
Multi-Scale Convolutional Network for Space-Based ADS-B Signal Separation with Single Antenna
1
School of Electrical and Information Engineering, Tianjin University, Tianjin 300072, China
2
Tianjin Key Lab for Advanced Signal Processing, Civil Aviation University of China, Tianjin 300300, China
3
State Key Laboratory of Dynamic Testing Technology and School of Information and Communication Engineering, North University of China, Taiyuan 030051, China
*
Author to whom correspondence should be addressed.
Appl. Sci. 2022, 12(17), 8816; https://0-doi-org.brum.beds.ac.uk/10.3390/app12178816
Submission received: 22 July 2022
/
Revised: 29 August 2022
/
Accepted: 30 August 2022
/
Published: 1 September 2022
(This article belongs to the Special Issue Computer Vision and Pattern Recognition Based on Deep Learning)
Abstract
:Automatic Dependent Surveillance-Broadcast (ADS-B) signals are very vital in air traffic control. However, the space-based ADS-B signals are easily overlapped and their message cannot be correctly received. It is challenge to separate overlapped signals especially for a single antenna. The existing methods have a low decoding accuracy for small power difference, carrier frequency difference and relative time delay between overlapped signals. In order to solve these problems, we apply the deep learning method to single antenna ADS-B signal separation. A multi-scale Conv-TasNet (MConv-TasNet) is proposed to capture long temporal information of the ADS-B signal. In MConv-TasNet, a multi-scale convolutional separation (MCS) network is proposed to fuse different scale temporal features extracted from overlapping ADS-B signals and generate an effective separation mask to separate signals. Moreover, a large dataset is created by using the real ADS-B data. In addition, the proposed method has been evaluated on the dataset. The average decoding accuracy on the test set is 90.34%. It has achieved the state-of-the-art results.
1. Introduction
ADS-B is the next-generation Air Traffic Control (ATC) surveillance system identified by the International Civil Aviation Organization (ICAO) [1]. The space-based ADS-B system places the ADS-B receivers on low-orbiting satellites to overcome the limitations of traditional radar and ground-based ADS-B systems [2]. Each aircraft in the airspace can be monitored and located in the shortest time. Then, the accidents such as MH370 and AF447 can be effectively avoided. However, the number of aircraft covered by a space-based receiver is becoming larger with the development of aviation industry [3]. It is easy for different ADS-B signals reaching the receiver simultaneously and overlapping. Thus, the signal separation methods are essential in the space-based ADS-B system. Depending on the type of antennas required, the ADS-B signal separation methods can be classified into single-antenna based and array-antenna based separation methods. At present, array-antenna based separation algorithms [4,5,6] are widely studied. They use the spatial characteristics of ADS-B signals for signal separation. However, if the direction difference of arrival between overlapping signals is less than the array resolution or the receiver only has single antenna, the array-antenna based separation methods will fail. In this case, single-antenna based separation algorithms can be used to separate the overlapped signals.
So far, the ADS-B signal separation algorithms based on a single antenna can be divided into three categories. The first approach is to utilize the power difference between overlapping signals. At present, this approach can only separate two signals, and cannot separate the overlapping signals with a small power difference effectively. For example, Wu et al. [7] proposed an accumulation and classification algorithm. The signals are separated based on k-means algorithm by using the power difference. Moreover, this method has a high accuracy when the power difference between signals is over 3 dB. Yu et al. [8] proposed a reconstruction and cancellation algorithm. This method fails when the input SNR of overlapped signals are low or the power difference between two signals is large. Furthermore, Li et al. [9] proposed a time-domain ADS-B blind signal separation (TDBSS) algorithm. Since the amplitude values of the two signals need to be estimated, the method requires a certain relative time delay between the overlapped signals, and it fails when the signals completely overlap. The second approach is to utilize the carrier frequency difference between overlapped signals. This approach can separate multiple overlapping signals, but large carrier frequency difference is needed. For instance, Galati et al. [10] proposed a projection algorithm single antenna (PASA). It converts a single antenna signal into a array antenna signal and uses projection algorithm to separate signals. However, the PASA can only separate two signals with a certain relative time delay and over 240 kHz carrier frequency difference correctly. In order to solve the problem of time delay, Shao et al. [11] proposed an improved PASA. Two signals can be separated as long as their relative time delay is greater than 0.5 μs, but their carrier frequency difference is no less than 300 kHz. Lu et al. [12] proposed a single-antenna separation method based on empirical mode decomposition (EMD). This method can separate multiple overlapped signals, but the minimum separable carrier frequency difference is 300 kHz and the problem of the mode aliasing needs to be solved. The third approach utilizes other characteristics of ADS-B signal to separate overlapped signals, such as sparse [13] and pulse position modulation (PPM) [14] characteristics. In general, traditional single-antenna based ADS-B signal separation methods are limited by the power difference, carrier frequency difference or relative time delay between overlapped signals. When all three parameters are small, it has difficulty in separating the overlapped signals.
In recent years, deep convolutional networks have made breakthroughs in many areas such as hand gesture recognition [15]. In general, it consists of a convolutional layer, normalized layer, pooling layer and activation function in deep convolutional networks. Moreover, the different sizes of convolutional kernels are used to extract local spatial information. The commonly used framework of deep convolutional networks is ResNet [16] and DenseNet [17]. This paper applies the deep convolutional networks to ADS-B signal separation. By learning the feature relationship between the overlapping and separated signals, the ADS-B overlapped signals are better separated. The single antenna ADS-B signal separation problem is similar to the speech separation problem. In speech separation based on deep learning methods, the framework including the encoder, separation and decoder is commonly used. The separation model can be divided into three approaches depending on the network types. The first approach [18,19,20] uses 1D convolution network with different size kernels to extract separation mask. However, the long temporal information cannot be effectively exploited. The second approach [21] uses the Recurrent Neural Network (RNN) to capture temporal features. However, the sequence is too long, and the RNN cannot be used to process the signal sequence directly. Generally, the long sequence is divided into many segments and generate the matrix. Therefore, spatial information in matrix is ignored and it has high complexity using two RNNs. The third approach [22] utilizes the transformer framework to extract mask features. However, it has higher complexity. Compared with RNN and the transformer-based framework, Conv-TasNet has low computational complexity. Thus, we improve the Conv-TasNet for ADS-B signal separation in this paper.
ADS-B signal separation based on deep learning is rarely focused due to lacking actual dataset. In order to solve this problem, a large semi-real ADS-B dataset (SR-ADSB) with two signals overlapping is created. The real ADS-B messages collected around Tianjin Airport are used to form overlapped signals by combining different signal parameters such as SNR, carrier frequency and relative time delay. Moreover, a multi-scale convolutional separation network is proposed to solve the problem that the Conv-TasNet cannot effectively capture long temporal information. In the separation network, the multi-scale temporal information is extracted by using the convolutional layer with different convolutional strides, and the deconvolution is used to restore the multi-scale under- sampled signal. Finally, the different temporal scale features are fused to generate the separation mask. The proposed method is verified on the SR-ADSB dataset and the average decoding accuracy on the test set is 90.34% and the BER is 0.27%.
2. Single Antenna ADS-B Signal Model
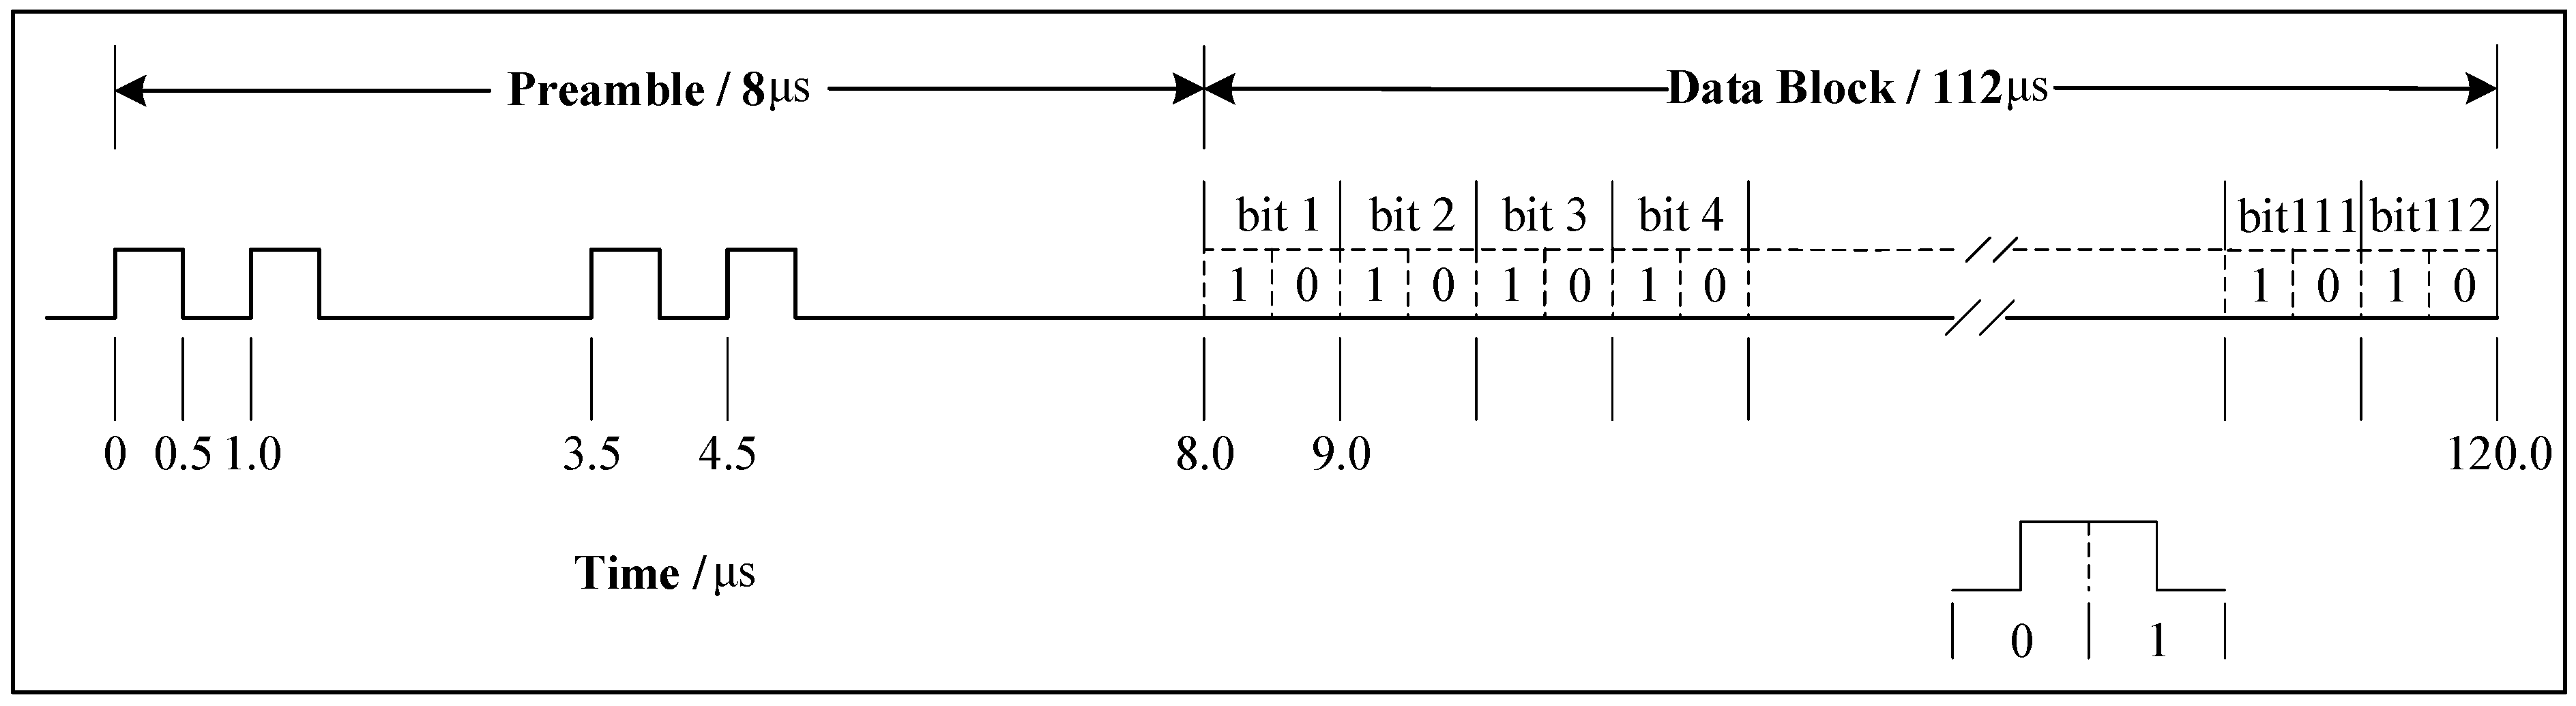
The ADS-B 1090 MHz Extended Squitter (1090ES) baseband signal is composed of an 8 bit fixed preamble and 112 bit data block, with a duration of 120 μs. The 8 bit preamble contains four fixed position pulses at 0, 1, 3.5 and 4.5 μs, respectively, while the remaining 112 bit data block vary with the content of the message. ADS-B signal is modulated by PPM technique, and each bit data is composed of two pulses with a duration of 0.5 μs. When the previous pulse is 0 and the next pulse is 1, it represents 0, and 1 otherwise. Therefore, every ADS-B signal has 240 pulses. The structure of an ADS-B baseband signal is shown in Figure 1.
ADS-B baseband signal at initial time (0 μs) is expressed as
where k is number of ADS-B signal pulse, . is the value of the kth impulse and can be 0 or 1. is the unit pulse width of ADS-B baseband signals, = 0.5 μs. is unit rectangular pulse with the pulse width at −0.5 μs starting position.
The ADS-B baseband signal is modulated to the carrier frequency using the Amplitude Shift Keying (ASK) modulation. ICAO allows the carrier frequency of ADS-B 1090ES signal to be (1090 ± 1) MHz. Therefore, the modulated ADS-B signal in the time-domain can be expressed as
where A is the signal amplitude. is the baseband signal and f is the carrier frequency.
In the case of single antenna, an ADS-B overlapping signal is linearly superimposed by d independent signals, and the ADS-B overlapped signal can be expressed as:
The Formula (2) can be further obtained by substituting Formula (3):
where is single antenna ADS-B overlapped signal. d is the number of overlapping signals. , , , and are the amplitude, baseband signal, time of arrival, and carrier frequency of ith signal, respectively. is the received Gaussian white noise.
3. Proposed Method
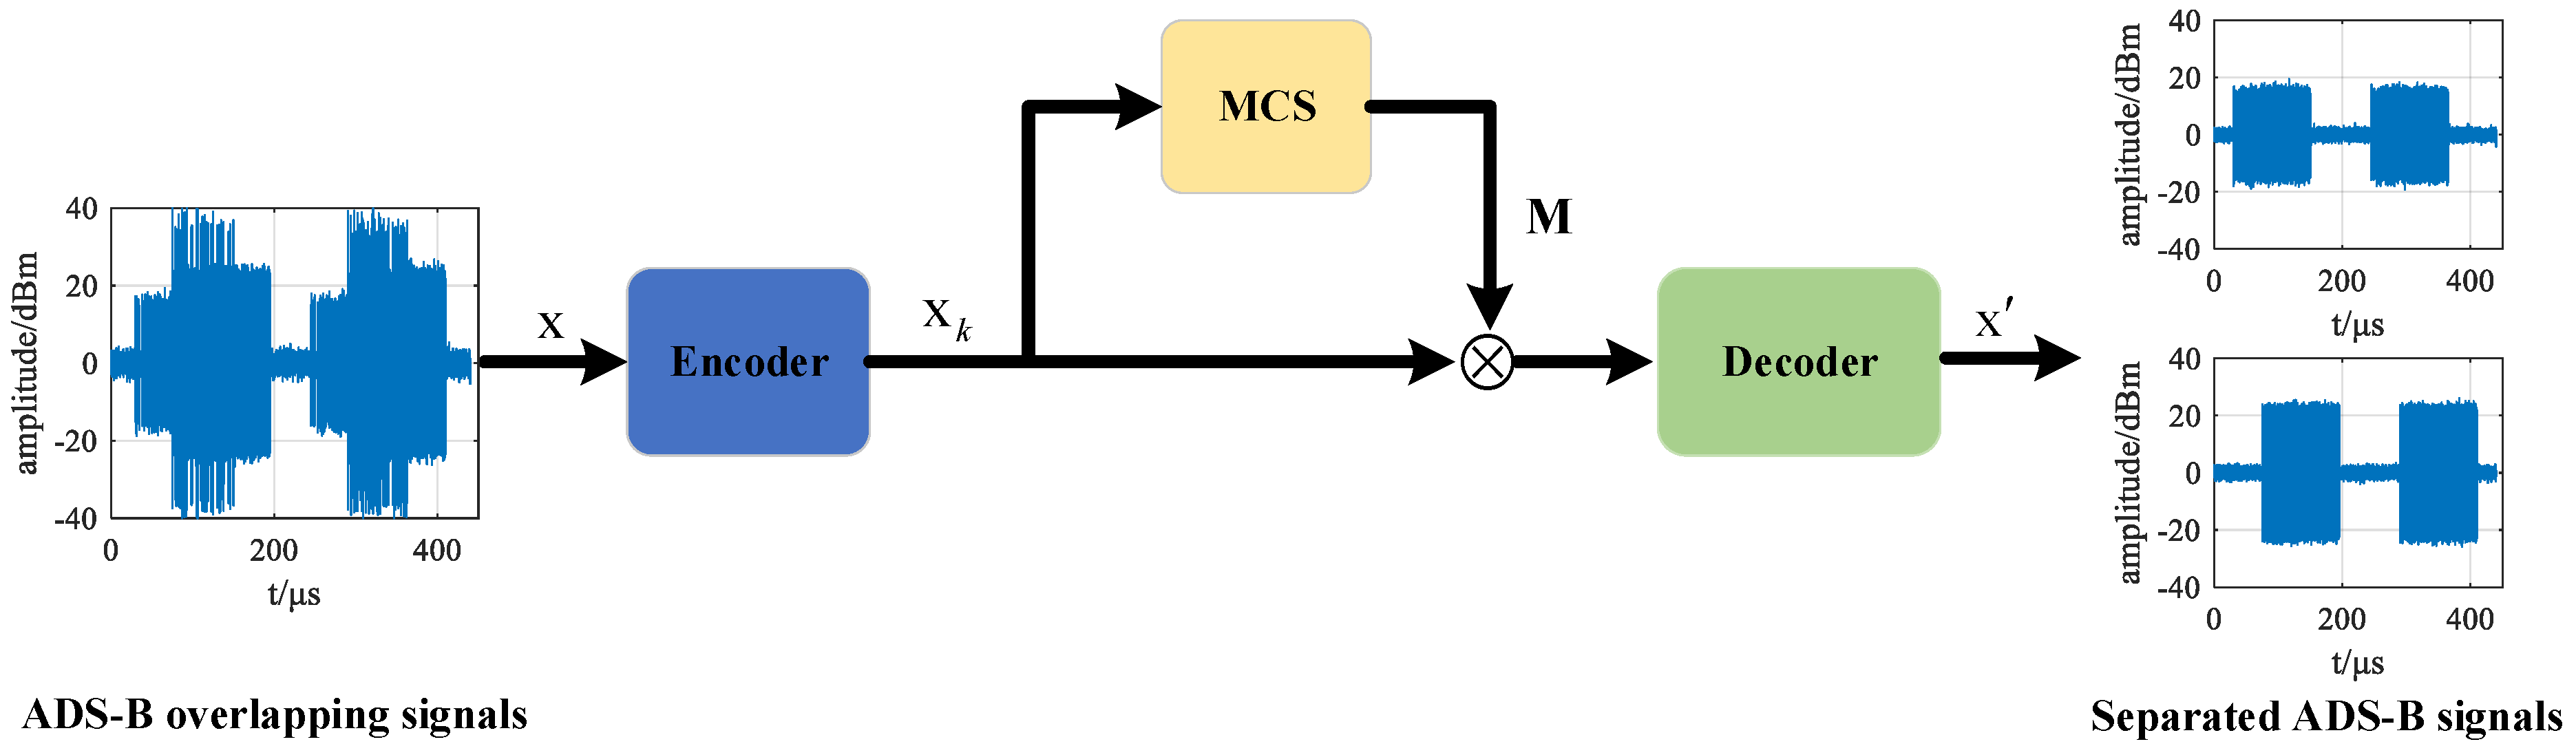
Compared with speech signal, it has higher sampling rate for ADS-B signal. However, the length of ADS-B signal is short and fixed 120 μs. It has similar sampling points with a currently used speech dataset. Thus, we improve the Conv-TasNet [18] framework used in the speech signal separation to construct a multi-scale Conv-TasNet (MConv-TasNet), as shown in Figure 2. From the Figure 2, it can be observed that the framework consists of three models. The encoder model is to extract the features from the ADS-B signal and the MCS network is to estimate the separation masks. The decoder is to separate the overlapped signals. In the following, the description of the model is detailed.
3.1. Encoder-Decoder
We follow the Conv-TasNet [18] to build the encoder and decoder model. For the encoder, a 1-D convolution operation with kernel size K is used to extract the features. Moreover, the convolutional stride is to reduce the length of ADS-B signal, which can reduce the computational complexity. The output of 1-D convolution is fed into the rectified linear unit (ReLU). The ADS-B signal is encoded into feature by the encoder model. C is the number of convolutional kernel.
The decoder model is a reverse process of the encoder model and utilizes the 1-D transposed convolution operation to generate the separated ADS-B signals. The feature is fed into MCS network to extract the separation masks . d is the number of separation signals. The element-wise multiplication between feature and mask is used to get the input of decoder. The whole process can be expressed:
where is ith separated signal and is activate function.
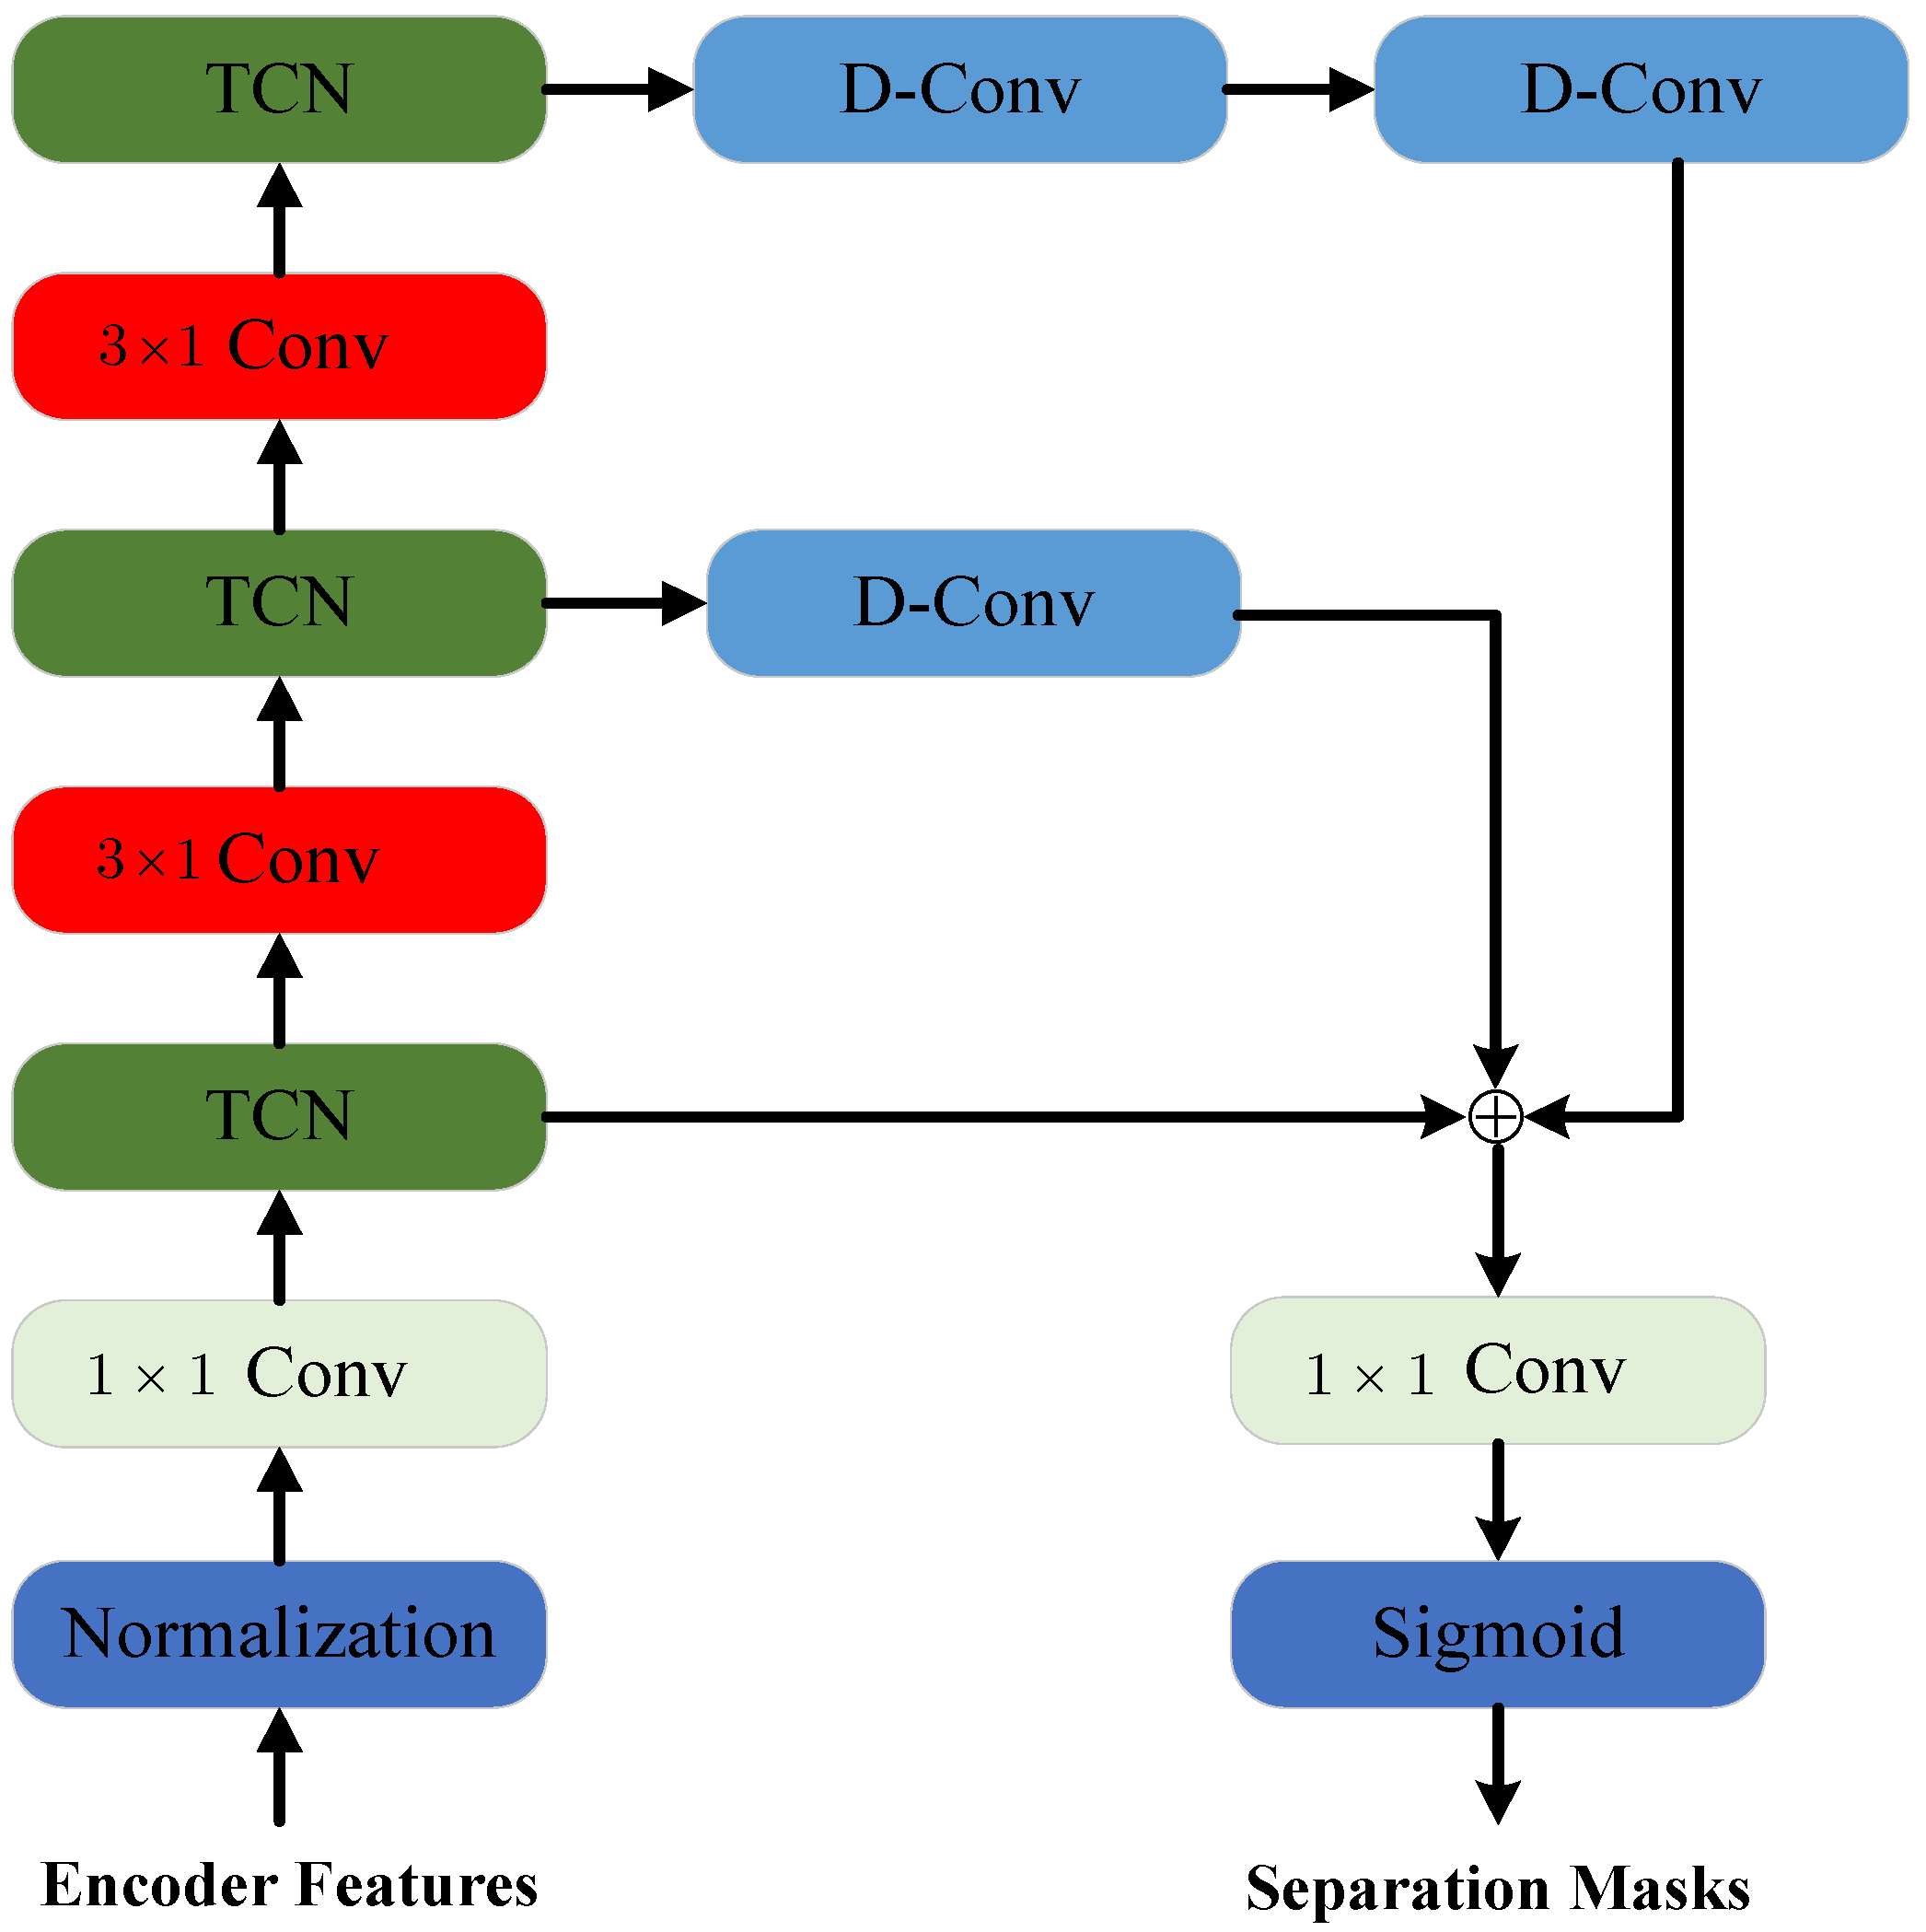
3.2. Multi-Scale Convolutional Separation Network
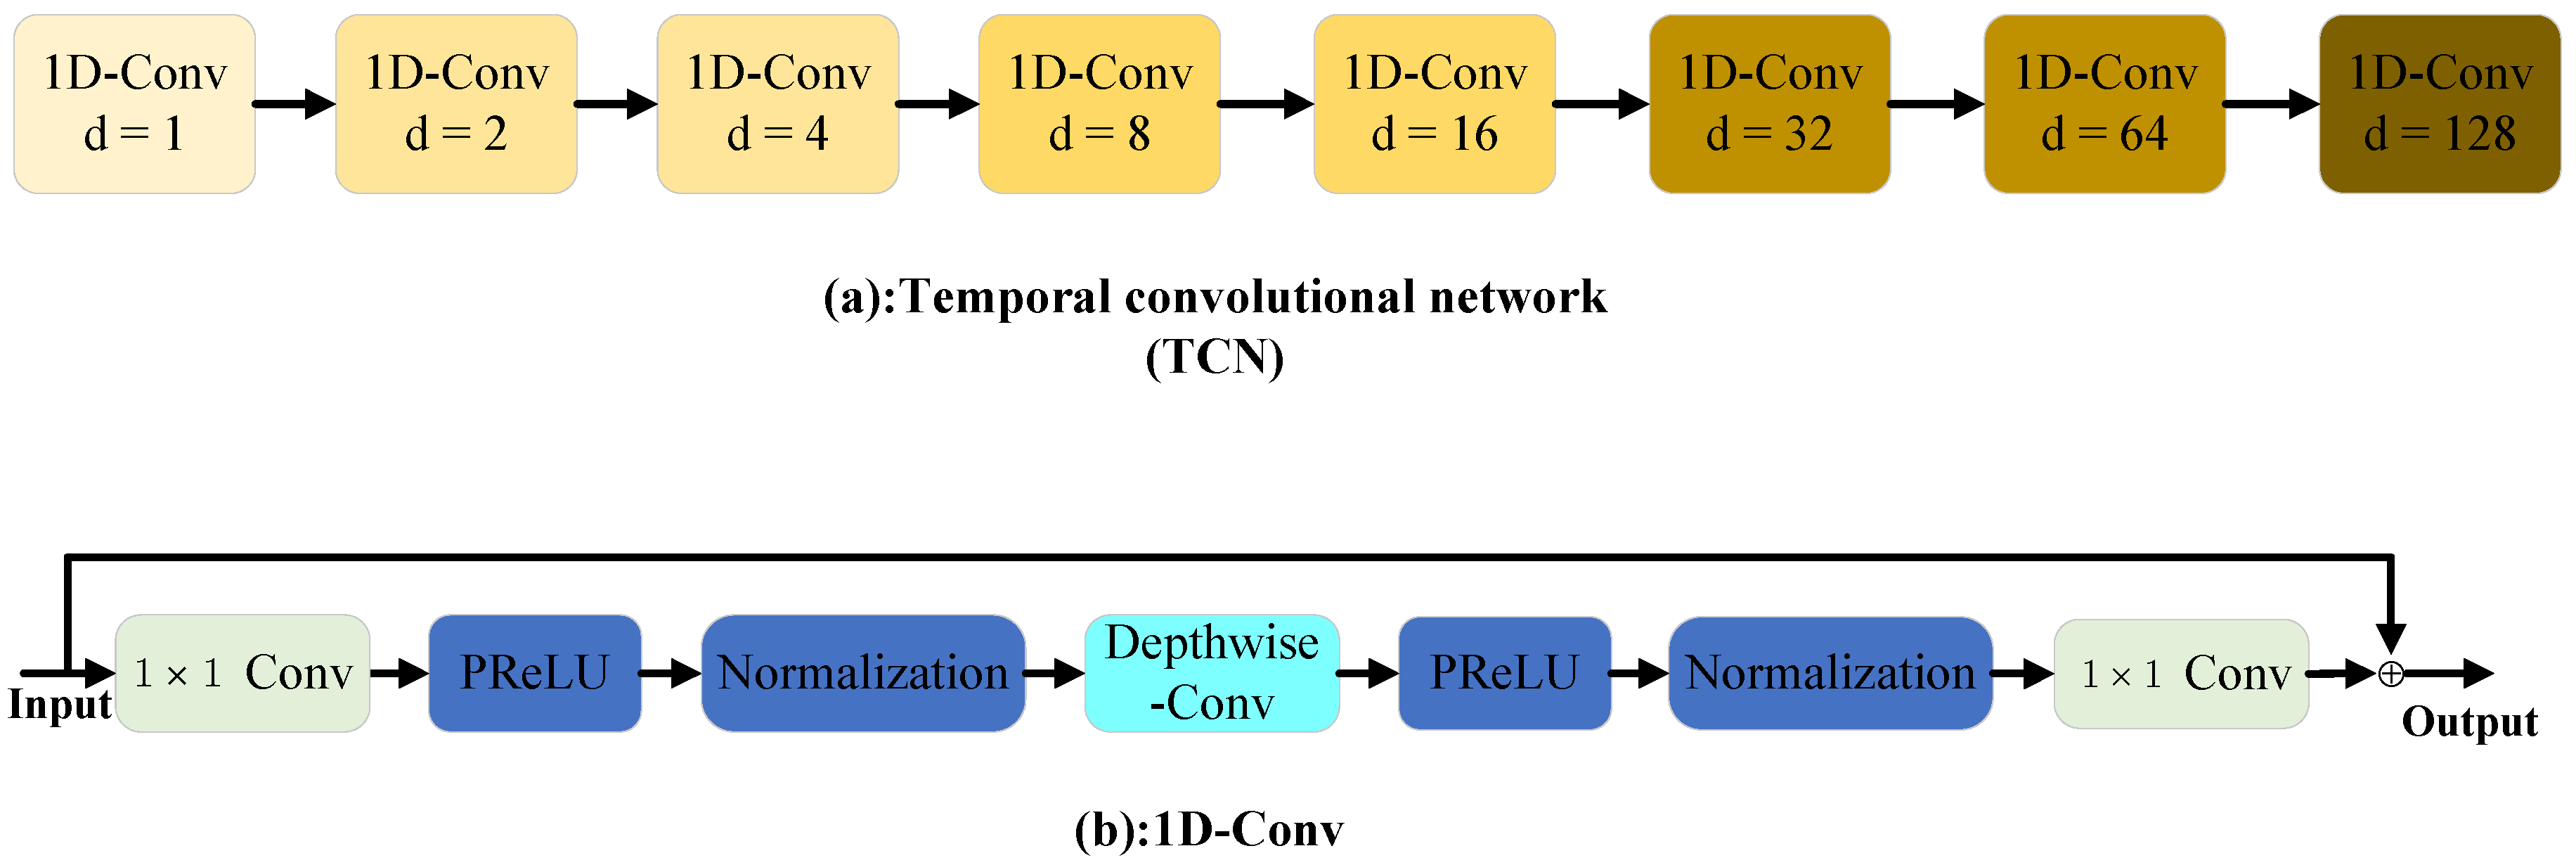
From the Formula (5), it can be observed that greatly affects the separation accuracy. It is significant to generate effective masks by using discriminative temporal information in the separation model. In order to capture long temporal information, the temporal convolutional network (TCN) including 1-D convolutional blocks with increasing dilation is used in Conv-TasNet. However, the signals is so long and the dilation factors can not adequately exploit the long temporal information.
In order to solve this issue, MCS network is designed as shown in Figure 3. The MCS network consists of four convolutional layers, three TCN model and three deconvolution layers. The output of encoder model is the input of the MCS network. First, the convolutional layers with kernel size is used to further extract features. Then, the TCN is utilized to capture long temporal information. The convolution with stride 2 is used to compress the length of ADS-B signal. The more long temporal information is captured by this temporal compression. After the compression, the temporal information of the next scale is exploited using the TCN. In order to keep the same size of multi-scale features, the 1-D transposed convolution is utilized in the second and third TCN. Moreover, the multi-scale temporal information is fused to generate the separation masks using the convolution. Compared with Conv-TasNet, our proposed MCS network can capture more temporal information and reduce the computational complexity.
In TCN, eight 1-D convolutional blocks are used as shown in Figure 4a. Moreover, each block uses the different dilation factors to capture the relationship between different time-stamps. Each block consists of three convolution layer and uses residual structure as shown in Figure 4b. First, the convolution followed by nonlinear activation function and normalization is used to improve feature dimensions. Then depth-wise convolution is used to decrease the number of parameters. Finally, the feature dimensions is changed to the same dimension of input using the convolution. The dilation factors are used in the depth-wise convolution.
3.3. ADS-B Signal Dataset
Currently, it is difficult to obtain a large number of ADS-B overlapped signals in practice. Thus, we created a semi-real ADS-B dataset (SR-ADSB) with two signals overlapping in this paper. Firstly, the ADS-B data of Tianjin Airport from 21 April to 21 May 2021 were collected. The abnormal data and duplicate information of the longitude, latitude and altitude were removed. A total of 171,850 ADS-B messages of 2315 aircraft were obtained. Among them, 600 ADS-B messages with different aircraft number (AA), longitude, latitude and altitude were randomly selected as the initial samples.
The overlapping signals parameters of the dataset are set according to the single antenna ADS-B overlapped signal model in Section 2. The range of SNR is 5–25 dB, and the interval step is 5 dB. The power difference between the signals is set to 0 dB, 1 dB and 2 dB. The carrier frequency of the signals is set as the intermediate frequency 9–11 MHz, the interval step is 0.5 MHz, and the carrier frequency difference between signals is set as 0 Hz, 500 Hz, 1000 Hz, and 1500 Hz. For the relative time delay between signals, 0 μs, 5 μs, 10 μs, 20.3 μs are used. It can generate 1200 kinds of overlapping signals with different SNR, carrier frequency, relative delay for a pair-wise signal. From the initial sample, 400 ADS-B signals are selected and two signals are used as a group. Hence, 240,000 samples were obtained as the training data for the SR-ADSB. The remaining 200 ADS-B signals are used to generate 120,000 test samples.
4. Experiment
4.1. Implementation Details
Our proposed MConv-TasNet is performed in the SR-ADSB Dataset. The PyTorch and RTX 6000 GPU are used in experiments. The Adam optimization function is used in all experiments. The initial learning rate is set to 0.001. When the validation accuracy is not improved in three consecutive epochs, the learning rate is decayed by ten. Gradient clipping with maximum -norm of 5 is applied during training. The batch-size is set to 32. C, K and L are 512, 16, and 16,400, respectively, in this paper.
4.2. Comparison with Different Deep Models
Three commonly used deep learning networks [18,21,22] are experimented on in our proposed dataset, and decoding accuracy and bit error rate (BER) are used as evaluation. The decoding accuracy is the percentage of the correctly decoded signals number in the total number of received signals, while the BER is the ratio of the erroneous bits’ number to the total number of signal bits. The average decoding accuracy and BER of the four networks on 120,000 test samples are shown in Table 1. From the table, it can be observed that the transformer based method is better than Conv-TasNet and Bidirectional LSTM. Moreover, our proposed MConv-TasNet outperforms the transformer-based method, which verifies the effectiveness of our proposed method.
4.3. Comparison with Different Traditional Methods
The separation performance of MConv-TasNet is compared with the PASA [10] and TDBSS [9] algorithms, which have better performance among the existing single-antenna based ADS-B signal separation algorithms. They are tested in the SR-ADSB dataset. Moreover, the decoding accuracy and BER are also used to measure the impact of SNR, power difference, carrier frequency difference and relative time delay on the performance of the algorithms.
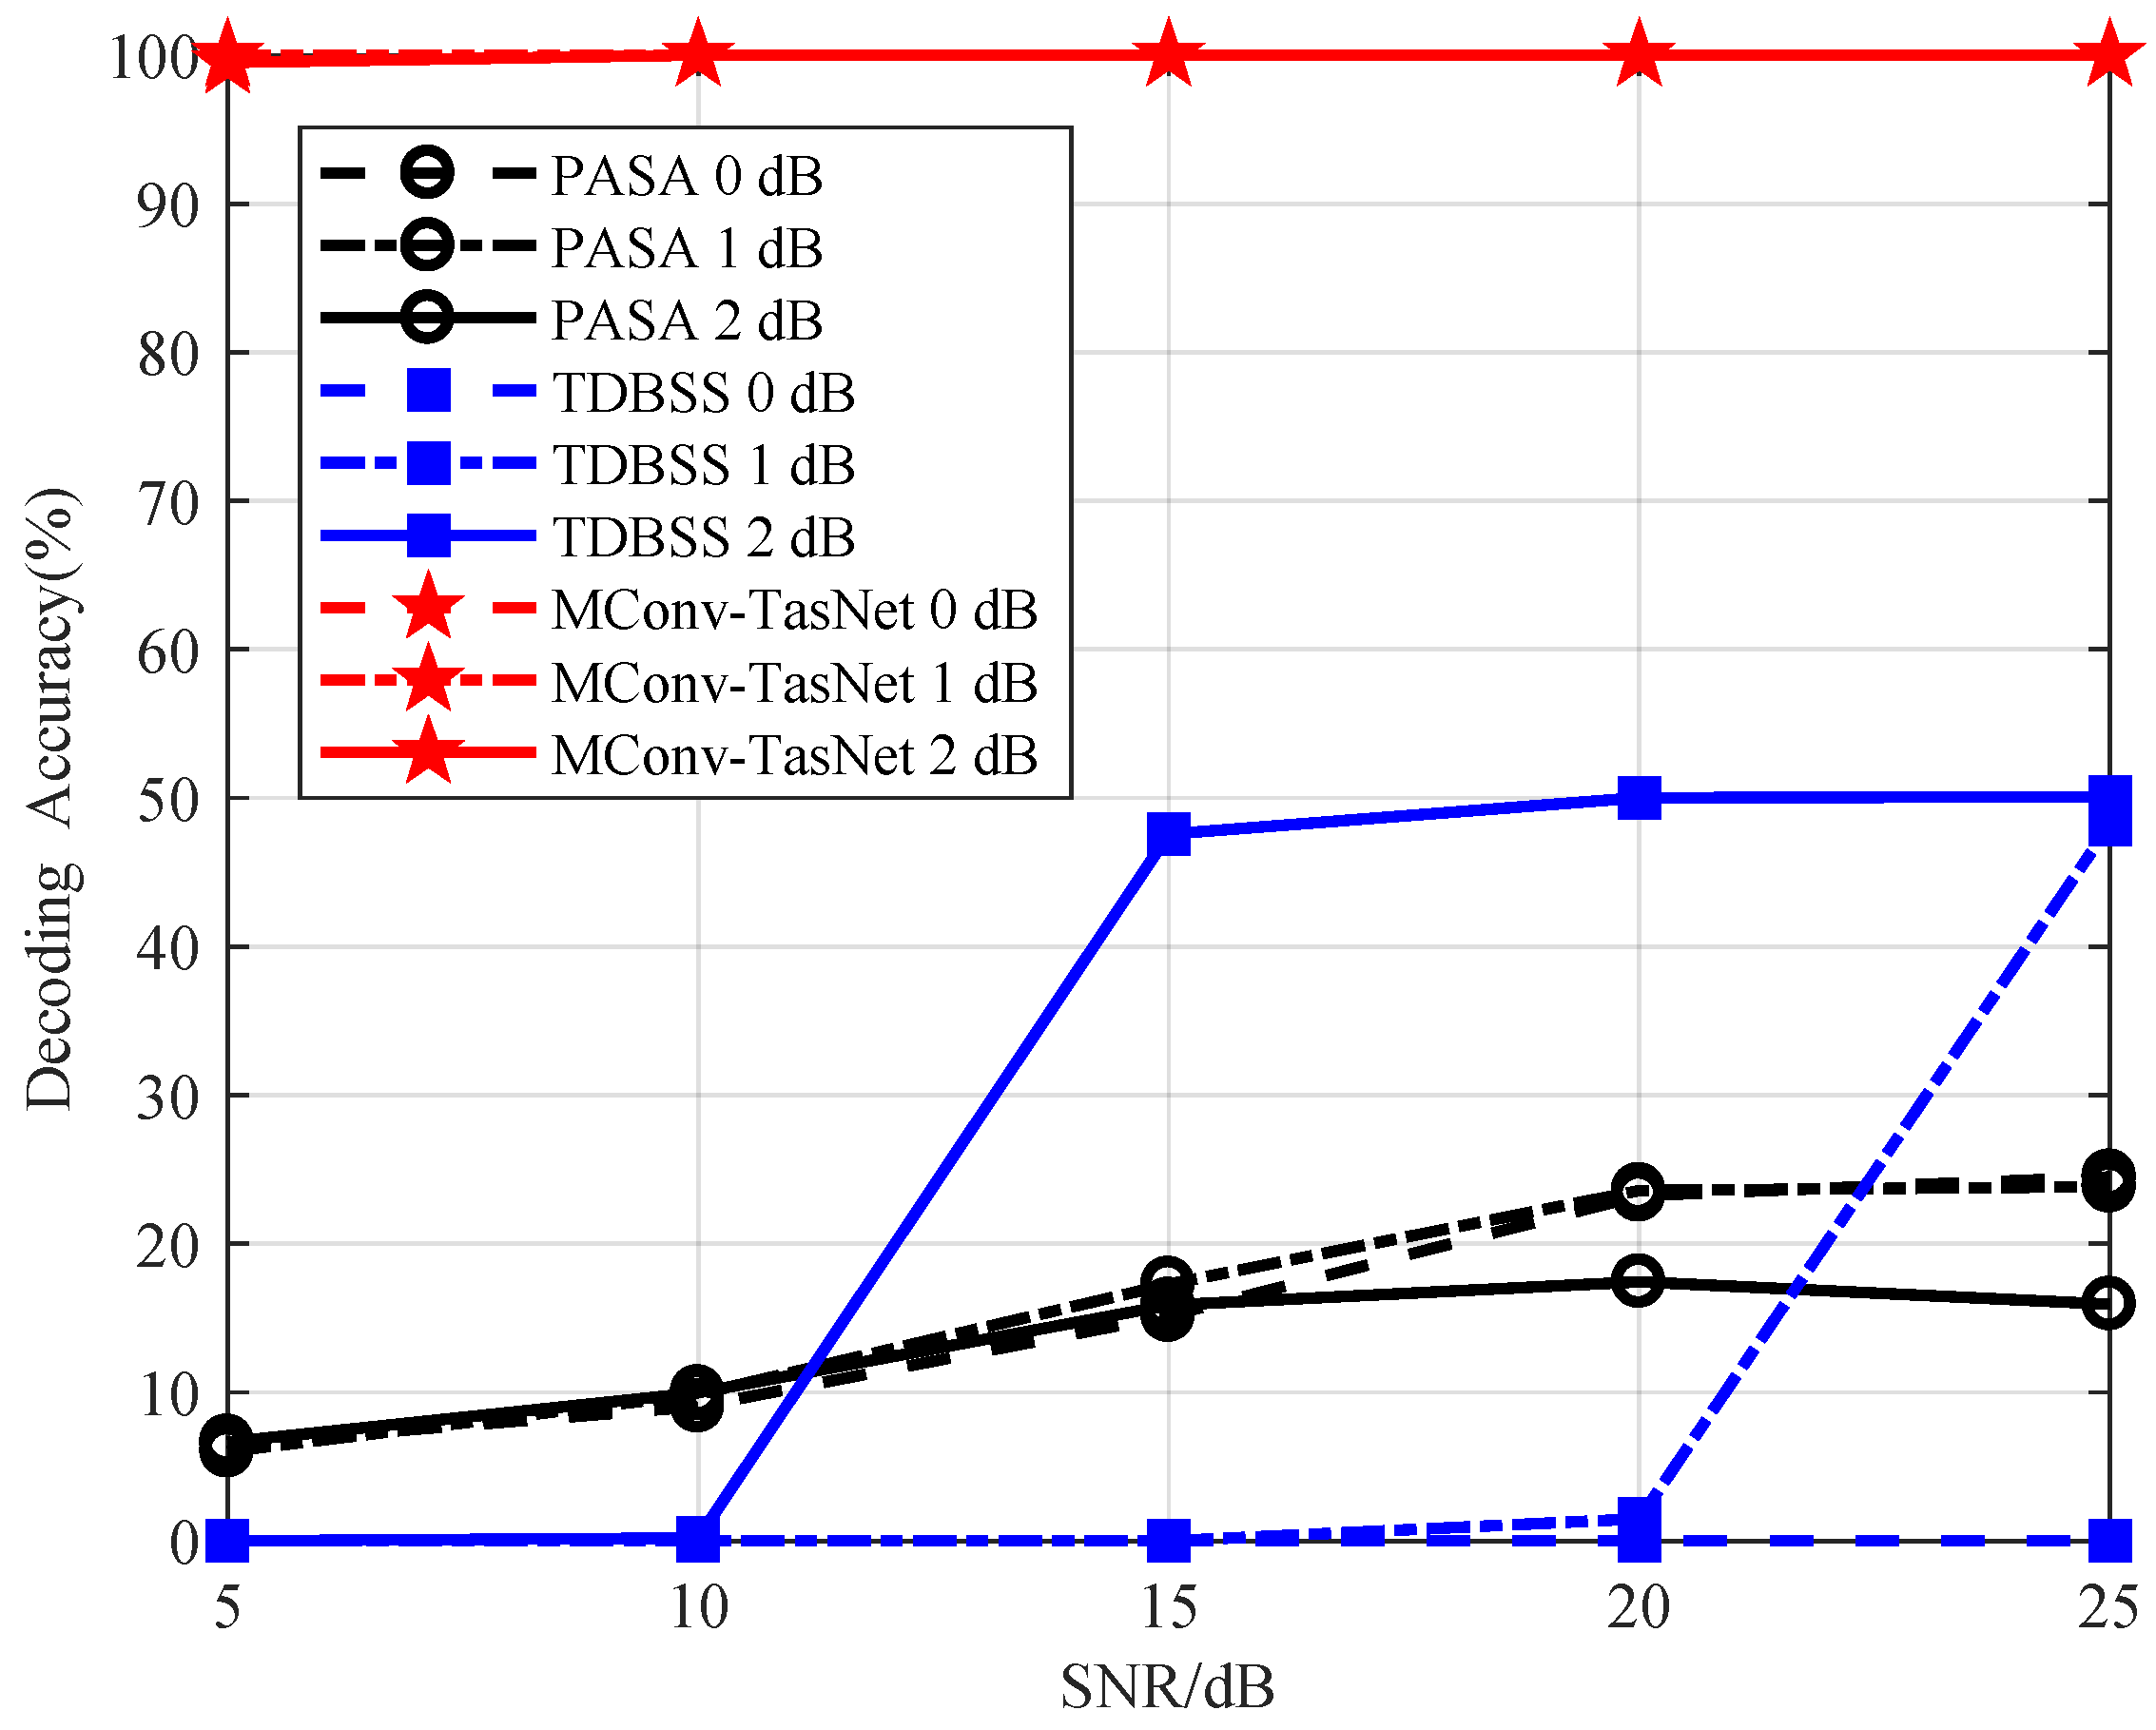
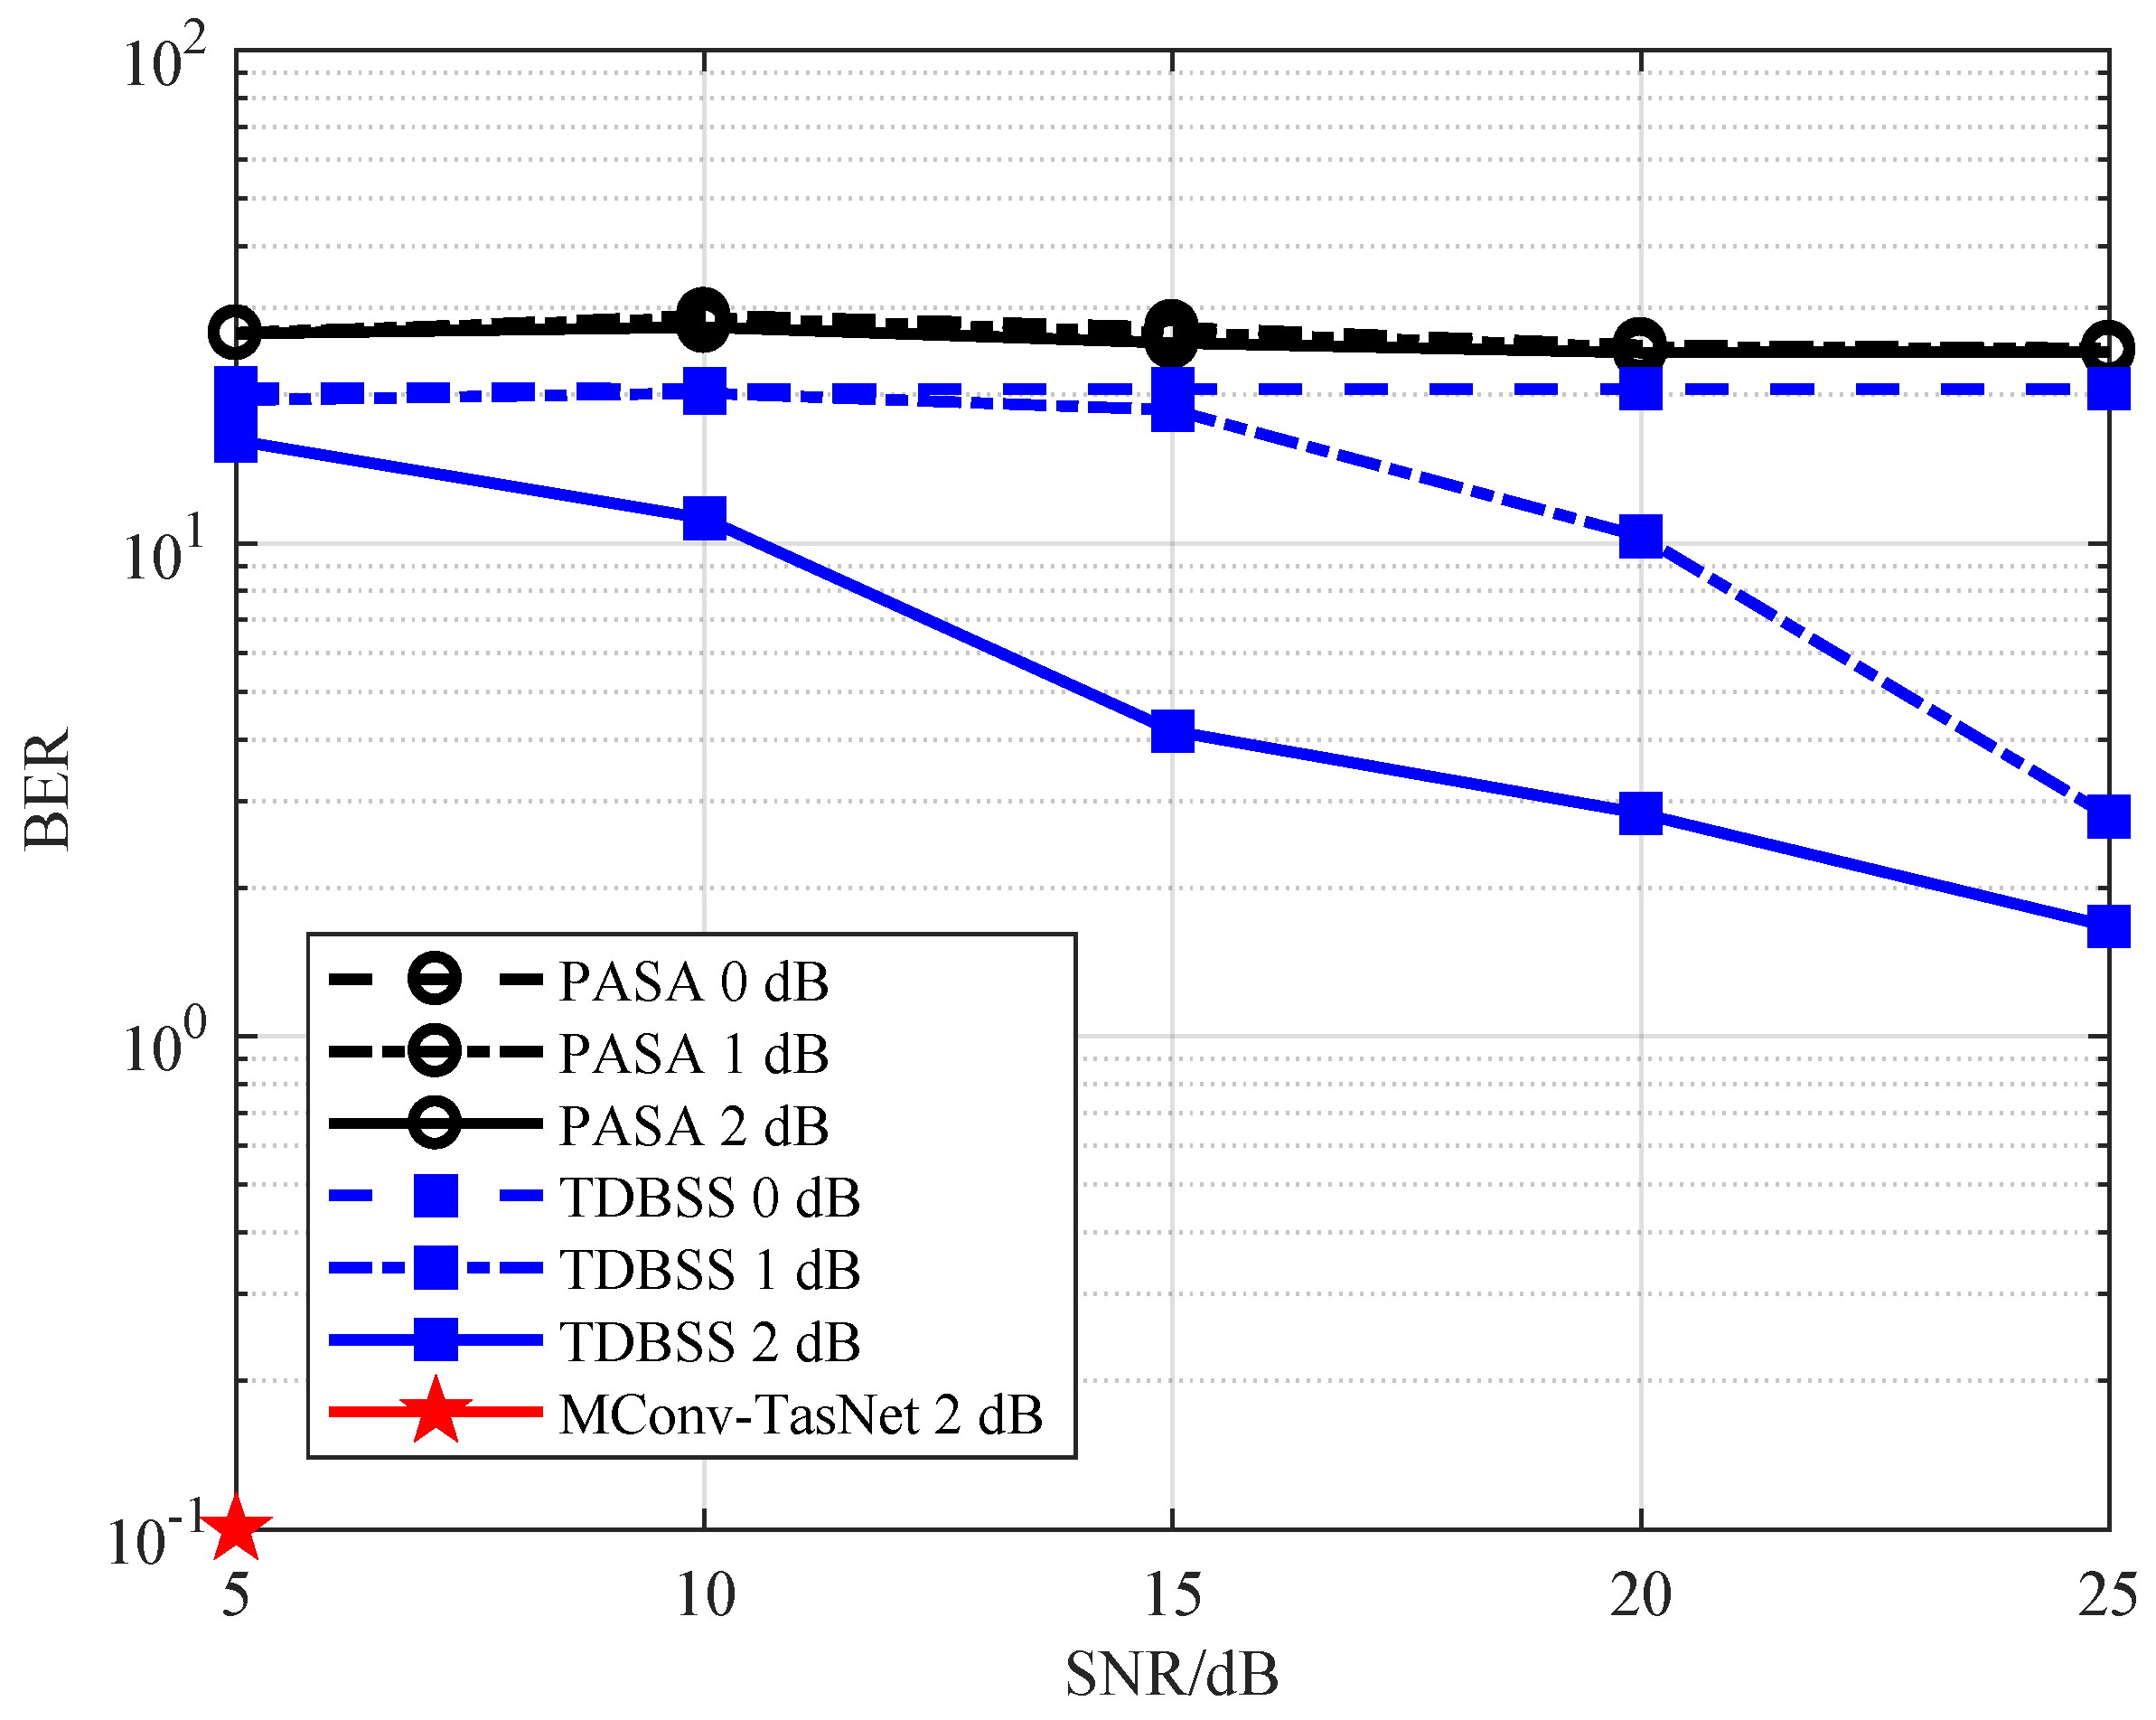
4.3.1. Analysis of Signal Power Difference on Separation Results
A total of 1500 test samples with SNR of 5, 10, 15, 20 and 25 dB, power difference between signals of 0, 1 and 2 dB, carrier frequencies of 10 MHz and 10.0015 MHz, respectively, and relative time delay of 10 μs are selected. The decoding accuracy and BER of PASA, TDBSS, and MConv-TasNet algorithms are shown in Figure 5 and Figure 6, respectively, where the carrier frequency and relative time delay of the signals are fixed, SNR varies from 5 to 25 dB, and the power difference between the signals is taken as 0 to 2 dB. Furthermore, the decoding accuracy and BER of PASA and TDBSS are the average of 100 Monte Carlo experiments.
The average decoding accuracy of PASA, TDBSS and MConv-TasNet algorithms in Figure 5 is 14.99%, 13.17% and 99.97%, respectively. It can be observed that the decoding accuracy of the MConv-TasNet algorithm is less affected by the signal power difference. However, the decoding accuracy of PASA is affected, and the performance of algorithm is better when the power difference is smaller. The TDBSS algorithm is very sensitive to the power difference between overlapped signals, and the decoding accuracy of TDBSS algorithm gradually increases as the power difference and SNR increase. Overall, the decoding accuracy of PASA and TDBSS algorithm are lower than that of the MConv-TasNet algorithm.
The BERs of PASA, TDBSS and MConv-TasNet algorithms with different SNR and power difference are shown in Figure 6, and the average BERs of the three algorithms are 26.22%, 14.03% and 0.01%, respectively. The MConv-TasNet algorithm only has a 0.1% BER when the SNR is 5 dB and the power difference is 2 dB. At the same time, the signal power difference has less influence on the BER of PASA. However, the TDBSS algorithm is very sensitive to the signal power difference and SNR variation, and its BER decreases gradually with the increase in signal power difference and SNR. The overall BER of the MConv-TasNet algorithm is significantly lower than that of the PASA and TDBSS algorithm.
4.3.2. Analysis of Carrier Frequency Difference on Separation Results
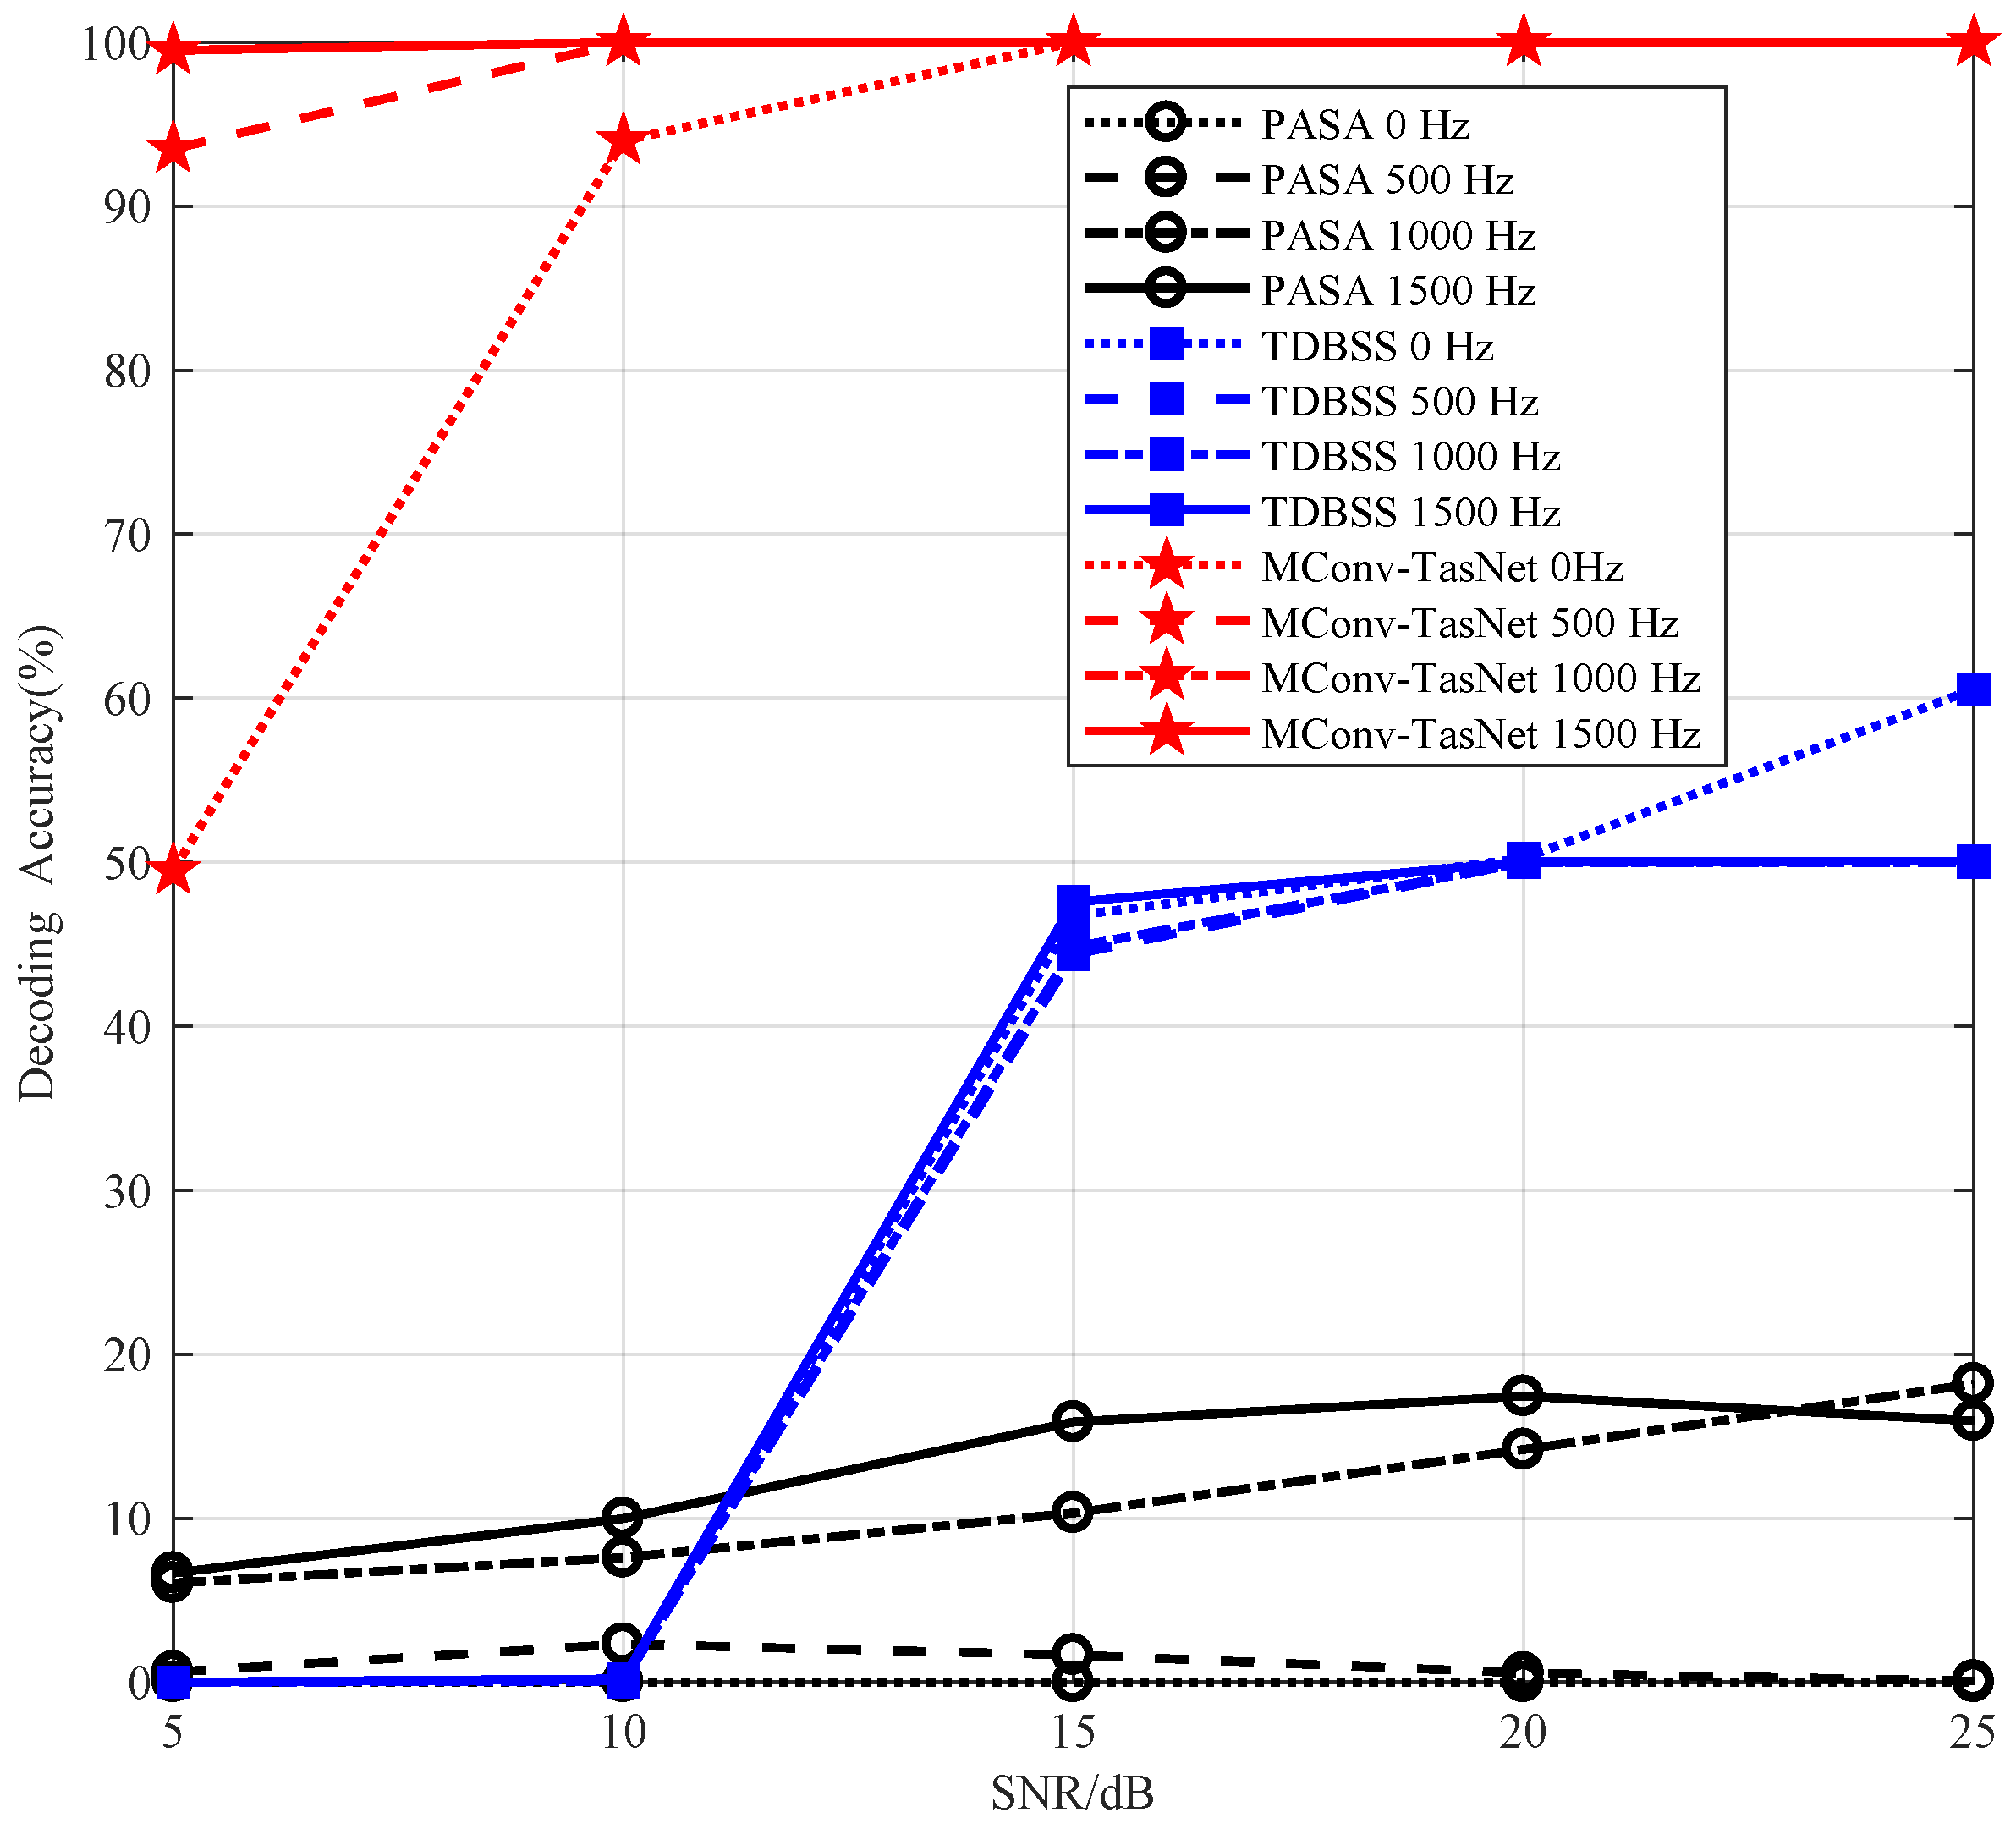
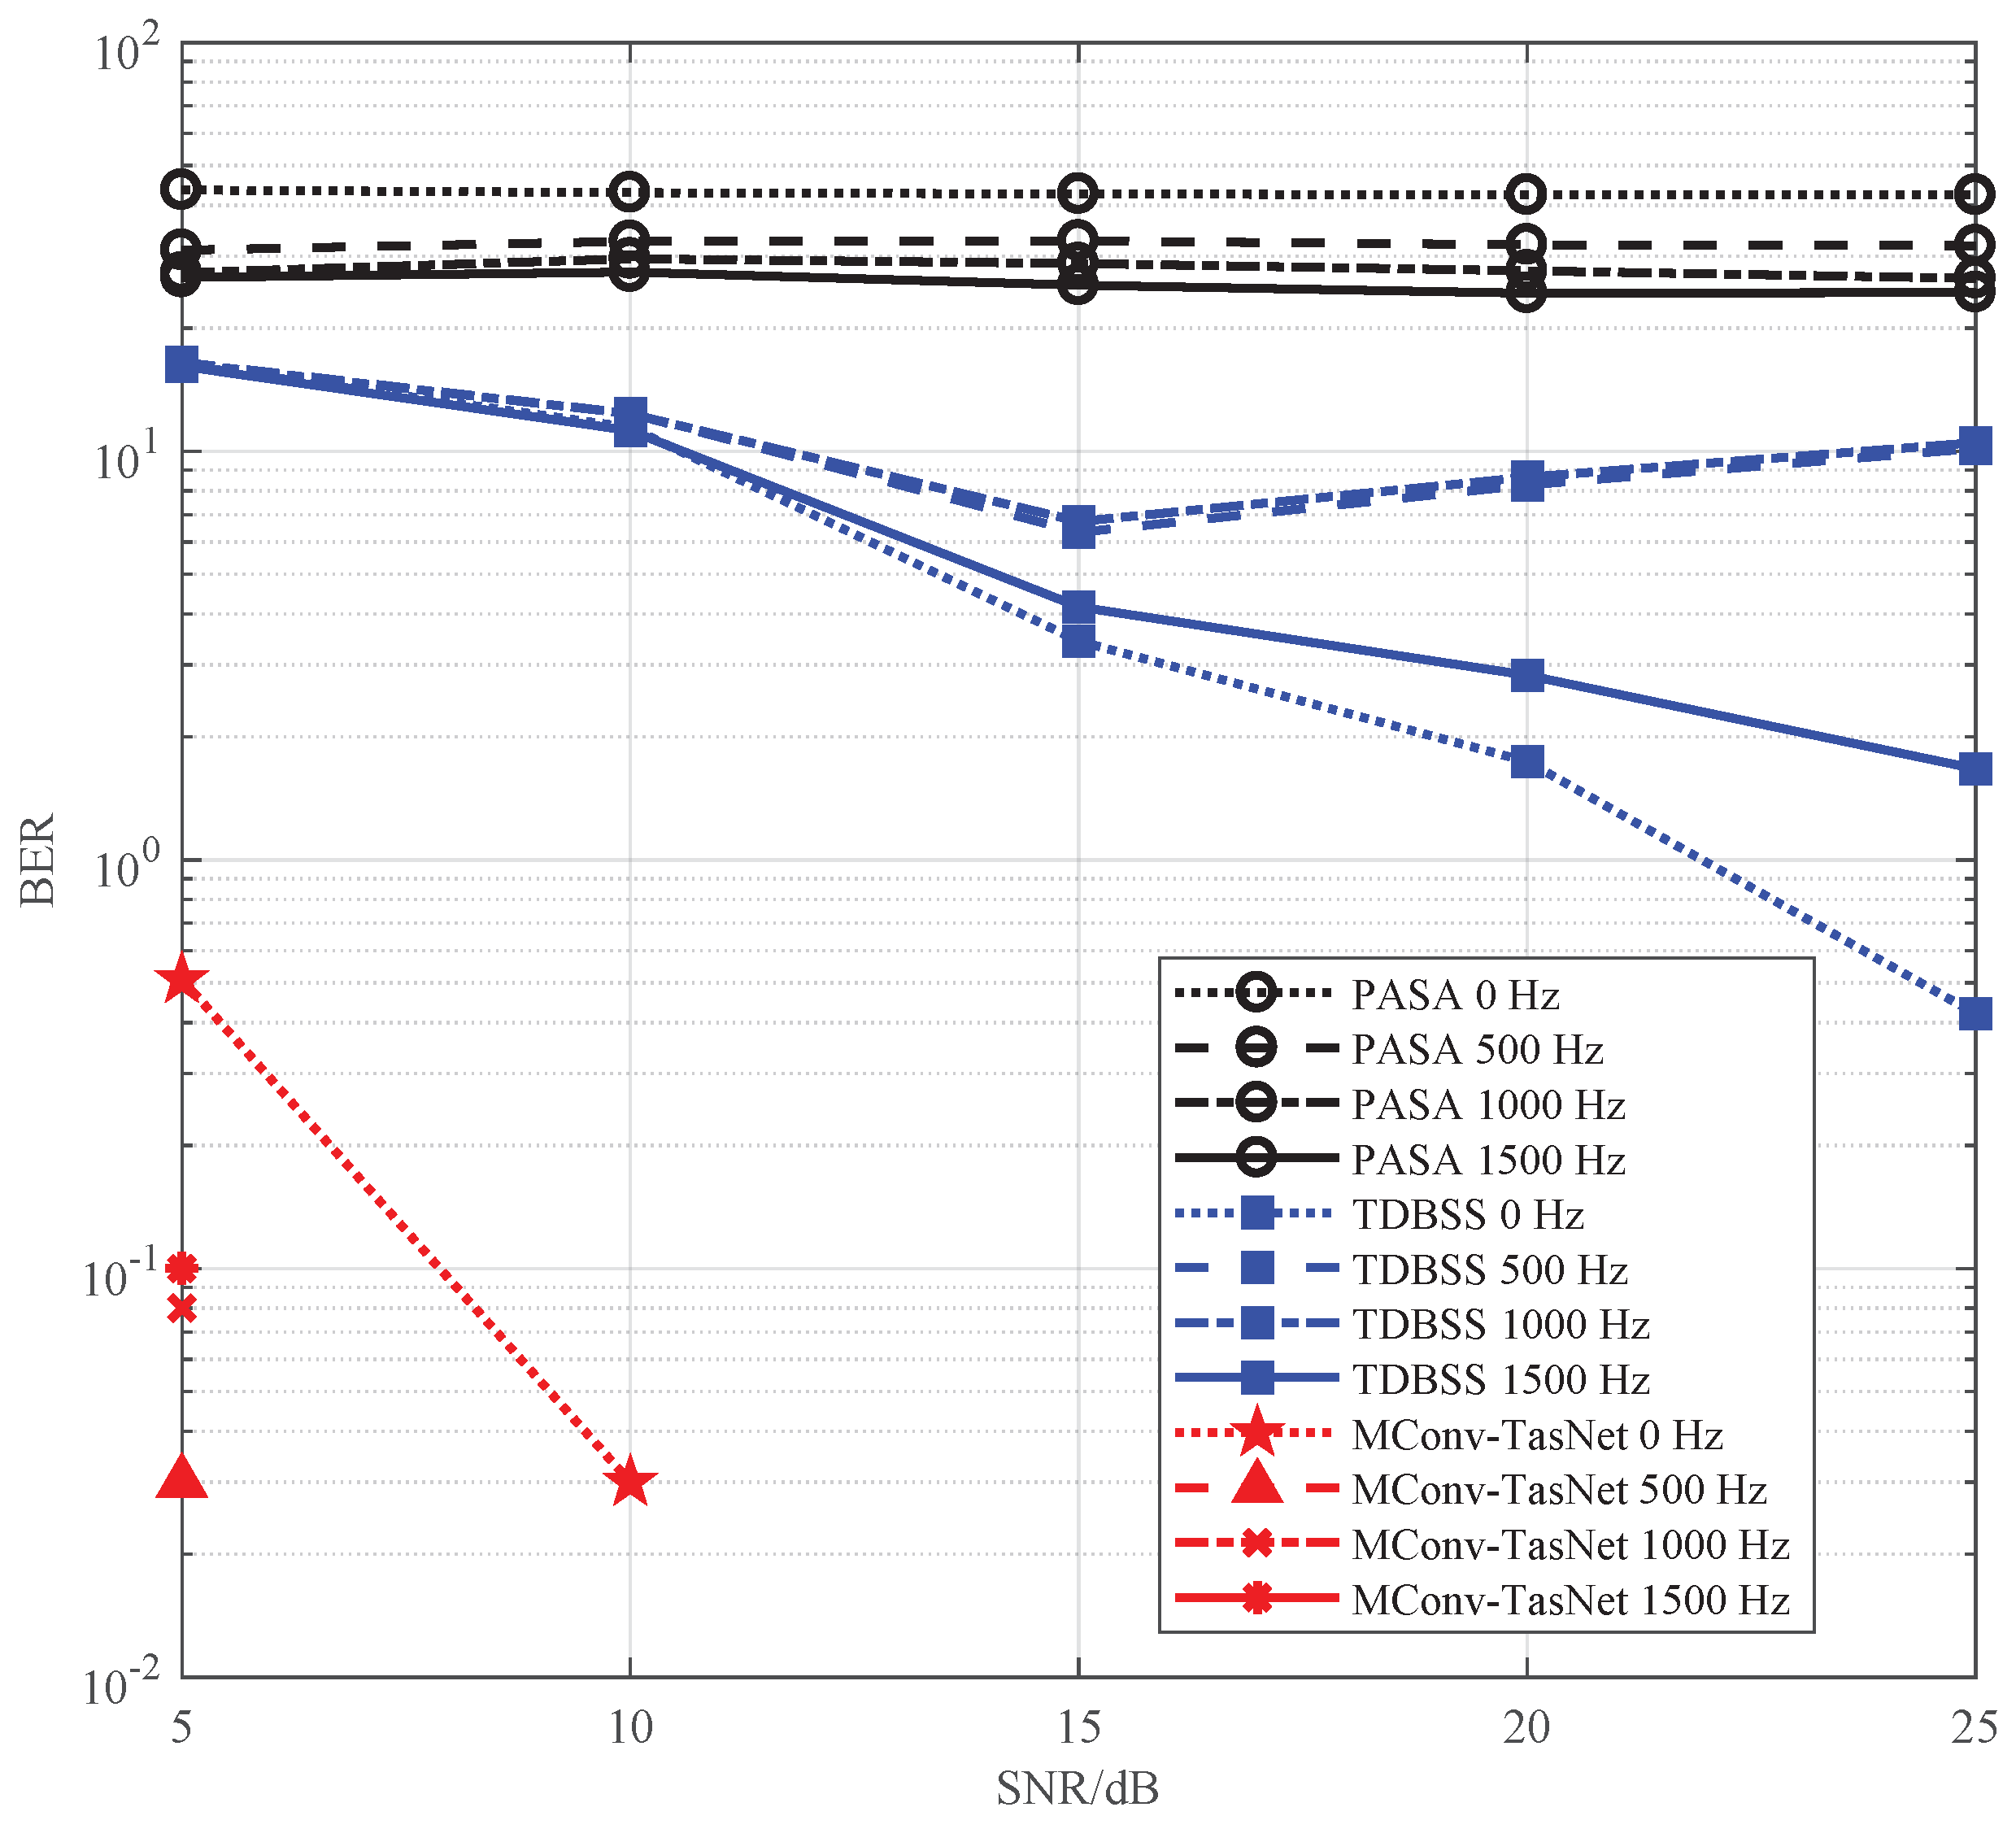
A total of 2000 test samples with SNR of 5, 10, 15, 20 and 25 dB, power difference between signals of 2 dB, relative time delay of 10 μs, carrier frequency of 10 MHz for one signal and 10, 10.0005, 10.001 and 10.0015 MHz for another are selected for testing. When the carrier frequency difference between the signals is 0, 500, 1000 and 1500 Hz and the SNR of the signals varies from 5 to 25 dB, the decoding accuracy and BER of PASA, TDBSS and the MConv-TasNet algorithms are shown in Figure 7 and Figure 8, respectively.
As can be observed in Figure 7, the average decoding accuracy of PASA, TDBSS and MConv-TasNet algorithms is 6.37%, 29.74% and 96.8%, respectively. The MConv-TasNet algorithm is affected in 0 Hz carrier frequency difference with small SNR. However, the TDBSS algorithm has its highest decoding accuracy when the carrier frequency difference is 0 Hz. As the carrier frequencies of the two signals are the same and the difference between high and low pulses is more stable, it is more accurate to estimate the bit values of the two signals by the amplitude difference. However, the decoding accuracy of the TDBSS algorithm is 0 when the SNR is small, such as 5 and 10 dB. Therefore, the TDBSS algorithm is more affected by the SNR. The PASA is based on the carrier frequency difference to separate signals; thus, it is more affected by the carrier frequency difference. The decoding accuracy of PASA is highest when the carrier frequency difference is 1500 Hz, but it is close to 0 when the carrier frequency difference is small. In summary, the MConv-TasNet algorithm can separate more signals accurately than the PASA and TDBSS algorithm when the carrier frequency difference between overlapped signals is less than 1500 Hz.
The average BERs of PASA, TDBSS and MConv-TasNet algorithms are 32.11%, 8.88% and 0.04%, respectively, in Figure 8. The BER of PASA is significantly higher than that of the TDBSS and MConv-TasNet algorithms, and the BER of PASA decreased gradually as the carrier frequency difference increased. The TDBSS algorithm has the lowest BER at 0 Hz. Meanwhile, the MConv-TasNet algorithm has a certain BER when the SNR and carrier frequency difference are small, and the BERs of the MConv-TasNet algorithm are all 0 for different carrier frequency differences when the SNR is greater than 10 dB. Therefore, PASA is most affected by carrier frequency difference among the three algorithms, while TDBSS and the MConv-TasNet algorithms are mainly affected by SNR.
4.3.3. Analysis of Relative Time Delay on Separation Results
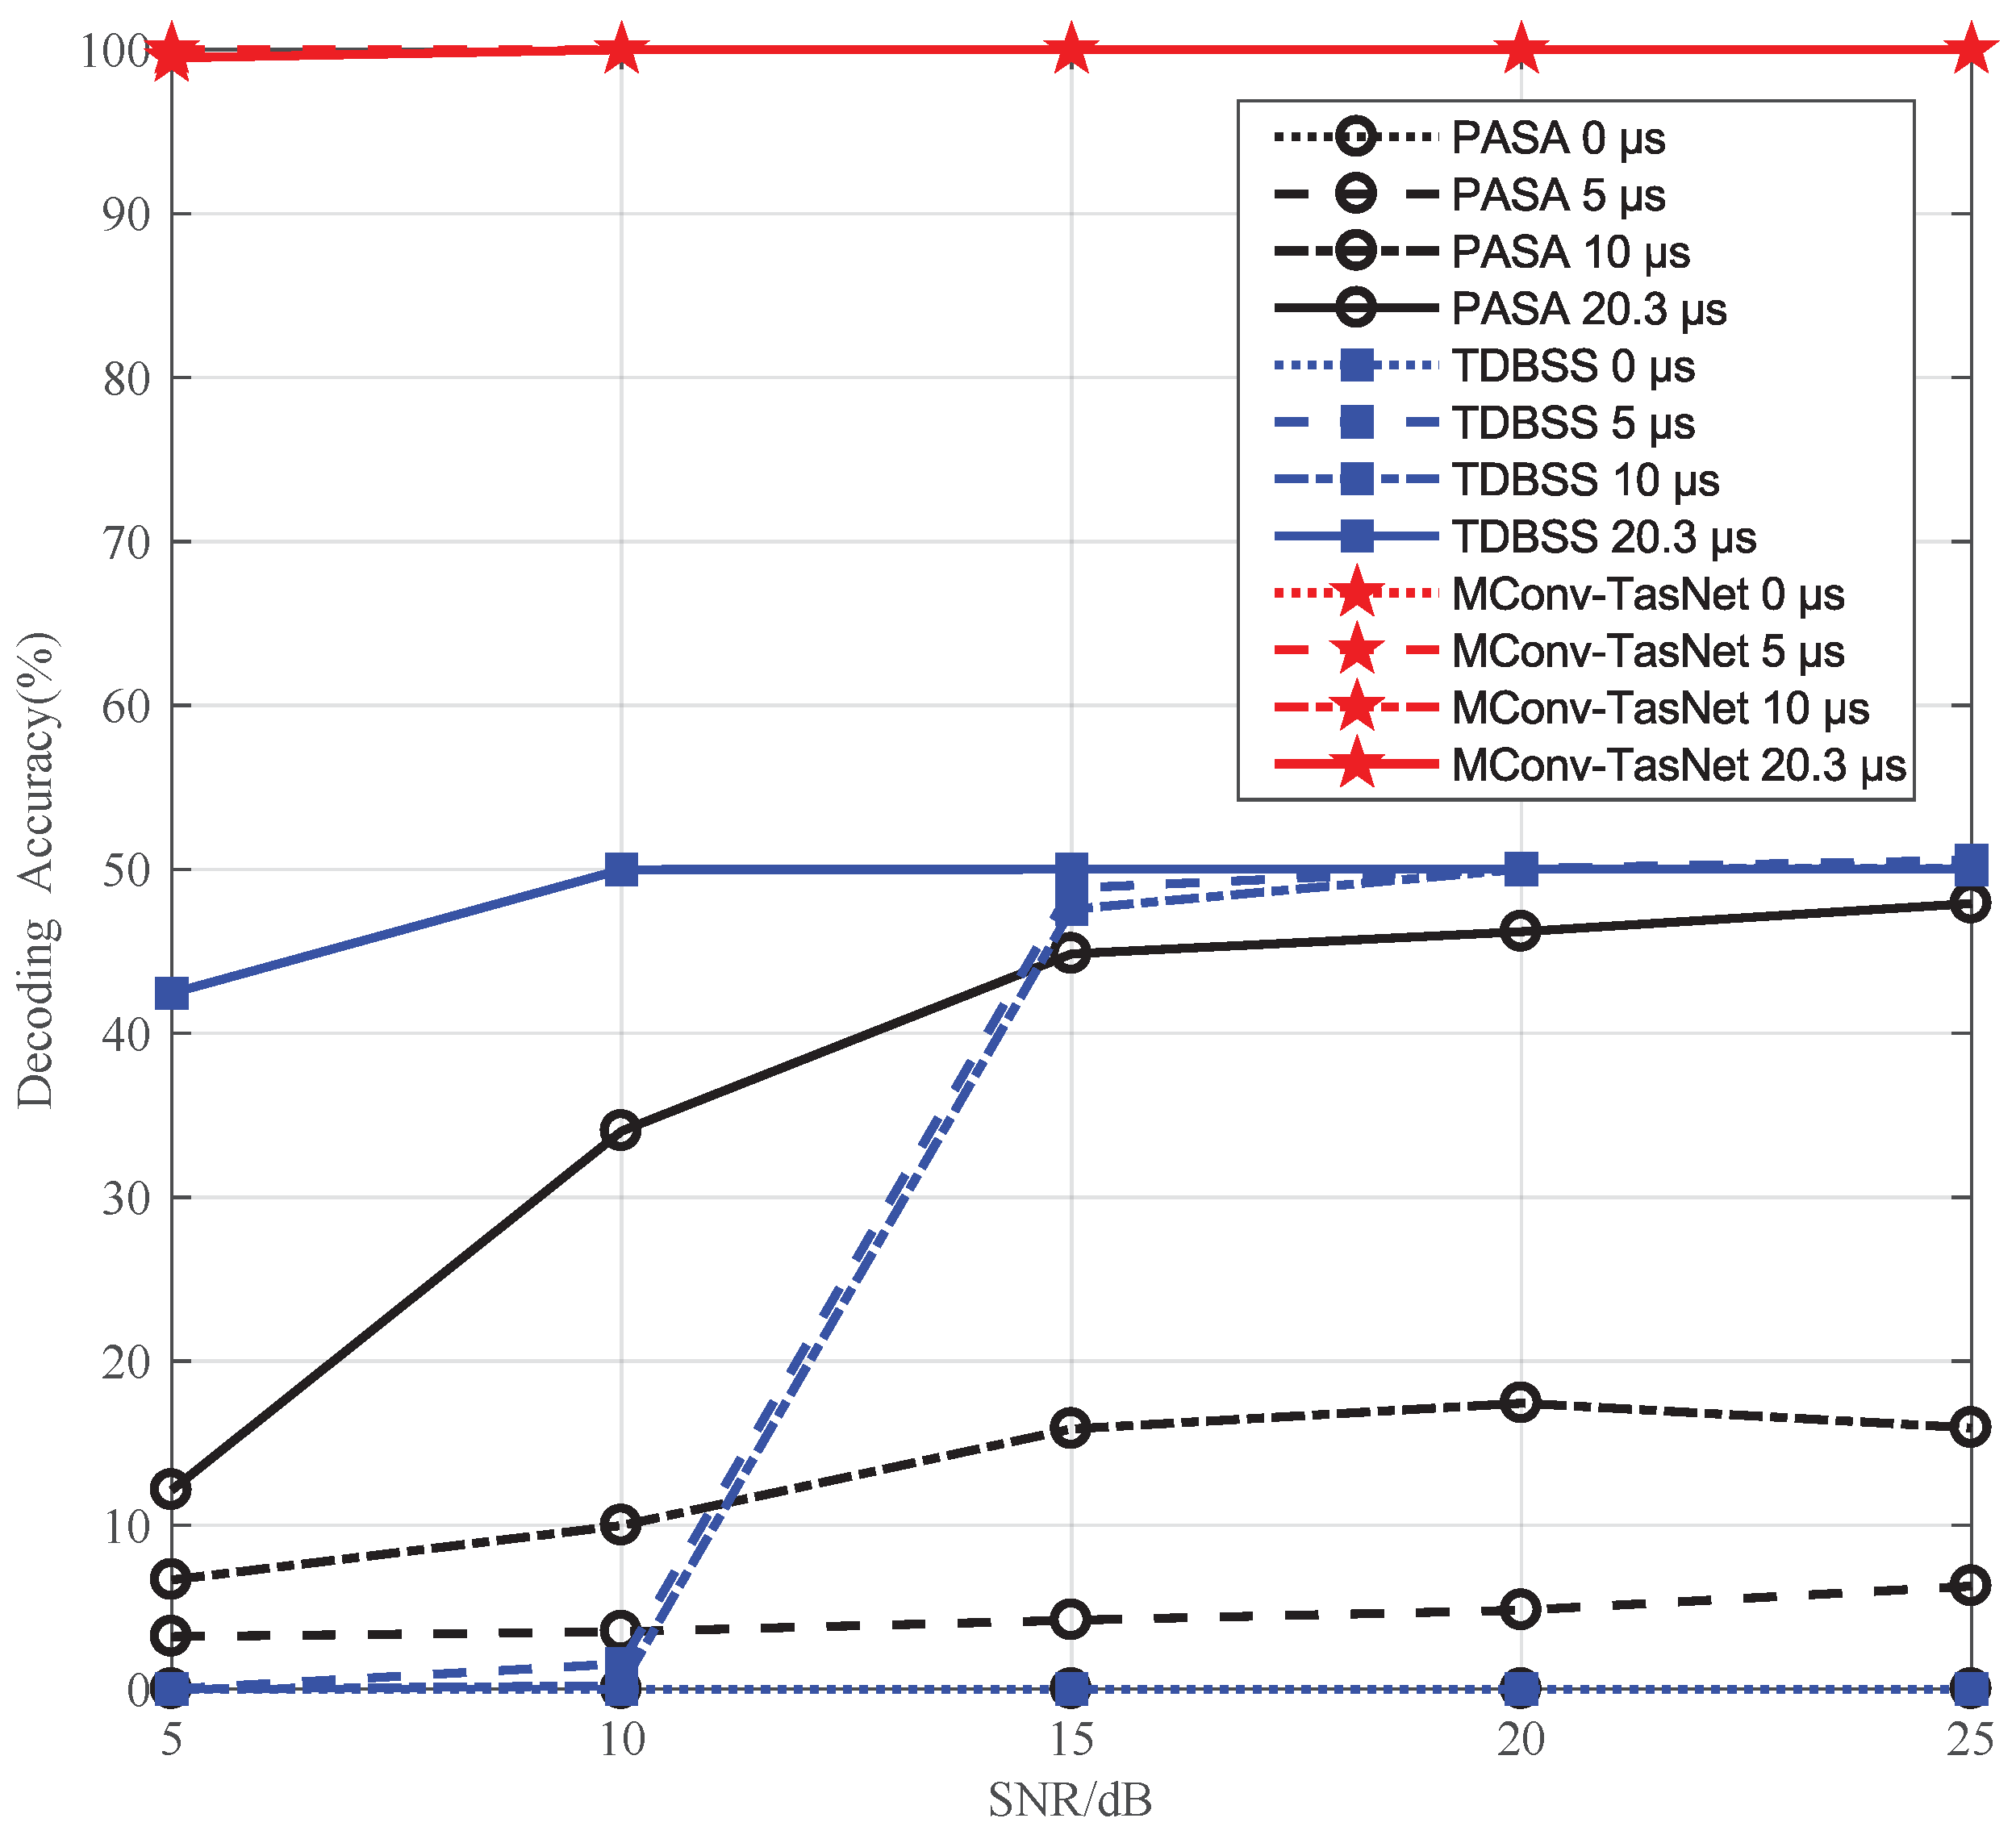
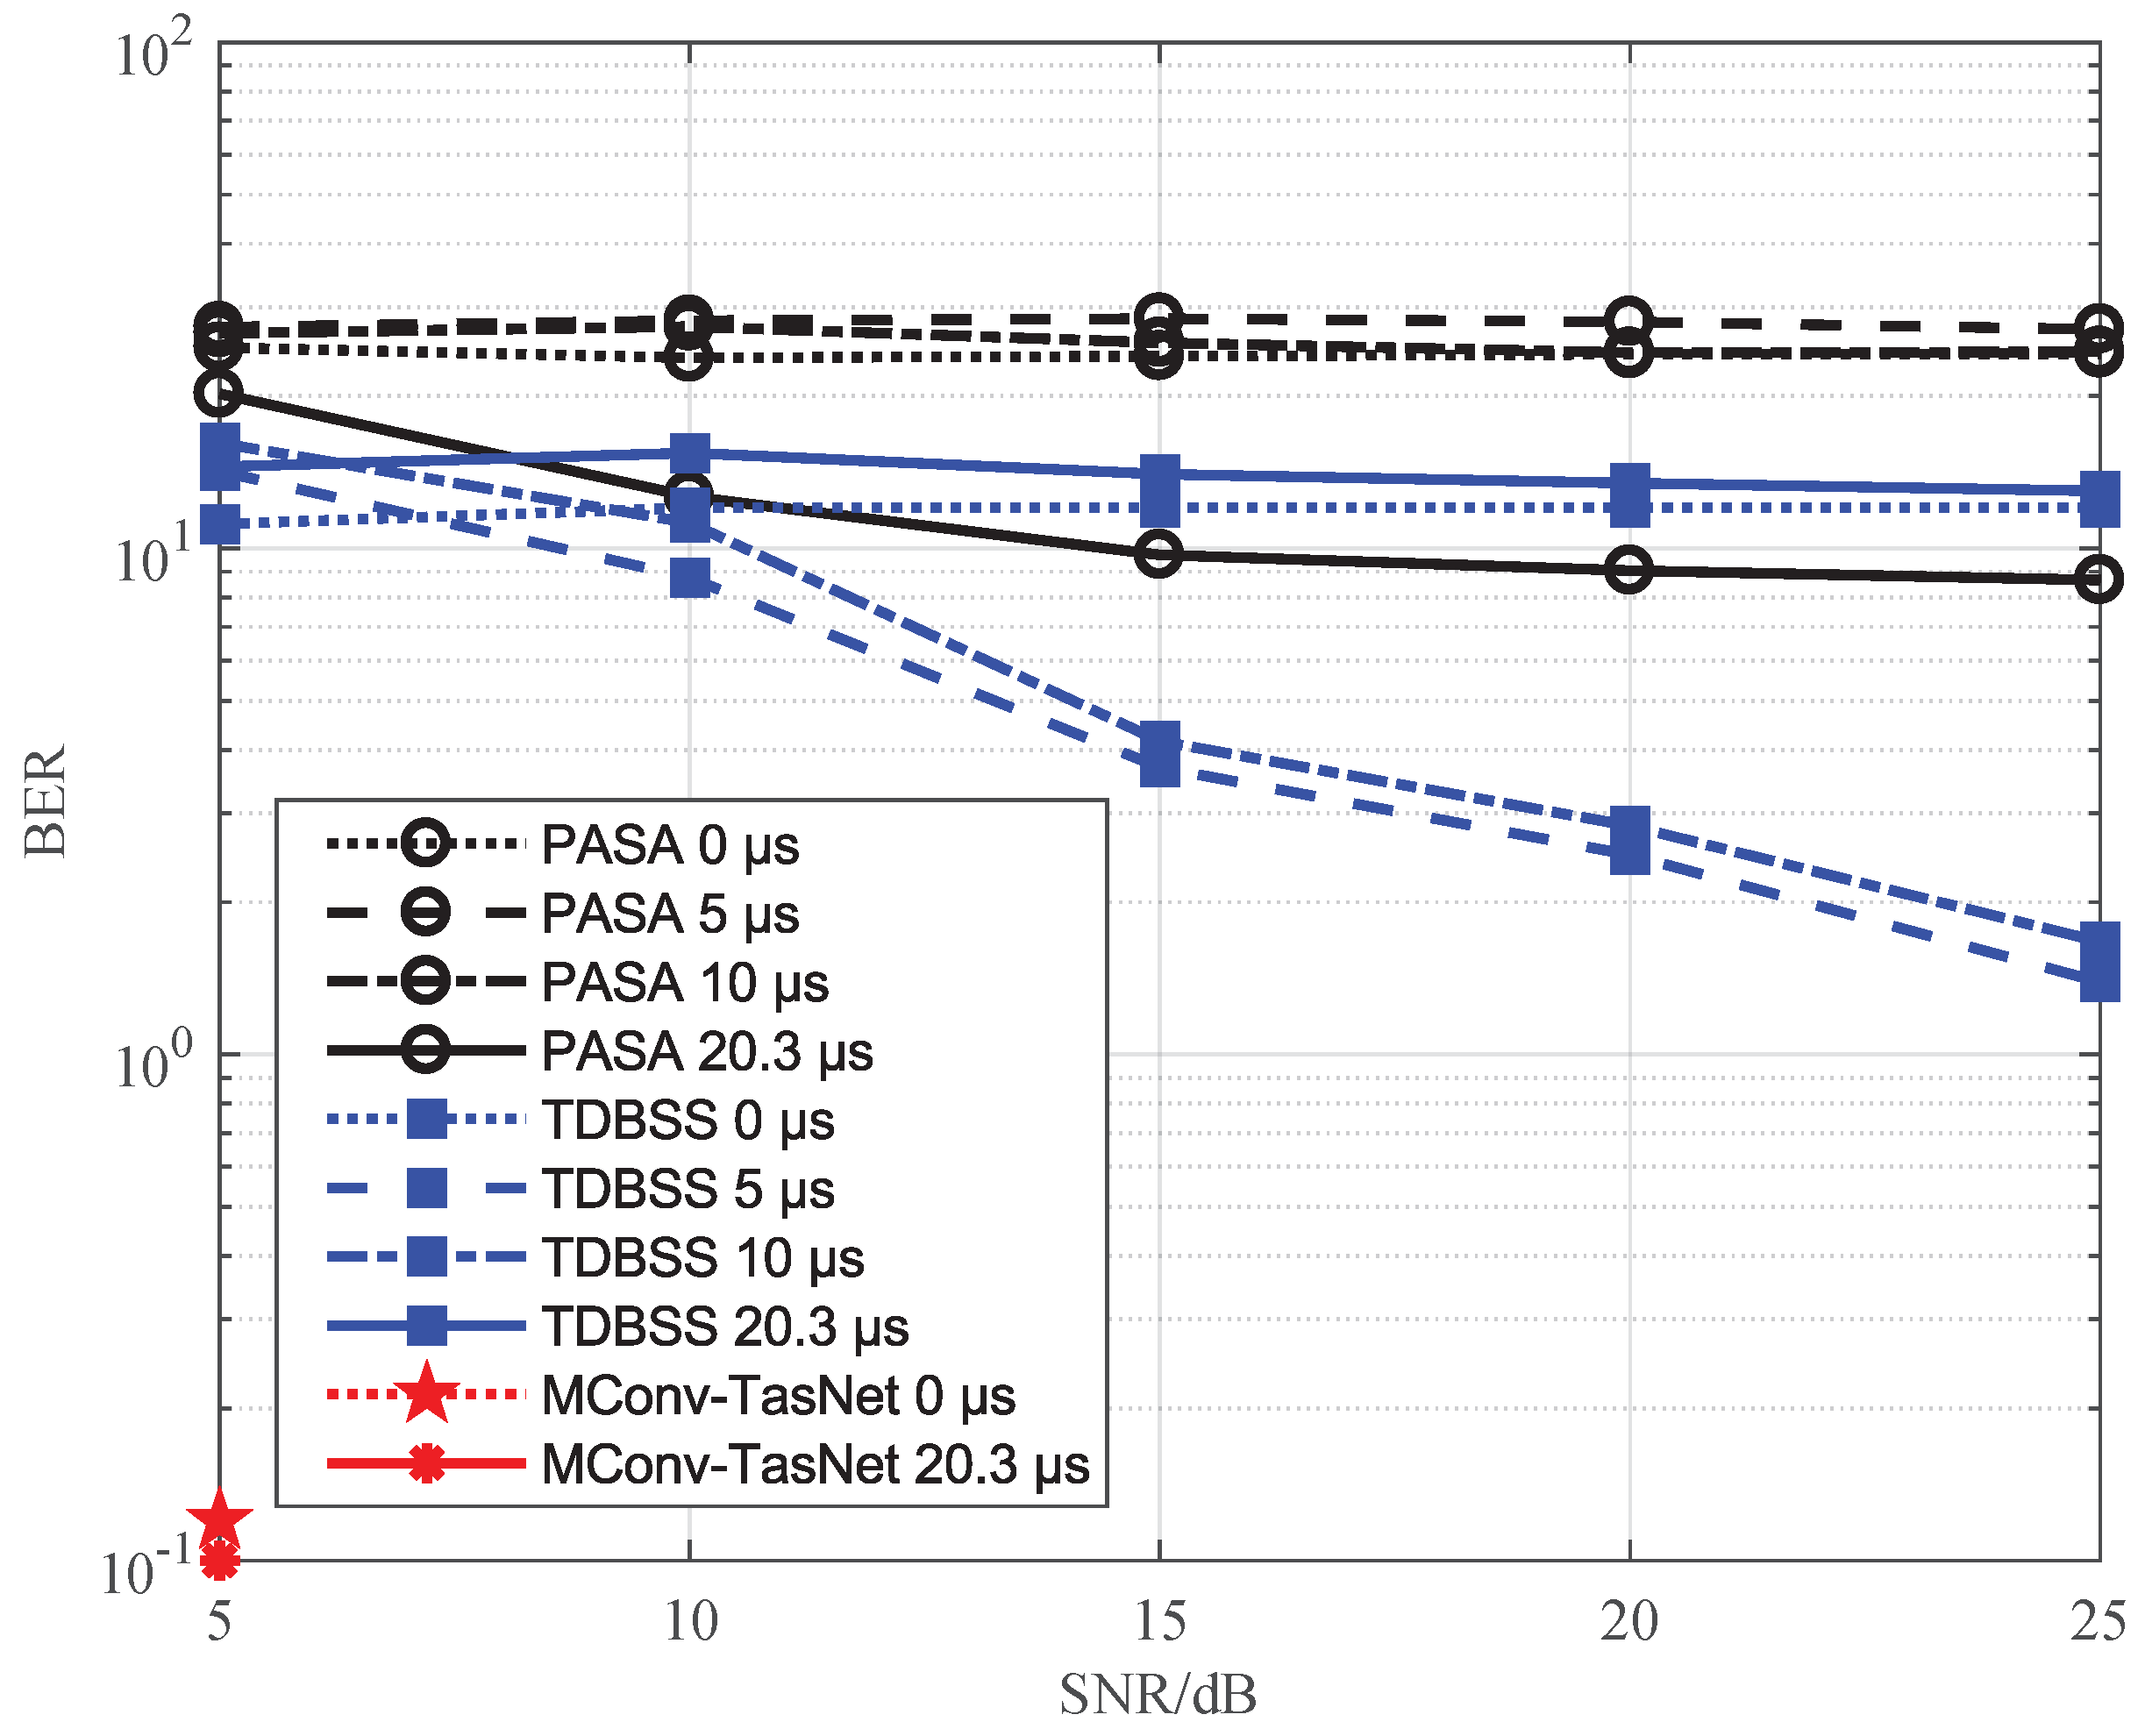
A total of 2000 test samples with a SNR of 5, 10, 15, 20 and 25 dB, power difference between signals of 2 dB, carrier frequencies of 10 MHz and 10.0015 MHz, and relative time delays of 0, 5, 10 and 20.3 μs are selected for testing. The decoding accuracy and BER of PASA, TDBSS and MConv-TasNet algorithms are shown in Figure 9 and Figure 10, respectively, with the power difference and carrier frequency of the signals fixed, SNR varying from 5 to 25 dB, and relative time delay taken as 0, 5, 10 and 20.3 μs, respectively.
The average decoding accuracy of PASA, TDBSS and MConv-TasNet algorithms is 13.65%, 27.07% and 99.93%, respectively, in Figure 9. It can be observed from the figure that PASA and TDBSS algorithm are more influenced by the relative time delay between overlapped signals. The decoding accuracy of both algorithms are increased with the rise of the relative time delay, and they achieve the highest decoding accuracy when the relative time delay is 20.3 μs. However, the MConv-TasNet algorithm outperforms them and is less affected by the relative time delay. In particular, the MConv-TasNet algorithm is still able to separate signals with high accuracy when the relative time delay is 0 μs.
The average BERs of PASA, TDBSS and the MConv-TasNet algorithms are 22.45%, 9.81% and 0.02%, respectively, in Figure 10. The MConv-TasNet algorithm achieves the maximum BER 0.12% when the relative time delay between overlapped signals is 0 μs and the SNR is 5 dB. The BERs of the algorithm are all 0 when SNR is greater than or equal to 10 dB. The TDBSS algorithm achieves the minimum BER 6.1% at the relative time delay of 5 μs, while the PASA achieves the minimum BER 12.06% at the relative time delay of 20.3 μs. Therefore, the TDBSS and PASA are more affected by the relative time delay, while it has less impact on the performance of the MConv-TasNet algorithm.
In summary, it is verified by semi-real data that the MConv-TasNet algorithm proposed in this paper has a much higher decoding accuracy than the PASA and TDBSS algorithm under different SNR, power difference, carrier frequency difference and relative time delay conditions. When the power difference, carrier frequency difference and relative time delay between overlapping signals are small, the improved algorithm can still separate the signals with high accuracy. Therefore, the single-antenna signal separation method based on the deep learning network has great superiority over the traditional methods, which can better separate signals by learning the feature relationships between overlapping and separated signals.
5. Conclusions
This paper proposes a novel MConv-TasNet for the space-based ADS-B signal separation with a single antenna. It can capture different scale temporal features from the overlapped ADS-B signal and improve the separation performance. Moreover, a large ADS-B signal dataset is created to verify our proposed method. Compared with other deep learning networks, our proposed MConv-TasNet performs better. Furthermore, MConv-TasNet is far superior to traditional methods, such as PASA and TDBSS. When the power difference, carrier frequency difference and relative time delay between overlapping signals are small, our proposed method can still separate the signals with high accuracy. Therefore, the ADS-B signal can be separated more accurately by taking advantage of deep learning methods that are good at mining signal features.
Author Contributions
Conceptualization, Y.B. and C.L.; methodology, Y.B. and C.L.; software, Y.B. and C.L.; investigation, Y.B. and C.L.; writing, Y.B. and C.L. All authors have read and agreed to the published version of the manuscript.
Funding
This research is partly funded by the National Natural Science Foundation of China (No. 62101512), Fundamental Research Program of Shanxi Province (20210302124031).
Institutional Review Board Statement
Not applicable.
Informed Consent Statement
Not applicable.
Data Availability Statement
The data presented in this study are available on request 305 from the corresponding author.
Conflicts of Interest
The authors declare no conflict of interest.
References
- Ali, B.S.; Schuster, W.; Ochieng, W.Y. Evaluation of the Capability of Automatic Dependent Surveillance Broadcast to Meet the Requirements of Future Airborne Surveillance Applications. J. Navig. 2017, 70, 49–66. [Google Scholar] [CrossRef]
- Baker, K. Space-Based ADS-B: Performance, Architecture and Market. In Proceedings of the 2019 Integrated Communications, Navigation and Surveillance Conference (ICNS), Herndon, VA, USA, 9–11 April 2019; pp. 1–10. [Google Scholar]
- Michael, G.; John, D.; Ben, H.; Andy, H.; Dennis, D. A Compilation of Measured ADS-B Performance Characteristics from Aiereons Orbit Test Program. In Proceedings of the 2018 Enhanced Solutions for Aircraft and Vehicle Surveillance (ESAVS) Applications Conference, Berlin, Germany, 17–19 October 2018; pp. 18–19. [Google Scholar]
- Zhang, C.; Zhang, T.; Zhang, H. Overlapping ADS-B Signals Separation Algorithm Based on MUSIC. In Proceedings of the 2019 6th International Conference on Information Science and Control Engineering (ICISCE), Shanghai, China, 20–22 December 2019; pp. 1094–1098. [Google Scholar]
- Petrochilos, N.; Galati, G.; Piracci, E.G. Separation of SSR Signals by Array Processing in Multilateration Systems. IEEE Trans. Aerosp. Electron. Syst. 2009, 45, 965–982. [Google Scholar] [CrossRef]
- Wang, W.; Wu, R.; Liang, J. ADS-B Signal Separation Based On Blind Adaptive Beamforming. IEEE Trans. Veh. Technol. 2019, 68, 6547–6556. [Google Scholar]
- Wu, R.; Wu, C.; Wang, W. A Method of Overlapped ADS-B Signal Processing Based on Accumulation and Classification. J. Signal Process. 2017, 33, 572–576. [Google Scholar]
- Yu, S.; Chen, L.; Li, S.; Li, L. Separation of Space-based ADS-B Signals with Single Channel for Small Satellite. In Proceedings of the 2018 IEEE 3rd International Conference on Signal and Image Processing (ICSIP), Shenzhen, China, 13–15 July 2018; pp. 315–321. [Google Scholar]
- Li, K.; Kang, J.; Ren, H.; Wu, Q. A Reliable Separation Algorithm of ADS-B Signal Based on Time Domain. IEEE Access 2021, 9, 88019–88026. [Google Scholar]
- Galati, G.; Petrochilos, N.; Piracci, E.G. Degarbling Mode S replies received in single channel stations with a digital incremental improvement. IET Radar Sonar Navig. 2015, 9, 681–691. [Google Scholar] [CrossRef]
- Wang, W.; Shao, Y. Signal Separation for Automatic Dependent Surveillance-Broadcast Using Improved Single Antenna Project Algorithm. J. Electron. Inf. Technol. 2020, 42, 2721–2728. [Google Scholar]
- Lu, D.; Chen, T. Single-antenna Overlapped ADS-B Signal Self-detection and Separation Algorithm Based on EMD. J. Signal Process. 2019, 35, 1681–1690. [Google Scholar]
- Luo, A.; Wu, L.; Chen, L.; Yu, S.; Ni, J. Single Channel Signals Separation of Space-based ADS-B Based on Compressed Sensing. In Proceedings of the 2021 4th International Conference on Information Communication and Signal Processing (ICICSP), Shanghai, China, 24–26 September 2021; pp. 116–123. [Google Scholar]
- Li, C.; Zhang, Y.; Tang, B. Secondary Surveillance Radar Replies Received in Single Channel Based on Manchester Decoding Algorithm. J. Detect. Control 2018, 40, 66–69. [Google Scholar]
- Li, C.; Li, S.; Gao, Y.; Zhang, X.; Li, W. A Two-Stream Neural Network for Pose-Based Hand Gesture Recognition. IEEE Trans. Cogn. Dev. Syst. 2021, 1–10. [Google Scholar] [CrossRef]
- He, K.; Zhang, X.; Ren, S.; Sun, J. Deep Residual Learning for Image Recognition. In Proceedings of the 2016 IEEE Conference on Computer Vision and Pattern Recognition (CVPR), Las Vegas, NV, USA, 27–30 June 2016; pp. 770–778. [Google Scholar]
- Huang, G.; Liu, Z.; Weinberger, K.Q. Densely Connected Convolutional Networks. In Proceedings of the 2017 IEEE Conference on Computer Vision and Pattern Recognition (CVPR), Honolulu, HI, USA, 21–26 July 2017; pp. 2261–2269. [Google Scholar]
- Luo, Y.; Mesgarani, N. Conv-TasNet: Surpassing Ideal Time Frequency Magnitude Masking for Speech Separation. IEEE/ACM Trans. Audio Speech Lang. Process. 2019, 27, 1256–1266. [Google Scholar] [CrossRef] [PubMed] [Green Version]
- Shi, Z.; Lin, H.; Liu, L.; Liu, R.; Han, J.; Shi, A. Deep Attention Gated Dilated Temporal Convolutional Networks with Intra-Parallel Convolutional Modules for End-to-End Monaural Speech Separation. In Proceedings of the INTERSPEECH, Graz, Austria, 15–19 September 2019; pp. 3183–3187. [Google Scholar]
- Shi, Z.; Lin, H.; Liu, L.; Liu, R.; Hayakawa, S.; Harada, S.; Han, J. End-to-End Monaural Speech Separation with Multi-Scale Dynamic Weighted Gated Dilated Convolutional Pyramid Network. In Proceedings of the INTERSPEECH, Graz, Austria, 15–19 September 2019; pp. 4614–4618. [Google Scholar]
- Luo, Y.; Chen, Z.; Yoshioka, T. Dual-Path RNN: Efficient Long Sequence Modeling for Time-Domain Single-Channel Speech Separation. In Proceedings of the ICASSP 2020—2020 IEEE International Conference on Acoustics, Speech and Signal Processing (ICASSP), Barcelona, Spain, 4–8 May 2020; pp. 46–50. [Google Scholar]
- Chen, J.; Mao, Q.; Liu, D. Dual-Path Transformer Network: Direct Context-Aware Modeling for End-to-End Monaural Speech Separation. In Proceedings of the INTERSPEECH, Shanghai, China, 25–29 October 2020; pp. 1–5. [Google Scholar]
Figure 1.
The diagram of ADS-B baseband signal.

Figure 2.
The framework of proposed MConv-TasNet.

Figure 3.
The multi-scale convolutional separation network.

Figure 4.
The temporal convolutional network.

Figure 5.
The decoding accuracy of PASA, TDBSS and MConv-TasNet algorithms on signal power difference.
Figure 5.
The decoding accuracy of PASA, TDBSS and MConv-TasNet algorithms on signal power difference.

Figure 6.
The BER of PASA, TDBSS and MConv-TasNet algorithms on signal power difference.

Figure 7.
The decoding accuracy of PASA, TDBSS and MConv-TasNet algorithms on carrier frequency difference.
Figure 7.
The decoding accuracy of PASA, TDBSS and MConv-TasNet algorithms on carrier frequency difference.

Figure 8.
The BER of PASA, TDBSS and MConv-TasNet algorithms on carrier frequency difference.

Figure 9.
The decoding accuracy of PASA, TDBSS and MConv-TasNet algorithms on relative time delay.

Figure 10.
The BER of PASA, TDBSS and MConv-TasNet algorithms on relative time delay.


Publisher’s Note: MDPI stays neutral with regard to jurisdictional claims in published maps and institutional affiliations. |
© 2022 by the authors. Licensee MDPI, Basel, Switzerland. This article is an open access article distributed under the terms and conditions of the Creative Commons Attribution (CC BY) license (https://creativecommons.org/licenses/by/4.0/).
Share and Cite
MDPI and ACS Style
Bi, Y.; Li, C. Multi-Scale Convolutional Network for Space-Based ADS-B Signal Separation with Single Antenna. Appl. Sci. 2022, 12, 8816. https://0-doi-org.brum.beds.ac.uk/10.3390/app12178816
AMA Style
Bi Y, Li C. Multi-Scale Convolutional Network for Space-Based ADS-B Signal Separation with Single Antenna. Applied Sciences. 2022; 12(17):8816. https://0-doi-org.brum.beds.ac.uk/10.3390/app12178816
Chicago/Turabian StyleBi, Yan, and Chuankun Li. 2022. "Multi-Scale Convolutional Network for Space-Based ADS-B Signal Separation with Single Antenna" Applied Sciences 12, no. 17: 8816. https://0-doi-org.brum.beds.ac.uk/10.3390/app12178816
Note that from the first issue of 2016, this journal uses article numbers instead of page numbers. See further details here.