
Field Test Study on Vertical Bearing Characteristics of Coal Rock
1
Institute of Geotechnical Engineering, Nanjing Tech University, Nanjing 211816, China
2
School of Civil Engineering and Architecture, Jiangsu Open University, Nanjing 210036, China
*
Author to whom correspondence should be addressed.
Appl. Sci. 2022, 12(18), 9301; https://0-doi-org.brum.beds.ac.uk/10.3390/app12189301
Submission received: 31 August 2022
/
Revised: 13 September 2022
/
Accepted: 14 September 2022
/
Published: 16 September 2022
(This article belongs to the Special Issue Recent Progress on Advanced Foundation Engineering)
Abstract
:Coal rock is rarely used as the foundation bearing strata. For buildings located on coal rock, it is a reasonable and feasible way to obtain the vertical bearing characteristics of coal rock through field tests. Three plate load tests and two bi-directional load tests were carried out, and the design parameters of the vertical bearing capacity of the shallow foundation and the deep foundation were obtained, respectively. The plate load test results show that the pressure–settlement curve of coal rock is a steep-drop-type, and the deformation modulus decreases with the increase of the pressure. The bi-directional load test results show that the unit tip resistance-displacement curve of coal rock is a steep-drop-type, and the load transfer function of the unit tip resistance is an ideal elastic–plastic curve, and the displacement value corresponding to the ultimate bearing capacity is about 1% of the pile diameter. The load transfer function of the unit side resistance of coal rock is a hyperbolic curve. The equivalent pile top load–settlement curve obtained according to the load transfer functions of the unit tip resistance and the unit side resistance is consistent with the equivalent conversion results of the bi-directional load test method.
1. Introduction
For the foundation design of buildings sitting on rock, the basic design parameters such as the uniaxial compressive strength of rock are usually determined through laboratory tests. Combining these parameters with the characteristics of joints and fissures of the rock mass, the bearing capacity of the shallow foundation or the deep foundation can be calculated according to the theoretical formulas or the empirical formulas [1,2]. Coal rock is a special type of rock that is composed of, or contains, coal. Its composition is complex, its properties vary greatly and its mechanical properties are different from other types of rocks [3]. At present, the research on coal rock mostly focuses on the damage, the fracture and the seepage characteristics from the perspective of mining [4,5,6]. It is rare for coal rock to be used for supporting buildings. At present, there is still a lack of basic physical and mechanical parameters of coal rock, and there is no corresponding theoretical or empirical formula verified to calculate the bearing capacity of coal rock. Therefore, in the field of engineering applications, the bearing capacity of coal rock can only be obtained through in situ testing [7].
Plate load test is a common in situ testing method. By applying a vertical load on a rigid plate, the pressure–deformation curve of the ground can be obtained, and the bearing capacity can be determined [8,9]. The shallow plate load test corresponds to the Boussinesq solution, i.e., applying a vertical load on the surface of the elastic semi-infinite space. The deep plate load test corresponds to the Mindlin solution, i.e., applying a vertical load at a certain depth below the surface. According to the Boussinesq solution or the Mindlin solution, the stress and the deformation in the ground can be calculated [10,11,12,13,14]. The bearing capacity of rock is generally high, and it is difficult to apply large tonnage test loads, so small-diameter rigid plates are usually used; when the testing conditions are available, a larger size bearing plate or even a full-scale bearing plate can be used to obtain the bearing capacity parameters [9,15].
The bearing capacity of the pile foundation is often tested by the static load tests. Traditional testing methods include the kentledge method and the anchor pile method, etc. The tip resistance and the side resistance of the pile can be tested directly by using transducers embedded in the pile or interpreted from the load–settlement curve through certain methods [16,17]. The bearing capacity of the rock-socketed pile is usually very high, and it is difficult for the traditional test methods to provide sufficient reaction force, so the bi-directional load test is often used. For the bi-directional load test, the tip resistance and the side resistance of the pile are tested separately, so the corresponding bearing capacity and the load transfer function are obtained, respectively, and then the equivalent pile top load–settlement curve can be obtained [18,19,20,21].
The bearing capacity of the pile foundation depends on the load transfer functions of the tip resistance and the side resistance. In general, the displacement required to fully mobilize the tip resistance is significantly larger than that of the side resistance, but the load transfer functions of both resistances are usually hyperbolas. For rock-socketed piles, it is difficult to load the ground to failure during the test, and this will result in a small amount of displacement; the load transfer function of the tip resistance is mostly a straight line, a double line, etc.; the load transfer function of the side resistance depends on the shear characteristics of the concrete–rock interface, and it is associated with the development of the tip resistance [22,23,24,25].
In this paper, three plate load tests were carried out for coal rock, and the bearing capacity and the deformation parameters of the shallow foundation were obtained. The bi-directional load test of two test piles was carried out, and the load transfer functions of the tip resistance and the side resistance of the pile foundation in coal rock were obtained, and the equivalent load–settlement curve of the pile top was obtained accordingly.
2. Materials and Methods
2.1. Project Background
2.1.1. Construction Site Conditions
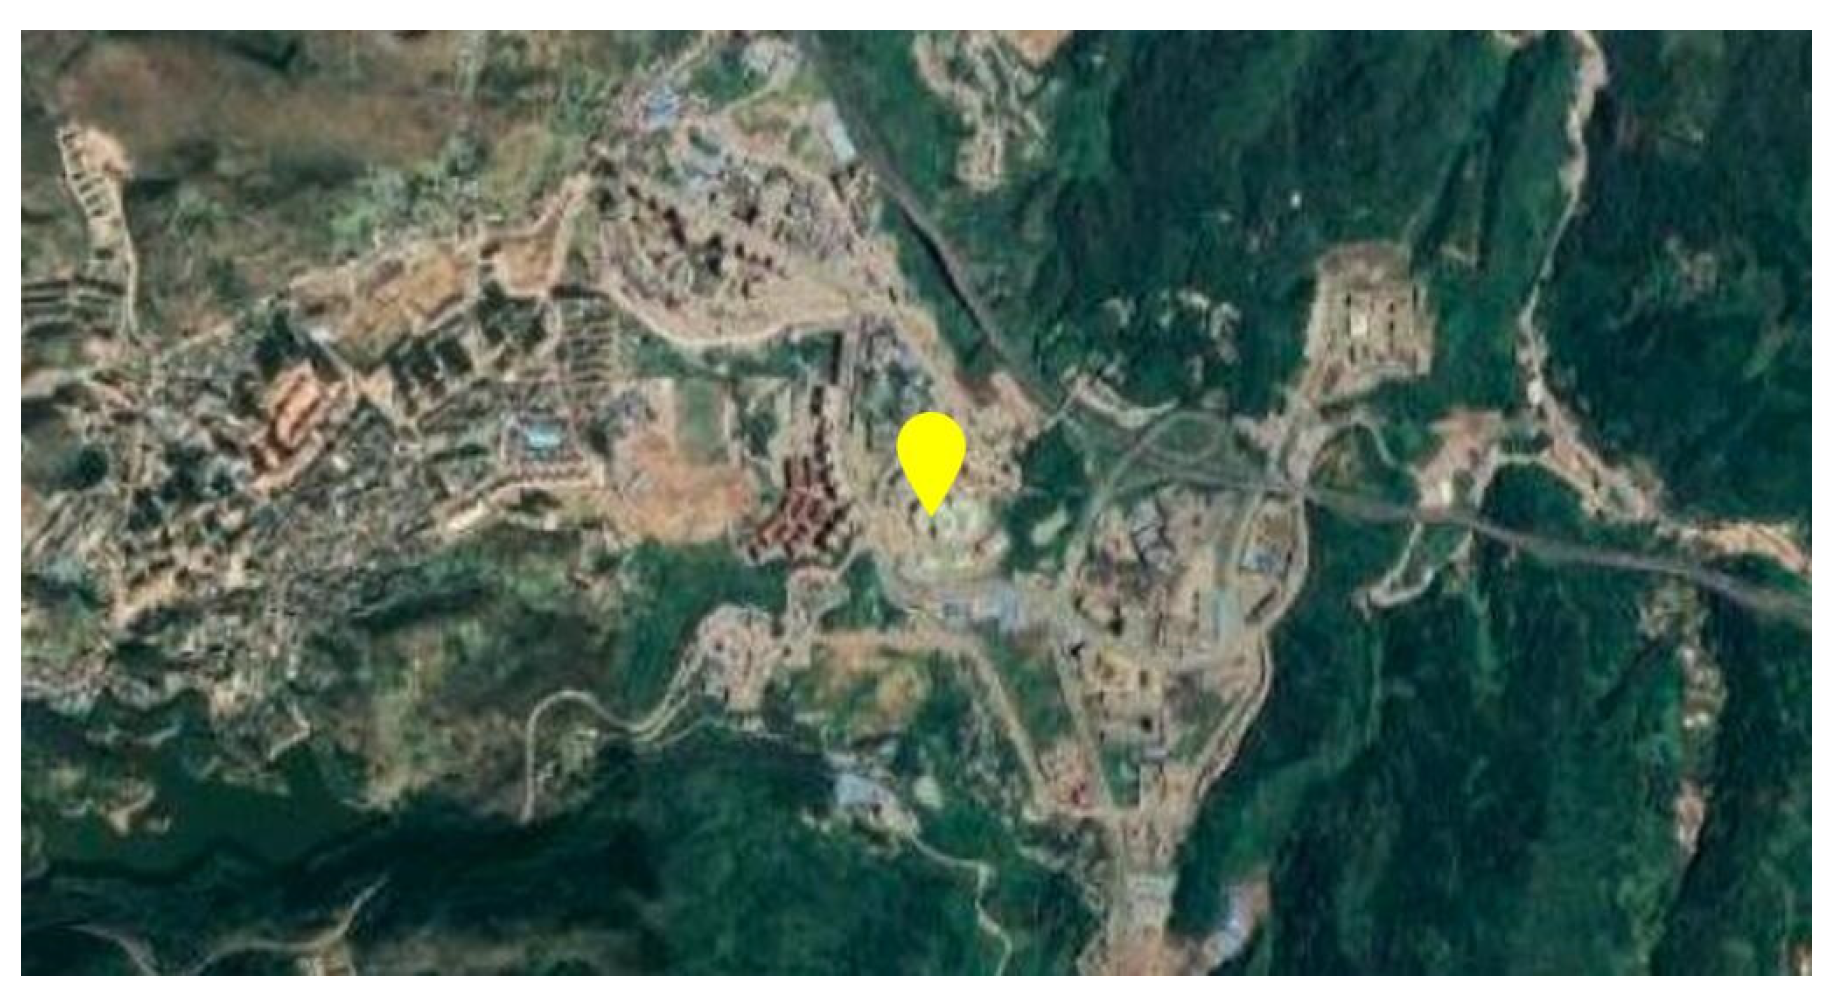
The construction site of the new Pu’an County People’s Hospital is located in Panshui Street, Pu’an County, as shown in Figure 1. The total building area is 87,673 m2. It consists of three towers (9 F~11 F, 33.9 m~40.5 m high), one Infectious Disease Building (6 F, 20.9 m high), two office buildings (4 F, 15.3 m high) and several other buildings (1 F~2 F, 4.2 m~8.6 m high). According to the difference of the superstructure, the building adopts two types of foundations: the independent foundation under columns for the lower parts of the building and the manual digging pile foundation for the higher parts of the building.
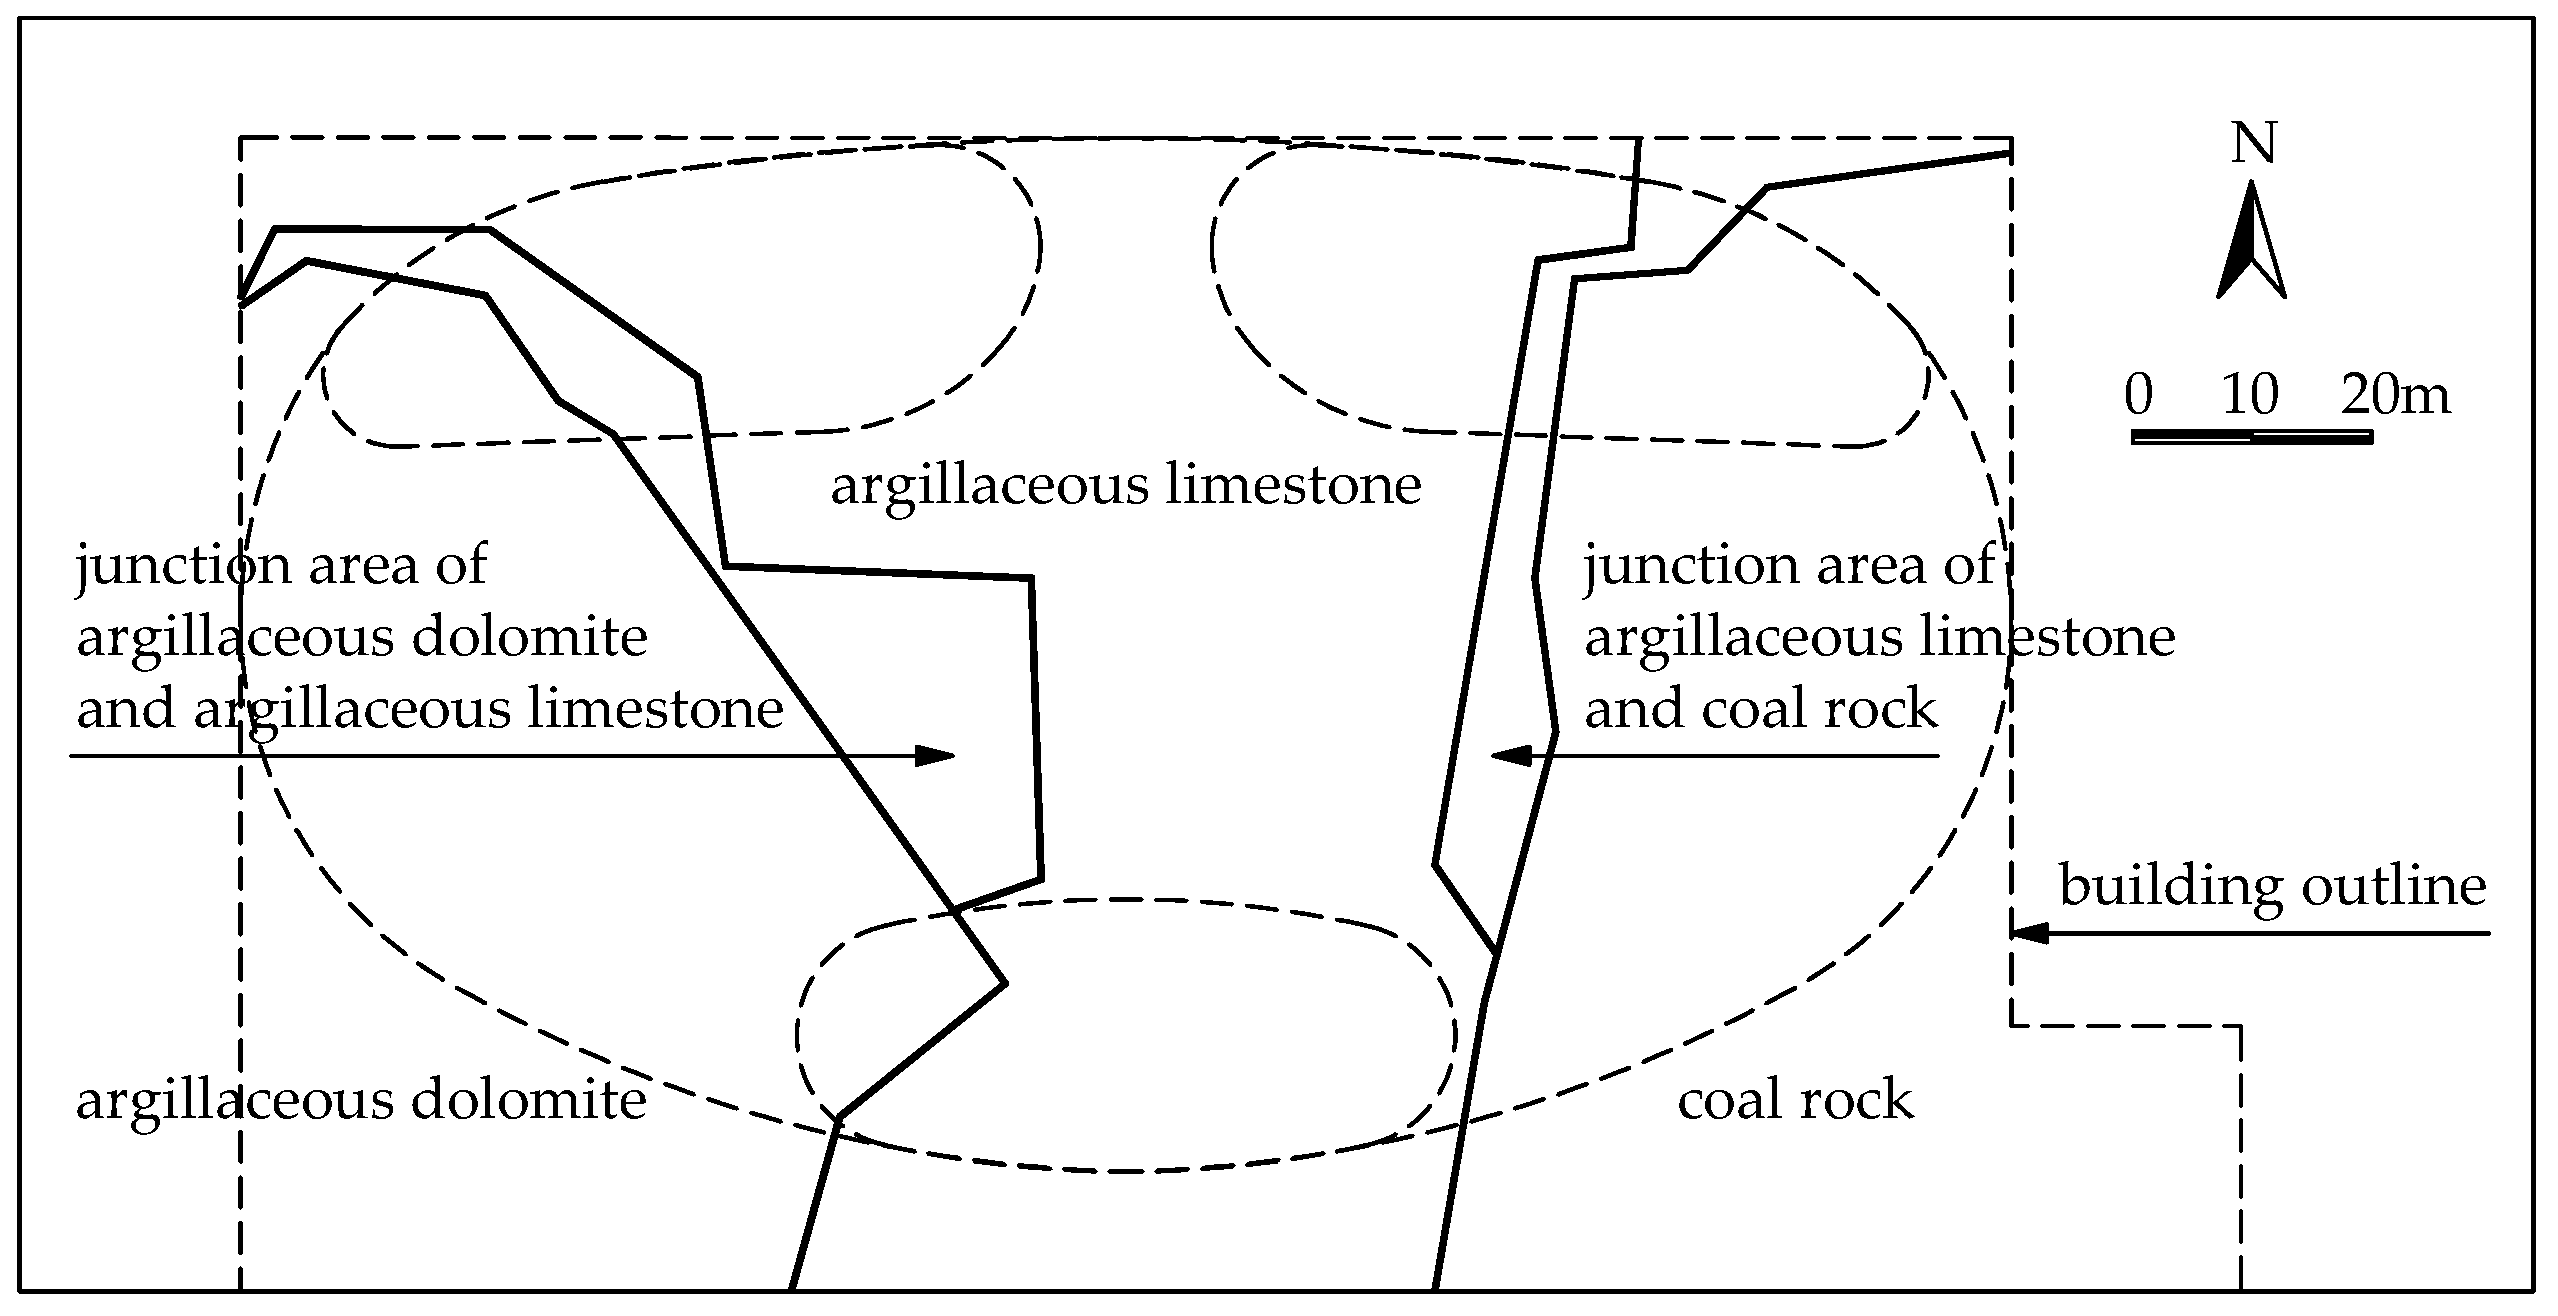
The ground elevation of the original site is between 1625 m and 1638 m, with a relative height difference of about 13 m. After excavation and leveling, the exposed strata on the working plane of the construction site are the argillaceous dolomite, the argillaceous limestone and the coal rock. The plane distribution of the rock formations is shown in Figure 2.
2.1.2. Foundation Design Considerations
For the foundation design of buildings, it is necessary to know the bearing capacity and the deformation characteristics of the ground. The argillaceous dolomite and the argillaceous limestone are common rock formations in the local area, and certain experiences have been accumulated, so the design parameters are clear. It is very rare for coal rock to be used as the bearing stratum of buildings, and there is no corresponding engineering experience accumulation, and there are no previous design cases for reference. Therefore, it is necessary to obtain the design parameters of coal rock through field tests.
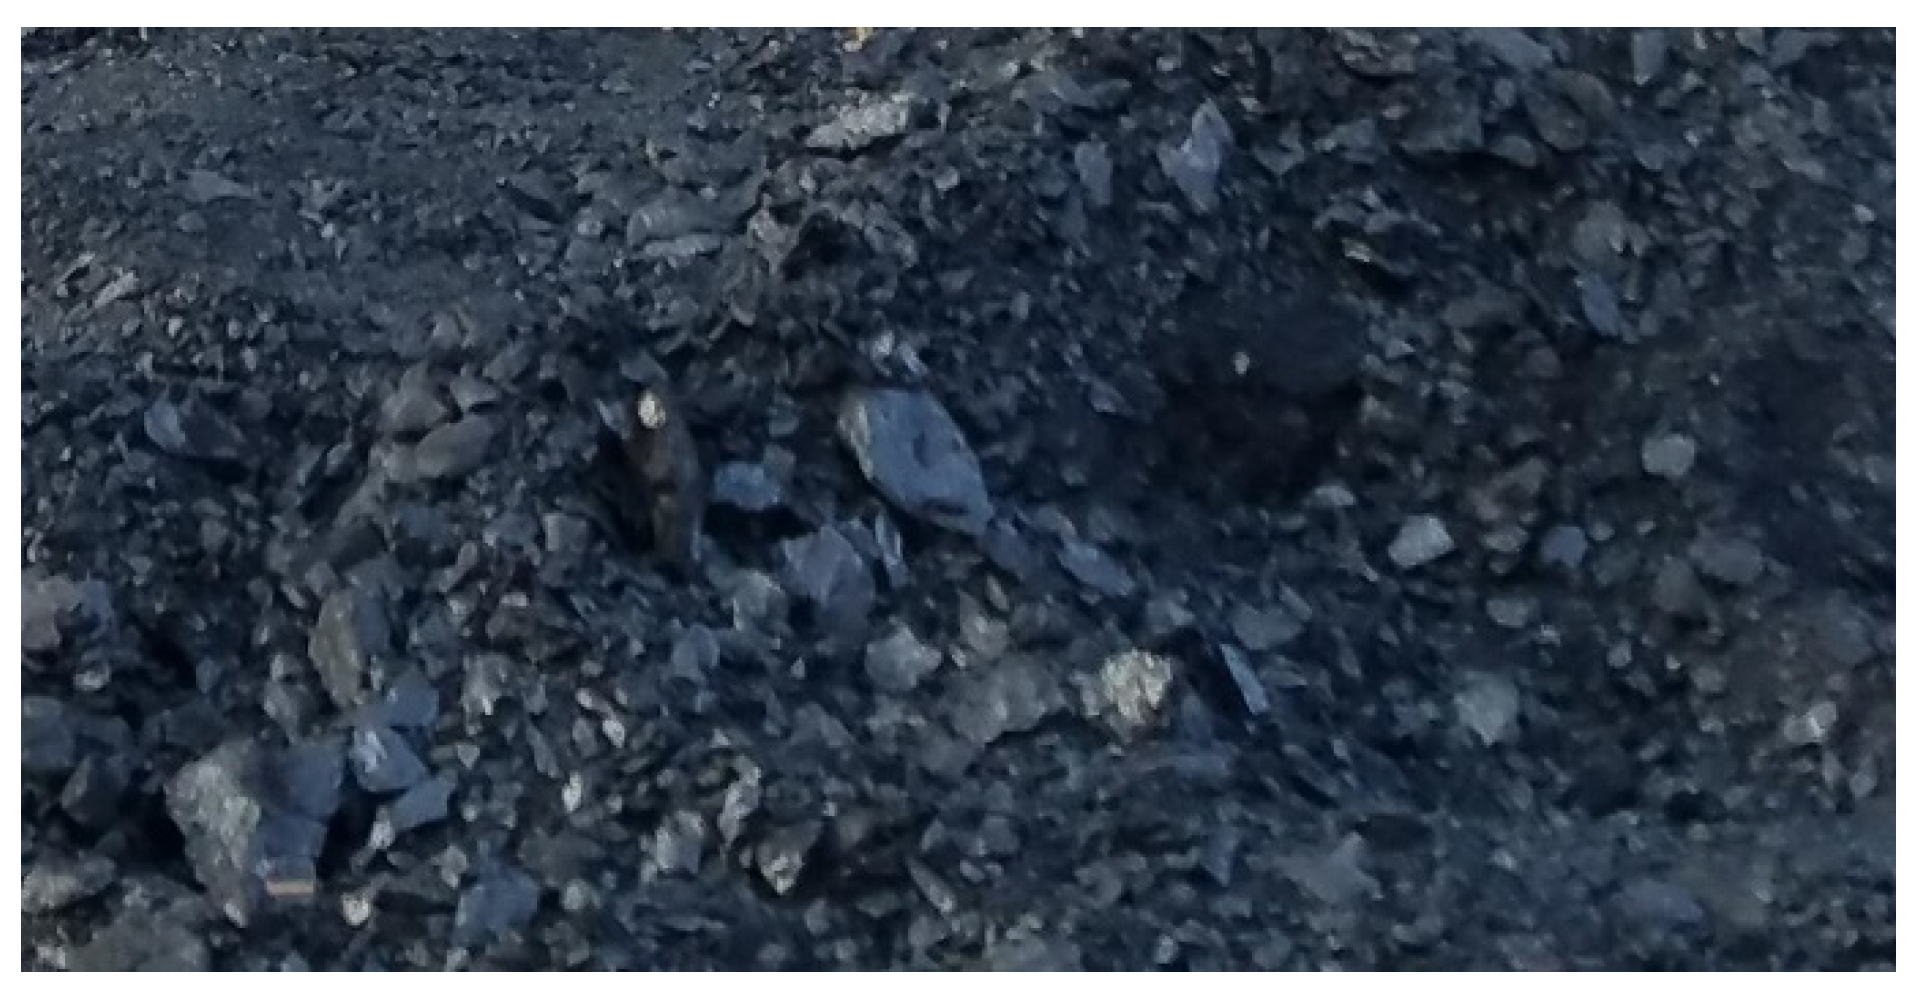
The coal rock is black, as shown in Figure 3. It is fragmented, flaky and sandy. The rock quality is very soft rock, and the basic quality of the rock mass is level V. In order to ensure the safety of the structure and the stability of the coal rock ground, the plate load test should be carried out to obtain the vertical bearing capacity and the deformation design parameters of the shallow foundation, and the static load test should be carried out to obtain the vertical compressive bearing capacity and the deformation design parameters of the pile foundation.
2.2. Field Tests
2.2.1. Test Plan
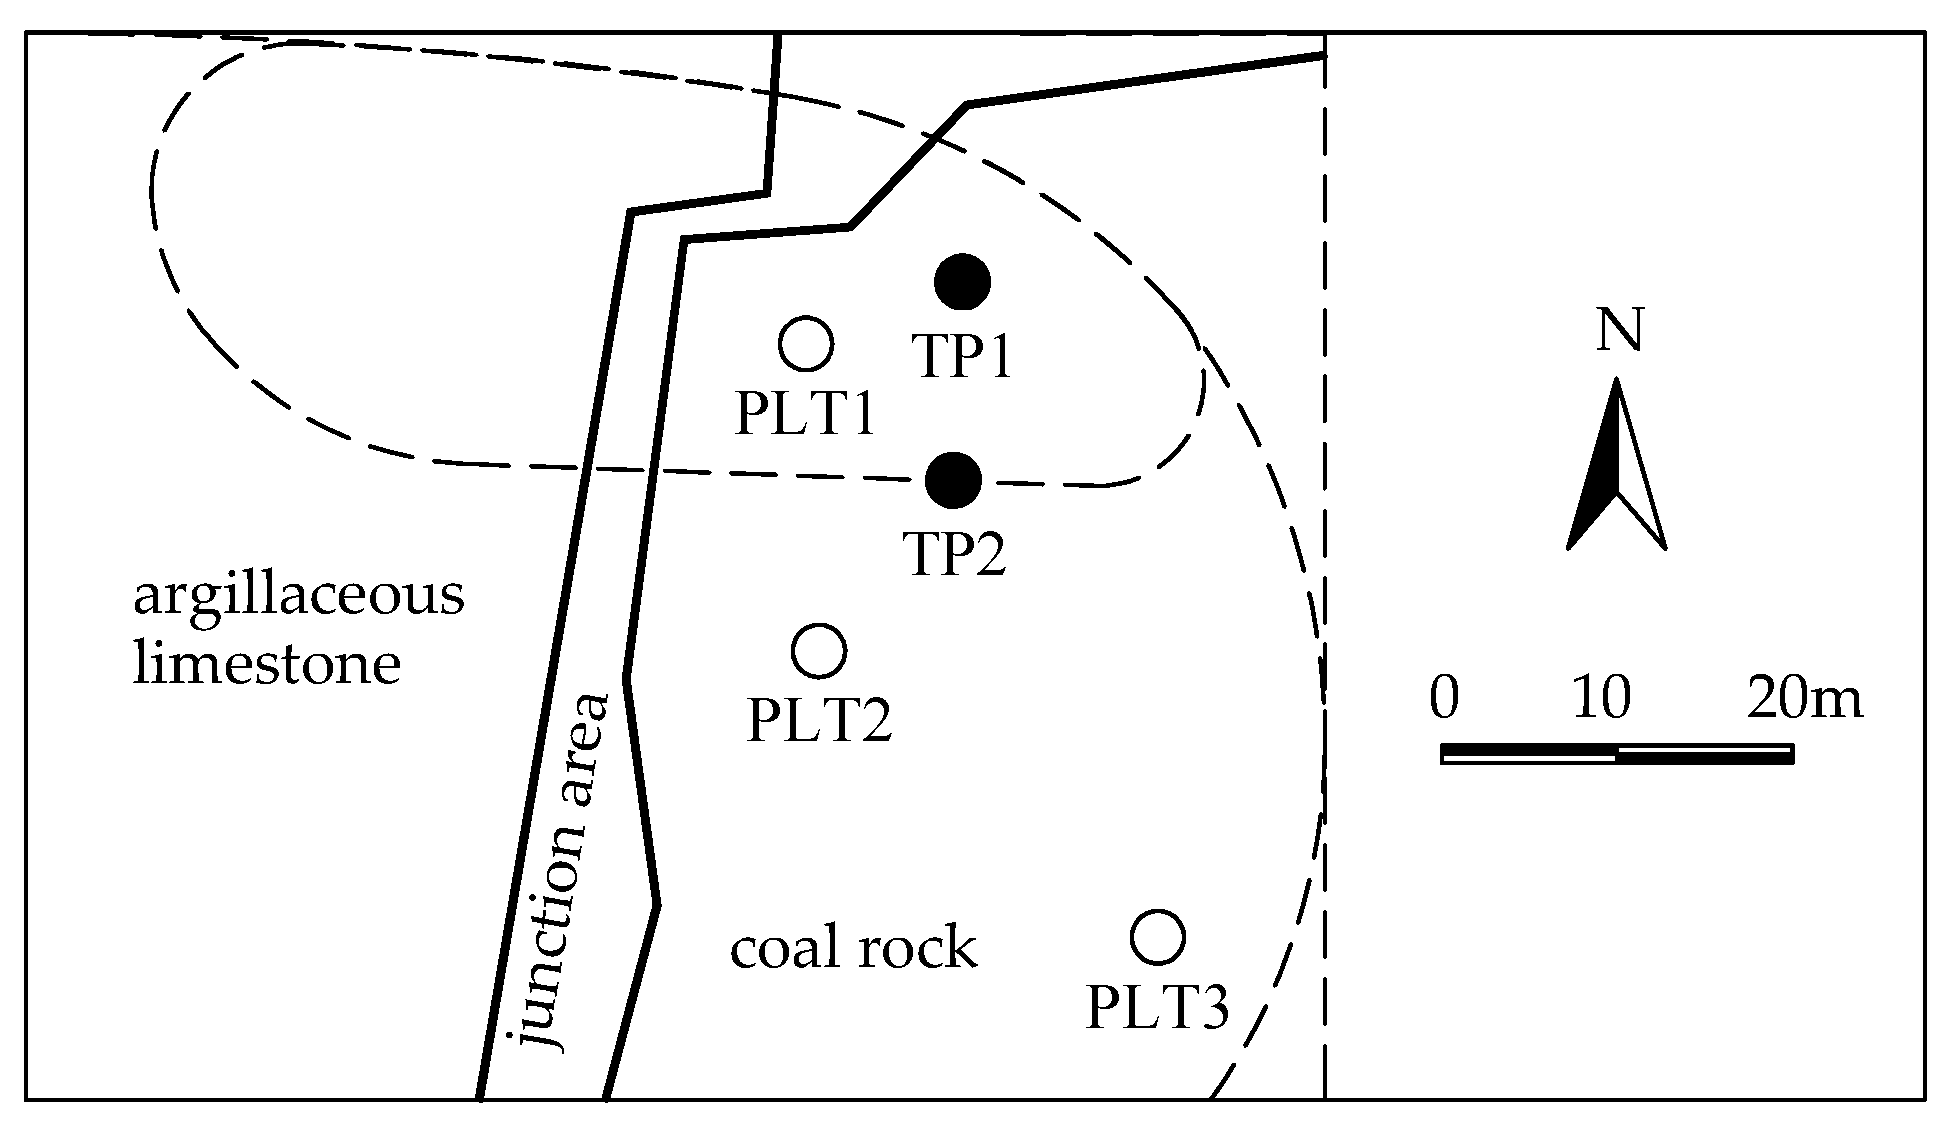
The elevation of the coal rock area after leveling is about 1628 m. According to the site conditions and the types of foundation, three test points (PLT1, PLT2, PLT3) of the plate load test were selected to obtain the design parameters of the shallow foundation. Two test points (TP1, TP2) of the bi-directional load test were selected to obtain the design parameters of the pile foundation. The distribution of the test points is shown in Figure 4.
2.2.2. Plate Load Test
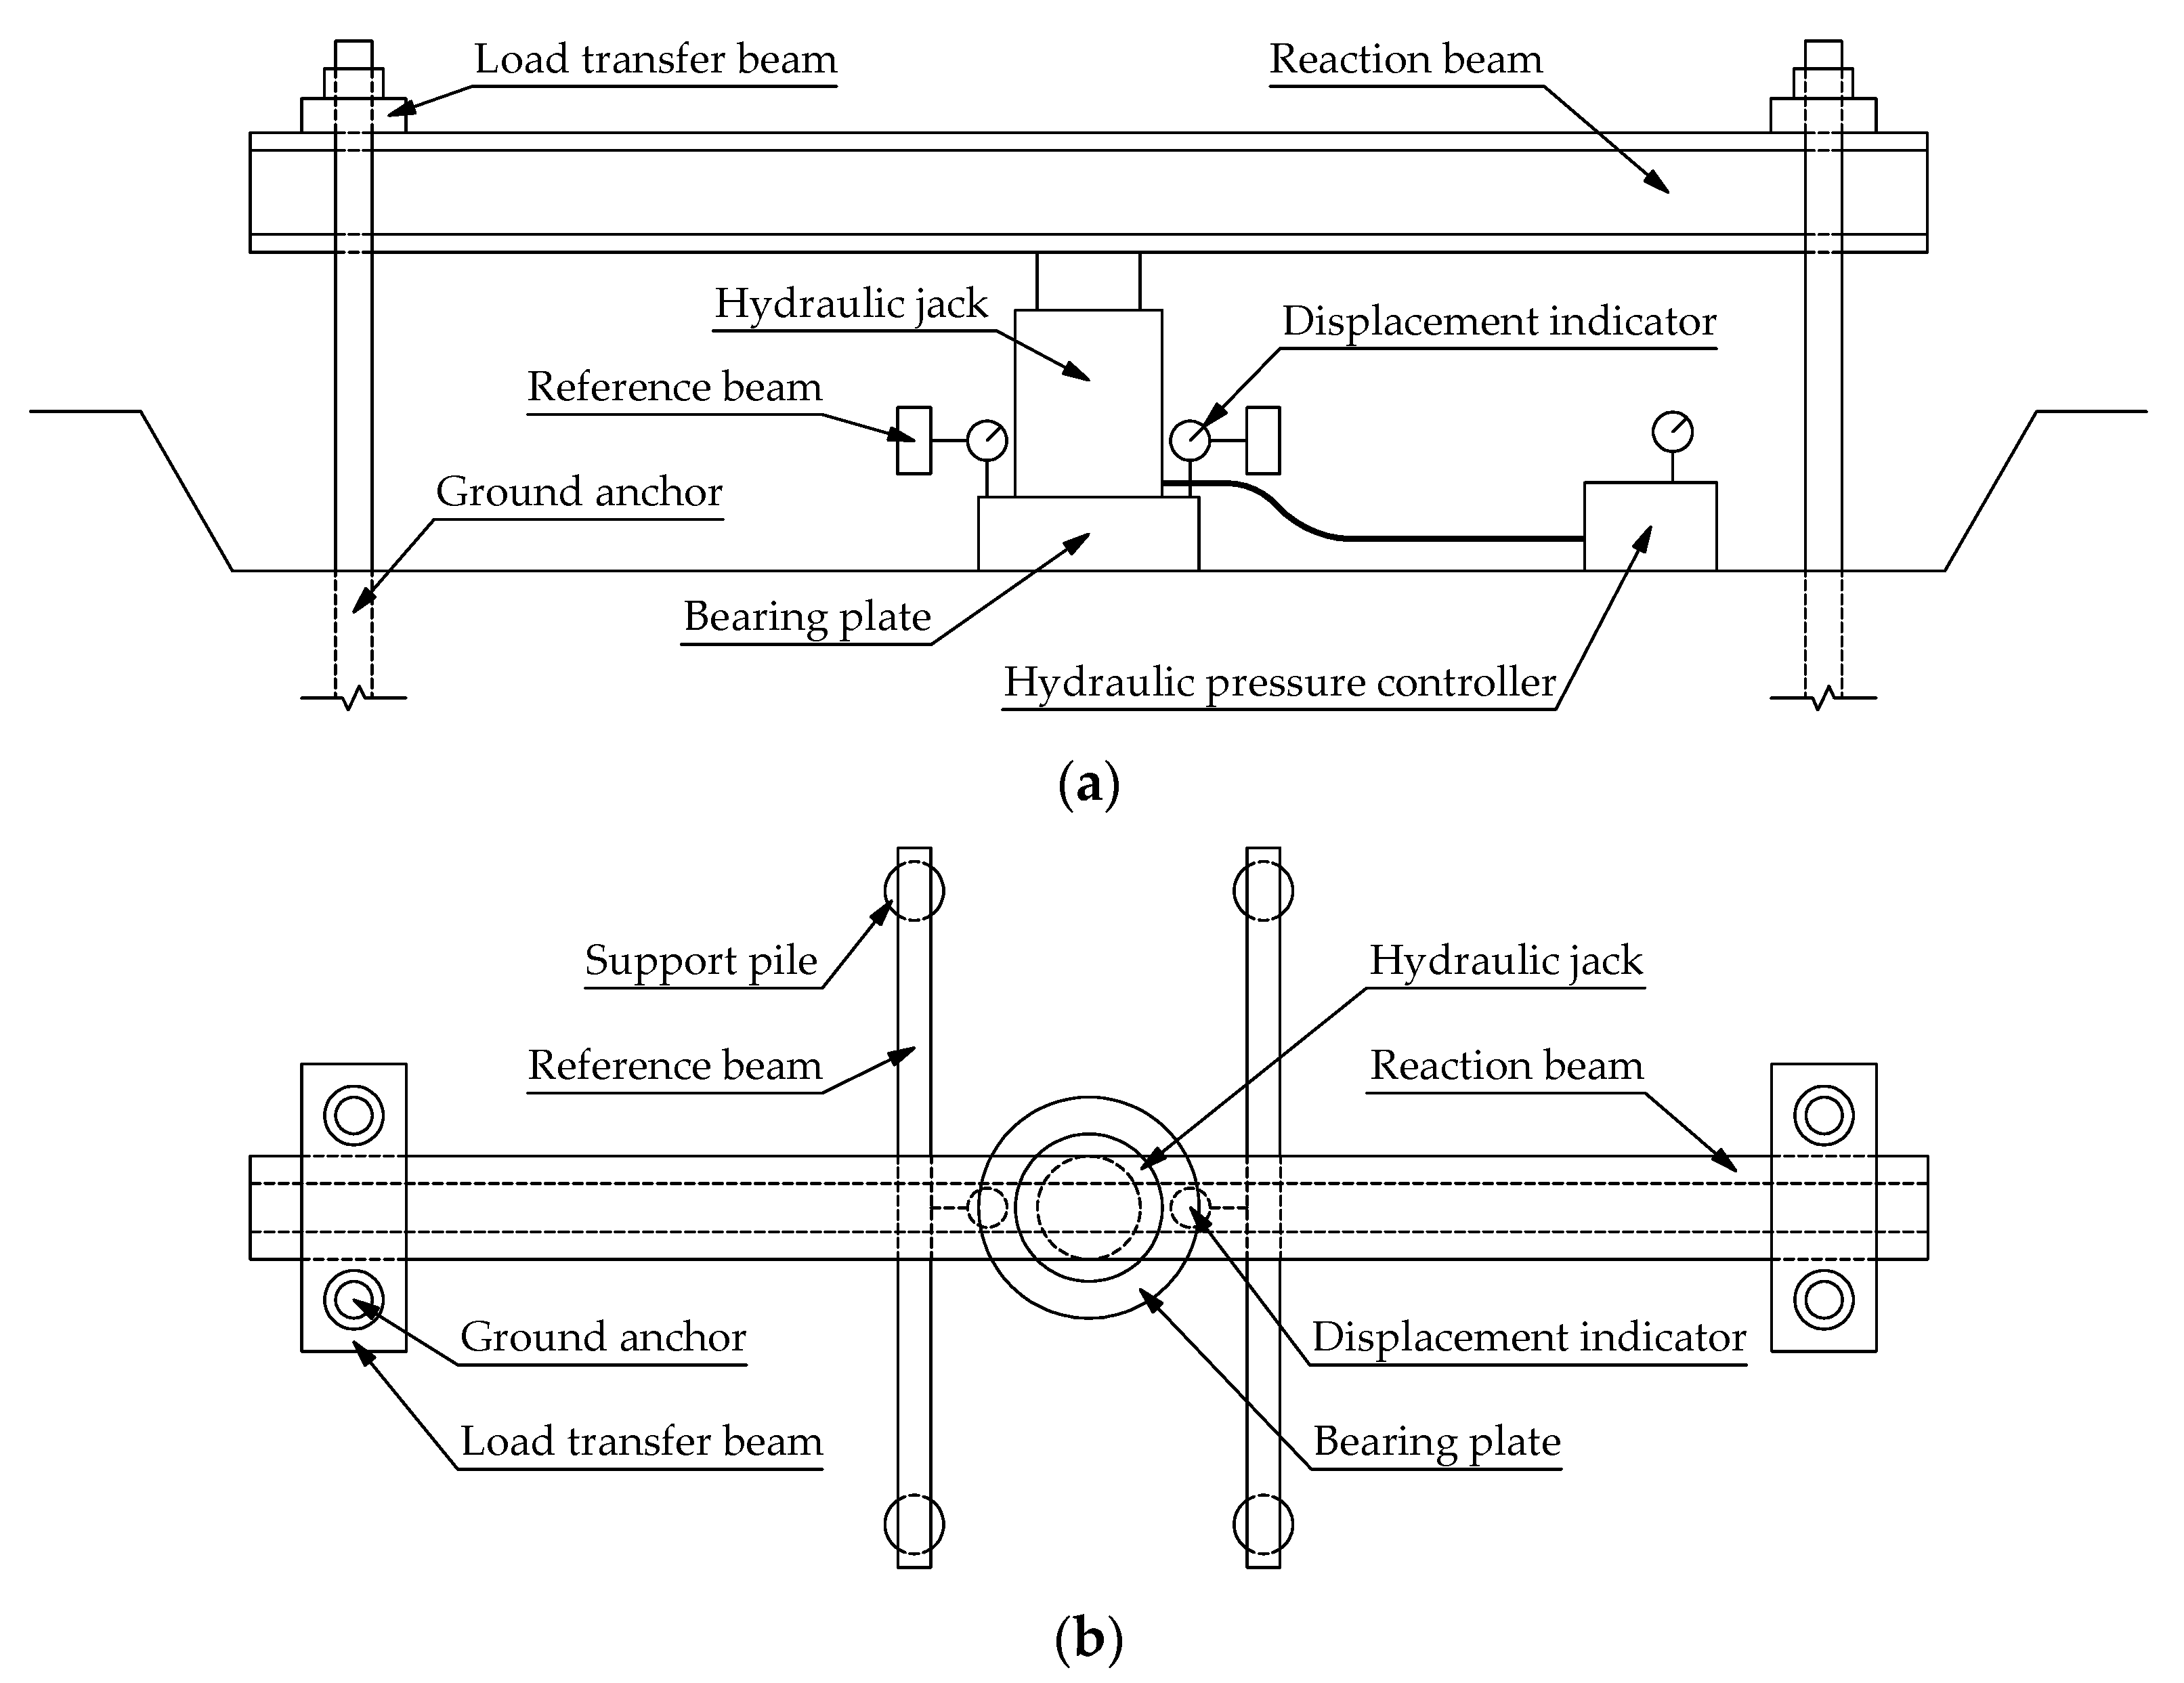
The plate load test was carried out using the ground anchor method, as shown in Figure 5. The bearing plate is a rigid circular steel plate with the diameter of 300 mm and the area of 0.07 m2. The reaction force required for the test is provided by the ground anchors, which are anchored into coal rock. The loading device is a hydraulic jack. The load applied is calculated by the pressure gauge at the hydraulic pressure controller, and the settlement of the bearing plate is measured by the displacement indicator [26].
The surface layer of the coal rock may be disturbed during excavation. In order to eliminate the influences, a test pit with the depth of 1 m was excavated downward from the working plane, and the fresh coal rock was exposed. Thus, the elevation of the test plane was about 1627 m. After leveling the test plane with coarse sand, the bearing plate was placed for testing.
The plate load test adopts the single-cycle loading method. The load is gradually increased until failure, and then unloaded in stages. When loading, the loading amount of the first level shall be 1/5 of the estimated bearing capacity, and the loading amount of each subsequent level shall be 1/10 of the estimated bearing capacity. The settlement is measured immediately after the application of each level of load, and then every 10 min thereafter. When the difference between three consecutive readings is not greater than 0.01 mm, the settlement convergence criteria are met, and the next level of load can be applied. When the pressure cannot be applied, or barely applied but cannot be maintained, it can be considered that the ultimate bearing capacity has been reached, and the loading process shall be terminated. When unloading, the unloading amount of each level is twice the loading amount. The settlement of each level of load is measured at an interval of 10 min, and the load can be removed after three times of reading. After unloading to zero, the settlement is measured at intervals of 10 min, until the rebound amount of 30 min is less than 0.01 mm [26].
The loading conditions of each plate load test are shown in Table 1. The loading amount of the first level is 280 kPa, and the load increment of each level is 140 kPa. When PLT1 is loaded to the 14 level, it is damaged, and the maximum loading value is 2100 kPa; the loading level and the maximum loading value are 13 and 1960 kPa for PLT2 and 15 and 2240 kPa for PLT3, respectively.
2.2.3. Bi-Directional Load Test
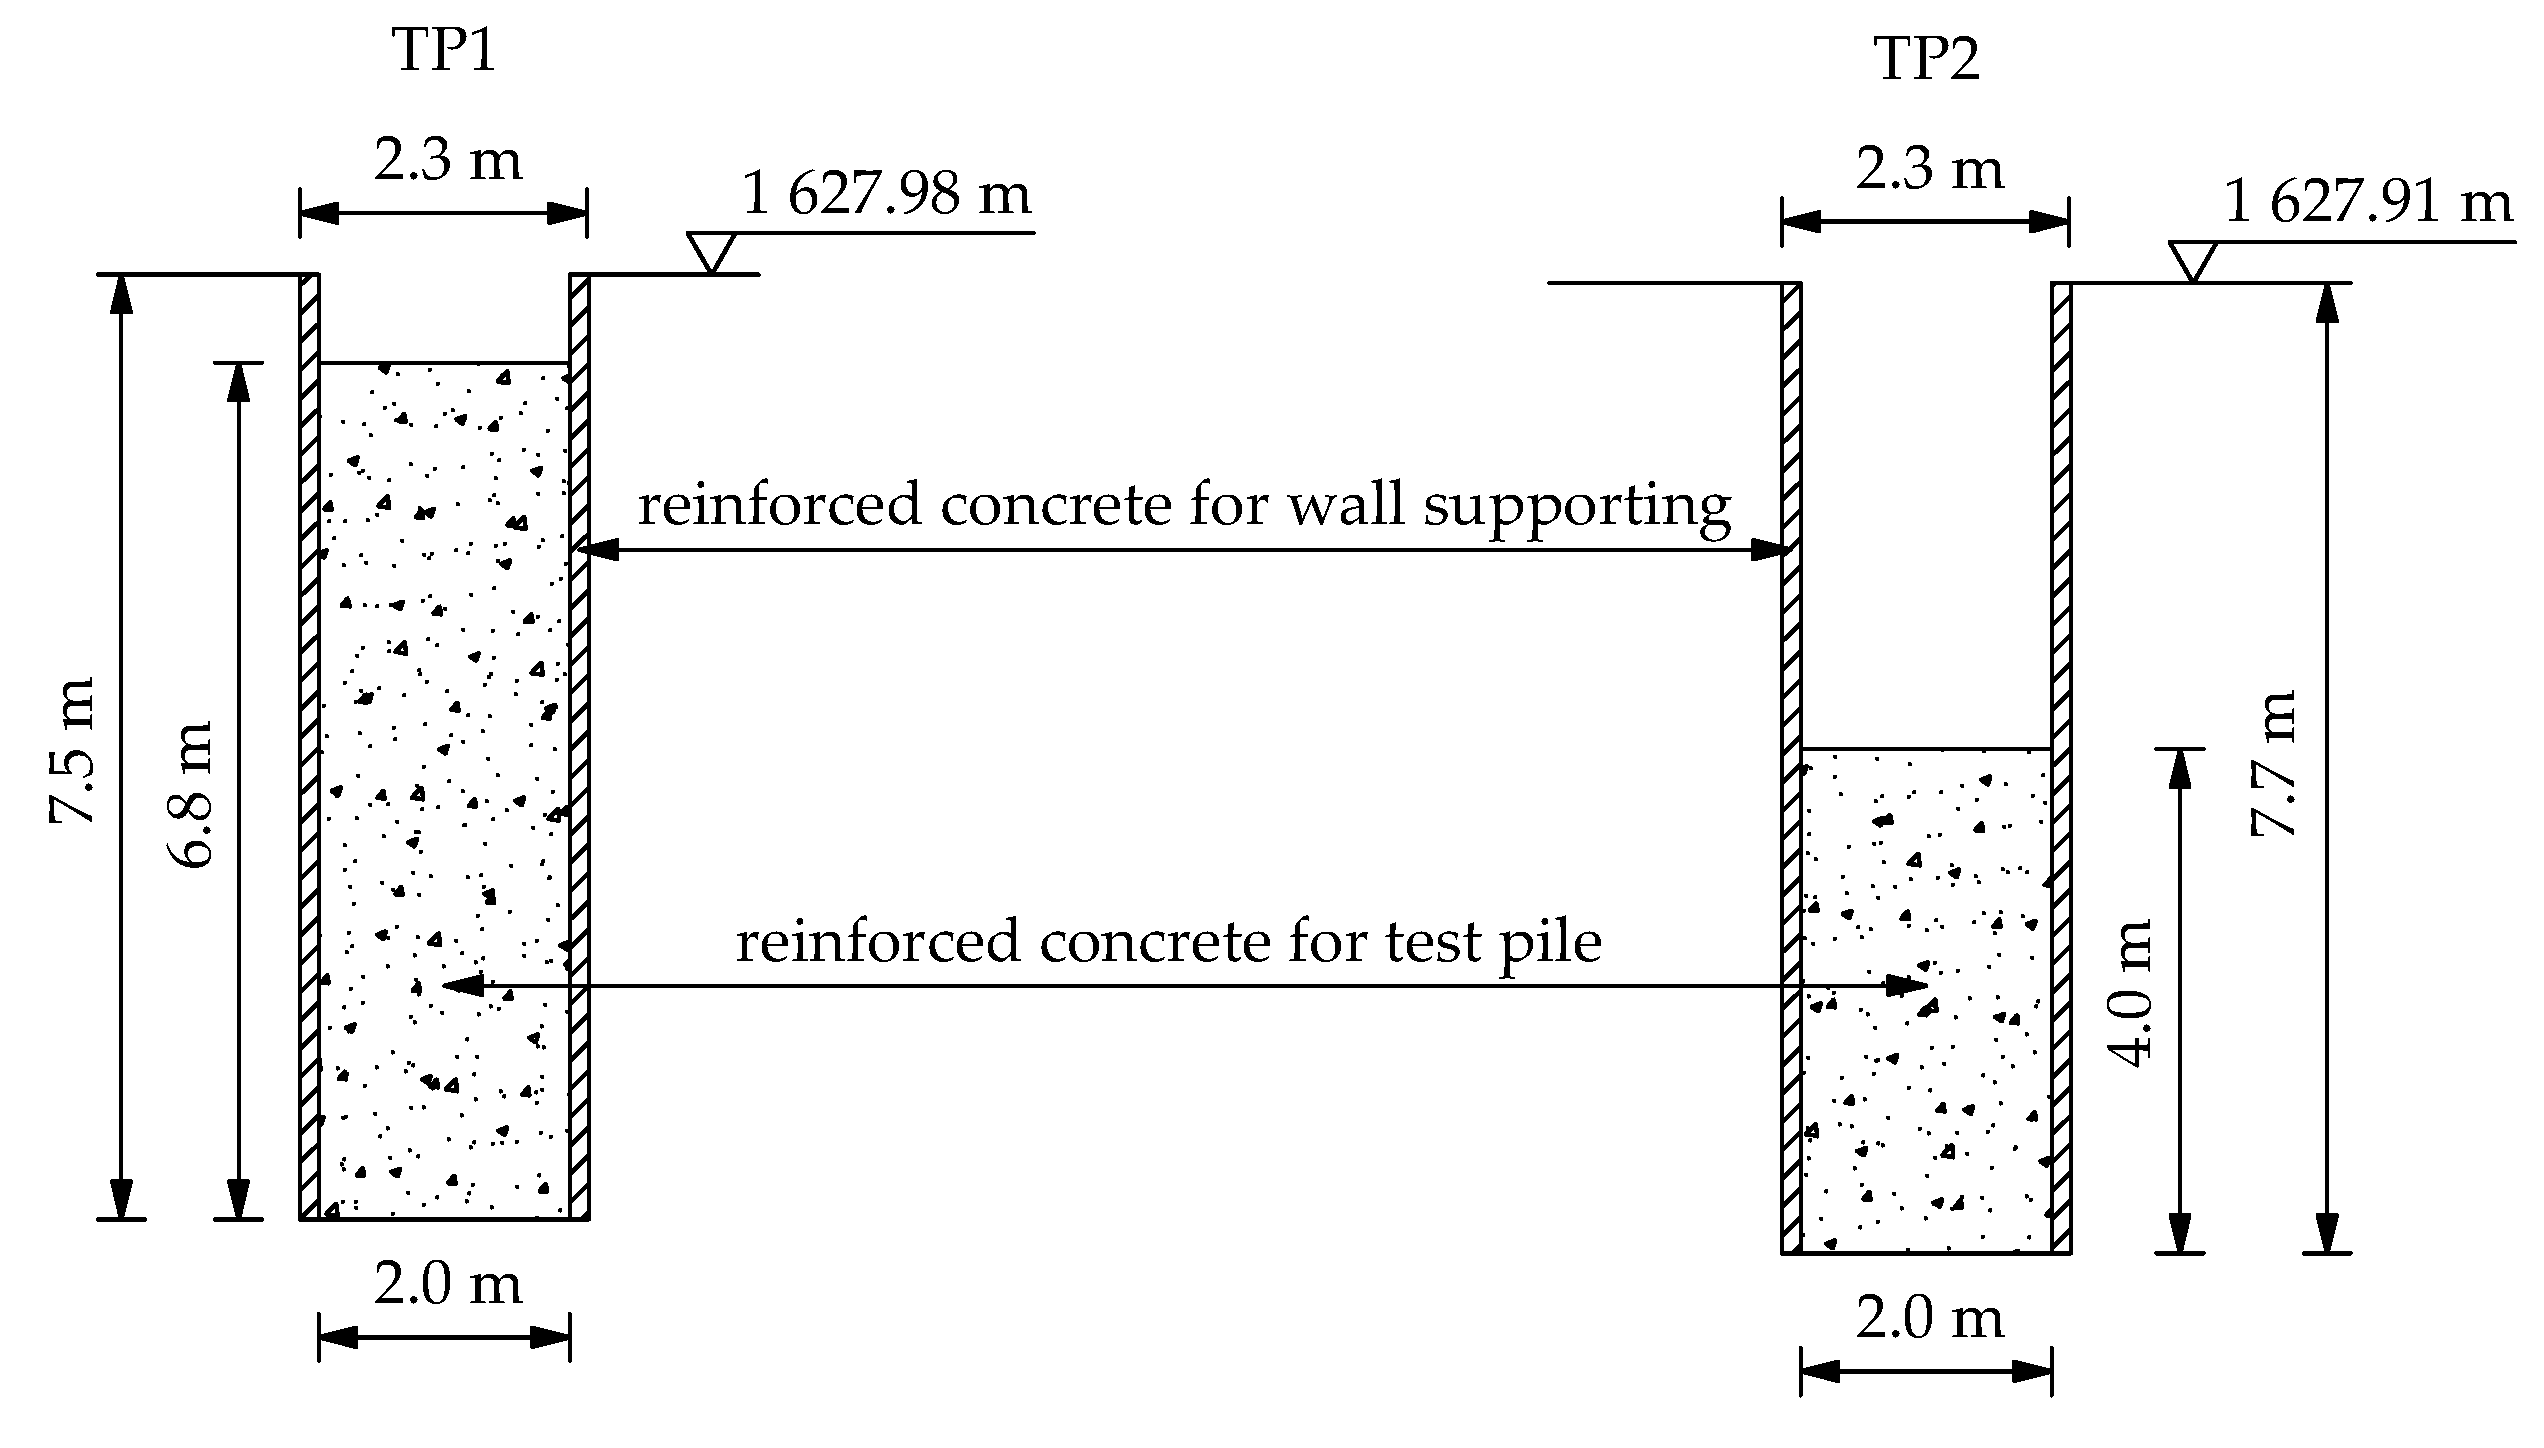
The test piles are manual digging piles. The geometric dimensions of the two test piles are shown in Figure 6. The design pile diameter is 2.0 m, and the thickness of the reinforced concrete for the wall supporting during the digging process is 0.15 m, so the outer diameter of the reinforced concrete supporting wall is 2.3 m. The concrete is not poured to the top of the hole, but at a certain depth below the top level, so the length of the pile is less than the depth of the hole. The TP1 test pile is 6.8 m long and the hole depth is 7.5 m; the TP2 test pile is 4.0 m long and the hole depth is 7.7 m.
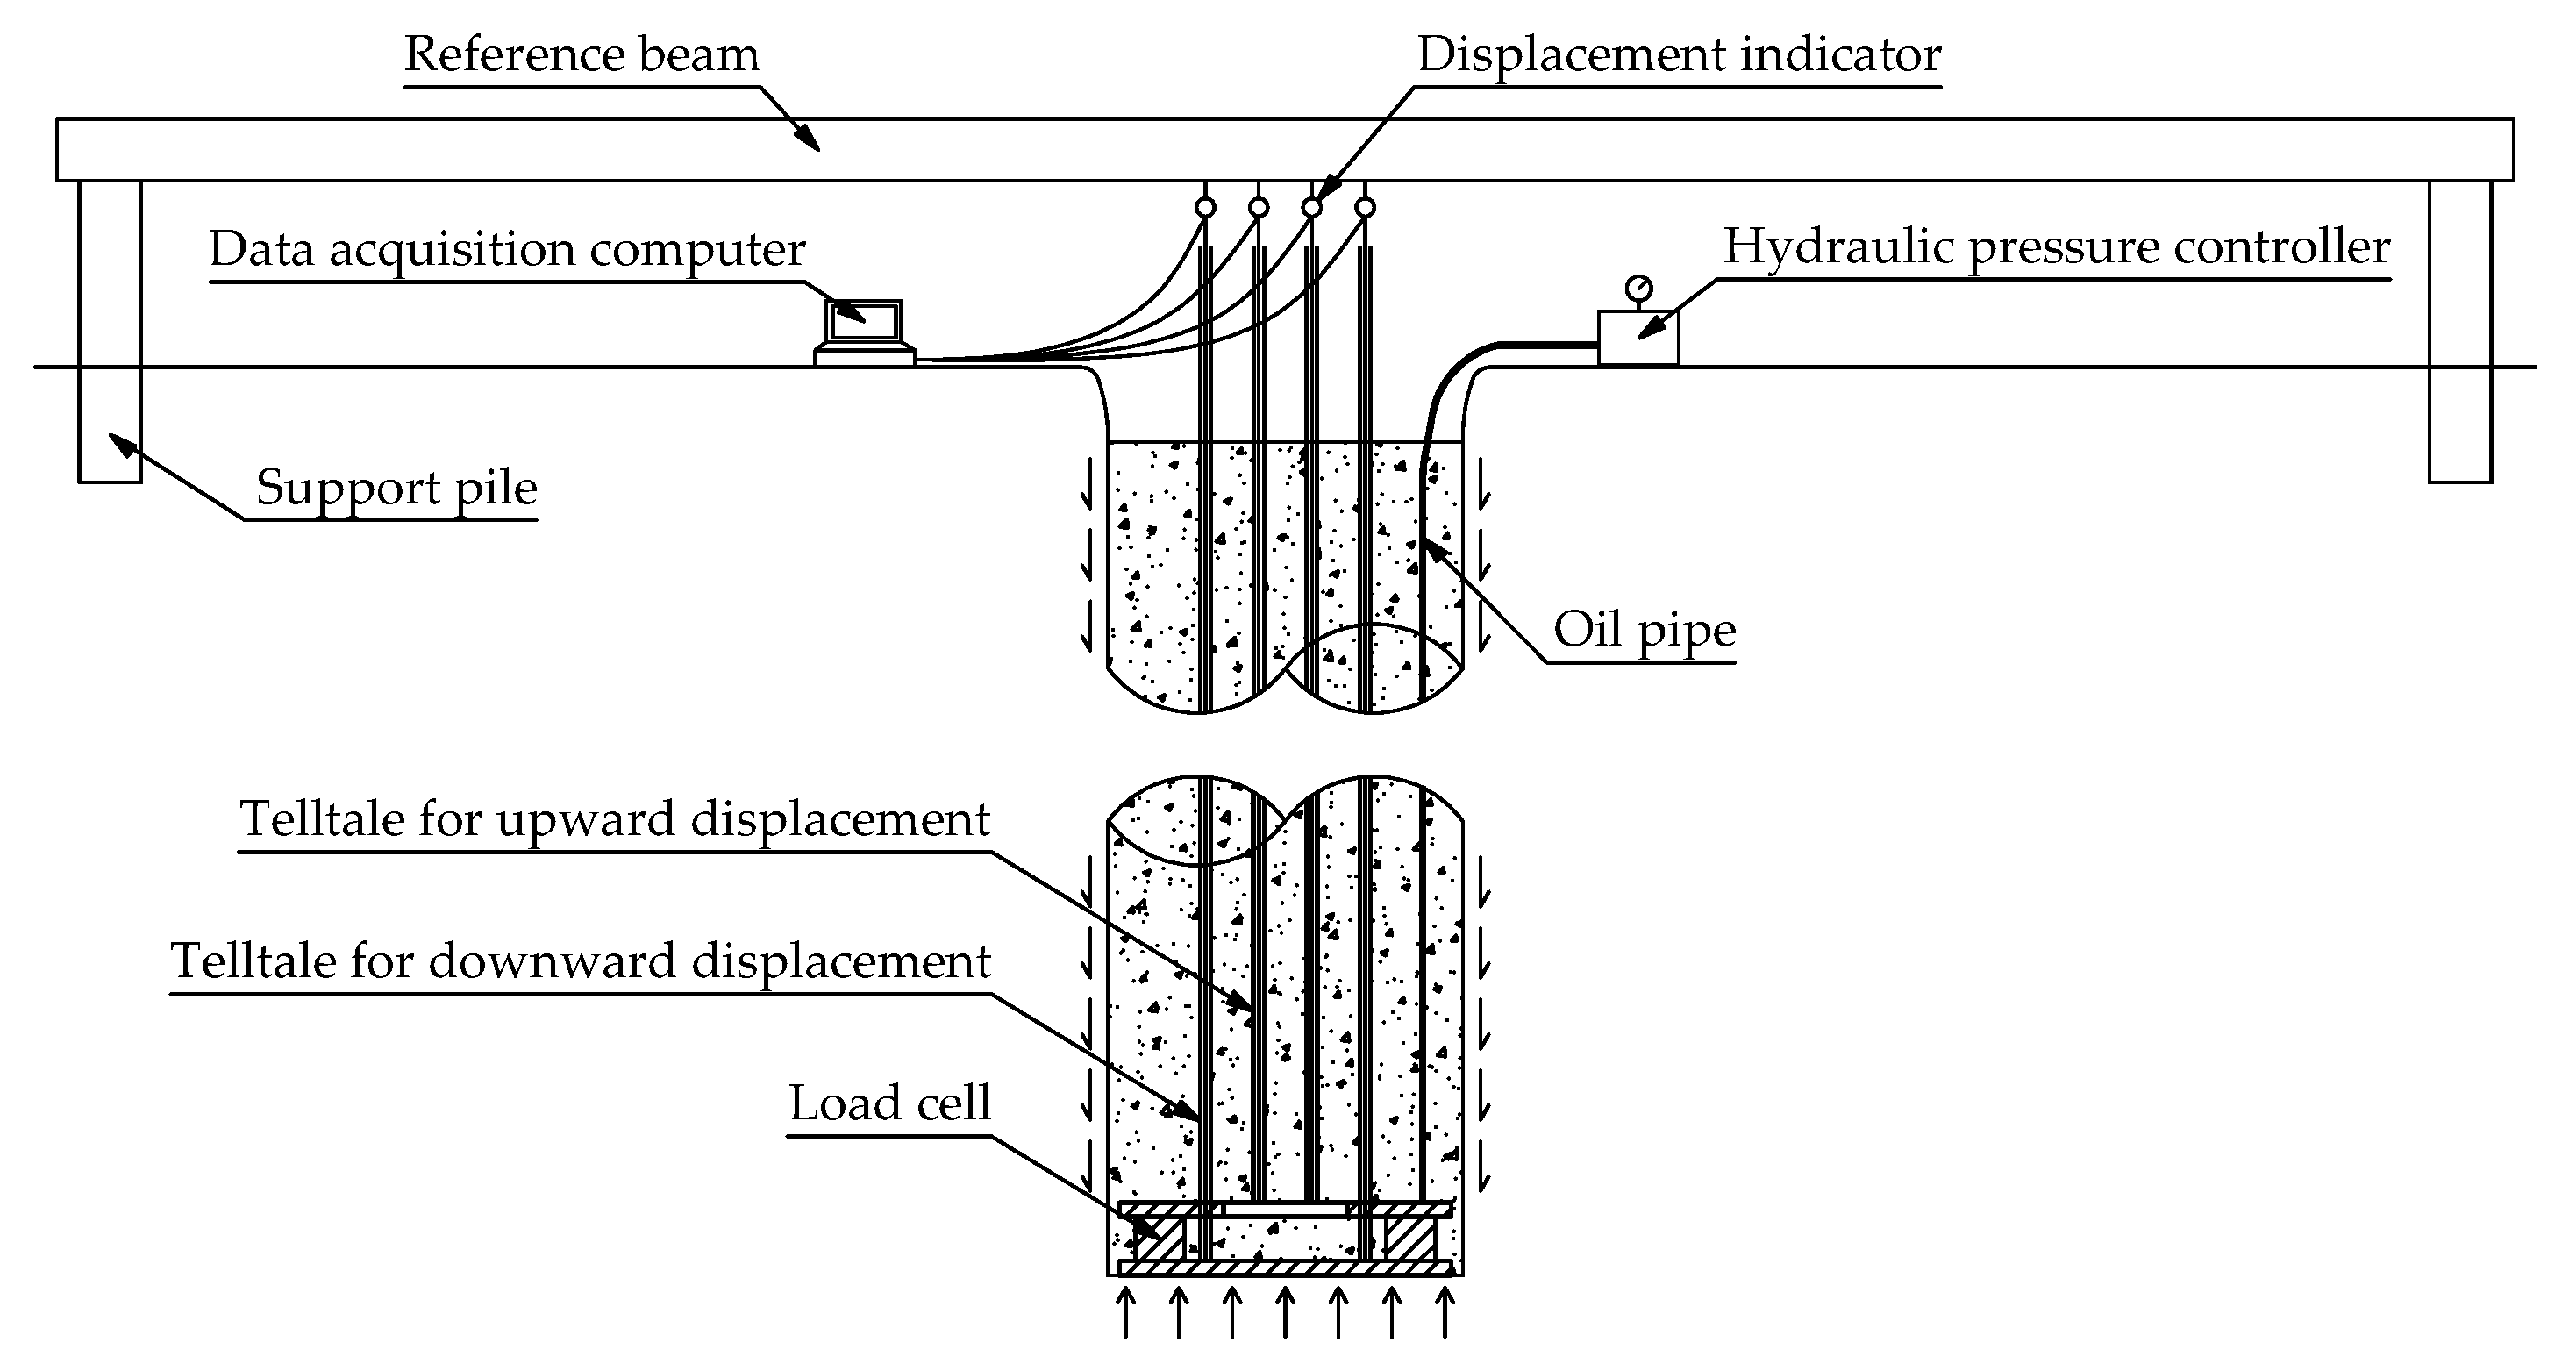
The bi-directional load test is used for the vertical compressive bearing capacity testing, as shown in Figure 7. The load cell is placed at the bottom of the pile. During the test, the load cell is loaded from the hydraulic pressure controller on the ground through the oil pipe. The bottom plate of the load cell is loaded downward to test the bearing capacity of the pile tip; the top plate of the load cell is loaded upward to test the bearing capacity of the pile side. The load applied is calculated by the pressure gauge at the hydraulic pressure controller. The downward displacement of the bottom plate and the upward displacement of the top plate are transmitted to the ground surface by the telltale and then measured by the displacement indicator [18,19,20,21,27].
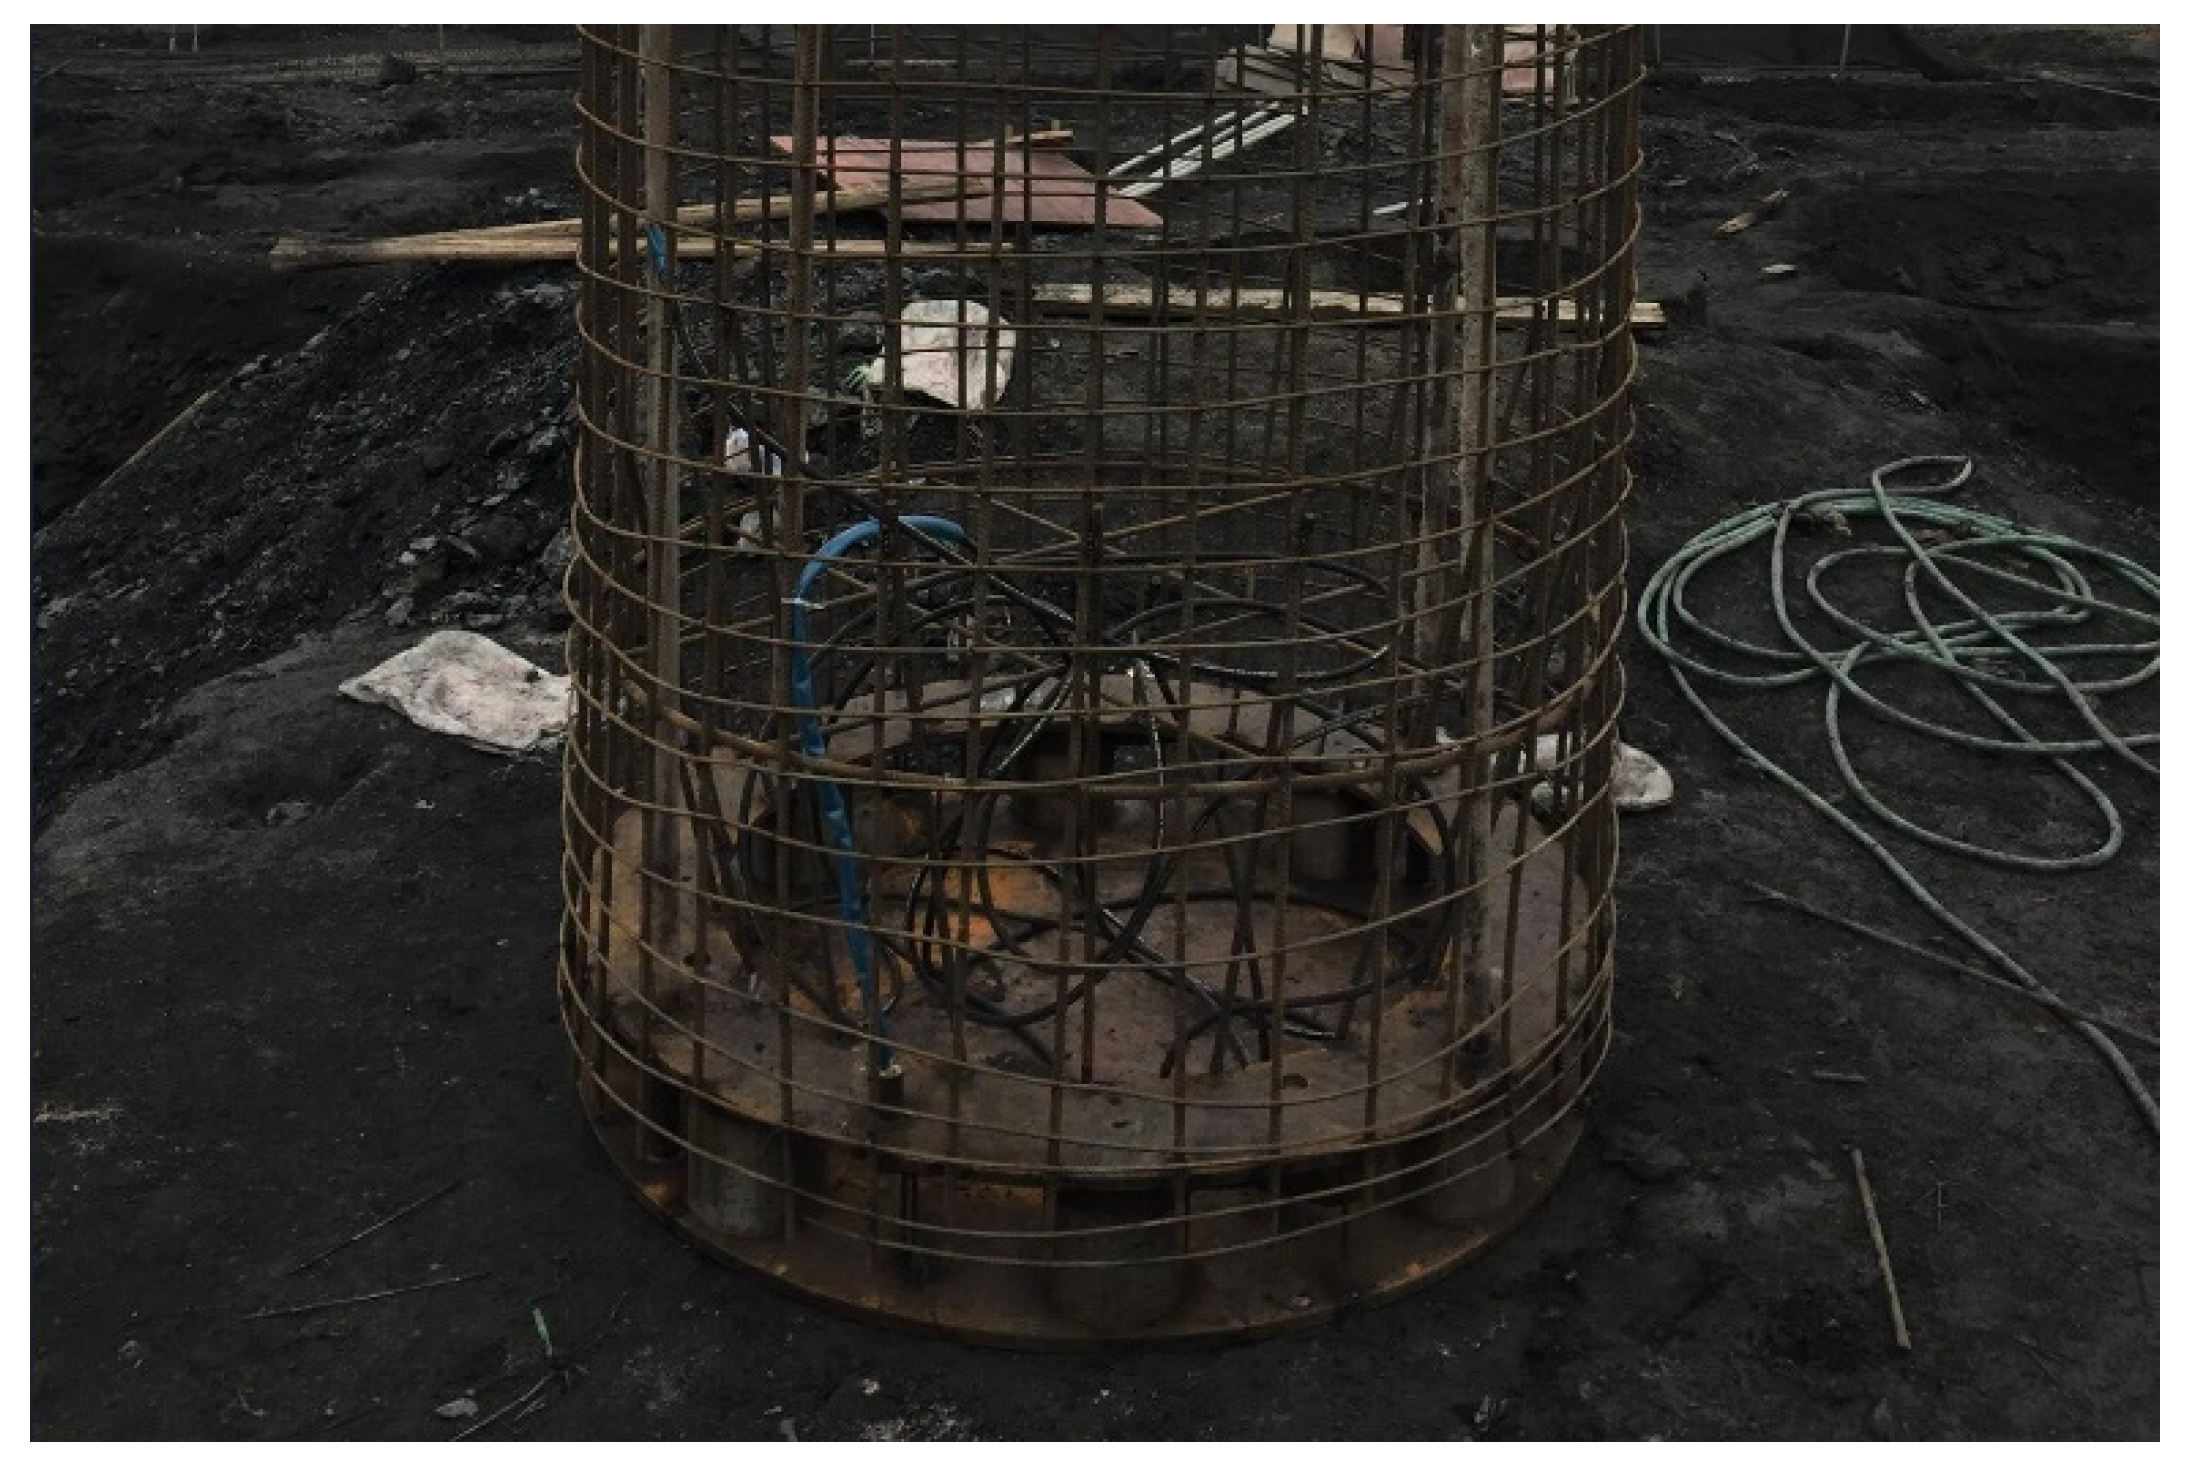
The bottom plate of the load cell is a circular steel plate with a diameter of 1800 mm and a thickness of 30 mm, as shown in Figure 8. When the pile hole is excavated to the design elevation and before the load cell lowers down, the cement mortar is use to level the bottom of the pile hole, and that ensures good contact between the bottom plate of the load cell and the coal rock.
The maintained load test method is adopted. At each level of loading, the displacement is measured at 5 min, 15 min, 30 min, 45 min, 60 min and then every 30 min thereafter. The displacement convergence criteria are as follows: The displacement increment per hour does not exceed 0.1 mm/h, and it occurs twice in a row (starting from 30 min, and for a consecutive 90 min). At a certain level of loading, if the displacement increment of the upper plate or the lower plate is greater than 5 times the displacement increment of the previous level of loading, and if the total displacement exceeds 40 mm, it can be considered that the ultimate bearing capacity has been reached, and the loading process shall be terminated. When unloading, the unloading amount of each level is twice the loading amount. The load of each level is maintained for 1 h, and the displacement is measured at 15 min, 30 min and 60 min, respectively. After unloading to zero, the displacement is measured for 3 h at 15 min, 30 min and every 30 min thereafter [27].
The loading conditions of the test piles TP1 and TP2 are shown in Table 2. The loading amount of the first level is 1600 kN, and the load increment of each level is 800 kN. Both of the two test piles failed when they were loaded to the 11 level, and the maximum loading value was 9600 kN for both.
3. Results
3.1. Plate Load Test
3.1.1. Pressure–Settlement Responses
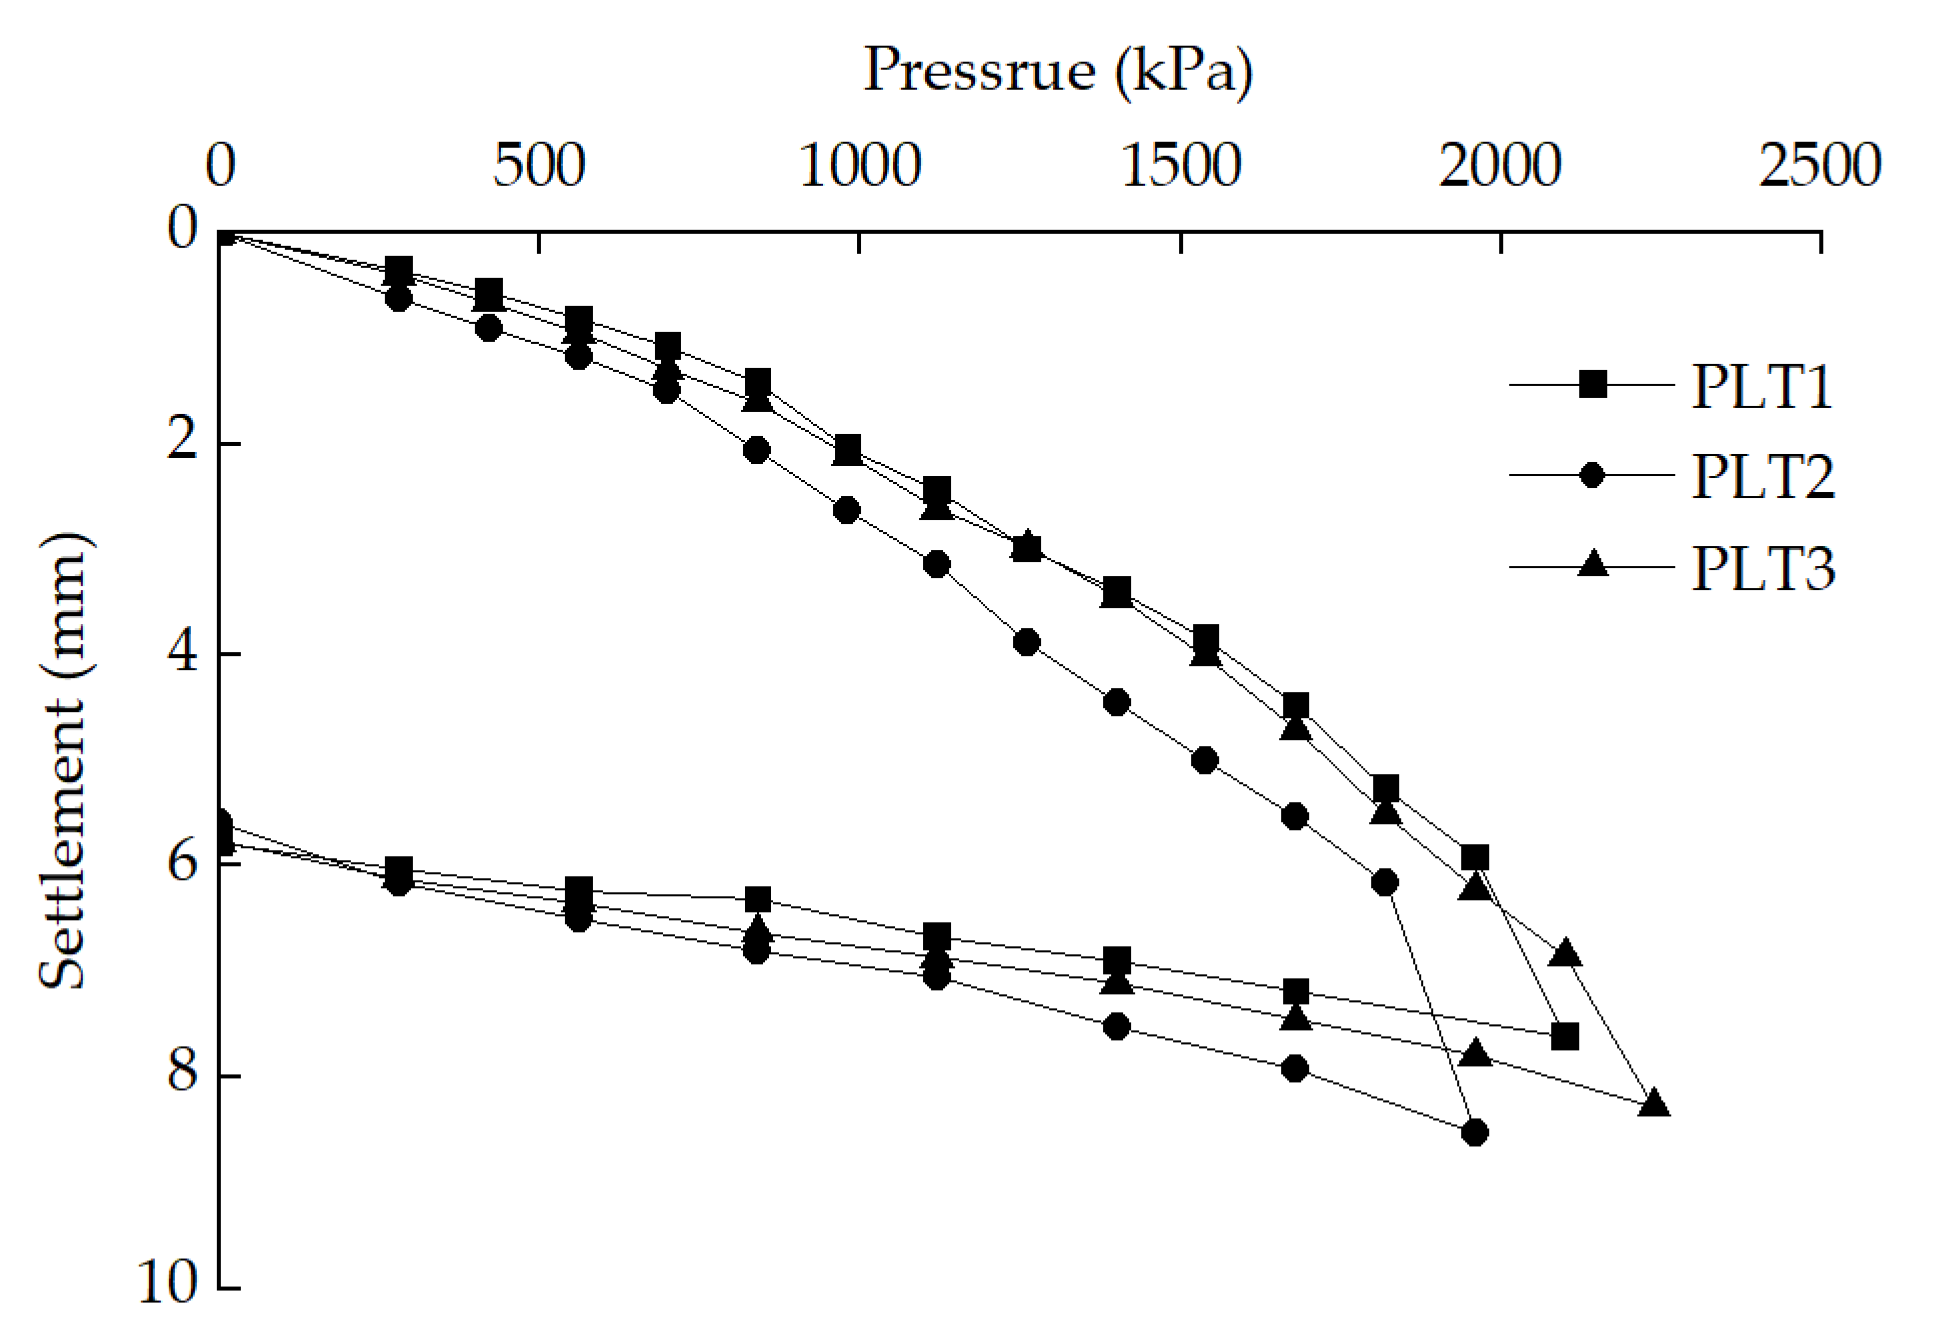
Figure 9 shows the pressure–settlement curves of PLT1, PLT2 and PLT3. It can be seen that the pressure–settlement curves are all steep-drop-type, and there is a turning point corresponding to the ultimate bearing capacity.
The pressure and settlement of coal rock show a nonlinear relationship. When the pressure is ≤700 kPa, it is approximately linear. With the increase of the pressure, the nonlinear characteristics of the pressure and the settlement are obvious. When the load reaches 1820 kPa~2100 kPa, the pressure and settlement curve showed a sharp drop. The results of the unloading test show that the average rebound rate of the three tests is 29.7%, indicating that the coal rock has changed from the elastic–plastic working state to the plastic working state.
3.1.2. Bearing Capacity
The maximum loading values of PLT1, PLT2 and PLT3 are 2100 kPa, 1960 kPa and 2240 kPa, respectively. On the test curve, the end point of the straight-line segment corresponds to the proportional limit load. For the three plate load tests, the proportional limit loads are all 700 kPa. The ultimate bearing capacity of PLT1, PLT2 and PLT3 are 1960 kPa, 1820 kPa and 2100 kPa, respectively. The ultimate bearing capacity takes the minimum value of the three tests, and the safety factor is three, so the design value of the bearing capacity of coal rock is 1820/3 = 607 kPa, which is smaller than the proportional limit load [26].
3.1.3. Deformation Modulus
The plate load test on coal rock is equivalent to the case of partial loading on the surface of a semi-infinite elastic body. According to the Boussinesq solution, the deformation modulus of the coal rock can be calculated [26]:
where E0 is the deformation modulus (MPa); I0 is the shape coefficient obtained according to the vertical displacement solution of Boussinesq, for the circular bearing plate it takes 0.785; ν is the Poisson’s ratio, it takes 0.27; p is the pressure of the linear segment of the p-s curve (kPa); d is the diameter of the bearing plate (m); s is the settlement corresponding to p (mm).
Equation (1) can be rewritten as:
It can be seen from Formula (2) that if p-s is proportional, E0 can be calculated from the slope of the p-s curve.
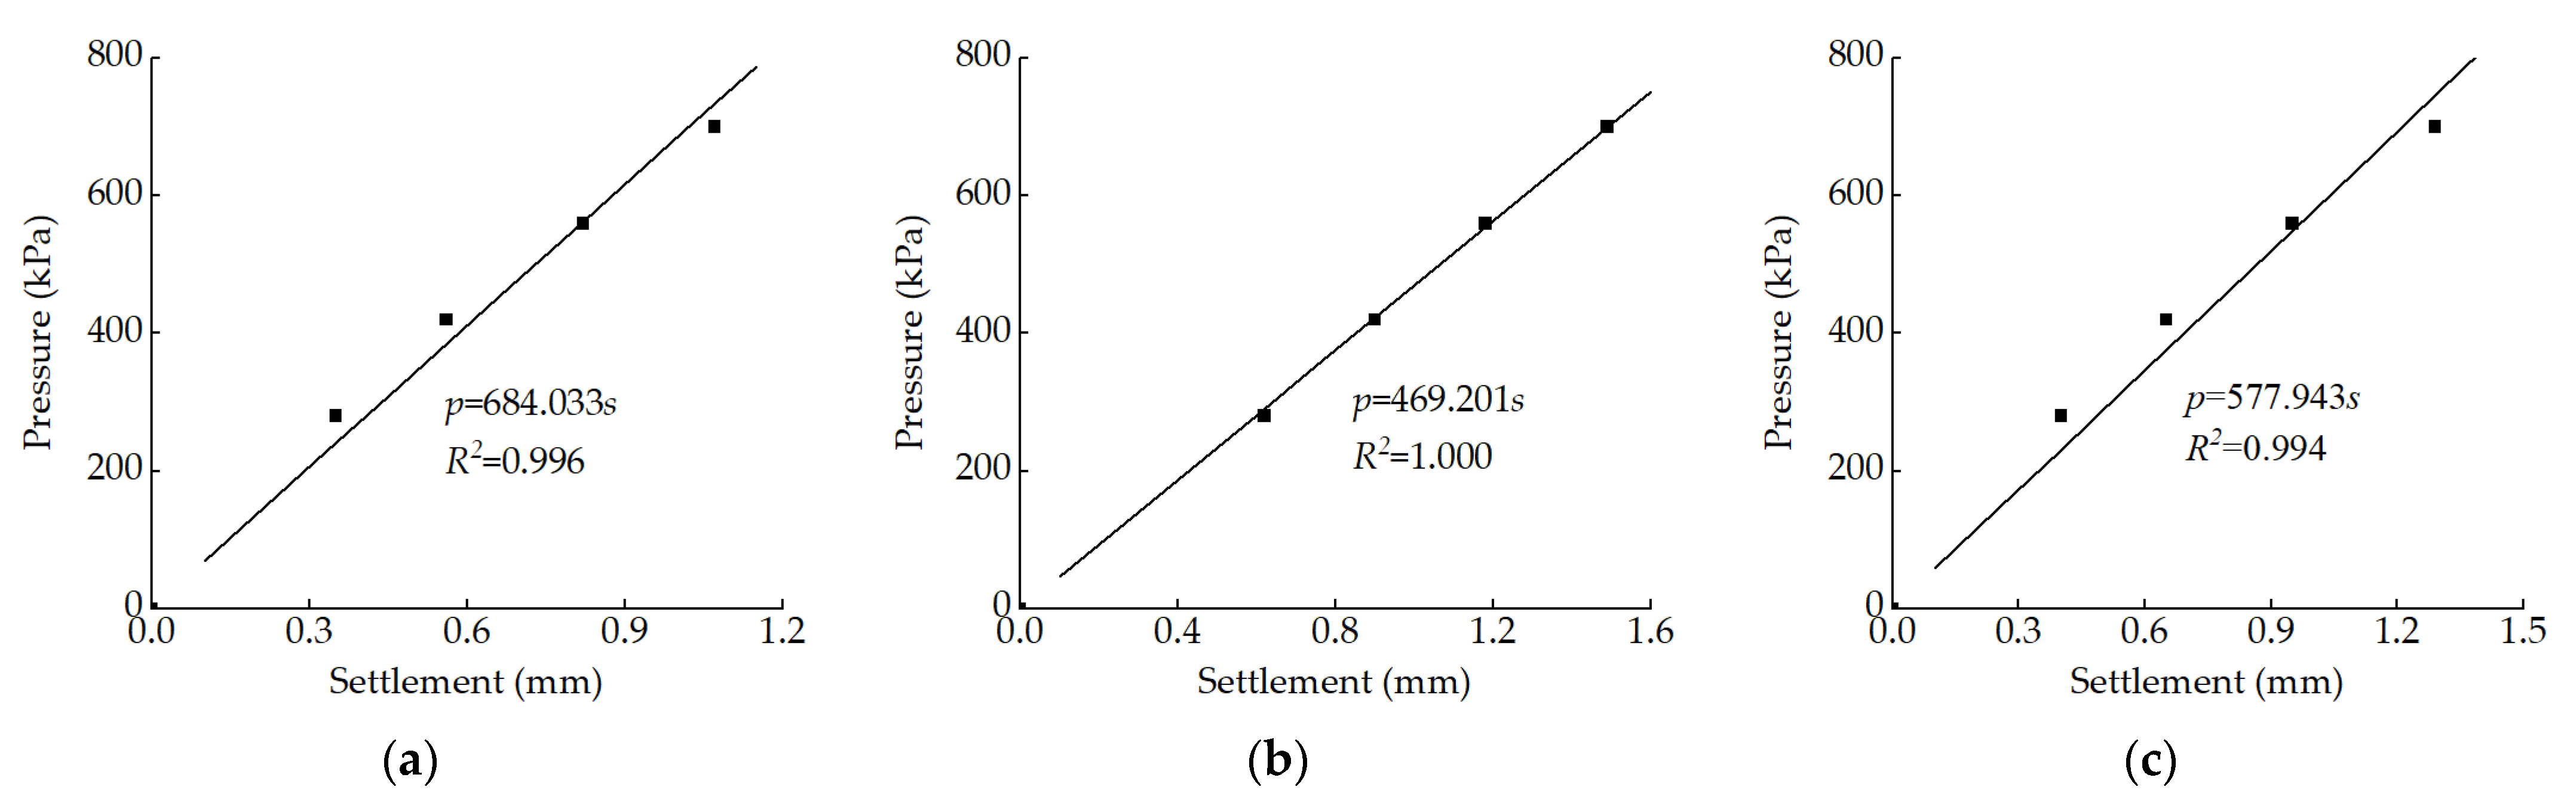
According to the results of the plate load test, the pressure–settlement curve is close to a straight line in the range of the proportional limit load, i.e., 700 kPa. The curve fitting results are shown in Figure 10. It reveals that there is a good linear correlation between the pressure p and the settlement s.
The E0 values of PLT1, PLT2 and PLT3 calculated according to Formula (2) and Figure 10 are 149.3 MPa, 102.4 MPa and 126.2 MPa. The average value is 126.0 MPa, and it is taken as the deformation modulus of the coal rock under the working load.
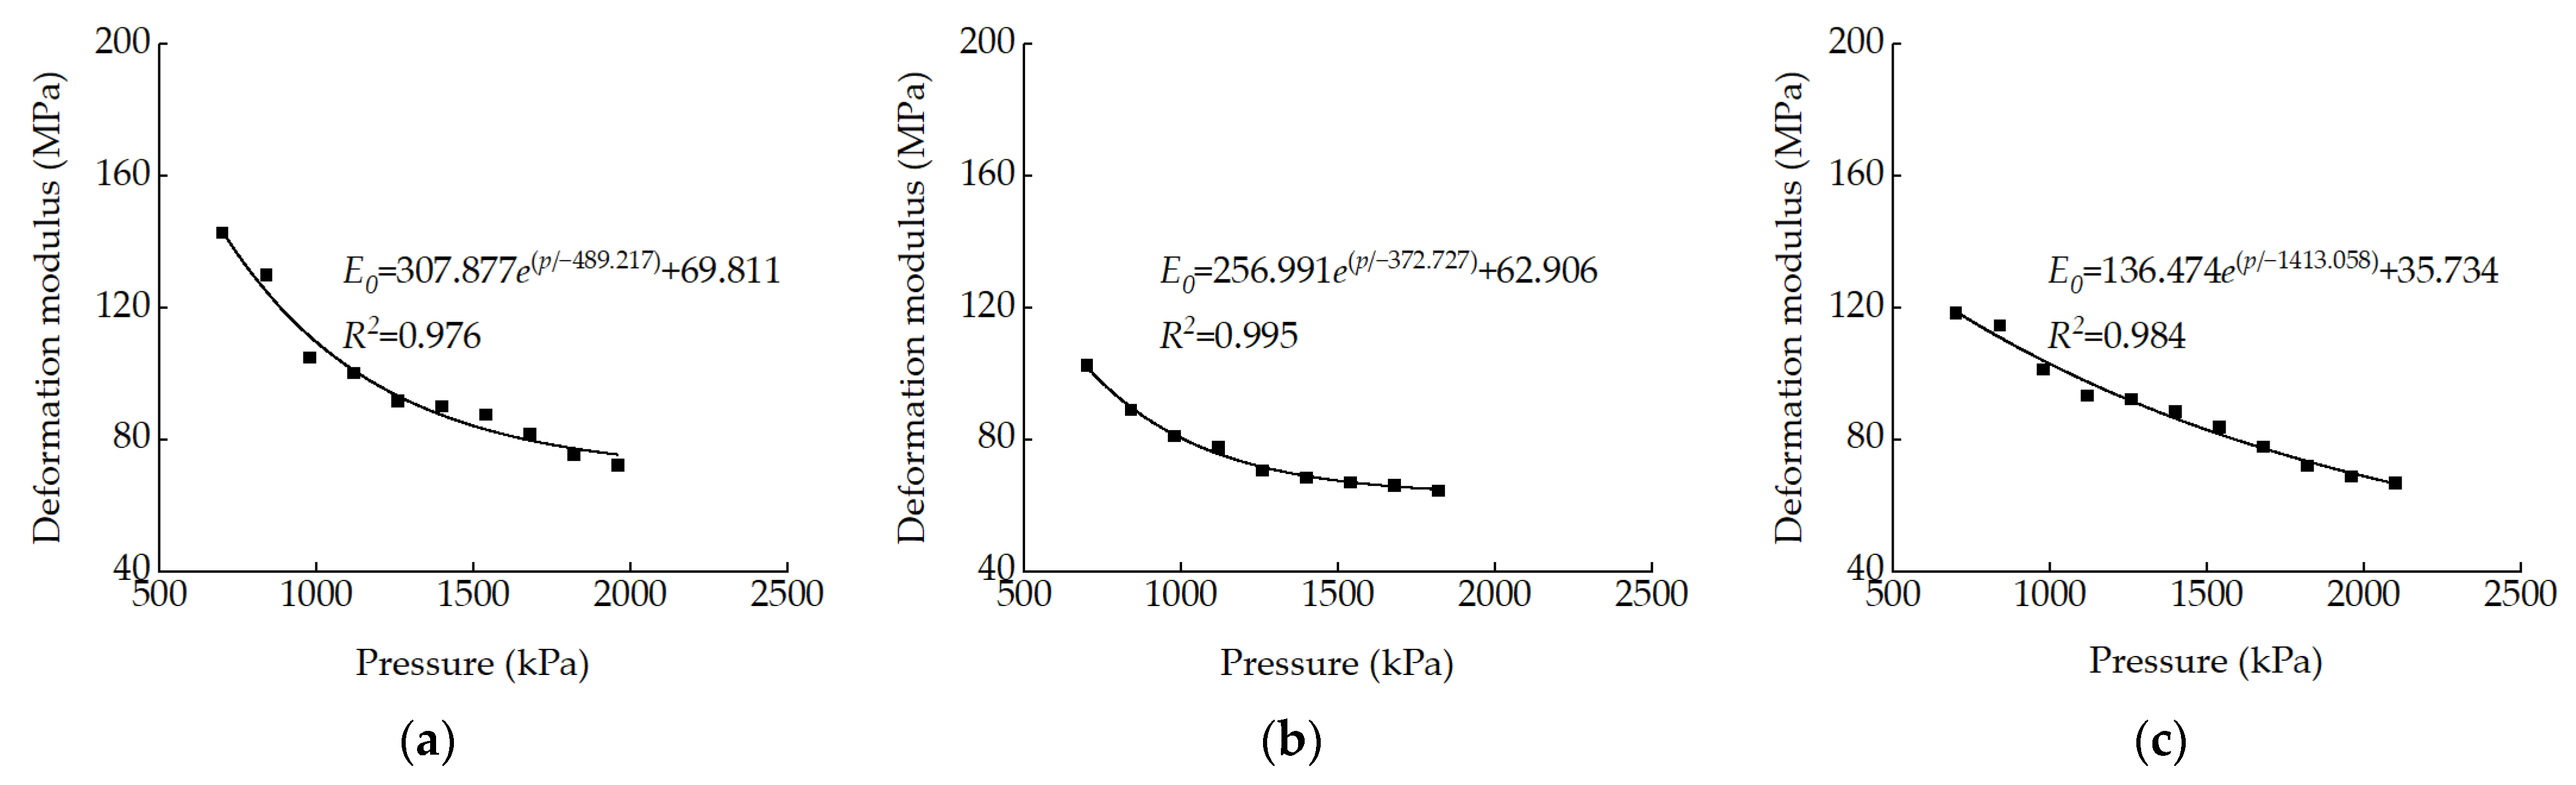
The deformation modulus generally decreases with the increase of pressure. For the loading data of the three tests, the E0 value corresponding to the p value can be calculated according to Formula (1). The results beyond the proportional limit load of 700 kPa are shown in Figure 11. It shows that the deformation modulus decreases with the increase in the pressure.
For the test points shown in Figure 11, the exponential function can be used for data fitting:
where A1, t1 and y0 are coefficients.
Figure 11 shows that there is a good correlation between the fitting curve and the test points, i.e., the deformation modulus and the pressure have an exponential function relationship.
3.2. Bi-Directional Load Test
3.2.1. Load–Displacement Responses
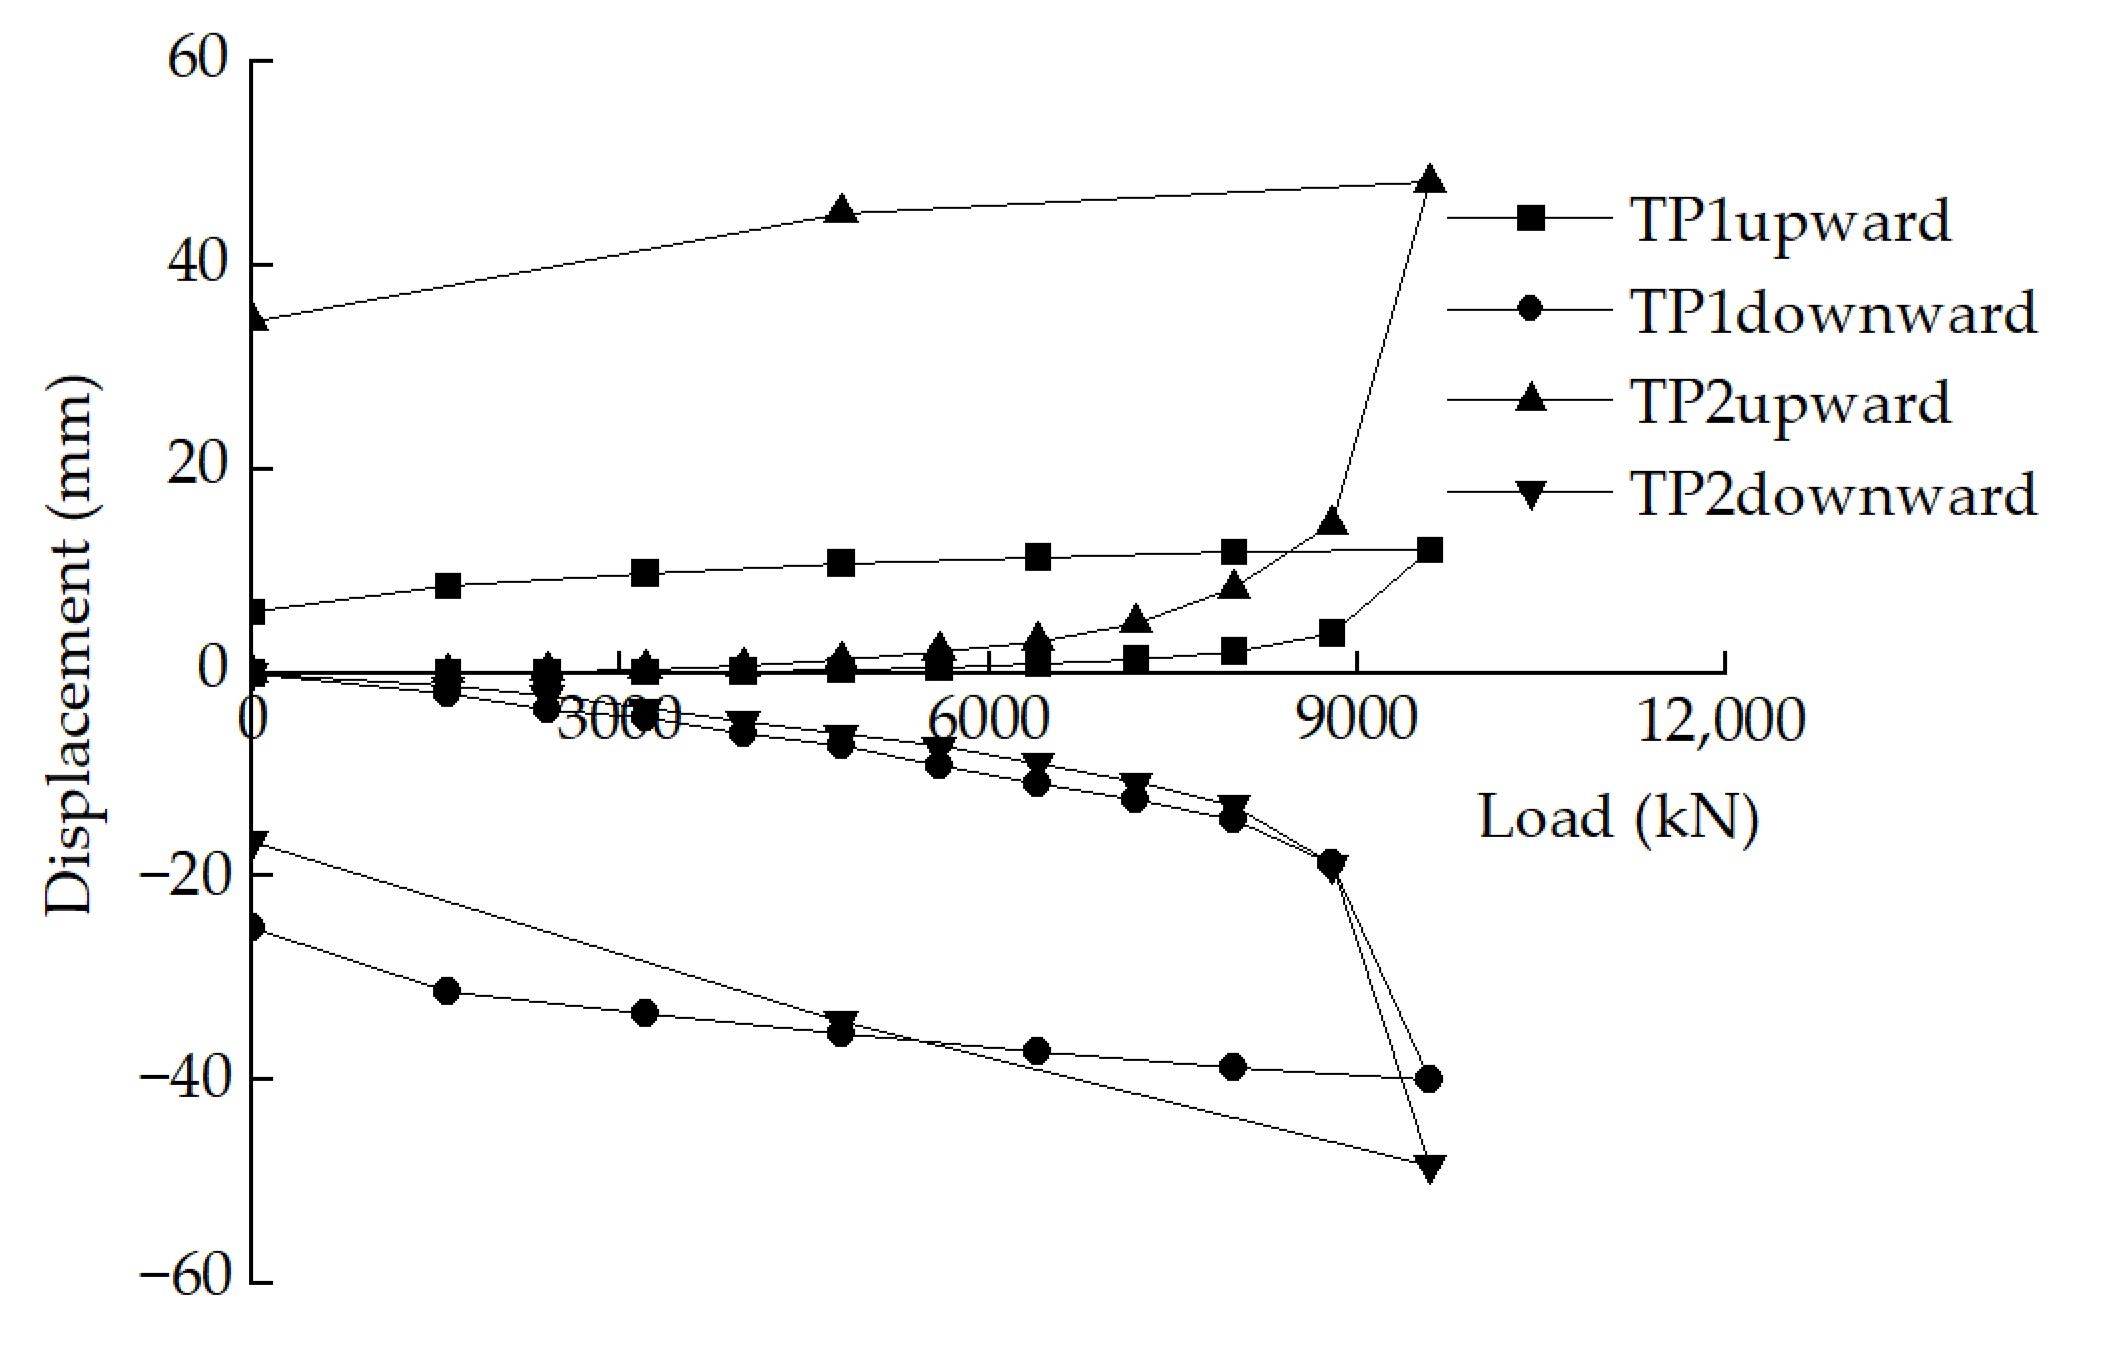
Figure 12 shows the load–displacement curves of TP1 and TP2. For the upper pile, there is a nonlinear relationship between load and displacement. For the lower pile, there is approximately a linear relationship between load and displacement. When TP1 is loaded to 9600 kN, the upper pile’s load maintained stable, but the displacement of the lower pile continued to increase over 40 mm and then failure occurred. The ultimate bearing capacity of the upper pile and the lower pile is 9600 kN and 8800 kN, respectively. When TP2 is loaded to 9600 kN, both of the upper pile and the lower pile were difficult to stabilize, the displacement continued to increase over 40 mm, and then failure occurred. The ultimate bearing capacity of the upper pile and the lower pile is 8800 and 8800 kN, respectively. The results of the unloading test show that the rebound rate of TP1 is 50.8% for the upper pile and 37.3% for the lower pile, and that of TP2 is 28.3% for the upper pile and 65.8% for the lower pile.
3.2.2. Mobilized Tip Resistance
The load cell of the bi-directional load test is placed at the tip of the pile and is in direct contact with the coal rock. It is equivalent to the deep plate load test. Therefore, according to the test curve of the lower pile, the bearing capacity of coal rock can be obtained:
where qi is the average tip resistance per unit area (kPa); Qdi is the downward loading value (kN); and dl is the diameter of the bottom plate of the load cell (m).
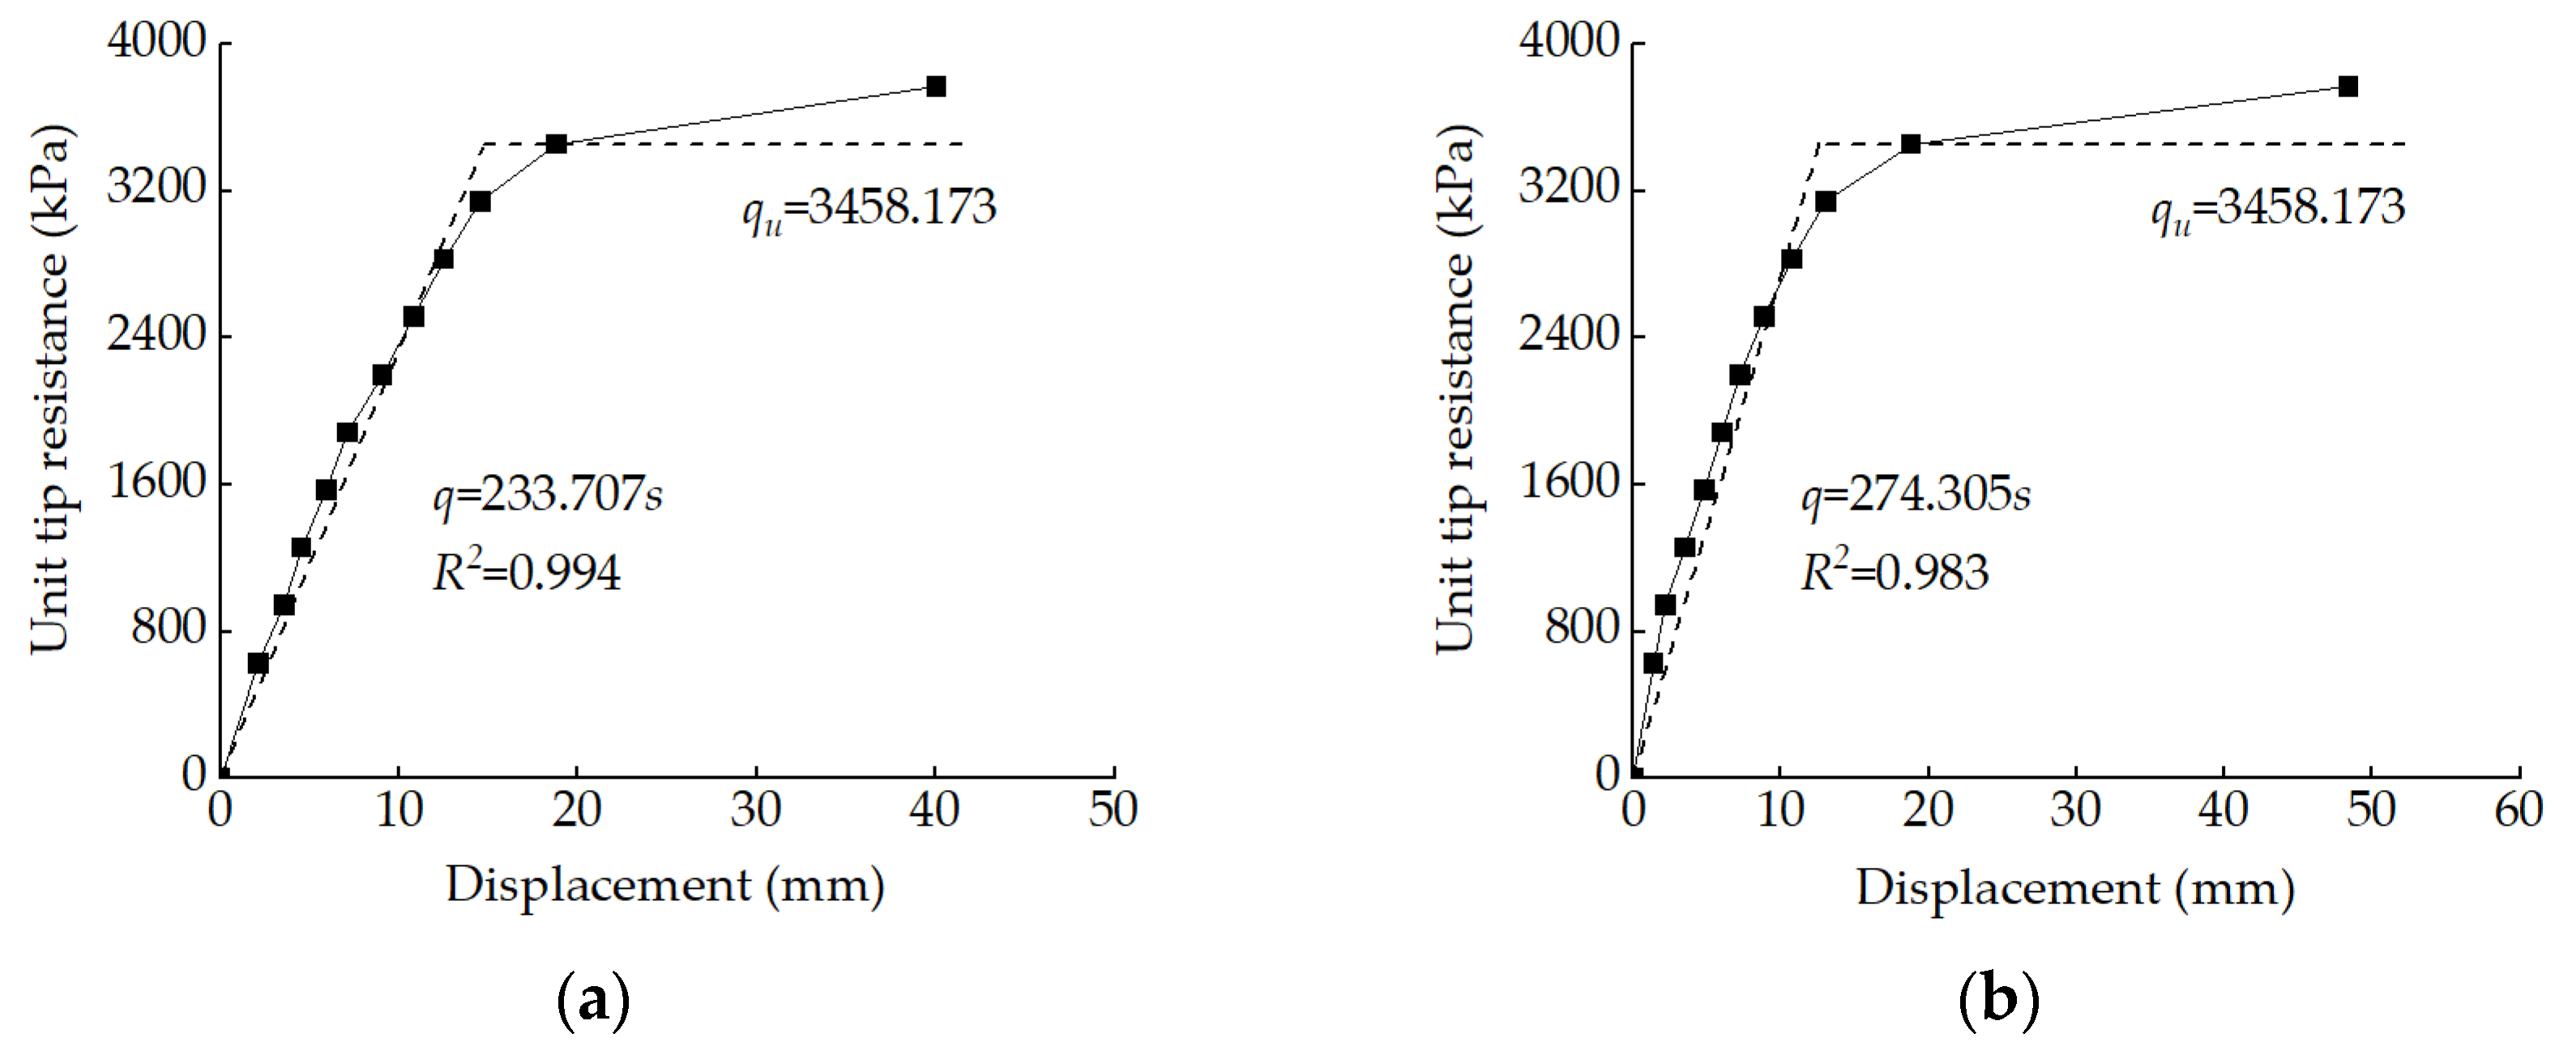
Since both of the pile tip elevations are about the same, the unit tip resistance–displacement curves of TP1 and TP2 have good consistency, as shown in Figure 13. It can be seen from Figure 13 that the curves are all steep-drop-types; the test points before failure are close to a straight line. The displacements corresponding to the ultimate bearing capacity are 18.79 mm and 18.82 mm for TP1 and TP2, and they are approximately 1% of the diameter of the bottom plate of the load cell, which is 18 mm.
From Figure 13, it can be seen that the unit tip resistance–displacement curve of coal rock is close to the ideal elastic–plastic curve:
where k is the coefficient (kPa/mm); s is the pile tip displacement (mm); qu is the limit unit tip resistance (kPa).
In Figure 13, linear fitting is performed on the test points before failure, and the obtained curve has a good correlation with the test points. The slopes k of the load transfer functions of TP1 and TP2 are 233.7 kPa/mm and 274.3 kPa/mm, respectively; the limit unit tip resistance qu of TP1 and TP2 is 3458 kPa for both.
When designing pile foundation, the safety factor of the bearing capacity of the pile tip usually takes a value of two, and the design value of the unit tip resistance is 3458/2 = 1729 kPa.
3.2.3. Deformation Modulus
The tip resistance test of TP1 and TP2 is equivalent to the situation of local loading in the elastic semi-infinite space. Based on the Mindlin solutions for stress and displacement, the deformation modulus of coal rock can be calculated [28]:
where w is the comprehensive coefficient obtained from Mindlin’s vertical displacement solution; m is the coefficient; h is the depth of the loading area; r is the radius of the loading area.
Equation (6) can be rewritten as:
It can be seen from Formula (9) that if p-s is proportional, E0 can be calculated from the slope of the p-s curve.
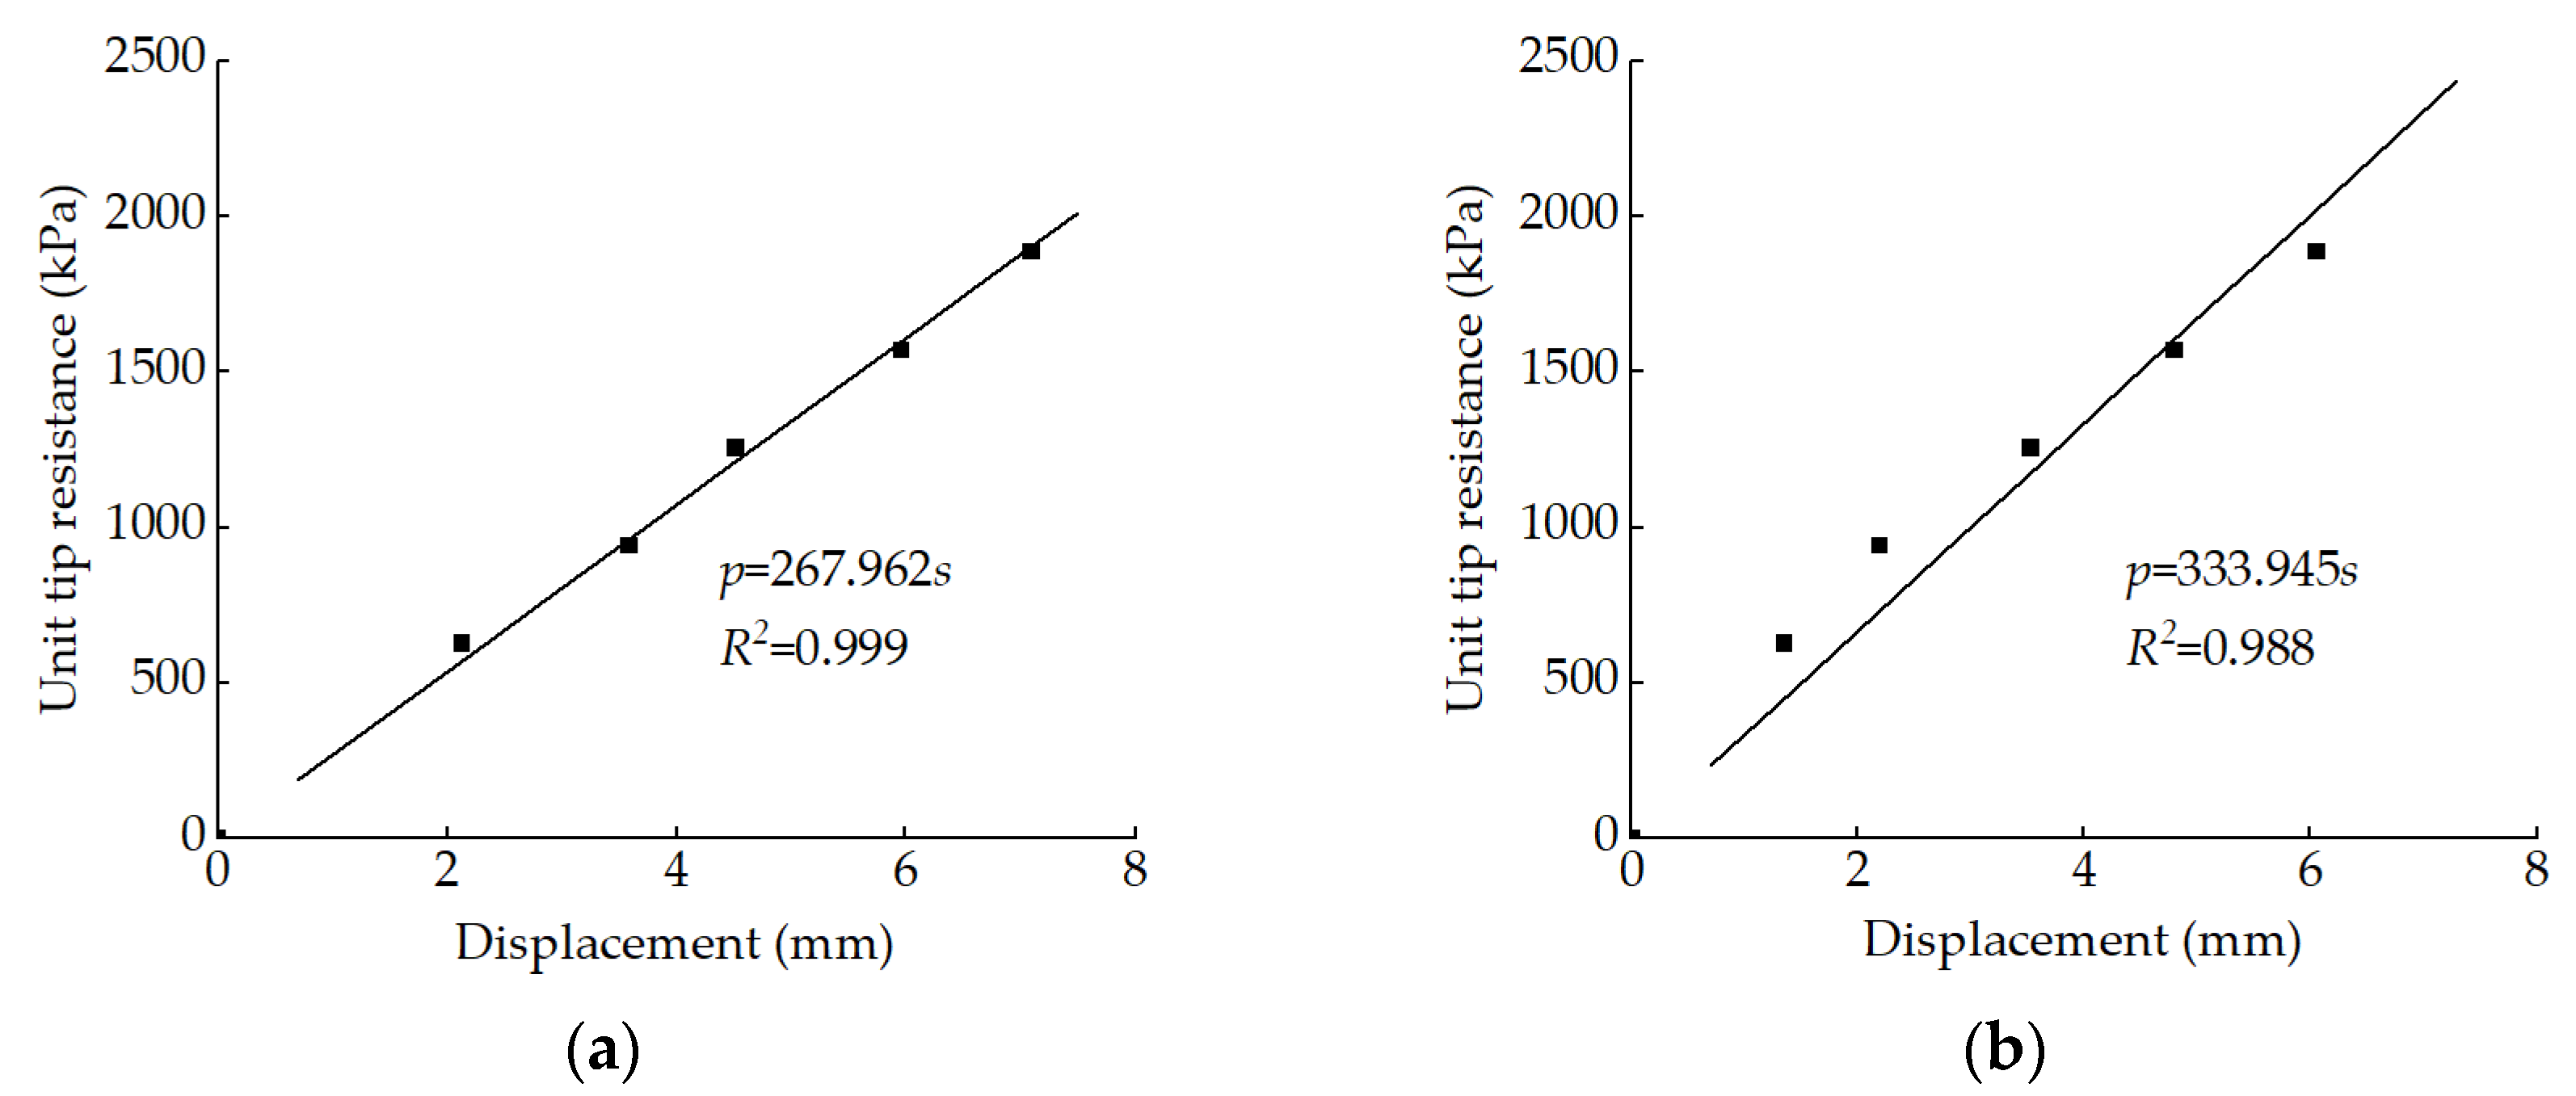
The design value of the unit tip resistance is 1729 kPa. Within this stress range, the unit tip resistance–displacement curve is close to a straight line. The test points of TP1 and TP2 are uniformly taken as the straight-line segment within the maximum pressure of 1 886 kPa. The curve fitting results are shown in Figure 14. It reveals that there is a good linear correlation between the unit tip resistance and the displacement.
The E0 values of TP1 and TP2 calculated according to Formula (9) and Figure 14 are 183.9 MPa and 228.8 MPa, respectively. The average value is 206.3 MPa, and it is taken as the deformation modulus of the coal rock under the working load.
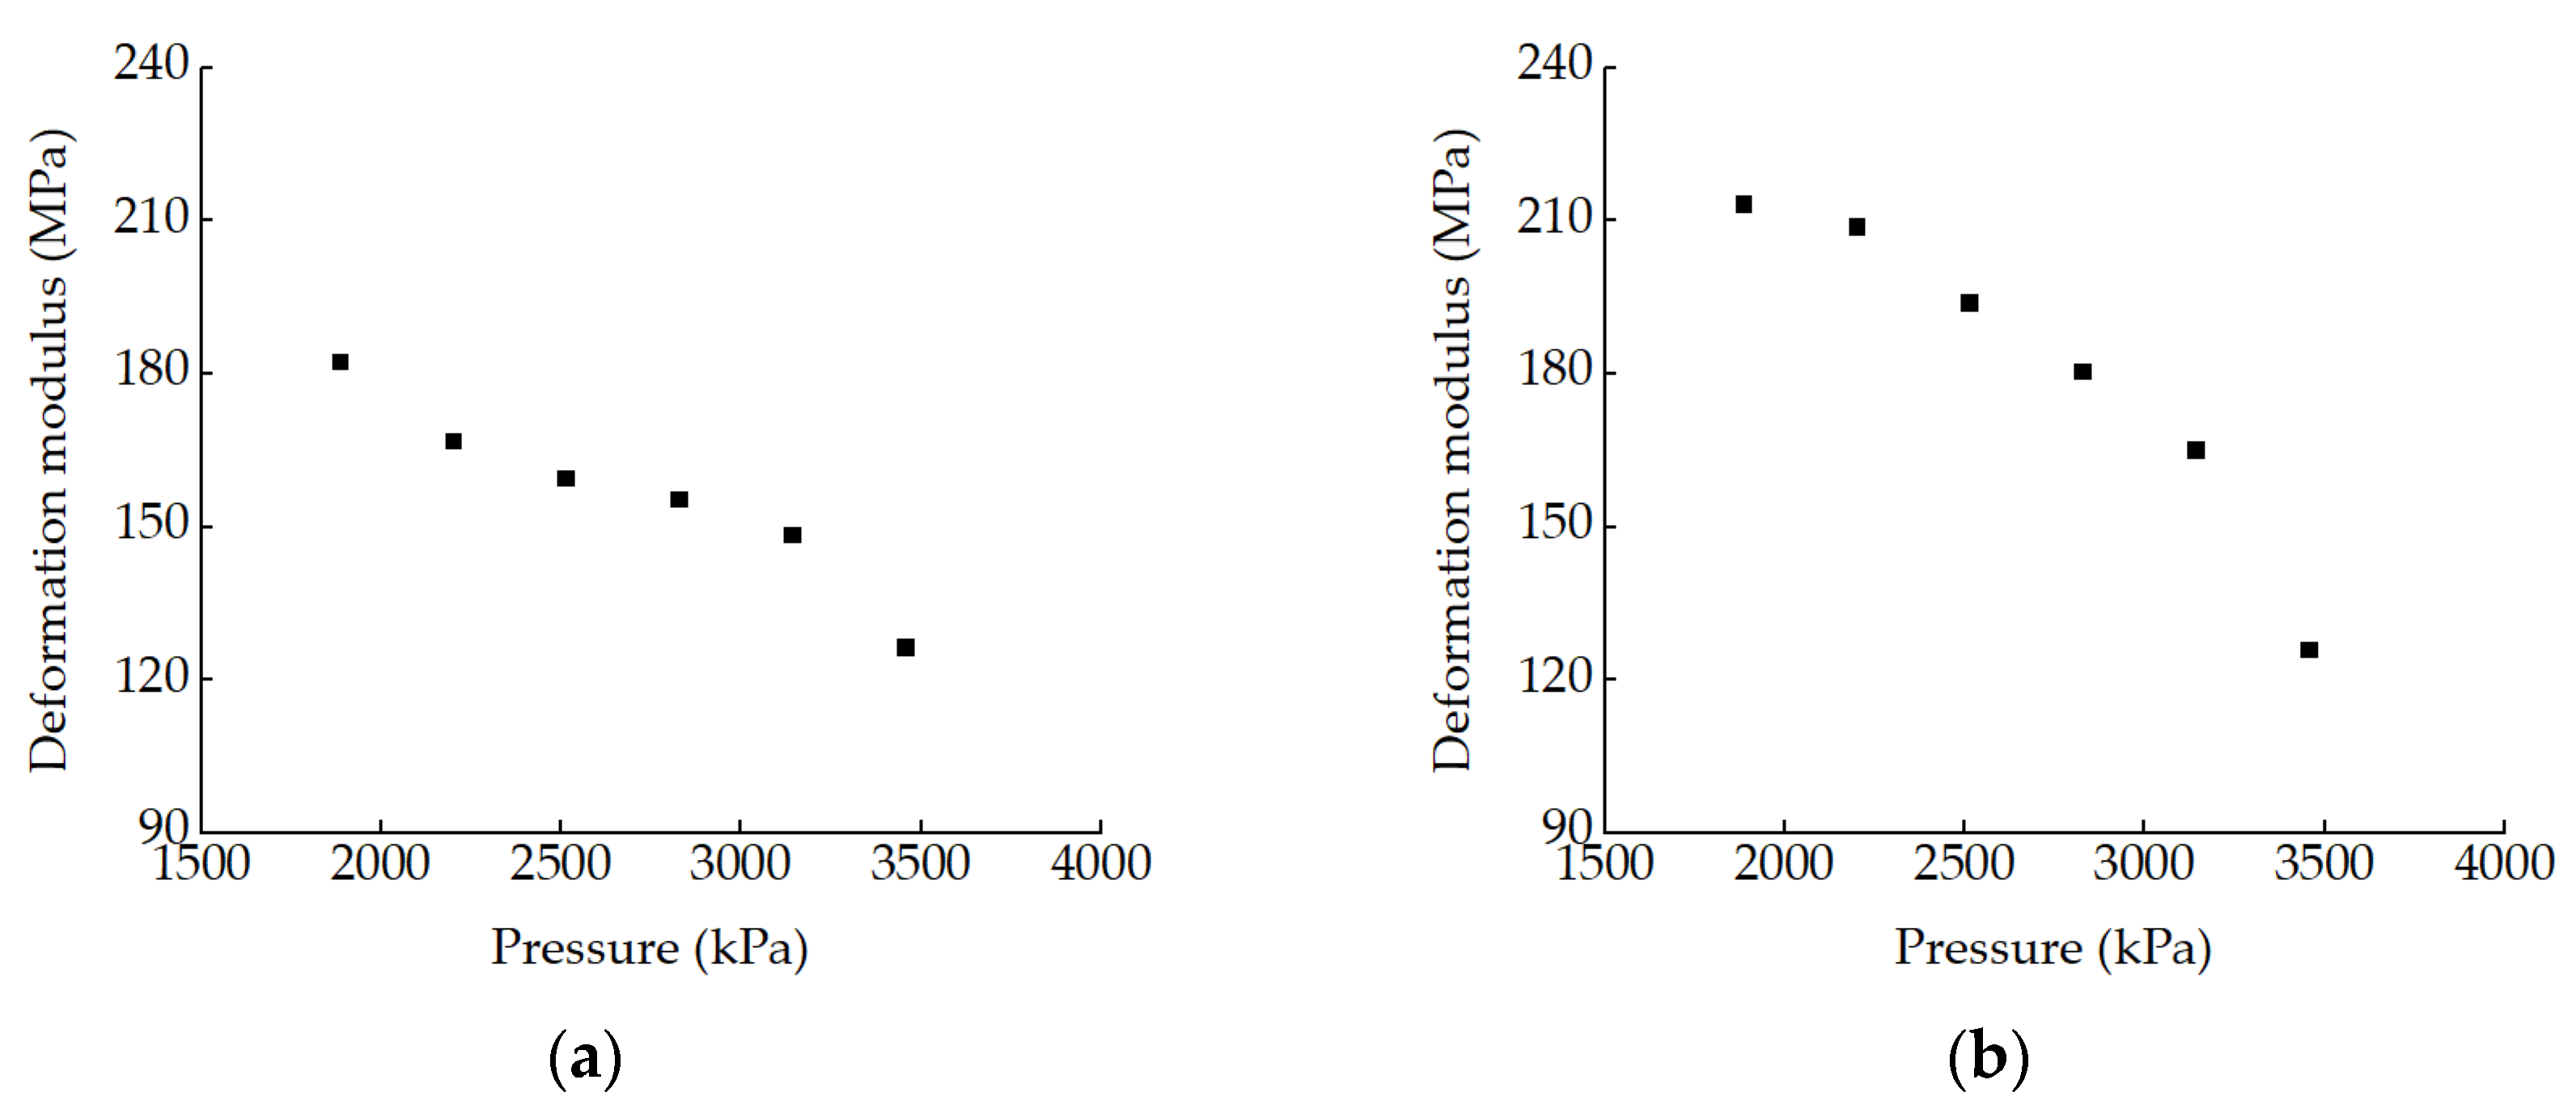
The E0 value corresponding to the p value can be calculated according to Formula (6). The results beyond the design value of unit tip resistance of 1729 kPa are shown in Figure 15. It shows that the deformation modulus decreases with the increase in the pressure.
3.2.4. Mobilized Side Resistance
For TP1 and TP2, the interface between the reinforced concrete supporting wall and the coal rock was damaged during the test. Therefore, the outer diameter and length of the reinforced concrete supporting wall was used to calculate the side resistance:
where τi is the average side resistance per unit area (kPa); Qui is the upward loading value (kN); W is the weight of the pile (kN); Dw is the outer diameter of the reinforced concrete supporting wall (m); hw is the length of the reinforced concrete supporting wall (m).
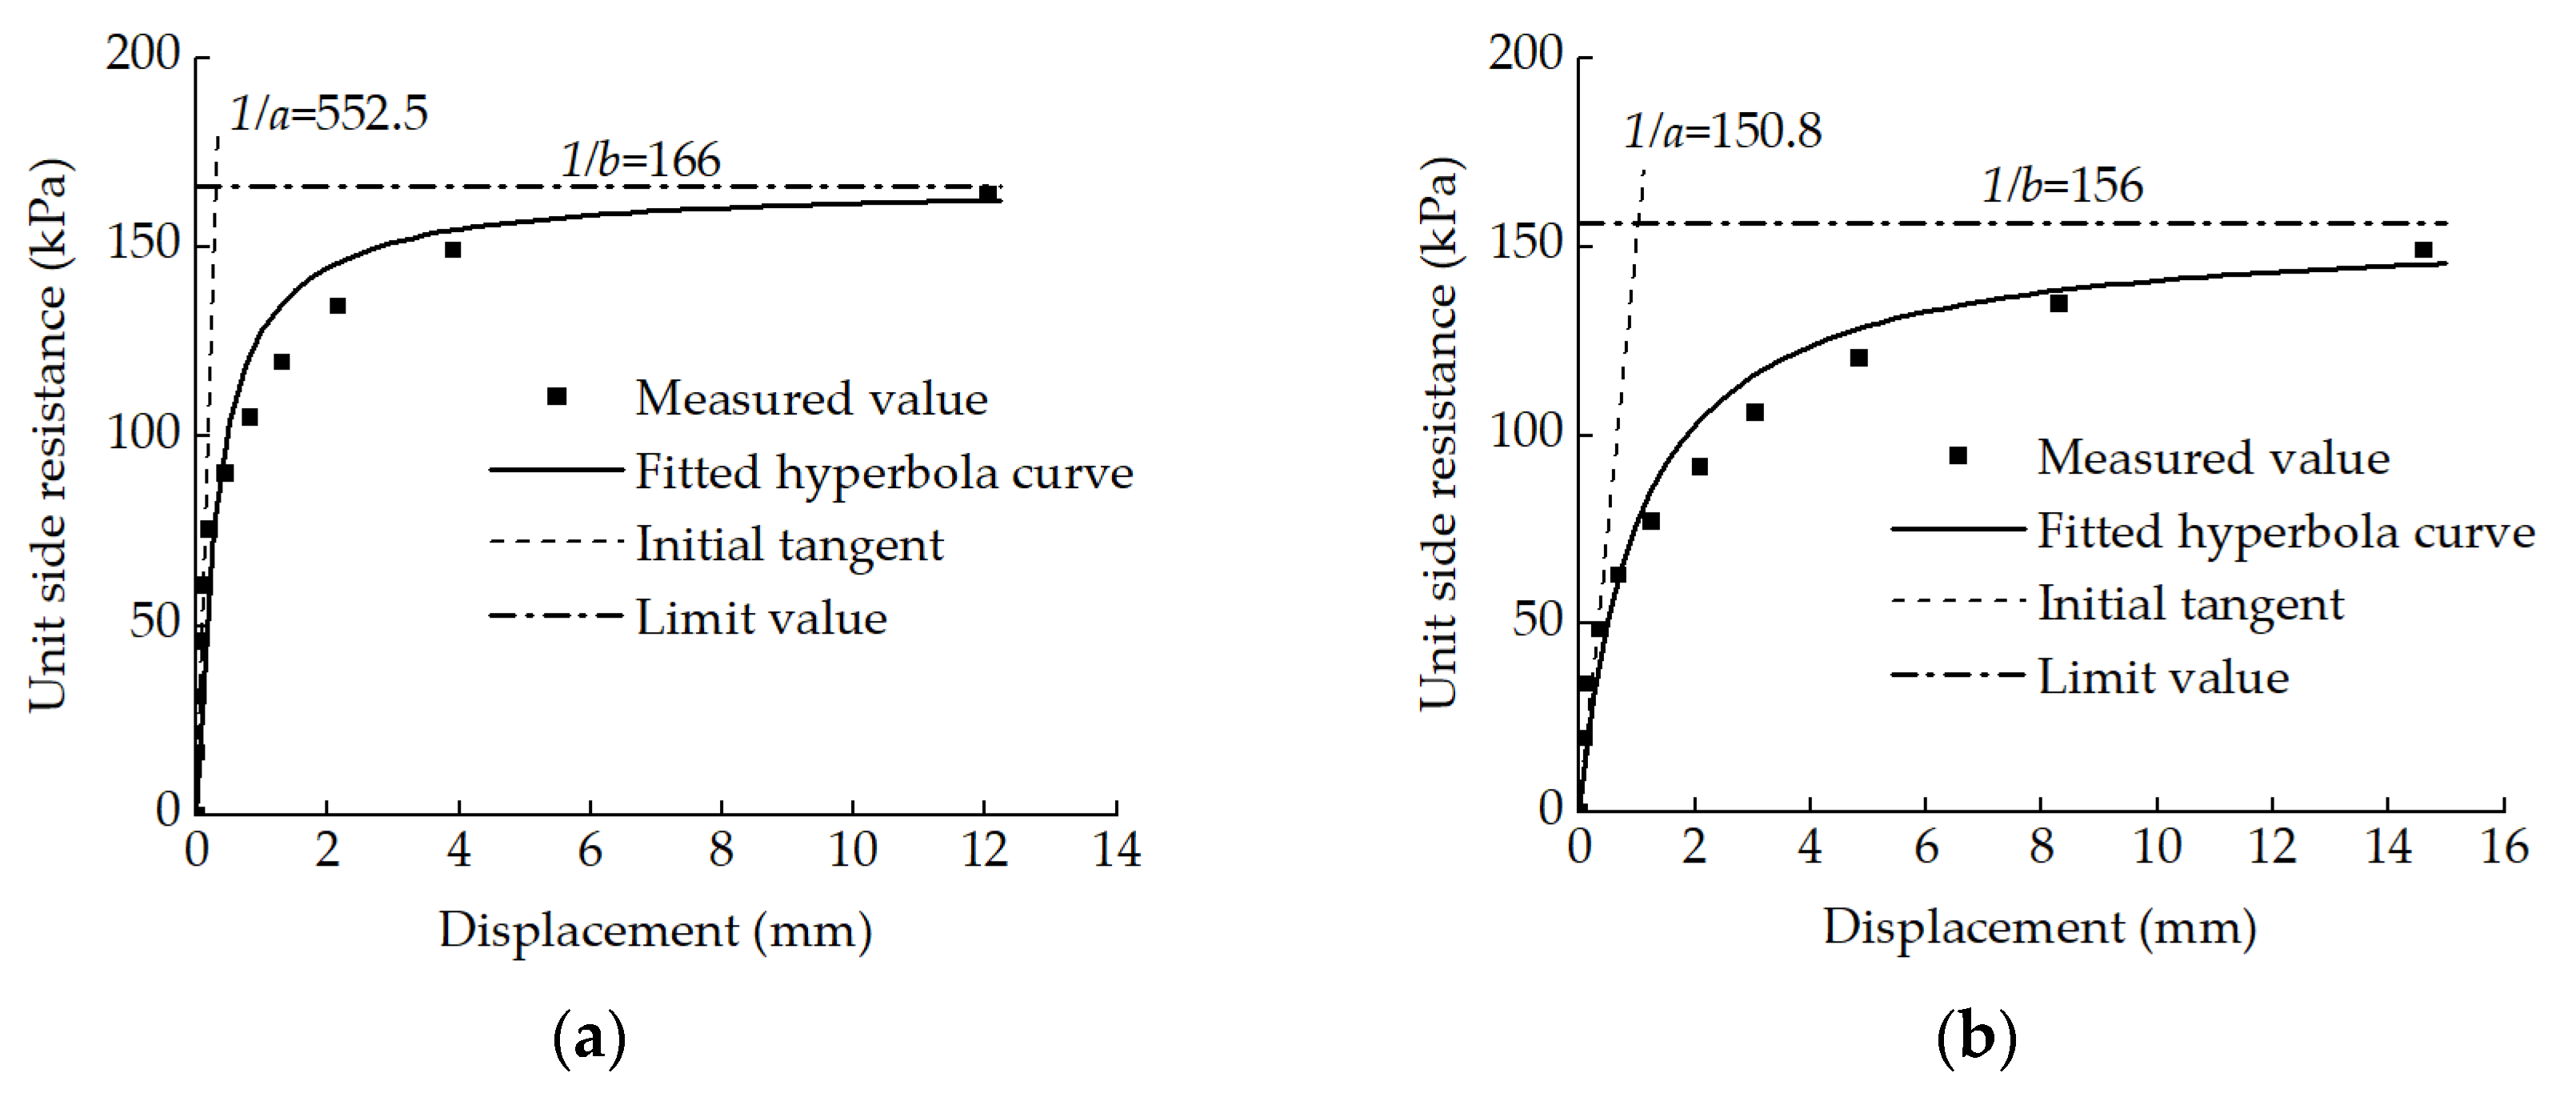
Figure 16 shows the unit side resistance–displacement curve of TP1 and TP2. There is a significant nonlinear relationship between the unit side resistance and the displacement. The hyperbola can be used to represent the load transfer function:
where s is displacement (mm); a and b are coefficients.
In Figure 16, the fitted hyperbola curve matches well with the test points. The initial tangent 1/a of the load transfer functions of TP1 and TP2 are 552.5 and 150.8, respectively, and the limit values of the unit side resistance 1/b of TP1 and TP2 are 166 kPa and 156 kPa, respectively. The difference of the initial tangent is significant, but the limit values of the unit side resistance are close.
In Figure 6, the lengths of the reinforced concrete supporting wall are 7.5 m for TP1 and 7.7 m for TP2, which are roughly the same. Because the failure occurs at the interface between the reinforced concrete supporting wall and the coal rock, the ultimate side resistance of the two piles is basically the same. That means the 1/b values of TP1 and TP2 are close. However, the reinforced concrete length of the pile body is 6.8 m for TP1 and 4.0 m for TP2. The stiffness of TP1 is significantly greater than that of TP2, and it makes the initial tangent 1/a of TP1 significantly greater than that of TP2.
4. Discussion
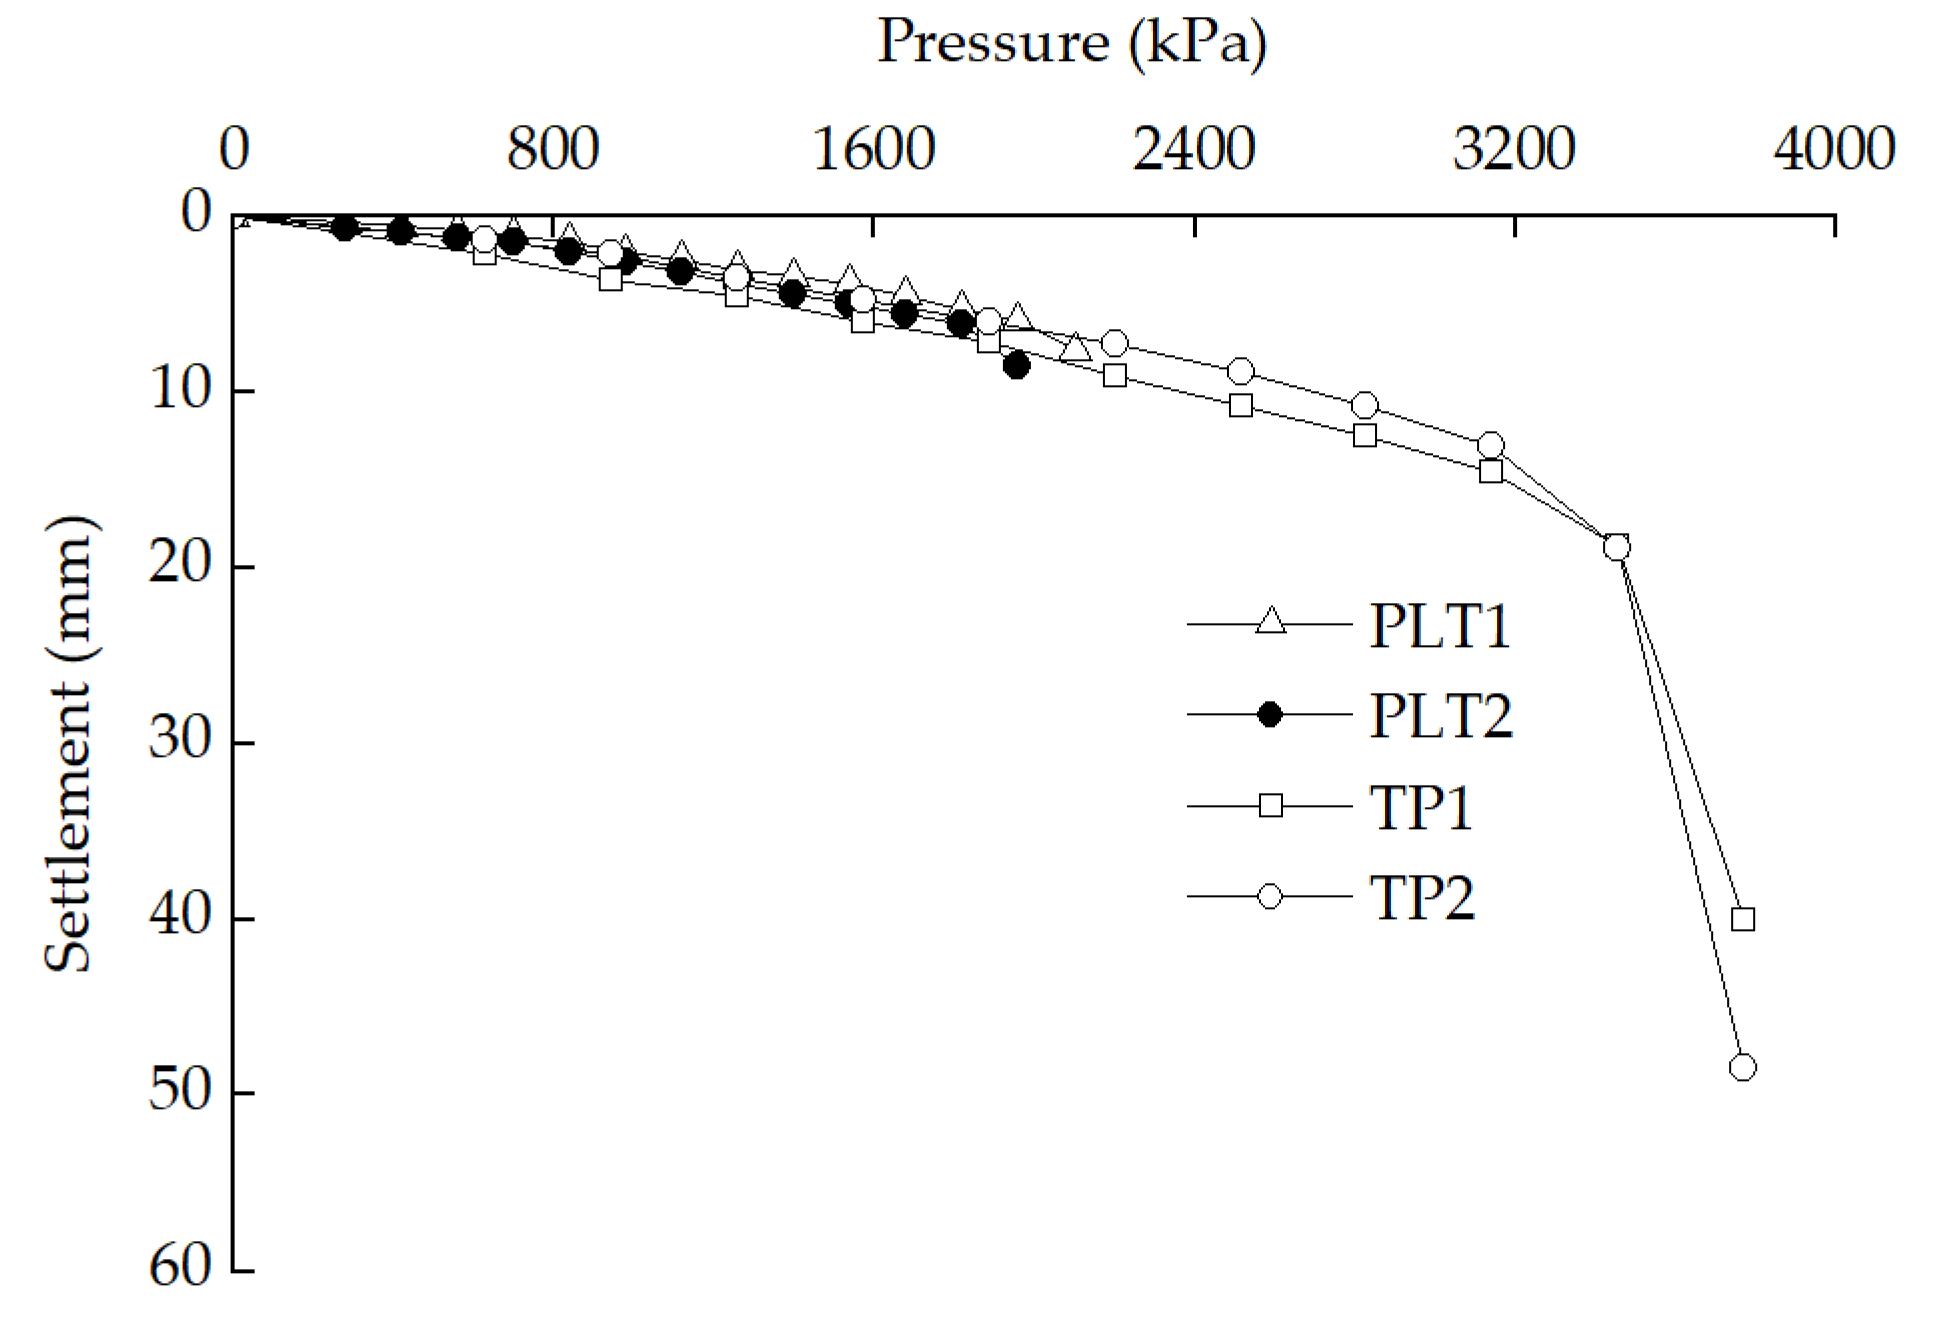
As shown in Figure 4, the position of the plate load test points PLT1 and PLT2 are close to the test piles TP1 and TP2. Figure 17 is the pressure–settlement curve of PLT1 and PLT2 and the unit tip resistance–displacement curve of TP1 and TP2. The test points PLT1 and PLT2 fall in the first half of the unit tip resistance curves of TP1 and TP2. The average value of the ultimate unit tip resistance of TP1 and TP2 is 3458 kPa, the average value of the ultimate bearing capacity of PLT1 and PLT2 is 1890 kPa, and the ratio of the two is 1.83. The ultimate bearing capacity of the pile is significantly higher than that of the plate load test. As to the testing conditions, the plate load test is carried out on the surface without surrounding rock constraints, and the pile tip resistance test is conducted at depths of 7.5 m and 7.7 m, which are constrained by surrounding rocks. This means the bearing capacity of the coal rock increases with the burial depth, and it has been significantly improved by the surrounding rock constraints.
When the bearing capacity of the upper pile and the lower pile are obtained by the bi-directional load test, the load–settlement curve of the pile top loading can be obtained by certain equivalent conversion methods [20,21,27,29]. The commonly used method is as follows [27]:
where Qe is the equivalent pile top load (kN); Qu is the corresponding load of the upper pile when the displacement value is sd (kN); Wu is the weight of the upper pile (kN); γ is the side resistance conversion coefficient, for rock γ = 1.0; Qd is the corresponding load of the lower pile when the displacement value is sd (kN); se is the equivalent settlement of the pile top (mm); sd is the downward displacement at the load cell (mm); Ep is the elastic modulus of the pile (kPa); Ap is the pile cross-sectional area (m2); Lu is the length of the upper pile (m).
In this paper, the unit tip resistance and unit side resistance of the pile in coal rock are obtained, and the mathematical functions are given in Equations (5) and (11). On this basis, the equivalent pile top load–settlement curve can be calculated:
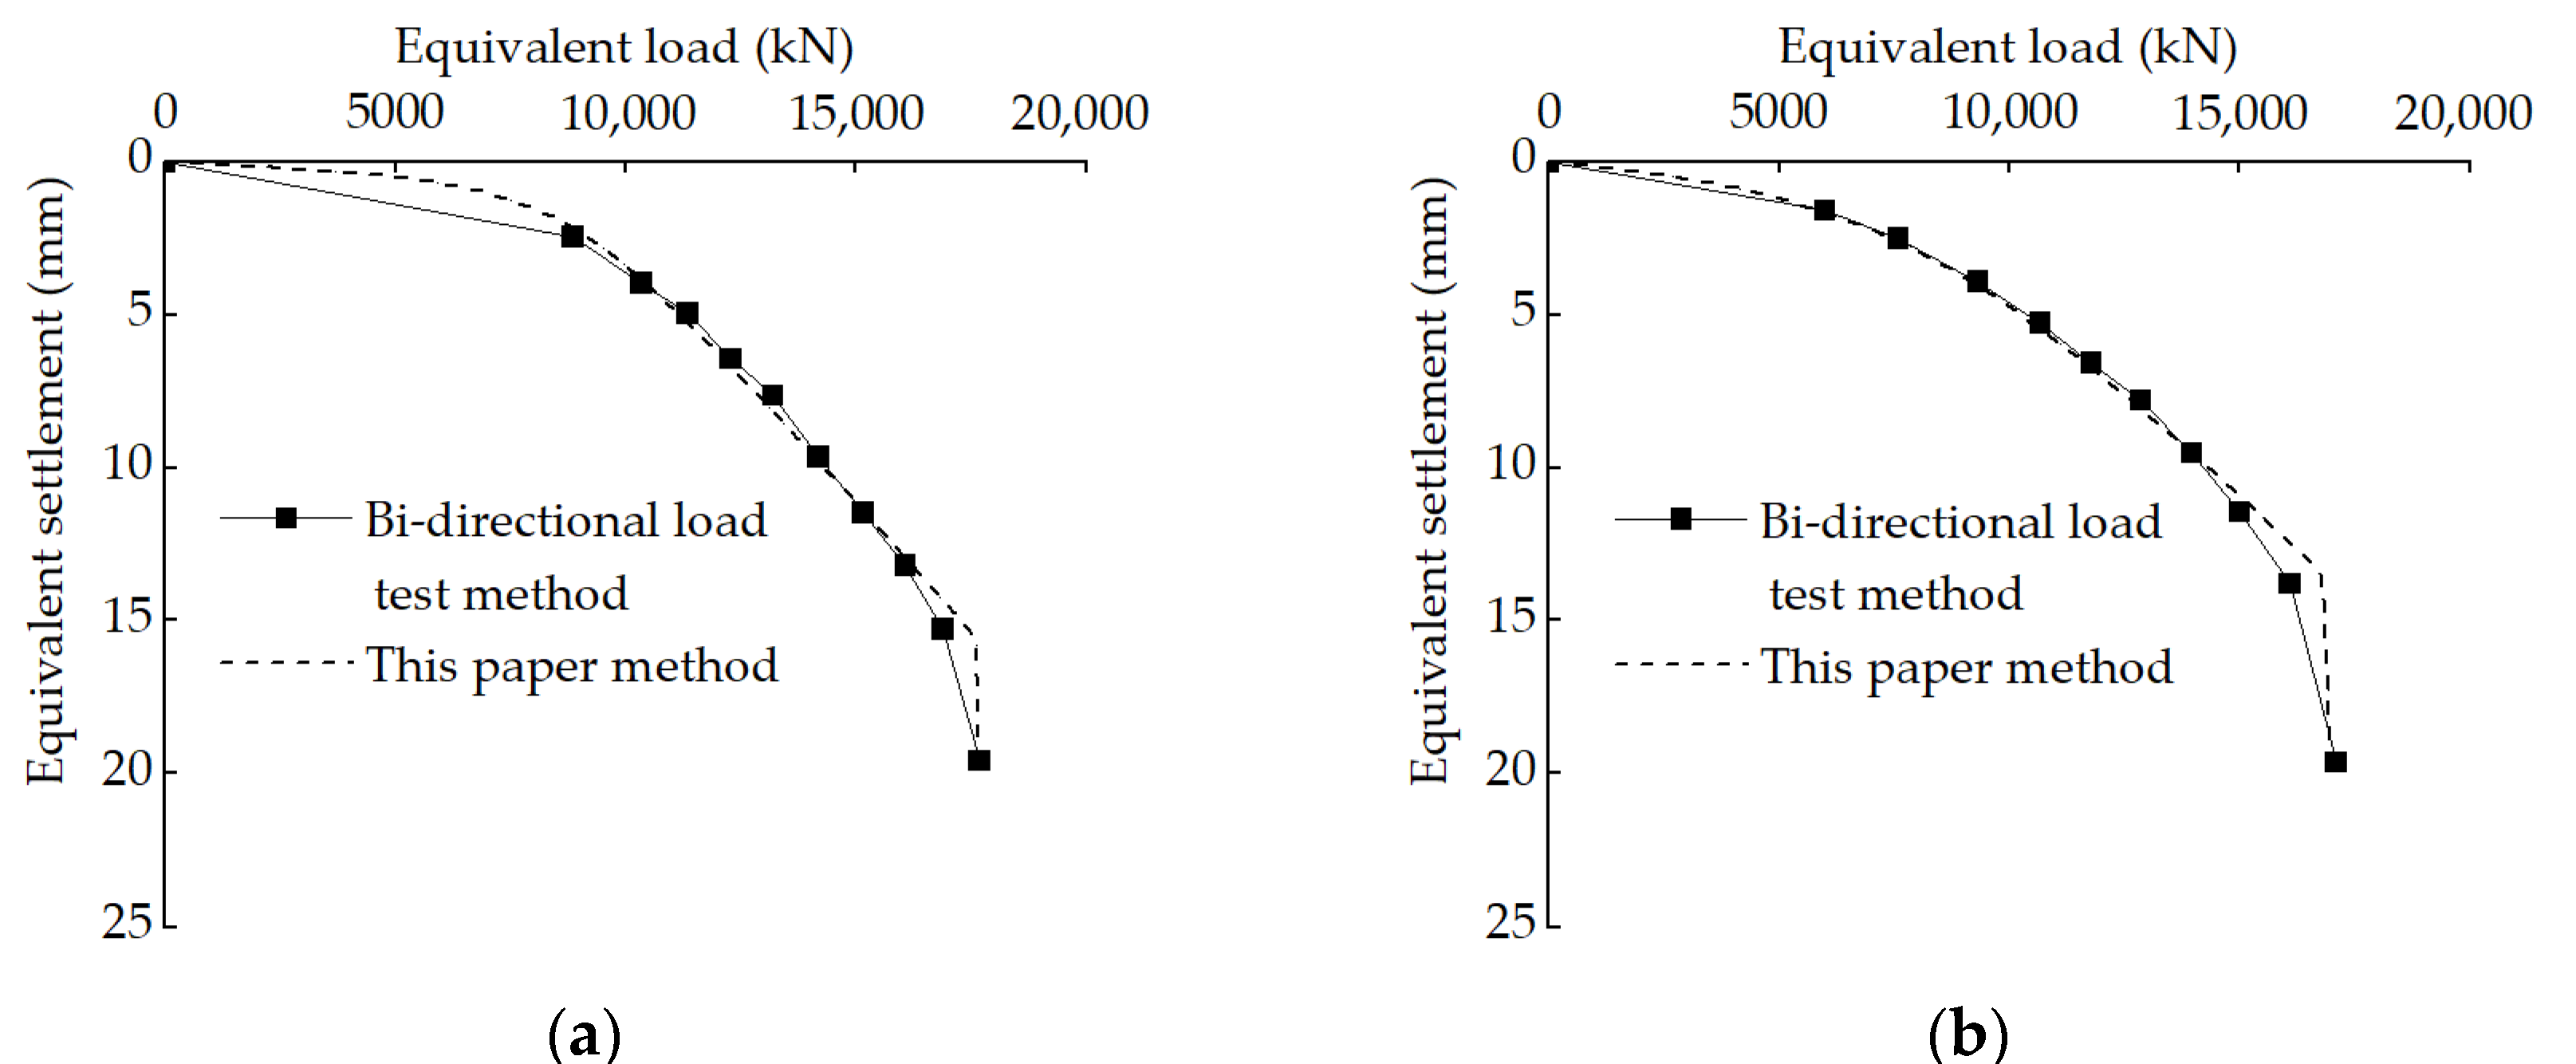
The equivalent conversion curves calculated according to the bi-directional load test method and this paper’s method are shown in Figure 18, and the two curves are in good agreement. The distribution of the equivalent conversion points of the bi-directional load test method depends on the distribution of test points, and the data in the front section of the equivalent conversion curve are often missing, as shown in Figure 18a. This paper’s method overcomes that shortcoming. In the middle section of the equivalent conversion curve, this paper’s method agrees well with the bi-directional load test method. At the end of the equivalent conversion curve, the curve of this paper’s method has a steep drop, which is caused by the tip resistance reaching the limit value in Equation (5), and the side resistance is close to the limit value in Equation (11).
Field test results based on the piles in soil and rock show that there is a size effect on the unit tip resistance and the unit side resistance, i.e., the unit resistance decreases when the pile diameter increases [30,31]. In this paper, two piles with the same diameter of 2.3 m were tested, and the influence of the size effect could not be obtained. That means the bearing capacity of piles with other diameters cannot be accurately calculated. However, when designing piles with a diameter of less than 2.3 m, it will be safer to use the design parameters of this paper to calculate the bearing capacity, from the perspective of size effect.
5. Conclusions
In this paper, three plate load tests and two bi-directional load tests were conducted, and the vertical bearing characteristics of the shallow foundation and the deep foundation on the coal rock were analyzed. The design parameters for practical use were obtained. Based on the test results and discussion, the following conclusions can be drawn.
- According to the results of the plate load test, the pressure–settlement curve of the coal rock is a steep-drop-type. The deformation modulus can be calculated from the Boussinesq solution. Under the working load, the deformation modulus is close to constant. Beyond the working load, the deformation modulus decreases with the increase in pressure, and the relationship between the two is an exponential function.
- The bi-directional load test in which the load cell is placed at the bottom of the pile can be used to directly obtain the tip resistance–displacement curve and the side resistance–displacement curve, so as to obtain the load transfer function of the tip resistance and the side resistance.
- The characteristics of the pile tip resistance of coal rock are: the tip resistance–displacement curve is steep-drop-type, and the distribution of the test points before failure is close to a straight line; the displacement value corresponding to the ultimate bearing capacity is about 1% of the pile diameter. The load transfer function of the unit tip resistance of coal rock is an ideal elastic–plastic curve. The deformation modulus can be calculated from the Mindlin solution. Under the working load, the deformation modulus is close to constant. Beyond the working load, the deformation modulus decreases with the increase in pressure.
- The load transfer function of the unit side resistance of coal rock is a hyperbola.
- According to the ideal elastic–plastic load transfer function of the unit tip resistance and the hyperbolic load transfer function of the unit side resistance, the equivalent pile top load–settlement curve is obtained, which is in good agreement with the results of the bi-directional load test method.
The conclusions drawn from the study of the vertical bearing characteristics of the coal rock have certain engineering application value for the foundation design in similar projects. However, there are still some problems to be further studied: piles with different diameters can be tested to explore the size effect, which was not covered in this research, and other field test methods such as the Dynamic Cone Penetration Test can be used to establish the relationship between the field test parameters and the bearing capacity of the coal rock.
Author Contributions
Conceptualization, Y.M. and X.W.; data curation, Y.M.; writing—original draft preparation, Y.M.; writing—review and editing, Y.M. and X.W.; project administration, X.W.; funding acquisition, Y.M. All authors have read and agreed to the published version of the manuscript.
Funding
This research was funded by General University Science Research Project of Jiangsu Province (22KJD560002), and Science and Technology Project of Jiangsu Province Construction System (2020ZD24). This work was also sponsored by High-end Research of Principal Investigator of Vocational College of Jiangsu Province (2022GRGDYX007).
Institutional Review Board Statement
Not applicable.
Informed Consent Statement
Not applicable.
Data Availability Statement
Not applicable.
Acknowledgments
The authors would like to express our gratitude to Guibin Wang of Guizhou Sino Rock Engineering Testing Co., Ltd., Guiyang, China, and Fujian Xu of Nanjing Dongda Bi-directional Pile Testing Co., Ltd., Nanjing, China, for their field-testing work. The authors would like to express appreciation to the editors and reviewers for their valuable comments and suggestions.
Conflicts of Interest
The authors declare no conflict of interest.
References
- Hoek, E.; Brown, E.T. Practical estimates of rock mass strength. Int. J. Rock Mech. Min. Sci. 1997, 34, 1165–1186. [Google Scholar] [CrossRef]
- Shi, L.; Zhu, D.; Shen, Y. Study of bearing capacity of joined rock mass foundation based on generalized Hoek-Brown nonlinear failure criterion. Chin. J. Rock Mech. Eng. 2013, 32, 2764–2771. [Google Scholar]
- Meng, Z.; Peng, S.; Fu, J. Study on control factors of rock mechanics properties of coal-bearing formation. Chin. J. Rock Mech. Eng. 2002, 21, 102–106. [Google Scholar]
- Yang, Y.; Song, Y.; Chu, J. Experimental study on characteristics of strength and deformation of coal under cyclic loading. Chin. J. Rock Mech. Eng. 2007, 26, 201–205. [Google Scholar]
- Wang, X.; Wen, Z.; Mikael, R.; Shen, B.; Xie, J. Experimental study of strength properties of coal-rock under non-uniformly distributed load. Rock. Soil Mech. 2017, 38, 723–730. [Google Scholar] [CrossRef]
- Xie, H.; Zhang, Z.; Gao, F.; Zhang, R.; Gao, M.; Liu, J. Stress-fracture-seepage field behavior of coal under different mining layouts. J. China Coal Soc. 2016, 41, 2405–2417. [Google Scholar] [CrossRef]
- Miao, Y.; Wang, G.; Xu, F.; Wang, F. Field test study on bearing characteristics of manual digging piles in coal strata. J. Build. Struct. 2020, 41, 124–130. [Google Scholar] [CrossRef]
- Yang, G.; Jiang, Y.; Xu, C.; Li, Z.; Chen, F.; Jia, K. New method for determining foundation bearing capacity based on plate loading test. In Proceedings of the China-Europe Conference on Geotechnical Engineering, Vienna, Austria, 13–16 August 2016; pp. 1064–1067. [Google Scholar] [CrossRef]
- Abdelsalam, S.; Anwar, M.; Esmail, D. LRFD for Shallow foundations using plate load test data. In Proceedings of the Geo-Congress 2020: Foundations, Soil Improvement, and Erosion, Minneapolis, MN, USA, 25–28 February 2020; pp. 313–324. [Google Scholar] [CrossRef]
- Ding, J.; Yuan, M.; Wang, Y. Reliability analysis on composite foundation settlement based on Boussinesq’s stress and displacement solution. Eng. Mech. 2011, 28, 35–39. [Google Scholar]
- Zhang, Z.; Chen, H.; Wu, H. Research on stress and settlement of composite ground with soft base slab. Rock. Soil Mech. 2004, 25, 451–454. [Google Scholar] [CrossRef]
- Hsu, Z. Calculation of vertical pressures in soil beneath loaded areas based on Mindlin’s formula. Chin. J. Civ. Eng. 1957, 4, 485–497. [Google Scholar] [CrossRef]
- Poulos, H.; Davis, E. Pile Foundation Analysis and Design; John Wiley and Sons: New York, NY, USA, 1980; pp. 74–83. [Google Scholar]
- Ai, Z.; Yang, M. Application extended Mindlin solution to analyze a vertically loaded pile in multi-layered soil. China Civ. Eng. J. 2001, 34, 89–95. [Google Scholar] [CrossRef]
- Gao, W.; Zhu, J.; Zhang, Z.; Huang, Z. Experiment study on bearing capacity of soft rock foundation. Chin. J. Rock Mech. Eng. 2008, 27, 953–959. [Google Scholar]
- Meyer, Z.; Żarkiewicz, K. Skin and toe resistance mobilisation of pile during laboratory static load test. Stud. Geotech. Mech. 2018, 40, 1–5. [Google Scholar] [CrossRef] [Green Version]
- Żarkiewicz, K. Pile bearing analysis based upon ultimate values of toe and skin resistance as well as their mobilization with settlement. MATEC Web Conf. 2019, 284, 03011. [Google Scholar] [CrossRef]
- Osterberg, J. The Osterberg load test method for bored and driven piles. The first ten years. In Proceedings of the 7th International Conference and Exhibition on Piling and Deep Foundations, Vienna, Austria, 15–17 June 1998; pp. 1.28.1–1.28.17. [Google Scholar]
- Fellenius, B.; Altaee, A.; Kulesza, R.; Hayes, J. O-cell testing and FE analysis of 28-m-deep barrette in Manila, Philippines. J. Geotech. Geoenviron. Eng. 1999, 125, 566–575. [Google Scholar] [CrossRef]
- Gong, W.; Dai, G.; Jiang, Y.; Xue, G. Theory and practice of self-balanced loading test for pile bearing capacity. J. Build. Struct. 2002, 23, 82–88. [Google Scholar] [CrossRef]
- Dai, G.; Gong, W. Application of bi-directional static loading test to deep foundations. J. Rock Mech. Geotech. Eng. 2012, 4, 269–275. [Google Scholar] [CrossRef]
- Yang, H.; Yang, M. Development of load-transfer method for settlement calculation of single pile. Chin. J. Undergr. Space Eng. 2006, 2, 155–165. [Google Scholar]
- Zhao, M.; He, J.; Cao, W.; Wu, M. Study on the load transfer model and the bearing capacity of vertically loaded piles. J. Hunan Univ. 2005, 32, 37–42. [Google Scholar]
- Randolph, M. Keynote Lecture: Considerations in the design of piles in soft rock. Lect. Notes Civ. Eng. 2020, 62, 1297–1312. [Google Scholar] [CrossRef]
- Zhao, M.; Lei, Y.; Liu, X. Analysis of load transfer of rock-socketed piles based on characteristics of pile-rock structural plane. Chin. J. Rock Mech. Eng. 2009, 28, 103–110. [Google Scholar]
- Committee of Geological Engineering Handbook. Geological Engineering Handbook, 5th ed.; China Architecture Publishing & Media Co., Ltd.: Beijing, China, 2018; pp. 246–261. (In Chinese) [Google Scholar]
- Ministry of Housing and Urban-Rural Development of the People’s Republic of China. Technical Specification for Static Loading Test of Self-Balanced Method of Building Foundation Piles; China Architecture Publishing & Media Co., Ltd.: Beijing, China, 2017. (In Chinese)
- Liu, X. Deduction of calculation formula for deformation modulus of deep flat plate load test. China Civ. Eng. J. 2022; in press. [Google Scholar] [CrossRef]
- Lee, J.; Park, Y. Equivalent pile load-head settlement curve using a bi-directional pile load test. Comput. Geotech. 2008, 35, 124–133. [Google Scholar] [CrossRef]
- Gong, C.; He, C.; Gong, W.; Dai, G. Analysis of size effect on large diameter rock-socketed pile based on self-balance method. Rock. Soil Mech. 2012, 33, 2403–2407. [Google Scholar] [CrossRef]
- Liu, F.; Zhao, C.; Wu, J.; Liu, D. Experimental research on bearing behavior and size effect of large diameter bored cast-in-situ piles in Changzhou area. Chin. J. Rock Mech. Eng. 2010, 29, 858–864. [Google Scholar]
Figure 1.
Location of site research.

Figure 2.
Plane distribution of rock formations.

Figure 3.
Coal rock on-site.

Figure 4.
Layout of test points.

Figure 5.
Sketch of plate load test: (a) Front view; (b) Floor plan.

Figure 6.
Geometric dimensions of test piles.

Figure 7.
Sketch of bi-directional load test.

Figure 8.
Load cell of the bi-directional load test.

Figure 9.
Pressure–settlement curves of PLT1, PLT2 and PLT3.

Figure 10.
Relationship between pressure and settlement at liner segment: (a) PLT1; (b) PLT2; (c) PLT3.
Figure 10.
Relationship between pressure and settlement at liner segment: (a) PLT1; (b) PLT2; (c) PLT3.

Figure 11.
Relationship between deformation modulus and pressure: (a) PLT1; (b) PLT2; (c) PLT3.

Figure 12.
Load–displacement curves of TP1 and TP2.

Figure 13.
Relationship between unit tip resistance and displacement: (a) TP1; (b) TP2.

Figure 14.
Relationship between unit tip resistance and displacement at liner segment: (a) TP1; (b) TP2.
Figure 14.
Relationship between unit tip resistance and displacement at liner segment: (a) TP1; (b) TP2.

Figure 15.
Relationship between deformation modulus and pressure: (a) TP1; (b) TP2.

Figure 16.
Relationship between unit side resistance and displacement: (a) TP1; (b) TP2.

Figure 17.
Comparison of plate load test results and pile tip resistance test results.

Figure 18.
Equivalent conversion curves of pile top load–settlement: (a) TP1; (b) TP2.


Table 1.
Loading conditions of plate load tests.
| No. | Initial Load (kPa) | Load Increment (kPa) | Max Load (kPa) |
|---|---|---|---|
| PLT1 | 280 | 140 | 2100 |
| PLT2 | 280 | 140 | 1960 |
| PLT3 | 280 | 140 | 2240 |
Table 2.
Loading conditions of bi-directional load tests.
| No. | Initial Load (kN) | Load Increment (kN) | Max Load (kN) |
|---|---|---|---|
| TP1 | 1600 | 800 | 9600 |
| TP2 | 1600 | 800 | 9600 |
Publisher’s Note: MDPI stays neutral with regard to jurisdictional claims in published maps and institutional affiliations. |
© 2022 by the authors. Licensee MDPI, Basel, Switzerland. This article is an open access article distributed under the terms and conditions of the Creative Commons Attribution (CC BY) license (https://creativecommons.org/licenses/by/4.0/).
Share and Cite
MDPI and ACS Style
Miao, Y.; Wang, X. Field Test Study on Vertical Bearing Characteristics of Coal Rock. Appl. Sci. 2022, 12, 9301. https://0-doi-org.brum.beds.ac.uk/10.3390/app12189301
AMA Style
Miao Y, Wang X. Field Test Study on Vertical Bearing Characteristics of Coal Rock. Applied Sciences. 2022; 12(18):9301. https://0-doi-org.brum.beds.ac.uk/10.3390/app12189301
Chicago/Turabian StyleMiao, Yun, and Xudong Wang. 2022. "Field Test Study on Vertical Bearing Characteristics of Coal Rock" Applied Sciences 12, no. 18: 9301. https://0-doi-org.brum.beds.ac.uk/10.3390/app12189301
Note that from the first issue of 2016, this journal uses article numbers instead of page numbers. See further details here.