
Supervised Learning-Based Image Classification for the Detection of Late Blight in Potato Crops


Department of Systems and Computing, Pedagogical and Technological University of Colombia, Sogamoso 150003, Colombia
*
Author to whom correspondence should be addressed.
Appl. Sci. 2022, 12(18), 9371; https://0-doi-org.brum.beds.ac.uk/10.3390/app12189371
Submission received: 12 August 2022
/
Revised: 9 September 2022
/
Accepted: 13 September 2022
/
Published: 19 September 2022
(This article belongs to the Special Issue Computer Vision and Pattern Recognition Based on Deep Learning)
Abstract
:This article presents the application of supervised learning and image classification for the early detection of late blight disease in potato using convolutional neural network and support vector machine SVM. The study was realized in the Boyacá department, Colombia. An initial dataset is created with the acquisition of a large number of images directly from the crops. These images are pre-processed in order to extract the main characteristics of the late blight disease. A classification model is developed to identify the potato plants as healthy or infected. Several performance, efficiency, and quality metrics were applied in the learning and classification tasks to determine the best machine learning algorithms. Then, an additional data set was used for validation, image classification, and detection of late blight disease in potato crops in the department of Boyacá, Colombia. The results obtained in the AUC curve show that the CNN trained with the data set obtained an AUC equal to 0.97; and the analysis through SVM obtained an AUC equal to 0.87. Future work requires the development of a mobile application with advanced features as a technological tool for precision agriculture that supports farmers with increased agricultural productivity.
1. Introduction
The most important economic activity in the department of Boyacá, Colombia is the potato crops. According to a report presented by FEDEPAPA, Boyacá is the second state in Colombia with the greatest influence of this crop. In the 2019/2020 period, the department had 27.30% of the total planted area and 26.84% of the total production at the national level being the greatest influence of this crop [1]. Therefore, research regarding potato growth and production is a critical issue for the economy of the state.
Plant pests and diseases constantly threaten the quality and quantity of agricultural production in general. The drop, also called late blight, is perhaps the most destructive disease that affects potato crops and weakens them in a short time, generating great economic losses. This pathogen is reported as one of the greatest limitations in production, the causative agent being the Oomycete Phytophthora Infestant, which mainly affects the leaves, stems, and tubers [2]. The first symptoms appear as small dark green spots, circular to irregular; and they typically begin to develop near the tips or edges of the leaves, where moisture is held longest. Under cool, wet weather conditions, foliar lesions expand rapidly, turning the leaves to dark brown to black colors. As new infection spots appear, these lesions spread to tissue and leaves that are quickly destroyed. Then, the damage expands towards the petioles and stems of the potato plant [3]. Visual inspections and lab testing by experts are the traditional way to detect the disease. Although these are precise procedures, applying these techniques is time-consuming and increases computational cost. These issues can be solved in a real application by applying a real-time technique to identify plant diseases using specialized techniques and IT [4]. The proposed approach can detect various diseases in the same image and the same diseases with different sizes. In addition, this approach can be accurately applied in different geographical areas from where the original dataset was acquired.
2. Related Works
The literature review about this topic shows that in recent years, the application of digital image processing techniques and machine learning models for the detection and classification of diseases in various crops has increased significantly. The studies carried out have obtained disease identification results with success rates greater than 95% in crop disease prediction and classification tasks [5]. Shrivastava and Pradhan presented a study on disease classification of rice plants using an image-based approach based only on color features. In addition, they tested different classifiers and found that the support vector machine achieved higher accuracy with 94.65% [6]; furthermore, a convolutional neural networks (CNN) model was developed in this work to detect diseases in tomato crops. The proposed model obtained an average precision of 91.2%, demonstrating the effectiveness over previously trained models such as VGG16, InceptionV3, and MobileNet, which obtained an average precision of 77.2%, 63.4%, and 63.75%, respectively. According to [7]. access to smart devices can be used to facilitate automatic diagnosis of diseases in maize crops and prevent losses. They present a method based on deep CNNs for the recognition of diseases in maize leaves, which has the ability to run on independent smart devices such as Raspberry-pi, smartphones, and/or drones with an accuracy of 88.46% [8]. Likewise, Ashqar and Abu-Naser carry out a study with the purpose of implementing a CNN model capable of identifying five diseases in tomato crops on smartphones, and the results obtained show an accuracy greater than 95.54% [9].
However, it has been observed that most of the studies in the literature diagnose different diseases such as gota or tizon tardio for a particular plant or several plants [10]. In this study, a CNN architecture is proposed that will be compared with SVM for the diagnosis of gout disease or late blight produced by the fungus phytophthora infestans present in potato crops. The main goal is to find the architecture with the best performance in identification and classification of the disease under study and using the created dataset and the deployment using a mobile app.
The results show the effectiveness of supervised learning models in detecting healthy and infected leaves with a significant reduction in human efforts to detet the disease especially in large crops, and the strengthening of agricultural productivity in the region. Finally, the development of a mobile app for precision agriculture supports the farmers of the region with increased agriculture productivity.
This work proposes a supervised learning model based on the SVM and CNN algorithms to classify and detect late blight disease in potato crops. This model was implemented in a mobile application to support the farmers in defining strategies to control this disease exhibited by their crops. In this work, the proposed deep-learning approach helps with an accurate identification of the common types of leaf diseases related with late blight in potato crops.
This article is organized as follows: The literature review conducted on machine learning and deep-learning models is presented in Section 2. Section 3 describes the material and methods used, the CNN architectures created, a comparation with SVM, and the evaluation metrics; Section 4 contains the results and the discussion regarding the different architectures; and finally, the final conclusions are reported in Section 5.
3. Materials and Methods
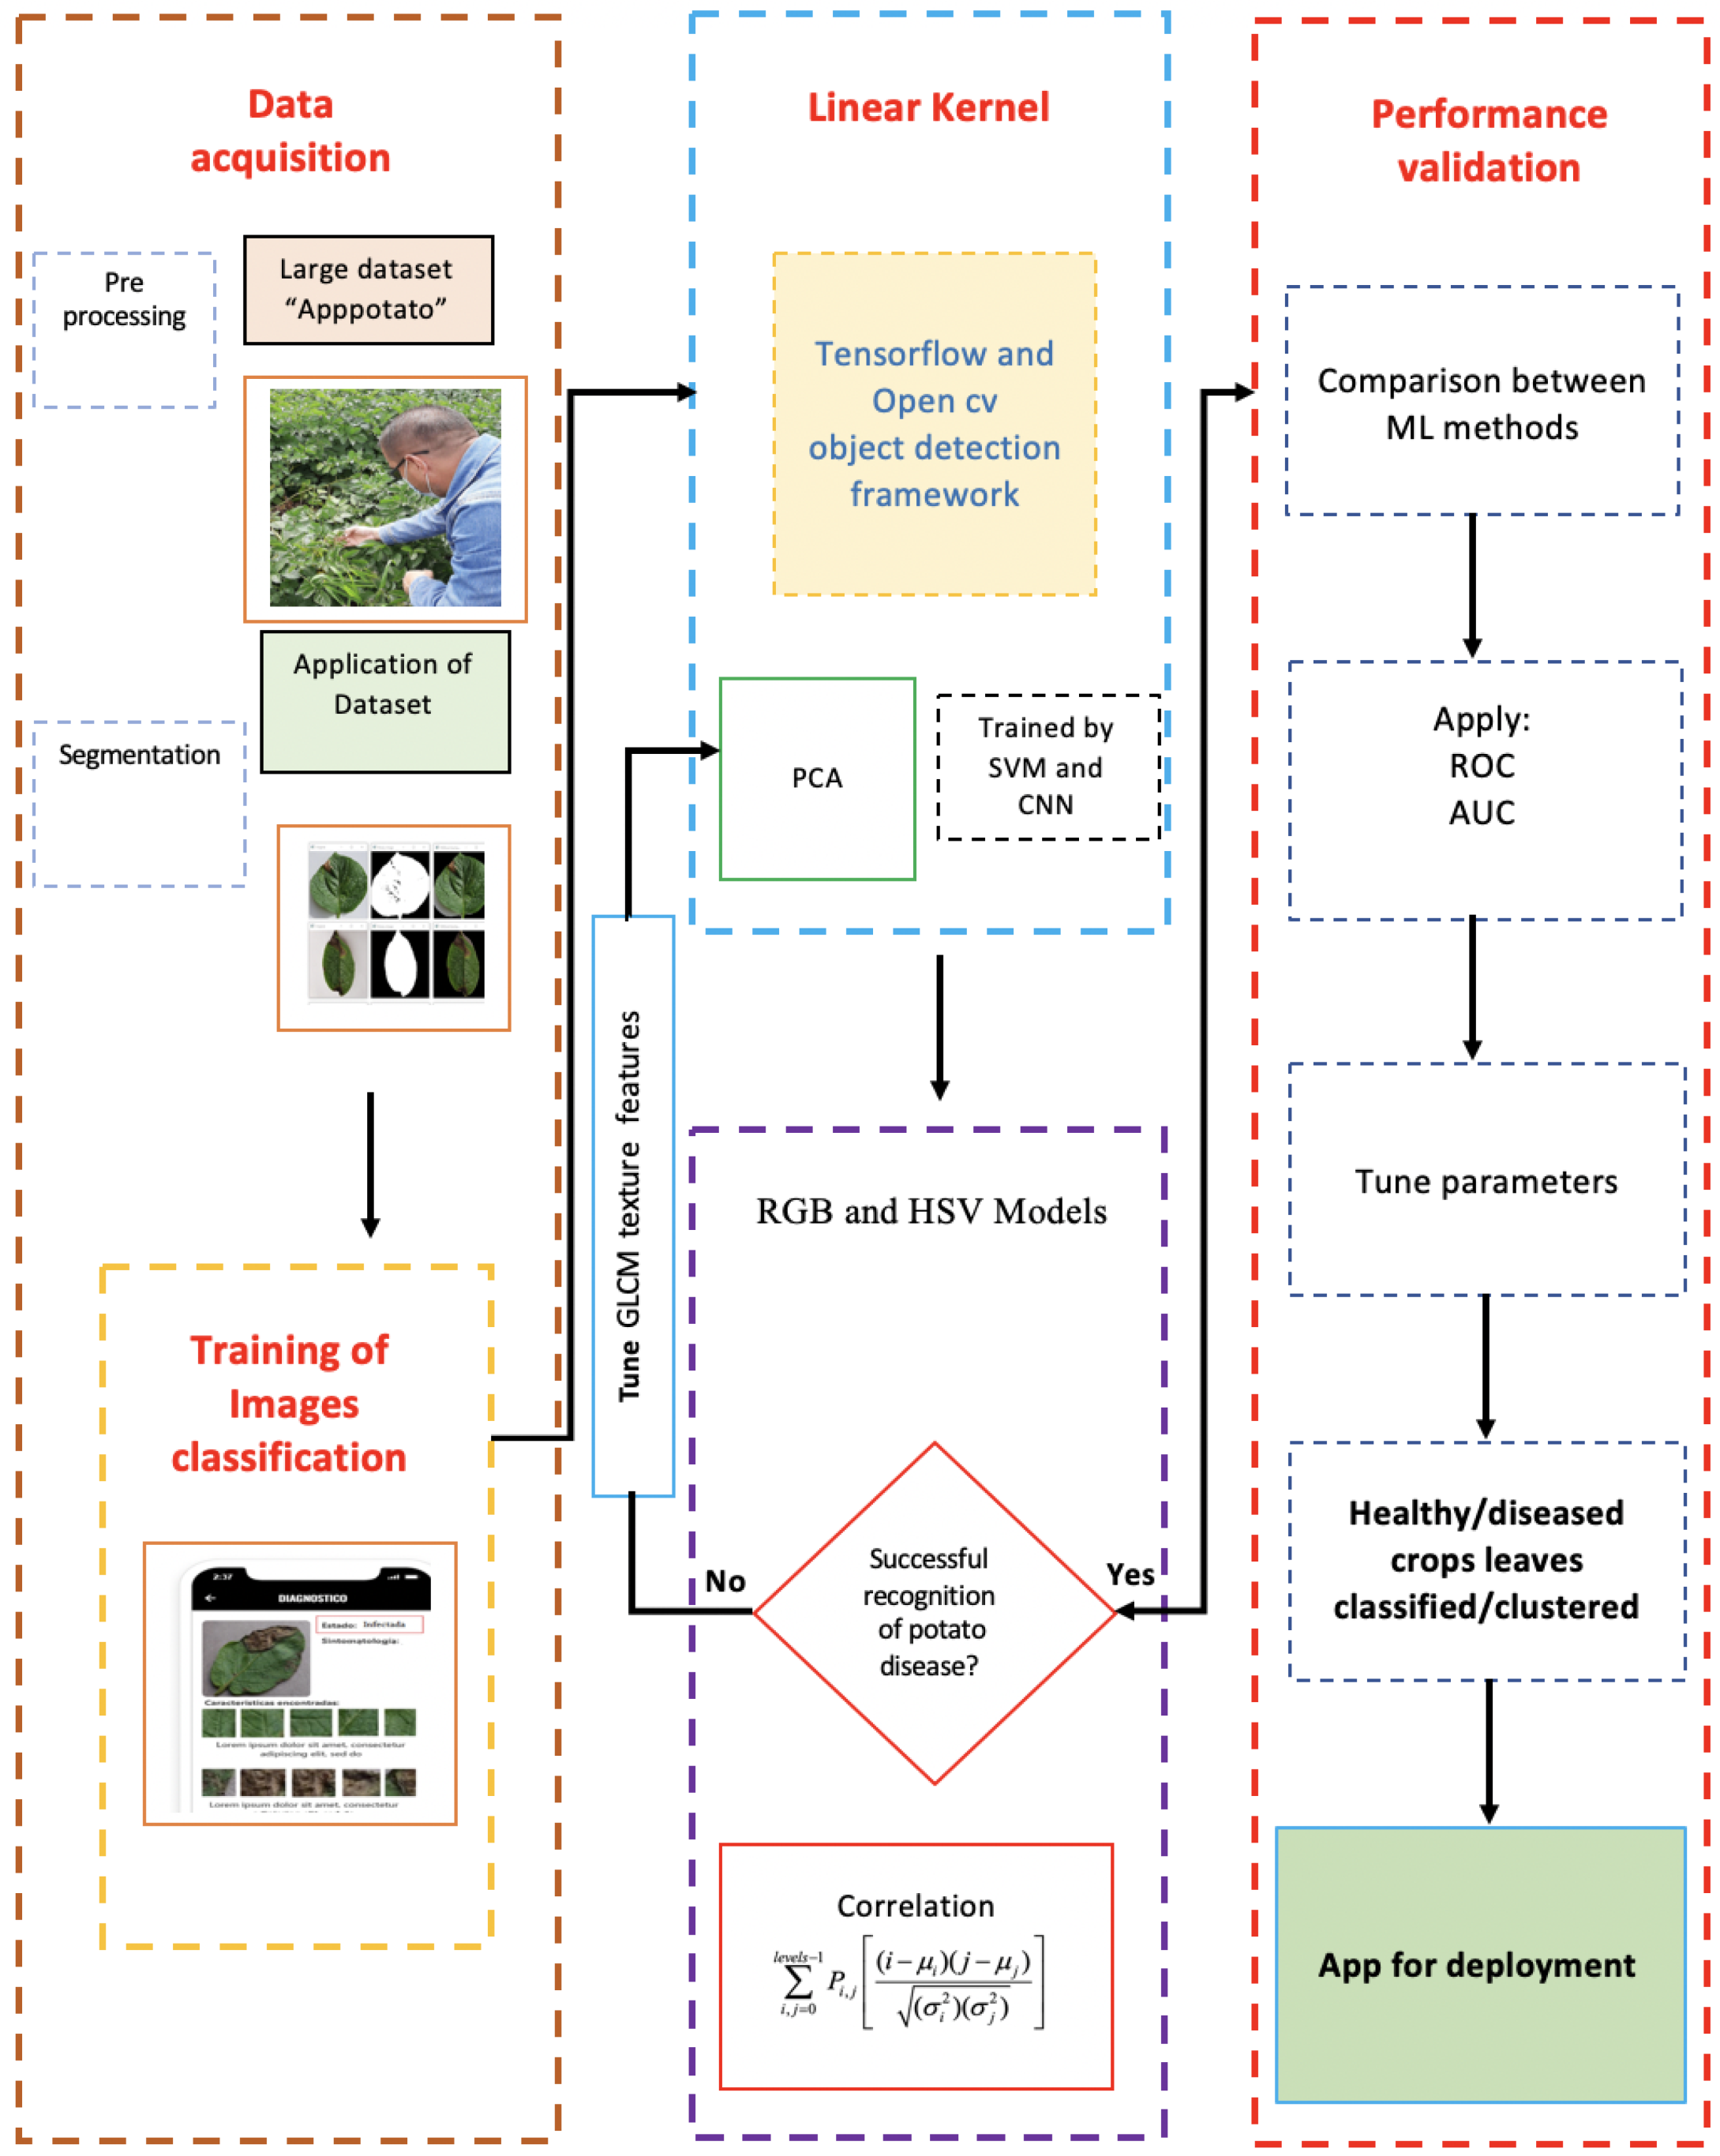
In this research, supervised machine learning techniques are applied to the early detection of late blight disease in potato crops. The main focus is on the performance analysis of ML models with the application of the linear kernel together with applying architecture based to by the AlexNet model [11]. The three-step methodology followed in this work is presented in Figure 1, and the steps are the following: (i) Data acquisition, (ii) Linear kernel, (iii) Performance validation of the models.
3.1. Mobile System Design
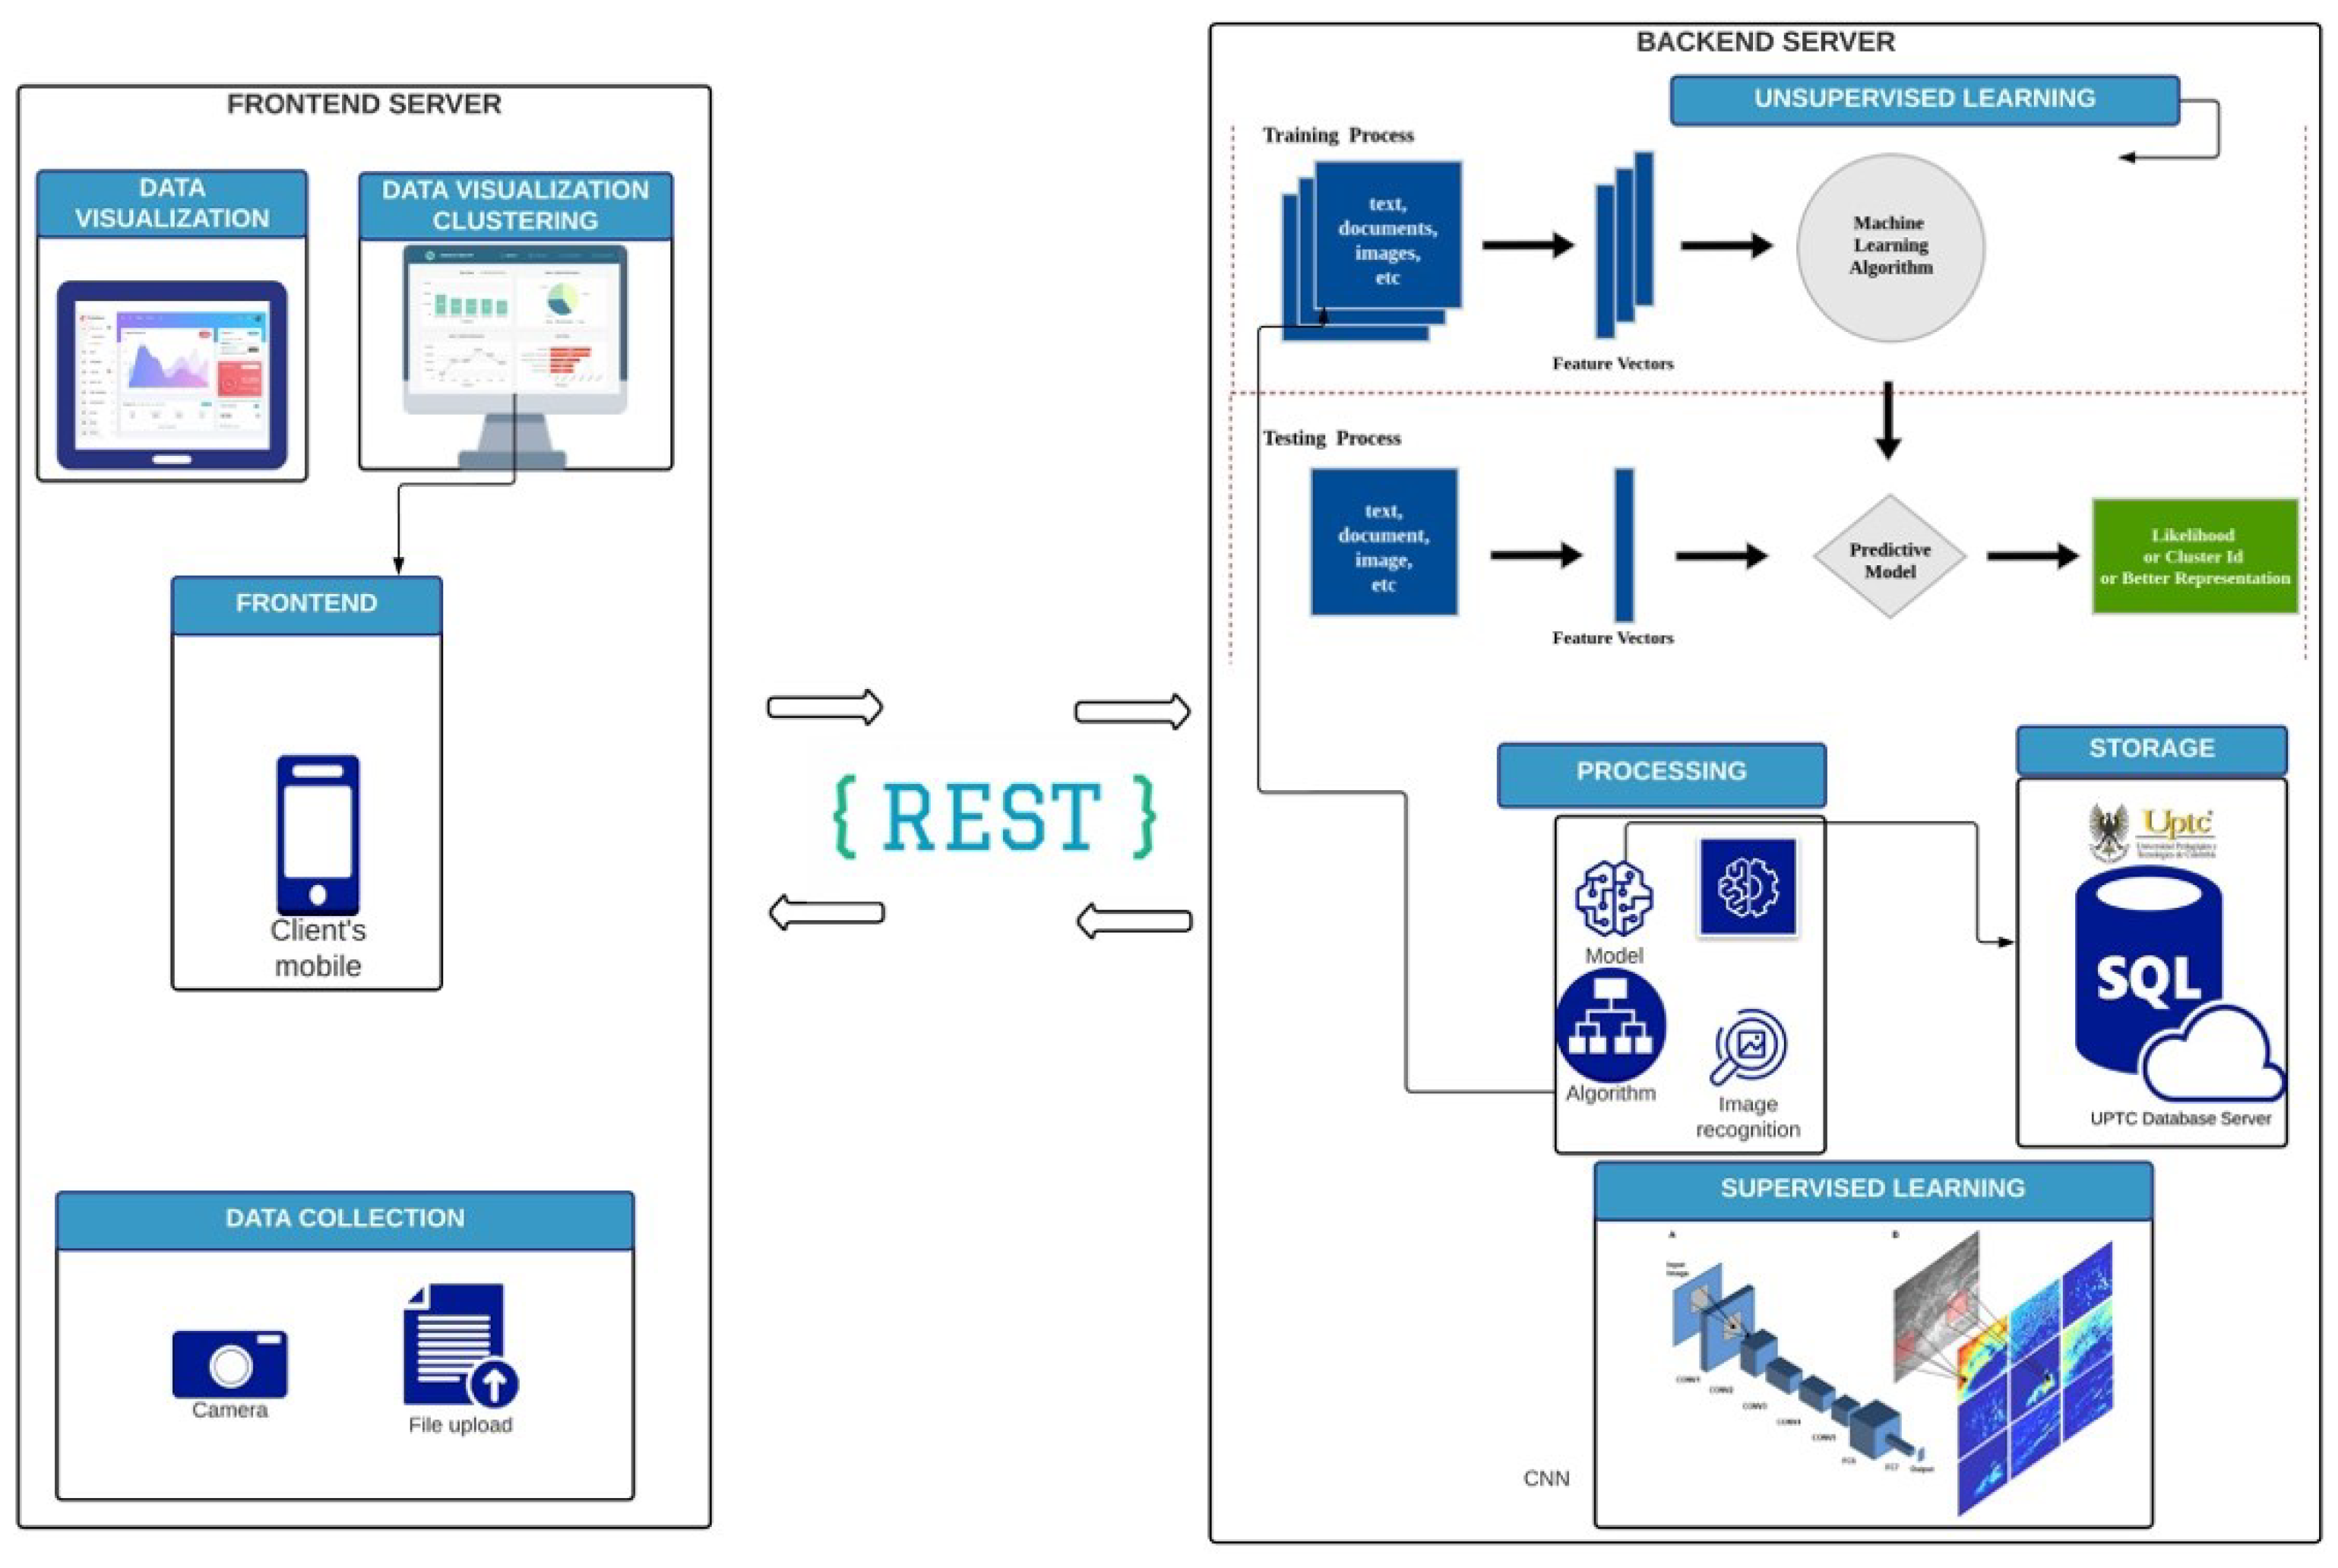
As illustrated in Figure 2, the distributed run-time system for the plant disease detector is organized with parts executing on mobile devices at the user side and on centralized servers at the cloud side. The layer in the left describes the Frontend server where the deep-learning model used in the system (i.e., CNN for Supervised learning) and the Intermediate Representation (IR) model run on the mobile device. The layer on the right illustrates the Backend focused user interface, which is developed as an Android app to enable system users to interact with the system conveniently.
The detection of potato late blight was divided into three stages: Data adquisition, implementation of linear kernel, and performance validation stage. In the training stages, firstly, we need to create data sets for training, preprocess the data sets for training and detection, then extract the features of contrast dissimilarity, homogeneity, energy, correlation, and ASM from the existing data sets. After extracting the features, we need to train CNN and SVM classifiers to obtain the final classifier.
In the linear kernel stage, firstly input the detection image; then, extract the characteristics of contrast, dissimilarity, homogeinity from the input image; then, detect whether the potato leaves suffer from late blight through the trained classifier; finally, obtain the detection results.
For the implementation and development of this work, the Python programming language was used, and the most used libraries for processing, feature extraction, classification, and visualization of results were OpenCV, Scikit-learn, TensorFlow, and Matplotlib. The first stage included the acquisition of the images of the potato leaves, then a pre-processing is performed on each of the images of the data set. This process includes the elimination of noise, scaling, and transformation of the color space so that the image would be cleaner, and in this way, the segmentation techniques will be applied to later extract the characteristics of the image. Finally, the SVM supervised learning models were trained using linear kernel and CNN with architecture created from scratch based on the AlexNet model to detect whether or not the leaf image is infected with late blight, and the validation process of the models was carried out and obtained to evaluate the performance of each classifier.
3.2. Generating Data Set
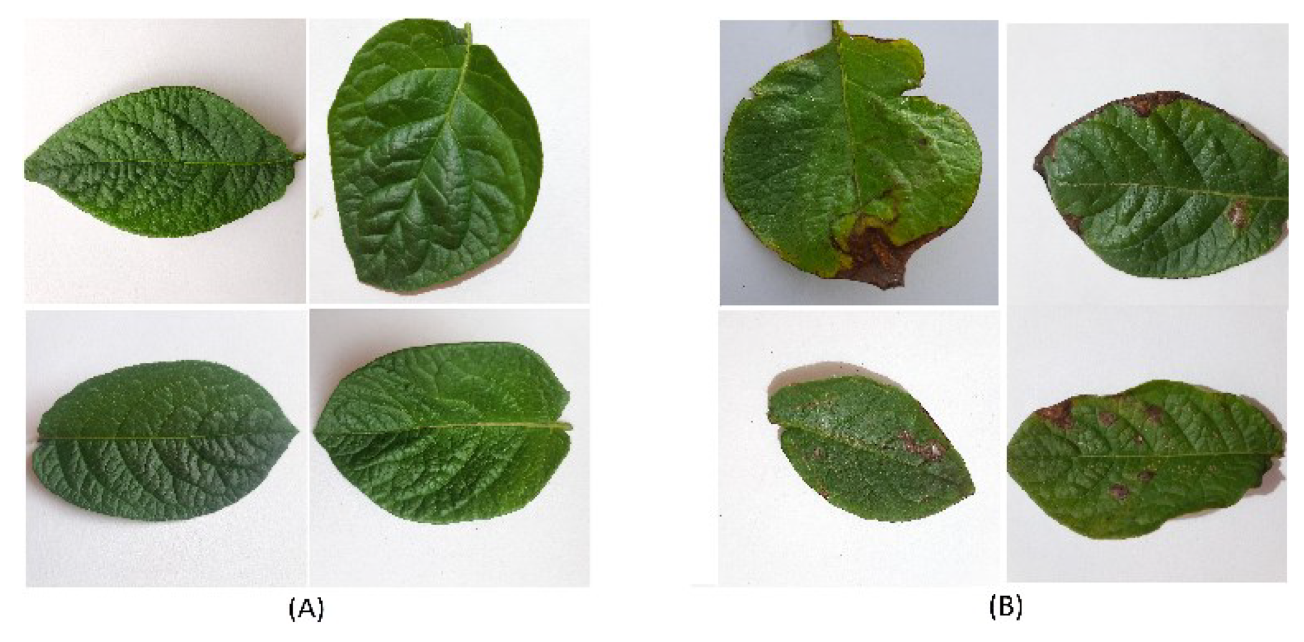
The structuring and conformation of the data set called “APPpotato” is a main contribution of this research, and in turn it is a contribution to the academic, scientific, and agricultural production communities. The images used to define the data set correspond to healthy leaves and those infected with late blight, which were captured in potato crops located in the municipalities of Aquitania and Tuta in the Boyacá state. These two categories have different altitudes, types of terrain, and different cultivation techniques. A mobile device with a 10 MP (megapixel) camera was used in a semi-controlled environment with a white background. The dataset is composed of 160 images of healthy and infected leaves with late blight and was used for training and classification. More details about these images are shown in Table 1. Within the data set, three different types of potatoes were analyzed, corresponding to the varieties: Tocarreña, Pastusa, and Amarilla with phenological stages between 2.5 and 6 months. Figure 3 shows sample images of healthy (A) and late blight-infected (B) potato leaves of the training data set.
3.3. Augmented Data Set
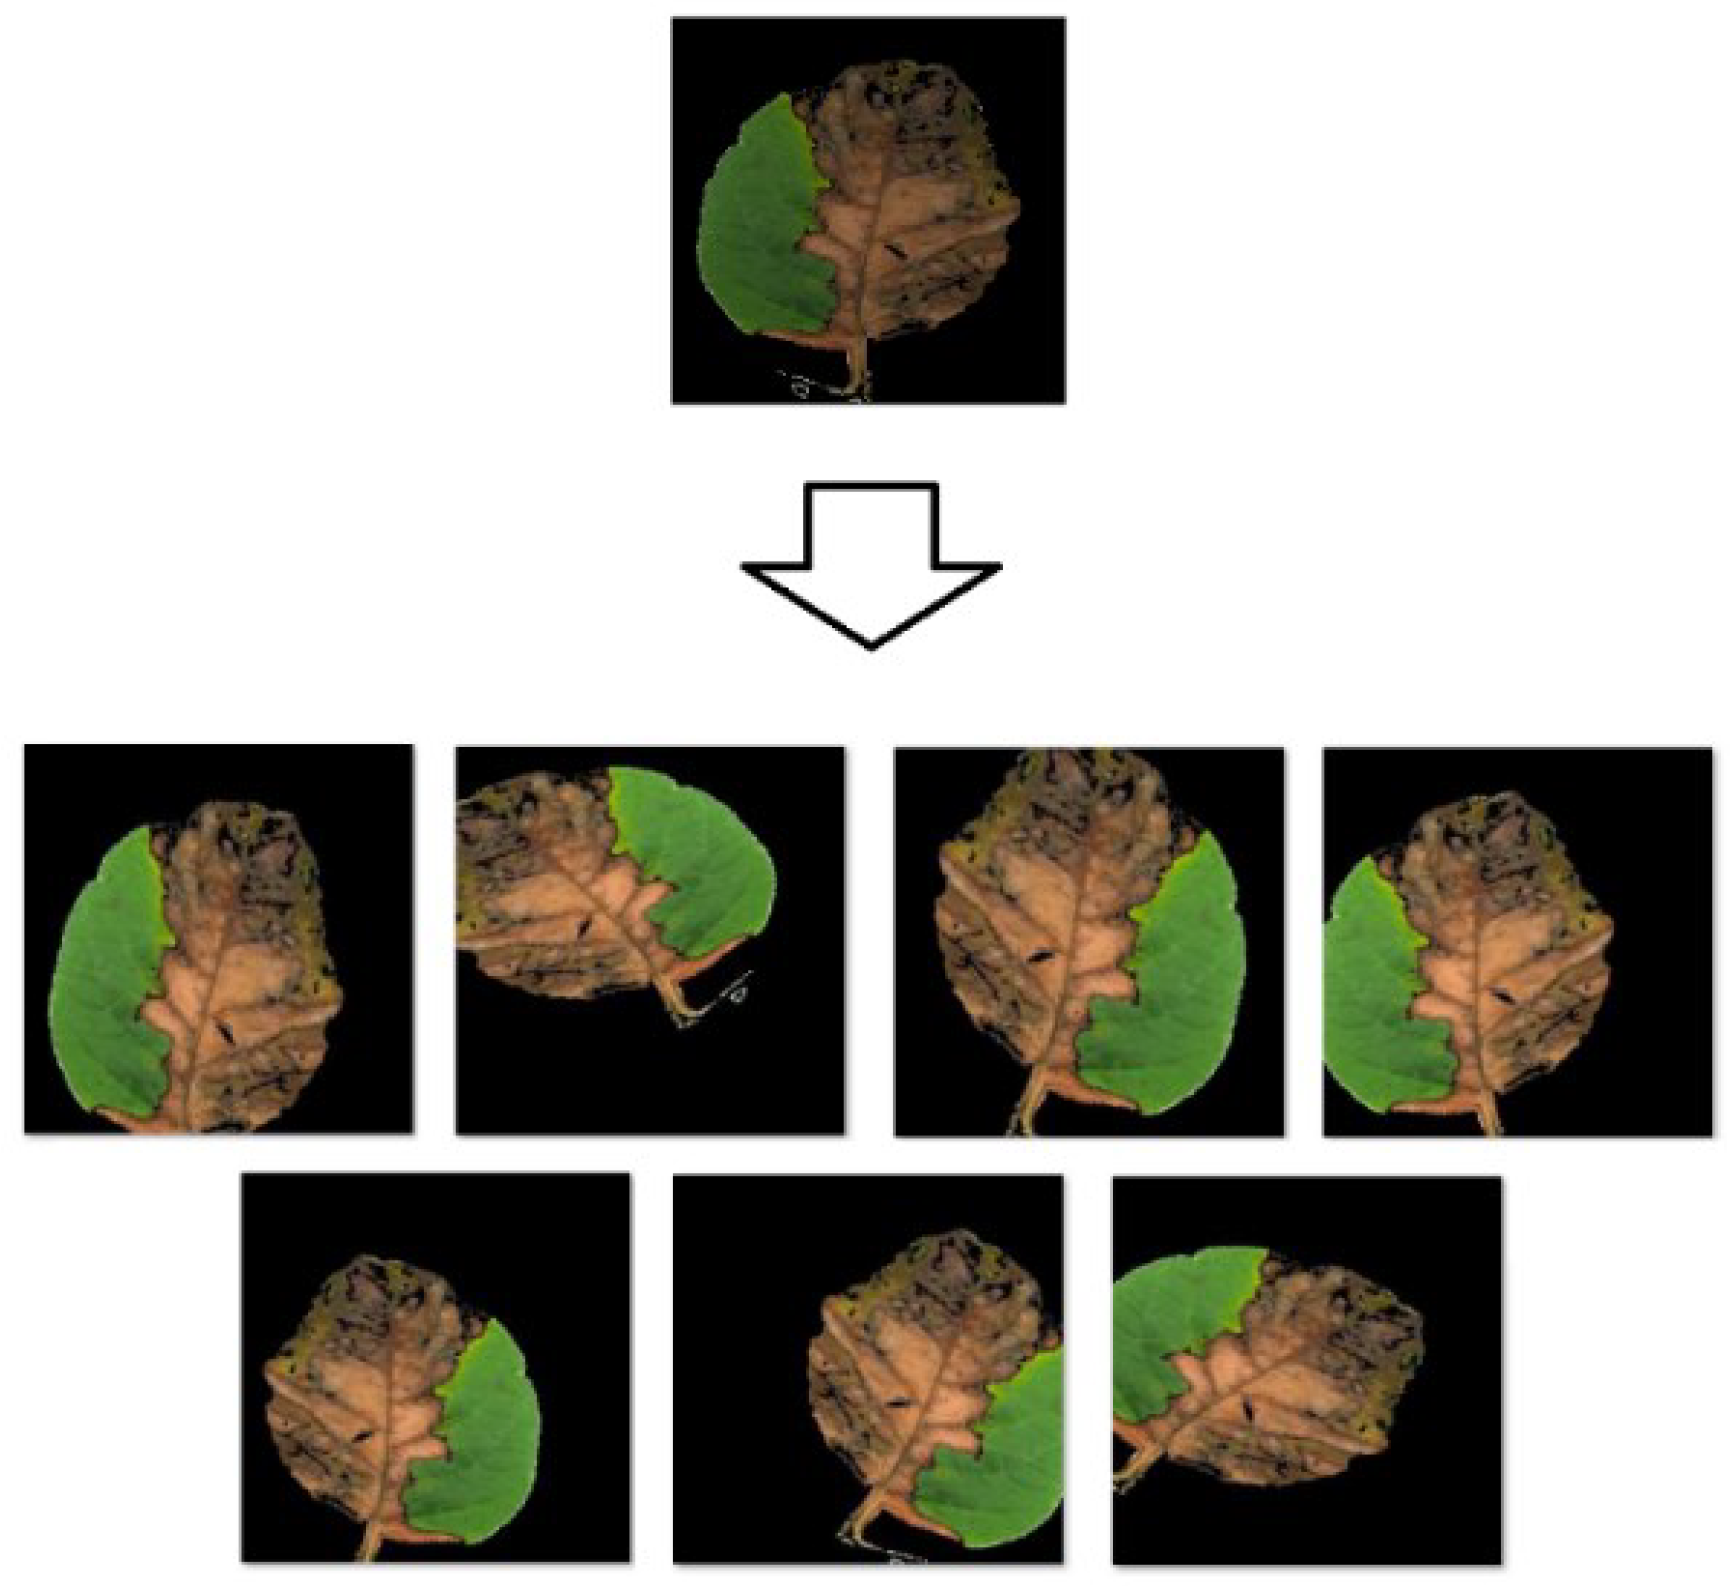
Some supervised learning algorithms require a large number of input data in training to achieve greater efficiency and accuracy in predictions. Therefore, a script was developed to augment the previously described original data set. As can be seen in Figure 4, random but realistic transformations were applied in the process; i.e., rotation of the image, change the size in the X and Y axes, apply magnification (zoom), and random flip the image horizontally. After applying the augmentation algorithm, to the original data set, the final result was the generation of 2240 images without background divided equally into healthy and infected leaves.
3.4. Image Pre-Processing
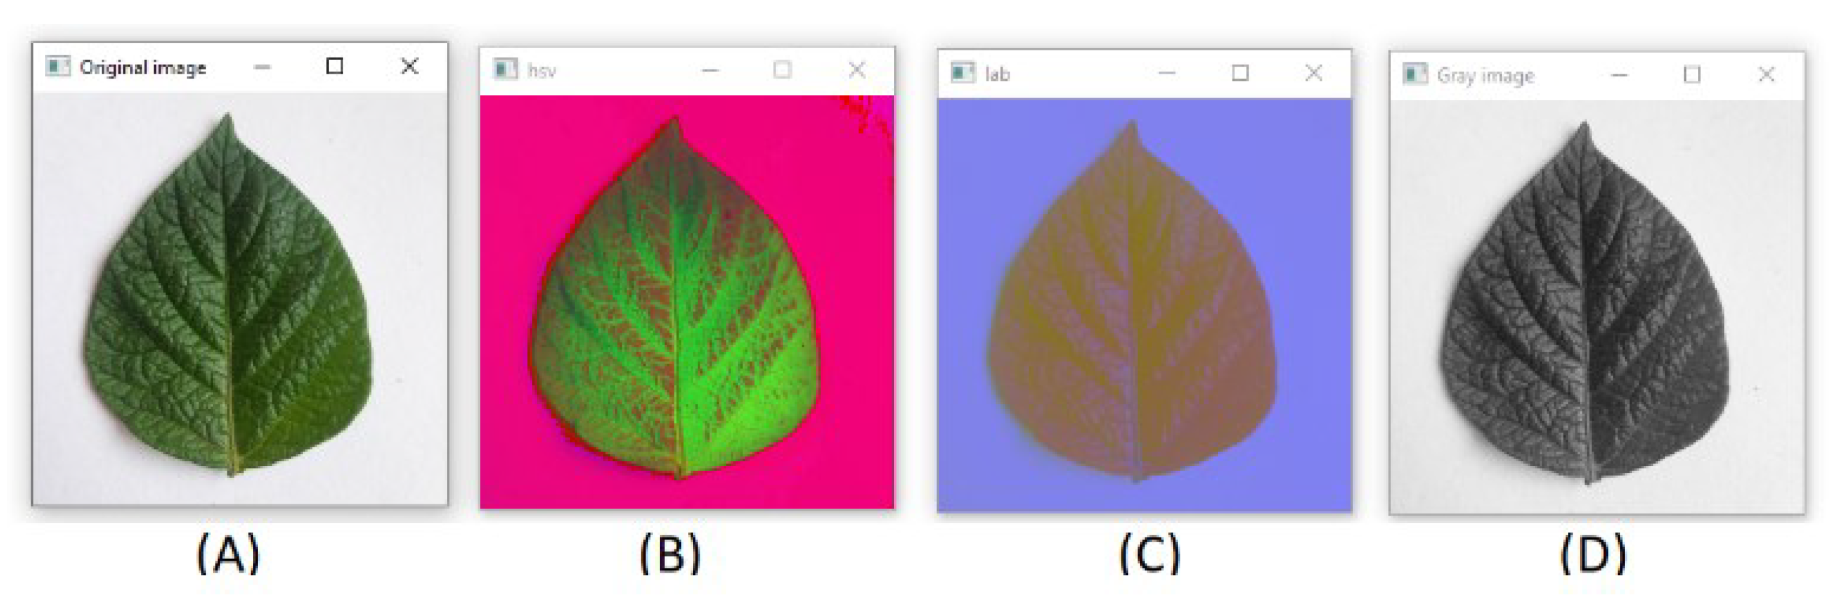
Image pre-processing includes two steps: (a) Image resizing, smoothing, and transformation from RGB (red, green, blue) color space to HSV (hue, saturation, value) spaces and (b) LAB three-dimensional analysis (brightness, red to green, blue to yellow) and its gray scale. The process of rescaling the image to a smaller dimension was carried out to optimize the computational time required for the treatment and extraction of features. Most of the images obtained have a dimension of 2992 × 2992 pixels; after going through the resizing process, the output images have a size of 256 × 256 pixels. The smoothing or blurring of an image is achieved by convolving the image with a filter or kernel to eliminate high-frequency content such as noise. Having the initial image in the RGB color space, we proceed to transform the color space to HSV, LAB, and gray scale. Figure 5 shows: the image (Figure 5A) corresponding to the photograph in the original RGB color space, it is captured from the crop. The image (Figure 5B) corresponding to the color transformation to the HSV model, The HSV color space has three components: hue, saturation and value. ‘Value’ is sometimes substituted with ‘brightness’ and then it is known as HSB. The image (Figure 5C) corresponding to the transformation of color to the LAB model, is based on the human perception of color. The color mode consists of one channel for Lightness (L) and two channels for Color (Figure 5A,B). And finally, the image (Figure 5D) that corresponds to the grayscale image, grayscale images are the those images where color information is missing and all colour information is converted into gray scale format.
3.5. Segmentation
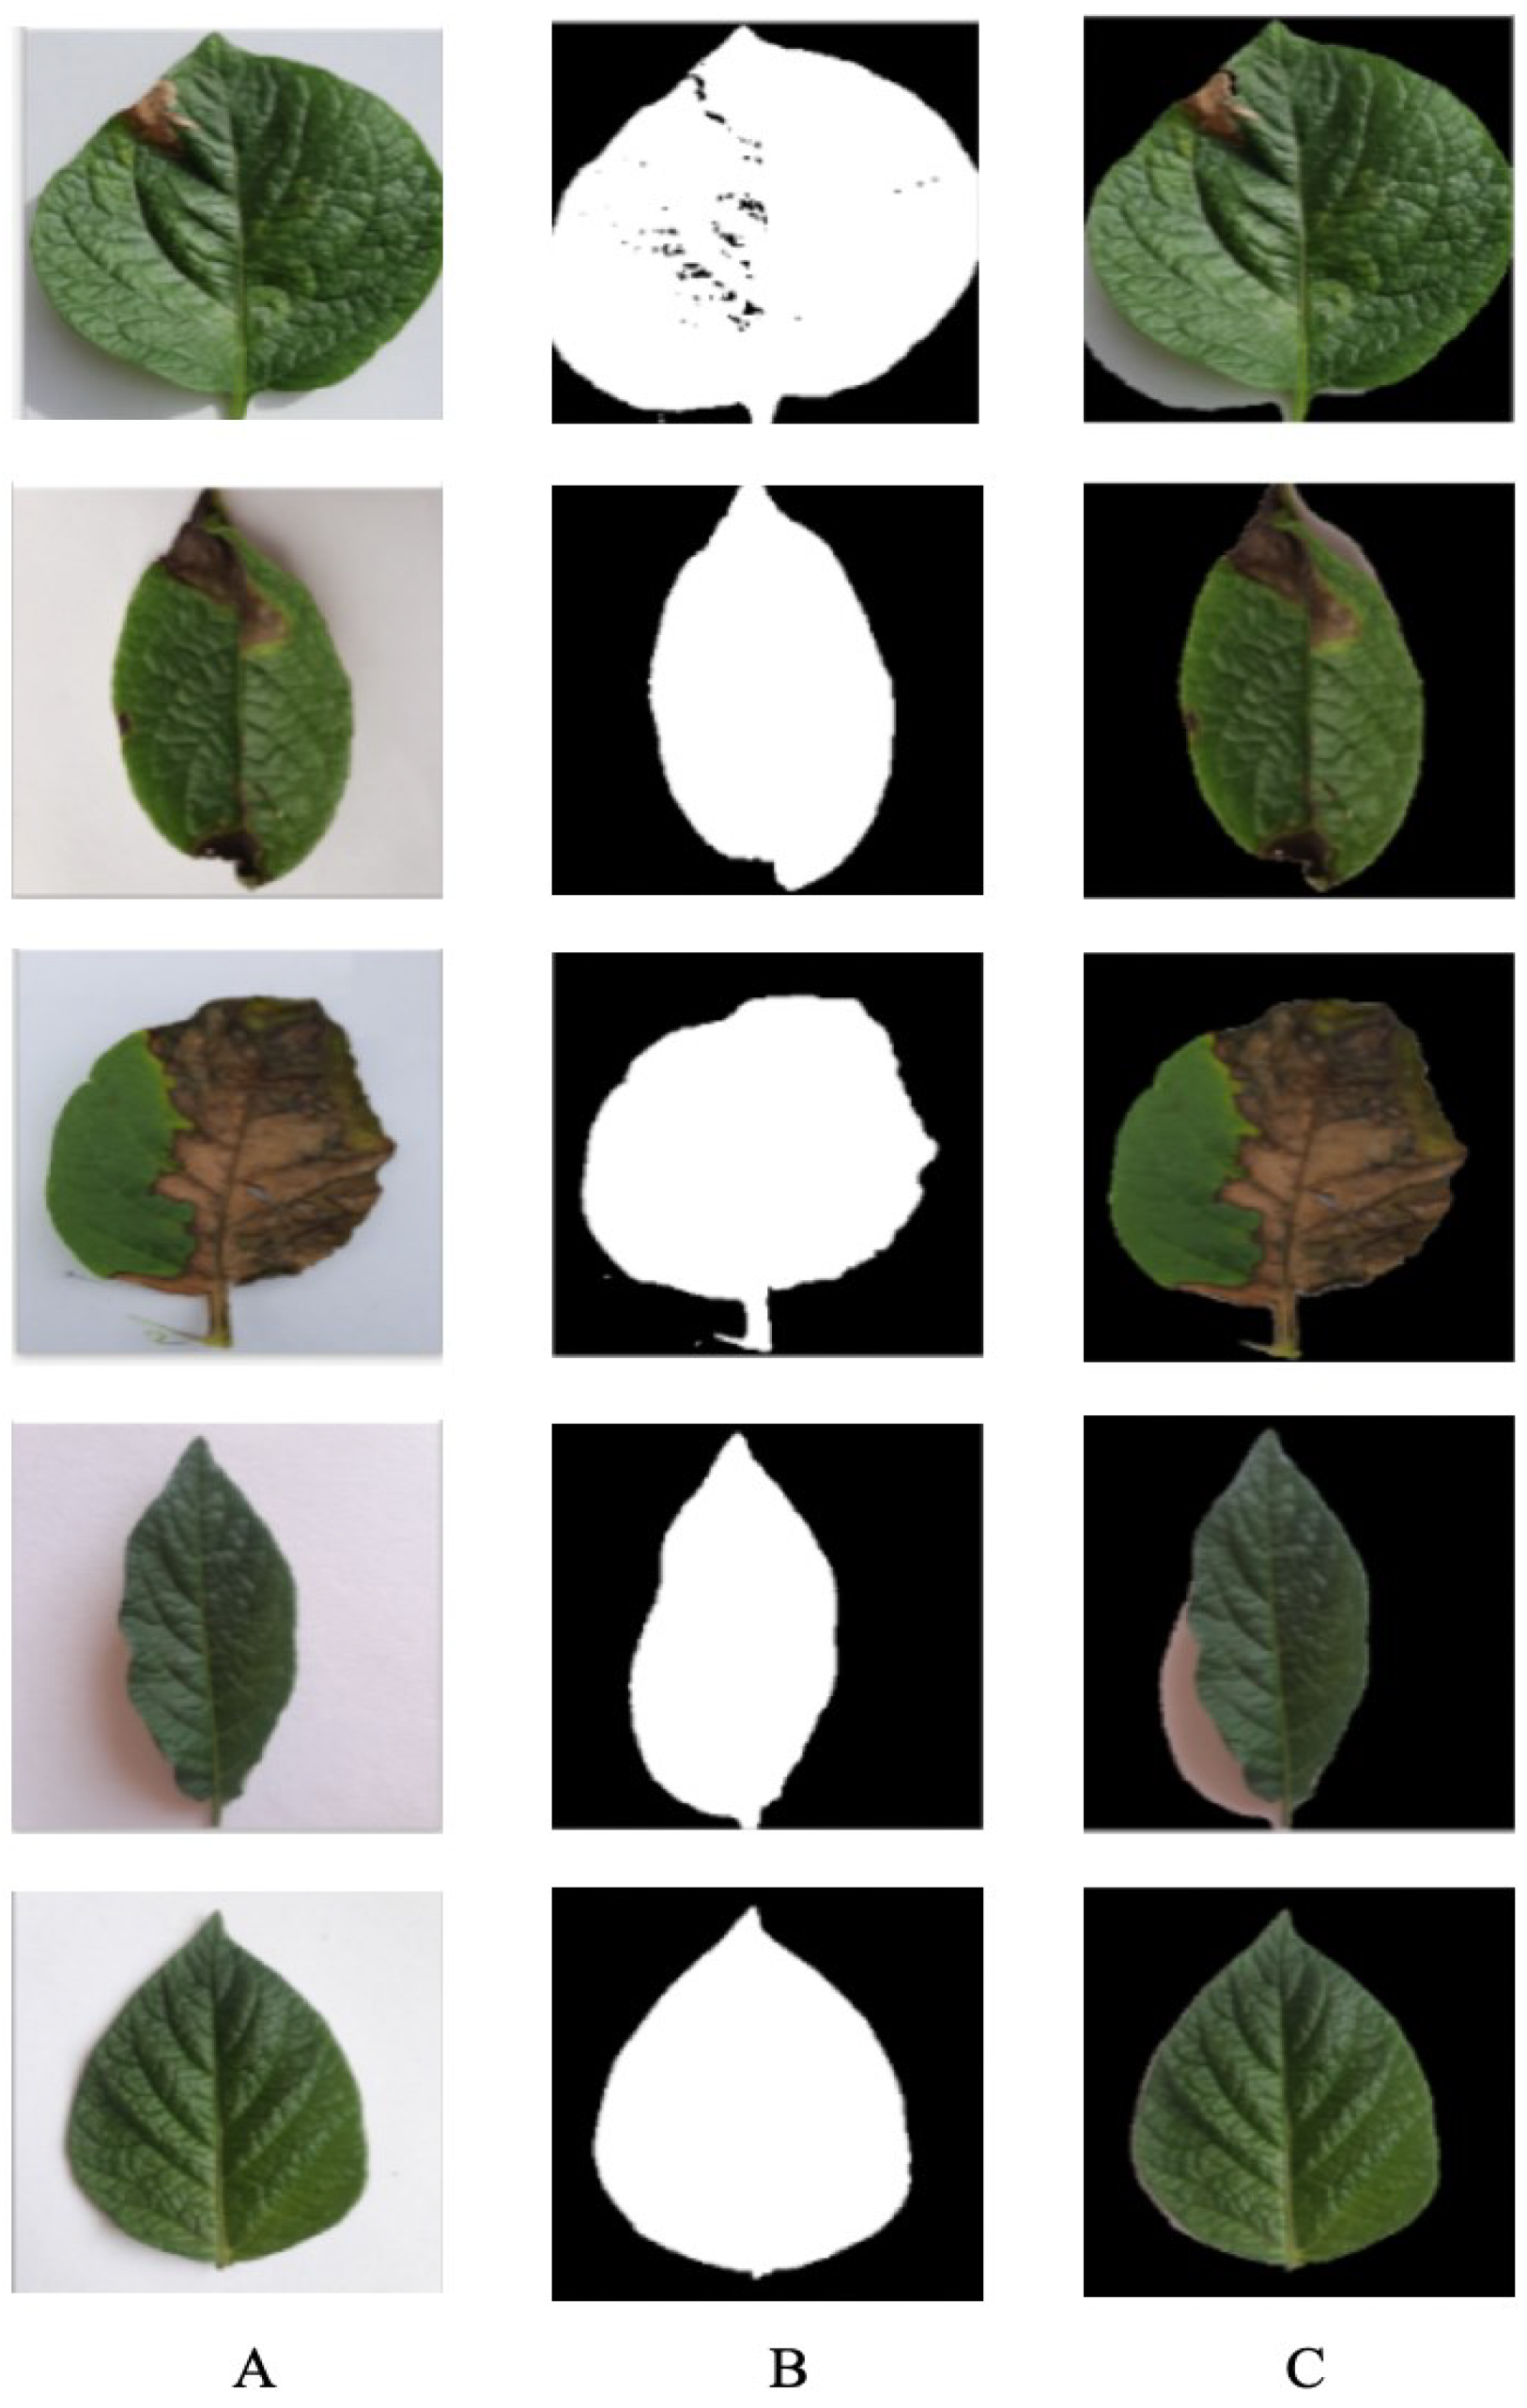
The image segmentation aims to separate the points of interest with better precision to obtain descriptive data of the image. One of the methods used to separate the leaf from the background of the image was through the thresholding algorithm. In this process, the grayscale image is transformed into another with only two colors (black and white). The optimal threshold in this segmentation procedure is obtained with the Otsu method [12]. This threshold value is compared to the reference value of each pixel, and it is changed to create the segmented images used in this analysis. Thus, segmented images were obtained in two levels of gray: white (leaf) and black (background). Figure 6 shows the application results of the segmentation algorithm using the thresholding method. Column (Figure 6A) contains the original images, column (Figure 6B) contains the binary images obtained after thresholding, and finally, column (Figure 6C), where the binary image is superimposed on the original to remove the background.
The other method used to separate the leaf from the background was the mask method, where the original image is initially passed to the HSV color space. In this method, the channel (H) models the type of color which facilitates the processing and segmentation of objects based on this property. Subsequently, the masks that will fulfill the filter function are defined to separate the colors close to green and brown, corresponding to the leaf and the stain, respectively, from the background of the image.
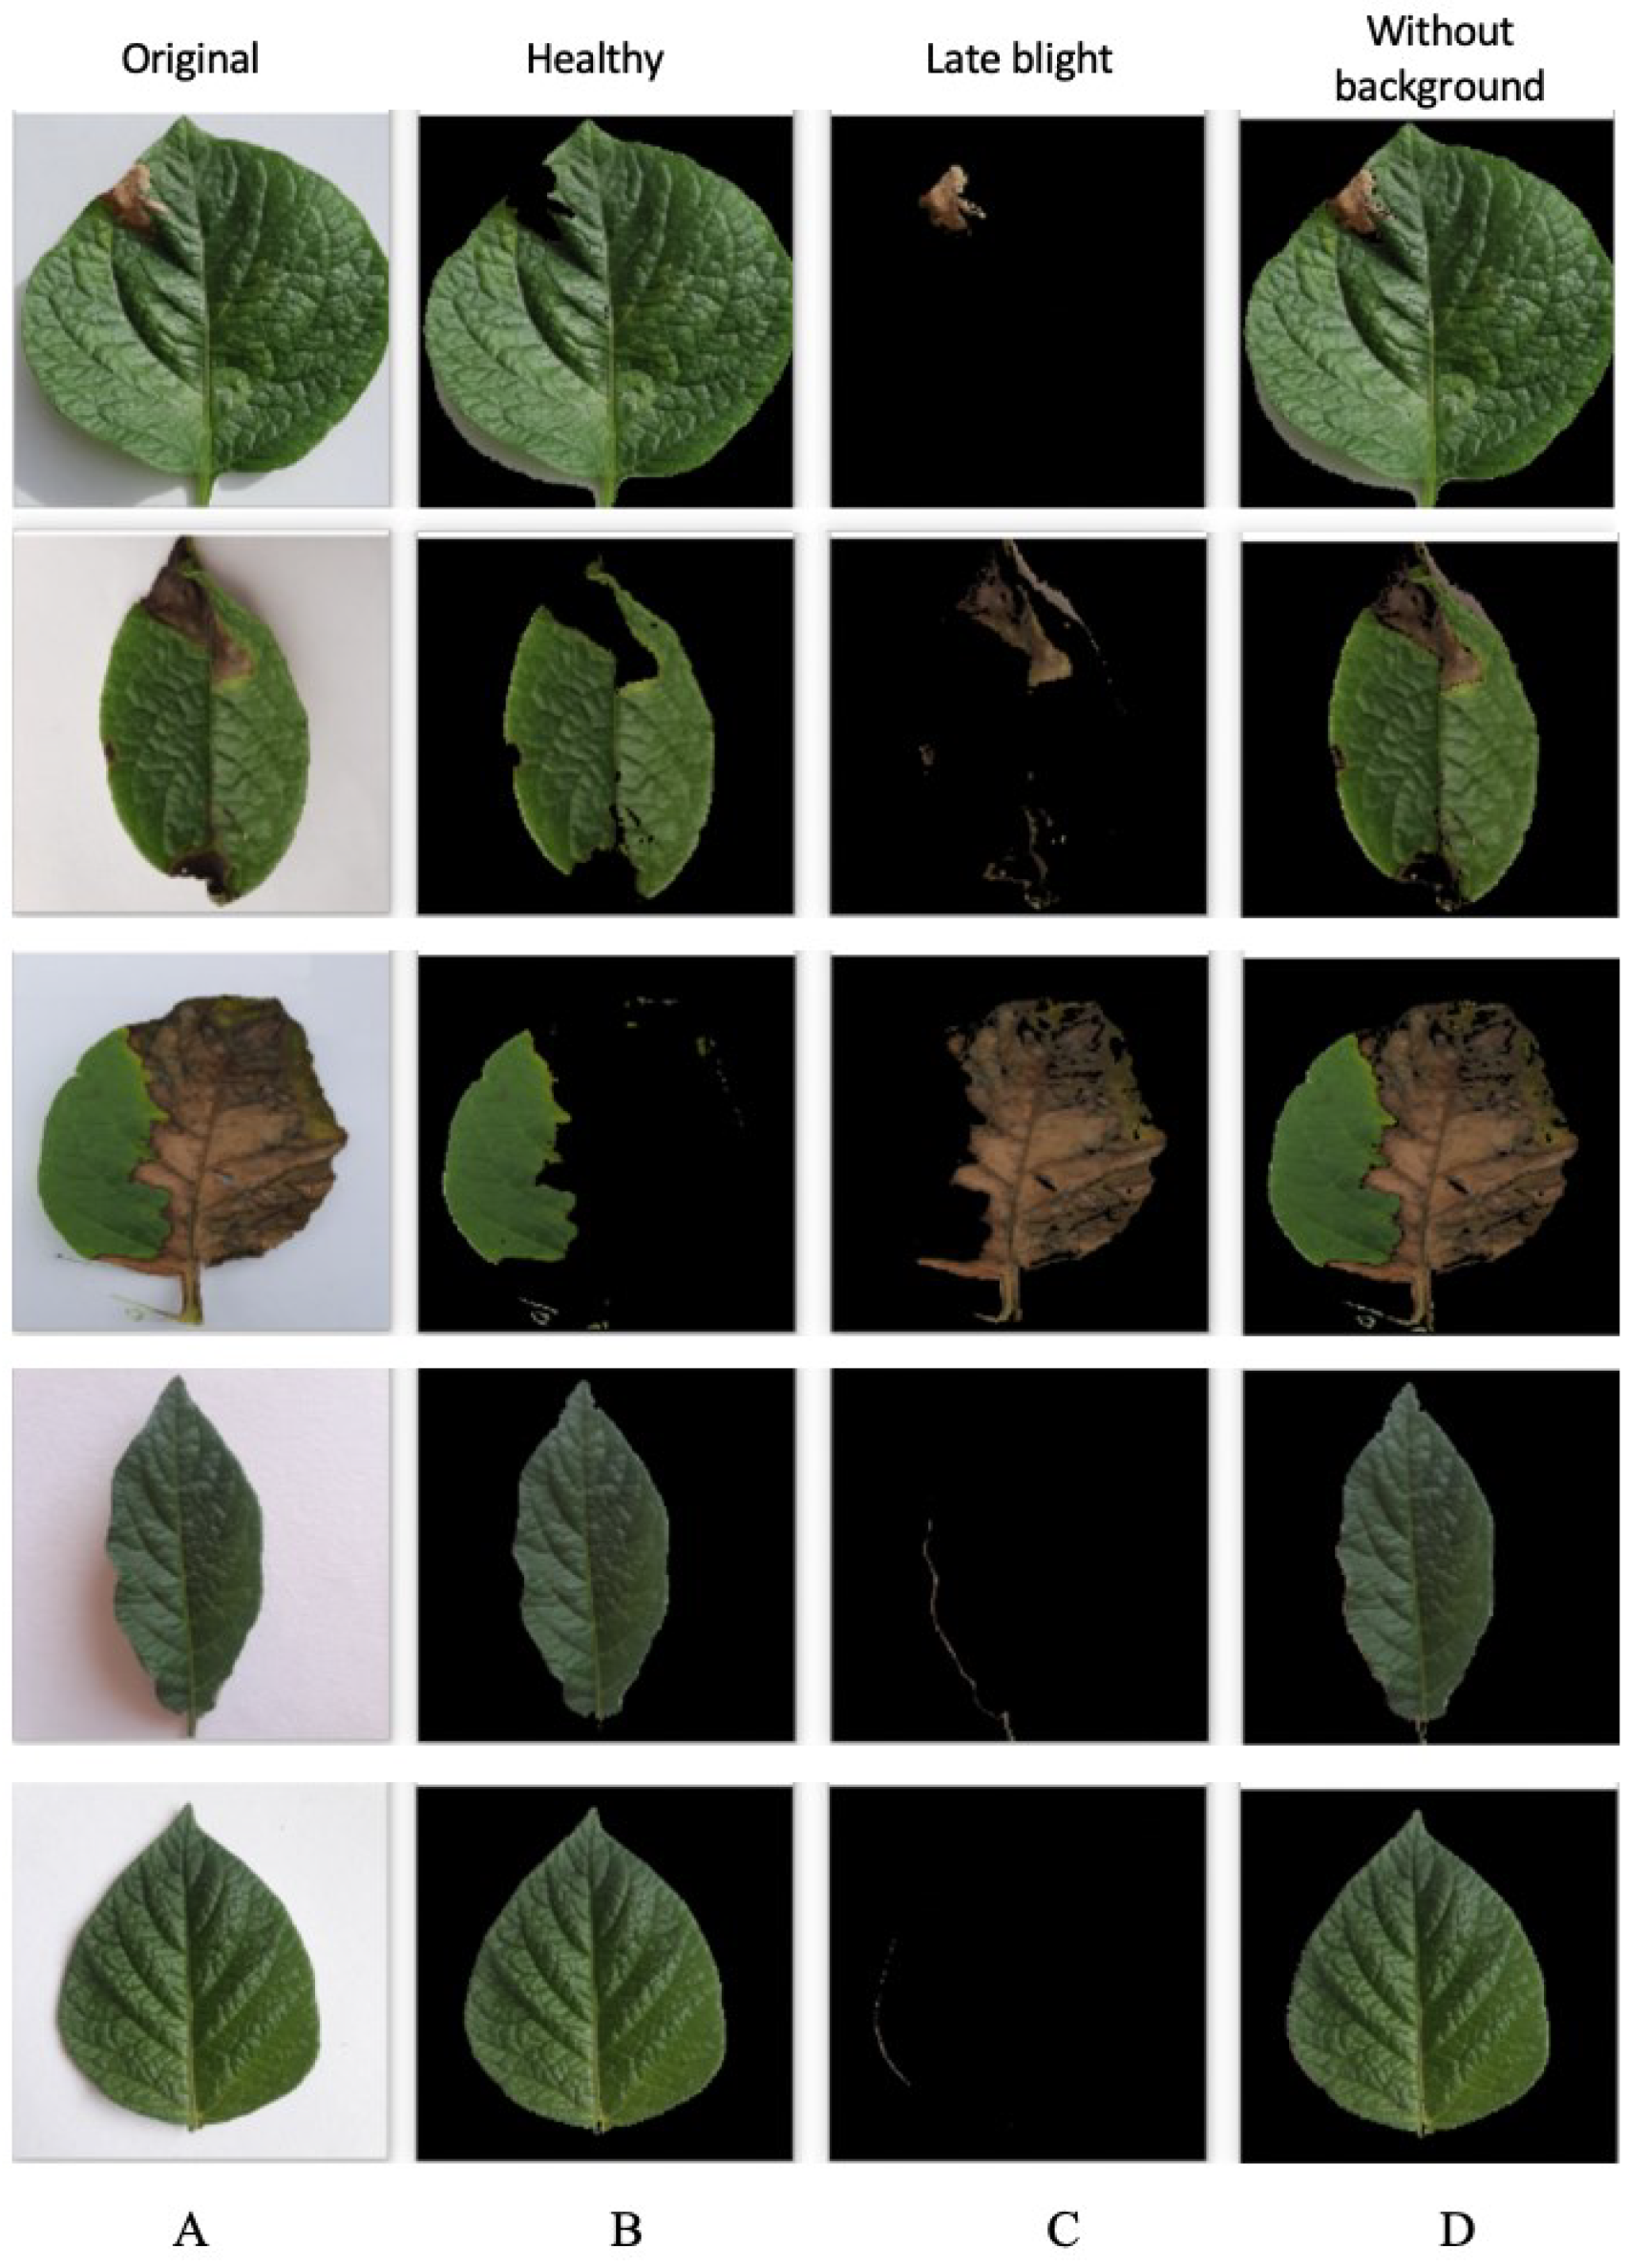
Figure 7 shows the results after applying the range thresholding method. The column (Figure 7A) shows the original image without being processed, it is captured directly from the crop. The column (Figure 7B) shows the superposition of the green mask on the original image, dephasing is wavelength dependent and the optimal behavior is reached for only one wavelength. The column (Figure 7C) shows the superposition of the coffee mask on the original image with late blight. Finally, the column (Figure 7D) shows the union of the two masks and their superposition on the original image, guaranteeing that the parts that do not correspond to the regions of the sheet are eliminated without background.
3.6. Feature Extraction
Feature extraction is based on identifying features in the image, region, or boundary and assigning quantitative and qualitative attributes to these detected features [13]. For this investigation, feature extraction focuses on identifying patterns based on the RGB and HSV color models and texture features based on the GLCM grey level co-occurrence matrix.
To carry out the extraction of color characteristics, initially, the color spaces RGB and HSV models are selected in this investigation. Subsequently, each model has been divided by the channels that compose it: red (R), green (G), and blue (B) for the case of RGB and value of brightness (V), tone (H), and saturation (S) for the case of HSV. Finally, first order statistics calculation is performed, including mean, standard deviation, variance, and range applied to each component of RGB and HSV. As a result of this feature extraction, a total of 24 color features are obtained.
- Contrast: It is the amount of local variations in the shades of grey of the image. If the contrast is higher, there are different shades of gray and the feature is defined as:
- Dissimilarity: Similar to contrast. It is high when the region has a high contrast; the metric can be defined as:
- Homogeneity: Measure of similarity in the image; a value of 0 indicates a high similarity. The measure can be expressed in the form:
- ASM (Angular Second Moment): Uniformity; if this is greater, there are fewer variations in the shades of gray. The metric can be defined as:
- Correlation: Dependence of the shades of gray in the image; if it is 0, there is no linear correlation between the levels. The metric can be defined as:
The texture feature extraction is based on the computation of the gray level co-occurrence matrix and the GLCM texture properties using Equations (1)–(5). A total of twenty-four features are obtained. An estimate of the image properties related to second-order statistics and based on the gray level co-occurrence matrix (GLCM) is shown in Table 2.
A dimensionality reduction technique called the principal component analysis (PCA) method was used to reduce the previously mentioned characteristics. This statistical method simplifies the complexity of sample spaces with many dimensions while preserving their information. The algorithm projects the original color and texture feature data that is 48-dimensional into just two dimensions. The two new components corresponding to the two main dimensions of the variation are obtained as output.
3.7. Classification
Classification is ideal for identifying which set certain input data belongs to. In this investigation, the classification task was used to determine whether or not a potato leaf is infected with late blight. From the training of the SVM supervised learning classification models using linear kernel and CNN with the adaptation of the AlexNet architecture, the performance of each algorithm is compared when training it on the same data set.
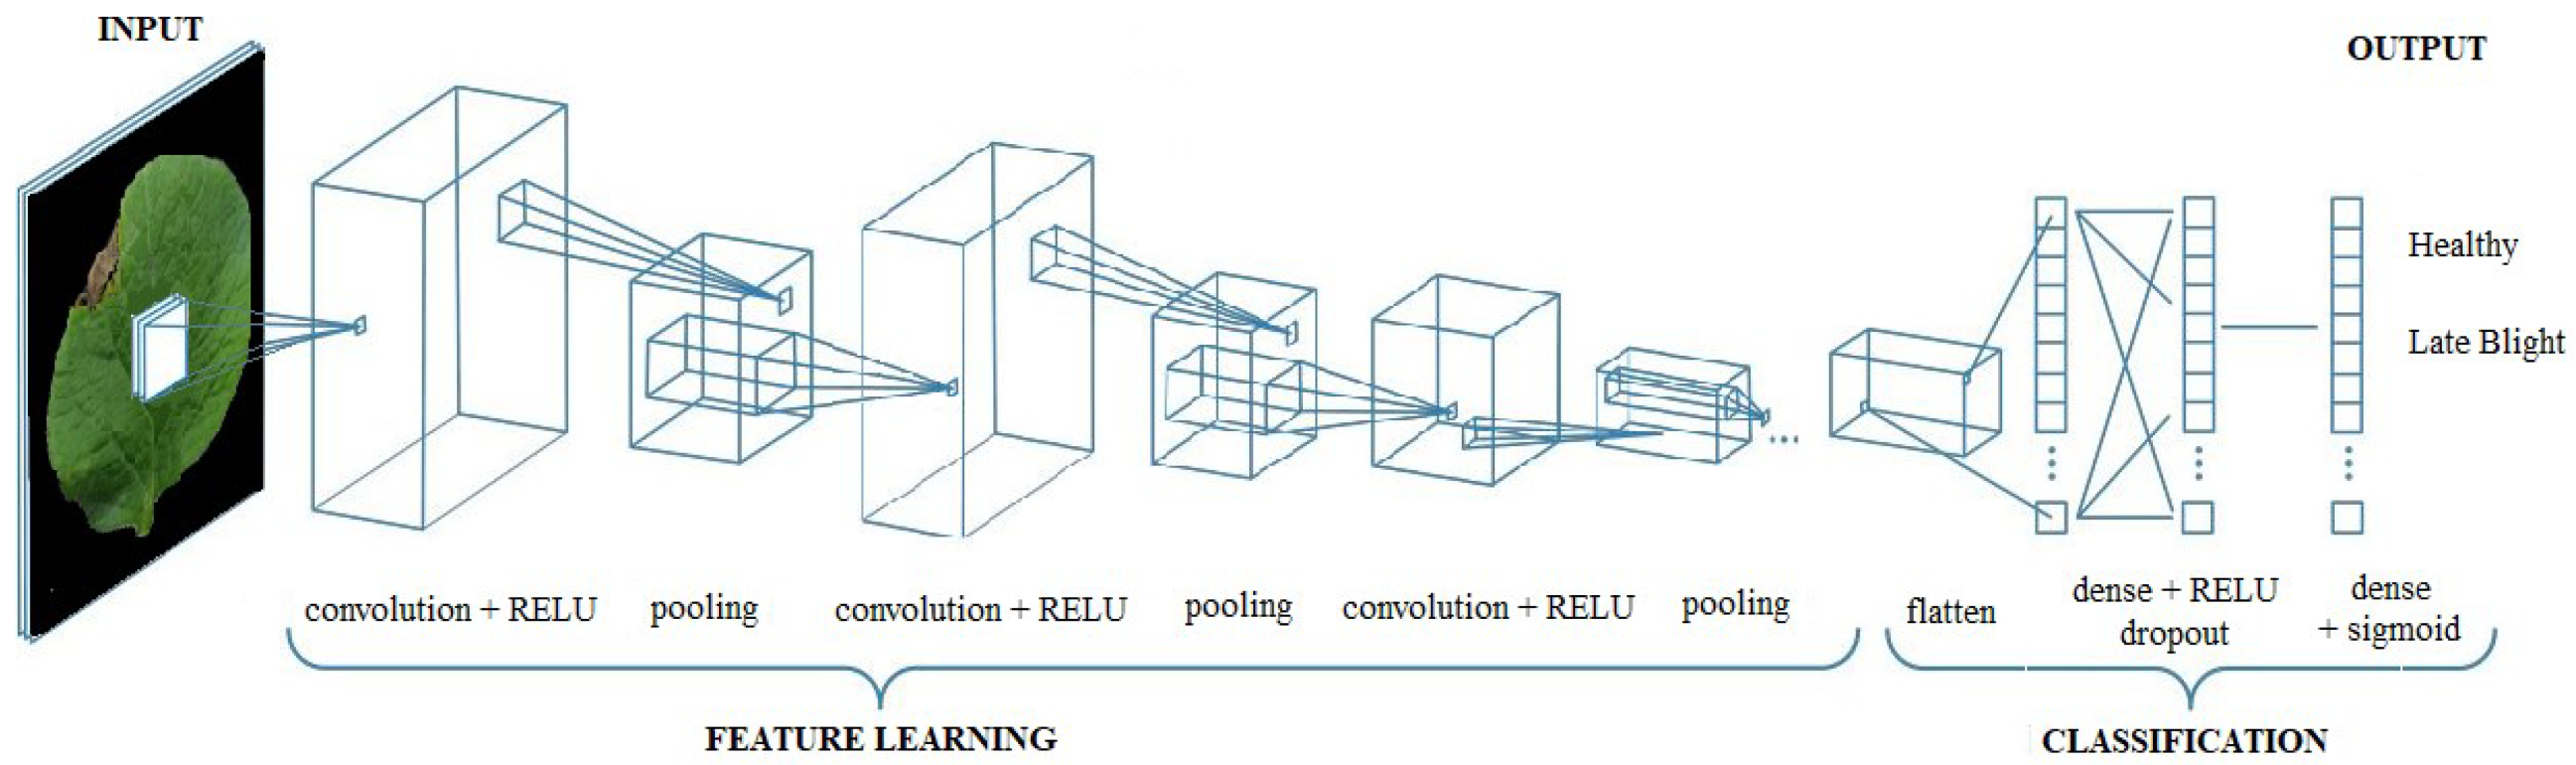
The trained SVM model is a supervised learning algorithm developed with a linear kernel; that is, a separation hyperplane is defined as a linear function that can separate the data set into two classes corresponding to the healthy and infected states. In Figure 8, the architecture used for the CNN models is shown; they are made up of three convolutional layers with Relu activation functions and three maximum pooling layers, a flattening of all layers, a dense layer with Relu activation, a dropout, and finally the classification layer corresponding to a dense layer with special sigmoidal activation for binary classification.
3.8. Validation
The validation of the classification models allows evaluating the performance of the models obtained from Support Vector Machines (SVM) and CNN. The accuracy, precision, sensitivity, and specificity metrics obtained from a confusion matrix were used. Likewise, the receiver operating characteristic (ROC) curve was analyzed together with the calculation of the area under the ROC curve (AUC).
4. Results and Discussion
4.1. App Design
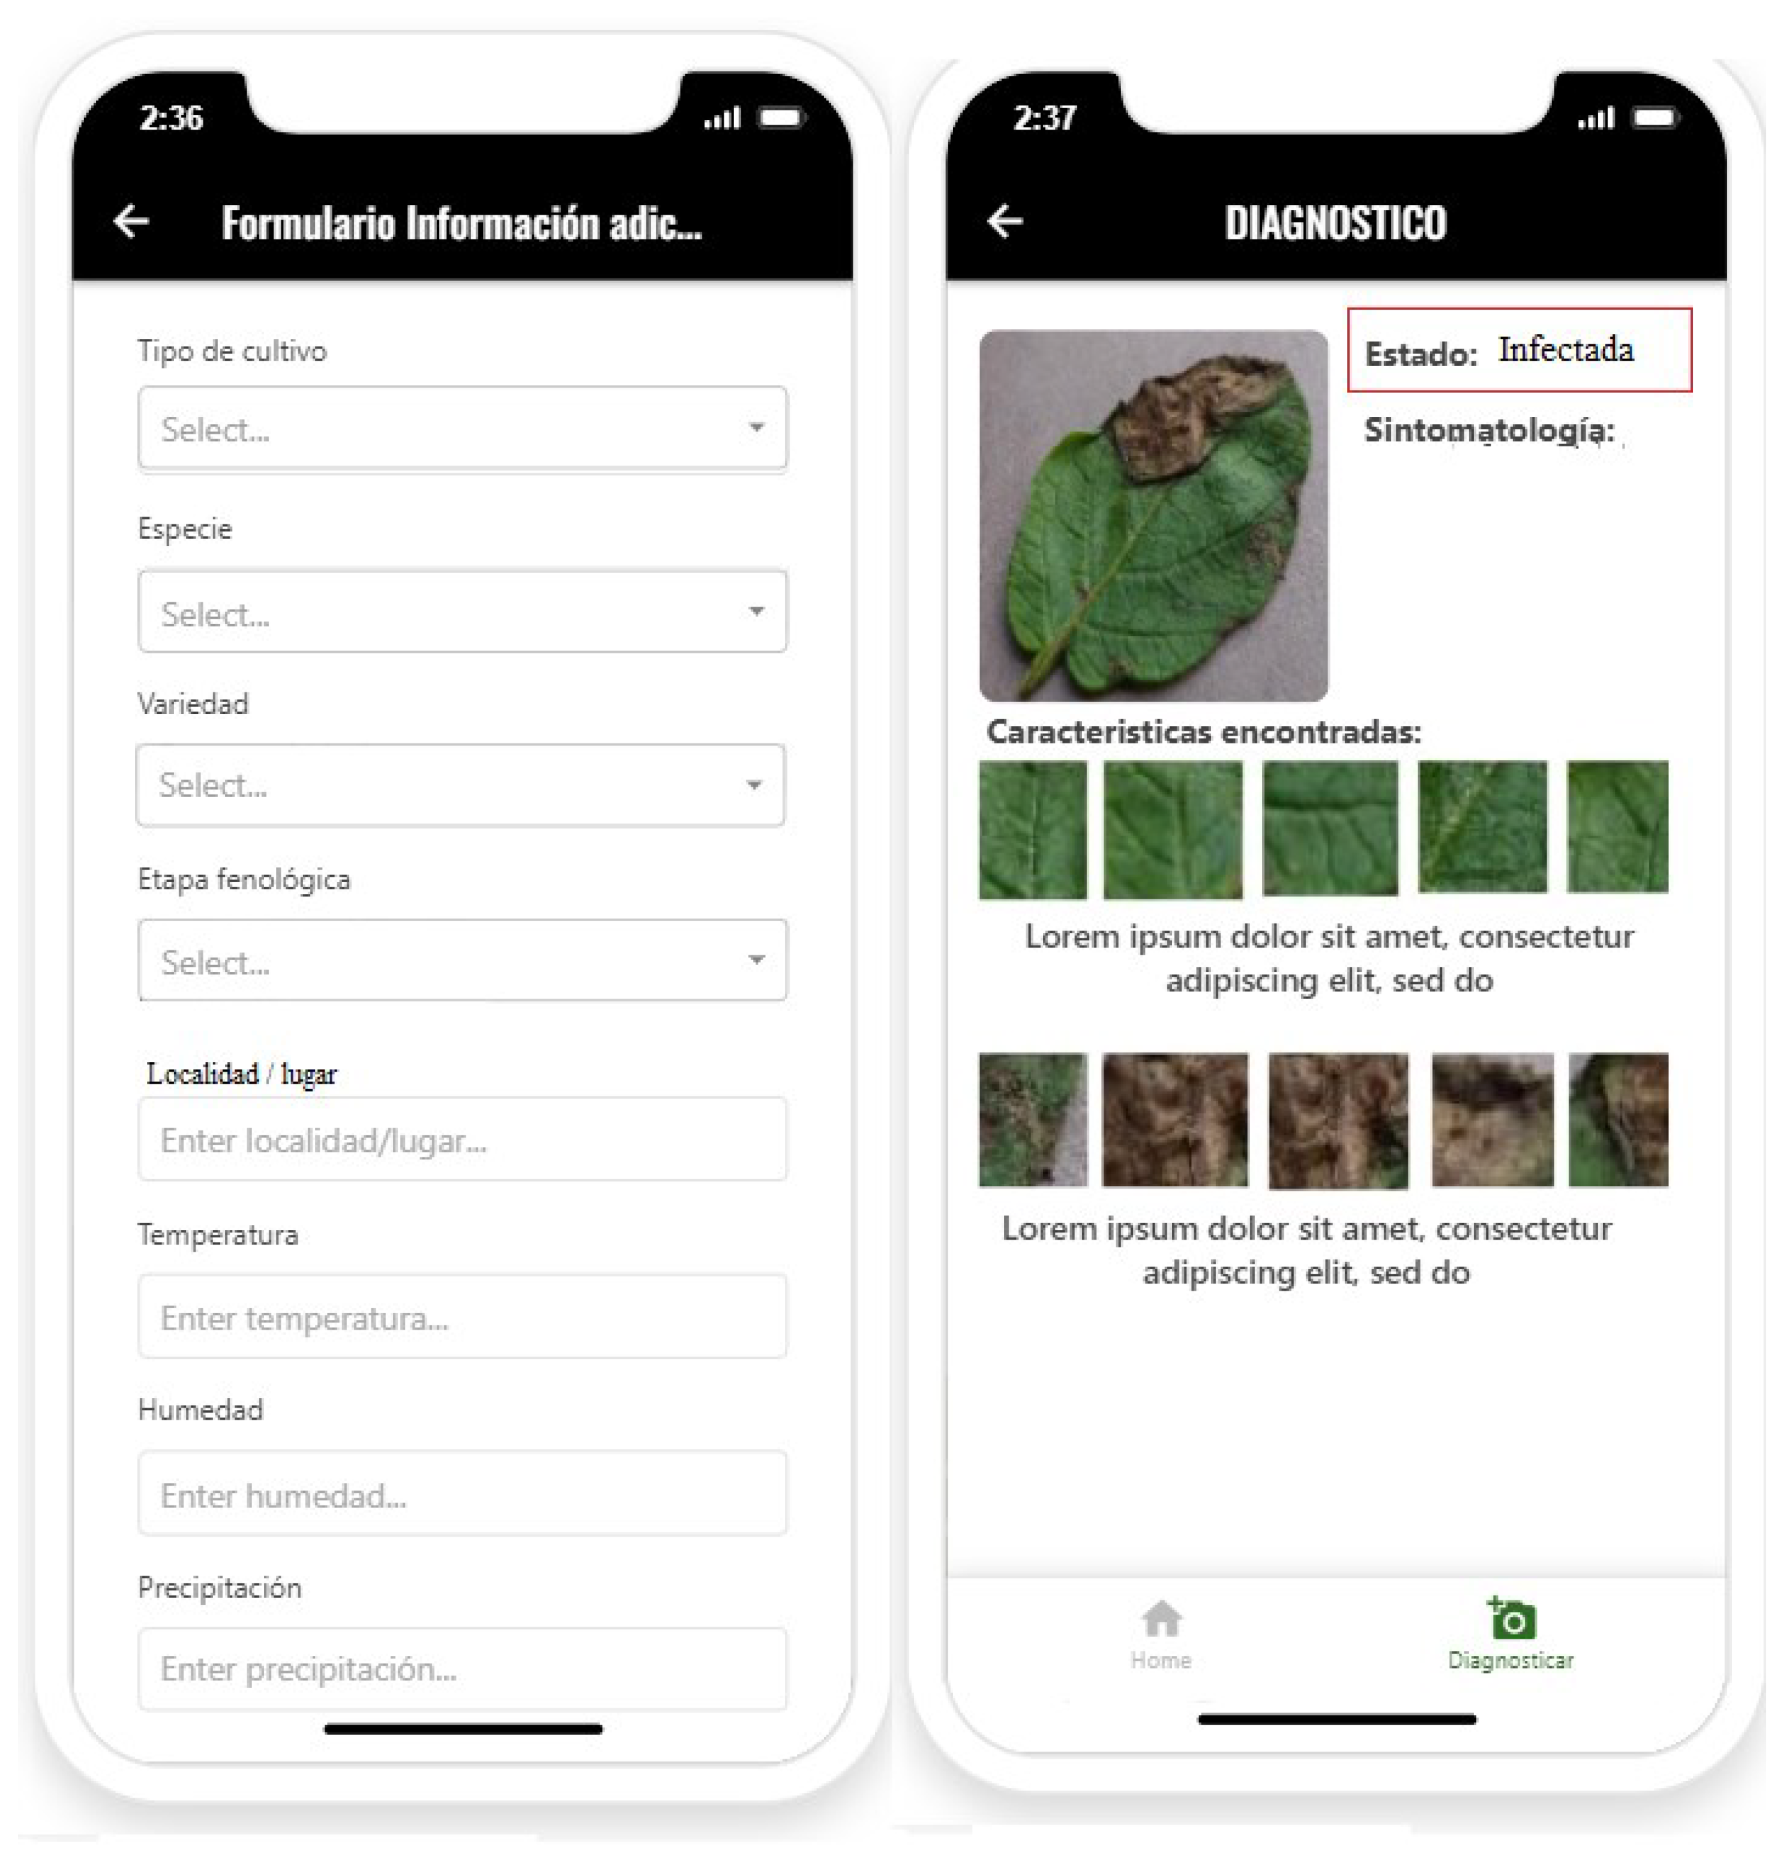
For the visualization of the predictions of the classification models and their use in a real environment, the design of a prototype for a mobile application was proposed that allows the visualization and analysis of the data obtained. Figure 9 shows the prototypes so that a user can diagnose a potato leaf from a mobile device and identify whether or not it is infected with late blight. Initially, the user fills out a form with information about the crop from which the sample is being taken, in order to collect data for later reading and analysis. Within the information requested from the user is the type of crop, the phenological stage, the variety, the species, and data on the locality or place where the crop is located, such as temperature, humidity, and average rainfall. From a capture or upload of an image, the application will show the result based on the supervised model integrated in the application.
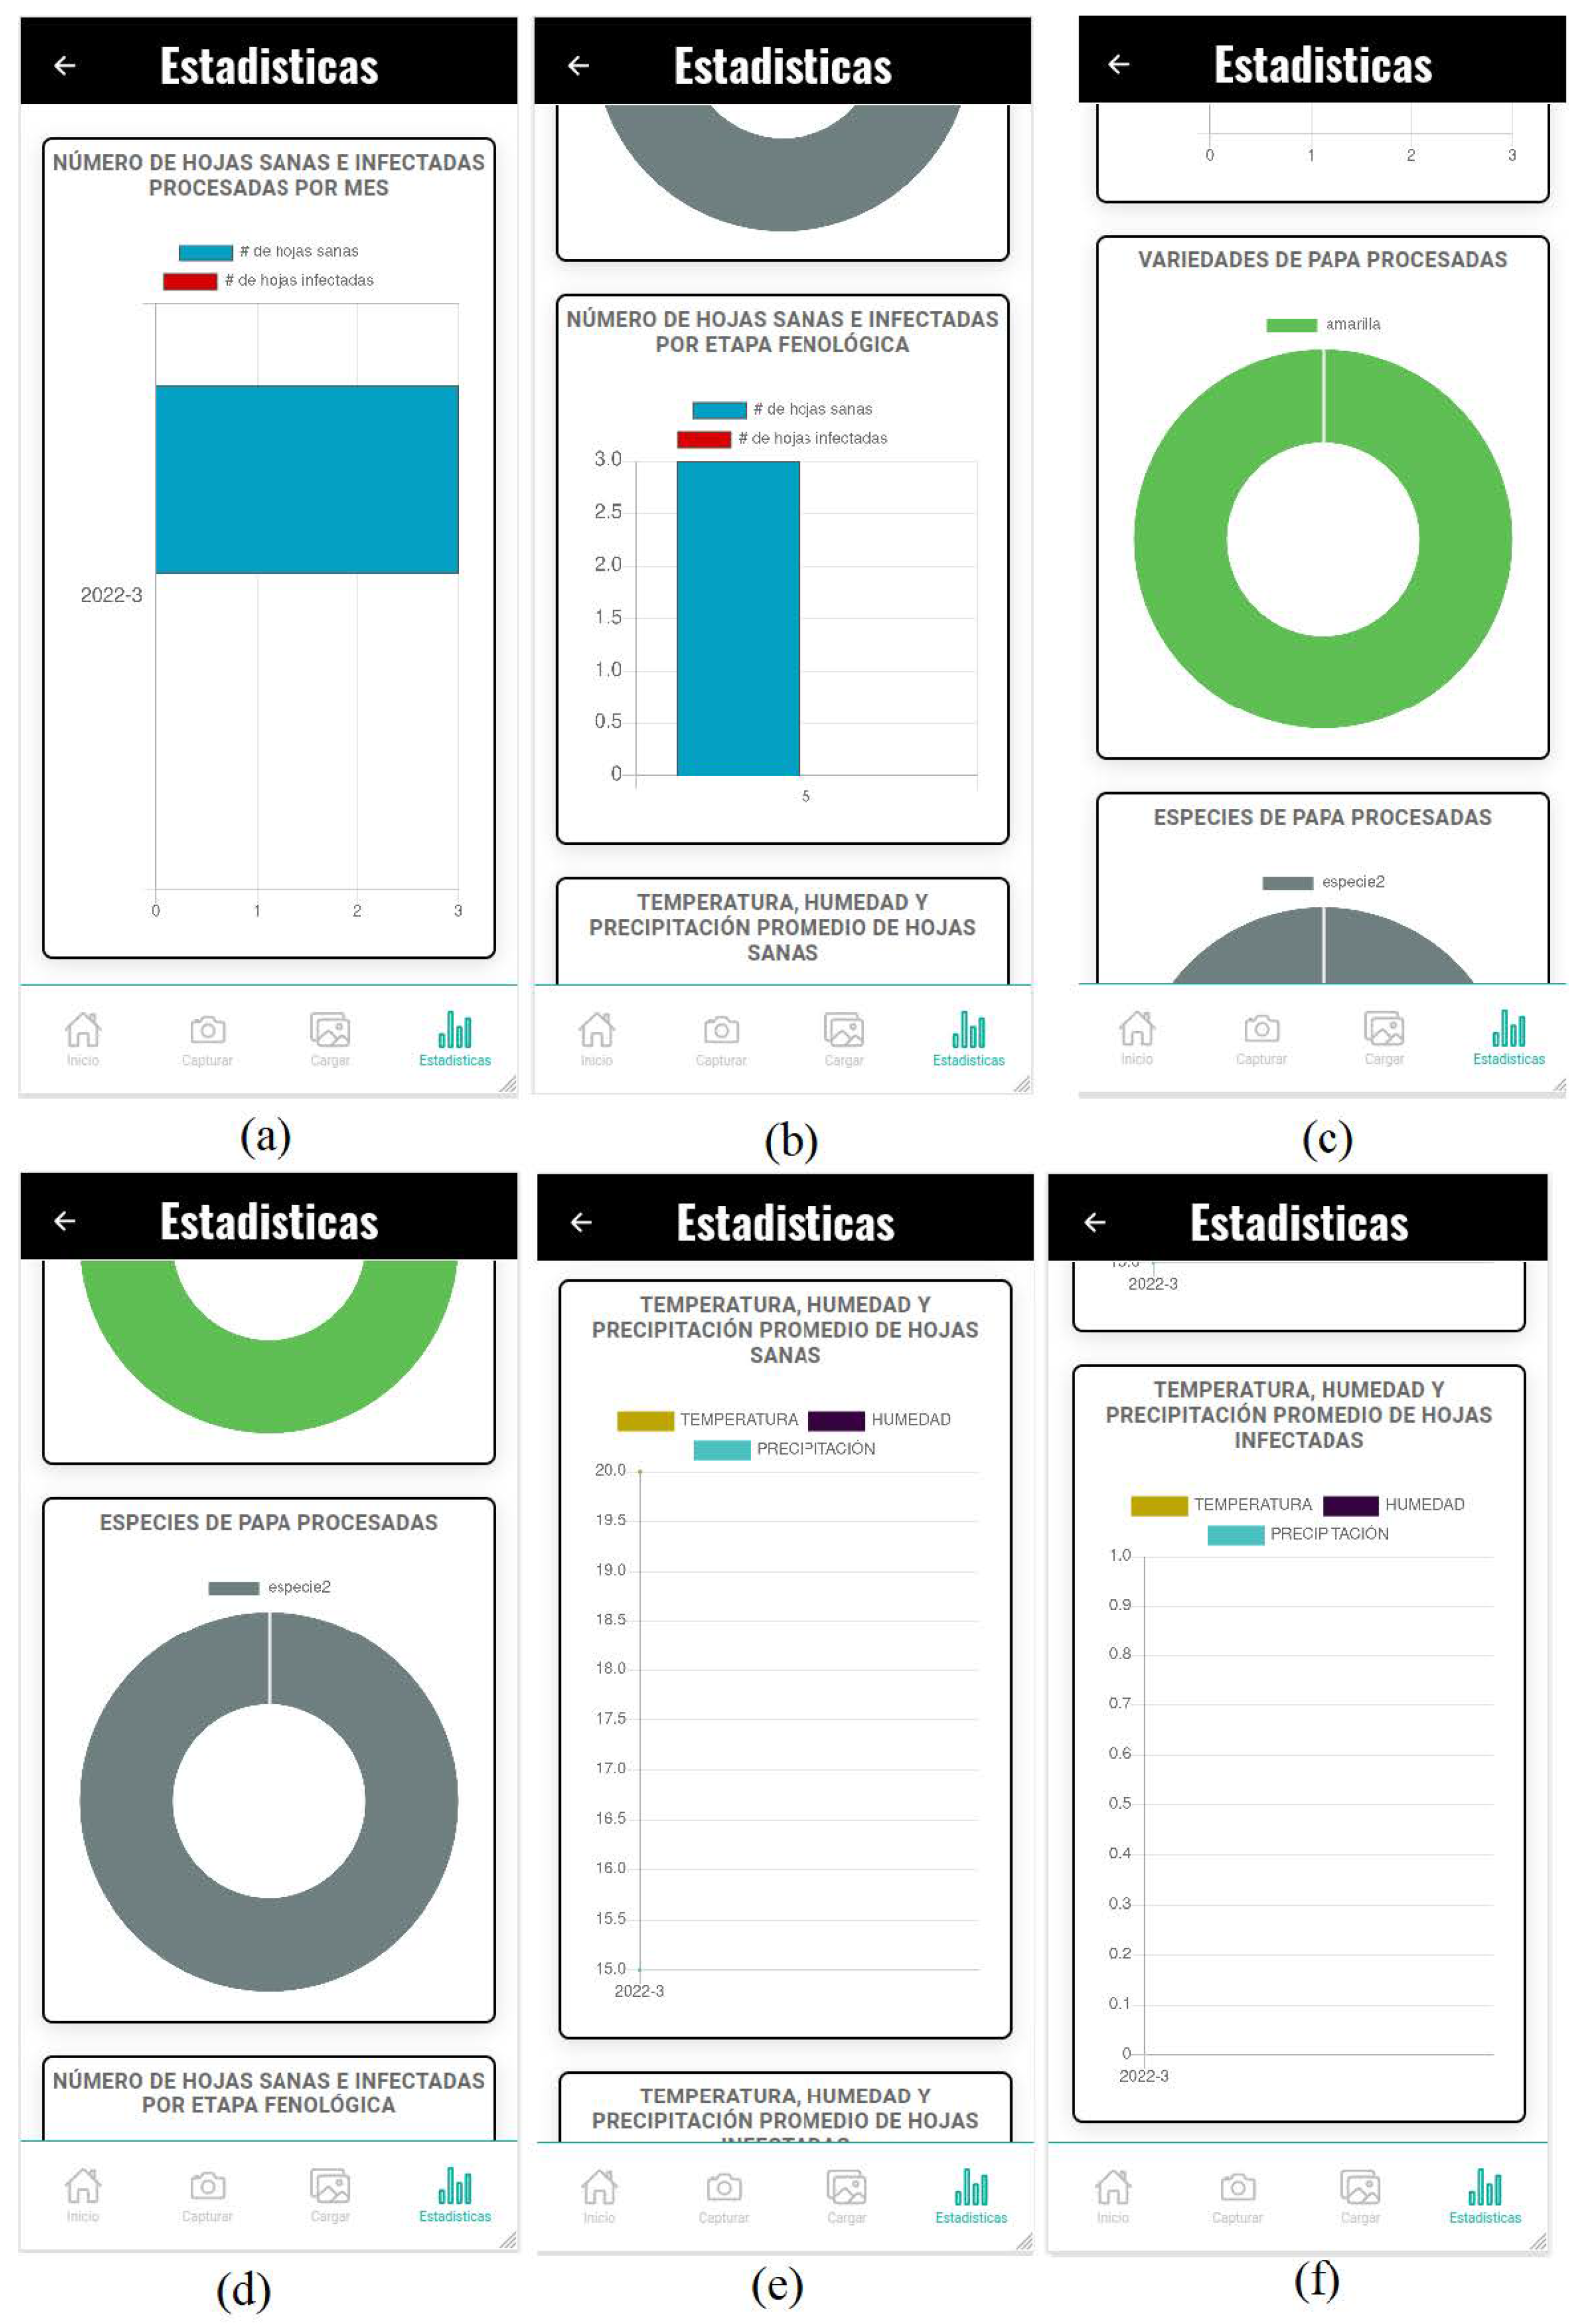
The application prototypes, in addition to allowing the diagnosis of a sheet, contemplates access to users with an administrator role to visualize the general statistics of the processed data. That is, the administrators will be able to observe graphs that provide them with relevant information on the diagnoses made.
In the prototype (Figure 10a) of Figure 10, a bar diagram is initially observed, which graphs the number of healthy and infected leaves that are processed per month. In this way, historical results can be compared to determine which are the months where the potato crops are affected mainly by late blight, and thus one is able to generate time series for later analysis to support decision making. In the prototype (Figure 10b), a bar chart is shown where the number of healthy and infected leaves grouped by age can be displayed, information that allows evaluating which of the phenological stages of the crop is more susceptible to being infected with the Phytophthora infestans fungus. In the prototypes (Figure 10c) and (Figure 10d) of Figure 10, circular diagrams are observed that allow visualizing the percentage of processed leaves grouped by species and variety. It can be seen that in early stages of crop development the disease does not attack significantly, however, from month 4 onwards the leaves of the crop begin to show symptoms of late blight infection. Finally, in the prototypes (Figure 10e) and (Figure 10f) of Figure 10, the environmental conditions under which the diagnoses of both healthy and infected leaves have been made are visualized. The environmental conditions under which the samples were taken to form the data set correspond to a temperature that ranges between 9 °C and 12 °C, a relative humidity of 91%, average monthly rainfall of 885 mm and height above the sea level of 2600 and 3050 to 3115 m.a.s.l.
4.2. Experimental Evaluation
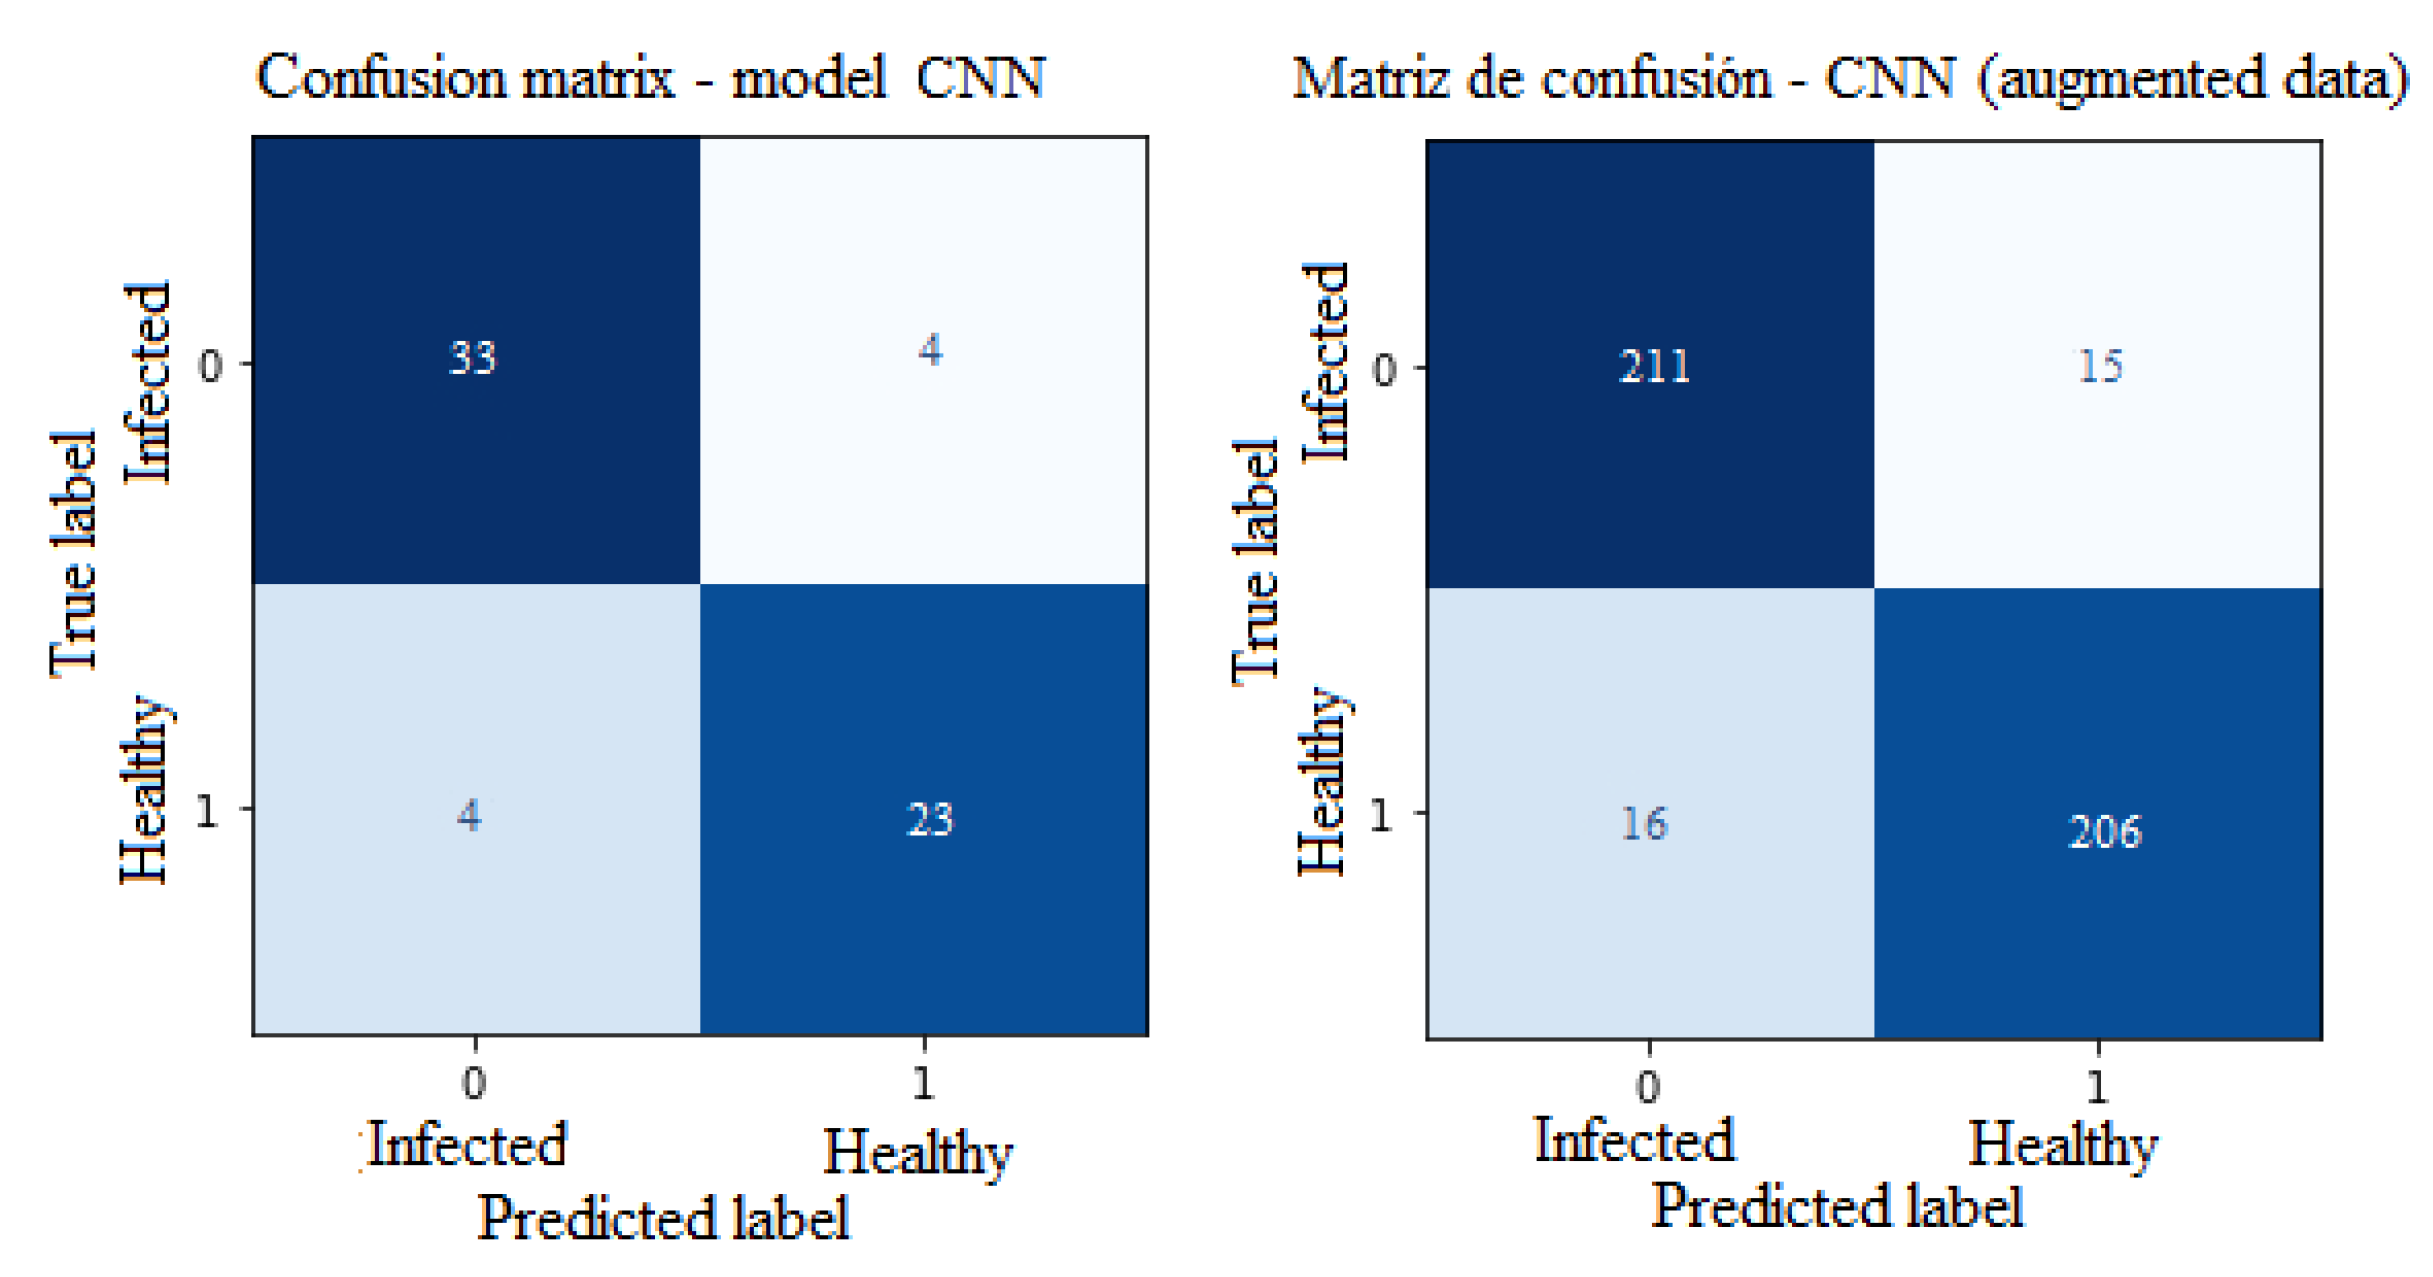
One of the tools used to evaluate the performance of supervised learning models trained for the classification of potato late blight disease was the confusion matrix. The matrix columns represent the labels predicted by the model, and the rows represent the true labels of the image.
Figure 11 shows the confusion matrices of the CNN models. The CNN confusion matrix trained with the original data set comprises 64 test images corresponding to 20% of the original image set. It is observed that it correctly classified 56 images and 8 images with the wrong labels. Regarding the confusion matrix of the CNN trained with the augmented data set, it was created with a total of 448 images corresponding to 20% of the augmented data set, and it is observed that it correctly classified 417 images and 31 wrong label images.
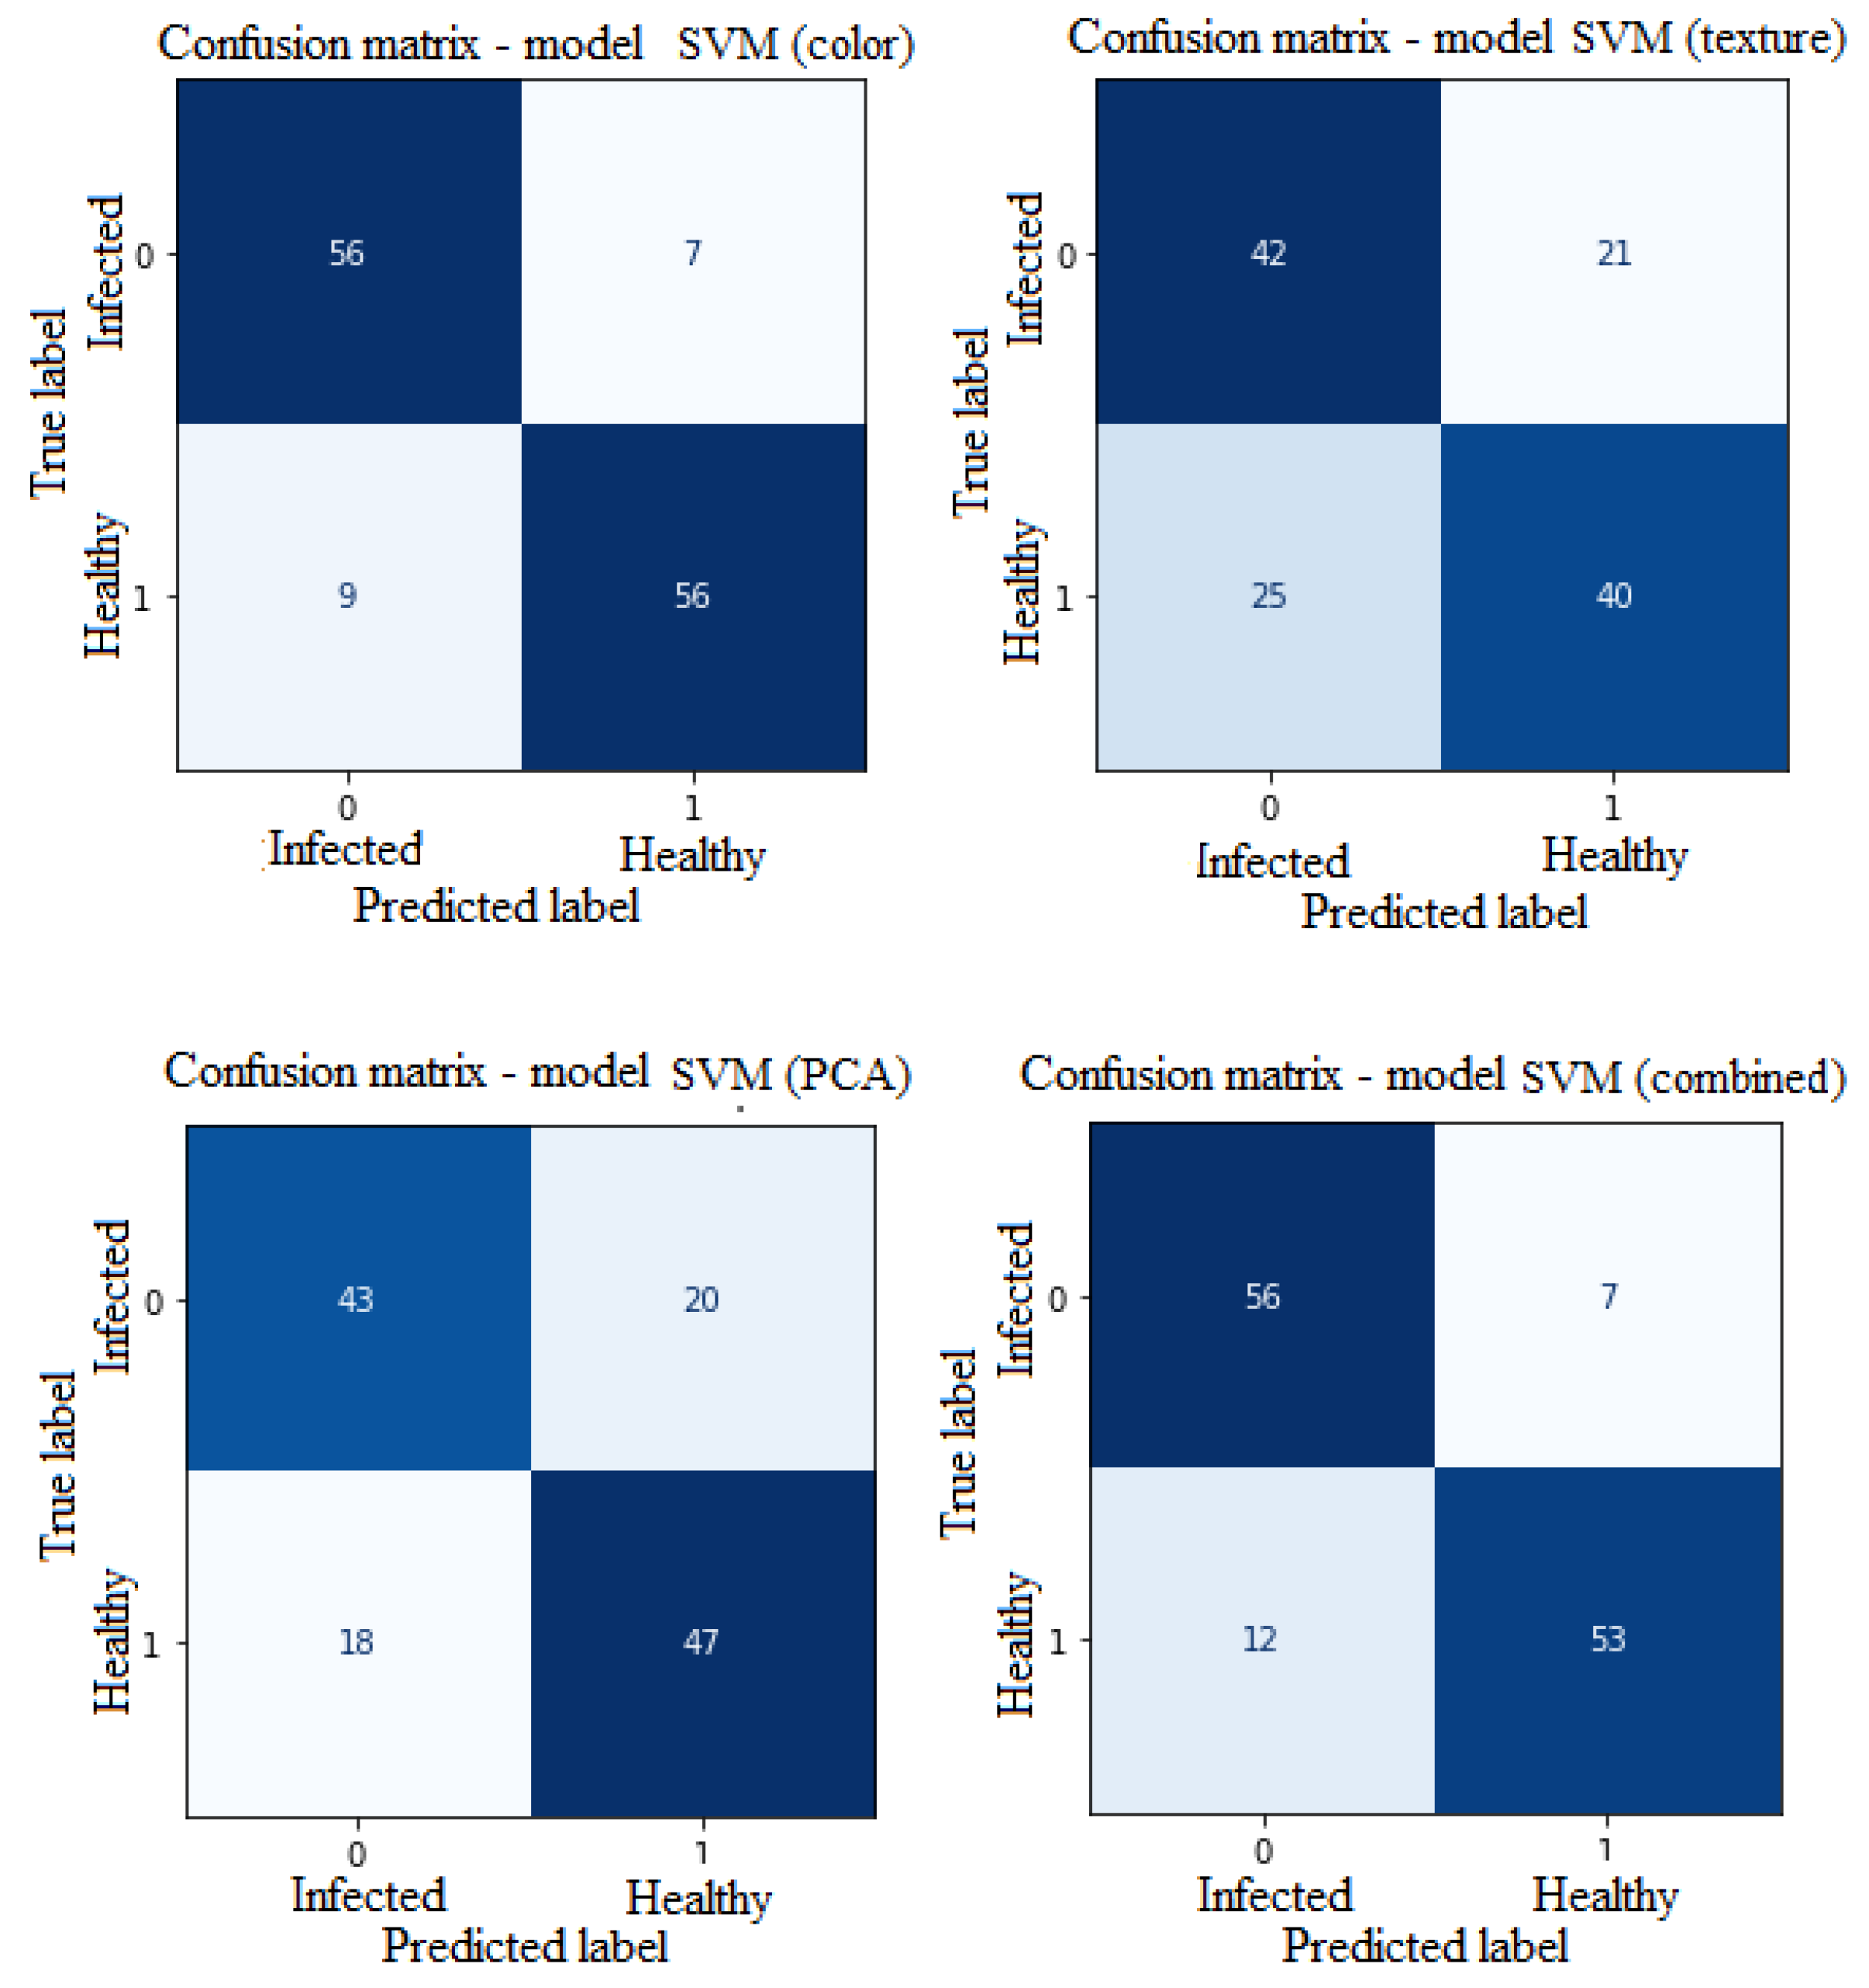
Figure 12 shows the confusion matrices of the Support Vector Machine models. The SVM model confusion matrices were created from 128 test images. Of the 128 images tested, it is observed that the SVM model trained with color features correctly classified 112 images, the SVM model trained with texture features correctly classified 82 images; the SVM model trained with PCA features correctly classified 90 images with the correct labels, and the SVM model trained with combined features correctly classified 109 images.
Based on the results obtained from the confusion matrices of the SVM and CNN models, the performance evaluation metrics of Equations (1)–(5) were calculated. Table 3 shows the percentage of correct predictions against each model’s total data or the accuracy. CNN models had the best performance compared to SVM models. The CNN model trained on the augmented dataset achieved an accuracy of 93%, while the CNN trained on the original dataset achieved an accuracy of 87.5%. Within the SVM models, the model trained with color features obtained better results with 87.5% accuracy, while the model trained with texture, PCA, and combined features obtained 64%, 70.3%, and 85%, respectively.
Regarding the precision or quality of the models in the classification of the leaves, it is observed that the CNN trained with the increased data set achieves the highest precision with 92.9% in classifying leaves with the disease. Regarding the SVM models, the highest accuracy that can be achieved is 86.1% when training with the color characteristics.
The sensitivity or capacity of the models to correctly detect and classify leaves infected with late blight is shown in column 5 of Table 3. It is observed that the CNN model trained with the increased data set presents better performance with 93.3% of sensitivity; that is, this model can detect and identify 93 out of 100 images infected with late blight. In turn, the SVM model trained with color features has 88.8% sensitivity, respectively.
Additionally, the models’ specificity or capacity to detect the negative samples, that is, the leaves that do not present late blight damage, is evidenced. The specificity of the CNN model trained with the augmented data set is 93.2%, which indicates that its ability to discriminate the cases where the leaves do not present late blight infection is high, while the SVM model trained with characteristics color has 88.8% specificity.
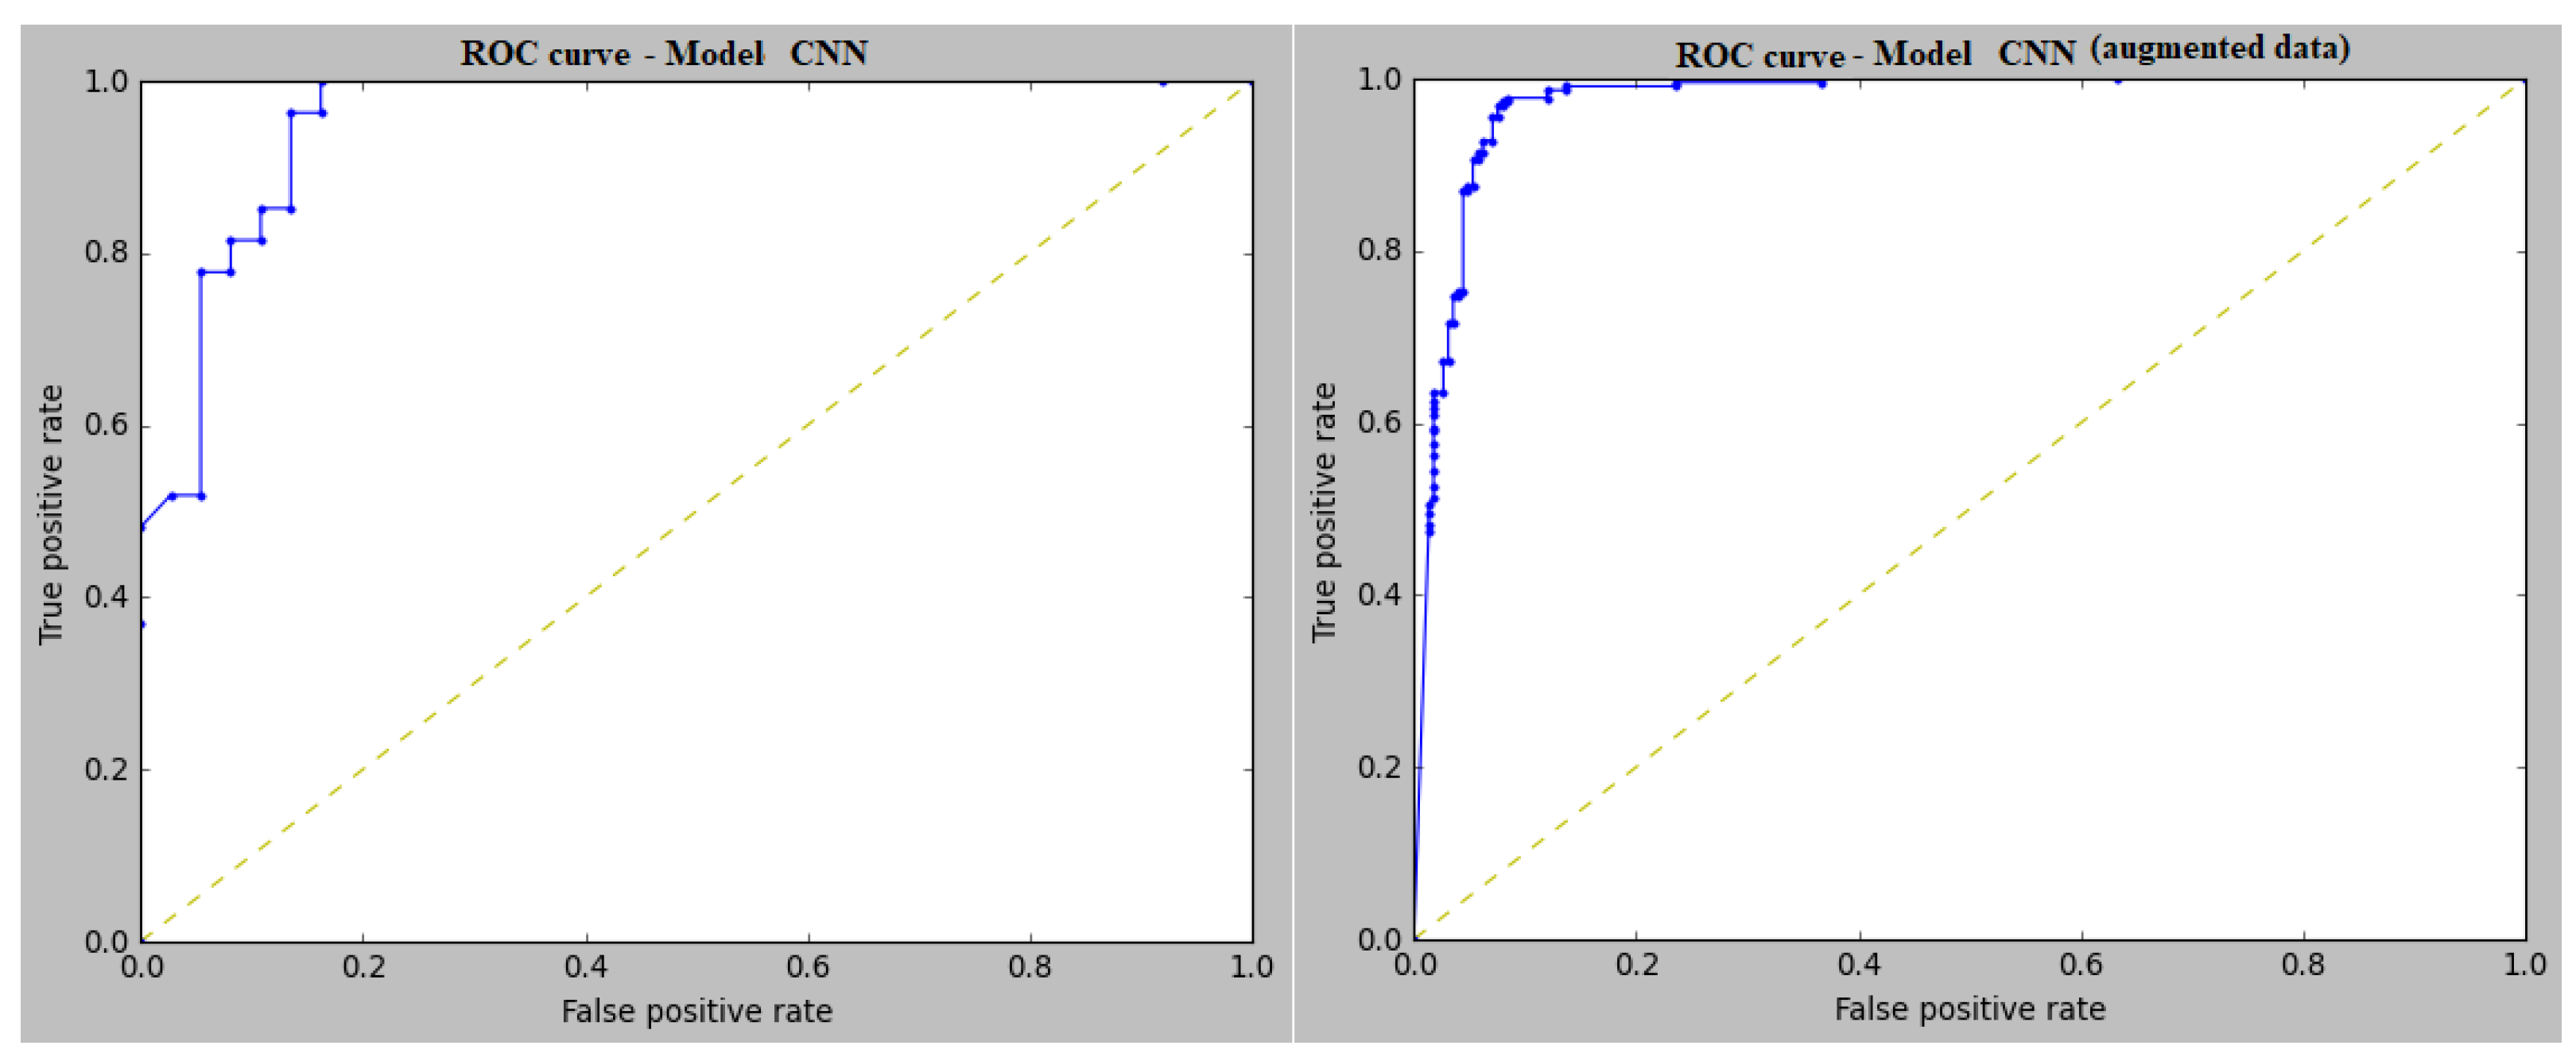
The ROC curve shows the relationship between the true and false positive rates. Table 4 shows the area under the curve of each ROC curve corresponding to each trained model.
Figure 13 shows the ROC curves corresponding to the CNN models trained with the original and augmented data sets, respectively. Compared to the evaluation carried out with the ROC curves, it can be seen that the convolutional neural network models stand out from the others, based on the fact that the CNN models obtained an AUC greater than 0.95. The CNN trained on the augmented data set obtained an AUC equal to 0.97, indicating that there is a 97% chance that this model can distinguish between a healthy leaf and a leaf infected with late blight. It is followed by the CNN trained with the original data set, which obtained an AUC equal to 0.95.
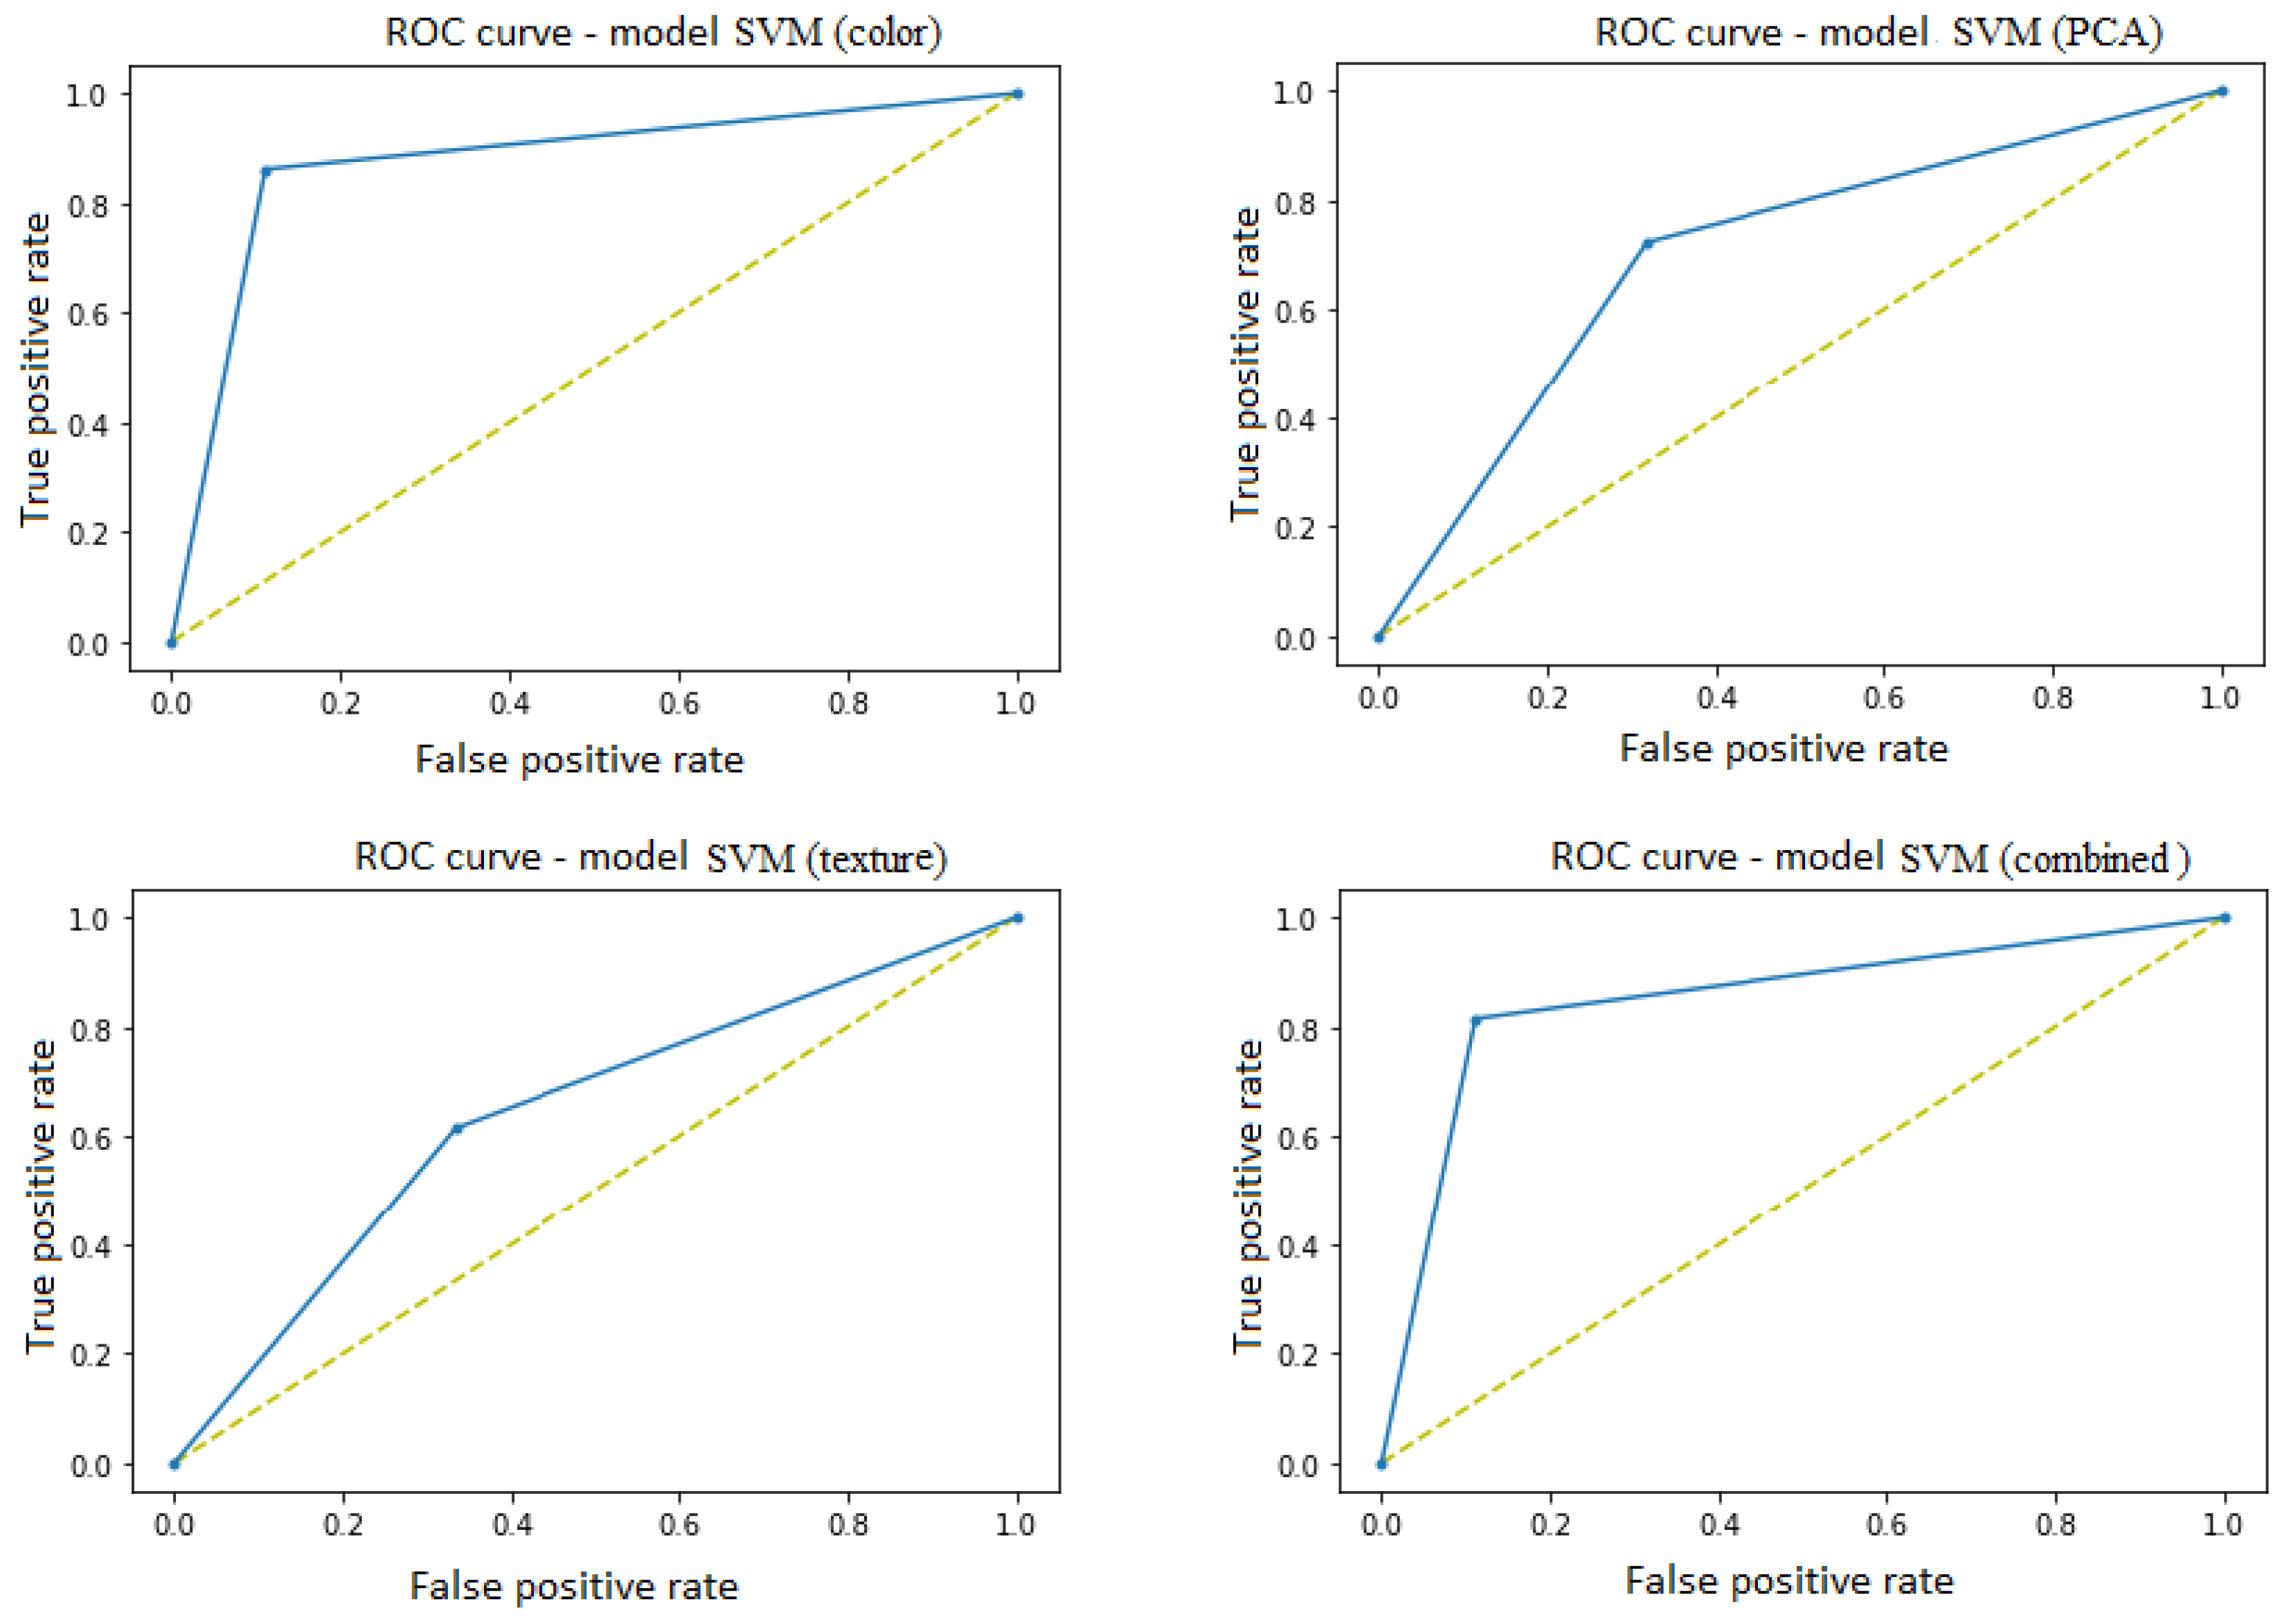
Of the SVM models, the SVM that obtained the best results in ROC curve analysis was the one trained with color features with an AUC equal to 0.87, followed by the models trained with combined PCA and texture features with AUC equal to 0.85, 0.7, and 0.64 respectively. Figure 14 shows the ROC curves obtained by validating the SVM models trained with color, texture, PCA, and combined characteristics. The line yellow represents the 0.0 point to the 1.1 point is called the reference diagonal, or non-discrimination line. Each point of the ROC curve (line blue) corresponds to a possible cut-off point of the diagnostic test, and informs us of its respective sensitivity (Y-axis) and 1-specificity (X-axis).
5. Conclusions and Future Work
This research project shows a mobile system that aims to assist Boyacá-Colombian farmers to identify late blight disease in potato crops of their plants non-invasively by inputting an image of a single plant leaf into the system and producing a early detection result based on the image proccesing.
In the review of the literature, it is observed that there is no efficient process to detect the presence of the fungus Phytophthora Infestans in early stages in potato crops, which is why a new method was proposed based on supervised learning models to detect and diagnose the disease using mobile applications.
Of the image processing and segmentation algorithms tested, the method with which the best results were obtained in the image background removal process was the HSV color range segmentation algorithm. Regarding classification, the CNN model obtained better results when trained with the augmented data set. On the other hand, the SVM models obtained better results when the algorithm was trained with the color features, showing that the color features play an important role in the development of the SVM classification models. The models were trained and applied to even augmented datasets and validated using typical performance metrics, confusion matrix, ROC, and AUC, showing that the CNN classifier achieved the highest accuracy with 93.2% compared to the SVM classifiers, where the highest accuracy was 87.5%.
For the integration of the supervised learning model and the use of this in a real space, a mobile application was developed that allows early detection and diagnosis of the presence of the fungus Phytophthora Infestans from images of potato leaves. In addition, it allows comparing and maintain a history of late blight detection for the sectorized production of crops, which will give way to identify conditions where the crop may be more prone to contagion and infection.
Currently, the supervised learning model allows to analyze and determine the current state of a potato leaf, and it is expected that future work will work on models that also allow the stem, tuber, and plant to be analyzed completely. Additionally, it would be significant to analyze the crop from video capture in a way that allows farmers to carry out precision agriculture and supports them in making decisions to improve yield by taking preventive and corrective actions against blight disease, late in the potato crop.
The next step in our project is to create a multi-platform application that can detect the disease of every type of crop and can provide the proper solution for those diseases of the crop in real time. Additionally, we aim to aggregate with more data than the current dataset.
Author Contributions
M.J.S.B. Conducting a research and investigation process, specifically performing the experiments, or data/evidence collection; A.L.G. Programming, software development; designing computer programs; implementation of the computer code and supporting algorithms; testing of existing code components; J.E.E.D. Acquisition of the financial support for the project leading to this publication. All authors have read and agreed to the published version of the manuscript.
Funding
This study was supported by the UPTC, Colombia [SGI Project 3096].
Institutional Review Board Statement
Not applicable.
Informed Consent Statement
Not applicable.
Data Availability Statement
Not applicable.
Conflicts of Interest
The authors declare no conflict of interest.
References
- FEDEPAPA. Informe Trimestral de Coyuntura Económica del Subsector Papa; FEDEPAPA: Bogota, Colombia, 2020. [Google Scholar]
- Ortiz Daza, C.A. Desarrollo de una Herramienta Computacional Basada en Redes Neuronales para el Diagnóstico del Tizón Tardío en Cultivos de Papa; Universidad Antonio Nariño: Bogota, Colombia, 2021. [Google Scholar]
- Bravo, I.A.; Herrera, R.B.; Arévalo, M.G.; Davis, M.M.; Johnston, R.O.; Díaz, B.S.; Velásquez, J.G. Tizón Tardío de la Papa: Estrategias de Manejo Integrado con Alertas Temprana; Ministerio de Agricultura: Santiago, Chile, 2019.
- Nandhini, S.; Ashokkumar, K. An automatic plant leaf disease identification using DenseNet-121 architecture with a mutation-based henry gas solubility optimization algorithm. Neural Comput. Appl. 2022, 34, 5513–5534. [Google Scholar] [CrossRef]
- Hou, C.; Zhuang, J.; Tang, Y.; He, Y.; Miao, A.; Huang, H.; Luo, S. Recognition of early blight and late blight diseases on potato leaves based on graph cut segmentation. J. Agric. Food Res. 2021, 5, 100154. [Google Scholar] [CrossRef]
- Shrivastava, V.K.; Pradhan, M.K. Rice plant disease classification using color features: A machine learning paradigm. J. Plant Pathol. 2021, 103, 17–26. [Google Scholar] [CrossRef]
- Agarwal, M.; Singh, A.; Arjaria, S.; Sinha, A.; Gupta, S. ToLeD: Tomato leaf disease detection using convolution neural network. Procedia Comput. Sci. 2020, 167, 293–301. [Google Scholar] [CrossRef]
- Mishra, S.; Sachan, R.; Rajpal, D. Deep convolutional neural network based detection system for real-time corn plant disease recognition. Procedia Comput. Sci. 2020, 167, 2003–2010. [Google Scholar] [CrossRef]
- Ashqar, B.A.; Abu-Naser, S.S. Image-Based Tomato Leaves Diseases Detection Using Deep Learning; AUG Repository: Göttingen, Germany, 2018. [Google Scholar]
- Barriga Pozada, A.C.; Arrasco Ordoñez, C.S. Diagnóstico Automático de Roya Amarilla en Hojas de Cafeto Aplicando Técnicas de Procesamiento de Imágenes y Aprendizaje de Máquina; PUCP: Lima, Peru, 2018. [Google Scholar]
- Kurmi, Y.; Gangwar, S.; Chaurasia, V.; Goel, A. Leaf images classification for the crops diseases detection. Multimed. Tools Appl. 2022, 81, 8155–8178. [Google Scholar] [CrossRef]
- Kose, U.; Prasath, V.S.; Mondal, M.R.H.; Podder, P.; Bharati, S. (Eds.) Artificial Intelligence and Smart Agriculture Technology; CRC Press: Boca Raton, FL, USA, 2022; pp. 45–55. [Google Scholar]
- Lozada-Portilla, W.A.; Suarez-Barón, M.J.; Avendaño-Fernández, E. Application of convolutional neural networks for detection of the late blight Phytophthora infestans in potato Solanum tuberosum. Rev. UDCA Actual. Divulg. Cient. 2021, 24, e1917. [Google Scholar]
Figure 1.
The flowchart of the methodology.

Figure 2.
Functional architecture.

Figure 3.
Samples of the data set used. (A) Healthy leaves, (B) leaves infected with late blight.

Figure 4.
Input image and output images of the data augmentation algorithm.

Figure 5.
Transformation to HSV, LAB, and grayscale space.

Figure 6.
Result obtained from the application of segmentation algorithm.

Figure 7.
Result obtained from the application of Range Threshold Segmentation.

Figure 8.
Proposed CNN Architecture.

Figure 9.
Prototype design for diagnostic visualization of a leaf from an image.

Figure 10.
Prototype designs of obtained data visualization for administrators.

Figure 11.
Confusion Matrices of the CNN Models.

Figure 12.
Confusion Matrices of Support Vector Machine (SVM) Models.

Figure 13.
ROC curve of convolutional neural network (CNN) models.

Figure 14.
ROC curves of the Support Vector Machine (SVM) models.


Table 1.
Classification and total number of sheets that make up the data set.
| Class | Number of Images | Variety | |
|---|---|---|---|
| 0 (infected) | 160 | 49.4% | Tocarreña |
| 50.6% | Pastusa | ||
| 1 (healthy) | 160 | 36.8% | Amarilla |
| 63.2% | Pastusa | ||
Table 2.
GLCM texture features.
| 0° | π/4 | π/2 | 3π/4 | |
|---|---|---|---|---|
| Contrast | contrast-0 | contrast-pi_4 | contrast-pi_2 | contrast-3pi_4 |
| Dissimilarity | dissimilarity-0 | dissimilarity-pi_4 | dissimilarity-pi_2 | dissimilarity-3pi_4 |
| Homogeneity | homogeneity-0 | homogeneity-pi_4 | homogeneity-pi_2 | homogeneity-3pi_4 |
| Energy | energy-0 | energy-pi_4 | energy-pi_2 | energy-3pi_4 |
| Correlation | correlation-0 | correlation-pi_4 | correlation-pi_2 | correlation-3pi_4 |
| ASM | asm-0 | asm-pi_4 | asm-pi_2 | asm-3pi_4 |
Table 3.
Evaluation metrics from confusion matrices.
| Model | Metrics | |||||
|---|---|---|---|---|---|---|
| Acurracy | Precision | Sensitivity | Score-F | Specificity | ||
| CNN | N/A | 0.875 | 0.891 | 0.891 | 0.891 | 0.851 |
| Augmented | 0.93 | 0.929 | 0.933 | 0.931 | 0.932 | |
| SVM | Color | 0.875 | 0.861 | 0.888 | 0.875 | 0.888 |
| Texture | 0.64 | 0.626 | 0.666 | 0.646 | 0.655 | |
| PCA | 0.703 | 0.704 | 0.682 | 0.693 | 0.701 | |
| Combined | 0.851 | 0.823 | 0.888 | 0.854 | 0.883 | |
Table 4.
Comparative matrix of results of the classifiers—ROC AUC.
| Model | Characteristic | AUC |
|---|---|---|
| CNN | N/A | 0.957 |
| Augmented | 0.973 | |
| SVM | Color | 0.875 |
| Texture | 0.641 | |
| PCA | 0.702 | |
| Combined | 0.852 |
Publisher’s Note: MDPI stays neutral with regard to jurisdictional claims in published maps and institutional affiliations. |
© 2022 by the authors. Licensee MDPI, Basel, Switzerland. This article is an open access article distributed under the terms and conditions of the Creative Commons Attribution (CC BY) license (https://creativecommons.org/licenses/by/4.0/).
Share and Cite
MDPI and ACS Style
Suarez Baron, M.J.; Gomez, A.L.; Diaz, J.E.E. Supervised Learning-Based Image Classification for the Detection of Late Blight in Potato Crops. Appl. Sci. 2022, 12, 9371. https://0-doi-org.brum.beds.ac.uk/10.3390/app12189371
AMA Style
Suarez Baron MJ, Gomez AL, Diaz JEE. Supervised Learning-Based Image Classification for the Detection of Late Blight in Potato Crops. Applied Sciences. 2022; 12(18):9371. https://0-doi-org.brum.beds.ac.uk/10.3390/app12189371
Chicago/Turabian StyleSuarez Baron, Marco Javier, Angie Lizeth Gomez, and Jorge Enrique Espindola Diaz. 2022. "Supervised Learning-Based Image Classification for the Detection of Late Blight in Potato Crops" Applied Sciences 12, no. 18: 9371. https://0-doi-org.brum.beds.ac.uk/10.3390/app12189371
Note that from the first issue of 2016, this journal uses article numbers instead of page numbers. See further details here.