
Model Test of Micro-Pile Group Reinforcing High Steep Landslide
1
Chinese Academy of Geological Sciences, Beijing 100037, China
2
College of Chemical Engineering, Qingdao University of Science and Technology, Qingdao 266061, China
3
Key Laboratory of Geohazard Prevention of Hilly Mountains, Ministry of Land and Resources of China (Fujian Key Laboratory of Geohazard Prevention), Fuzhou 350002, China
4
Fujian Geological Engineering Survey Institute, Fuzhou 350002, China
*
Author to whom correspondence should be addressed.
Appl. Sci. 2022, 12(19), 10017; https://0-doi-org.brum.beds.ac.uk/10.3390/app121910017
Submission received: 1 September 2022
/
Revised: 22 September 2022
/
Accepted: 29 September 2022
/
Published: 6 October 2022
(This article belongs to the Special Issue Recent Progress on Advanced Foundation Engineering)
Abstract
:High steep landslides are a major concern for infrastructure construction in the mountainous areas of Western China. The micro-pile technique has been gradually used to prevent landslides, due to convenient construction and good performance. However, the application of the micro-pile technique on landslide prevention was generally implemented on the front edge of landslides, which is not applicable for the high steep landslides due to the limited operation space. In this study, a large-scale model test on the performance of a micro steep pile group on the prevention of high steep landsides was conducted in order to implement the micro-pile on the top of landslides. The force-deformation characteristics and failure modes of the steel pipe micro-pile group reinforcing high steep landslides were investigated. The test results showed that the landslide thrusts acting on the micro-pile group showed a triangle distribution. The maximum soil earth pressure was observed near the slip surface during landsides. The resistance of the micro pole group was distributed in an inverted triangle, mainly in the upper half of the loaded section. The sliding bed resistance is unevenly distributed along the height direction, and is larger near the slip surface. Once the landslide occurred, the force distribution of each row of steel pipe micro-piles was basically the same. The bending moment of the loaded section of the steel pipe micro-pile was mostly negative, with a larger bending moment in the range of eight times the pile diameter above the slip surface. The largest bending moment value is located at two times the pile diameter on the slip surface. On the other hand, the bending moment of the embedded section of the steel pipe micro-pile is mostly positive, showing a tension state with a maximum value at four times the pile diameter under the slip surface. This implies that the role of loaded and embedded sections of the micro-pile group on the landsides is different. The failure mode of the micro-pile group was mainly attributable to the bending failure within eight times the pile diameter above and below the slip surface.
1. Introduction
With the development of economic growth, much infrastructure is to be constructed in the mountainous areas of China. Hence, high and steep landslides are commonly encountered due to the construction in these areas. High and steep landslides often cause great economic losses and human casualties, which require effective reinforcement techniques to prevent landsides during construction. In general, the sites available for construction near high and steep landslides are small, and the common retaining structures, such as anti-slide piles, are not applicable. On the other hand, with the development of micro-pile technology, this technique has become an effective method to install steel pipe micro-piles at the top of high and steep landslides for reinforcement.
Steel pipe micro-piles are a kind of micro-pile; their pile diameters are generally less than 30 cm. Steel pipe micro-piles are usually formed by a drilling rig, inserted into the steel pipe, and then filled with concrete, which has the advantage of fast construction speed, little disturbance to the landslide, and strong site adaptability. Micro-piles are increasingly used in landslide prevention projects [1,2,3,4,5,6,7,8,9,10] and have been studied by many scholars. For example, through field tests, Awad [11] preliminarily studied the relationship between the lateral load acting on a single micro-pile and the required pile length. Richards et al. [12] investigated the lateral load-bearing performance of micro-piles. Konagai et al. [13] carried out a detailed analysis on the performance of micro-pile groups with rigid caps under lateral loading through model tests. Several model tests to illustrate anti-sliding performance of steel pile groups were also proposed by many researchers [14,15,16,17]. Hence, the micro-pile–slop movement reaction was well understood throughout the test results as relating to the stress distribution and failure mechanisms of micro-pile groups [18,19,20]. Based on recent field test results, the use of micro-piles in landslide prevention has been proven to be an acceptable method, and some real projects have also been conducted in China [21,22]. However, these previous studies mainly focused on the micro-piles placed on the front edge of the landslide, because the front edges of most landslides are relative gentle. Meanwhile, in Western China, many high and steep landslides existed where micro-piles may not be constructed on the front edge of these slopes due the limited space. Hence, the new technique of implementing steel pipe micro-pile groups on the tops of landslides is of great importance for high steep landside prevention, and is not yet fully understood. Meanwhile, steel pipe micro-pile use steel pipes as reinforcement, which has some differences from reinforcement forms such as steel reinforcement cages and steel tendons in terms of mechanical properties. For engineering construction needs, it is necessary to study the force-deformation characteristics of steel pipe micro-pile groups in high and steep landslide reinforcement.
In this study, in order to further our understanding of the performance of the micro steel pipe group on the prevention of high steep landslides, a large-scale physical model test was conducted to test the interaction between steel pipe micro-pile groups and high steep landslides. The landslide model is made of compressed loess, with an artificial sliding surface. The landslides were triggered by step-loading at the top of the landslide. The force, deformation law, and damage mode of steel pipe micro-pile groups in high steep landslides are investigated in detail. The test results may provide a scientific basis for a design method for slope disaster prevention.
2. Model Test Design
2.1. Test Model
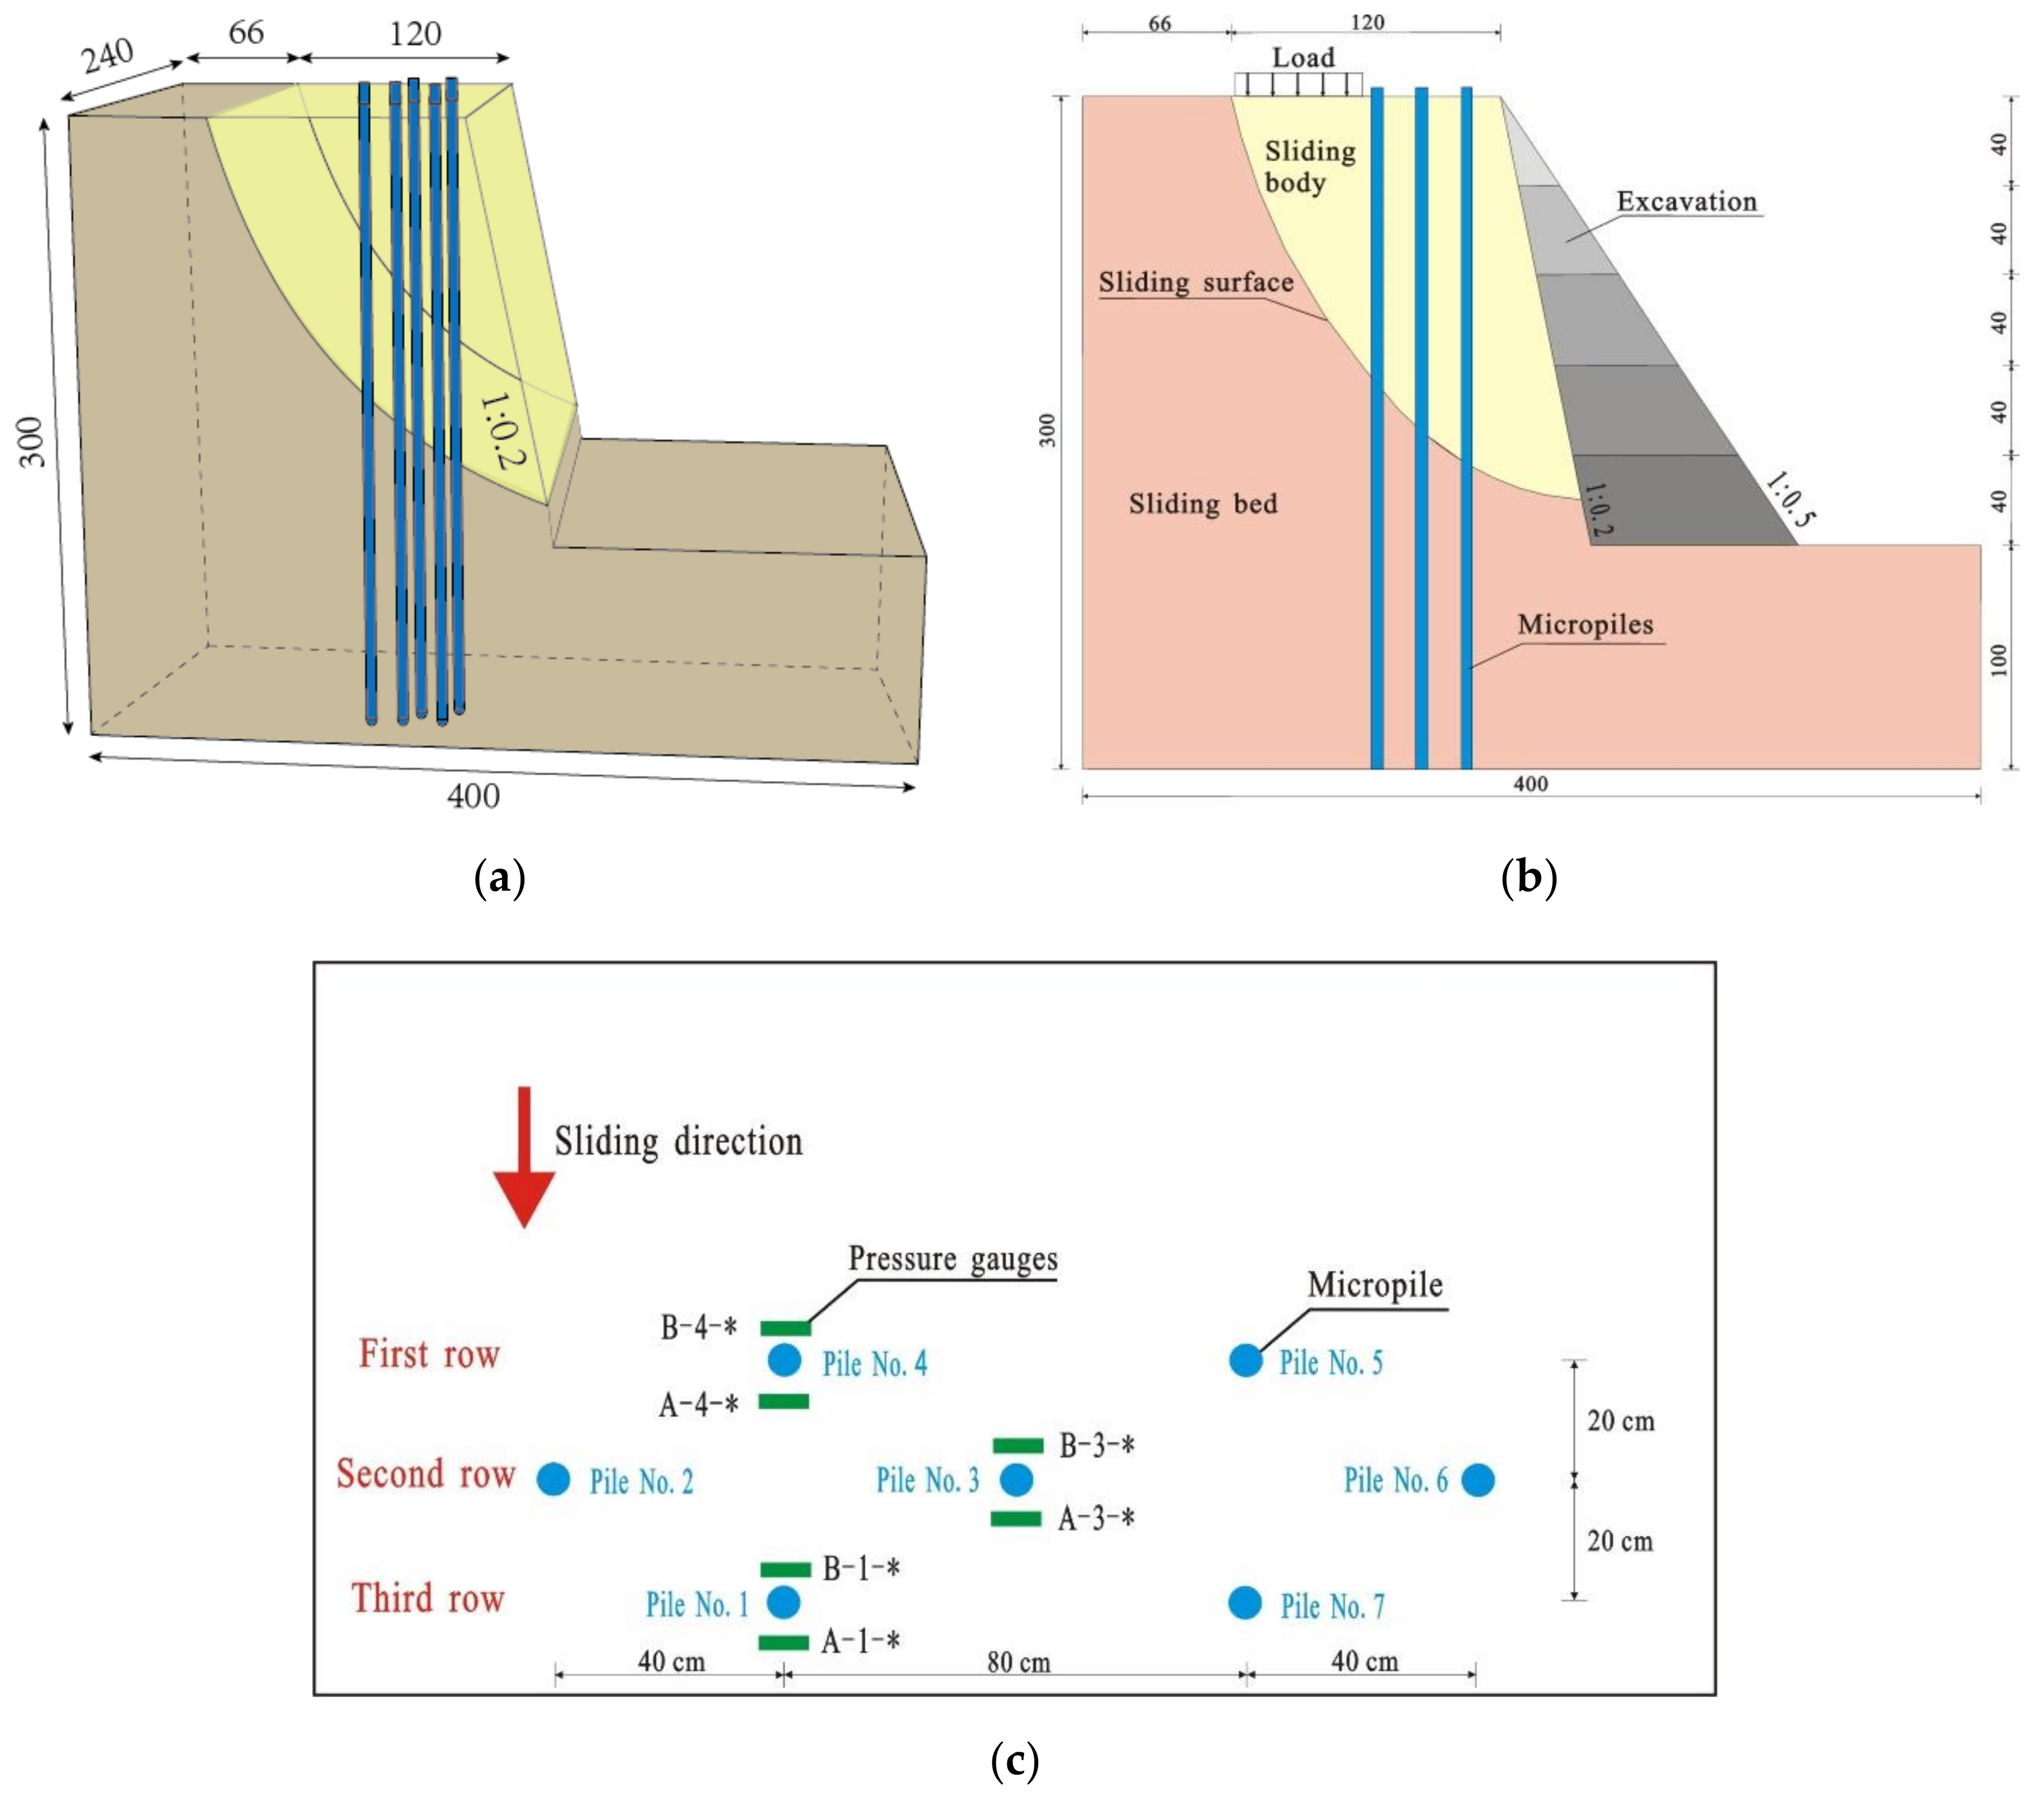
The model used in this test is shown in Figure 1. Among them, Figure 1a shows a three-dimensional view of the model, and Figure 1b shows a cross-sectional view of the model, which mainly consists of a manually made landslide model and a micro-pile model. The micro-piles are arranged in groups at the top of high and steep landslides. Three rows of micro-piles with 0.2 m row spacing and 0.4 m middle pile spacing were laid out (Figure 1c). During the test, the landslide was induced to slide by loading at the top of the slope, and the force-deformation pattern of the micro-pile group was obtained by various test elements.
2.2. Similarity Ratio
The similitude law used in this study was based on the Buckingham theorem (Π theorem) [10], with a geometric similarity ratio of CL = 3 and an elastic modulus similarity ratio of CE = 3. Based on the principle of similarity theory, the similarity ratio of physical quantities can be expressed as follows:
where and represent the stress and strain of the pile body, E represents the elastic modulus of the pile, represents the poison ratio, X represents the volume force, L represents the length of the pile, and represents the deformation of the pile. If X and L are chosen as the basic physical quantities, the relationship of other physical quantities can be formulated using the dimension of FL−3 and L, with the principle of all dimensions occurring at least one time.
In order to obtain a dimensionless π1, α and β should be equal to 1. Then, Equation (2) can be expressed as
Following the same rule, other quantities can be obtained:
Using the similarity ratio submitted into Equations (3) and (4):
With the initial value of CL = 3 and CE = 3, Equation (5) can be solved as follows:
where Cq denotes the similarity ratio of the linear load on the pile body; CP denotes the similarity ratio of the concentrated force on the pile body; Cσ denotes the similarity ratio of the stress of the pile body; Cε denotes the similarity ratio of the strain of the pile body; CAc denotes the similarity ratio of the cross-sectional area of the pile body; and CAs denotes the similarity ratio of the cross-sectional area of reinforcement.
Cq = 5, CP = 25, Cσ = 3, Cε = 1, CAc = 25, CAs = 25
2.3. Materials
2.3.1. Sliding Bed and Sliding Body
2.3.2. Sliding Surface
After filling the sliding bed soil, the sliding surface was made according to the shape of the designed sliding surface, and double-layer plastic films were placed on the sliding surface to simulate the sliding zone. The sliding surface is shown in Figure 3.
2.3.3. Model Pile
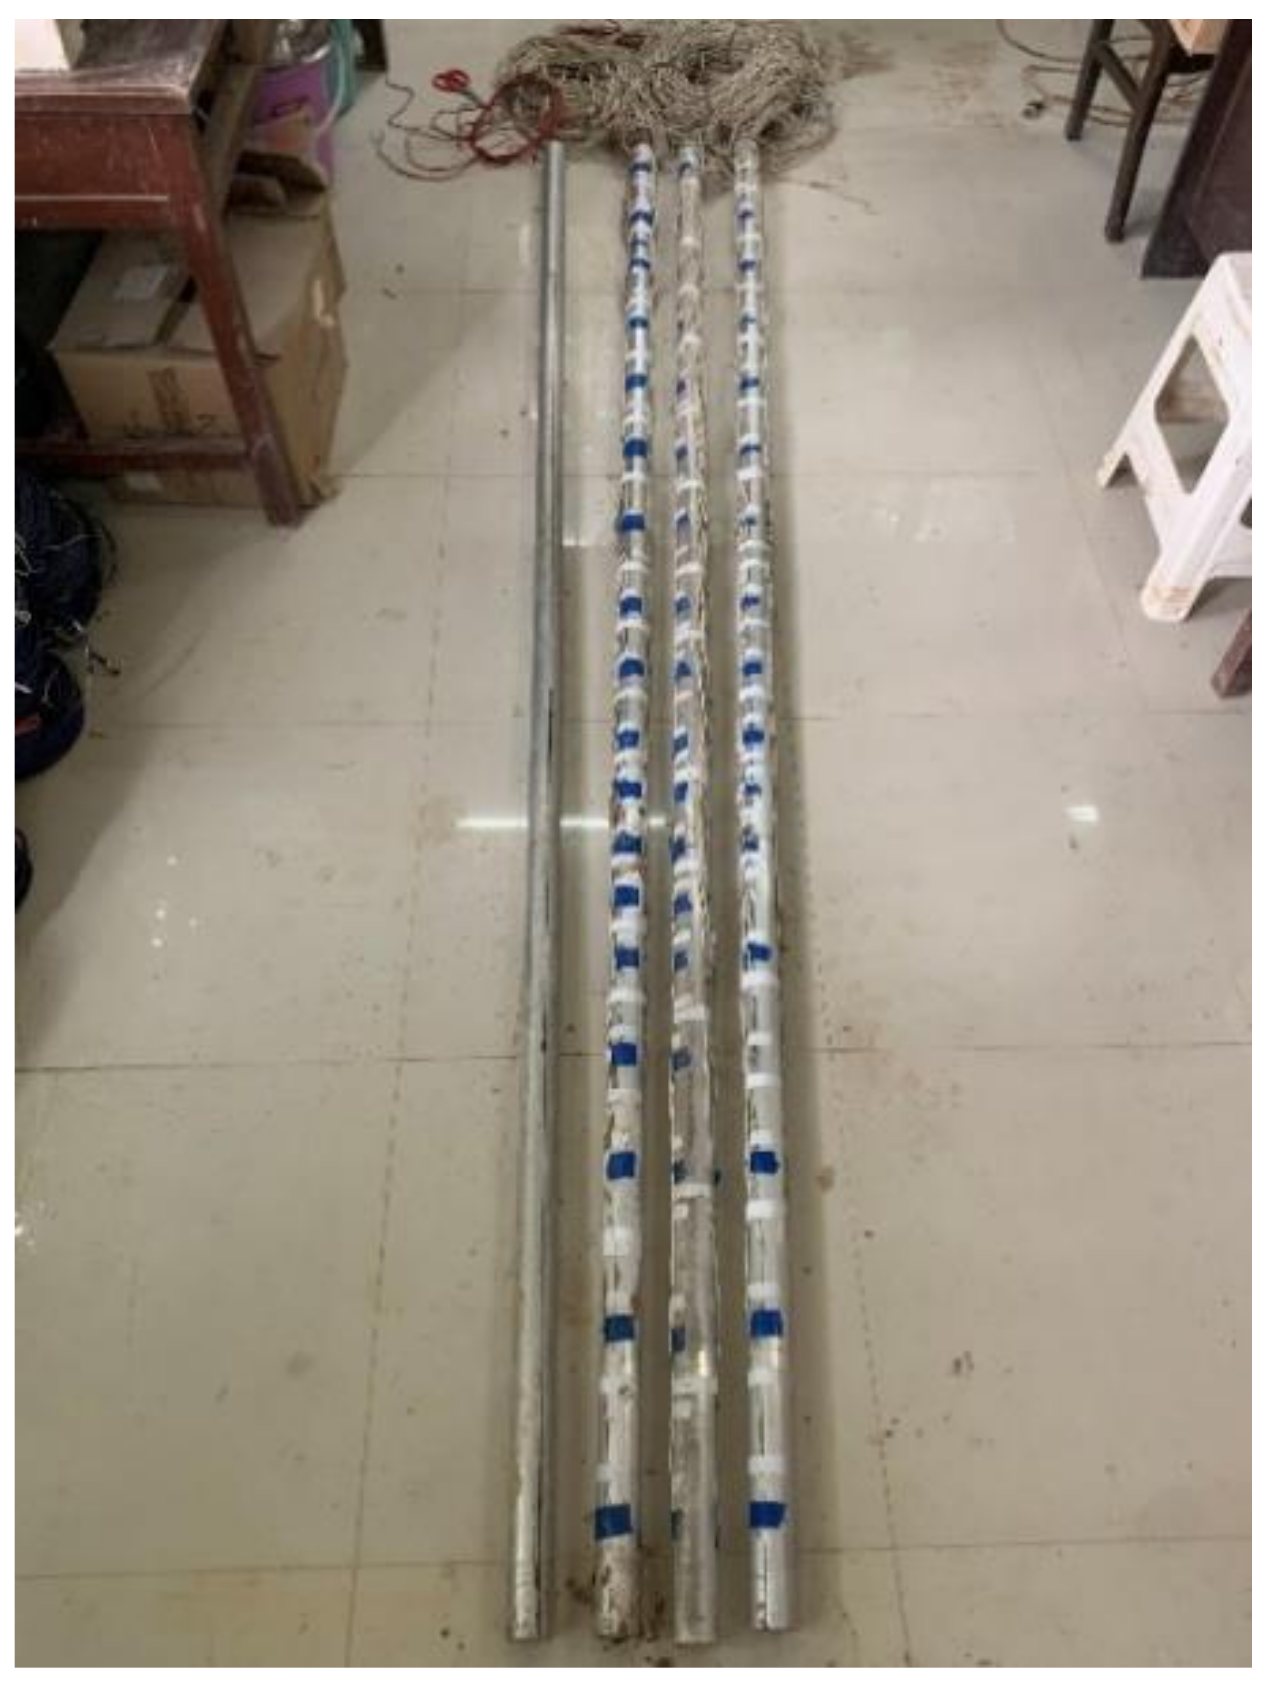
In order to facilitate the burial of test instruments, the model piles used in this test were aluminum tube gypsum precast piles. A 3 m-long aluminum tube (diameter 5 cm, wall thickness 2 mm) was selected, and the tube was filled with gypsum, as shown in Figure 4. It should be mentioned that the filling material was chosen as gypsum in order to increase the bending resistance in the model test and to simulate the role of concrete in the real project.
2.4. Measurements
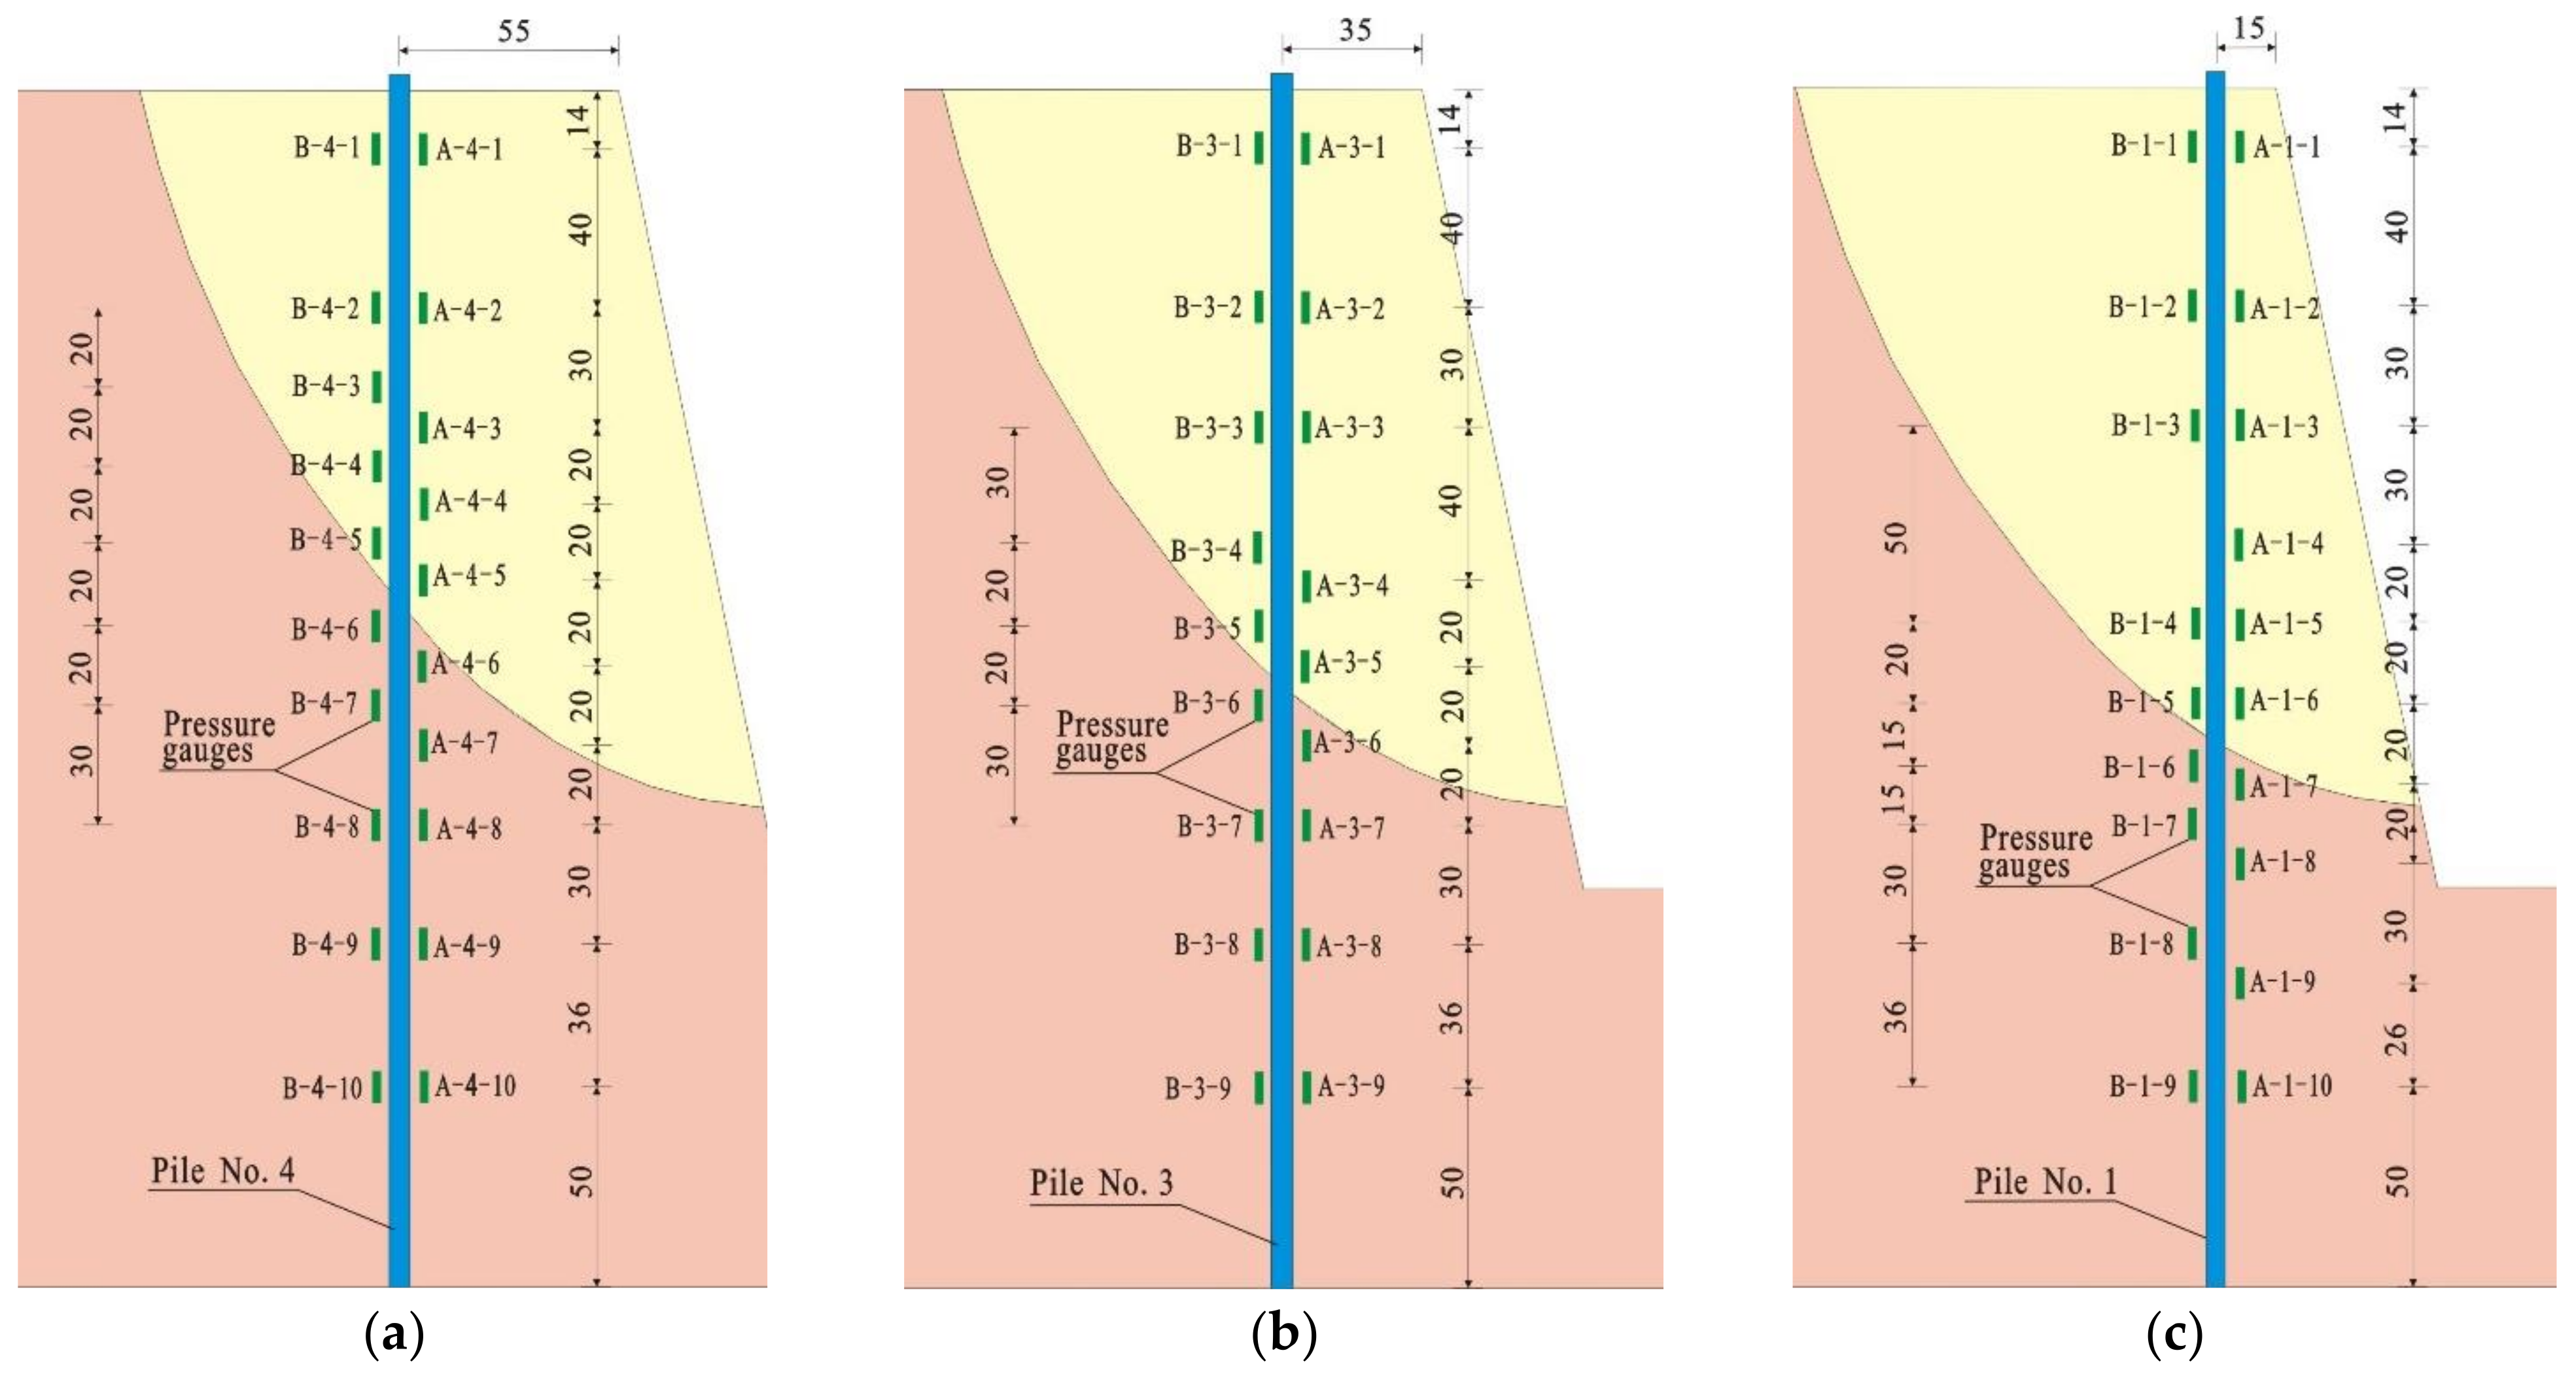
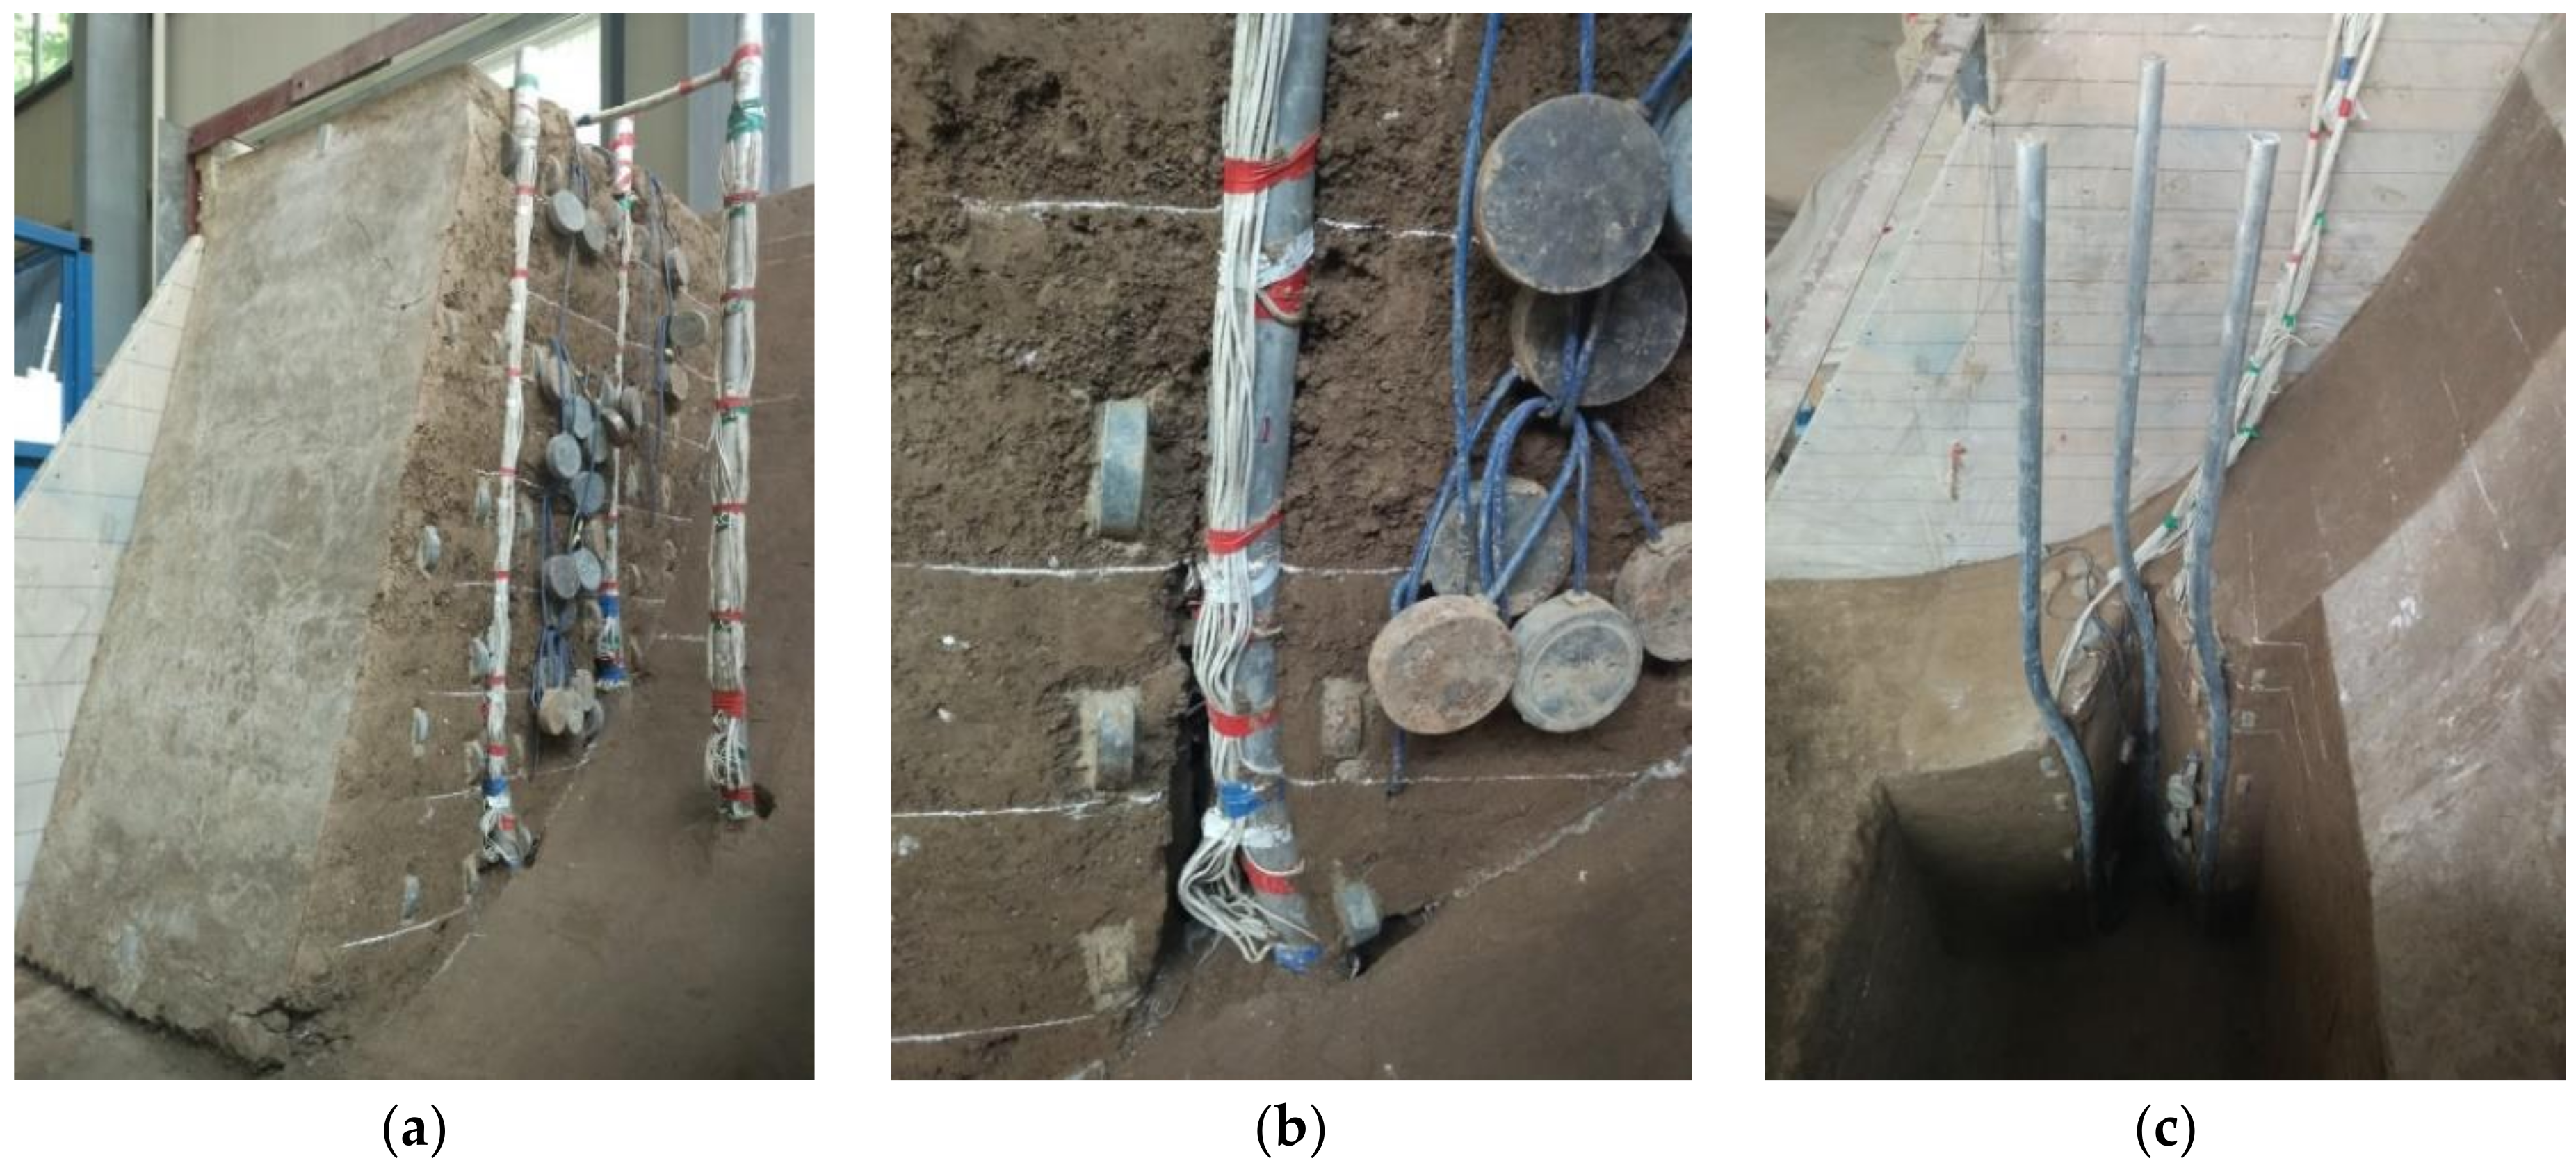
2.4.1. Pressure Measurements for the Micro Piles
The pressure gauges were embedded along the piles, in front of and behind them, in order to monitor the distribution and variation of landslide thrust of the micro-piles, the resistance from the sliding body behind the piles, and the resistance from the sliding bed. The position and number of pressure gauges are shown in Figure 1c and Figure 5.
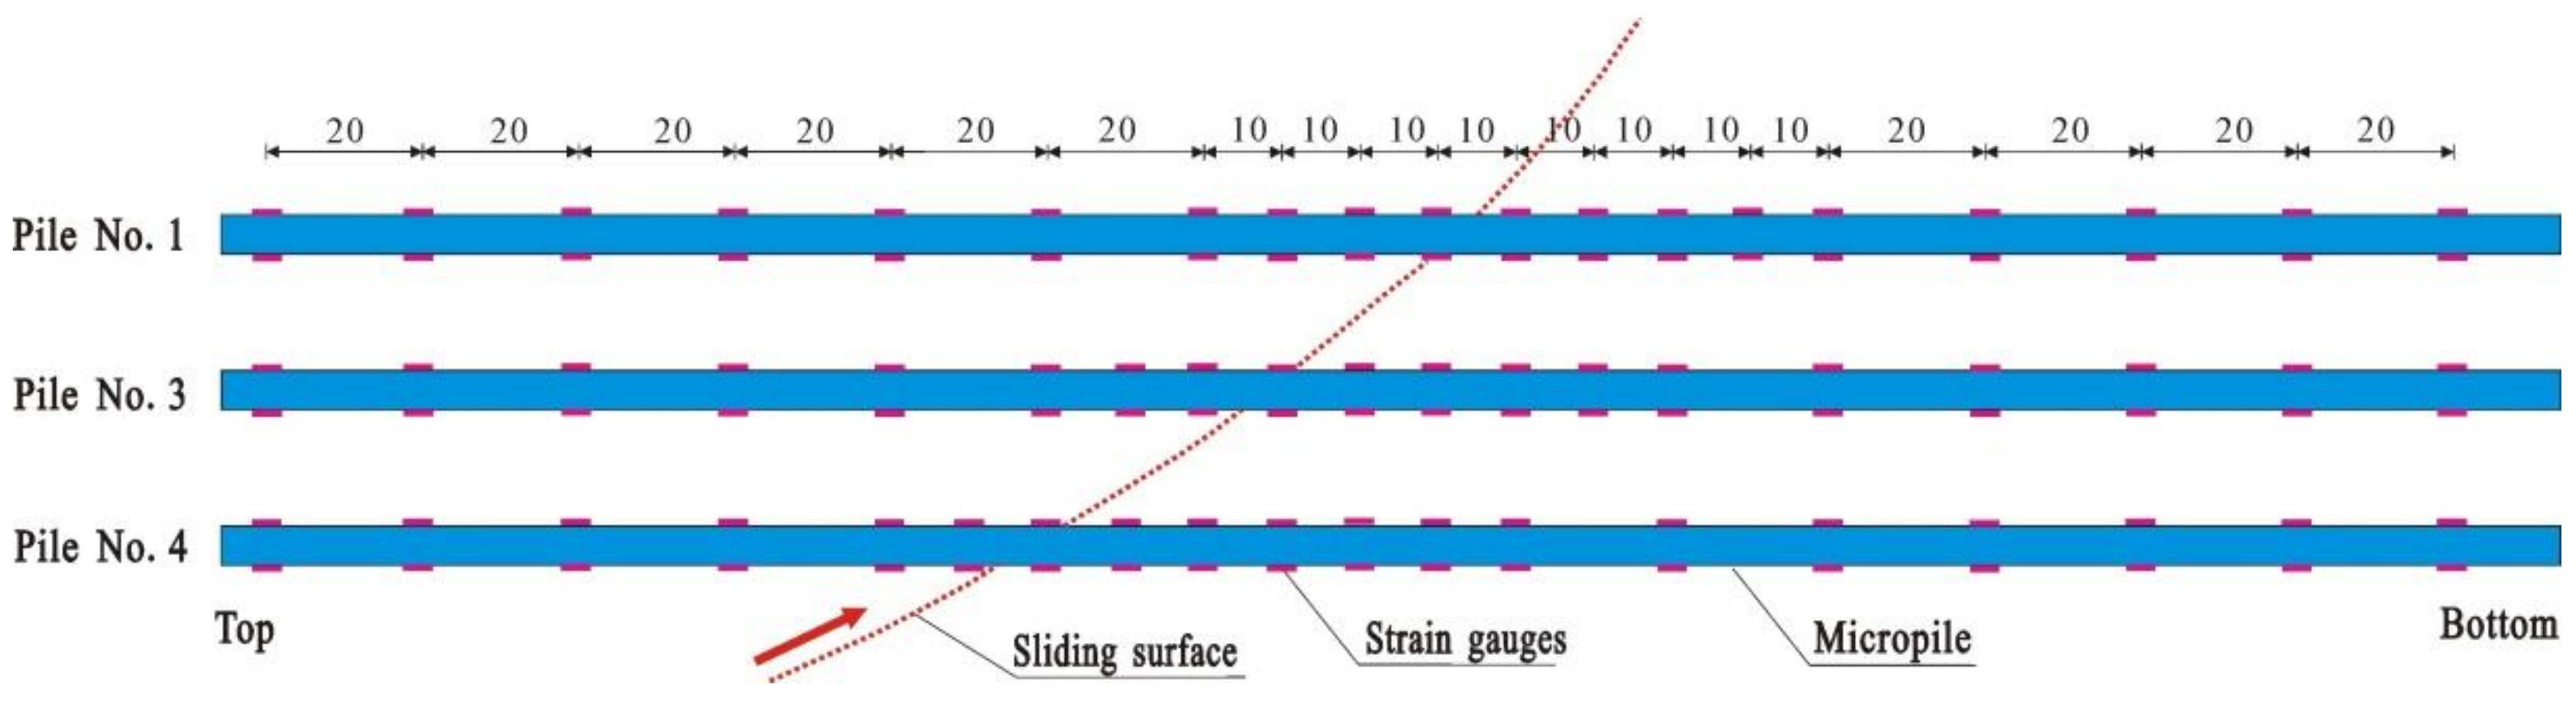
2.4.2. Strain Measurements of the Micro Piles
In order to test the bending moment of the micro-pile, strain gauges were pasted in pairs before and after the piles [23,24,25]. The spacing of the strain gauges is shown in Figure 6. After measuring the strains of different parts of the micro-pile, the bending moments can be obtained by Formula (7):
In the formula, M represents the bending moment, N·m, EI represents the flexural rigidity of the micro-pile, N·m2; , represent the tensile and compressive strains of each measuring point, respectively; and h represents the distance of the tensile and compressive strain gauges at the same section, m.
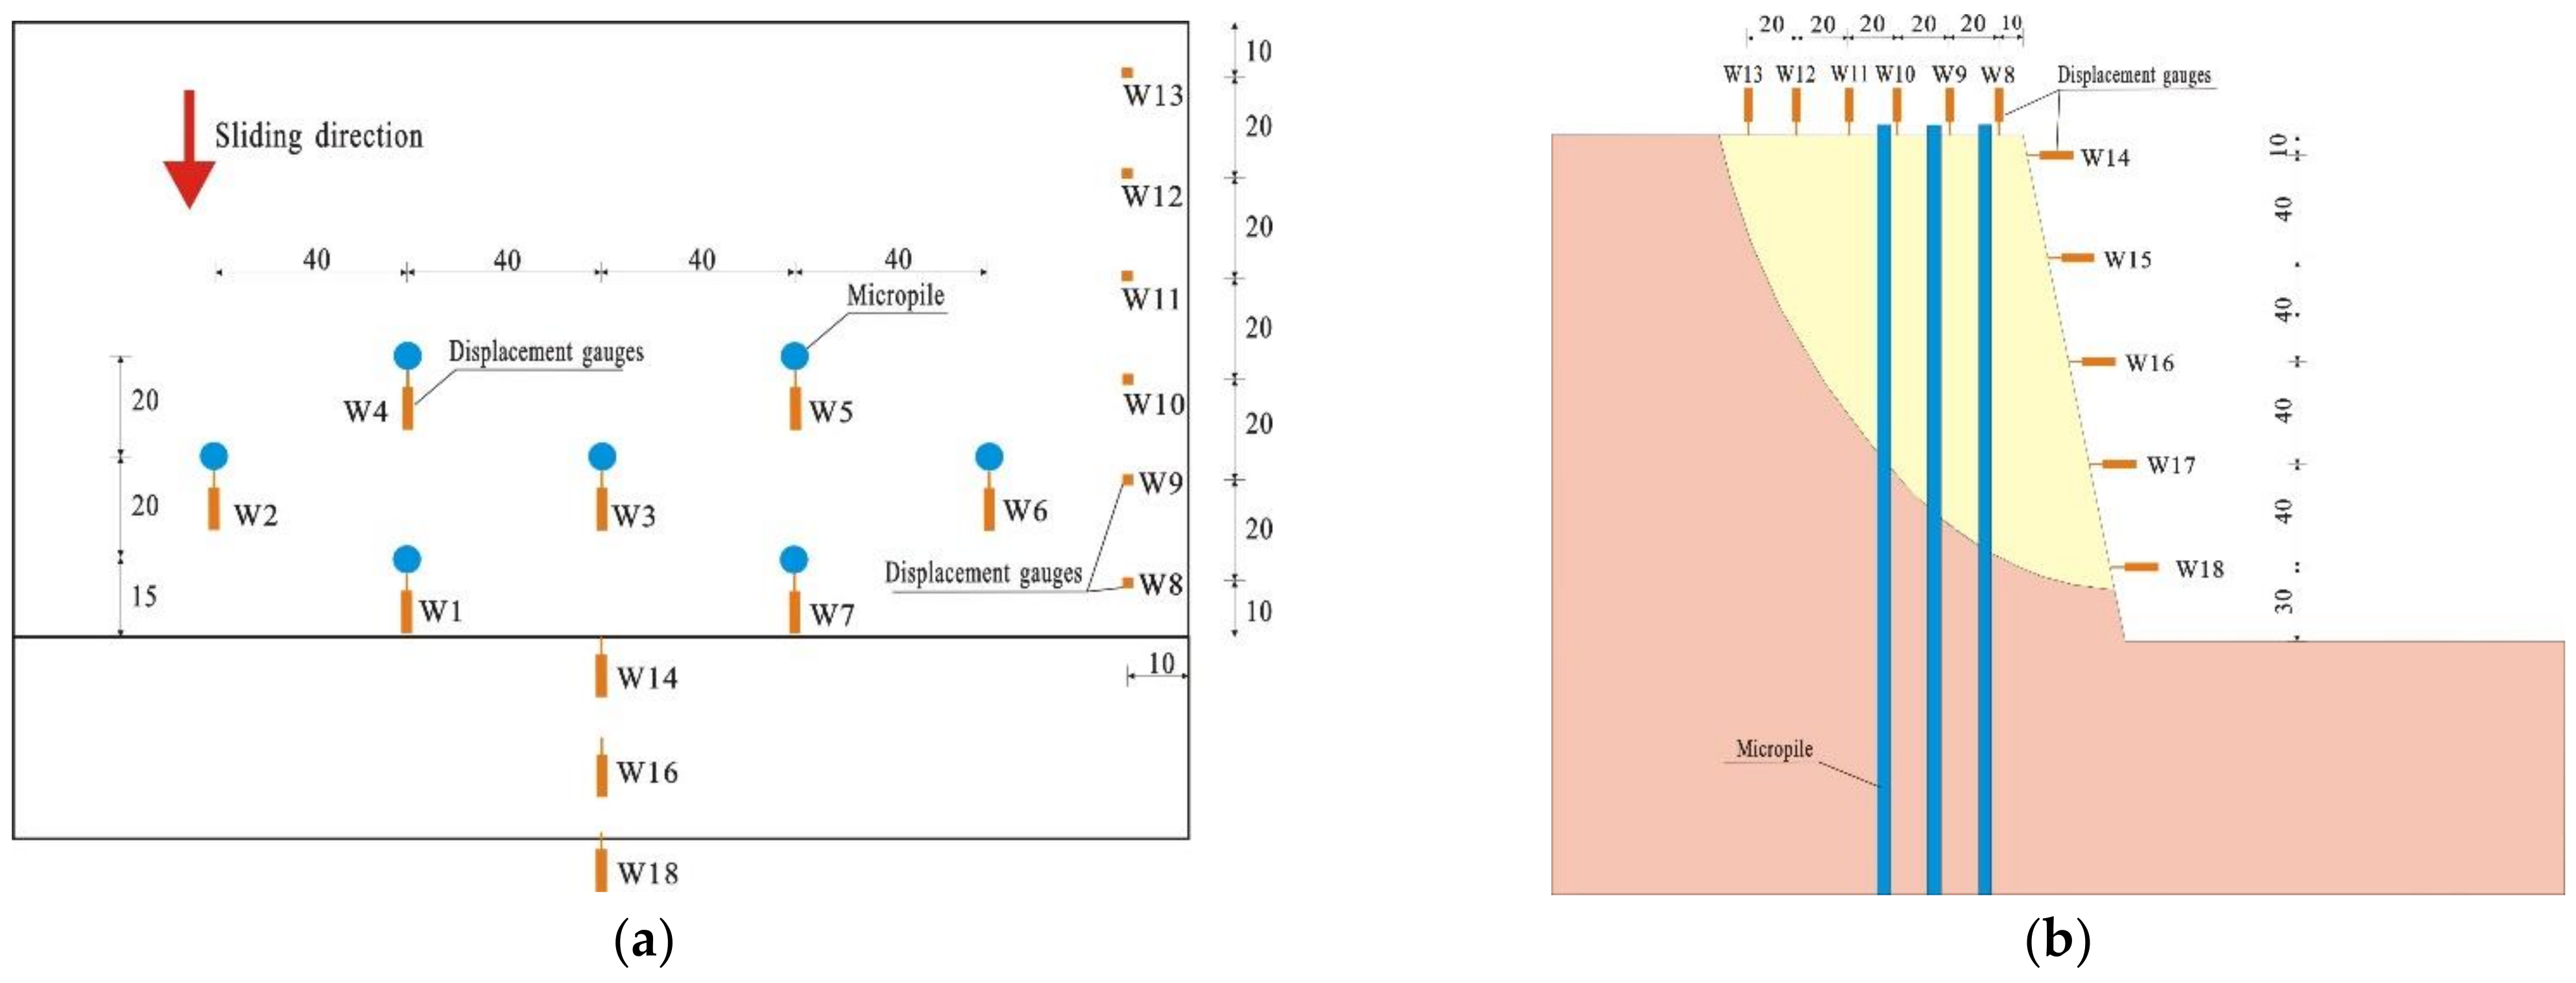
2.4.3. Displacement Measurements
The displacement gauges were placed on the top of the piles as well as at the top of the slope and at the slope surface, aiming to measure the displacement of the piles and slope deformation. The position and number of displacement gauges are shown in Figure 7.
2.5. Excavation and Loading Design
After completion of the filling, the excess soil was excavated to form the designed model shape. The landslide model was excavated five times, each with an excavation depth of 40 cm (Figure 1). After the slope was implemented, layers of sandbags used as the multi-stage loading were placed on the top of the landslide model. Each loading increment was set as 1 kPa. Data measurements were taken after each excavation or loading, and after the measurements were completed, the next level of excavation or loading was performed.
3. Results and Discussion
3.1. Failure Modes of Micropiles
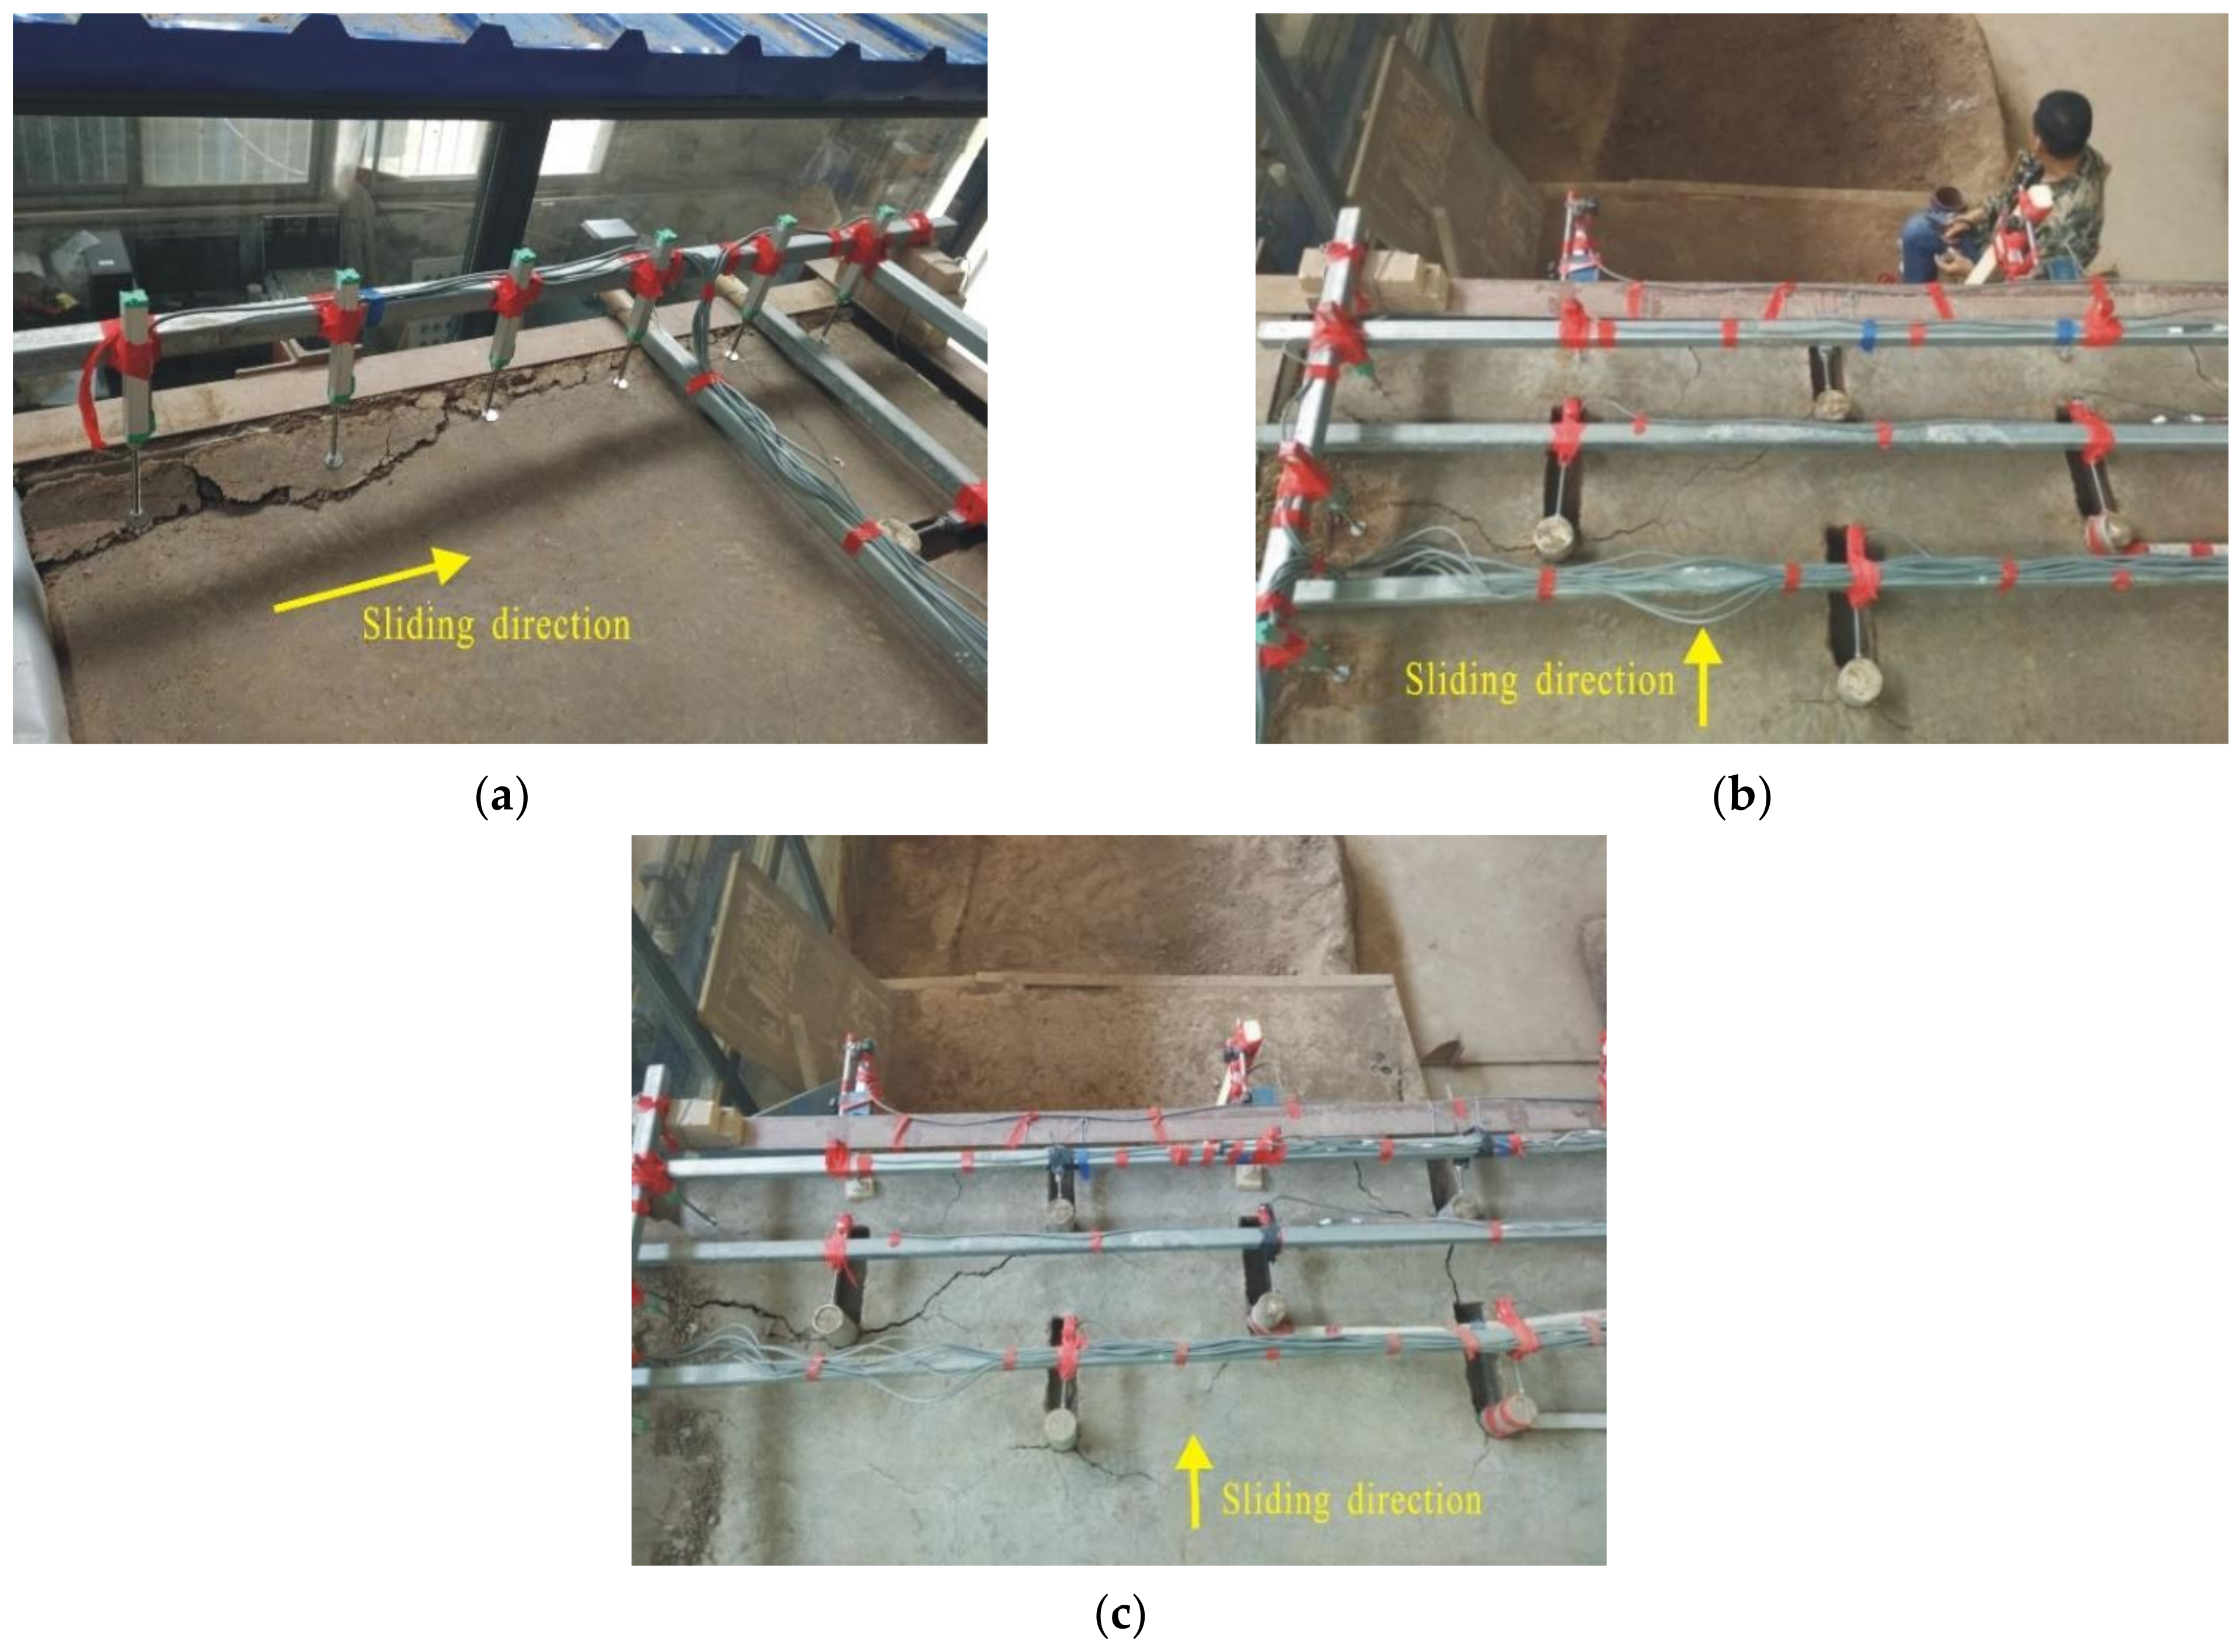
The deformation of the landslide model is shown in Figure 8. After excavation of the shear outlet, the model underwent a large degree of deformation. Figure 8a shows the settlement of the slope top after excavation of the shear outlet. It can be seen that a certain degree of settlement deformation occurred at the top of the slope, especially near the location of the slip surface (trailing edge), and a significant misalignment between the slide body and the original ground was produced. In addition, cracks were produced in the slope near the top of each micro steel pile, as shown in Figure 8a,b. The cracks spread roughly along the lateral direction (perpendicular to the sliding direction) but were not fully penetrated. The generation of cracks in the vicinity of the micro-pile indicated that a certain degree of deformation of the micro-pile had occurred by that time. This is due to the deformation of the micro-pile body above the slip surface in the sliding direction, which squeezes the soil behind the pile and creates cracks between the soil both behind the pile and in front of the pile. Since the width of the crack was not large and not fully penetrated by that time, the deformation of the slide body mainly occurred along with the overall sliding of the slip surface. In this process, the micro-pile body within a certain area near the top of the pile is deformed together with the slide body. After loading to the end of the test (Figure 8c), the crack width of the slope near the top of the pile increased, but was not completely penetrated in the lateral direction, further illustrating the results of the above analysis.
Figure 9 shows the excavation profile at the end of the test. It can be seen that in the case of the preset slip surface, the slide body slides completely along the slip surface. The micro steel pile was deformed significantly under the action of the sliding body. The micro steel pile was deformed near the slip surface, nearly in an “S” shape. The damage to the micro-pile existed 40 cm above and below the slip surface (eight times the pile diameter), while the pile below the slip surface was deformed to the back slide side, indicating that the pile was under tension on the slide side. The deformation of the pile above the slip surface underwent reverse bending due to the force resistance of the slide body behind the pile, which reflects the compression effect of the soil body on the back slide side. Due to the relative deformation of the pile and the soil near the slip surface, a part of the debonded area was created near the slip surface. However, because of the good plasticity of the soil due to the moisture content of the test soil, the debonding area did not extend far in the lateral direction, and its effect can be neglected.
3.2. Force Condition of Micropiles
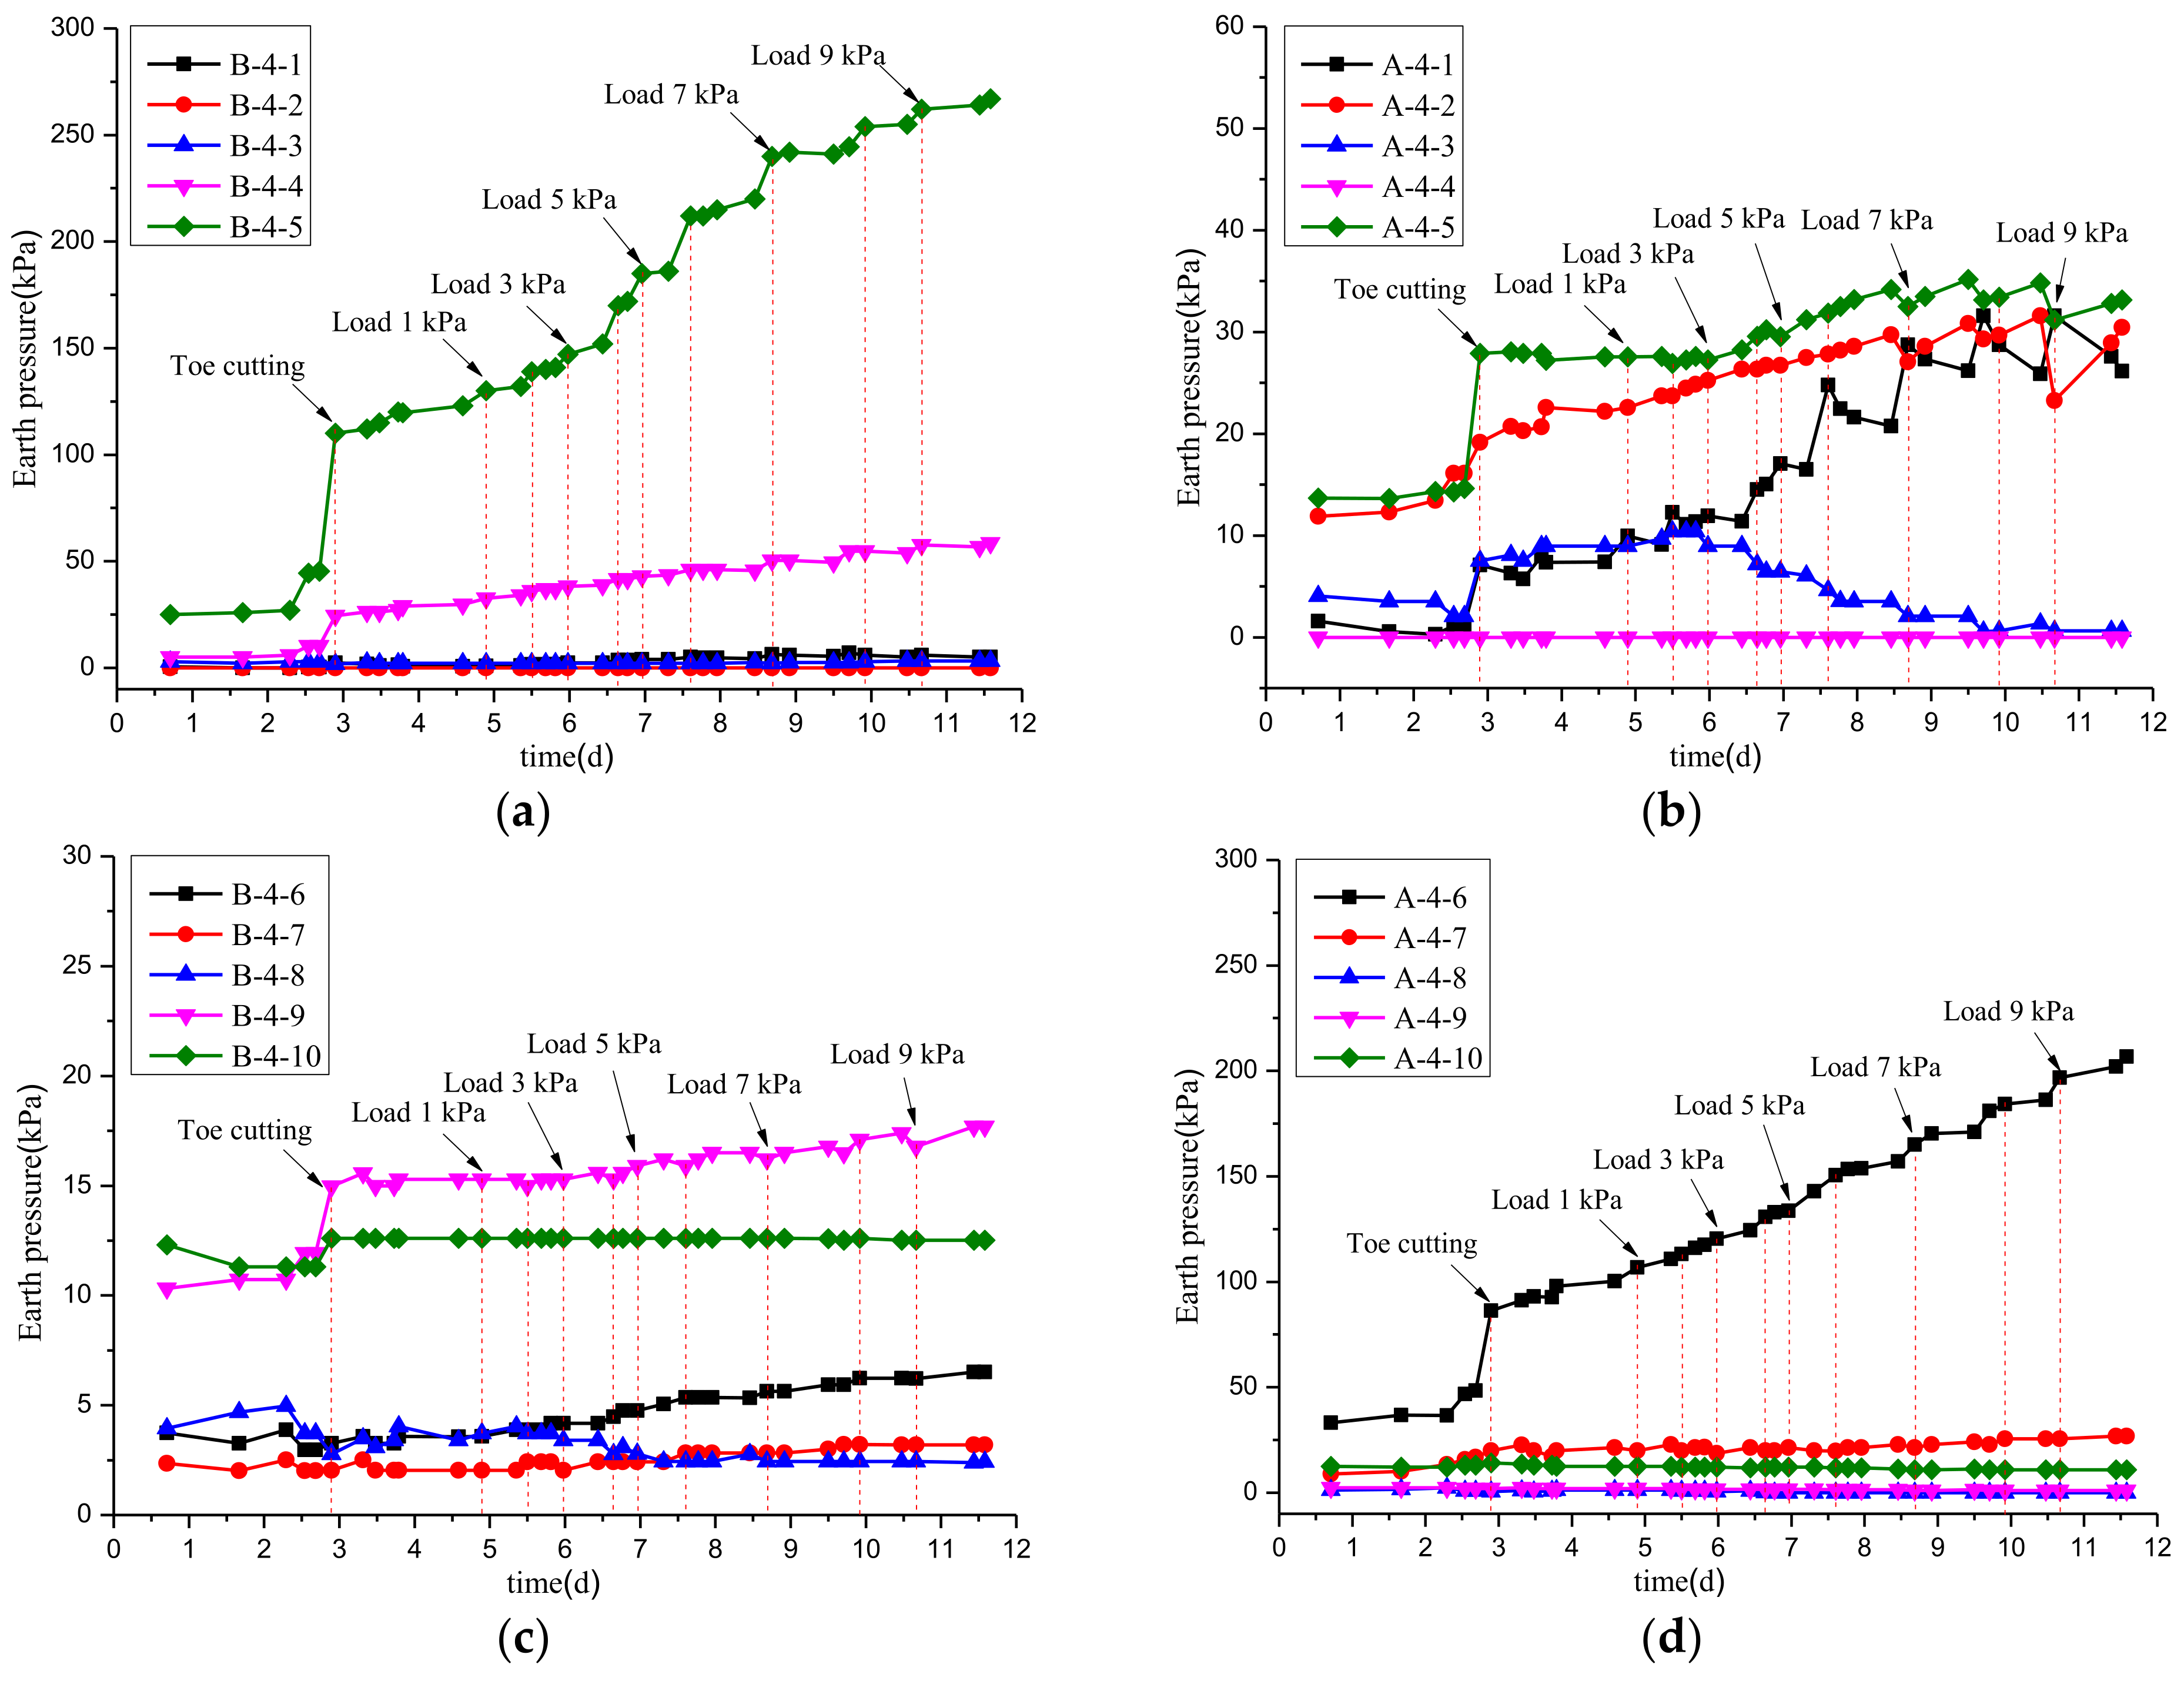
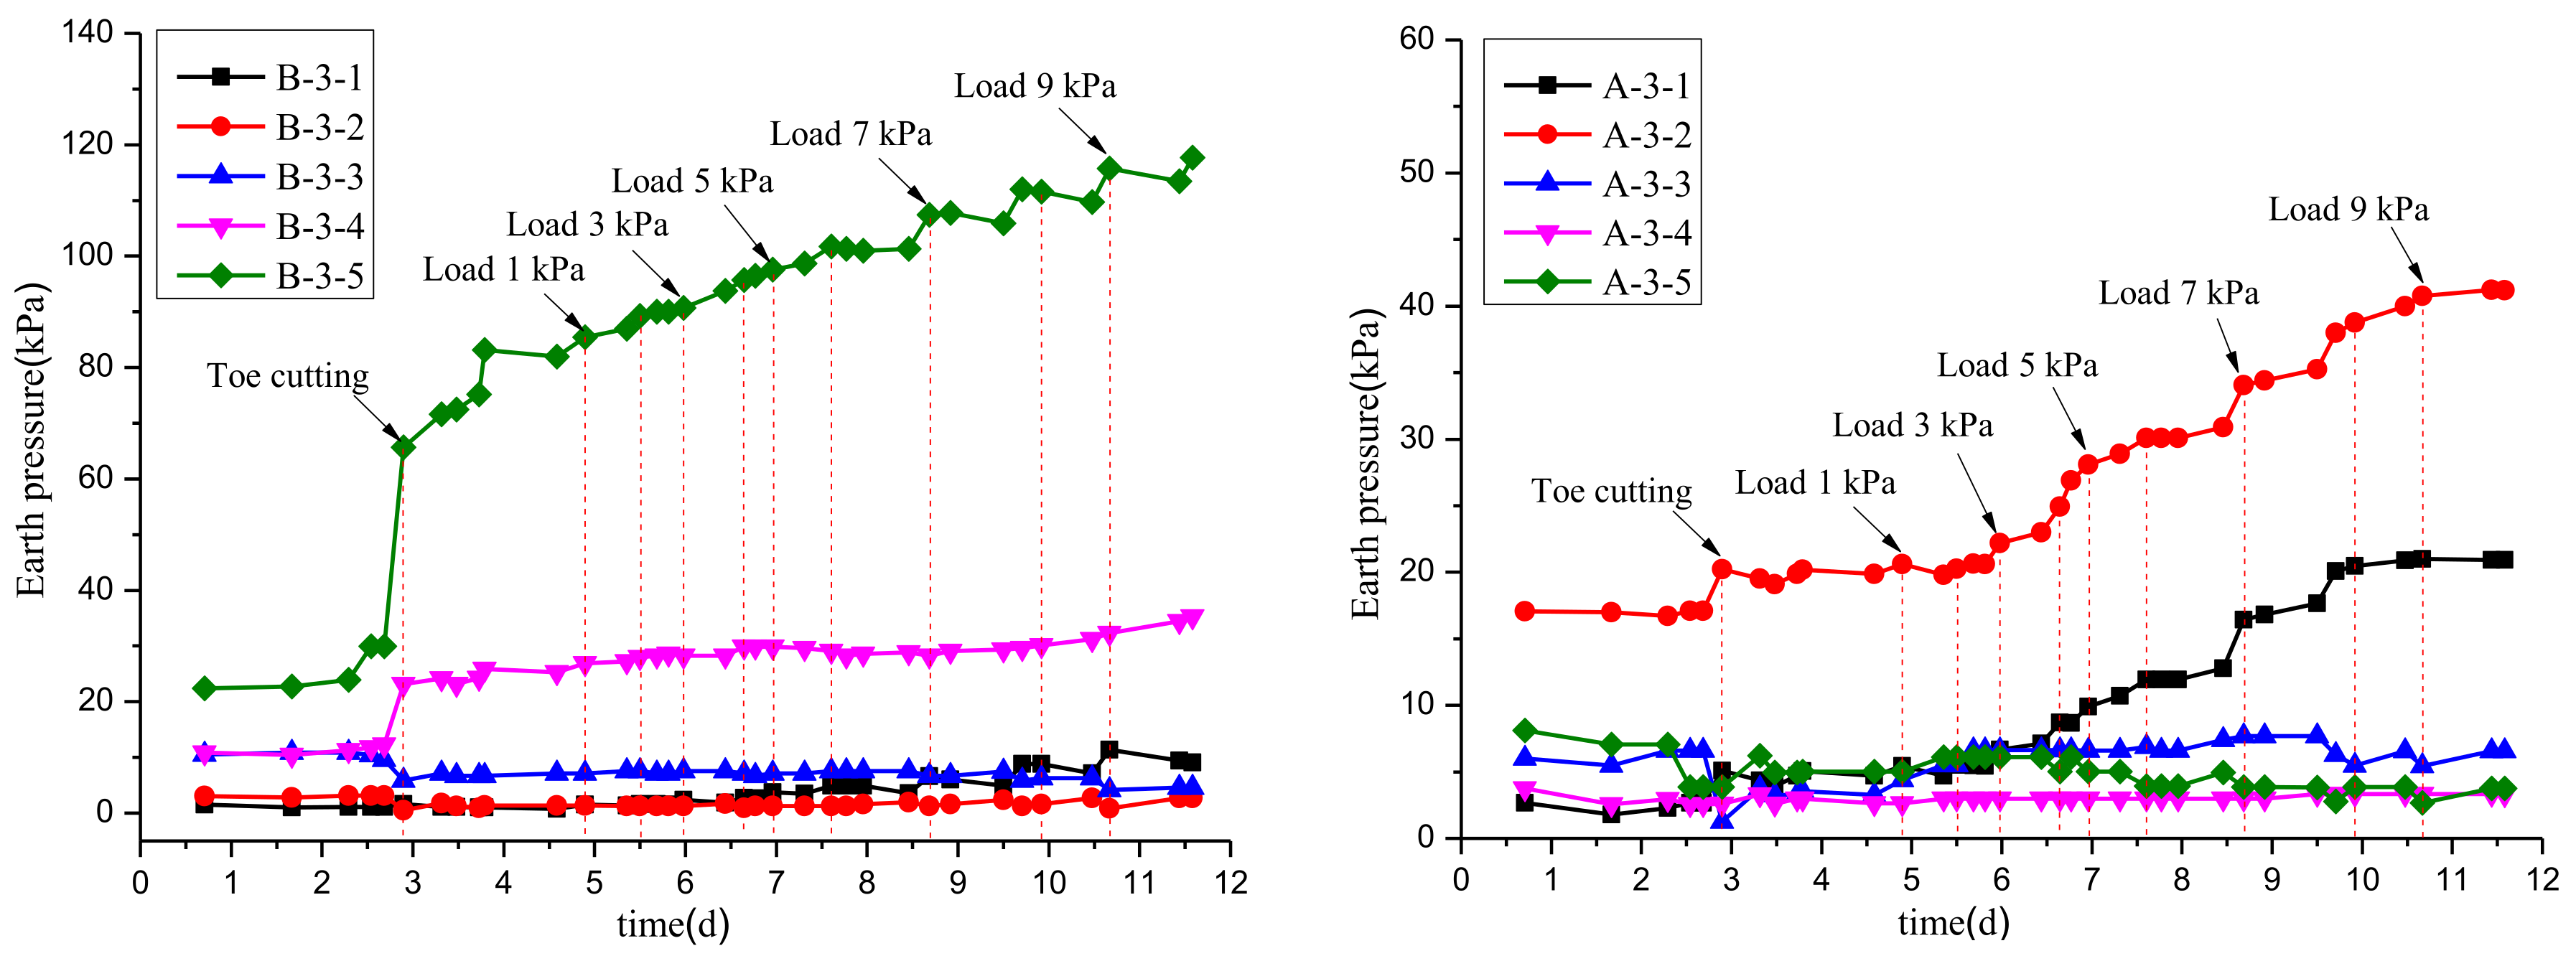
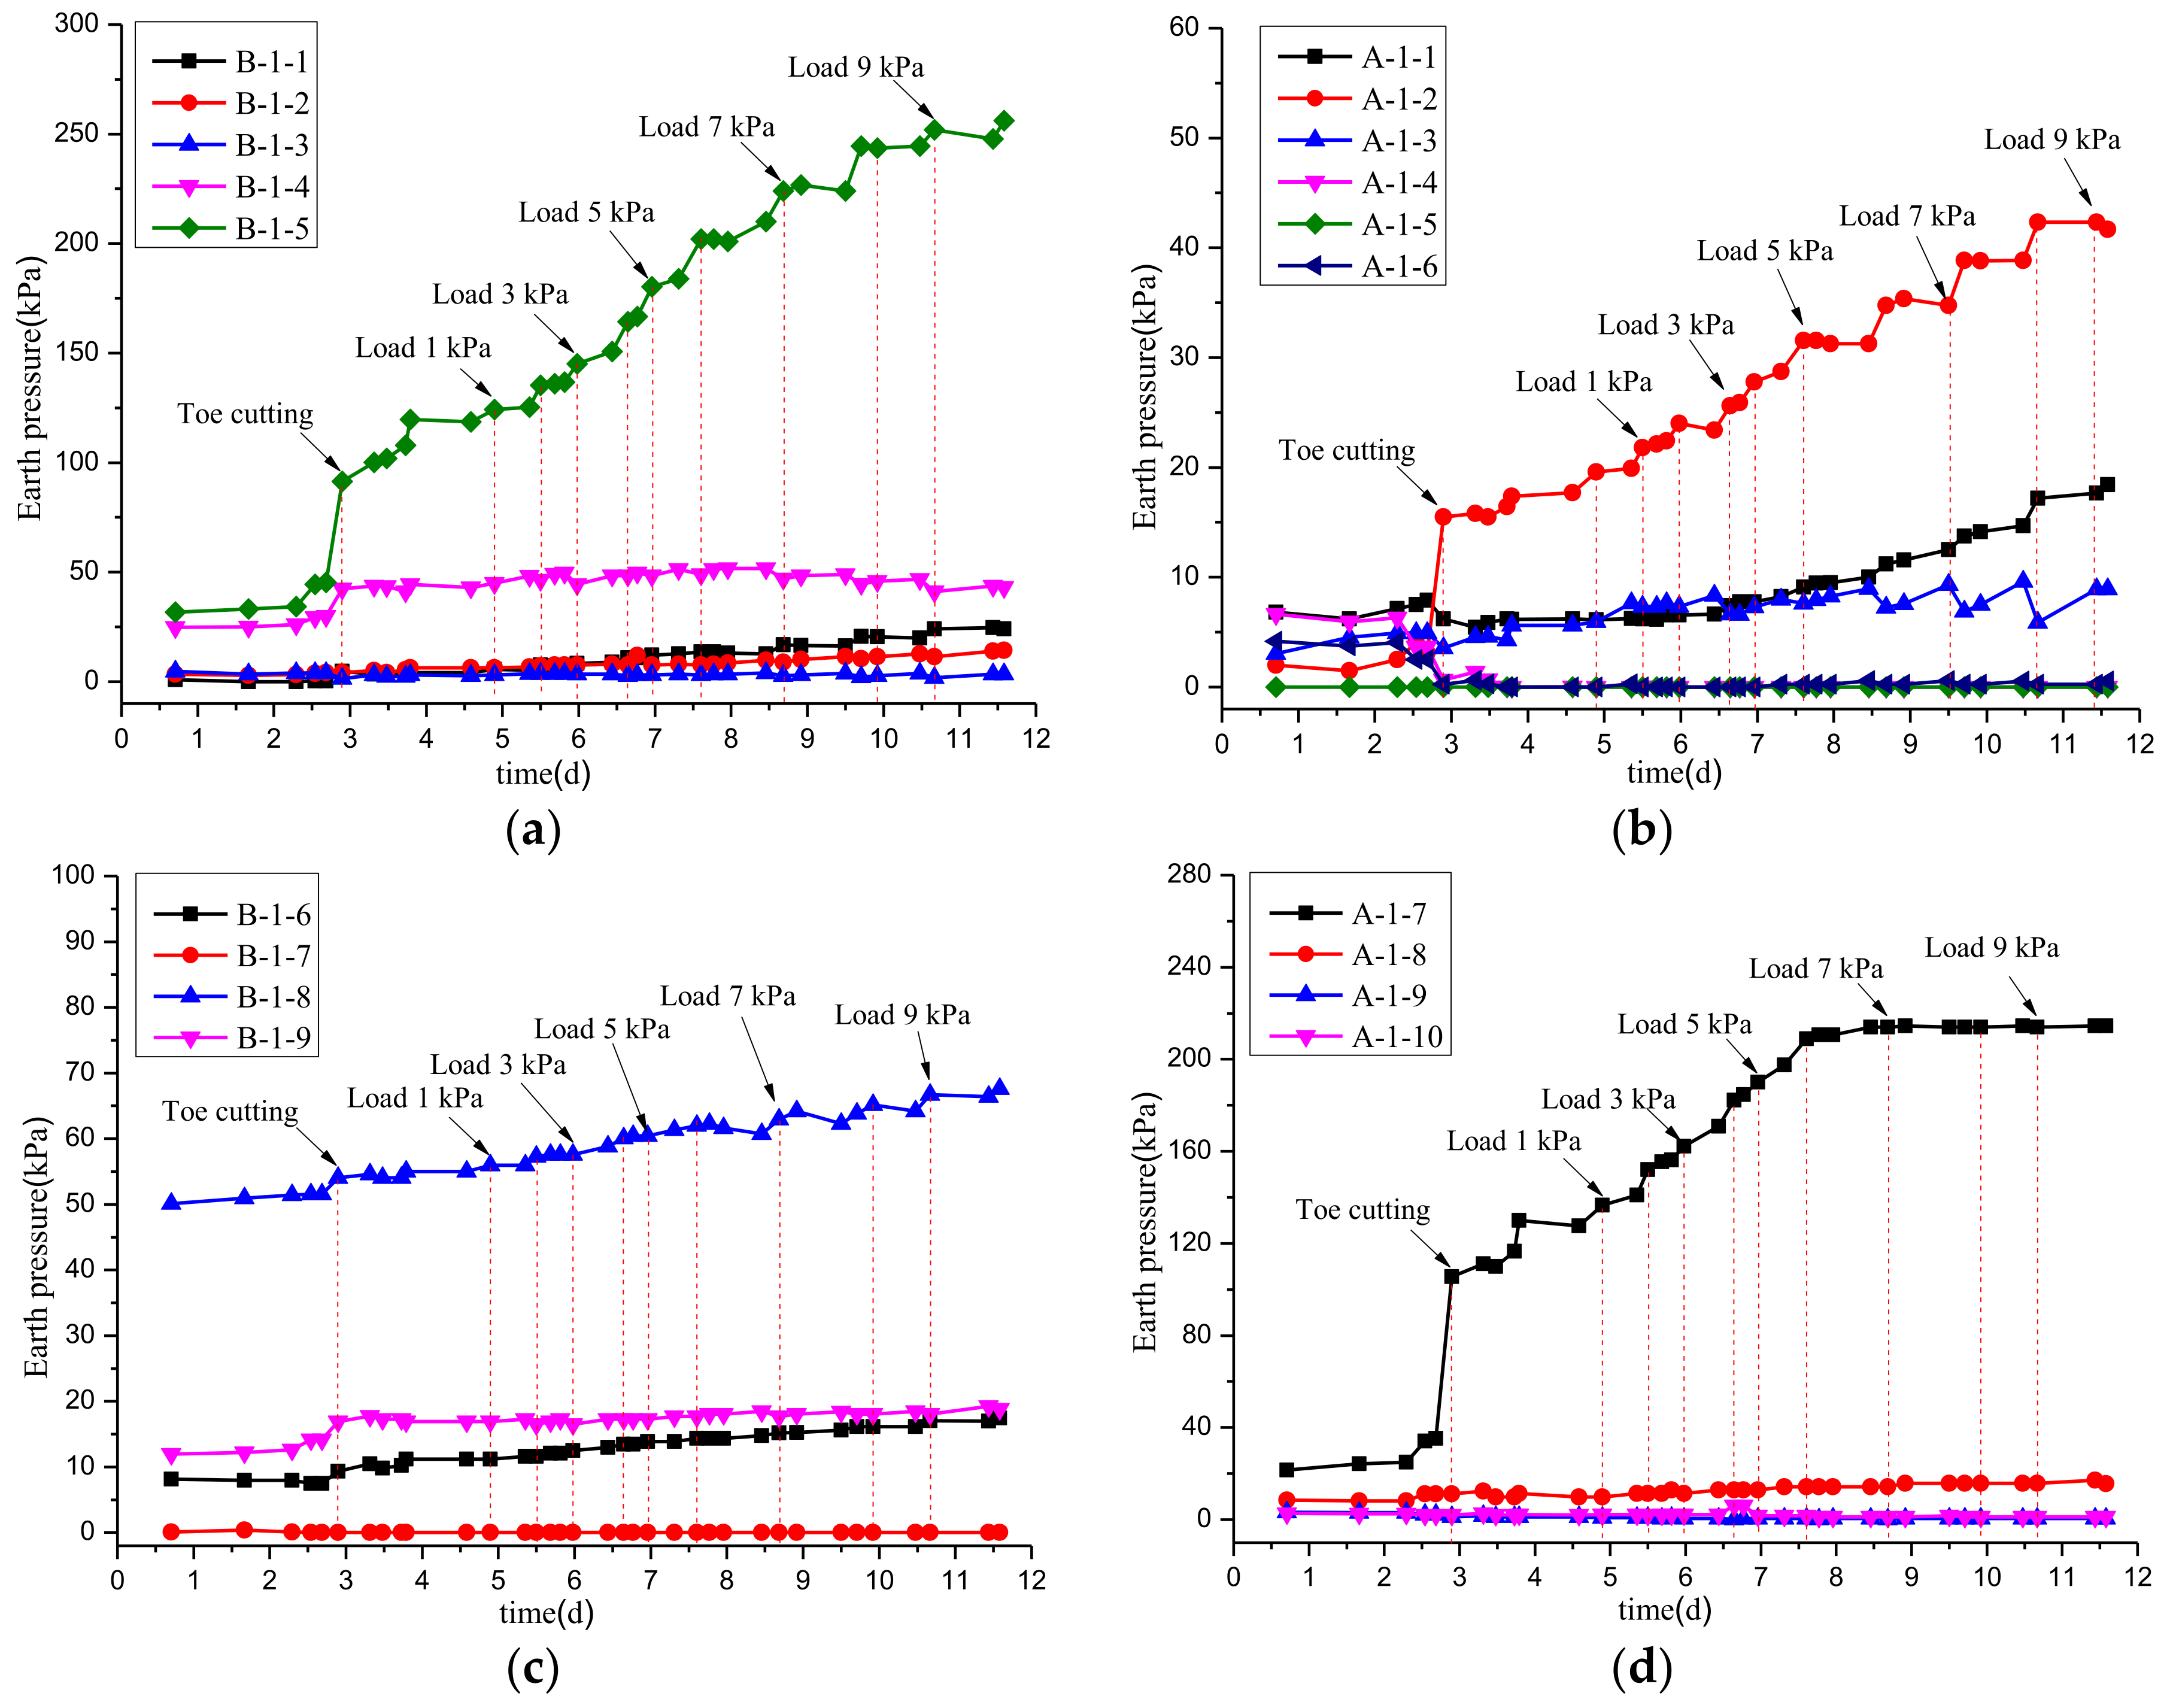
Figure 10, Figure 11 and Figure 12 show the variation curves of the earth pressure at the measurement points before and behind pile 4 (first row), pile 3 (second row), and pile 1 (third row), respectively. The pile section above the slipping surface was regarded as the anti-sliding segment of the pile. The pile section under the slipping surface was regarded as the anchoring section of the pile.
The variation pattern of earth pressure before the anti-sliding segment of piles is shown in Figure 10a, Figure 11a, and Figure 12a. The earth pressure at the first measurement point upon the sliding surface (B-4-5, B-3-5, and B-1-5) was larger and varied most significantly during the test. The earth pressure at the point of the three rows of piles all increased rapidly at the same time after excavation of the shear outlet, indicating that the three rows of piles were stressed simultaneously. From after loading until the end of the test, the earth pressure at these points maintained a pattern of continuous increase. The earth pressure at the second measurement point upon the sliding surface (B-4-4, B-3-4, and B-1-4) was also relatively high. After excavation of the shear outlet, the earth pressure at these measurement points increased to different degrees with increasing loading. It is worth noting that the magnitude of the earth pressure and its variation at the second measurement point was less than that at the first measurement point. The earth pressure at the measured points in the rest of the anti-sliding section (upper part of the anti-sliding section) was relatively low, and did not vary to a great extent during the test.
After excavation of the shear outlet, the original supporting soil at the leading edge of the landslide was removed, and the slope slid along the predetermined sliding surface. As the sliding body acted on the micro-pile, it led to increasing earth pressure at the measurement point in front of the pile, in the loaded section. From the change of earth pressure in front of the three piles, it can be seen that the rows of piles were subjected to the action of landslide thrust at the same time when the slope was deformed. It can also be inferred that most of the anti-sliding section of piles deformed together with the sliding body, and that the degree of mutual extrusion was weak, resulting in less earth pressure in the area. Near the sliding surface, the deformation of the pile body and the soil in front of the pile was relatively large, which caused the stress concentration zone formed by the extrusion in this area.
The variation pattern of earth pressure behind the anti-sliding section of the piles is shown in Figure 10b, Figure 11b and Figure 12b. Among these measurement points, the earth pressure at the second measurement point (A-*-2) under the top of the slope was the largest, and also varied the most during the test. After excavation of the shear outlet, the earth pressure at these measurement points (A-*-2) began to increase significantly. After that, with the increase in loading at the top of the slope, the earth pressure showed a pattern of earth pressure first increasing, and then gradually stabilizing after each loading. The earth pressure at the measurement point (A-*-1) located near the top of the pile was also relatively high, and the earth pressure increased to a certain extent after excavation of the shear outlet. After that, the earth pressure gradually increased with the increase in loading, especially after loading to 4 kPa. The earth pressure at the measurement points in the rest of the anti-sliding section (the lower part of the anti-sliding section) were relatively low, and did not vary to a great extent during the test. With the deformation of the slope, the anti-sliding section deformed under the action of landslide thrust. The pile body in the upper part of the anti-sliding section compresses the soil behind the pile, increasing its earth pressure. The pile body in the lower part of the anti-sliding section detached from the soil behind the pile to varying degrees, resulting in lower earth pressure.
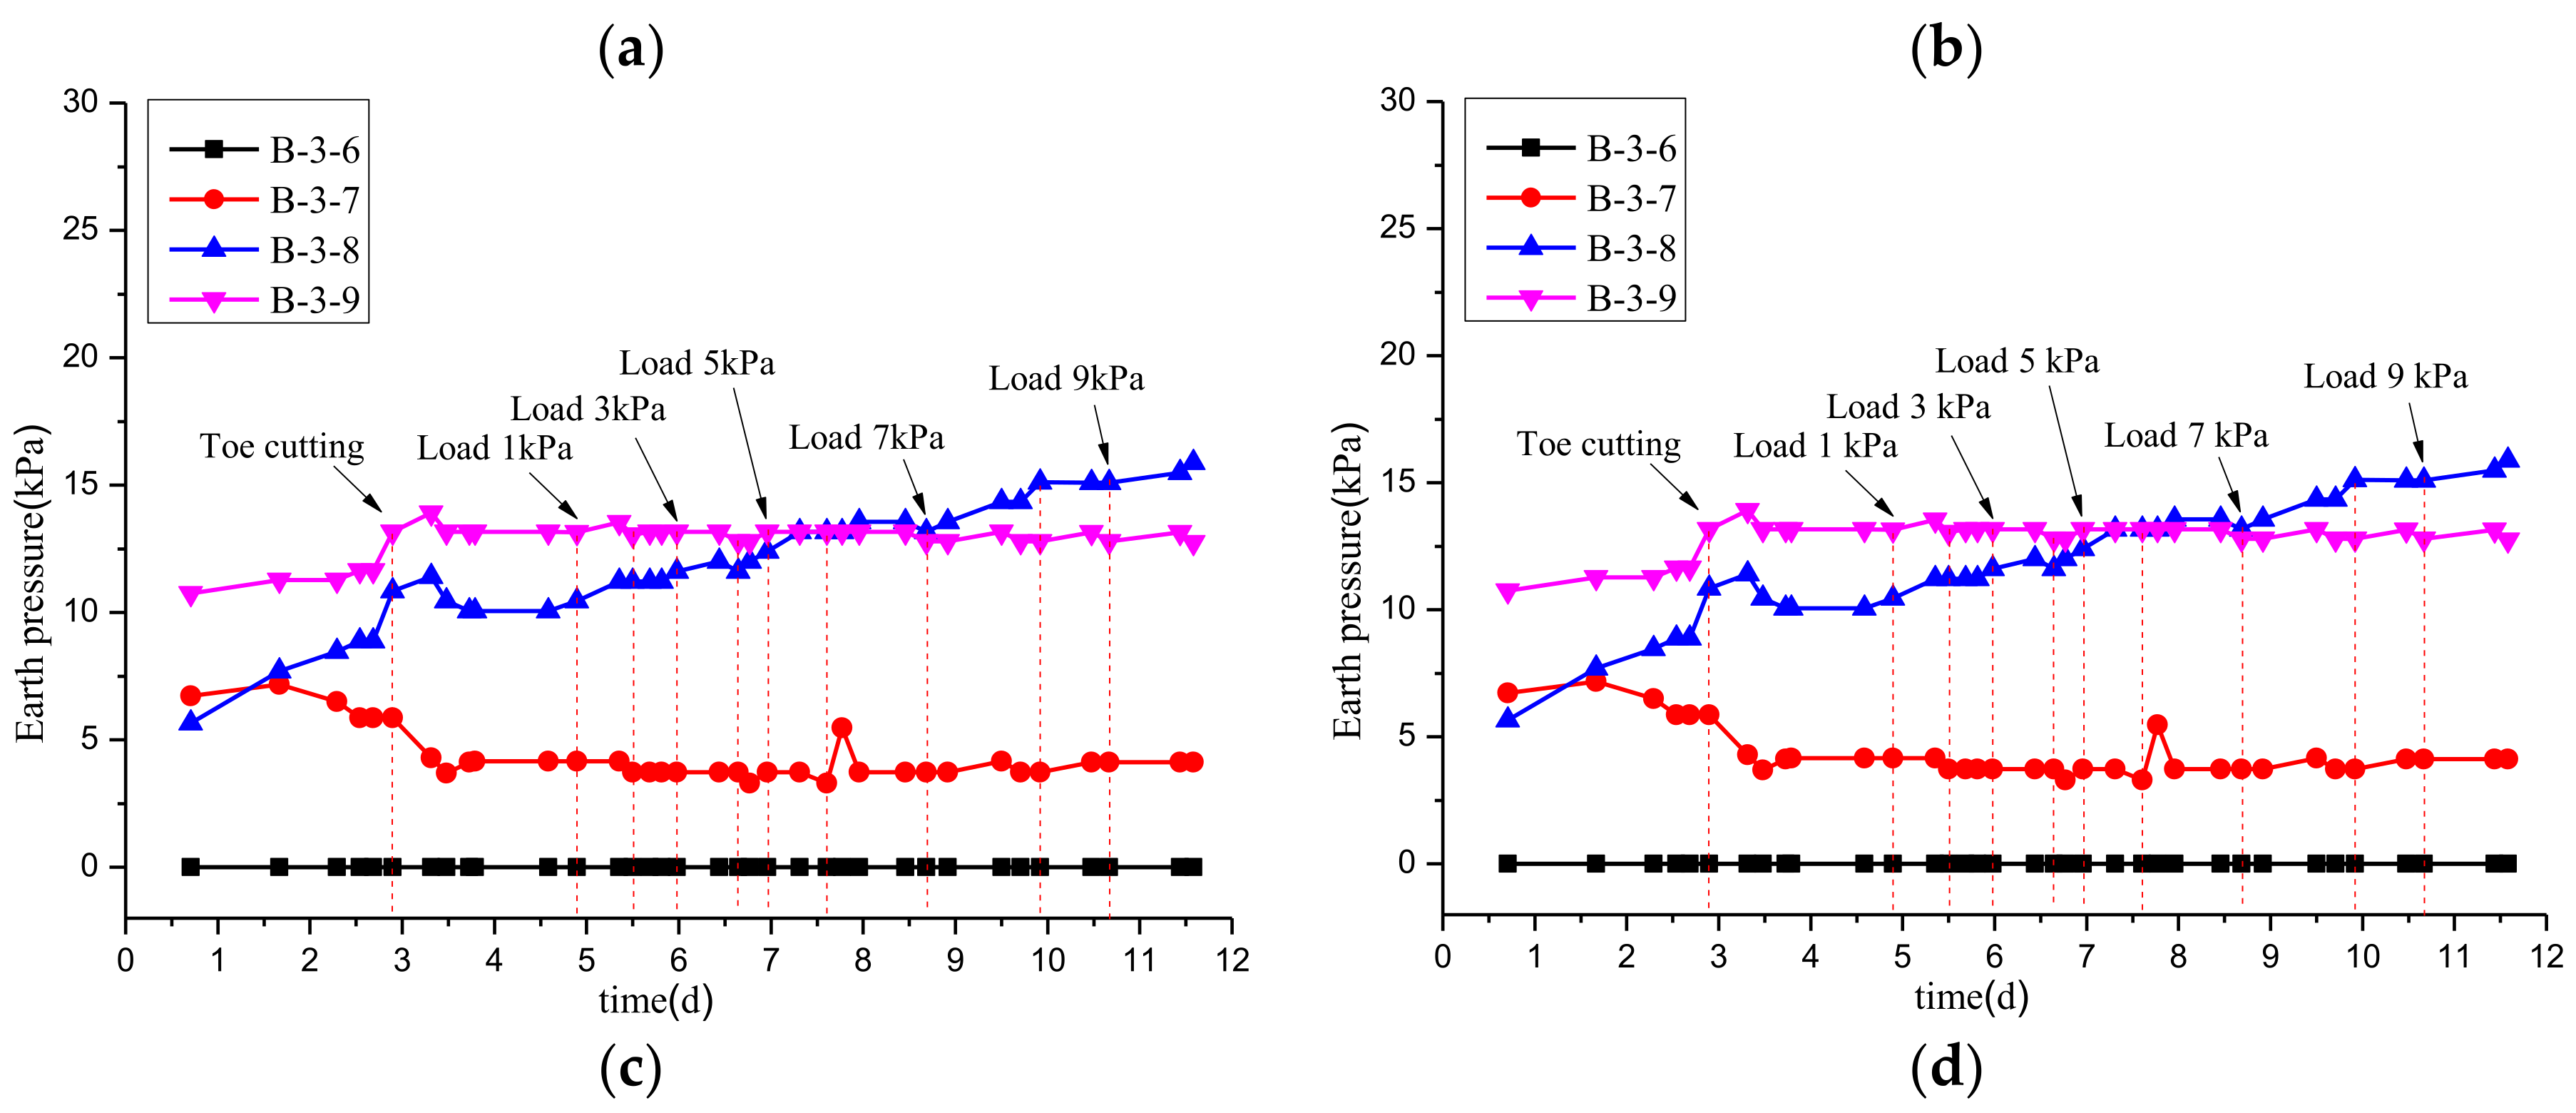
The variation in earth pressure in front of the anchoring section of the piles is shown in Figure 10c, Figure 11c, and Figure 12c. It can be found that the earth pressure in front of the anchoring section of each row of piles had a low value in general. Overall, the area of relatively high earth pressure was located in the lower half of the anchoring section. The earth pressure at the measurement points located within the upper half of the anchoring section was either relatively low or zero. After excavation of the shear outlet, significant deformation of earth pressure occurred in different areas. During the loading process thereafter, the earth pressure did not change much. Due to the deformation of the micro-pile by the force, the pile body within the upper half of the anchoring section had different degrees of detachment from the soil of the sliding bed in front of the pile, resulting in lower earth pressure in this area. At the same time, due to the elasticity of the micro-pile itself, the pile body located in the lower half of the anchoring section squeezed the sliding bed soil in front of the pile, resulting in a relatively high earth pressure in this area.
The variation of earth pressure behind the anchoring section of the piles is shown in Figure 10d, Figure 11d, and Figure 12d. Overall, the earth pressure at the first measurement point under the sliding surface was larger, and varied considerably during the test. The earth pressure at these points increased sharply after excavation of the shear outlet, indicating that a large degree of deformation of the micro-pile occurred at this time. The earth pressure of the three rows of piles increased at the same time, which further indicated the simultaneous force deformation of each row of piles. The earth pressure at the remaining measurement points behind the anchoring section of each row of piles was relatively low and remained unchanged during the test, indicating that the sliding bed resistance behind the piles was mainly provided by the sliding bed soil in a very small area under the sliding surface.
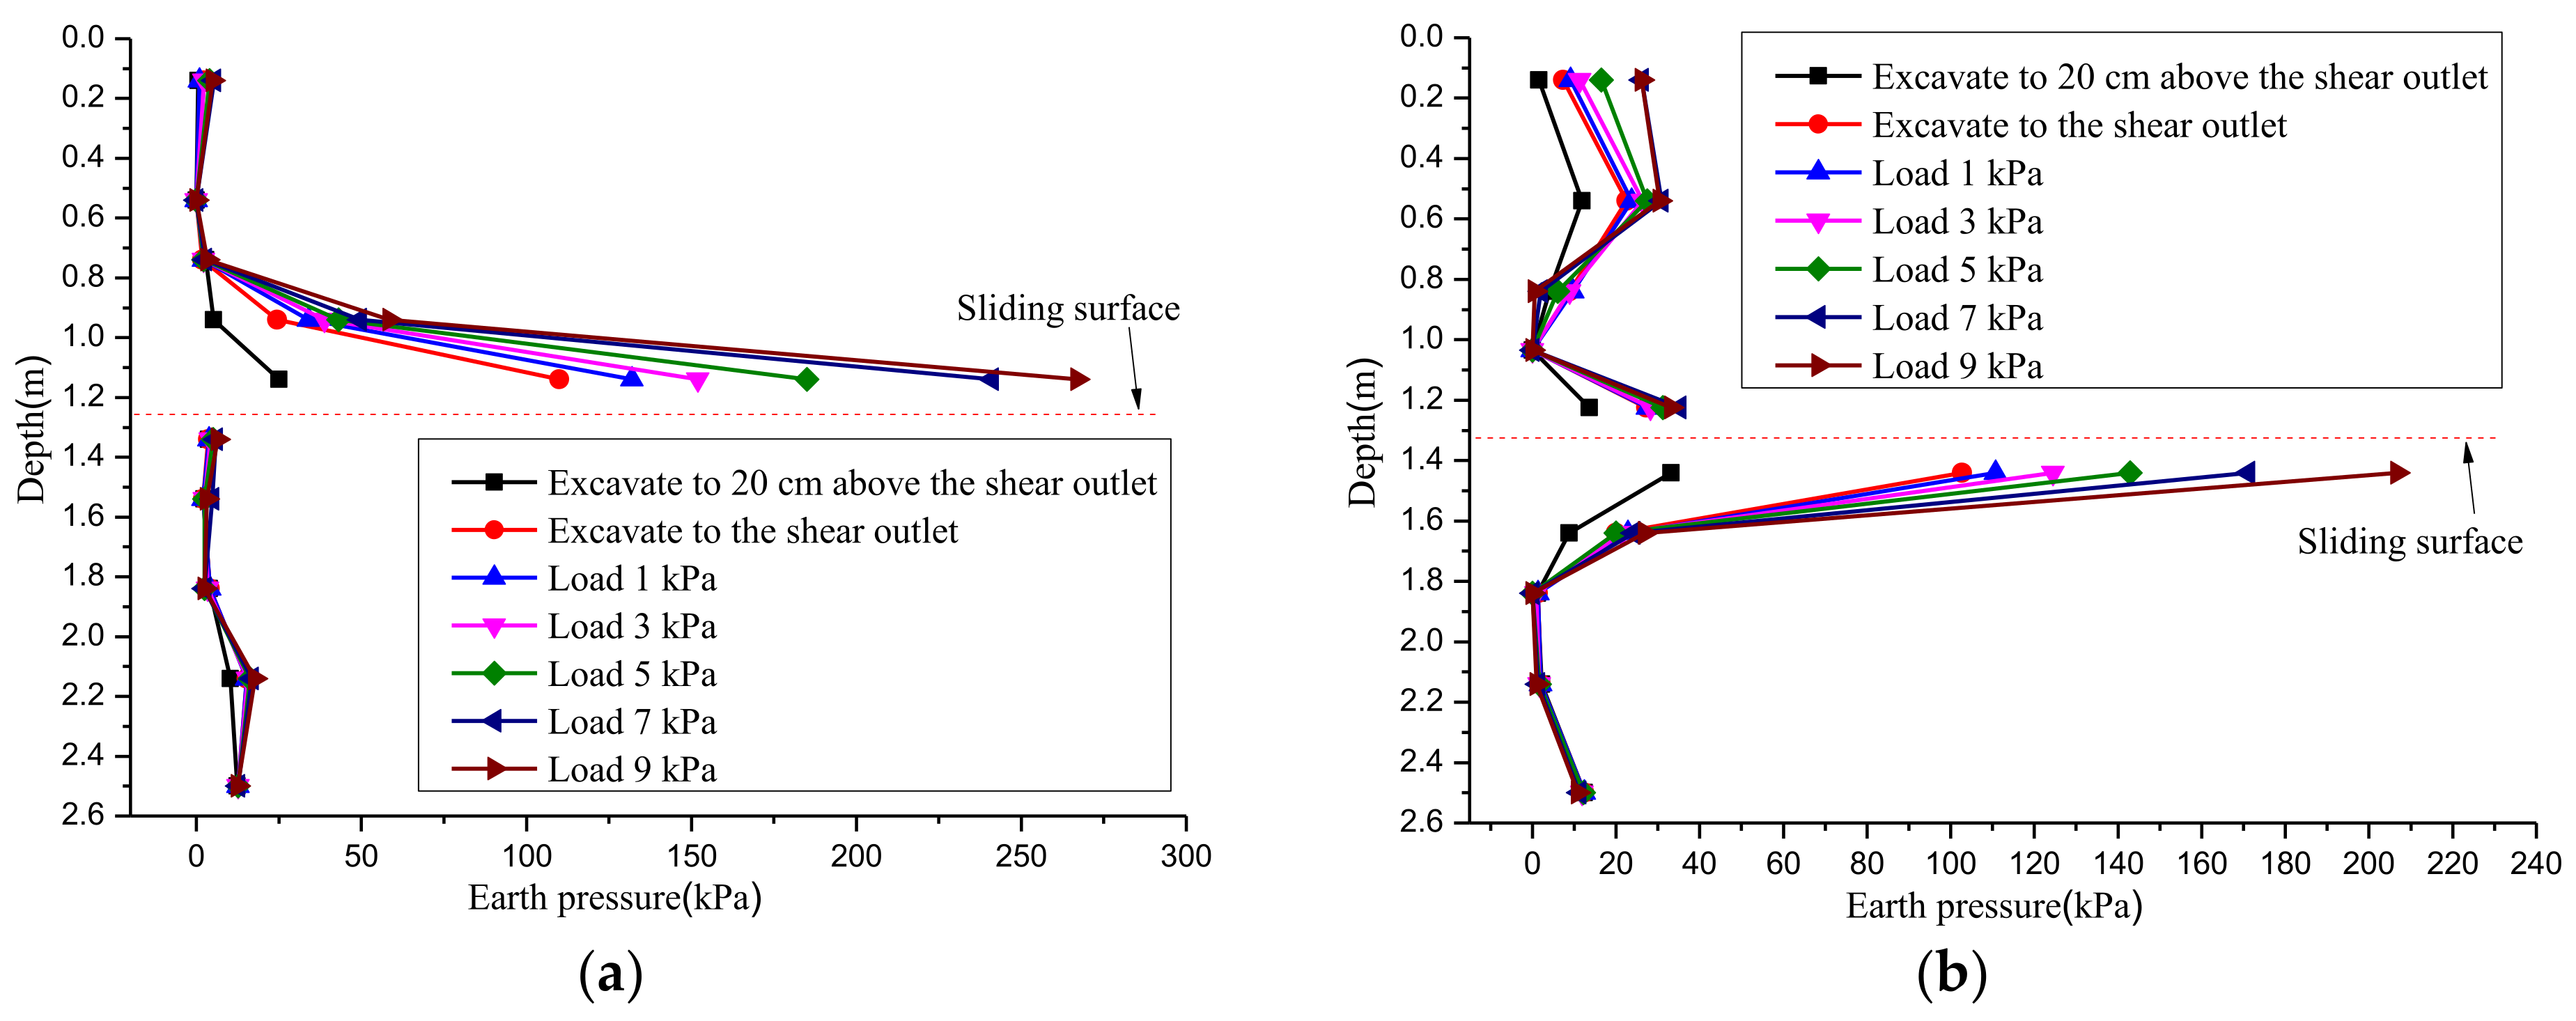
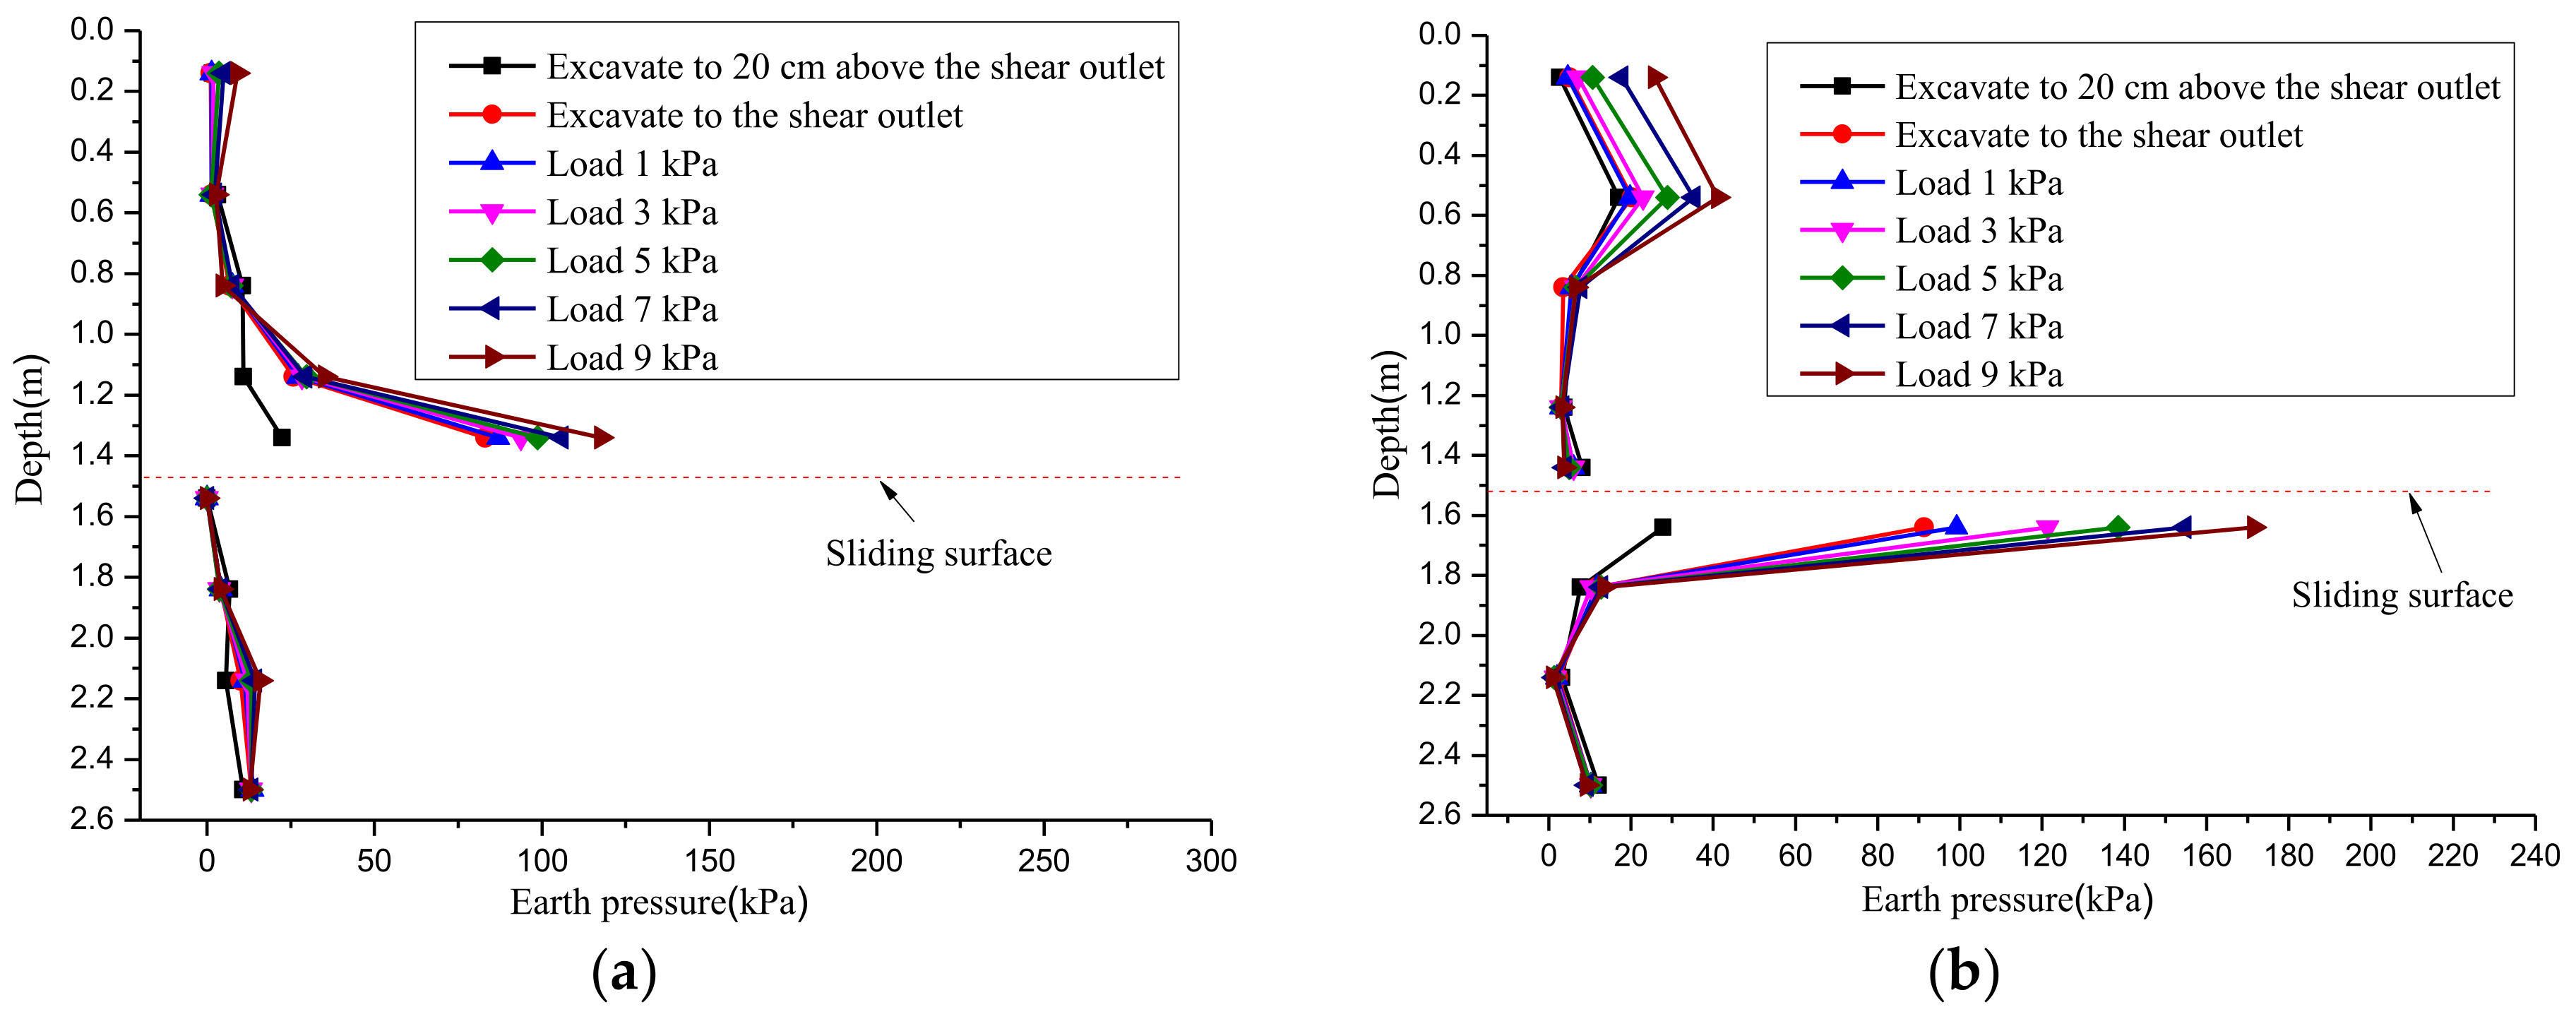
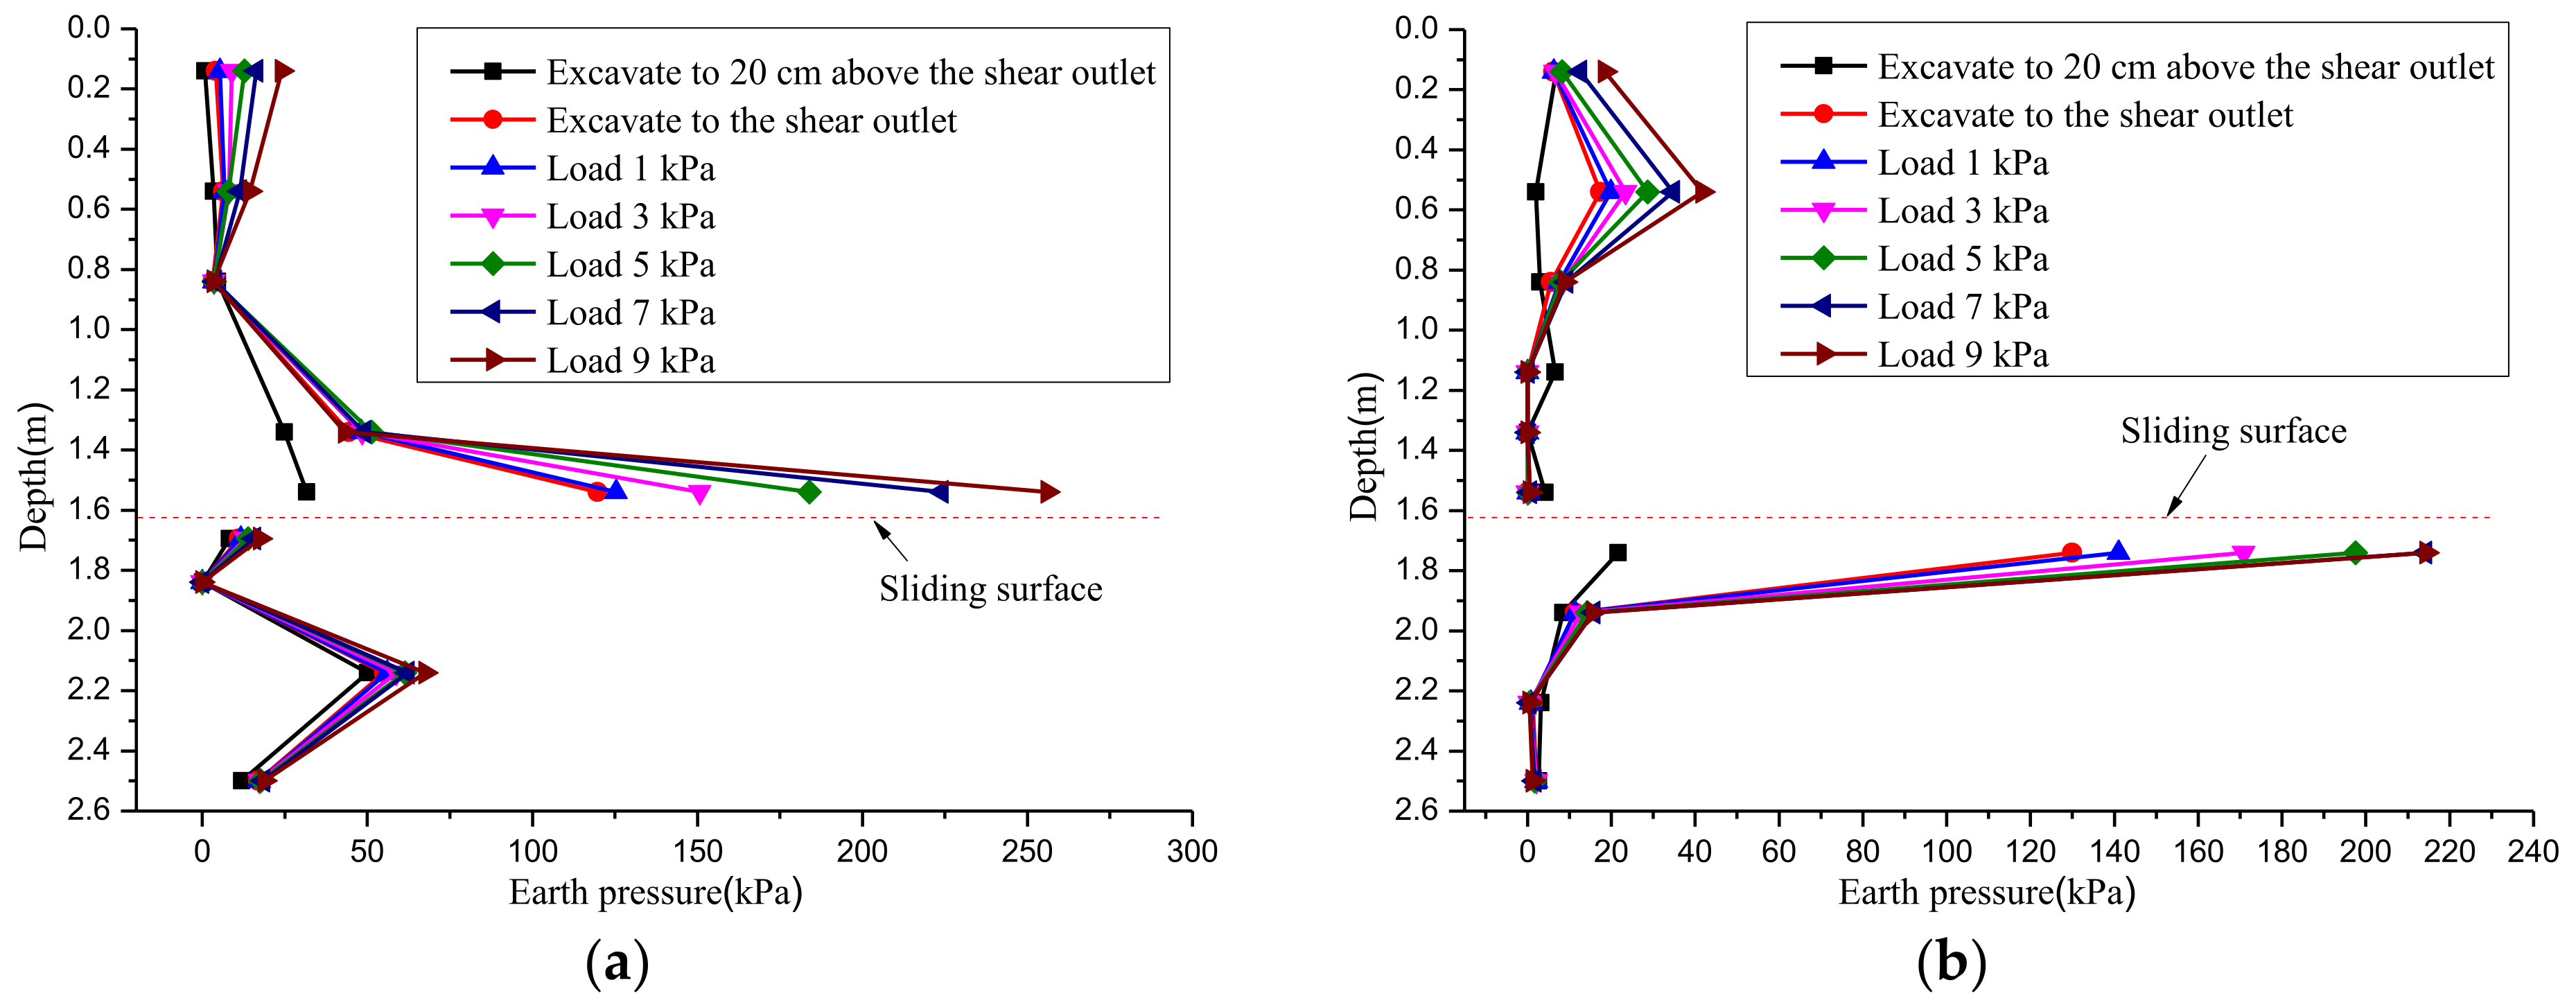
Figure 13, Figure 14 and Figure 15 show the force distribution of each row of micro-piles. In the early stages of the test, the earth pressure in front of the pile in the anti-sliding section (landslide thrust) was triangularly distributed. The earth pressure was low near the top of the pile, gradually increased downward, and was at its maximum near the slip surface. After excavation of the shear outlet and loading, the earth pressure in the lower part of the anti-sliding section increased significantly. The earth pressure at this time was mainly distributed in the lower half of the anti-sliding section, with a triangular distribution. The earth pressure behind the pile in the anti-sliding section (sliding body resistance) was rectangular in distribution at the beginning of the test. After excavation of the shear outlet and loading, the earth pressure in the upper part of the anti-sliding section increased and the earth pressure in the lower part decreased. Once this had occurred, the earth pressure was distributed in an inverted triangle.
The earth pressure in front of the pile in the anchoring section (resistance of the sliding bed in front of the pile) was triangularly distributed in the early stages of the test. After excavation of the shear outlet and loading, the earth pressure changed mainly in the lower half of the anchoring section, with a slight increase. At this time, the distribution form of the resistance of the sliding bed in front of the pile could still be considered triangular. The distribution form of the earth pressure behind the pile in the anchoring section (resistance of the sliding bed behind the pile) was an inverted trapezoid at the beginning of the test. After excavation of the shear outlet and loading, the earth pressure in the upper part of the anchoring section increased. At this time, the earth pressure behind the pile was mainly distributed in the range of 0.5 m below the slip surface, and the distribution form was an inverted triangle.
3.3. Variation of Displacement at Measurement Points
Figure 16 shows the horizontal displacement variation curve of the top of each pile, where piles 4 and 5 are located in the first row, piles 2, 3, and 6 in the second row, and piles 1 and 7 in the third row. The curves in the figure show that the displacements of the seven piles have the same variation pattern. After excavation of the shear outlet, the horizontal displacement of the top of each pile increased sharply, with a variation of about 8 mm. Thereafter, with the increase in loading, the horizontal displacement gradually grew, reflecting the regular pattern of rapid increase after loading and then, gradually, stabilization. However, at the same time, there were some differences in the horizontal displacement of each pile. It could be found that the piles exhibit the rule that the horizontal displacement of the first row of piles was the largest, and the displacement of the tops of the remaining two rows of piles decreased sequentially along the sliding direction. It showed that the deformation of each row of micro-piles in the group decreased sequentially along the sliding direction when there was no coupling beam on the top of piles. In this test, the largest horizontal displacement of the pile top was the no. 5 pile located in the first row, and the maximum displacement was about 30 mm. The smallest horizontal displacement of the pile top was the no. 1 pile located in the third row, and the final horizontal displacement was about 23 mm.
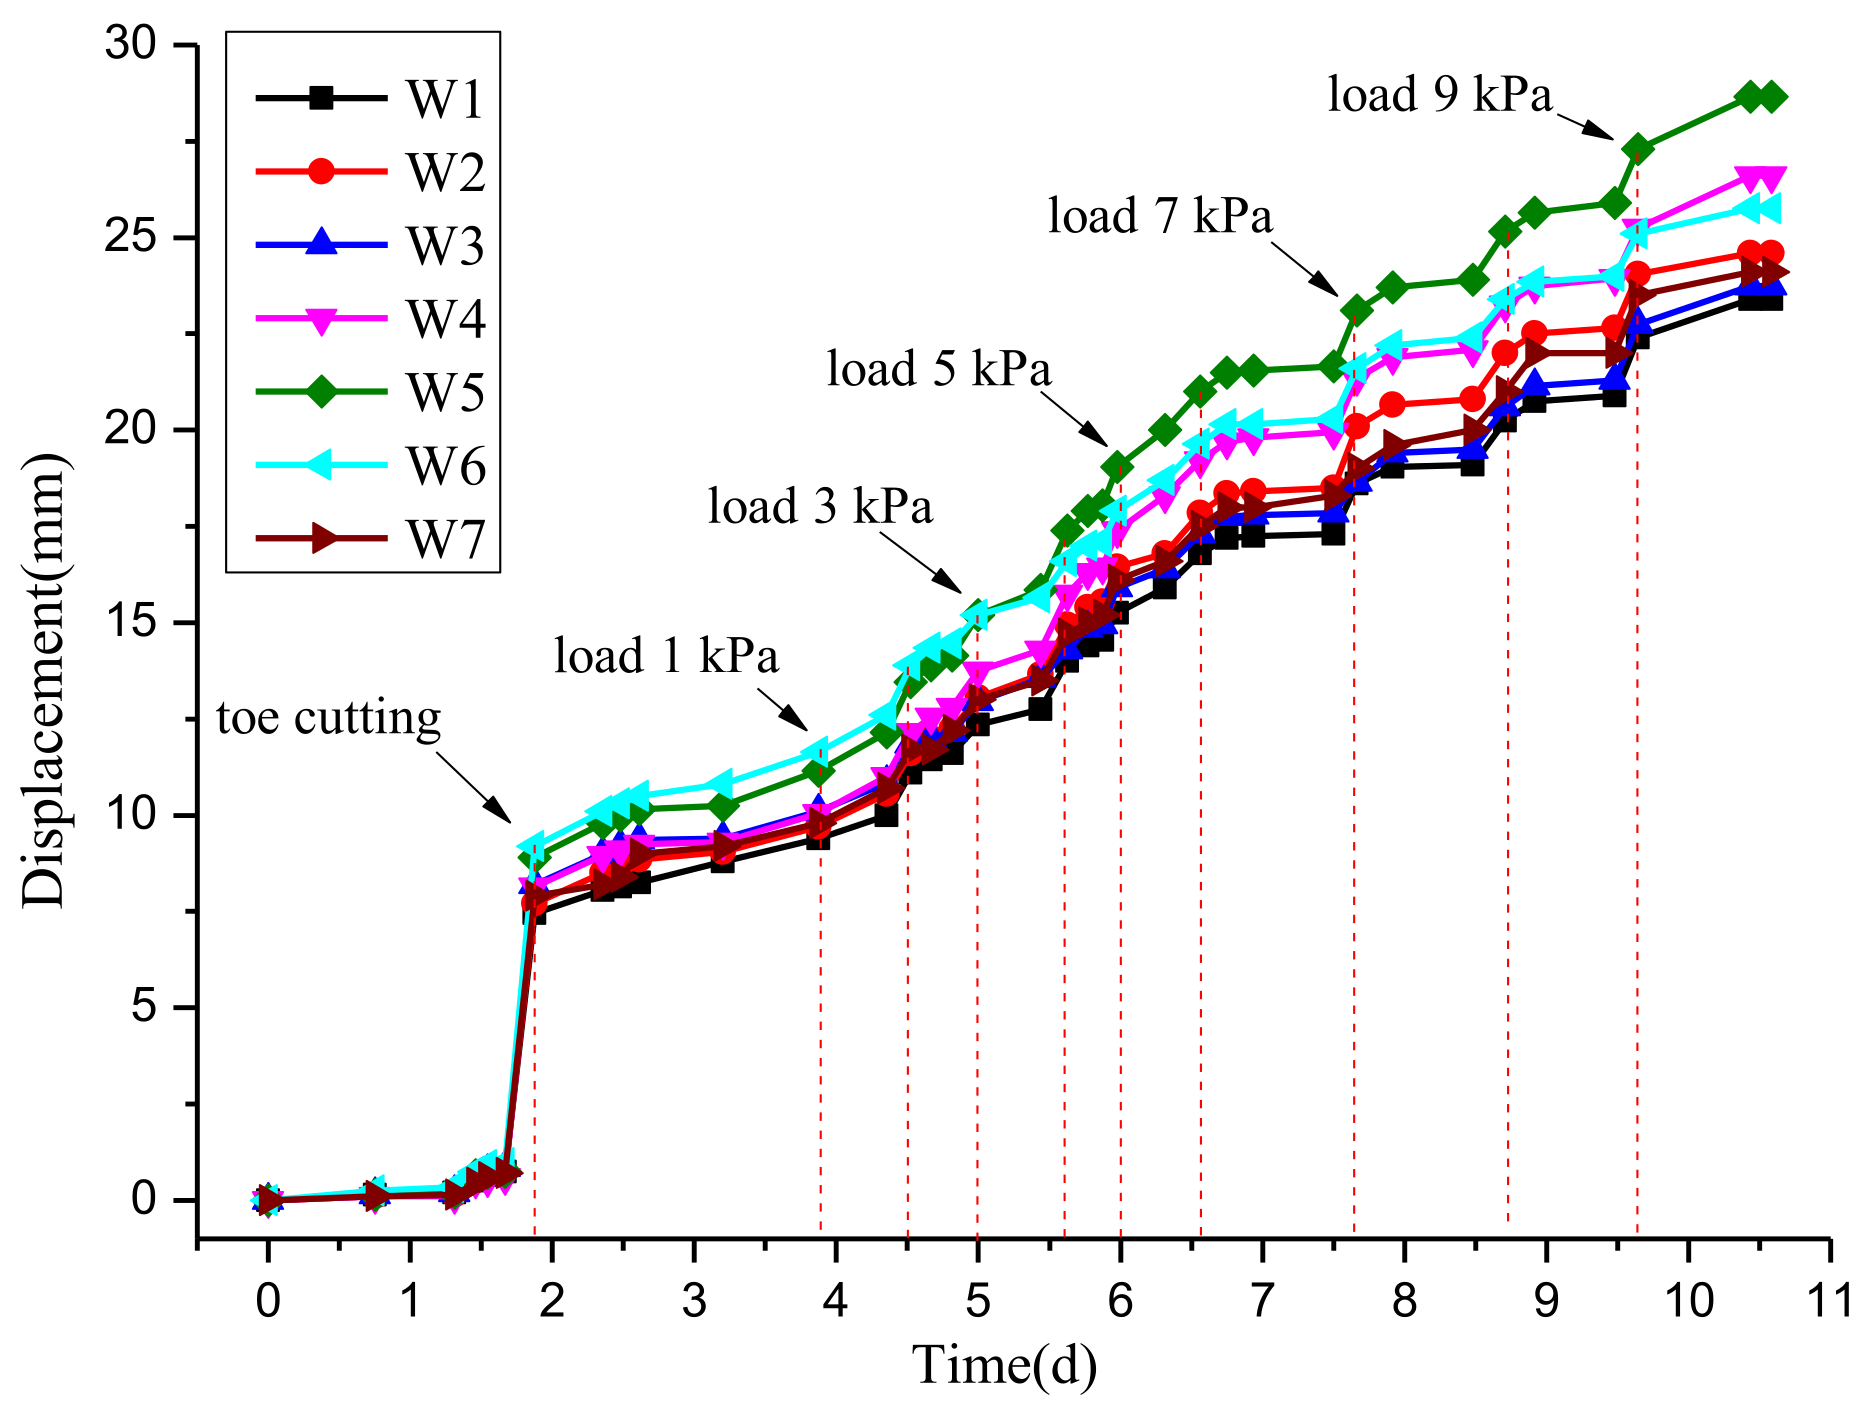
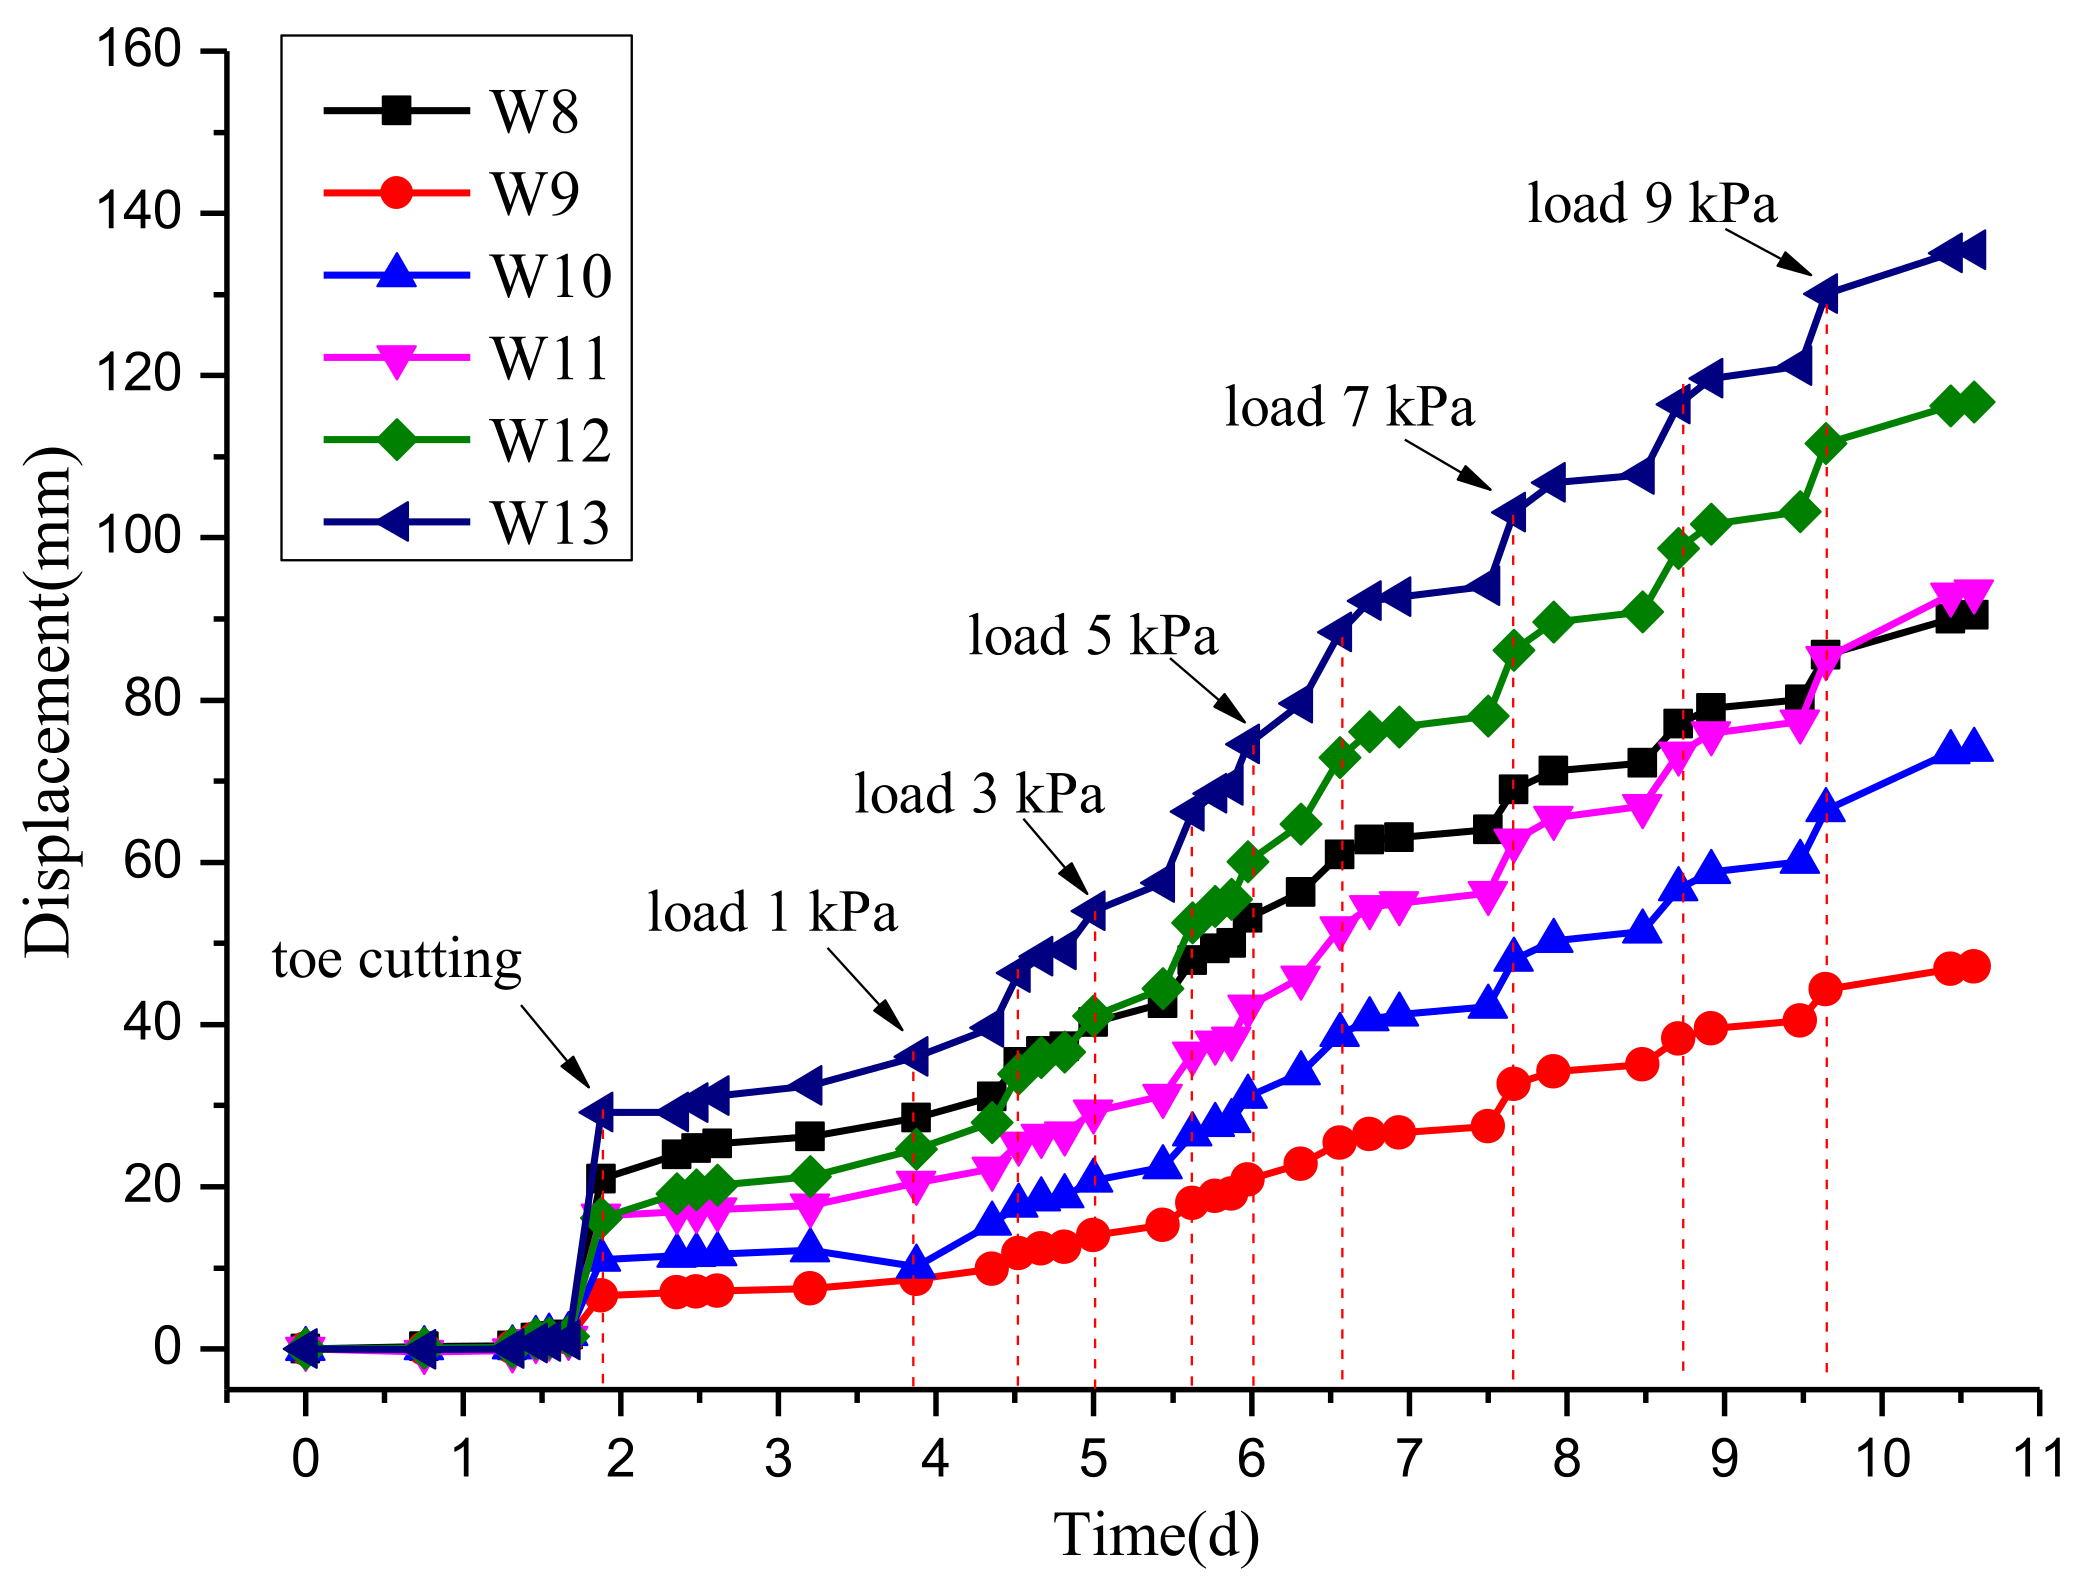
Figure 17 shows the vertical displacement variation curve at the top of the slope. After excavation of the shear outlet, the vertical displacement of each measurement point at the top of the slope changed significantly. The displacement of measurement point W13, closest to the slip surface, was the largest (30 mm). After loading, the vertical displacement of each measurement point continued to increase. There were differences in the vertical displacement of the slope top at different locations, among which the vertical displacement near the slip surface was larger, and the vertical displacement of the measurement points arranged within the reinforcement of the micro-pile group (W9, W10) was smaller.
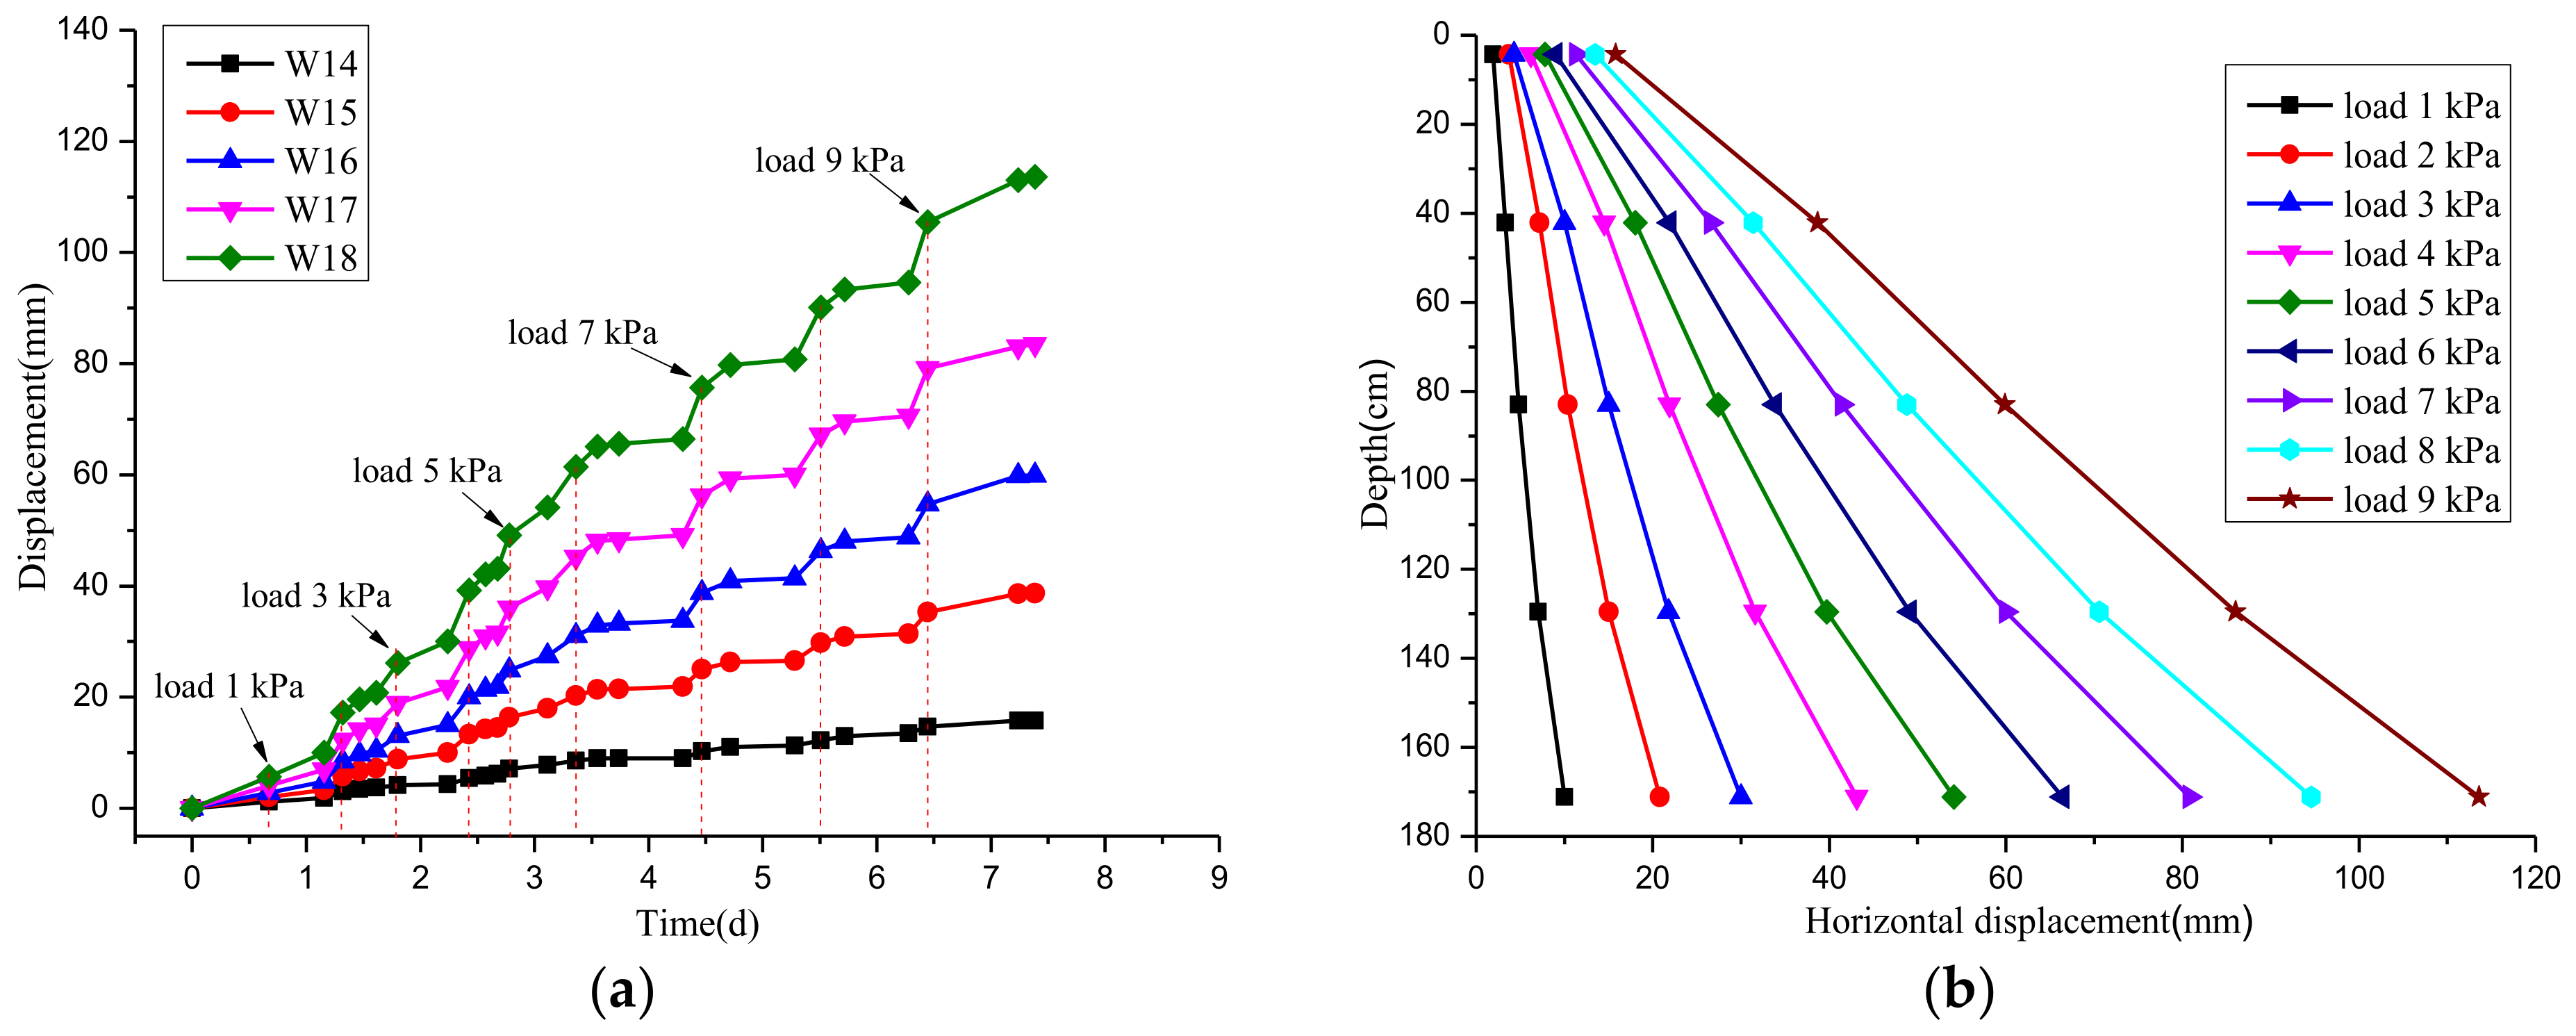
Figure 18a shows the horizontal displacement variation curves of different height measurement points on the slope surface, and Figure 18b shows the horizontal displacement distribution curve of the slope surface. It can be seen that the horizontal displacement of the measurement point near the top of the slope was the smallest, and the horizontal displacement of the measurement point nearer to the bottom was larger. The horizontal displacement distribution curves shown in Figure 18b were all straight lines, indicating that the landslide deformed as a whole, and no local damage occurred on the slope.
3.4. Bending Moment of Pile Body
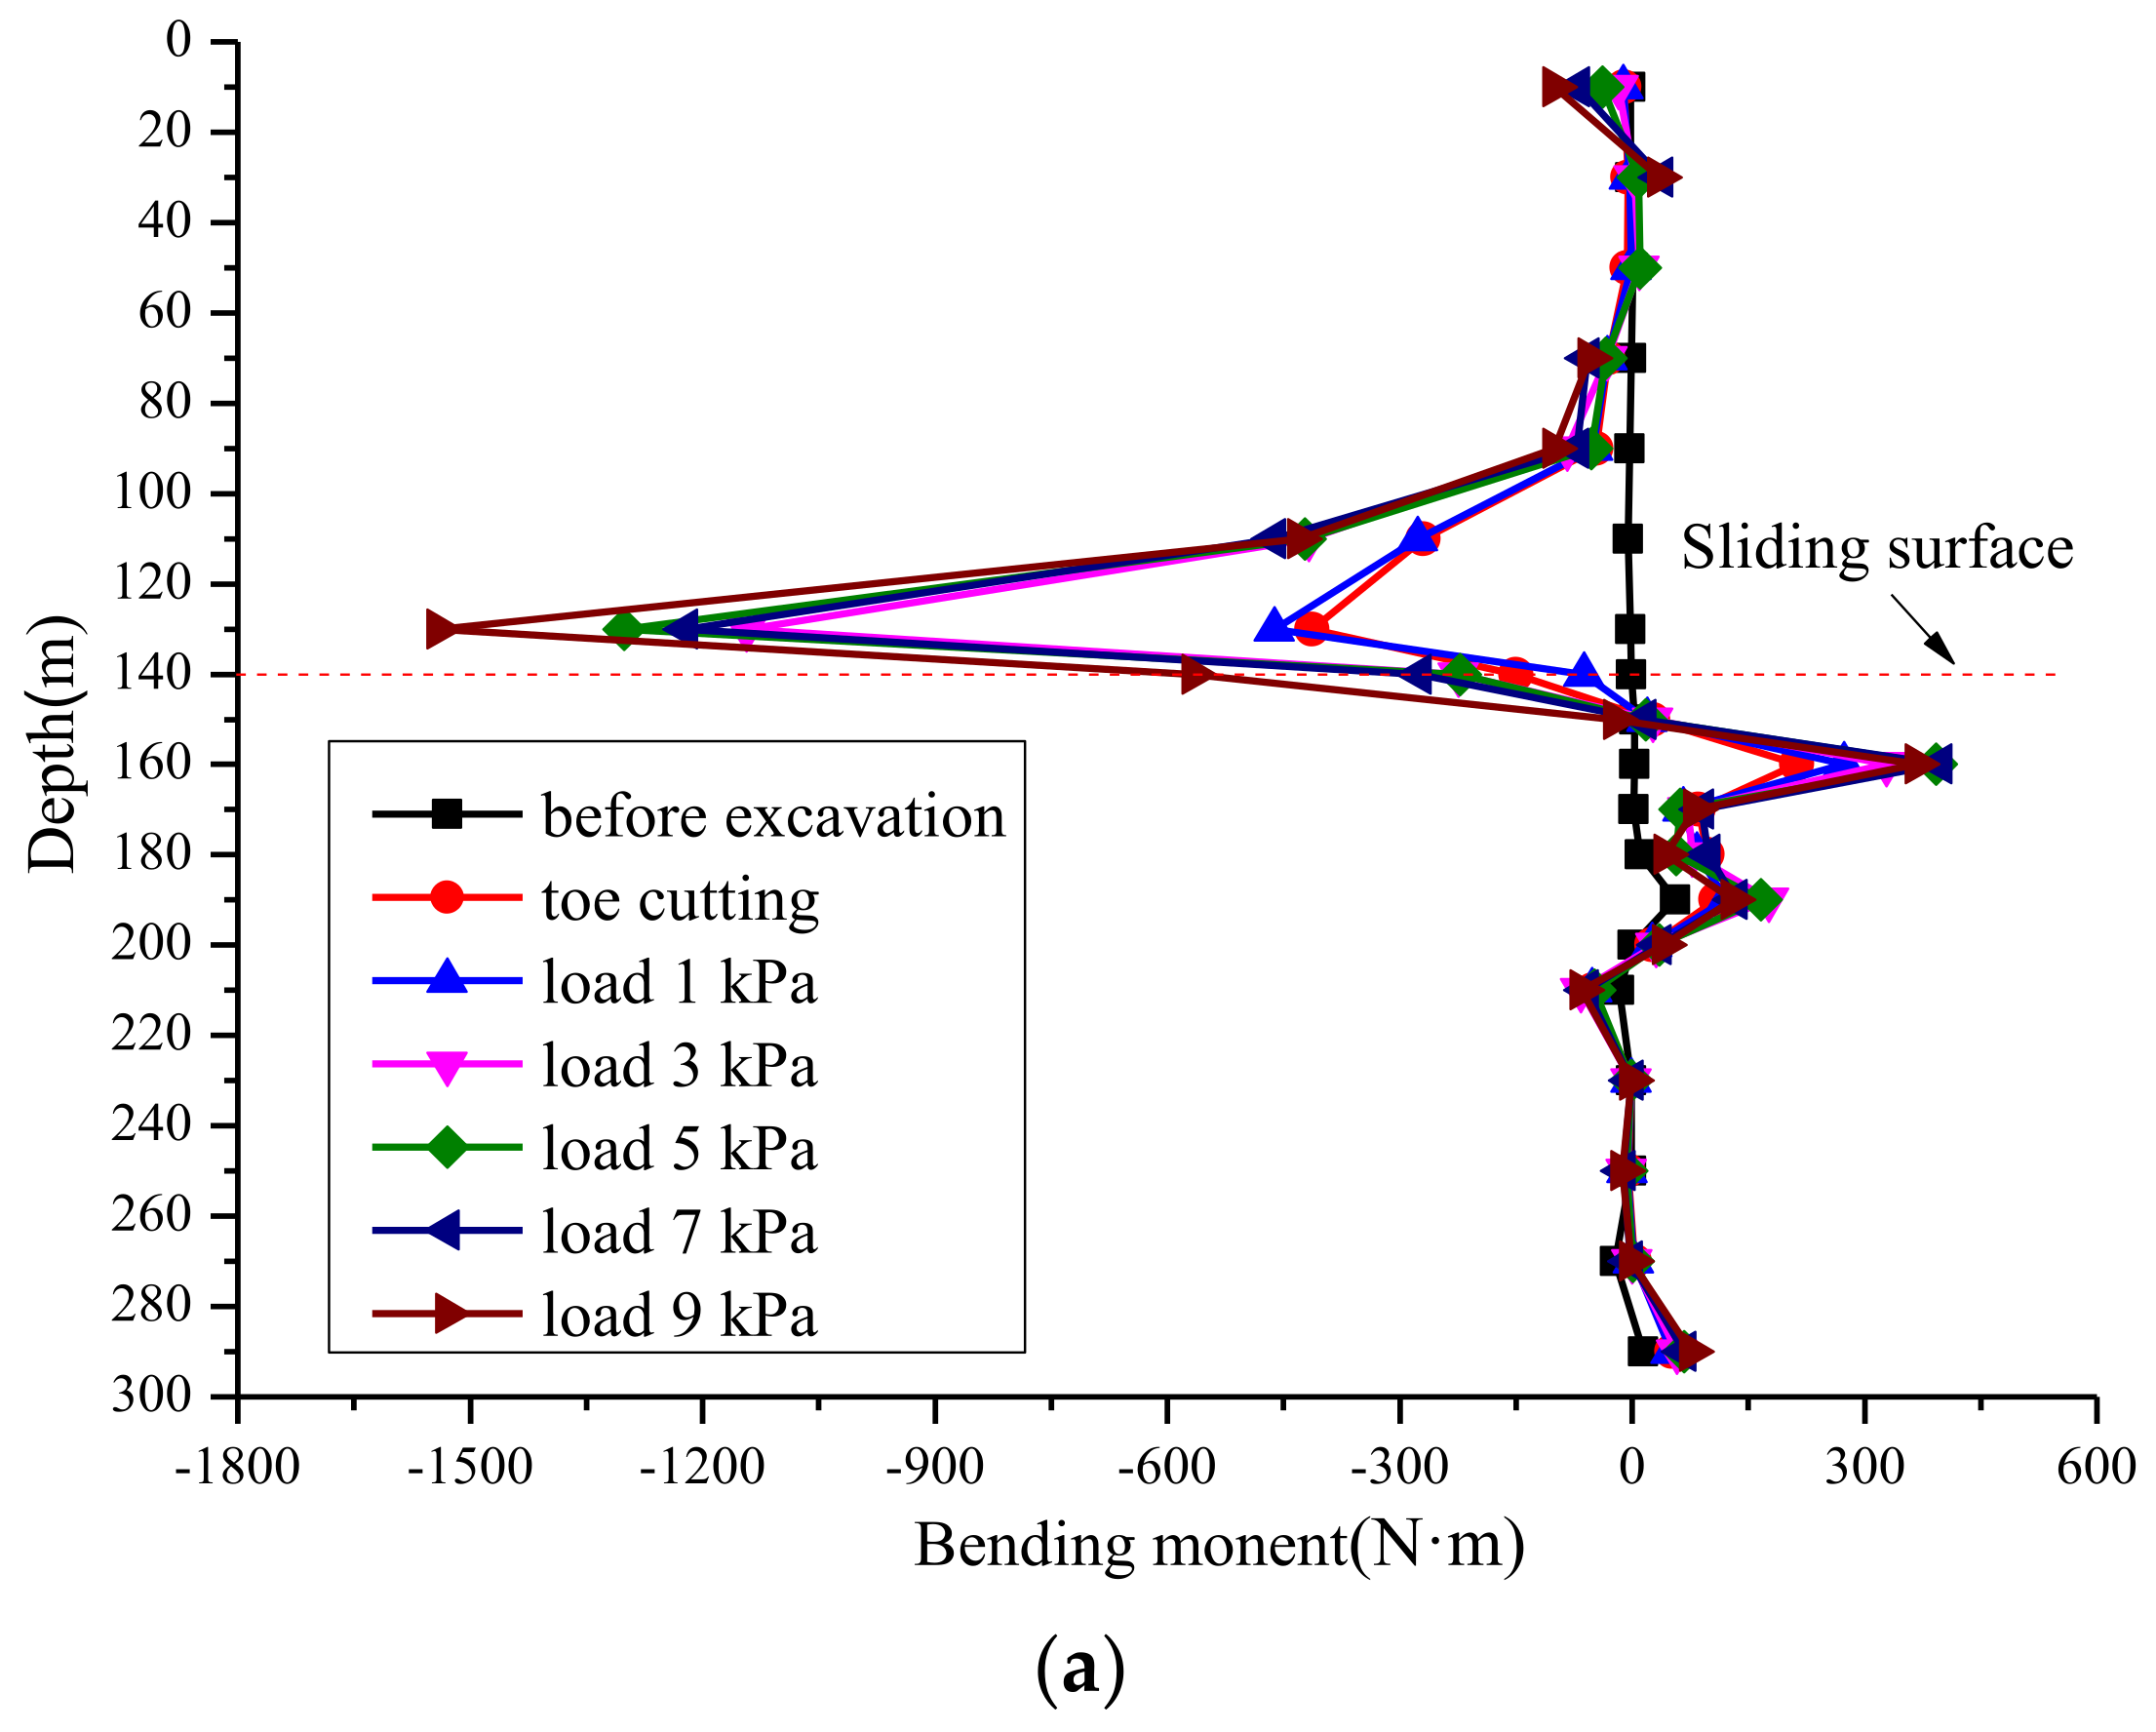
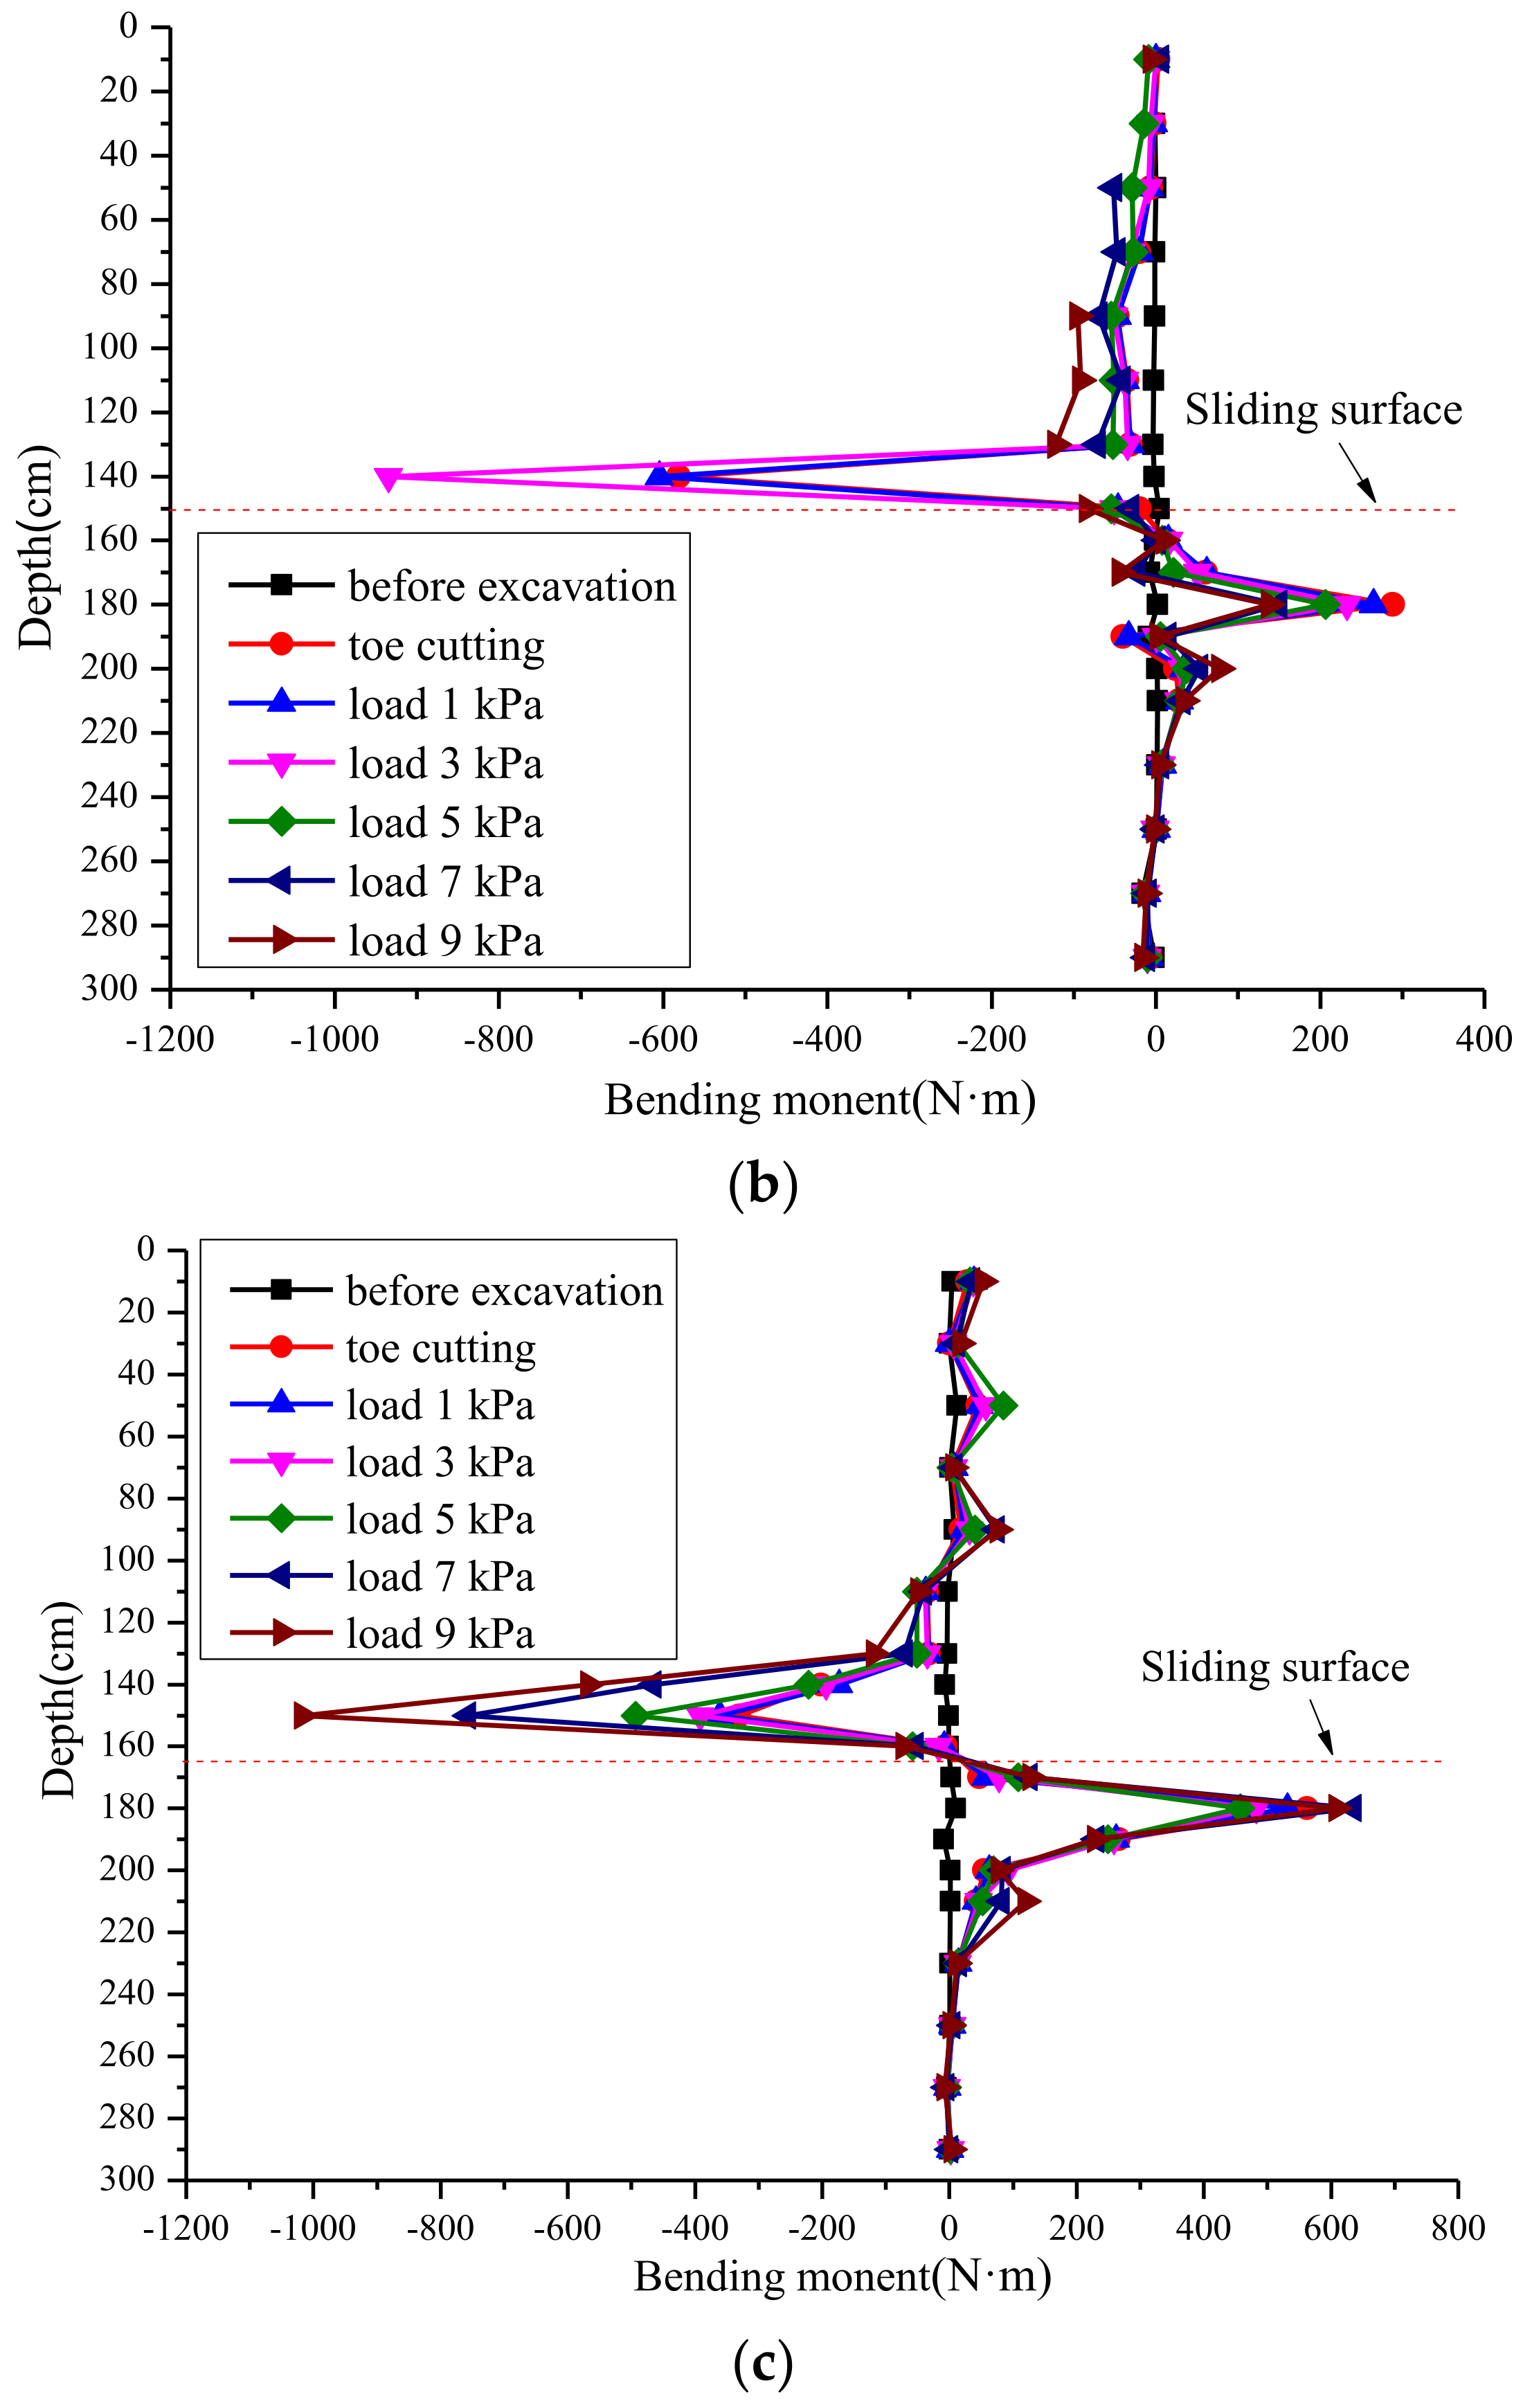
Figure 19 shows the bending moment distribution of pile 4, pile 3, and pile 1. The bending moment of each row of piles had a good level of consistency. Under the premise that the bending moment is positive in the case of tension on the slip side, the bending moment of the anti-sliding section of the micro steel pile is mostly negative, i.e., the back slip side of the micro-pile is in a state of tension. From Figure 19, it can be found that the larger bending moment values were mainly in the range of 0.4 m above the sliding surface (eight times the pile diameter), and the largest bending moment value was located 0.1 m above the sliding surface (two times the pile diameter). After excavation of the shear outlet, the bending moment of the pile changed significantly, indicating that a large deformation of the pile occurred at this time. The bending moment of the pile in the anchoring section was positive, indicating that the slip side of the anchoring section was in a state of tension. The larger bending moment value in the anchoring section was located 0.3 m below the sliding surface (six times the pile diameter), and the largest bending moment value was located at 0.2 m below the sliding surface (four times the pile diameter).
4. Conclusions
A large-scale model test was performed in order to simulate the effect of micro steel pile groups on high steep landslides. The force and deformation characteristics of micro steel pile groups set at the top of high steep landslide were investigated. The main conclusions can be drawn as follows:
- (1)
- When the high steep landslide was generated, the deformation of the micro steel piles in different rows were consistent, showing good performance of the model test. The earth pressure was largely varied according to the relative position to the slip surface, due to the fact that the portion of the pile above the slip surface acted as an anchor.
- (2)
- The landslide thrusts on micro steel piles showed a triangular distribution concentrated in the lower half of the loaded section. The distribution of the slip resistance behind the pile was generally an inverted triangle, which was mainly located in the upper half of the loaded section. The main sliding resistance was observed in the local area behind the pile, below the slip surface.
- (3)
- There was a difference in horizontal displacement of the top of the piles in the micro steel pile group, due to the group’s gradually increasing resistance. The horizontal displacement at the top of the first row of piles on the sliding side was the largest, and the horizontal displacement of each row of piles along the sliding direction decreased in turn.
- (4)
- The bending moment of the micro steel pile in the loaded section was mostly negative. The larger bending moment values were mainly in the range of eight times the pile diameter above the slip surface, with a maximum value of two times the pile diameter on the slip surface. The bending moment of the micro steel pile in the embedded section was mostly positive, indicating that the micro-pile was in a state of tension. The tension portion was concentrated in the area of six times the pile diameter under the slip surface, with a maximum value of four times the pile diameter under the slip surface.
- (5)
- The failure mode of the micro steel pile was mainly due to the bending damage occurring near the slip surface, and the failure mode of each row of piles was essentially the same. Hence, the reinforcement of the pile near the shear surface, in the vicinity of eight times the micro steel pile diameter around the slide surface, is recommended in order to increase the resistance of pile groups in the real-life project.
Author Contributions
Conceptualization, J.Y. and X.L. (Xueling Liu); methodology, J.Y.; model test, X.L. (Xueling Liu); formal analysis, Z.Z.; data curation, K.J.; writing—original draft preparation, J.Y.; writing—review and editing, X.L. (Xueling Liu); visualization, K.J.; supervision, Z.Z.; project administration, X.L. (Xianzhui Lu). All authors have read and agreed to the published version of the manuscript.
Funding
The authors would like to give sincere thanks to the funding agencies that supported this research. This work was supported by the Independent subject of Key Laboratory of Geohazard Prevention of Hilly Mountains, Ministry of Land and Resources of China (Grant nos. KLGHZ202102), China Geological Survey Project (Grant nos. DD20211314).
Institutional Review Board Statement
Not applicable.
Informed Consent Statement
Not applicable.
Data Availability Statement
Not applicable.
Conflicts of Interest
The authors declare no conflict of interest.
References
- Lizzi, F. Reticulated Root Piles to Correct Landslides; ASCE Convention: Chicago, IL, USA, 1978; Preprint 3370. [Google Scholar]
- Cantoni, R.; Collotta, T.; Ghionna, V. A design method for reticulated micropiles structure in sliding slopes. Ground Eng. 1989, 22, 41–47. [Google Scholar]
- Pearlman, S.L.; Campbell, B.D.; Withiam, J.L. Slope stabilization using in-situ earth reinforcement. In Proceedings of the Special Conferenceon Stability and Performance of Slopes and Embankment, Berkeley, CA, USA, 29 June–1 July 1992; Volume 2. [Google Scholar]
- Juran, I.; Benslimane, A.; Bruce, D.A. Slope stabilization by micropile reinforcement. Landslides 1996, 5, 1718–1726. [Google Scholar]
- Loehr, J.E.; Bowders, J.J.; Owen, J.W.; Sommers, L.; Liew, W. Slope Stabilization with Recycled Plastic Pins. Transp. Res. Rec. J. Transp. Res. Board 2000, 1714, 1–8. [Google Scholar] [CrossRef]
- Bian, X.; Zeng, L.L.; Li, X.Z.; Shi, X.S.; Zhou, S.M.; Li, F.Q. Fabric changes induced by super-absorbent polymer on cement and lime stabilized excavated clayey soil. J. Rock Mech. Geotech. Eng. 2021, 13, 1124–1135. [Google Scholar] [CrossRef]
- Jim, B.; Mario, R.; Nadir, A. Design and construction of a micropile wall to stabilize a railway embankment. In Proceedings of the 29th Annual Conference on Deep Foundations, Emerging Technologies, Deep Foundation Insititute, Vancouver, BC, Canada, 29 September–1 October 2004; pp. 1–11. [Google Scholar]
- Bian, X.; Zeng, L.L.; Ji, F.; Xie, M. Plasticity role in strength behaviour of cement-phosphogypsum stabilized soils. J. Rock Mech. Geotech. Eng. 2022, 1–12. [Google Scholar] [CrossRef]
- Zhou, Y.B.; He, X.H.; Ma, M. Study on the Application of Micro-group Piles in Highway Cutting. J. Anhui Jianzhu Univ. 2018, 26, 45–52. [Google Scholar]
- Bian, X.; Zhang, W.; Li, X.Z.; Shi, X.S.; Deng, Y.F.; Peng, J. Changes in strength, hydraulic conductivity and microstructure of superabsorbent polymer stabilized soil subjected to wetting-drying cycles. Acta Geotech. 2022, 1–15. [Google Scholar] [CrossRef]
- Awad, D.R.M. Lateral Load Tests on Mini-piles. Islam. Univ. J. 1999, 7, 15–33. [Google Scholar]
- Richards, J.R.; Thomas, D.; Rothbauer, M.J. Lateral Loads on Pin Piles (micropiles). In Proceedings of the Sessions of the Geosupport Conference: Innovation and Cooperation in Geo, Orlando, FL, USA, 29–31 December 2004; ASCE, Geotechnical Special Publication: Reston, VA, USA, 2012. [Google Scholar]
- Konagai, K.; Yin, Y.; Murono, Y. Single beam analogy for describing soil-pile group interaction. Soil Dyn. Earthq. Eng. 2003, 23, 31–39. [Google Scholar] [CrossRef]
- Liang, Z.Y.; Rao, J.Y.; Chen, Z.Q.; Shuai, S.; Liu, D. Study on Ultimate Flexural Bearing Capacity of Mini Pile Featuring Steel Tube and Centered Steel Bar. Railw. Eng. 2018, 58, 99–102. [Google Scholar]
- Chen, H.; Zhang, Y.F.; Zhang, X.M.; Wei, S. Full-scale model experiments on anti-sliding characteristics of high-pressure grouting steel-tube micropiles. Rock Soil Mech. 2020, 41, 428–436. [Google Scholar]
- Zhang, Y.F.; Wei, S.W.; Zhou, W.J.; Li, D.W.; Zhou, B. Model test study on anti-sliding behaviours of multiple segmented grouting steel pile group structure. Chin. J. Rock Mech. Eng. 2019, 38, 982–992. [Google Scholar]
- Hu, S.Y.; Cai, Q.; Li, C.J. A study of the physical model test of debris landslide reinforcement with three row micro-piles. Hydrogeol. Eng. Geol. 2018, 45, 56–62. [Google Scholar]
- Boeckmann, A.C. Load Transfer in Micropils for Slope Stabilization from Test of Large-Scale Phydical Models; University of Missouri-Columbia: Columbia, SC, USA, 2006. [Google Scholar]
- Liu, X.L.; Yan, J.K.; Tong, B.; Liu, L. Evaluation of Micropiles with Different Configuration Settings for Landslide Stabilization based on Large Scale Experimental Testing. Front. Earth Sci. 2021, 9, 693639. [Google Scholar] [CrossRef]
- Liu, X.L.; Yan, J.K.; Liu, L.; Han, B. Large-Scale Model Test of a Micropile Group for Landslide Control. Adv. Civ. Eng. 2021, 6687124. [Google Scholar] [CrossRef]
- Yan, J.K.; Men, Y.M. Model Tests Based Design Method of Micropiles for Landslide Reinforcement. J. Eng. Geol. 2022, 20, 355–361. (In Chinese) [Google Scholar]
- Wang, L.Q.; Zhang, Z.H.; Huang, B.L.; Hu, M.J.; Zhang, C.Y. Triggering mechanism and possible evolution process of the ancient Qingshi landslide in the Three Gorges Reservoir. Geomat. Nat. Hazards Risk 2021, 12, 3160–3174. [Google Scholar] [CrossRef]
- Bian, X.; Zeng, L.L.; Li, X.Z.; Hong, J.T. Deformation modulus of reconstituted and naturally sedimented clays. Eng. Geol. 2021, 295, 106450. [Google Scholar] [CrossRef]
- Bian, X.; Yan, J.K.; Zhang, W. Observed performance of highway embankment over soft marine clay: A case study in Wenzhou, China. Adv. Civ. Eng. 2020, 8813832. [Google Scholar] [CrossRef]
- Zhang, K.Q.; Wang, L.Q.; Dai, Z.W.; Huang, B.L.; Zhang, Z.H. Evolution trend of the Huangyanwo rock mass under the action of reservoir water fluctuation. Nat. Hazards 2022, 113, 1583–1600. [Google Scholar] [CrossRef]
Figure 1.
Schematic diagram of the test model: (a) schematic diagram of the test model (unit: cm); (b) sectional view of the model (unit: cm); (c) layout of micro-piles and pressure gauges (unit: cm).
Figure 1.
Schematic diagram of the test model: (a) schematic diagram of the test model (unit: cm); (b) sectional view of the model (unit: cm); (c) layout of micro-piles and pressure gauges (unit: cm).

Figure 2.
Filling of soil: (a) layered filling of sliding bed; (b) layered filling of sliding body.

Figure 3.
Schematic diagram of sliding surface: (a) the sliding surface; (b) double-layer plastic films were put on the sliding surface.
Figure 3.
Schematic diagram of sliding surface: (a) the sliding surface; (b) double-layer plastic films were put on the sliding surface.

Figure 4.
Micro steel piles used for the test.

Figure 5.
Distribution of the pressure gauges in a vertical direction along the pile: (a) the position and number of pressure gauges along the pile no. 4 (unit: cm); (b) the position and number of pressure gauges along the pile no. 3 (unit: cm); (c) the position and number of pressure gauges along the pile no. 1 (unit: cm).

Figure 6.
The layout of strain measurement points on the piles (unit: cm).

Figure 7.
The layout of displacement gauges: (a) plan view of the displacement gauge arrangement (unit: cm); (b) sectional view of the displacement gauge arrangement (unit: cm).
Figure 7.
The layout of displacement gauges: (a) plan view of the displacement gauge arrangement (unit: cm); (b) sectional view of the displacement gauge arrangement (unit: cm).

Figure 8.
Deformation and damage of landslide: (a) settlement of slope top before loading; (b) crack in pile position before loading; (c) crack in pile position at the end of loading.
Figure 8.
Deformation and damage of landslide: (a) settlement of slope top before loading; (b) crack in pile position before loading; (c) crack in pile position at the end of loading.

Figure 9.
Damage of micro-piles: (a) overall damage of the model; (b) breakage of the pile near the slipping surface; (c) overall damage of micro-pile groups.
Figure 9.
Damage of micro-piles: (a) overall damage of the model; (b) breakage of the pile near the slipping surface; (c) overall damage of micro-pile groups.

Figure 10.
Earth pressure of pile no. 4: (a) curves of earth pressure before the anti-sliding segment of pile no. 4; (b) curves of earth pressure behind the anti-sliding segment of pile no. 4; (c) curves of earth pressure before the anchoring segment of pile no. 4; (d) curves of earth pressure behind the anchoring segment of pile no. 4.

Figure 11.
Earth pressure of pile no. 3: (a) curves of earth pressure before the anti-sliding segment of pile no. 3; (b) curves of earth pressure behind the anti-sliding segment of pile no. 3; (c) curves of earth pressure before the anchoring segment of pile no. 3; (d) curves of earth pressure behind the anchoring segment of pile no. 3.


Figure 12.
Earth pressure of pile no. 1: (a) curves of earth pressure before the anti-sliding segment of pile no. 1; (b) curves of earth pressure behind the anti-sliding segment of pile no. 1; (c) curves of earth pressure before the anchoring segment of pile no. 1; (d) curves of earth pressure behind the anchoring segment of pile no. 1.

Figure 13.
Earth pressure distribution curve of pile no. 4: (a) earth pressure distribution curve in front of the pile; (b) earth pressure distribution curve behind the pile.
Figure 13.
Earth pressure distribution curve of pile no. 4: (a) earth pressure distribution curve in front of the pile; (b) earth pressure distribution curve behind the pile.

Figure 14.
Earth pressure distribution curve of pile no. 3: (a) earth pressure distribution curve in front of the pile; (b) earth pressure distribution curve behind the pile.
Figure 14.
Earth pressure distribution curve of pile no. 3: (a) earth pressure distribution curve in front of the pile; (b) earth pressure distribution curve behind the pile.

Figure 15.
Earth pressure distribution curve of pile no. 1: (a) earth pressure distribution curve in front the pile; (b) earth pressure distribution curve behind the pile.
Figure 15.
Earth pressure distribution curve of pile no. 1: (a) earth pressure distribution curve in front the pile; (b) earth pressure distribution curve behind the pile.

Figure 16.
Horizontal displacement curve at the top of the piles.

Figure 17.
Vertical displacement variation curve of the top of the slope.

Figure 18.
Horizontal displacement curves of the slope surface: (a) horizontal displacement variation curve of the slope surface; (b) horizontal displacement distribution curve of the slope surface.
Figure 18.
Horizontal displacement curves of the slope surface: (a) horizontal displacement variation curve of the slope surface; (b) horizontal displacement distribution curve of the slope surface.

Figure 19.
Bending moment of micro-piles: (a) bending moment of pile no. 4; (b) bending moment of pile no. 3; (c) bending moment of pile no. 1.
Figure 19.
Bending moment of micro-piles: (a) bending moment of pile no. 4; (b) bending moment of pile no. 3; (c) bending moment of pile no. 1.


Table 1.
Soil material parameters of the model.
| Bulk Density (g/cm3) | Water Content (%) | Cohesion (kPa) | Internal Friction Angle (°) |
|---|---|---|---|
| 1.84 | 13.52 | 26 | 28 |
Publisher’s Note: MDPI stays neutral with regard to jurisdictional claims in published maps and institutional affiliations. |
© 2022 by the authors. Licensee MDPI, Basel, Switzerland. This article is an open access article distributed under the terms and conditions of the Creative Commons Attribution (CC BY) license (https://creativecommons.org/licenses/by/4.0/).
Share and Cite
MDPI and ACS Style
Yan, J.; Liu, X.; Zhang, Z.; Jin, K.; Lu, X. Model Test of Micro-Pile Group Reinforcing High Steep Landslide. Appl. Sci. 2022, 12, 10017. https://0-doi-org.brum.beds.ac.uk/10.3390/app121910017
AMA Style
Yan J, Liu X, Zhang Z, Jin K, Lu X. Model Test of Micro-Pile Group Reinforcing High Steep Landslide. Applied Sciences. 2022; 12(19):10017. https://0-doi-org.brum.beds.ac.uk/10.3390/app121910017
Chicago/Turabian StyleYan, Jinkai, Xueling Liu, Zhichao Zhang, Kemo Jin, and Xianzhui Lu. 2022. "Model Test of Micro-Pile Group Reinforcing High Steep Landslide" Applied Sciences 12, no. 19: 10017. https://0-doi-org.brum.beds.ac.uk/10.3390/app121910017
Note that from the first issue of 2016, this journal uses article numbers instead of page numbers. See further details here.