
Tracking the Rhythm: Pansori Rhythm Segmentation and Classification Methods and Datasets


1
Department of Computer Science and Engineering, Kathmandu University, Dhulikhel 6250, Nepal
2
Deep AI Nepal, Guru Technology, Kathmandu 4460, Nepal
3
Division of Computer Science and Engineering, Jeonbuk National University, Jeonju 54896, Korea
*
Author to whom correspondence should be addressed.
Appl. Sci. 2022, 12(19), 9571; https://0-doi-org.brum.beds.ac.uk/10.3390/app12199571
Submission received: 26 August 2022
/
Revised: 15 September 2022
/
Accepted: 20 September 2022
/
Published: 23 September 2022
(This article belongs to the Special Issue Scale Space and Variational Methods in Computer Vision)
Abstract
:This paper presents two methods to understand the rhythmic patterns of the voice in Korean traditional music called Pansori. We used semantic segmentation and classification-based structural analysis methods to segment the seven rhythmic categories of Pansori. We propose two datasets; one is for rhythm classification and one is for segmentation. Two classification and two segmentation neural networks are trained and tested in an end-to-end manner. The standard HR network and DeepLabV3+ network are used for rhythm segmentation. A modified HR network and a novel GlocalMuseNet are used for the classification of music rhythm. The GlocalMuseNet outperforms the HR network for Pansori rhythm classification. A novel segmentation model (a modified HR network) is proposed for Pansori rhythm segmentation. The results show that the DeepLabV3+ network is superior to the HR network. The classifier networks are used for time-varying rhythm classification that behaves as the segmentation using overlapping window frames in a spectral representation of audio. Semantic segmentation using the DeepLabV3+ and the HR network shows better results than the classification-based structural analysis methods used in this work; however, the annotation process is relatively time-consuming and costly.
1. Introduction
Deep learning research on music information retrieval has generally focused on content-based filtering (affective state, artist, genre, music similarity) rather than musical structure, although musical structure analysis has wide applications in music information retrieval (MIR). The applicable fields of music structural analysis (MSA) are musicology, music theory, and music cognition. Numerous methods [1,2,3,4,5] have been developed in the structural analysis of music based on similarities between a given musical data and other pieces of music. Some well-known similarity comparison methods are note-based (string matching approach), frame-based (geometric representation), ground truth-based, probability matching, and N-gram (based on pitch and rhythm dimensions) [6,7].
The development of a computational model to learn from music content for structure analysis is an important and useful tool today to efficiently store and retrieve the digital content. In musicology, the musical structure expresses the contiguous, non-overlapping musical segments that compose a given audio signal. MSA identify the similar musical pieces and label them at different time scales. The automatic segmentation of music is a key issue in music browsing, searching, summarization and recommendation [8]. Segmenting music involves identifying boundaries between homogenous regions. Music segmentation is possible based on vocals, instruments, rhythm, harmony, pitch, and interval. The segmentation result shows musical boundaries, musical form and semantic labels such as verse, chorus or bridge [9,10,11]. The segmentation algorithm detects the locations where significant changes of statistical properties [12] or semantic information [13] occur.
A perfect understanding of musical boundaries is a hard task even for a human, as highlighted in a review paper [14]. The paper highlights the real-world applications, current trends and challenges, existing methods, evaluation, dataset, and future direction of research for music structure analysis. Homogeneity, novelty, repetition, and regularity are some segmentation principles described in the review paper; among them, our approach is homogenous musical piece detection using a deep neural network. Past methods show interesting results in MSA using a non-data-driven approach. Sheh [8] proposed an EM-based HMM method for chord-based segmentation. Similarly, Wei [11] used tonality and the recurrent structure of music for automatic music segmentation. The data-driven approaches are now massively used for structure boundaries determination of music. A CNN-based method [15] used audio spectrograms with self-similarity lag matrices. The method proposed a complex CNN structure with multiple input features fusion. The results are interesting but have some limitations because of limited training data and simple network architecture. The past research only conducted a similarity-based comparison of two-piece of music using the information of pitch, rhythm, vocals, or instrument. We proposed a novel technique for music structure analysis using rhythmic information at pixel labels. At the time of writing, we could not find such research that has been used to segment music according to rhythmic features.
At present, we have several efficient segmentation algorithms but still have data scarcity to train them from scratch. We proposed two datasets and methods for MSA that could attract new researchers in this direction in the future. In this paper, we studied a structural analysis of Korean traditional music called Pansori based on musical rhythms. Musical rhythm is a sound pattern composed of silent and singing notes. There are more than six unique rhythmic patterns in Pansori excluding rests (silences) between each rhythmic category and narration. Some non-data-driven methods for MSA research [1,16] using rhythmic information of music have been used in Western music. We use the current mainstream classification and semantic segmentation for MSA using deep learning. Two novel Pansori rhythm datasets are proposed in this work and define a baseline of the proposed dataset, which provide inspiration for subsequent research.
We introduce a novel benchmark of Pansori rhythm segmentation using the data-driven deep learning method. We trained the HR network [17] and DeepLabV3+ network [18] for segmentation in an end-to-end manner. A modified HR network and a novel GlocalMuseNet are trained for rhythm classification and later used for both segmentation and classification purposes. The GlocalMuseNet outperforms the other classifier for the classification and segmentation of Pansori rhythm. The DeepLab V3+ network shows the best performance in the semantic segmentation of rhythm. Overall, semantic segmentation outperformed classification-based segmentation, despite a time-consuming data annotation process that required expert supervision. The major contributions of this work are summarized as follows:
- We developed two supervised datasets for rhythm classification and segmentation.
- We propose GlocalMuseNet, a DNN, which was found to be efficient at capturing the acoustic information and preserving the resolution in feature maps. The network outperforms other DNNs for the classification of Pansori rhythm.
- A novel segmentation model (modified HR) is proposed for the semantic segmentation of music rhythm that is found to be superior to a vanilla HR network.
- We compared the classification and semantic segmentation-based methods for the structural analysis of music.
This paper is structured as follows. Section 2 describes the proposed dataset for rhythm classification and segmentation. The methods in Section 3 introduce the Pansori rhythm classification and segmentation datasets, music preprocessing methods, and neural network architectures used in the study. The experiments and results in Section 4 discuss the classification and segmentation results and analyze the performance of the trained DNNs. Finally, we present the conclusions and potential areas for further research in Section 5.
2. Dataset for Pansori Rhythm
Pansori is a genre of a narrative song performed by a vocalist and a drummer. It reflects the different situations of stories using varying tones and rhythmic structures. Originally, there were 12 sets of Pansori stories known as Madang; however, only five sets are still being performed in the 21st century. The singer performs a long narrative poem with alternating singing, narrating, and acting. Aniri is a form of narration, and there are numerous singing modes such as Anirichangzo, Jinyangjo, Jajinmori, Jajinzungzungmori, Jungmori, Jungjungmori, Danjungmari, Hwimori, Eonmori, Eotjungmori, Sichang, Semachi, Dockseoseong, and Pyungzungmori. The singing modes are the rhythmic patterns in Pansori known as Jangan that express unique circumstances in a story and differ according to the story’s content and the performer’s singing techniques. Usually, narration follows singing, but this is not always the case. The rhythmic patterns are diverse according to the song’s duration, measure, rhythmic cycle, and speed. For example, “Jinyangjo” is the slowest rhythm pattern with six slow beats in one measure and four measures in each cycle, which are expressed in 18/8 time. On the other hand, “Hwimori” is the fastest rhythm which consists of four very quick beats, which are expressed in 4/4 time.
In this work, Pansori data are collected from original CD recordings with the help of the Jeonbuk National University, Department of Music (https://wz3.jbnu.ac.kr/musiceng/index.do, accessed on 14 December 2021). Five students from the department are involved in the annotation and validation process of the Pansori rhythm. Students involved in this research are good Pansori singers and drummers and have a deep understanding of rhythmic patterns and note-level composition of the song. As displayed in Table 1, we used seven categories for structural analysis of Pansori music; among them, ‘Aniri’ generally appeared before the other six singing modes. In the ‘Aniri’ section, the singer tries to explain the story’s characters, activities, and scenarios, and then, the story is sung using various modes based on the situation. The six categories of Pansori rhythm used in this work are namely ‘AniriChangzo’, ‘Jajinmori’, ‘Jinyangjo’, ‘Jungjungmori’, ‘Jungmori’ and ‘Others’ where the ‘Others’ class included rhythms that rarely appear in Pansori songs such as ‘Dockseoseong’, ‘Eonmori’, ‘Eotjungmori’, ‘Hwimori’, ‘Semachi’, and ‘Sichang’.
The segmentation of Pansori music according to its rhythmic features is a challenging task due to its diversified rhythmic structure, imbalanced training samples, and computational complexity due to long and variable length rhythmic structures. Some rhythms are very short (less than five seconds), and some are more than 20 min. During the semantic segmentation, the ‘Others’ class used in the classification network was represented as background. Other categories of singing mode and narration are kept the same, as illustrated in Table 2.
3. Methods
This study focuses on the segmentation of Pansori music, which follows an established rhythmic structure. This section explains the audio processing and deep neural networks used in this work for the classification and segmentation of Pansori rhythm.
3.1. Audio Representation
The raw audio requires pre-processing in a suitable format before it is input into the deep neural networks for the MIR task. We used the log-Mel spectrogram for both classification and semantic segmentation tasks because it is proven and found efficient representation for audio classification [19], emotion recognition [20], and sound event detection [21,22]. The data pre-processing during training and testing time is designed to address the fixed-size input to the neural network and memory issues in processing the long audio sequence. During training, fixed-sized input was randomly selected that should meet the neural network input dimension. During testing time, the clip of test audio is sequentially passed to the trained DNNs. A series of test results are aggregated and voted in overlapping regions for a final decision on test data. The detail of audio processing for the classification and semantic segmentation of Pansori rhythm is discussed in the following sub-sections.
3.1.1. Audio Processing for Classification
In the classification process, rhythms were clipped from long audio sequences, and the clips were then uploaded to the DNN for training and testing. The stereo channel audio was transformed into mono, and the music was repeated when the audio was less than the required length. We used 30 s of audio to train the neural networks with a sampling rate of 16 kHz, a fast Fourier transform (FFT) size of 1024, a Mel-bin of 64, and a hop size of 500 in audio pre-processing.
During the inference process, we used a sliding overlapping window over the time-frequency representation of the audio sequence as described in Algorithm 1. The window length should be the same as the input audio representation used during training time. The stride size was 10 s, and other audio parameters were the same as those used for training time. The overlapping regions of the input audio sequences were counted and voted on by averaging the multiple classification results from pre-trained DNNs for the final determination of category labels.
| Algorithm 1: Classification-based segmentation with overlapped sliding windows |
| Inputs: Log-Mel spectrogram (A) and rhythm category (C) |
| Network: A neural network (N) |
| Step 1: Calculate input length of audio; W = length(A) |
| Step 2: Create and initialize a list (L) for counting the total segments of input audio and iterate over the total audio length with overlapping strides |
| Step 3: Initialize prediction result array: (P) = Zeros (W, C); and overlapping window counter array: (O) = Zeros (W, C) |
| Step 4: Loop s until length of L |
| Step 4.1: Select network input a = A [s [0]:s [1]] |
| Step 4.2: Predict rhythm class p = N(a) |
| Step 4.3: Update P by adding p and O by adding one |
| Step 5: Average result by P/O |
| Step 6: Find the target category by maximizing number of predicted classes |
3.1.2. Audio Processing for Segmentation
For the semantic segmentation in audio, the annotation is given in the temporal dimension with the value of the start time, end time, and rhythm category label. Based on the annotation, we generated the mask on-the-fly during training. Input log-Mel spectrograms and corresponding masks were randomly selected from long audio sequences during the training of the neural network. The log Mel-spectrogram is generated by keeping the same value of sampling rate, FFT size, Mel bins, and hop length used in the rhythm classification process.
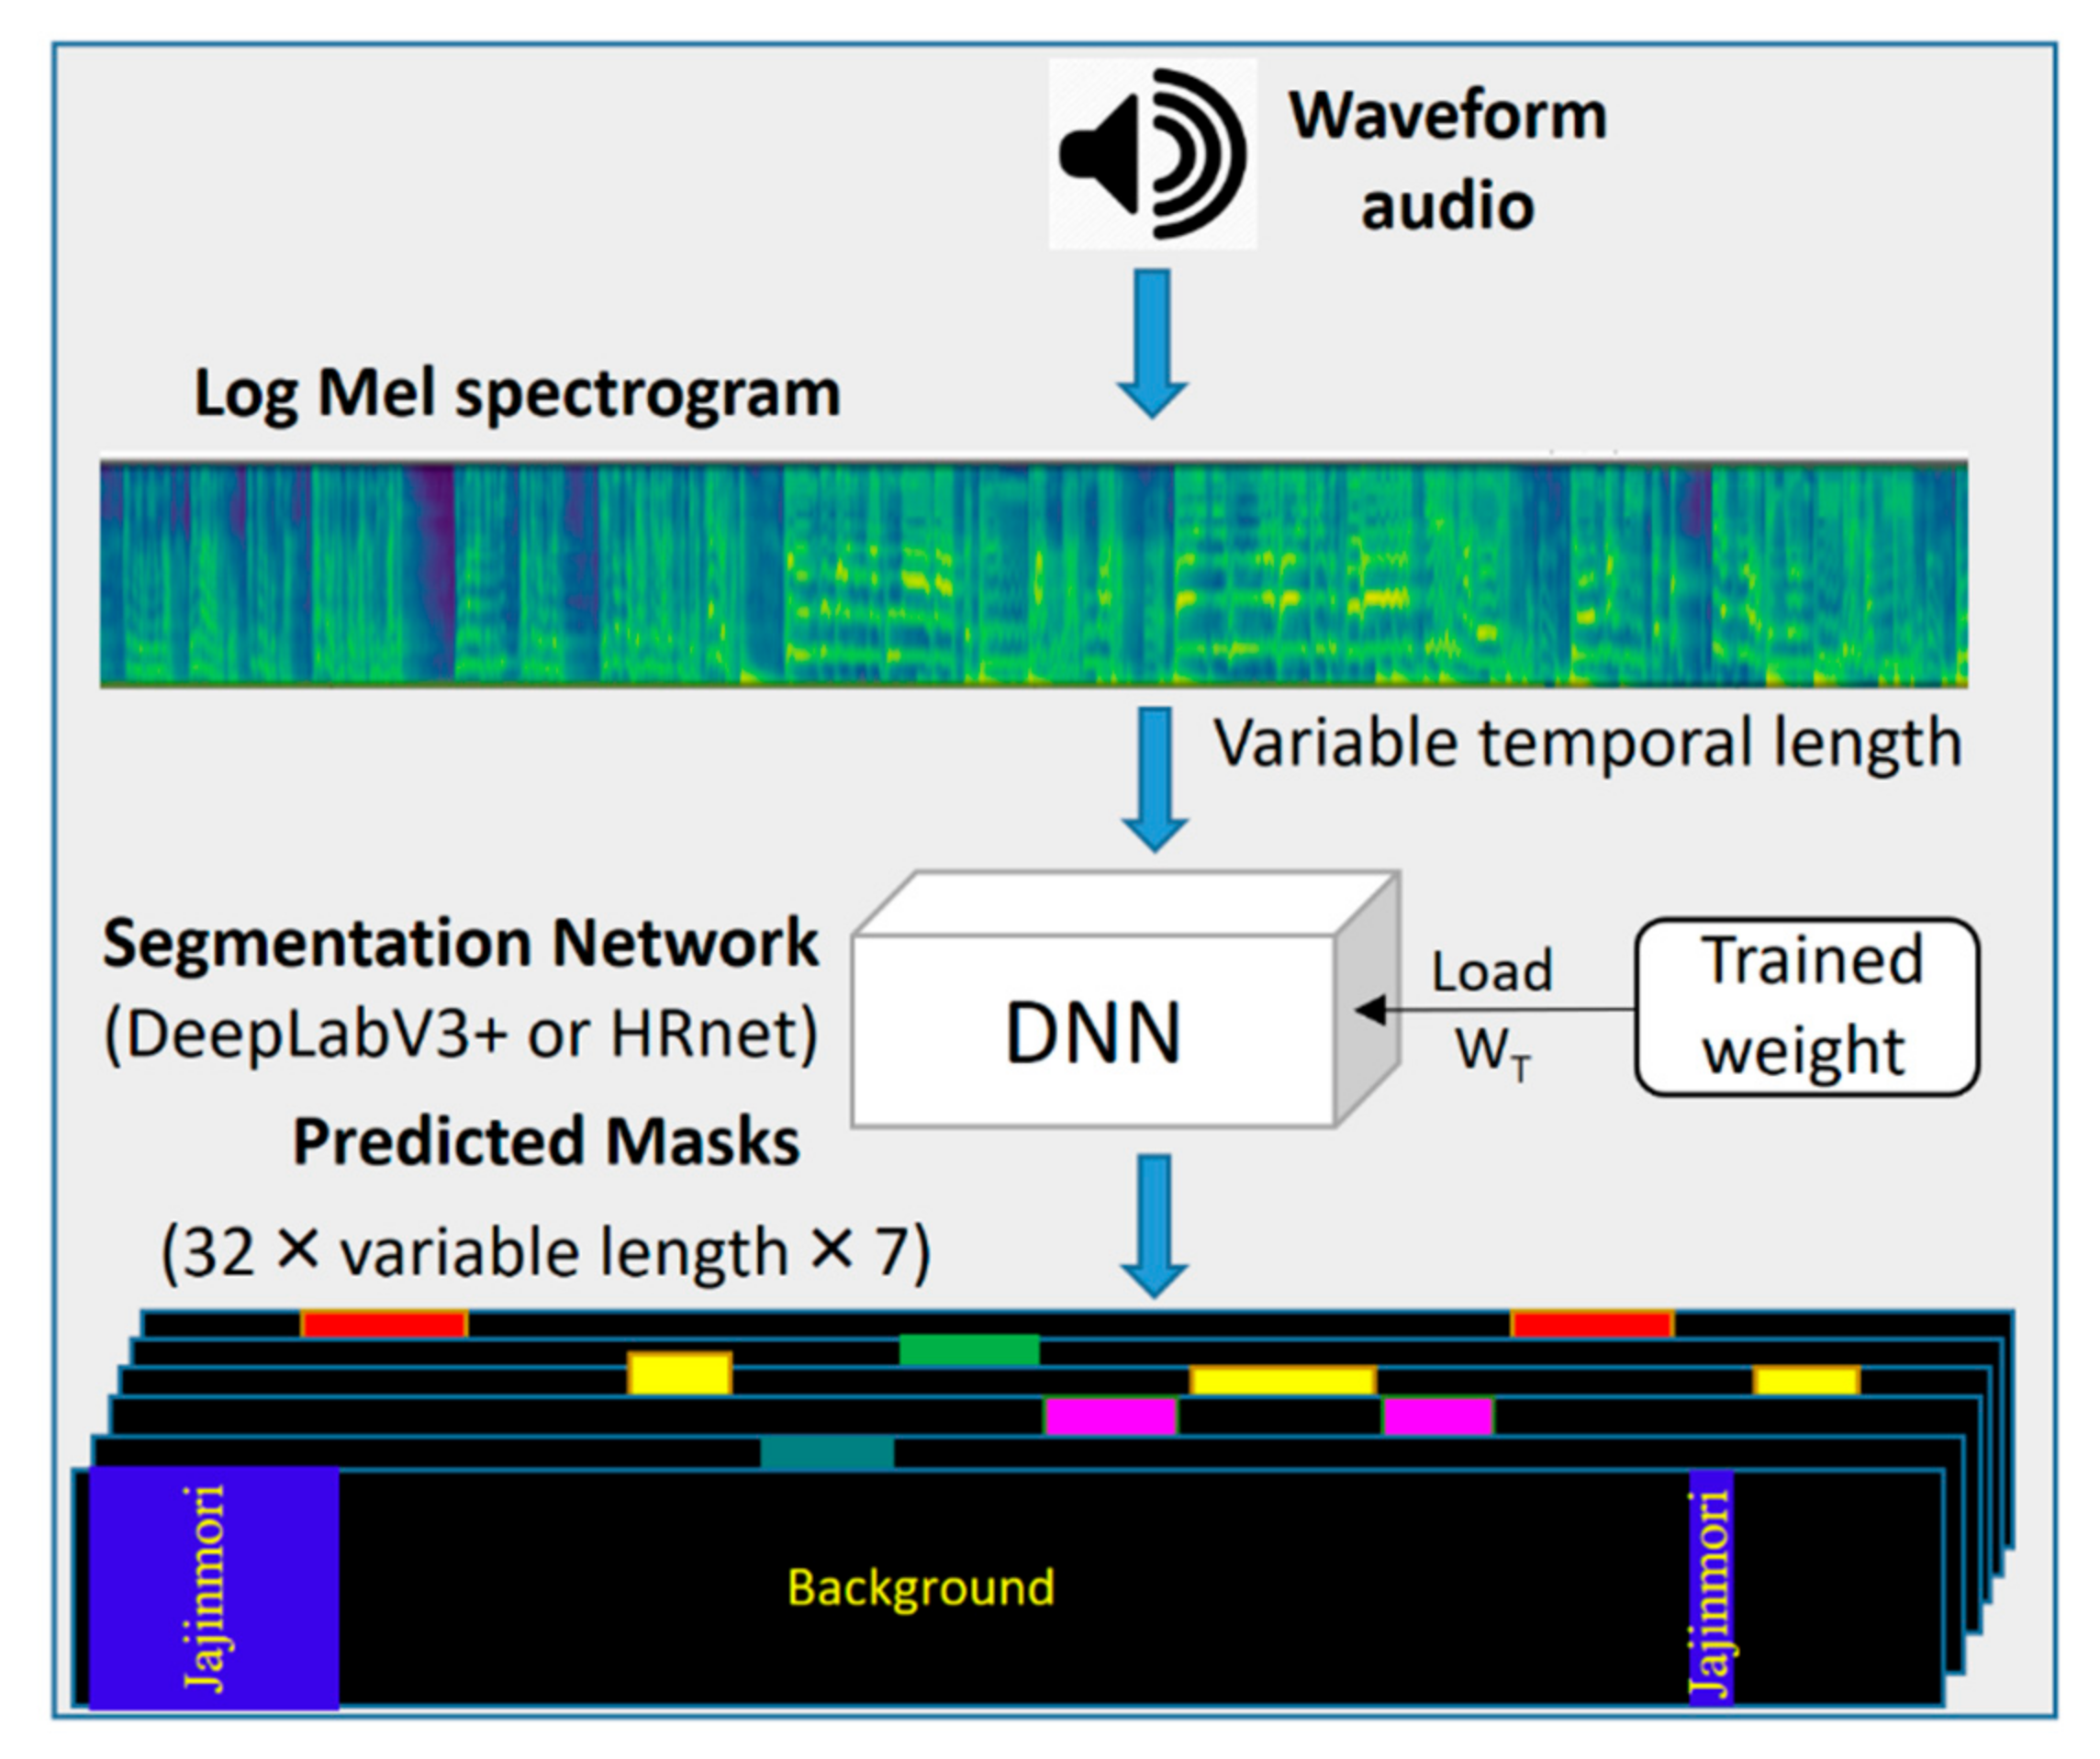
At the inference stage of semantic segmentation, the entire time-frequency representation of an audio sample was inputted to the trained segmentation network, and probable masks were generated for each rhythm category, as shown in Figure 1. The start and end times of each predicted rhythm category are shown in output masks with unique colors as with visual data [23]. The background class was illustrated with black (RGB: 0, 0, 0), Aniri with red (RGB: 255, 0, 0), AniriChangzo with green (RGB: 0, 255, 0), Jajinmori with blue (RGB: 0, 0, 255), Jinyangjo with yellow (RGB: 255, 255, 0), Jungjungmori with pink (RGB: 255, 0, 255) and Jungmori with sky green (RGB: 0, 128, 128).
3.2. Network Architectures
We used two neural networks for classification and two for segmentation of the Pansori rhythm dataset. The standard HR network [17] is a network used for rhythm segmentation. The HR network maintains high-resolution representations through the encoding process by connecting the high-to-low resolution convolution streams in parallel and repeatedly exchanging the information across resolutions. Another encoder–decoder network used for semantic segmentation is the DeepLabV3+ network that uses atrous separable convolution to preserve the resolution in the feature map. For both the HR network and DeepLabV3+, we utilized the network configurations as in the original paper.
A modified HR network is used for the classification of music rhythm. The last de-convolution block of the standard HR network was replaced by a Softmax layer after using global average pooling. We proposed a novel rhythm classifier called GlocalMuseNet that is capable of capturing local and global correlations of music. We addressed two major problems of standard convolution networks in the proposed architecture. First, the standard convolution considers only local regions and operations, which cannot include the global long-range dependencies. Second, deep neural networks become computationally expensive as the number of feature channels increases using standard convolution. Therefore, powerful hardware is a requirement that may not always be infeasible for all.
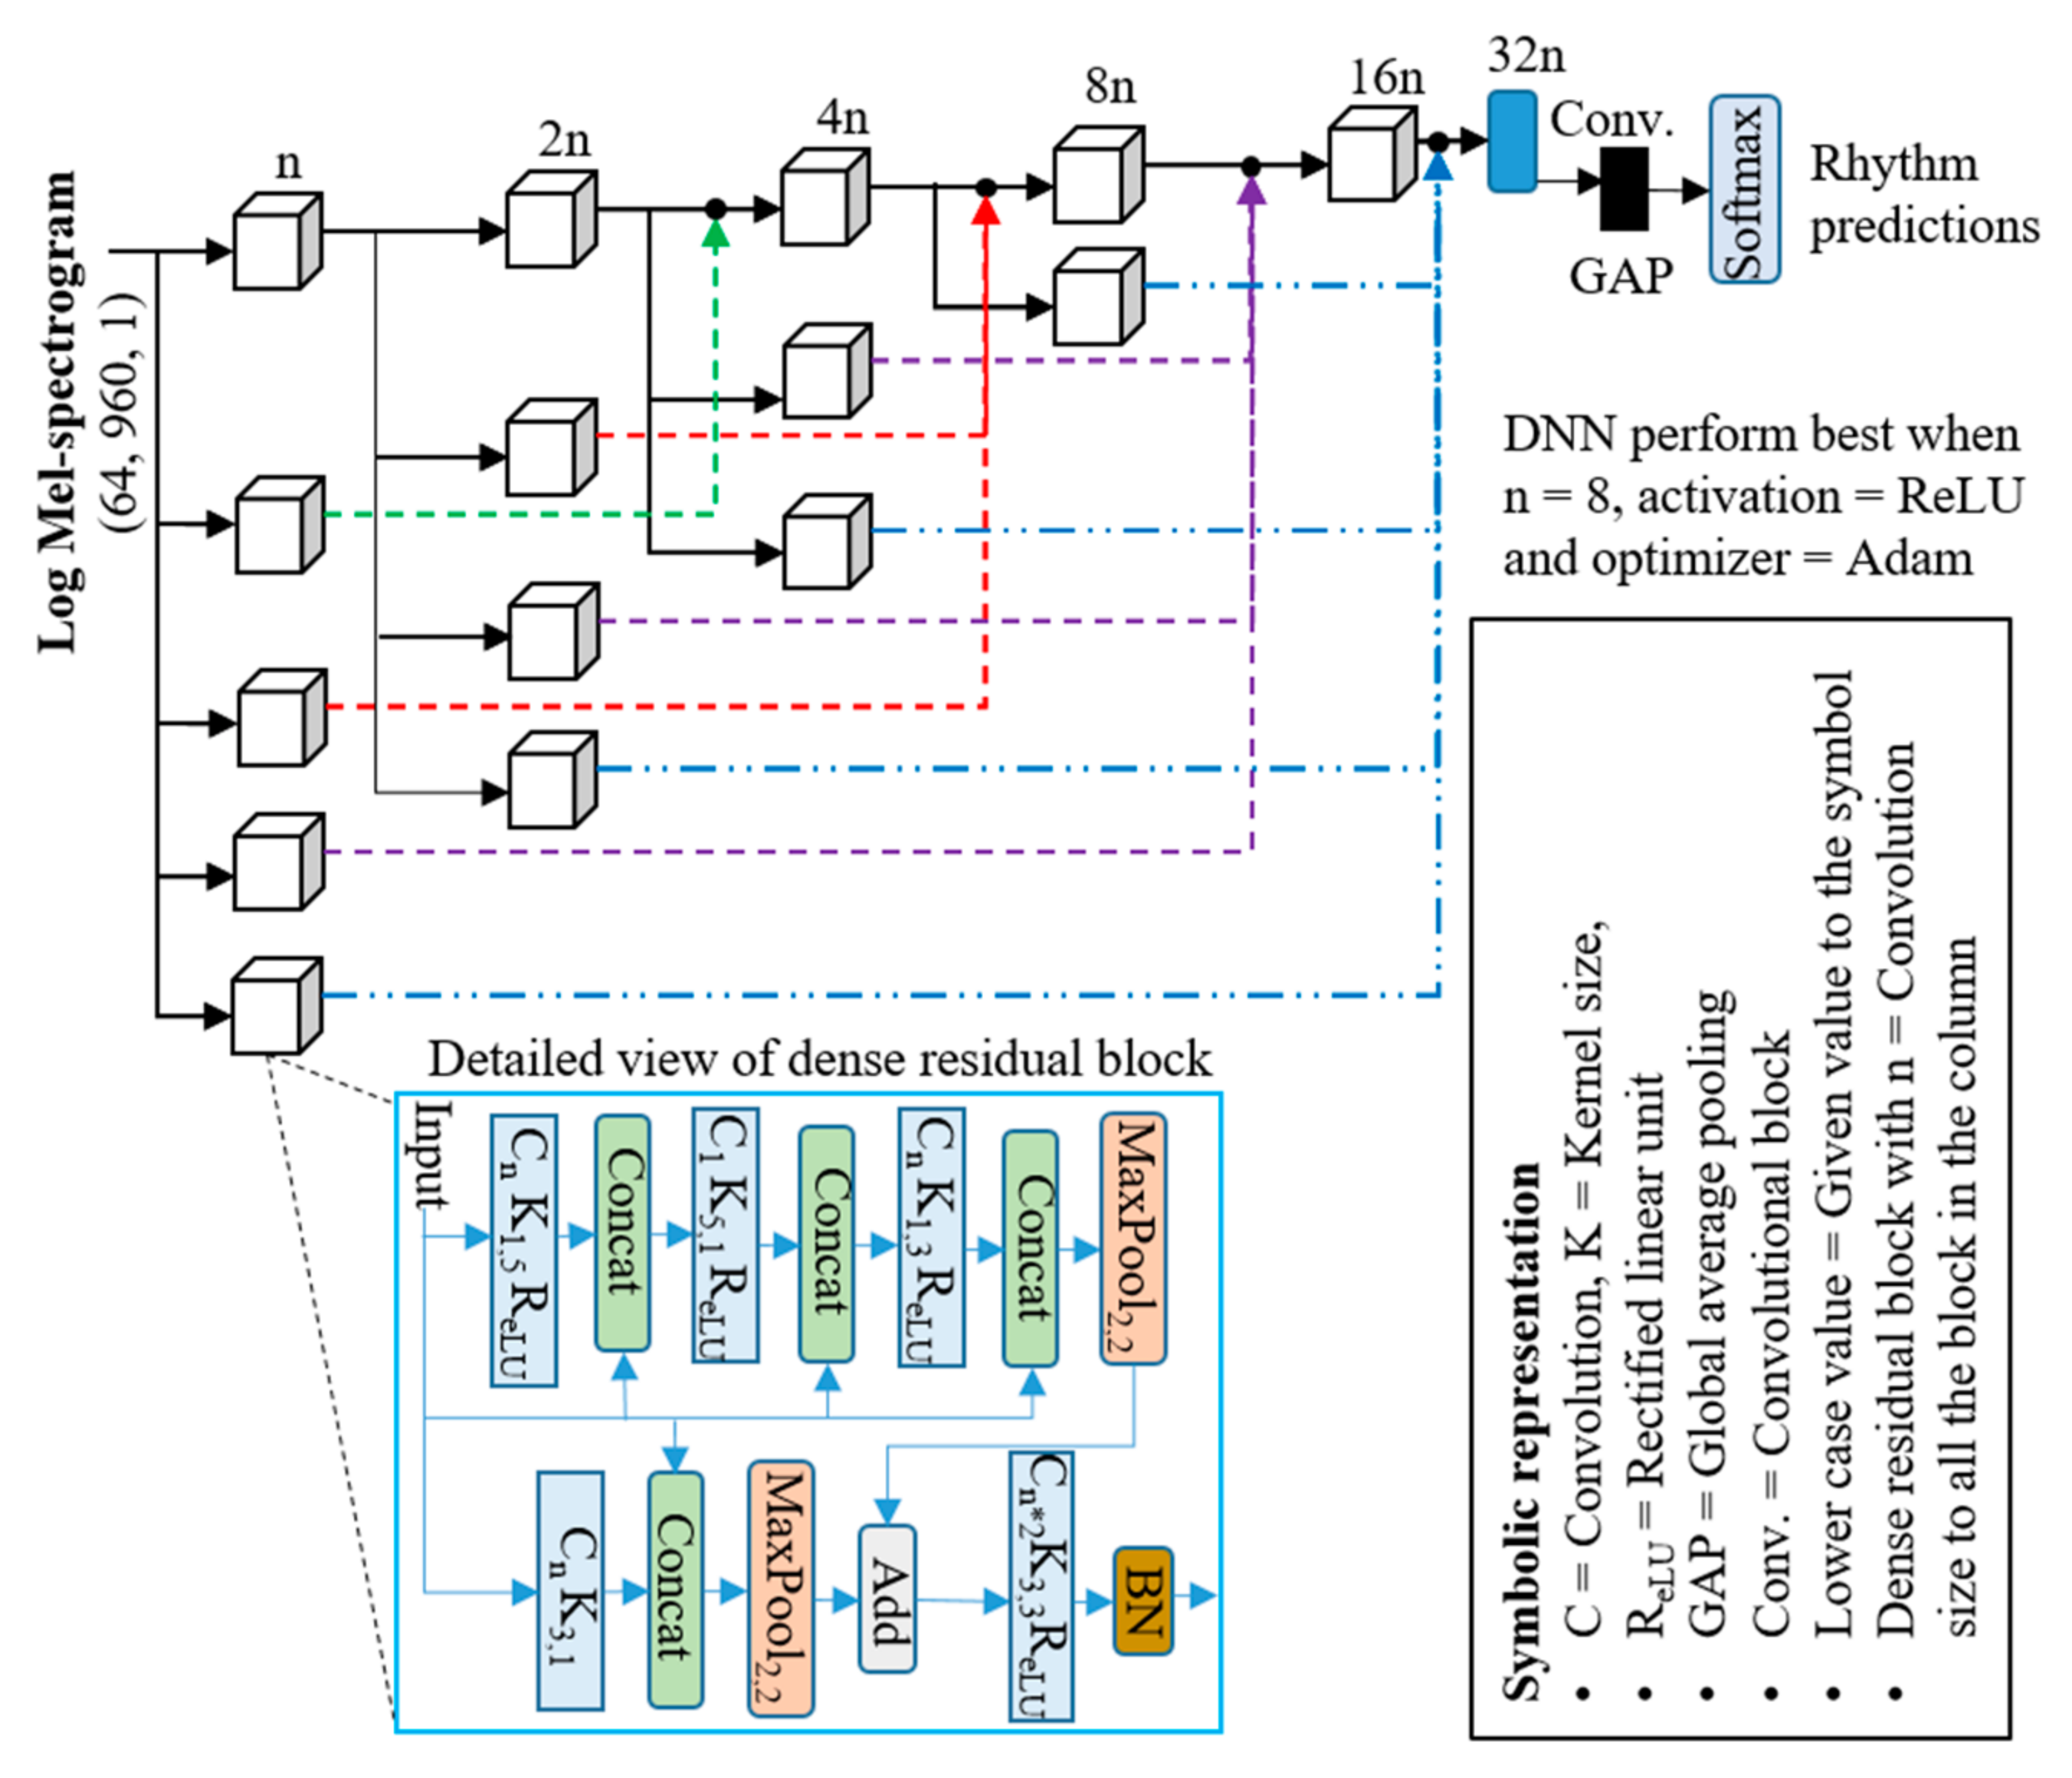
The GlocalMuseNet includes several dense residual blocks with several skip connections to share the global information and preserve sufficient resolution in feature maps. The network is designed with fewer parameters using the filter and channel separable convolution method [24]. In music processing using 2D convolution, the standard square filter of size () is converted into a rectangular temporal filter () and spatial filter (). This convolution separation method reduces computational complexity by preserving the essential temporal and harmonic features of music. The separable channel method summarizes all the channel information into a single channel and behaves as spatial attention. Each dense residual block of GlocalMuseNet is designed using filter and channel convolution and globally connected with another block to share the information and keep a resolution. The network block diagram of GlocalMuseNet is shown in Figure 2 with a detailed description of hyper-parameter settings and acronyms.
4. Experiments and Results
In this experiment, we represented the structural analysis of music using rhythms. The rhythmic structure of Pansori music was segmented using classification and semantic segmentation methods in long audio sequences. The classification-based segmentation method needs the class label to train DNNs and does not require precise boundary information (start time and end time) of music rhythm as the semantic segmentation method. Therefore, the classification-based method is less expensive in terms of labeling, training and evaluation time than semantic segmentation. However, the classifier does not experience the real data pattern at training time, which diminishes the overall segmentation result in test data. On the other hand, the DNNs for semantic segmentation are understood about the changing scenario of rhythmic patterns in the long audio sequence. Therefore, they well segment the test samples of Pansori music; however, some pixels are not correctly classified because of fewer training samples. The classifier and semantic segmentation networks are trained in an end-to-end fashion because of less possibility of transfer learning or meta-learning. In addition, the data augmentation is not used during training and testing: that is, test–time augmentation. Therefore, future researchers have enough space to improve this type of research. The greatest pitfall of our classification and segmentation results is the unbalanced dataset that needs to be corrected in future work. One possible way can be a generation of synthetic music data in order to balance the dataset using generating models such as GANs.
We used two methods for music segmentation described in the following sub-section. The deep neural networks used in this study successfully discovered the correlated information of multiple time-varied musical rhythms. The two datasets are set on contrast experiments for classification and segmentation in this paper. Adam is utilized to optimize the network by the initial learning rate of 1 × 10⁻³. The size of the log Mel-spectrogram input is set to 32 (Mel-bins) by 1020 (temporal length), which is equivalent to one-minute audio. The system was trained on a batch size of 8, and early stopping was applied to obtain the optimal solution. The Keras 2.3 with backend TensorFlow 1.4 is combined with CUDA version 10.0 and cuDNN version 8.0. The model training and inference are carried out in line with the NVIDIA RTX 6000 ×1 and Intel i7-6700k@4GHz.
4.1. Classification-Based Rhythm Segmentation
The modified HR network and the GlocalMuseNet were trained in an end-to-end manner for the classification of Pansori rhythms. The entire rhythm classification dataset was split randomly into the train (80%) and test (20%) sets. The performance of the trained classifier on the Pansori rhythm test dataset is illustrated in Table 3.
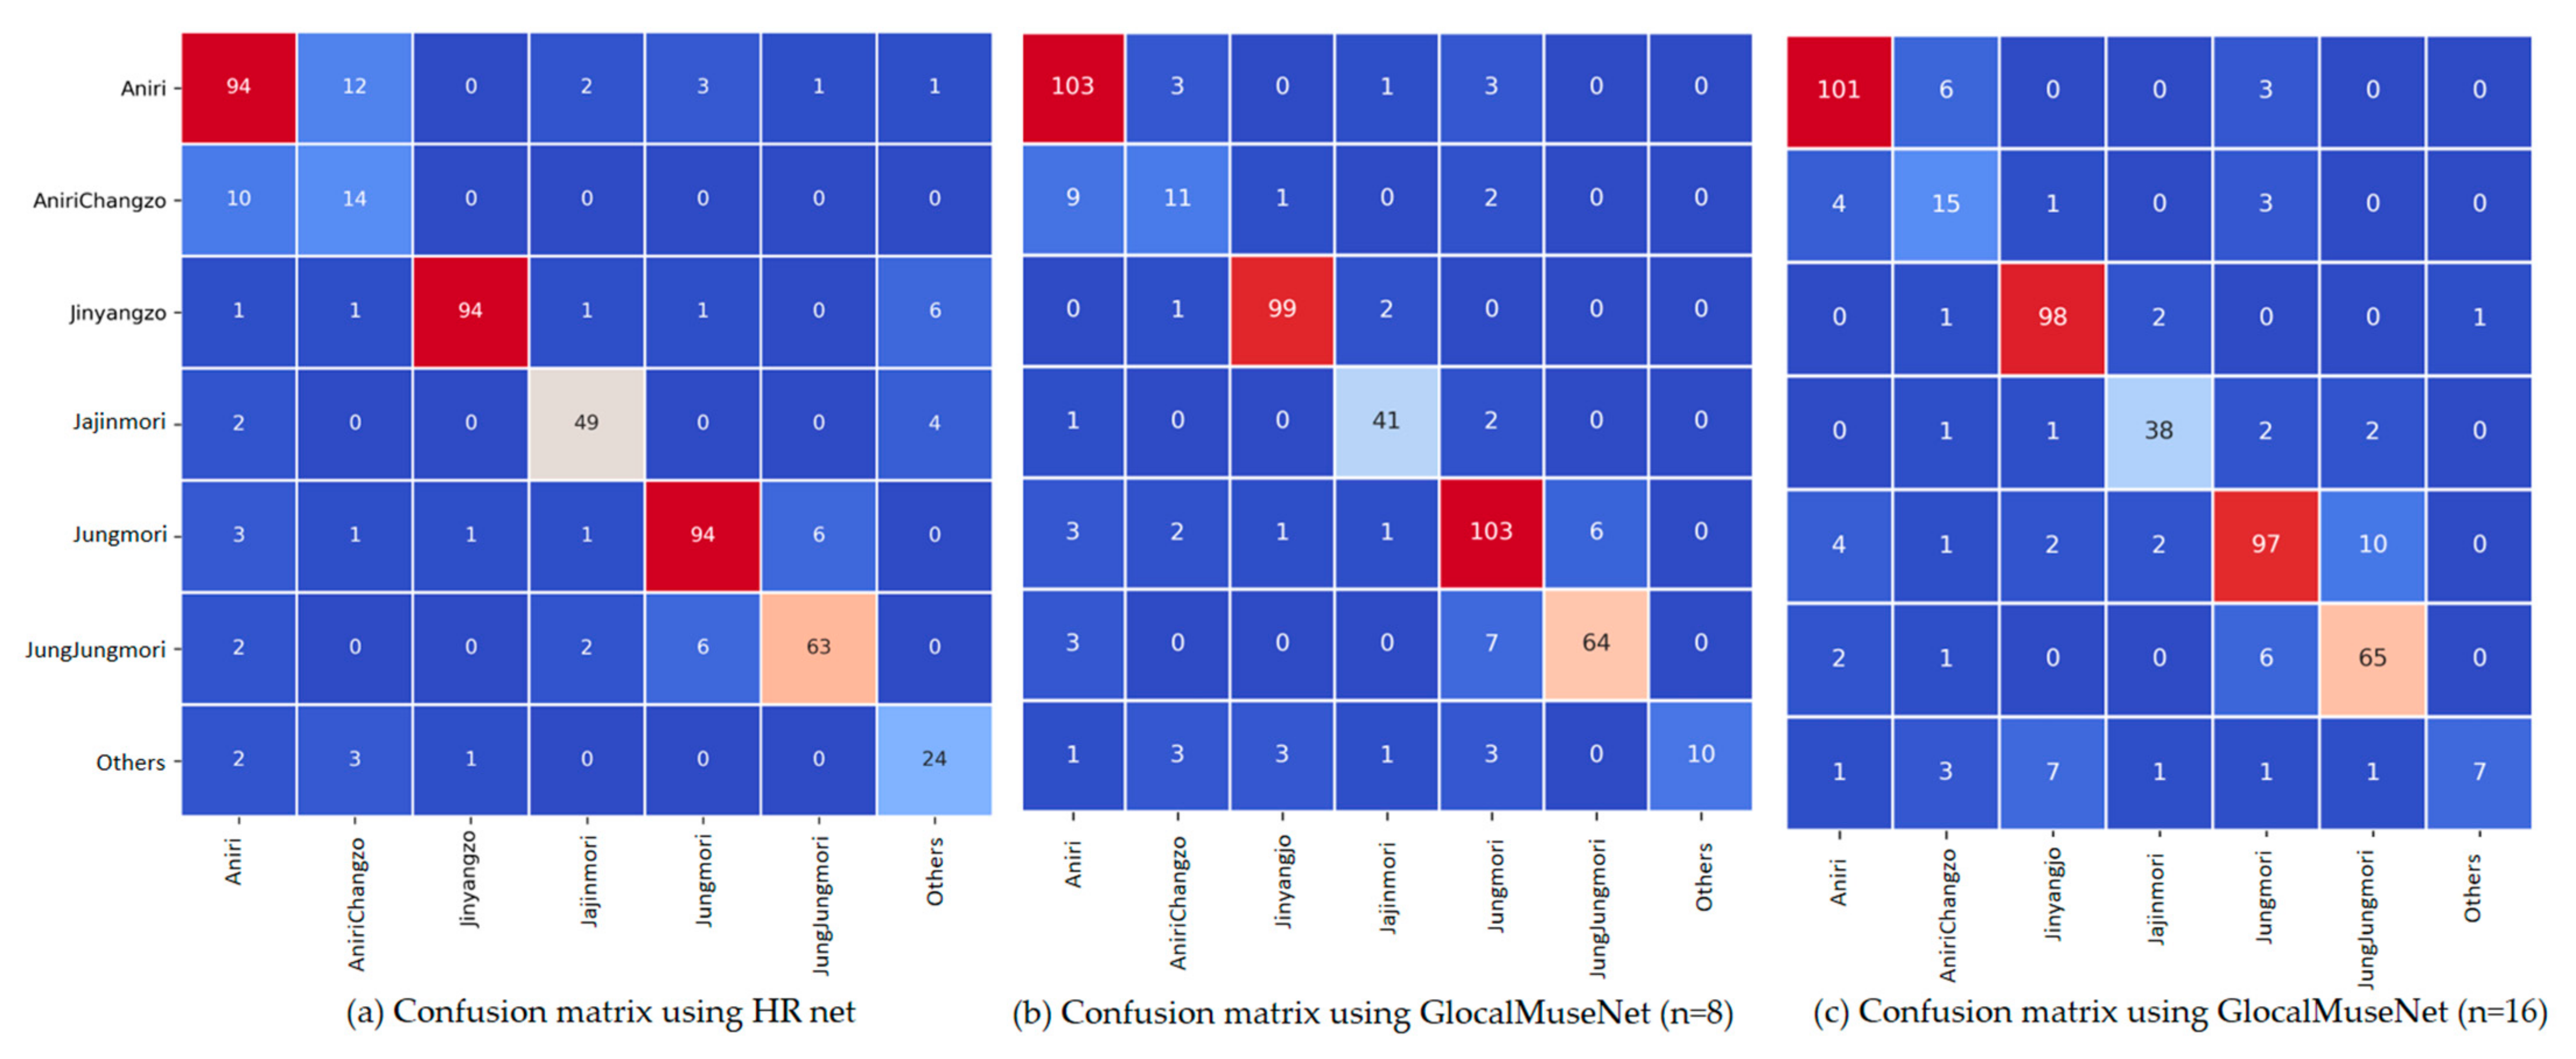
The GlocalMuseNet outperforms the HR net in this experiment with few training parameters. The GlocalMuseNet with eight initial convolution filters outperforms the other classifiers. The HR network has higher computational complexity than the GlocalMuseNet with 16 initial convolution filters but has relatively more computational complexity. The GlocalMuseNet with eight initial convolution filters perform the best and lightweight for training. The same network was used in classification-based rhythm segmentation. The evaluation metrics used in the classification of rhythmic patterns were accuracy, F1-score, and the area under the receiver operating characteristic curve (ROC-AUC) score. The confusion matrix of our three classifiers is shown in Figure 3a–c. The “Other” rhythmic class was found to be more confusing for GlocalMuseNet because it includes a diversified rhythm category, as described on Section 2. “AniriChangzo” was found to be confusing with “Aniri” for all classifiers, because these two classes have some common characteristics.
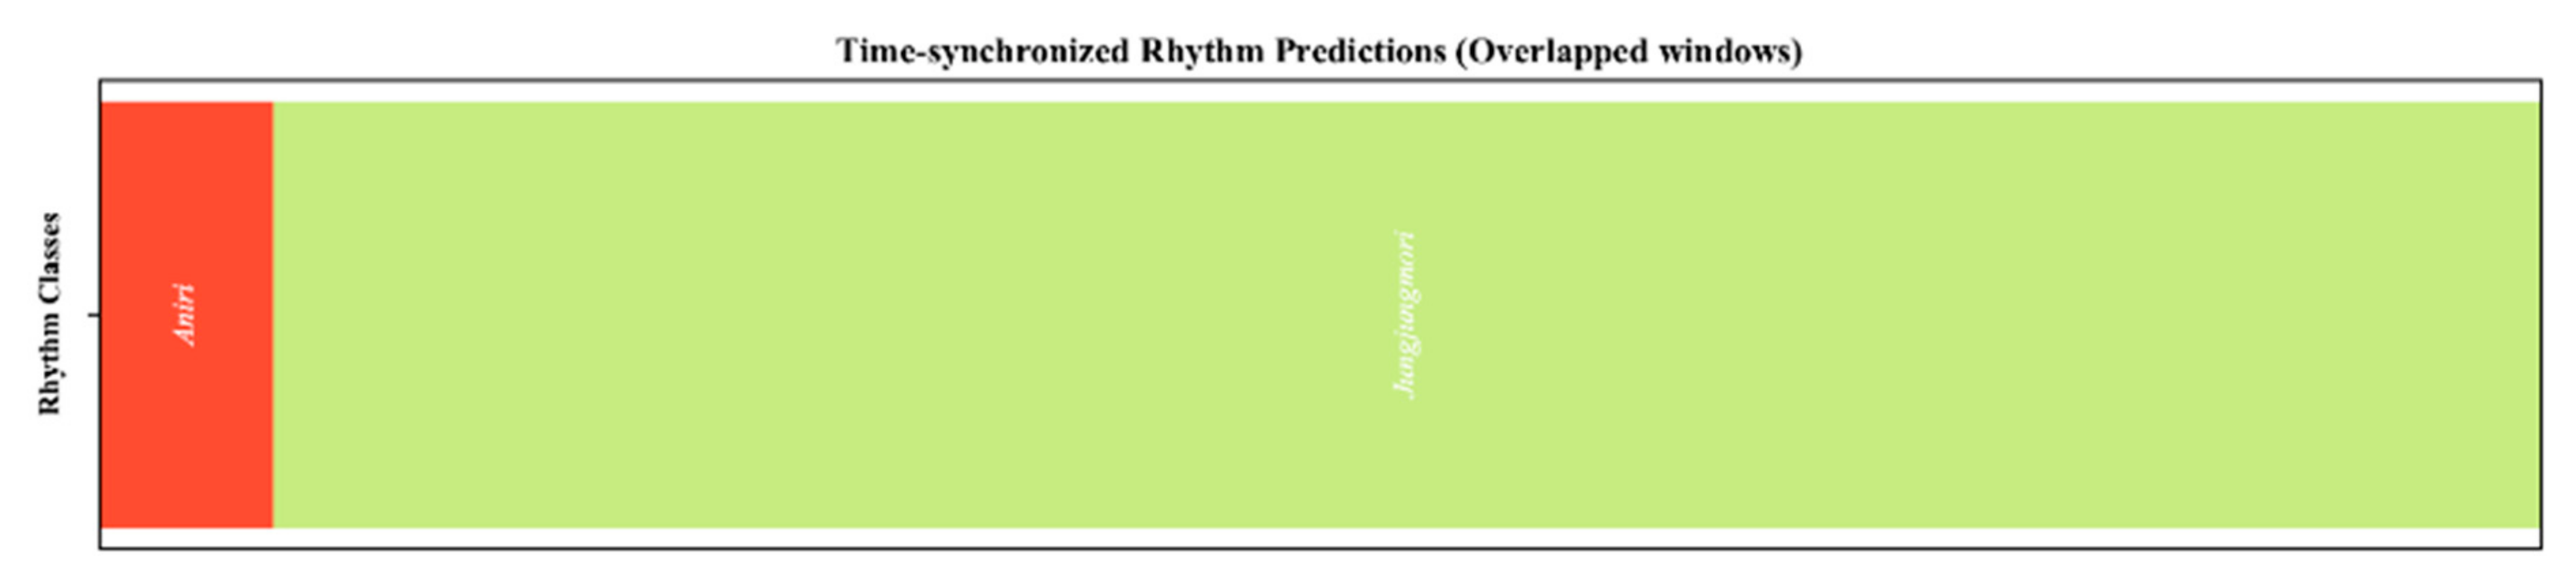
The segmentation results of a test sample using GlocalMuseNet are shown in Figure 4. The ground-truth rhythmic boundaries and class categories are described in the caption of the figure. The result shows a strong calibration of segmented rhythm with ground truth. However, some results are biased from actual ground truth due to the lack of training data.
4.2. Pixel-Based Rhythm Segmentation
The standard HR network and DeepLabV3+ networks are designed for the semantic segmentation of images that are applicable in MIR if audio representation is a time-frequency spectrogram. In this work, the HR network is used in its original form and with minor modifications. We termed the modified HR network for semantic segmentation as a 2Dto1D HR network in which the frequency dimension is squeezed to one by max-pooling/average pooling after upsampling the encoded feature maps in the final layer. The modified version of the HR network outperformed the original HR network but did not exceed the DeepLabV3+’s capabilities, as shown in Table 4. For the semantic segmentation network, the input audio representation had a size of (1920, 32) with a single channel. Here, 32 represents the number of Mel-bins, and 1920 represents the temporal length of audio in spectral representation that is equivalent to one-minute audio.
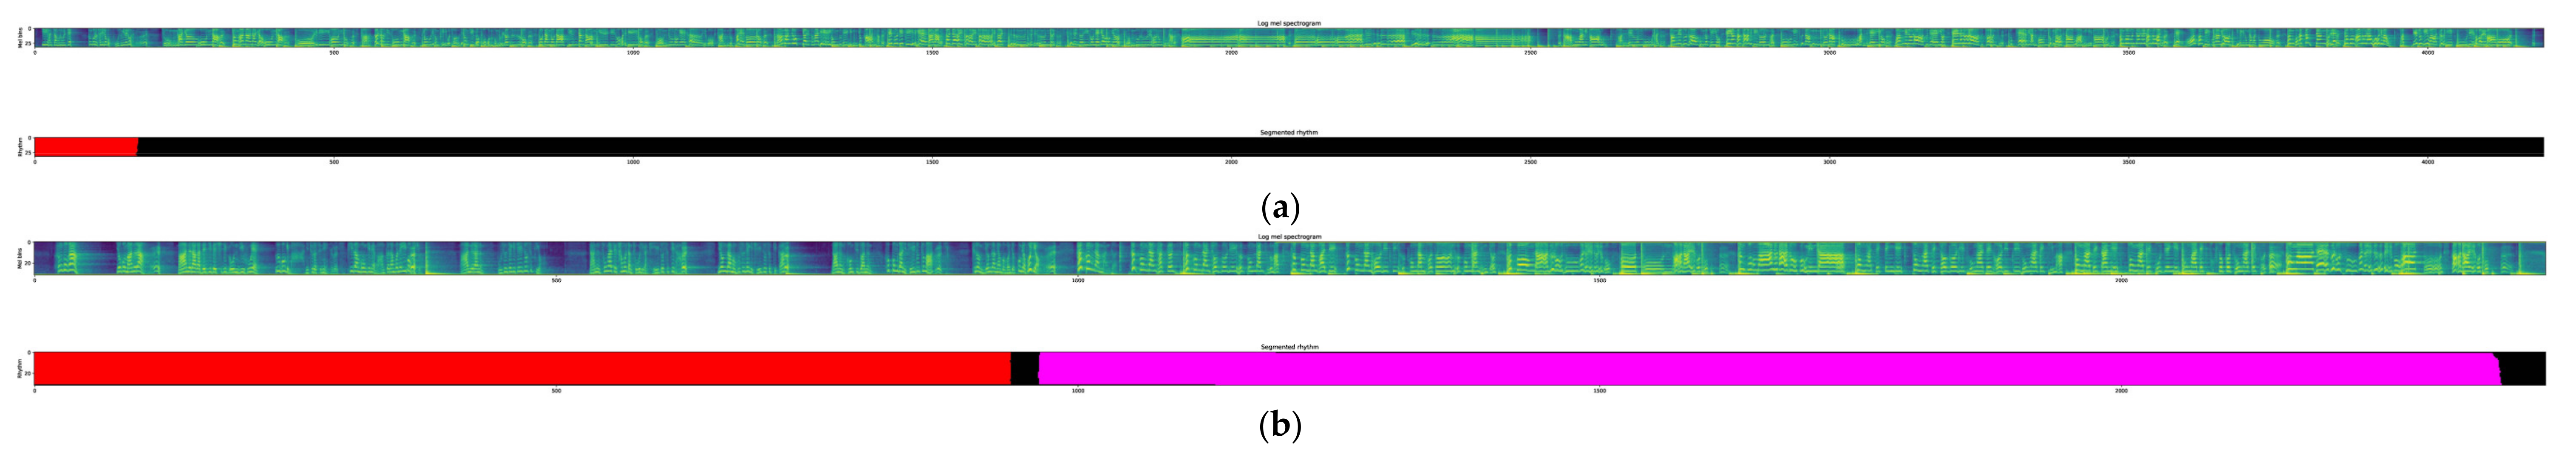
The evaluation metrics used in the semantic segmentation experiment are intersection over union (IoU), class accuracy, mean square error (MSE), and pixel accuracy scores. The DeepLabV3+ network outperformed the HR network; however, it required a relatively large number of parameters and training time. Figure 5a,b show the DeepLabV3+ network’s segmentation results with ground truths provided by Pansori experts. Figure 5a shows the successful segmentation of Pansori rhythms; however, the separation of background (black) from other rhythmic categories/classes was difficult, as it included highly unbalanced rhythmic patterns and boundary noises. Figure 5b illustrates that the segmentation networks were well-trained and successfully recognized the rhythmic patterns when it has sufficient training samples. The output masks can be of different widths (as shown in Figure 5) based on the length of the audio.
4.3. Comparison on Proposed Methods
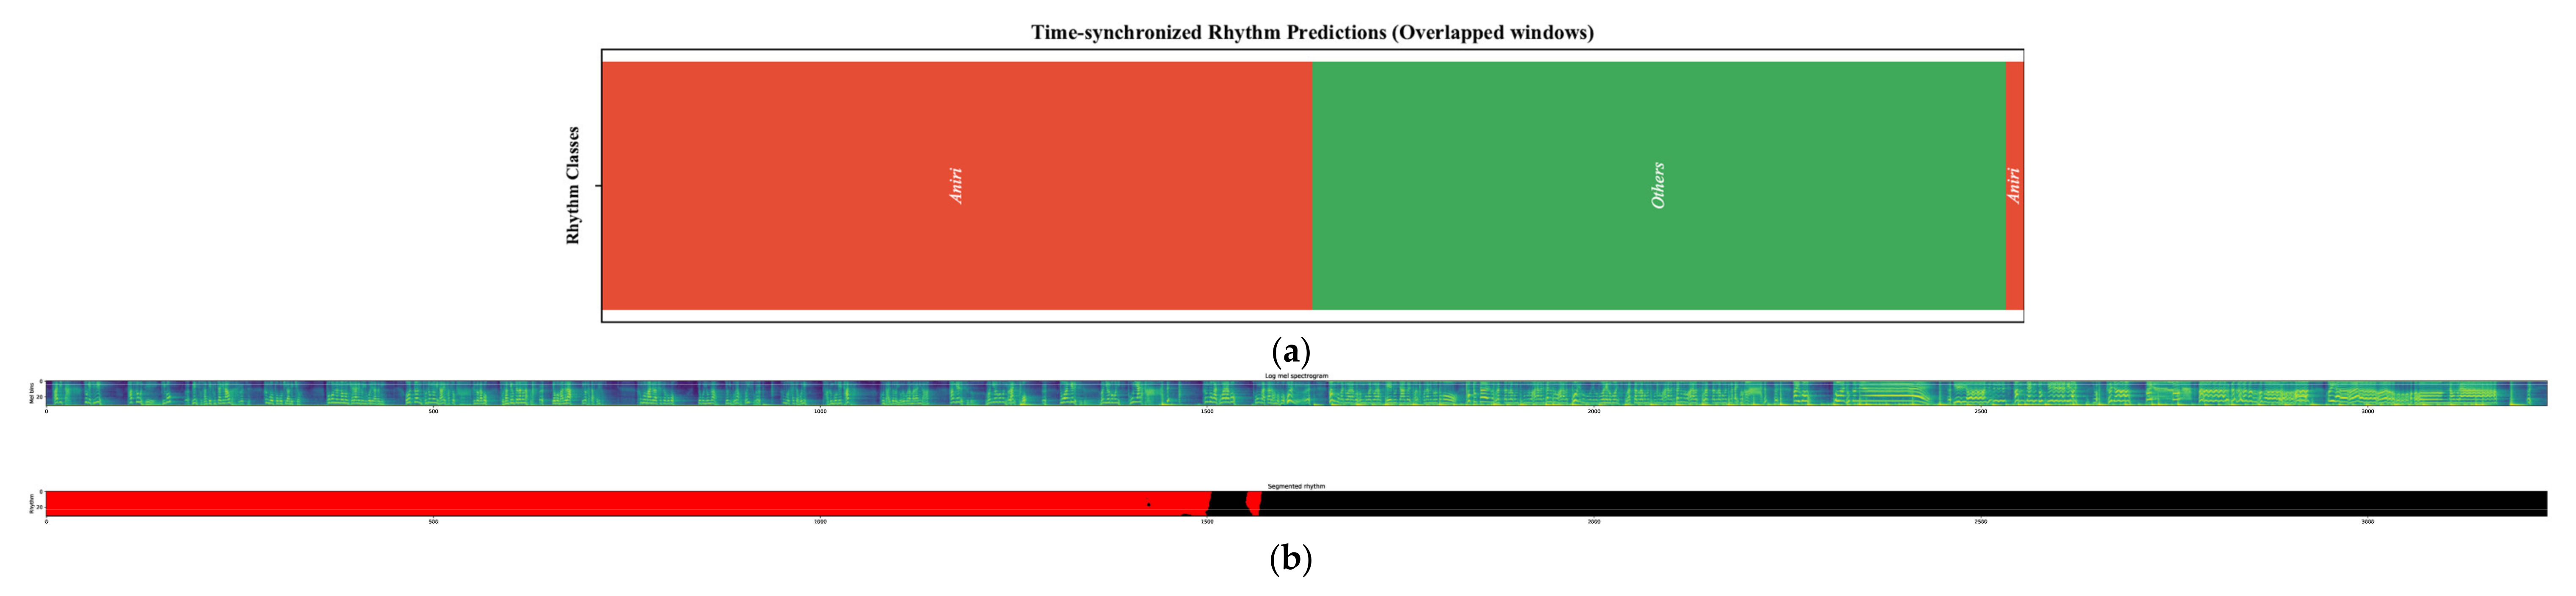
The past MSA methods do not use the pixel-level segmentation of musical modes. The past research [16,17] used a novelty curve and self-similarity matrix to represent the structural information in music. We made a pixel-level structural segmentation of music using two methods. In this section, we compared the efficiency of our classification-based and semantic segmentation-based methods in the Pansori rhythm segmentation dataset. It is hard to make a quantitative comparison between these two methods; therefore, we interpreted the segmentation results of our two methods in the same test sample, as shown in Figure 6a,b.
The small boundary of the “Aniri” class at the right end of Figure 6a shows the miss-predicted segmentation result using the classification-based segmentation method. The semantic segmentation shown in Figure 5b solves this issue and segmented the music bounder as the ground truth; however, the DeepLabV3+ model also has some limitations in pixel label. The “Background” includes highly diversified rhythmic patterns that create confusion for both the classifier and the segmentation network. Another reason can be the unbalanced dataset and noisy rhythmic boundaries. These issues can be solved in the future by increasing the dataset and designing an optimal neural network for this specific problem.
5. Conclusions
We developed a straightforward method of music structure segmentation using the rhythms of Korean traditional music called Pansori. We successfully implemented rhythm classification and semantic segmentation methods for rhythm segmentation. We implemented straightforward and practical methods to process long audio sequences during the inference phase of music classification and segmentation. We proposed and utilized two supervised datasets: one for classification and another for the semantic segmentation of Pansori music. Several classifications and semantic segmentation neural networks were trained in an end-to-end manner and tested for structural analysis. A novel classification model called GlocalMuseNet and a novel segmentation model (modified HR) are proposed in this work for the structural analysis of Pansori music. The trained classifiers successfully segment the music rhythm by using overlapping window frames in a spectral representation of unknown audio. In this experiment, the semantic segmentation-based method was more accurate than the classification-based rhythm segmentation method. One reason is that the classifier never faces the real segmentation environment in its training phase. In comparison, the annotation process for the semantic segmentation method is more complicated and expensive than the classification-based method. In the future, if sufficient training data and efficient methods are available, both the classification and segmentation methods can provide satisfactory results in the structural segmentation of music. Data augmentation using generative networks such as GANs can be another way to solve the data scarcity and unbalanced class problem.
Author Contributions
The first author, Y.R.P., contributed to the whole project, which includes conceptualization, methodology, software development, validation, analysis, data curation and writing the original draft. The corresponding author, J.L., contributed to funding acquisition, conceptualization and supervision. The second author, B.B., mainly helped with the manuscript review and editing as well as resource management. All authors have read and agreed to the published version of the manuscript.
Funding
This work was funded by the National Research Foundation of Korea (NRF) under the Development of AI for Analysis and Synthesis of Korean Pansori Project (NRF-2021R1A2C2006895).
Institutional Review Board Statement
Not applicable.
Informed Consent Statement
Not applicable.
Data Availability Statement
The raw data supporting the conclusions of this article will be made available by the authors without undue reservation.
Acknowledgments
We would also like to express our gratitude to the editors of the Writing Center at Jeonbuk National University for their skilled English-language assistance.
Conflicts of Interest
The authors declare no conflict of interest.
References
- Jensen, K. Multiple Scale Music Segmentation Using Rhythm, Timbre, and Harmony. EURASIP J. Adv. Signal Process. 2006, 073205, 2007. [Google Scholar] [CrossRef]
- Aucouturier, J.J.; Pachet, F. Music Similarity Measures: What’s the Use? In Proceedings of the 3rd International Conference on Music Information Retrieval (ISMIR 2002), Paris, France, 13–17 October 2002. [Google Scholar]
- Chen, H.C.; Lin, C.H.; Chen, A.L.P. Music segmentation by rhythmic features and melodic shapes. In Proceedings of the 2004 IEEE International Conference on Multimedia and Expo (ICME) (IEEE Cat. No. 04TH8763), Taipei, Taiwan, 27–30 June 2004; Volume 3, pp. 1643–1646. [Google Scholar]
- Jensen, J.H.; Christensen, M.G.; Jensen, S.H. A Framework for Analysis of Music Similarity Measures. In Proceedings of the 15th European Signal Processing Conference, Poznan, Poland, 3–7 September 2007; EURASIP Open Library: Poznan, Poland, 2007; pp. 926–930. [Google Scholar]
- Jia, Y.; Liu, Y. A Music Similarity Model Based on Data Analysis and Algorithm Application. In Proceedings of the 2021 IEEE International Conference on Artificial Intelligence and Industrial Design (AIID), Guangzhou, China, 28–30 May 2021; pp. 242–246. [Google Scholar]
- Gurjar, K.; Moon, Y. A Comparative Analysis of Music Similarity Measures in Music Information Retrieval Systems. J. Inf. Process. Syst. 2018, 14, 32–55. [Google Scholar]
- Volk, A.; Chew, E.; Margulis, E.H.; Anagnostopoulou, C. Music Similarity: Concepts, Cognition and Computation. J. New Music Res. 2016, 45, 207–209. [Google Scholar] [CrossRef]
- Sheh, A.; Ellis, D. Chord Segmentation and Recognition using EM-Trained Hidden Markov Models. In Proceedings of the 4th International Symposium on Music Information Retrieval (ISMIR-03), Baltimore, MD, USA, 27–30 October 2003. [Google Scholar]
- Peiszer, E.; Lidy, T.; Rauber, A. Automatic audio segmentation: Segment boundary and structure detection in popular music. In Proceedings of the 2nd International Workshop on Learning the Semantics of Audio Signals (LSAS), Paris, France, 21 June 2008. [Google Scholar]
- McFee, B.; Ellis, D.P.W. Learning to segment songs with ordinal linear discriminant analysis. In Proceedings of the 2014 IEEE International Conference on Acoustics, Speech and Signal Processing (ICASSP), Florence, Italy, 4–9 May 2014; pp. 5197–5201. [Google Scholar] [CrossRef]
- McCallum, C.M. Unsupervised Learning of Deep Features for Music Segmentation. arXiv 2021, arXiv:2108.12955v1. [Google Scholar]
- Chai, W. Semantic segmentation and summarization of music: Methods based on tonality and recurrent structure. IEEE Signal Process. Mag. 2006, 23, 124–132. [Google Scholar] [CrossRef]
- Berenzweig, A.L.; Ellis, D. Locating Singing Voice Segments within Music Signals. In Proceedings of the Workshop on Applications of Signal Processing to Audio and Acoustics, New Platz, NY, USA, 24–24 October 2001. [Google Scholar]
- Nieto, O.; Mysore, G.J.; Wang, C.; Smith, J.B.L.; Schlüter, J.; Grill, T.; McFee, B. Audio-Based Music Structure Analysis: Current Trends, Open Challenges, and Applications. Trans. Int. Soc. Music Inf. Retr. 2020, 3, 246–263. [Google Scholar] [CrossRef]
- Grill, T.; Schluter, J. Music boundary detection using neural networks on combined features and two-level annotations. In Proceedings of the 16th International Society for Music Information Retrieval Conference, Málaga, Spain, 26–30 October 2015. [Google Scholar]
- Jensen, K.; Xu, J.; Zachariasen, M. Rhythm-Based Segmentation of Popular Chinese Music. In Proceedings of the 6th International Conference on Music Information Retrieval (ISMIR 2005), London, UK, 11–15 September 2005. [Google Scholar]
- Wang, J.; Sun, K.; Cheng, T.; Jiang, B.; Deng, C.; Zhao, Y.; Liu, D.; Mu, Y.; Tan, M.; Wang, X.; et al. Deep High-Resolution Representation Learning for Visual Recognition. IEEE Trans. Pattern Anal. Mach. Intell. 2020, 43, 3349–3364. [Google Scholar] [CrossRef] [PubMed]
- Chen, L.C.; Zhu, Y.; Papandreou, G.; Schroff, F.; Adam, H. Encoder-Decoder with Atrous Separable Convolution for Semantic Image Segmentation. In Computer Vision—ECCV 2018, Proceedings of the 15th European Conference, Munich, Germany, 8–14 September 2018; Springer Nature: Cham, Switzerland, 2018. [Google Scholar]
- Pandeya, Y.R.; Kim, D.; Lee, J. Domestic Cat Sound Classification Using Learned Features from Deep Neural Nets. Appl. Sci. 2018, 8, 1949. [Google Scholar] [CrossRef]
- Pandeya, Y.R.; Bhattarai, B.; Lee, J. Music video emotion classification using slow–fast audio–video network and unsupervised feature representation. Sci. Rep. 2021, 11, 19834. [Google Scholar] [CrossRef] [PubMed]
- Pandeya, Y.R.; Bhattarai, B.; Lee, J. Visual Object Detector for Cow Sound Event Detection. IEEE Access 2020, 8, 162625–162633. [Google Scholar] [CrossRef]
- Pandeya, Y.R.; Bhattarai, B.; Afzaal, U.; Kim, J.B.; Lee, J. A monophonic cow sound annotation tool using a semi-automatic method on audio/video data. Livest. Sci. 2022, 256, 104811. [Google Scholar] [CrossRef]
- Demeyere, N.; Humphreys, G.W. Distributed and focused attention: Neuropsychological evidence for separate attentional mechanisms when counting and estimating. J. Exp. Psychol. Hum. Percept. Perform. 2007, 33, 1076–1088. [Google Scholar] [CrossRef] [PubMed]
- Pandeya, Y.R.; Bhattarai, B.; Lee, J. Deep-Learning-Based Multimodal Emotion Classification for Music Videos. Sensors 2021, 21, 4927. [Google Scholar] [CrossRef] [PubMed]
Figure 1.
Information pipeline in inference phase of semantic segmentation of Pansori rhythm. The black color represent background and the music rhythmic segments are shown by unique color in the temporal direction of music in spectral representation.
Figure 1.
Information pipeline in inference phase of semantic segmentation of Pansori rhythm. The black color represent background and the music rhythmic segments are shown by unique color in the temporal direction of music in spectral representation.

Figure 2.
Architectural block diagram of GlocalMuseNet with detail view of dense residual block, hyper-parameters and symbolic representation.
Figure 2.
Architectural block diagram of GlocalMuseNet with detail view of dense residual block, hyper-parameters and symbolic representation.

Figure 3.
Confusion matrix of our three classifiers using Pansori classification dataset of seven classes.
Figure 3.
Confusion matrix of our three classifiers using Pansori classification dataset of seven classes.

Figure 4.
Segmented output on test sample using classification-based segmentation method. (ground truth: Aniri 0 to 17 s and Jungjungmori 18 to 93 s).
Figure 4.
Segmented output on test sample using classification-based segmentation method. (ground truth: Aniri 0 to 17 s and Jungjungmori 18 to 93 s).

Figure 5.
Pixel-level segmentation results of test samples using DeepLabV3+. The best segmentation network distinguishes the musical modes with unique color per class. The background class is illustrated with black (RGB: 0, 0, 0), Aniri with red (RGB: 255, 0, 0), AniriChangzo with green (RGB: 0, 255, 0), Jajinmori with blue (RGB: 0, 0, 255), Jinyangjo with yellow (RGB: 255, 255, 0), Jungjungmori with pink (RGB: 255, 0, 255) and Jungmori with sky green (RGB: 0, 128, 128). (a) Semantic segmentation result of a test sample using best segmentation network. The upper figure is an input log Mel-spectrogram and the lower figure is the predicted mask (ground truth: Aniri 0 s to 5 s and Utmori 6 s to 191 s). (b) Semantic segmentation result of a test sample using best segmentation network. The upper figure is an input log Mel-spectrogram and the lower figure is the predicted mask (ground truth: Aniri 0 to 29 s and Jungjungmori 30 to 75 s).

Figure 6.
Classification-based and semantic segmentation-based Pansori rhythm segmentation on same test sample. The color indicates the rhythmic class as in Figure 5. (a) Segmented output on test sample using classification-based segmentation method (ground truth: Aniri 0 to 50 s and Hweemori 51 to 101 s). The segmented classes are distinguished by color and captions. (b) Segmented rhythm in a test sample using DeepLabV3+. The upper figure is an input log Mel-spectrogram and the lower figure is the predicted mask (ground truth: Aniri 0 to 50 s and Hweemori 51 to 101 s).


Table 1.
Pansori rhythm classification dataset. There is only one rhythm category per sample.
| Musical Class | Number of Samples |
|---|---|
| Aniri | 752 |
| AniriChangzo | 232 |
| Jajinmori | 144 |
| Jinyangjo | 132 |
| Jungjungmori | 157 |
| Jungmori | 292 |
| Others Ψ | 95 |
Ψ Other categories include ‘Dockseoseong’, ‘Eonmori’, ‘Eotjungmori’, ‘Hwimori’, ‘Semachi’, and ‘Sichang’ musical modes.
Table 2.
Pansori rhythm segmentation dataset. Events are the singing mods presented in the whole dataset.
Table 2.
Pansori rhythm segmentation dataset. Events are the singing mods presented in the whole dataset.
| Musical Segment Name | Number of Audio Events |
|---|---|
| Aniri | 752 |
| AniriChangzo | 232 |
| Jajinmori | 144 |
| Jinyangjo | 132 |
| Jungjungmori | 157 |
| Jungmori | 292 |
| Background # | 95 |
# Background includes ‘Dockseoseong’, ‘Eotmori’, ‘Eotjungmori’, ‘Hwimori’, ‘Semachi’, and ‘Sichang’ musical segments of audio.
Table 3.
Classification score of rhythm classifier.
| Network | Test Accuracy | F1-Score | ROC-AUC Score | Training Parameters |
|---|---|---|---|---|
| HR net | 0.8554 | 0.811 | 0.971 | 9,523,655 |
| GlocalMuseNet (n * = 8) | 0.8795 | 0.815 | 0.969 | 1,753,567 |
| GlocalMuseNet (n = 16) | 0.8591 | 0.784 | 0.961 | 6,967,951 |
* n = number of convolution features in first layer.
Table 4.
Semantic segmentation based on rhythmic segmentation.
| Network | Test_IOU | Test_Acc | MSE | Test_Pixel_Acc |
|---|---|---|---|---|
| DeepLabV3 | 0.81580 | 0.9829 | 0.0038 | 0.9829 |
| HR network 2Dto1D | 00.7987 | 0.9428 | 0.0145 | 0.9428 |
| HR network | 0.67242 | 0.8886 | 0.0287 | 0.8886 |
Publisher’s Note: MDPI stays neutral with regard to jurisdictional claims in published maps and institutional affiliations. |
© 2022 by the authors. Licensee MDPI, Basel, Switzerland. This article is an open access article distributed under the terms and conditions of the Creative Commons Attribution (CC BY) license (https://creativecommons.org/licenses/by/4.0/).
Share and Cite
MDPI and ACS Style
Pandeya, Y.R.; Bhattarai, B.; Lee, J. Tracking the Rhythm: Pansori Rhythm Segmentation and Classification Methods and Datasets. Appl. Sci. 2022, 12, 9571. https://0-doi-org.brum.beds.ac.uk/10.3390/app12199571
AMA Style
Pandeya YR, Bhattarai B, Lee J. Tracking the Rhythm: Pansori Rhythm Segmentation and Classification Methods and Datasets. Applied Sciences. 2022; 12(19):9571. https://0-doi-org.brum.beds.ac.uk/10.3390/app12199571
Chicago/Turabian StylePandeya, Yagya Raj, Bhuwan Bhattarai, and Joonwhoan Lee. 2022. "Tracking the Rhythm: Pansori Rhythm Segmentation and Classification Methods and Datasets" Applied Sciences 12, no. 19: 9571. https://0-doi-org.brum.beds.ac.uk/10.3390/app12199571
Note that from the first issue of 2016, this journal uses article numbers instead of page numbers. See further details here.