Article

Numerical Study on Single-Bubble Contraction–Rebound Characteristics in Cryogenic Fluids

1
State Key Laboratory of Multiphase Flow in Power Engineering, Xi’an Jiaotong University, Xi’an 710049, China
2
Beijing Institute of Satellite Environmental Engineering, Beijing 100029, China
3
Beijing Institute of Aerospace Test Technology, Beijing 100074, China
*
Author to whom correspondence should be addressed.
Submission received: 24 September 2022 / Revised: 16 October 2022 / Accepted: 24 October 2022 / Published: 26 October 2022
(This article belongs to the Topic Fluid Mechanics)

Abstract

:
In cryogenic fluid storage and delivery, the rapid contraction and rebound of bubbles are prone to occur during bubble collapse due to the pressure saltation. With the contraction and rebound of bubbles, the pressure and temperature in the bubbles fluctuate greatly, which affects the service life of fluid machinery. During bubble contraction and rebound, there is an accompanied complex heat and mass transfer process. According to the thermal properties of cryogenic fluids, a single-bubble collapse model is proposed considering the temperature variations inside the bubble. In order to study the variation in temperature and pressure during bubble collapse in cryogenic fluids, the contraction and rebound of a single bubble in liquid hydrogen are investigated numerically under various operating pressures and supercooling degrees. The numerical results of the model indicate that there are periodic contraction and rebound of the bubble when the pressure rises suddenly. Furthermore, the periods and attenuation rates of bubbles in different media are studied and compared. For the most concerned pressure and temperature characteristics, the relationship between the peak pressure, the attenuation rate of the temperature and the dimensionless number is proposed.

1. Introduction

For long-distance delivery and large-scale storage of cryogenic fluids, liquid storage and delivery are the most widely used methods in favor of high security and cost effectiveness [1,2,3,4]. Among the cryogenic fluids, liquid hydrogen (normal boil point is 20.37 K) and liquid oxygen (normal boil point is 90.19 K) have been widely used in rocket engines [5,6]. Taking liquid hydrogen as an example, its delivery cost is only 0.181 EUR/kg [7] and energy consumption is only 0.37 kWh/kg [8], which is much lower than 0.63~0.76 EUR/kg and 2.43 kWh/kg for high-pressure hydrogen delivery.
In the transportation of cryogenic fluids, substantial sloshing cannot be avoided easily due to the jounce of transport tankers and LNG carrier ships. This results in a large variation in local pressure for the delivered cryogenic fluids. Under this condition, cavitation bubbles grow when the local pressure drops below the saturated pressure of liquids [9,10]. When the operating pressure increases suddenly, the bubbles contract and rebound rapidly. During this contraction–rebound process, there is noise, vibration, pressure pulsation and damage to the fluid machinery due to the high pressure and temperature of the bubbles [11].
Single-bubble growth in ordinary fluids has been preliminarily studied. The single bubbles growth in water and freon has been focused on in many experiments [12,13,14]. Compared with bubble experiments in ordinary fluids, cavitation experiments in cryogenic fluids are relatively rare. Among cryogenic research, experiments of liquid nitrogen and hydrogen flow around a hydrofoil and an ogive were carried out by Hord in the 1970s [15,16,17,18]. The temperature and pressure distributions along the cavitation region of the hydrofoil surface were measured experimentally. Moreover, Ball et al. [19] experimentally investigated liquid hydrogen cavitation characteristics in various inducers. The experimental results provided a reference for the design of an inducer for cryogenic fluids. Recently, Ito et al. [20] studied the difference in cavitation characteristics between liquid nitrogen and water in an inducer using a visualization experiment. The experimental results indicated that the bubble size in liquid nitrogen was much smaller than that in water. In addition to cavitation flow experiments in fluid machinery, single-bubble growth and collapse in cryogenic fluids are the basis for the study of the cavitation mechanism in cryogenic fluids. However, there is relatively little experimental research in the open literature due to its extremely rapid growth and collapse process. Hewitt et al. [21] carried out the bubble growth experiment in liquid nitrogen under depressurization and studied the bubble radius growth process. Due to the limitations of harsh low-temperature conditions, the pressure and temperature inside the nitrogen bubble were not investigated in the experiments.
In addition to experimental studies, there have also been theoretical and numerical results focused on the heat and mass transfer process at the bubble interface. The isothermal hypothesis is often adopted in cavitation models of ordinary fluids. Transport cavitation models based on the Rayleigh–Plesset equation are used widely. Among these models, the Zwart–Gerber–Belamri model [22], Schnerr–Sauer model [23] and Singhal model [24] are applied in commercial CFD software. The growth and heat and mass transfer between the bubble and liquid are predicted using the single-bubble model [25,26]. The bubble radius growth results calculated with the model are verified with data from experiments in water and freon. For ordinary fluids, the thermodynamic temperature drop is small and the liquid vapor density ratio is large. Additionally, the transition time of bubble growth from the dynamic growth stage to the thermal growth stage is equivalent to the bubble existence time. Therefore, the isothermal assumption is prone to be suitable for the cavitation in ordinary fluids.
Different from ordinary fluids, the temperature drop of the bubble growth process cannot be ignored in cryogenic liquids. The existing isothermal hypothesis is not viable. Therefore, for cryogenic fluids, thermodynamic effects must be considered on cavitation development and bubble growth. Zhang et al. [27] modified the cavitation model for ordinary fluids considering thermal effects and used it to study cavitation in liquid nitrogen. The application of the cavitation model for cryogenic fluids was improved in prediction. Comparing to the experimental results, the numerical results were within the error limits. Recently, a large number of numerical studies popped up focusing on cryogenic fluid cavitation. Xu et al. [28] used the modified cavitation model with thermodynamic effects to compare the cavitation process of water and liquid nitrogen. The numerical results indicated that thermal effects could inhibit the cavitation in liquid nitrogen but had almost no suppression effect for water. Moreover, the particularity of liquid hydrogen cavitation, which is different from other cryogenic fluids, was further investigated by Le et al. [29]. The empirical evaporation and condensation constant in liquid hydrogen was obviously higher than that in other fluids. In addition to the modification of the cavitation model, Li et al. [30] also used the modified model to study the cavitation model of liquid oxygen in turbopumps. Cavitation was mainly distributed in the leading edge of the inlet of the inducer and the central blade head of the impeller.
In most of the existing cavitation models, modifications have focused on the influence of the thermal effect. There are relatively few models which have been proposed for single-bubble growth and collapse. Ito [31] considered the equation of heat conduction outside the bubble and used it to calculate the phase transition in the thermal boundary layer. In addition, this model was also used to study the bubble development process in liquid hydrogen, liquid nitrogen and liquid oxygen. The growth process of bubbles in the inducer was studied numerically based on this model [32]. However, the temperature difference between the center and boundary of the bubble was not considered.
During the growth and collapse of a single bubble, the temperature and pressure of the vapor inside the bubble vary greatly [33]. Nevertheless, most of the existing bubble growth and collapse models assume that the temperature inside the bubble is the same as that of the fluid at the bubble boundary. For the more accurate prediction of the growth–collapse process of single bubbles in cryogenic fluids, existing bubble models should be modified. In this paper, based on the existing bubble model, a single-bubble collapse model was proposed for cryogenic fluids. The modified Rayleigh–Plesset equation, heat balance equation, heat diffusion equation and state equation were solved simultaneously in various cryogenic fluids. By comparing the tendency of bubble bursting and rebound in different fluids, the influence of the physical properties of cryogenic fluids on bubbles was analyzed. In addition, the influence of the bubble internal temperature on the bubble collapse and rebound process was considered and calculated. The bubble contraction–rebound process in liquid hydrogen was selected as the main research object. The oscillations of the bubble radius, radius growth rate, temperature at the bubble boundary and temperature and pressure inside the bubble were studied using the model. The amplitude, attenuation rate and period of bubble collapse were analyzed under different supercooling degrees and operating pressures.

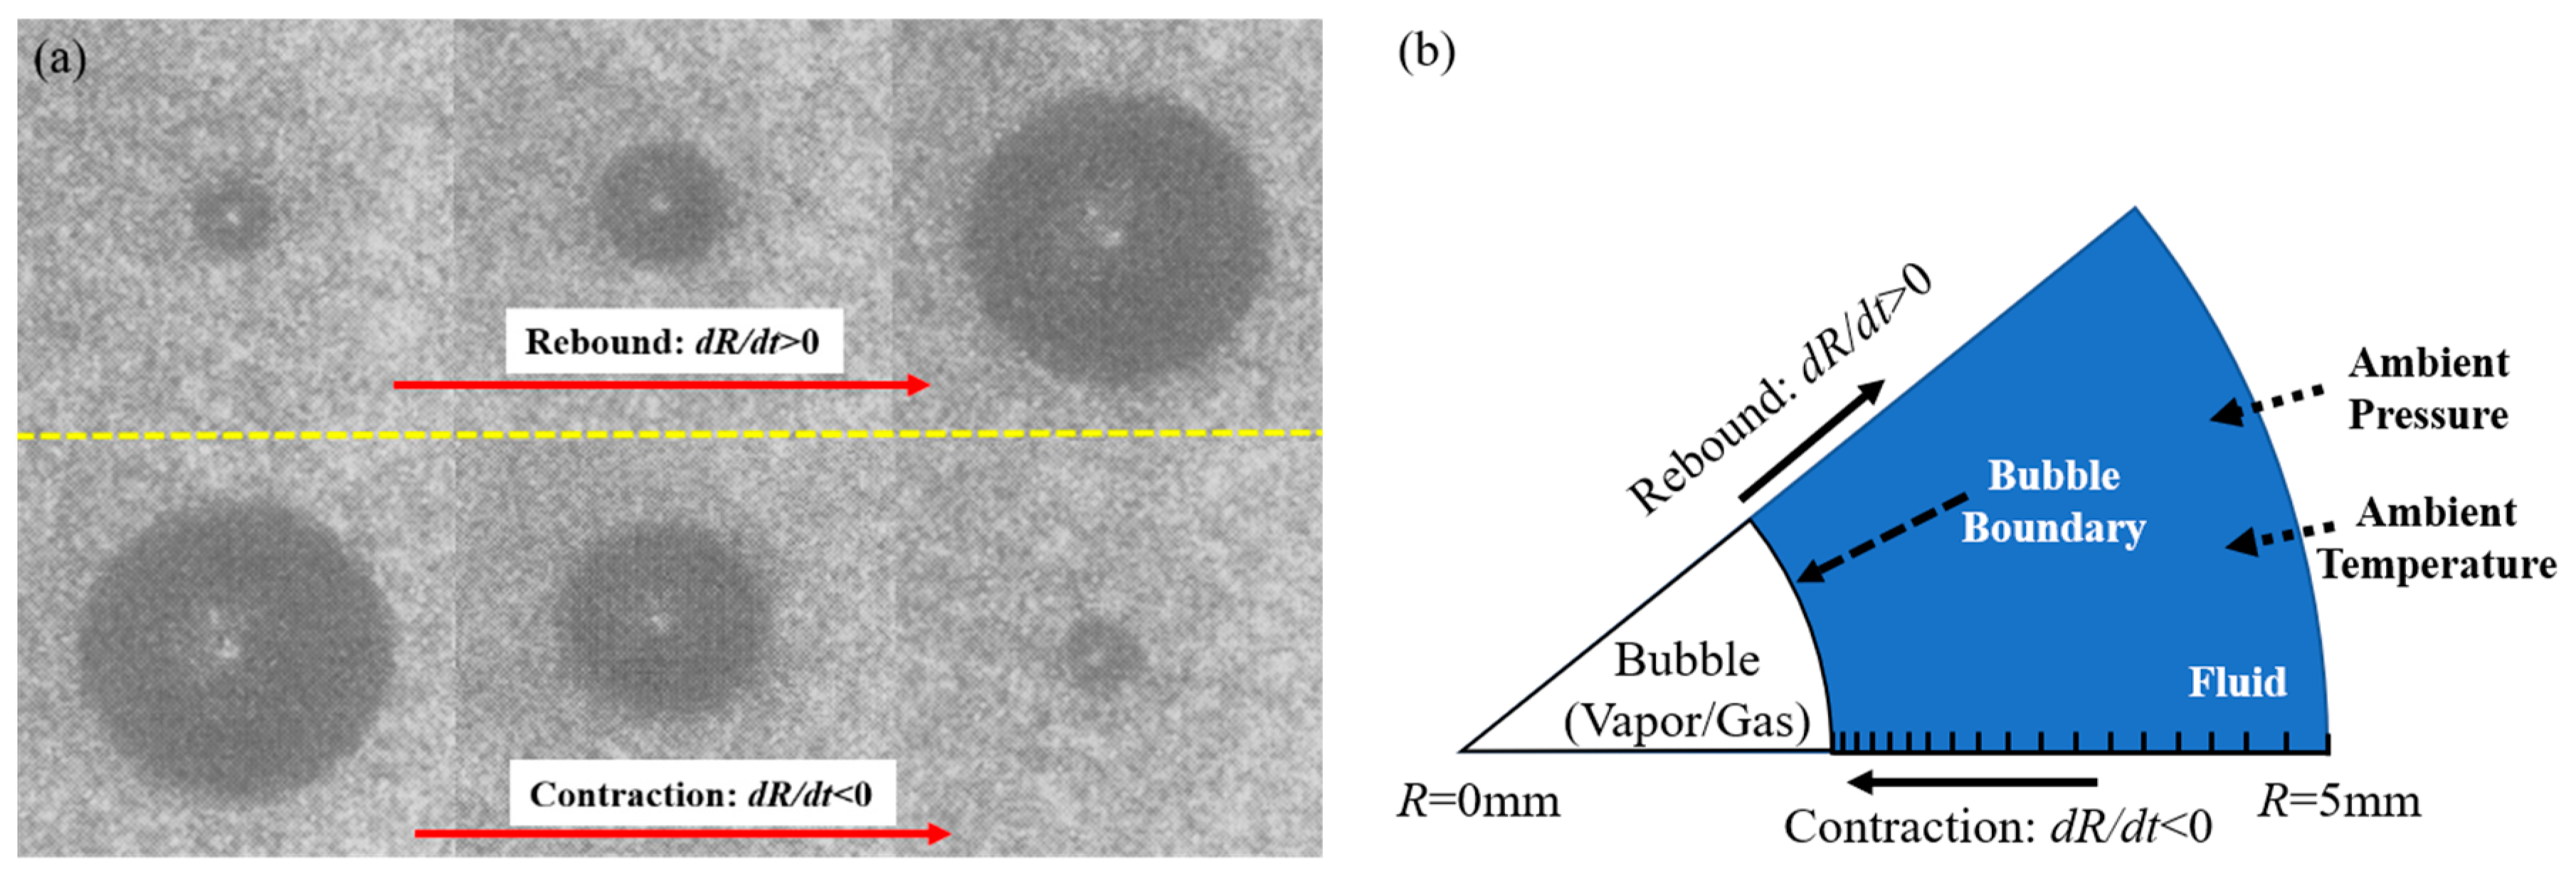
2. Derivation and Verification of the Single-Bubble Collapse Model

During bubble collapse, the temperature and pressure inside the bubble are affected by the operating pressure, supercooling degree and thermophysical property of different fluids. In order to accurately predict and compare the bubble collapse process in various fluids, the temperature and pressure inside the bubble were considered in the model. The bubble collapse model is derived and the results of this model are verified in this section.

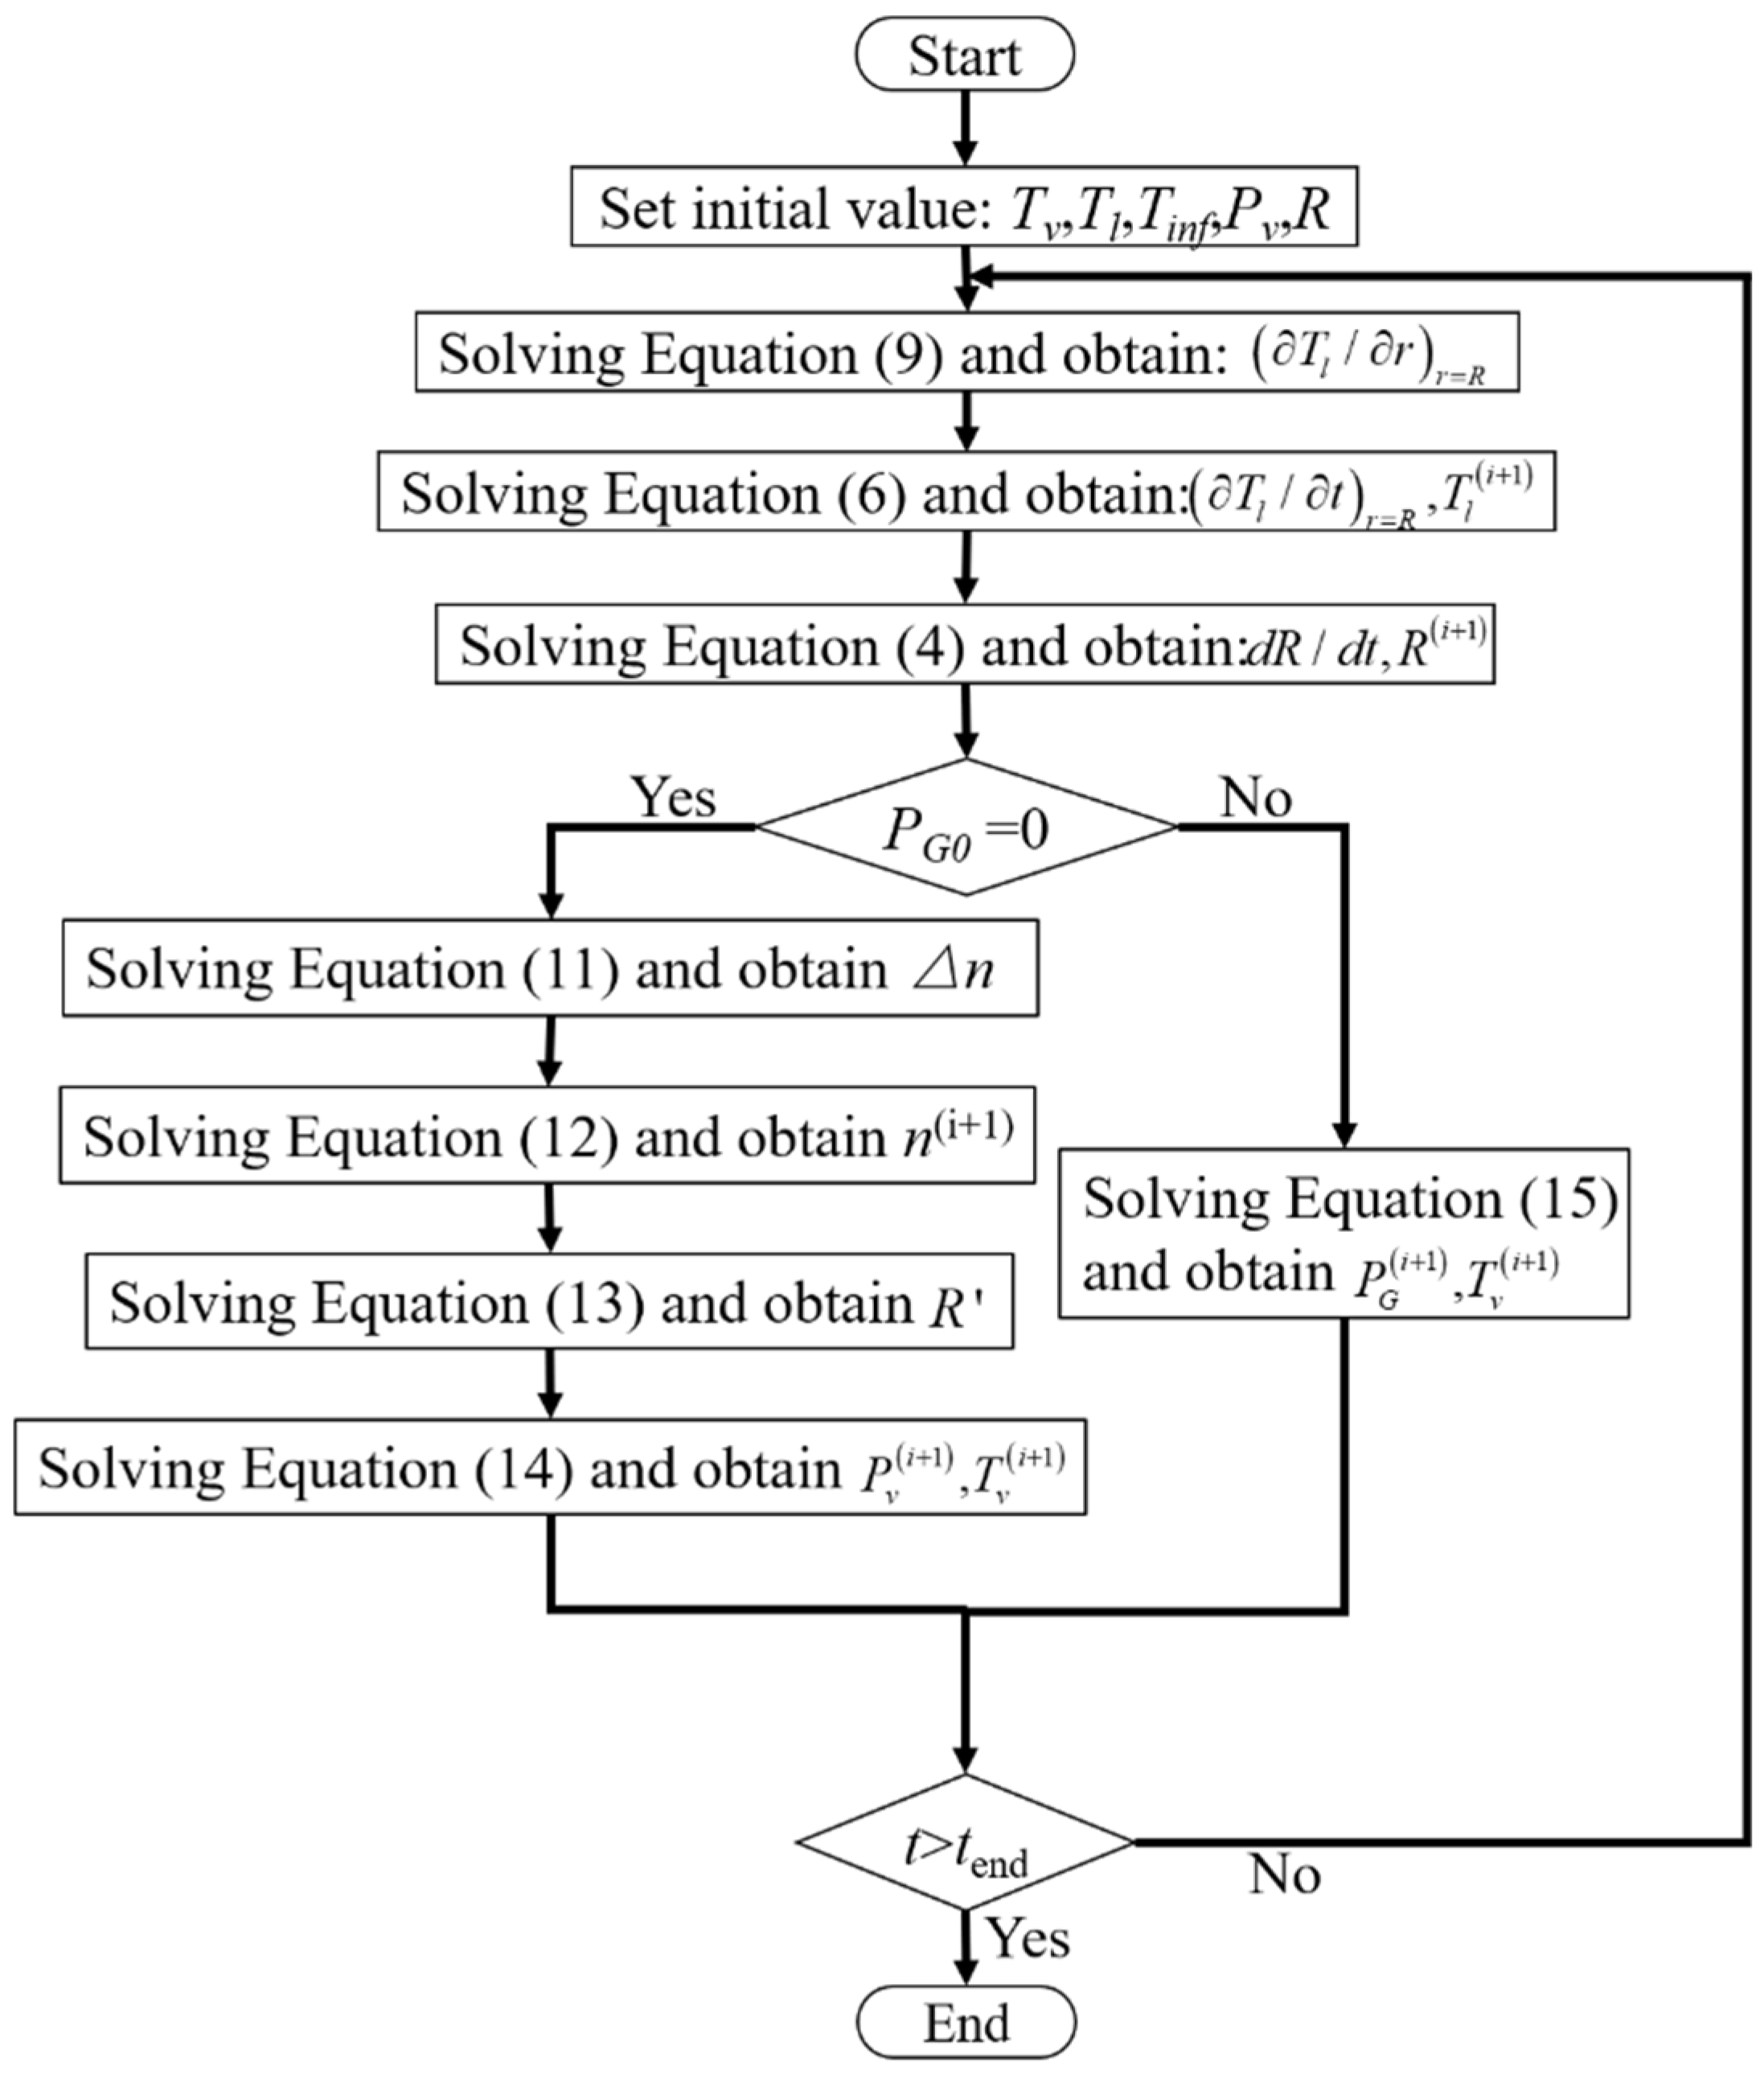
2.1. Derivation of the Single-Bubble Collapse Model

The equation for bubble growth was first derived and used by Rayleigh [34] in the absence of surface tension and viscosity. Subsequently, this equation was improved by Plesset [35] and was applied to the problem of traveling cavitation bubbles.
R d 2 R d t 2 + 3 2 ( d R d t ) = P v ( T v ) P inf ρ l 4 ν l R d R d t 2 S ρ l R
where R is the bubble radius, Tv is the temperature inside the bubble, Pv is the pressure inside the bubble, ρl is the liquid density, Pinf is the operating pressure, νl is the kinematic viscosity of the liquid and S is the surface tension of the fluid.
In addition to the Rayleigh–Plesset equation, the noncondensable gas in the bubble was considered. In general, it was assumed that there is no mass transfer between the noncondensable gas and the liquid. When the initial partial pressure of the noncondensable gas is PG0, the partial pressure, PG, varies with the bubble radius, as shown in Equation (2).
P G = P G 0 ( T v T inf ) ( R 0 R ) 3 k
where R0 is the initial bubble radius, Tinf is the operating temperature and k is the polytropic exponent; k = 1 for bubble growth and k = 1.4 for bubble collapse.
In the process of bubble collapse, the contraction speed of the bubble interface is greater than the bubble growth rate. When the Mach number (|dR/dt|/c) is higher than 0.3, the influence of liquid compressibility should be considered [10]. For this point, the near-acoustic solutions of Herring [36] and Trilling [37] modified the Rayleigh–Plesset equation, and the results are shown in Equation (3):
R d 2 R d t 2 ( 1 2 c l 0 d R d t ) + 3 2 ( d R d t ) 2 ( 1 4 3 c l 0 d R d t ) = R ρ l 0 c l 0 d P d t + P v P inf ρ l 0
where cl0 and ρl0 are the constant sound speed and the density of the liquid, respectively.
The Rayleigh–Plesset equation adopted by the model could be modified by substituting Equations (1) and (2) into Equation (3):
R d 2 R d t 2 ( 1 2 c l 0 d R d t ) + 3 2 ( d R d t ) 2 ( 1 4 3 c l 0 d R d t ) = R ρ l 0 c l 0 d d t ( P v ( T v ) + P G 0 ( T v T inf ) ( R 0 R ) 3 k 2 S R 4 μ l R d R d t ) + P v ( T v ) + P G 0 ( T v T inf ) ( R 0 R ) 3 k 2 S R 4 μ l R d R d t P inf ρ l 0
where μl is the dynamic viscosity of the liquid.
In order to further consider the thermal effect in the bubble model, the thermal equilibrium equation was introduced. The vapor density ρv in the bubble varies greatly with the temperature. Additionally, the variation in temperature inside the bubble could not be ignored during the bubble growth–collapse process. The transient variation in vapor density in the bubble was also considered. In order to obtain the temperature inside the bubble, TB, and the temperature at the bubble boundary, Tl, it was assumed that only heat conduction exists in the thermal boundary layer around the bubble. According to the thermal balance equation, Equation (5) was introduced:
4 π R 2 k l ( d T l d r ) r = R = L d d t ( 4 3 π R 3 ρ v ) = 4 π R 2 L ρ v d R d t + 4 3 π R 3 L d ρ v d T l ( d T l d t ) r = R
where L is the latent heat of the fluid and kl is the thermal conductivity of the liquid. The derivative of the temperature at the bubble boundary, Tl, with respect to time could be derived from Equation (5):
d T l d t = ( k l d T l d r L ρ v d R d t ) / ( 1 3 R L d ρ v d T )
In Equation (6), the temperature gradient at the bubble boundary, dTl/dr, was unknown. The temperature gradient at the bubble boundary could be obtained by solving the energy equation in spherical coordinates for the moving boundary. The one-dimensional energy equation is as follows.
T t + u T r = α l ( 2 T r 2 + 2 r T r )
where αl is the thermal diffusivity of the liquid. In Equation (7), u is the radial velocity which is a function of the bubble growth rate and bubble radius. The radial velocity could be solved:
u ( R , t ) = d R d t ( R r ) 2
By substituting Equation (8) into Equation (7), the thermal diffusion equation of the bubble boundary could be obtained:
T t + d R d t ( R r ) 2 T l r = α l r 2 r ( r 2 T l r )
The boundary conditions and initial condition are shown in Equation (10). The temperature of the entire flow field is constant and uniform. Moreover, the temperature at the bubble boundary could be derived from the assumption of discontinuity at the bubble interface. The liquid temperature is constant at an infinite distance.
{ T ( r , 0 ) = T inf T ( R , t ) = T l T ( R inf , t ) = T inf
By the external discretization of bubbles, Equations (4) and (9) could be solved using the fourth-order Runge–Kutta method. Photos and a schematic diagram of the bubble collapse–rebound process are shown in Figure 1. It was assumed that the liquid beyond the 5 mm bubble boundary is not affected by the temperature and pressure change inside the bubble [1], where the temperature and pressure are equal to Tinf and Pinf, respectively. Based on the bubble radius and the temperature at the bubble boundary, the temperature and pressure inside the bubble could be obtained.
At first, it was assumed that there is no noncondensable gas inside the bubble. During bubble collapse, the bubble boundary contracts inward rapidly. Inside the bubble, there exists vapor compression and phase transformation simultaneously. Taking the boundary layer at the bubble interface as the control volume, the heat flowing into the boundary layer is positive and the heat flowing out is negative. The latent heat from phase transformation flows into the boundary layer, and the conducted heat flows out of the boundary layer. Assuming that the mass in the boundary layer is constant and equals m, the energy balance equation of the thermal boundary layer is shown in Equation (11).
T l ( i + 1 ) T l ( i ) = 4 π ( R ( i ) ) 2 [ Δ n M ( R ( i ) R ( i + 1 ) ) L k l d T l d r ] m
where Δn is the variation in the amount of vapor substances and the superscript (i) indicates the i-th time step. The total amount of vapor in the bubble could be obtained from Equation (12)
n ( i + 1 ) = n ( i ) + Δ n
If only the phase transition process was being considered, the bubble radius R’ could be obtained using the Clapeyron Equation (13).
4 3 π ( R ) 3 P v ( i ) = n ( i + 1 ) T v ( i )
where is the molar gas constant which has a value of 8.3145 J/(mol·K).
At last, the pressure and temperature inside the bubble could be solved with the polytropic compression/expansion Equation (14). In the equation, k is the polytropic exponent. Generally, the growth and rebound of bubbles are deemed to be isothermal expansion processes with k = 1. The collapse process is an adiabatic compression with k = 1.4.
{ P v ( i + 1 ) = P v ( i ) ( R R ( i + 1 ) ) 3 k T v ( i + 1 ) = T v ( i ) ( R R ( i + 1 ) ) 3 ( k 1 )
For bubbles containing noncondensable gas, the solution process could be simplified. The variation in the partial pressure of the noncondensable gas could be solved directly according to the polytropic process Equation (15). Then, the temperature of the noncondensable gas was obtained. According to the assumption of uniform temperature inside the bubble, the temperature inside the bubble was represented by the temperature of the noncondensable gas, T v ( i + 1 ) .
{ P G ( i + 1 ) = P G ( i ) ( R ( i + 1 ) R ( i ) ) 3 k T v ( i + 1 ) = T v ( i ) ( P G ( i + 1 ) P G ( i ) ) ( k 1 ) / k
The model solving process is summarized as a flow chart shown in Figure 2. The operating of the flow field, bubble radius and bubble growth time “tend” were initialized at first. The temperature inside the bubble (Tv), temperature at the bubble boundary (Tl), pressure inside the bubble (Pv), bubble radius (R) and bubble growth rate (dR/dt) were investigated.

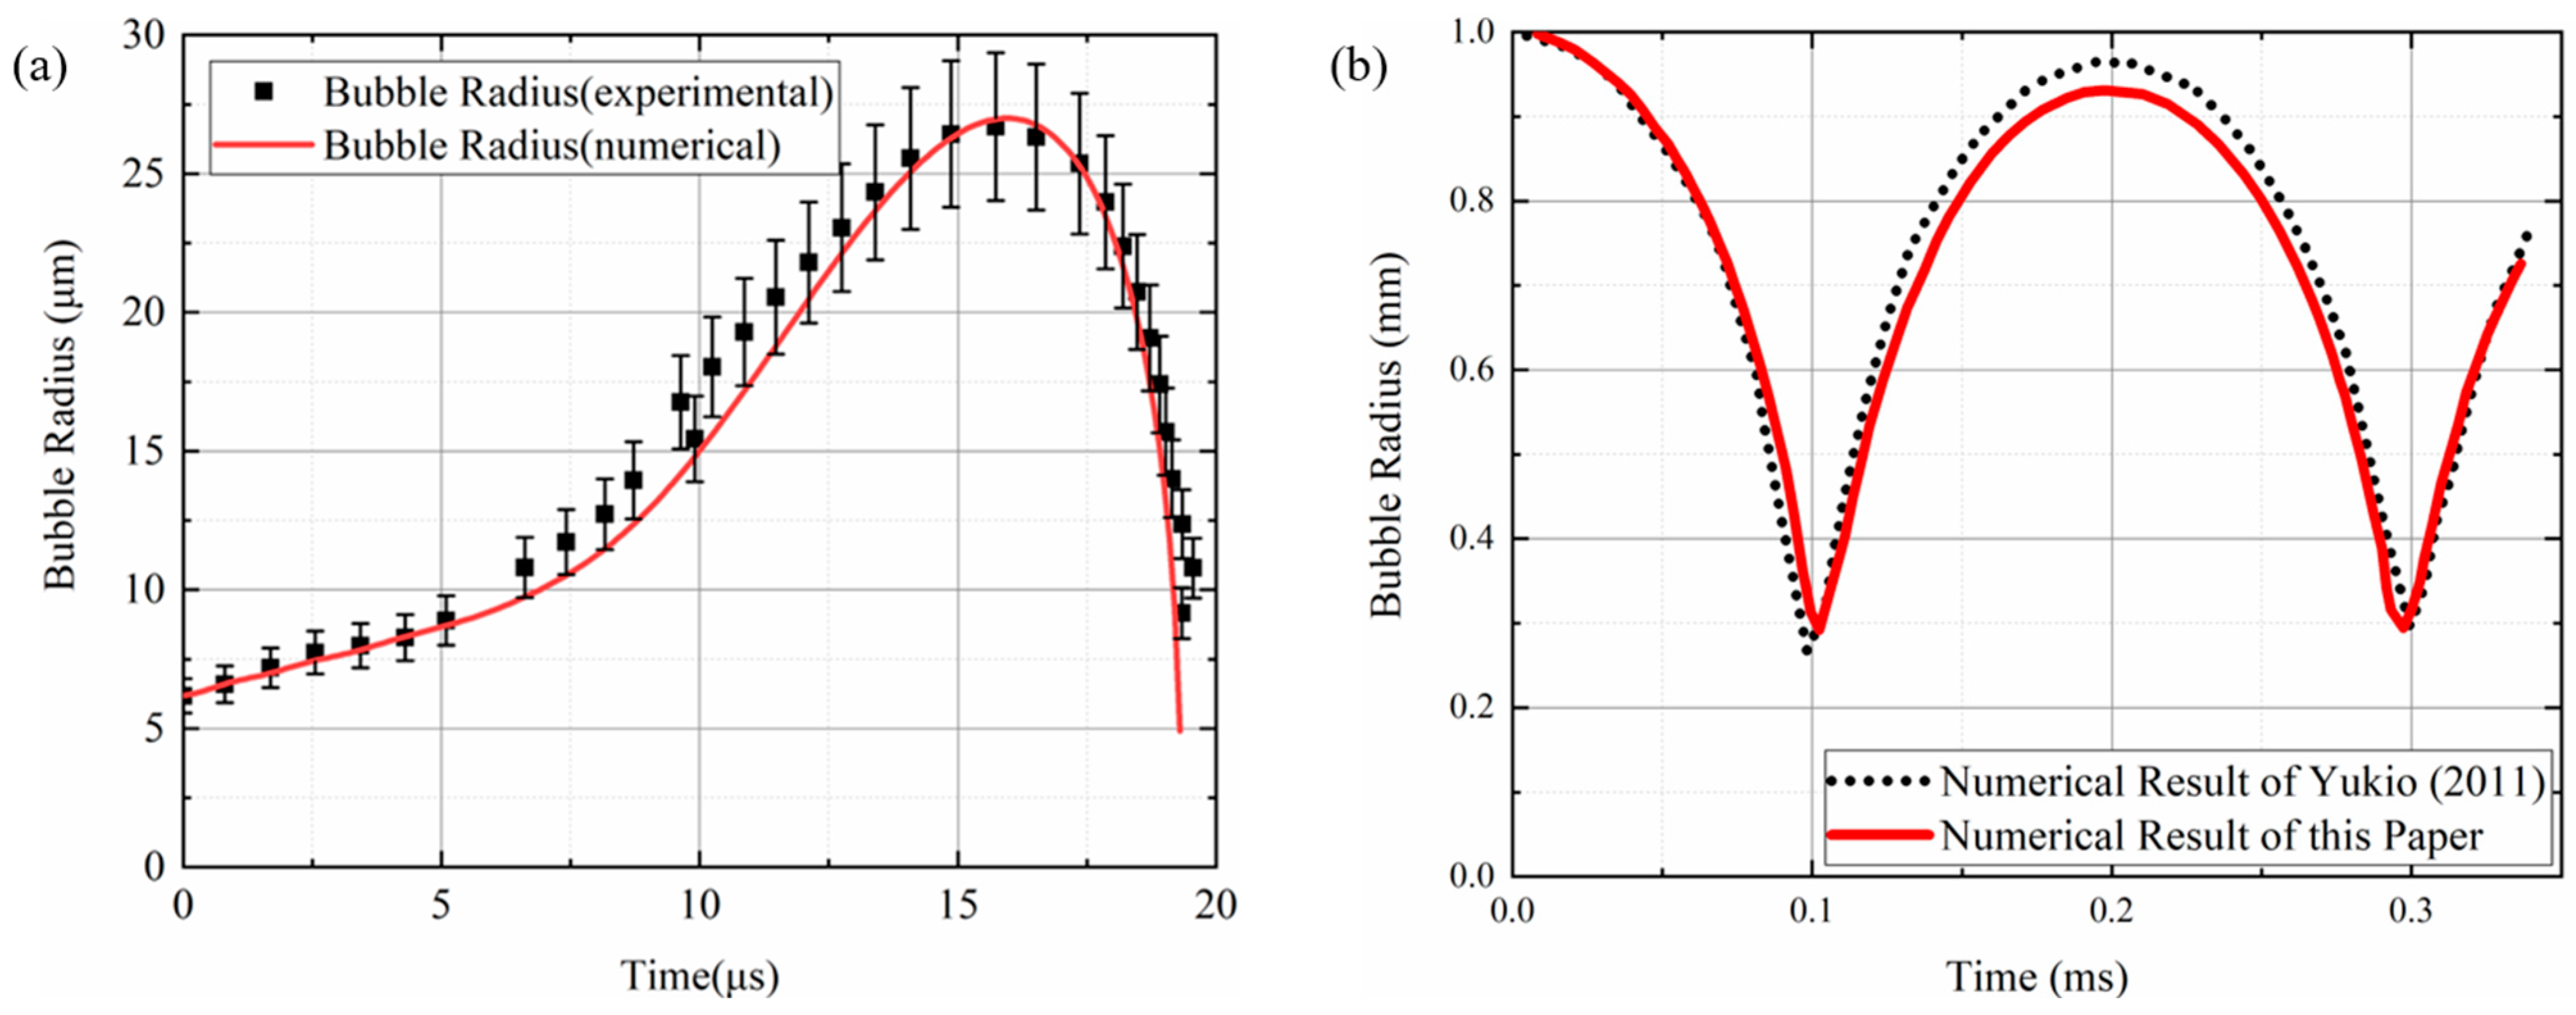
2.2. Verification of the Single-Bubble Collapse Model

Due to the rapid contraction and rebound of the bubble, there are relatively few experiments on the collapse of a single bubble, especially in cryogenic fluids. In order to verify the model, the experimental results [38] of water bubbles under the condition of an alternating pressure field and the numerical results of Yukio et al. [39] were selected in this paper. The verification of the bubble collapse and rebound process is shown in Figure 3. Under the operating pressure of 1 atm, the initial radius of the bubbles in the saturated water was 6.18 μm. With the condition of a sinusoidal pressure field with an applied amplitude of 1.29 × 10⁵ Pa and frequency of 25 kHz, the experimental and numerical results of the bubble radius are shown in Figure 3a. The numerical results using the model presented in this paper were within 10% of the experimental measurements. The numerical results of this model were compared with the calculation results of the Yukio model, shown in Figure 3b. The difference between the numerical results of the two models were within 10%.

3. Comparison of Bubble Collapse in Different Fluids

According to the open literature [40], the pressure of 0.1 MPa~0.51 MPa and the temperature of 20~27.4 K are often used in liquified hydrogen storage and delivery. Therefore, in this section, the operating pressure of 1~3 atm and the supercooling degree of 1~5 K were selected for calculation. The effects of operating pressure and supercooling degree on the radius of a single bubble, bubble growth rate, temperature and pressure inside a bubble were investigated. In order to study the particularity of bubble behavior in liquid hydrogen, the bubble collapse process of liquid nitrogen, liquified methane and water were introduced and compared.
In the process of bubble collapse, there is a bubble period with rapid contraction and rebound. In the collapse process, the variation in the bubble radius with time under different operating pressures and supercooling degrees is shown in Figure 4a,b, respectively. Under the condition of low operating pressure, the liquid hydrogen force acting on the bubble was small, so the bubble growth rate was slow. Therefore, the bubble contraction–rebound period increased with higher operating pressure. Moreover, the amplitude of the bubble radius increased with lower operating pressure because of the small kinetic energy attenuation. When the operating pressure of the bubble remained the same, the velocity of bubble contraction increased greatly with the supercooling degree. Therefore, the period of the bubble radius decreased with the supercooling degree. Meanwhile, due to the fast contraction of the bubble, the bubble radius became larger with the same kinetic energy attenuation.
In addition to the bubble radius, the bubble growth rate over time was also investigated. The bubble growth rate under different operating pressures and supercooling degrees is shown in Figure 5. As analyzed above, the maximum bubble growth rate was not significantly correlated with operating pressure. Initially, the peak and valley values of the bubble growth rate were almost the same under the same supercooling degree. However, the bubble growth rate was affected by the high operating pressure and the attenuation rate was rapidly accelerated. In contrast, the amplitude of the bubble growth rate increased greatly with the supercooling degree of liquid hydrogen. The peak value and attenuation rate of the bubble growth rate were affected by the operating pressure and the supercooling degree. The period of the bubble growth rate decreased with the operating pressure and the supercooling degree.
During contraction–rebound, the pressure and temperature of the bubble also varied greatly. The pressure inside the bubble during oscillation is shown in Figure 6. The peak and equilibrium of the pressure inside the bubble was promoted under larger operating pressure. Similarly, the peak in pressure inside the bubble was also enlarged sharply with supercooling degree. Accompanied with the variation in bubble radius, rapid contraction led to the fast compression of hydrogen inside the bubble. The period of the bubble pressure was almost the same as the bubble radius period. The fluctuation of pressure inside the bubble was possibly caused by the variation in the bubble radius.
Due to the different operating pressures, the absolute value of the peak pressure inside the bubble did not reflect the impact intensity during bubble collapse clearly. Therefore, the pressure inside the bubble was nondimensionalized using the operating pressure of infinity. The comparison results are shown in Figure 7. The dimensionless pressure inside the bubble was reduced. This result indicated that the impact caused by bubble collapse was strong under low operating pressure.
The temperature variation at the bubble boundary with time is shown in Figure 8. The initial and final temperature at the bubble boundary were upraised at higher operating pressure, but the amplitude decayed. With increment of supercooling degree, the lower initial temperature at the bubble boundary led to larger temperature undulation. However, the influence of supercooling degree on the final bubble boundary temperature was not significant.
Different from the liquid temperature at the bubble boundary, there was a larger undulation in vapor temperature due to its small heat capacity. Moreover, the oscillation of temperature inside the bubble was enhanced due to the vapor compression process. As shown in Figure 9a, the initial temperature inside the bubble increased under higher operating pressure. Under different operating pressures, the peak value of the temperature remained almost the same during the first few periods. The influence of the supercooling degree on the bubble temperature is shown in Figure 9b. The equilibrium temperature inside the bubble was almost unaffected by the supercooling degree. The temperature peak increased with the supercooling degree.
In order to compare the temperature inside the bubble and that at the bubble boundary, the condition was selected with the operating pressure equal to 3 atm and supercooling degree equal to 1 K. The two temperatures are shown in Figure 10. The temperature peak inside the bubble was much larger than that at the bubble boundary. As the thermal conductivity of the vapor phase was much lower than that of the liquid phase, the temperature inside the bubble accumulated gradually, and its valley value gradually separated from the temperature at the bubble boundary.
Based on the investigation of bubble collapse in liquid hydrogen, the effect of fluids’ properties on bubble collapse was studied. The comparison of the bubble radius and bubble growth rate in different fluids is shown in Figure 11a,b, respectively. The oscillation frequency and amplitude of the liquid hydrogen bubble were much larger than those in the other three fluids. The radius and growth rate of the bubble in liquid nitrogen and liquid methane had similar peak values. The bubble radius in liquid nitrogen had a relatively lower valley value.
Due to the great differences in standard boiling points among different fluids, it was meaningless to compare temperature inside the bubble and that at the bubble boundary directly. Therefore, the bubble temperature was nondimensionalized with the fluid critical temperature. As shown in Figure 12, the amplitude and frequency of the dimensionless temperature and the equilibrium temperature of the bubble in liquid hydrogen were larger than those in the other fluids. Moreover, it is worth noting that only the peak temperature inside the liquid hydrogen bubble was higher than the critical temperature during temperature oscillation. Additionally, the bubble oscillation time of liquid hydrogen was much smaller than that in the other fluids.
The variation in bubble pressure in the different fluids is shown in Figure 13. The pressure amplitude and frequency in the different fluids were in the same order as the other parameters. The peak pressure during bubble collapse in liquid hydrogen was approximately four times the operating pressure, which proved that the impact intensity on the nearby surface was the largest. In other words, the damage of liquid hydrogen cavitation to hydraulic machinery could be much greater than that of the other fluids.
It is generally believed that the high pressure during bubble collapse is the main cause of cavitation damage [33]. In order to investigate the potential damage, it was necessary to compare the maximum pressure peaks in the different fluids, as well as different conditions. The maximum peak pressure and dimensionless number (Weber number divided by the Reynolds number: Wb/Re) during bubble collapse are shown in Figure 14. The maximum peak pressure monotonously increased with the Wb/Re roughly. Therefore, the intensity of cavitation damage could be roughly predicted using the magnitude of Wb/Re.

4. Analysis of Periodicity and Attenuation Rate of Bubble Collapse

From Section 3, all the physical parameters of the bubbles featured oscillation characteristics. The oscillation period and attenuation rate were influenced by the operating pressure and supercooling degree. In this section, the attenuation rate and periodicity of the liquid hydrogen bubble collapse process were studied and compared with the other fluids. Moreover, the relationship between the temperature attenuation rate inside the bubble and dimensionless number was drawn.
The period length of the bubble oscillation was defined as the length of time between peak values in terms of radius, radius growth rate, temperature and pressure, respectively. The period of the different parameters was almost same. Therefore, the first period of the bubble radius oscillation was studied and is shown in Figure 15. The statistical results indicated that the bubble oscillation period was the shortest in liquid hydrogen and the longest in water. The period in liquid nitrogen was slightly longer than that in liquid methane. The period length of the bubble oscillation decreased with the operating pressure. Moreover, the increase in the supercooling degree also reduced the bubble oscillation period. In addition, the influence of supercooling degree on period was weaker than that of the operating pressure in the different fluids.
Besides the period, the attenuation rate was also an important parameter. The attenuation rate was the dimensionless result of dividing the difference between the amplitude of the current period and that of the next period with the amplitude of the current period. The attenuation rate in the first thirty oscillation periods is shown in Figure 16. The attenuation rate of the bubble radius was suppressed with operating pressure and lessened with supercooling degree. The attenuation rate was almost not affected by operating pressure. The influence of the supercooling degree on the radius attenuation rate was not as great as that of the operating pressure. However, under the condition of smaller supercooling degree, the attenuation rate of the bubble radius almost did not vary with period. With larger supercooling degree, the slope of the radius attenuation rate increased obviously in both the ascending and descending parts.
Furthermore, the attenuation rate of the bubble growth rate (dR/dt) was investigated in the first thirty periods. The attenuation rate with different operating pressures and supercooling degrees is shown in Figure 17. Similar to the influence of operating pressure and supercooling degree on the attenuation rate of bubble radius, operating pressure greatly enlarged the attenuation rate dR/dt, while it was reduced slightly with higher supercooling degree. The difference was that the higher supercooling degree only raised the slope of the attenuation rate dR/dt but did not change its monotonicity.
Different from the attenuation rate mentioned above, the attenuation rate of the temperature inside the bubble (Tv) dropped significantly in the first thirty periods, as shown in Figure 18. Therefore, the period investigated was extended. The attenuation rate of Tv was like an “S” curve. Its slope reached a maximum in the middle 20 periods, while its decline was very slow at the beginning and ending. In addition to the Tv attenuation rate, its maximum slope was enlarged with the operating pressure. The influence of the supercooling degree on the maximum value, minimum value and slope of the Tv attenuation rate was slight.
The slope of the attenuation rate of the bubble pressure (Pv) was large in the first few periods and gradually decreased in the subsequent periods, as shown in Figure 19. The influence of the operating pressure on the attenuation rate of Pv was similar to the attenuation rate of the other parameters. It increased with higher operating pressure, but its maximum slope varied slightly.
In order to study the difference in the bubble collapse process among the different fluids, the comparison results of bubble attenuation rates are shown in Figure 20. The attenuation rates of all physical parameters in liquid hydrogen were the highest, and they were the lowest in water. The attenuation rates of bubbles in liquid nitrogen and liquid methane were very similar. However, the attenuation rate of Tv in the liquid hydrogen bubbles suddenly declined in the 20th period and fell below that of water bubbles.
In order to understand the difference in bubble attenuation rates in the different fluids, the standard temperature drop and thermodynamic effect parameter of the different fluids were investigated. The standard temperature drop (ΔT) and thermodynamic effect parameter (∑(Tinf)) are defined as follows:
Δ T = ρ v L ρ l C P l
( T inf ) = L 2 ρ v 2 ρ l 2 C p l T inf α l 0.5
where ρv and ρl are the density of vapor and liquid, L is the latent heat, Cpl is the specific heat capacity of the liquid at constant pressure and αl is the thermal diffusivity of the liquid.
Under the operating pressure of 3 atm, the trends in ∑(Tinf) and ΔT with the supercooling degree are shown in Figure 21. ∑(Tinf) and ΔT in liquid hydrogen were much larger than in the other fluids. The two parameters in liquid nitrogen and methane were very close. Moreover, the magnitude of ∑(Tinf) and ΔT in the four fluids were almost the same as the magnitude of the attenuation rate. Therefore, the magnitude of the bubble attenuation rate could be qualitatively determined according to ∑(Tinf) and ΔT in the different fluids.
The relationship between ΔT/Tinf and Tv maximum attenuation rates in the different fluids was investigated using the statistical method and is shown in Figure 22. The maximum Tv attenuation rate was enhanced with ΔT/Tinf monotonously and presented a roughly logarithmic relationship. The magnitude could be qualitatively determined according to the relationship between ΔT/Tinf and the maximum attenuation rate of Tv.

5. Conclusions and Discussions

In this paper, based on the existing bubble growth model, a mathematical model suitable for the collapse process of a single bubble was proposed, considering the vapor compression and expansion process inside the bubble. The collapse–rebound process of bubbles in liquid hydrogen was studied. The variation in the period length and the attenuation rates of different parameters with operating pressure and supercooling degree were investigated using statistical methods and comparisons. The following conclusions can be drawn.
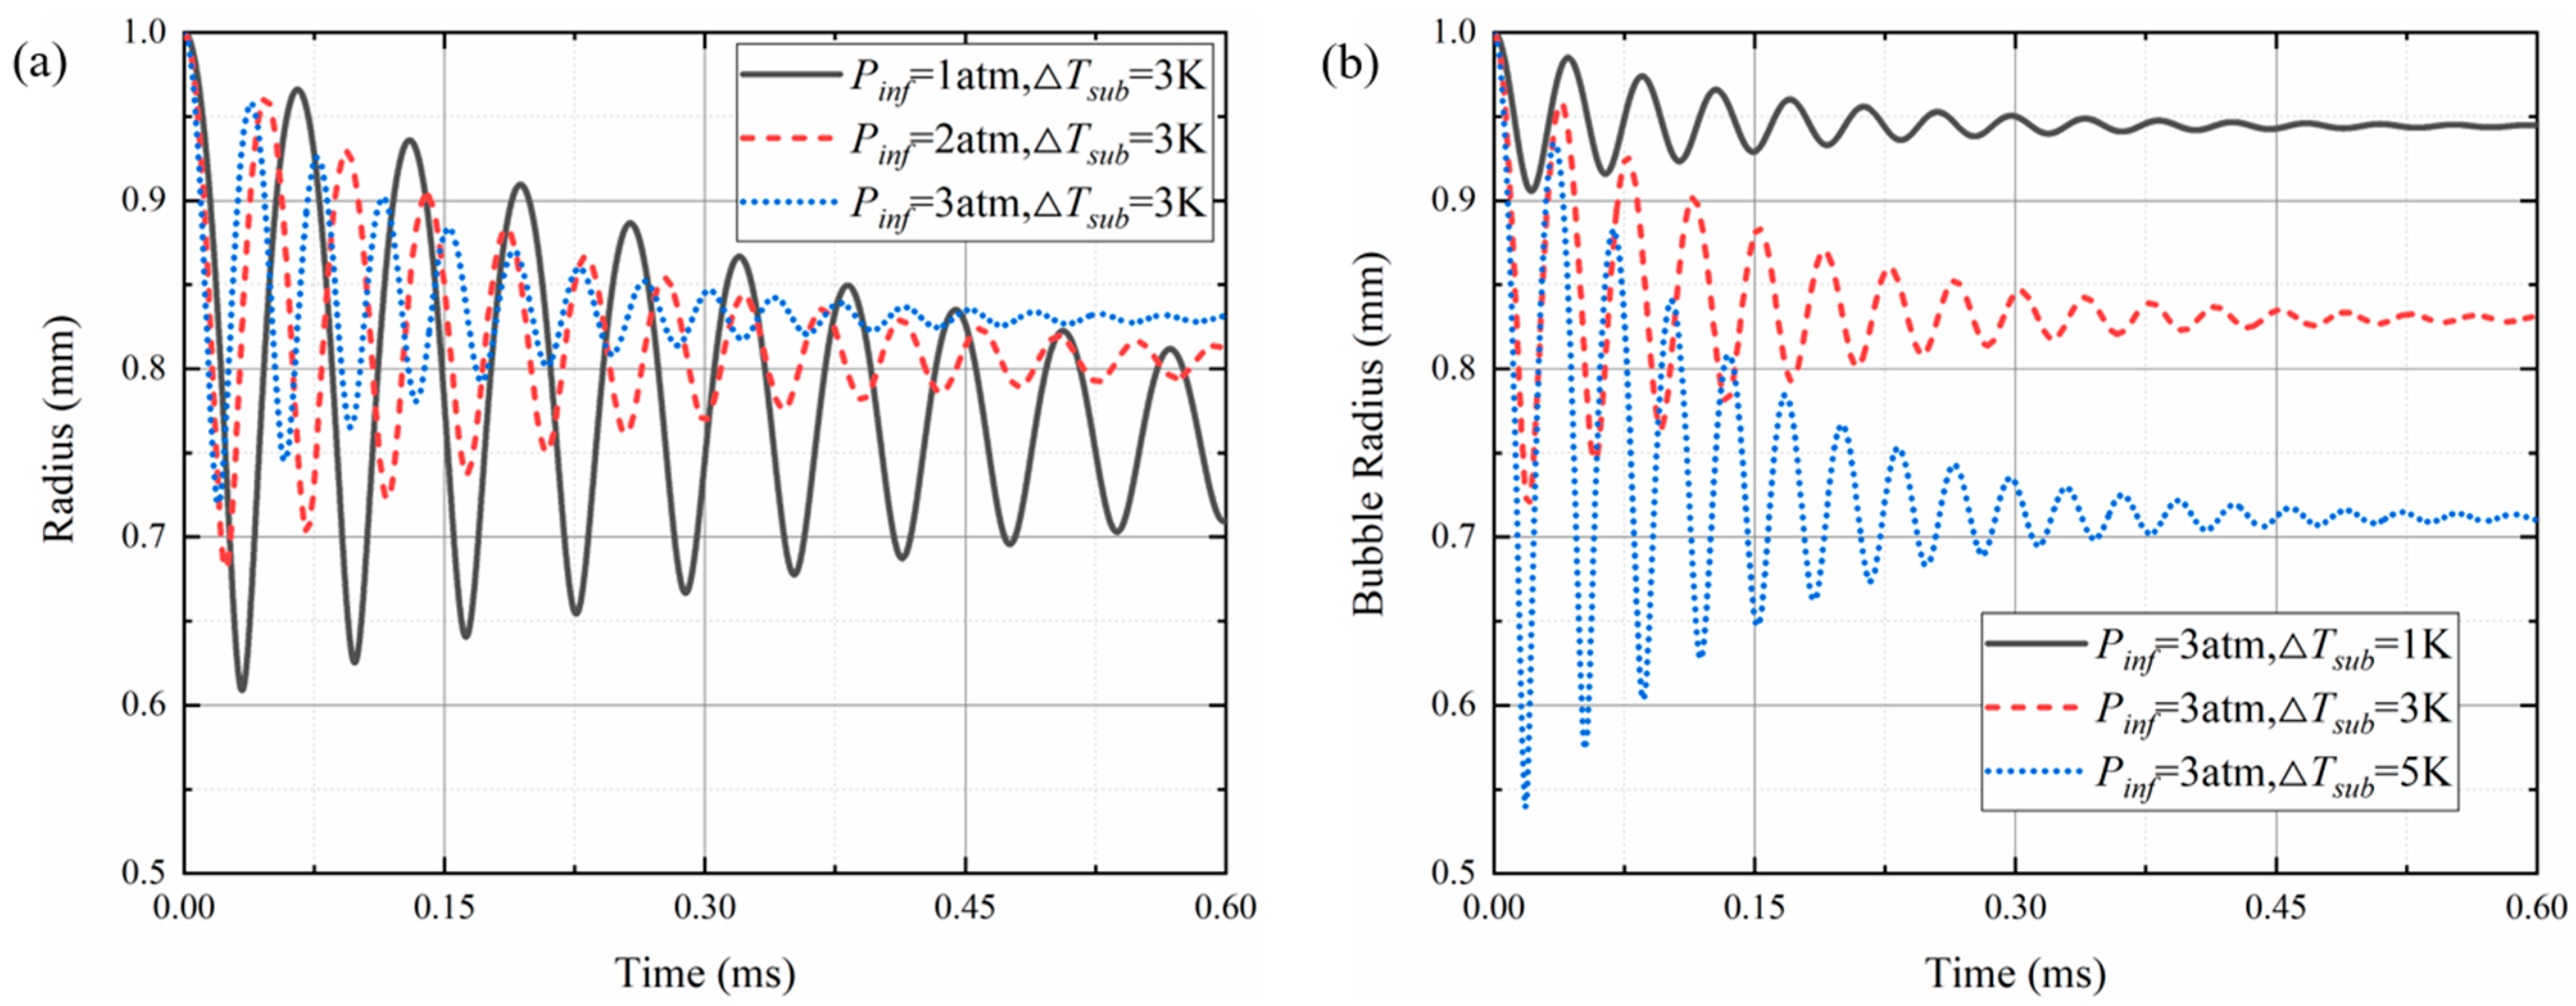
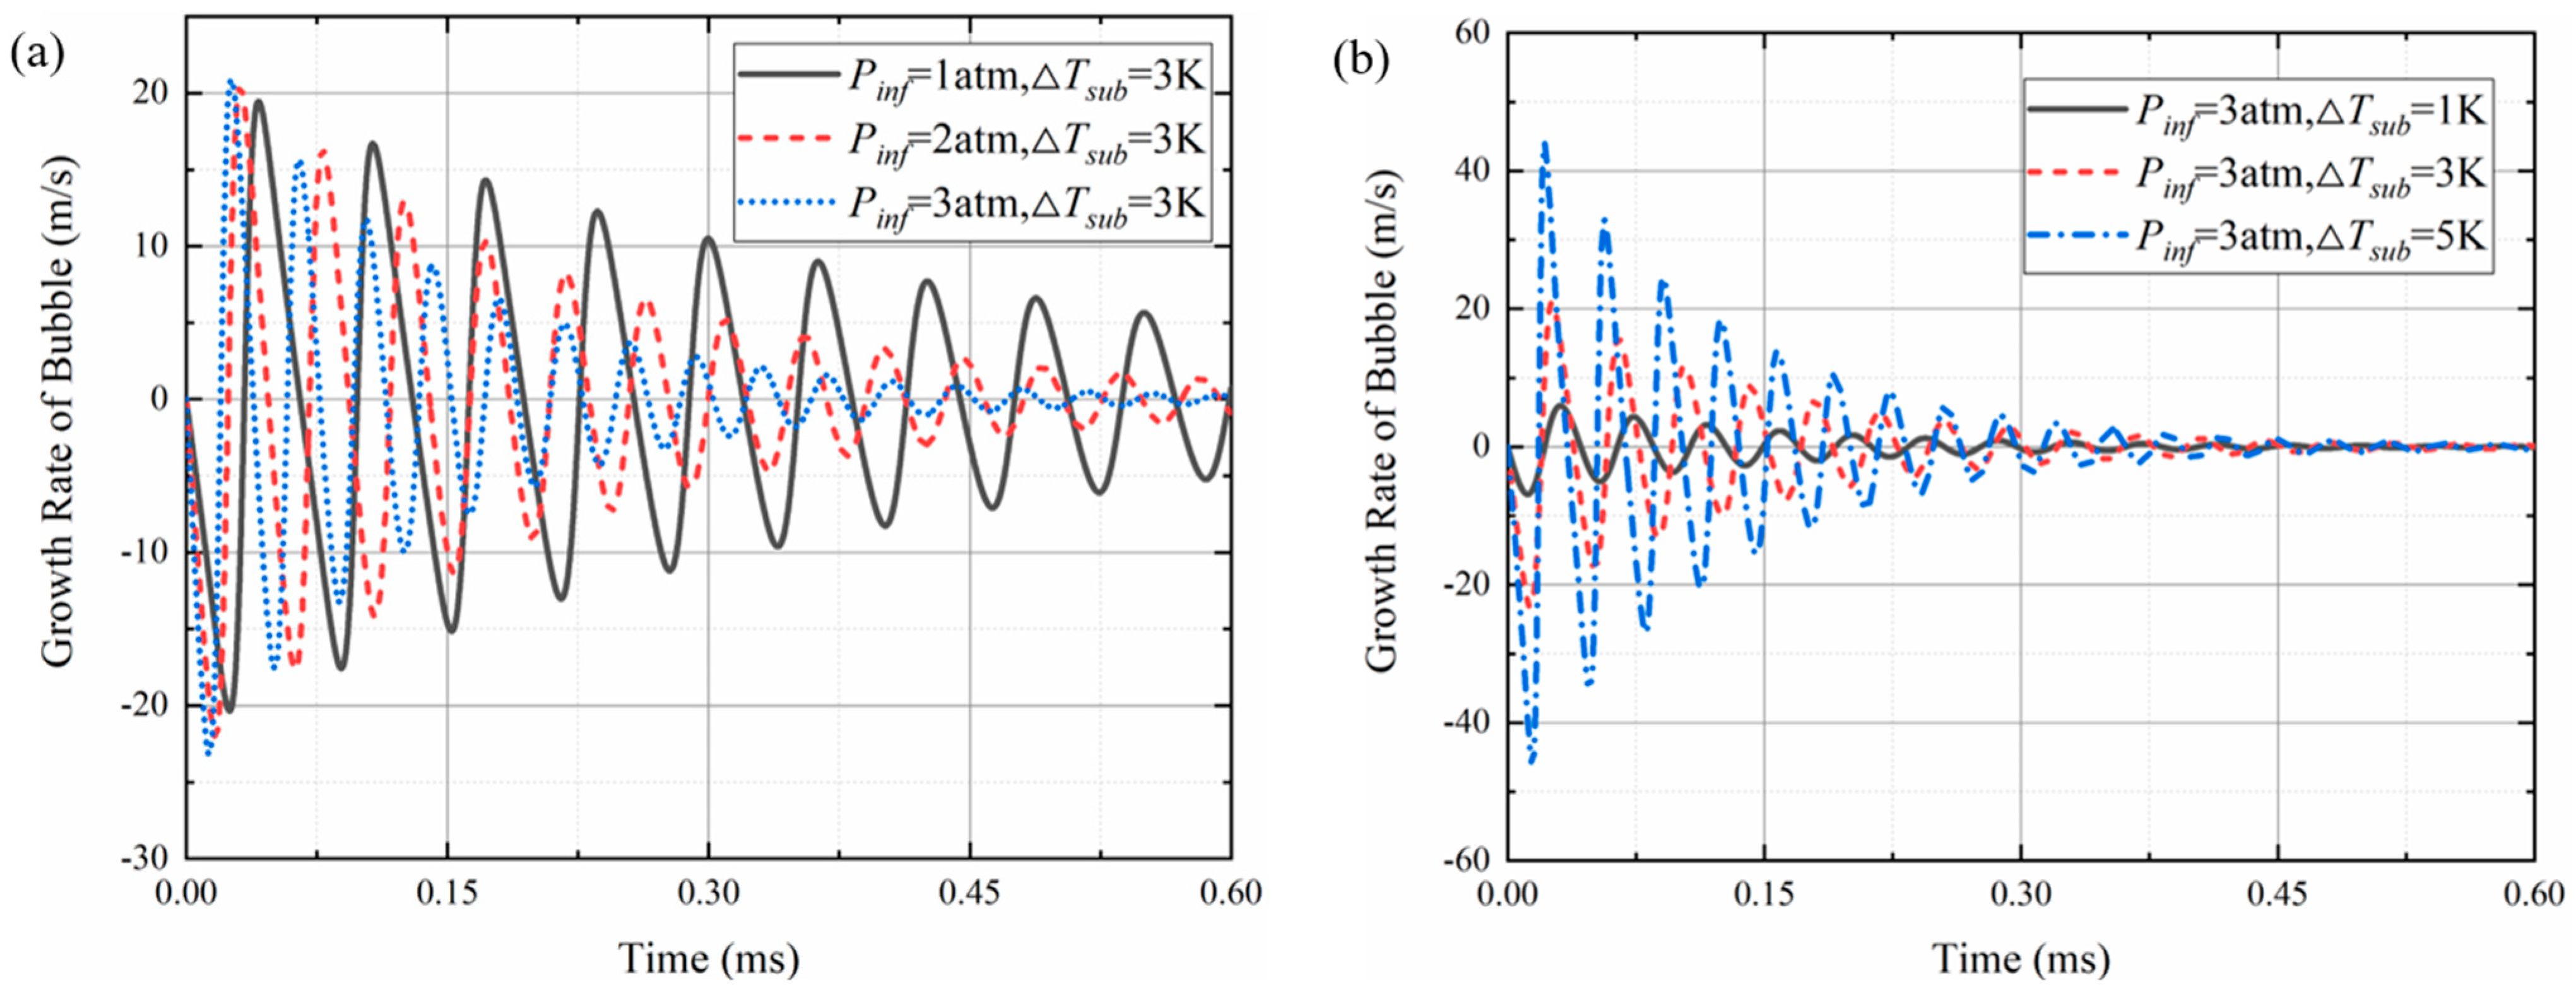
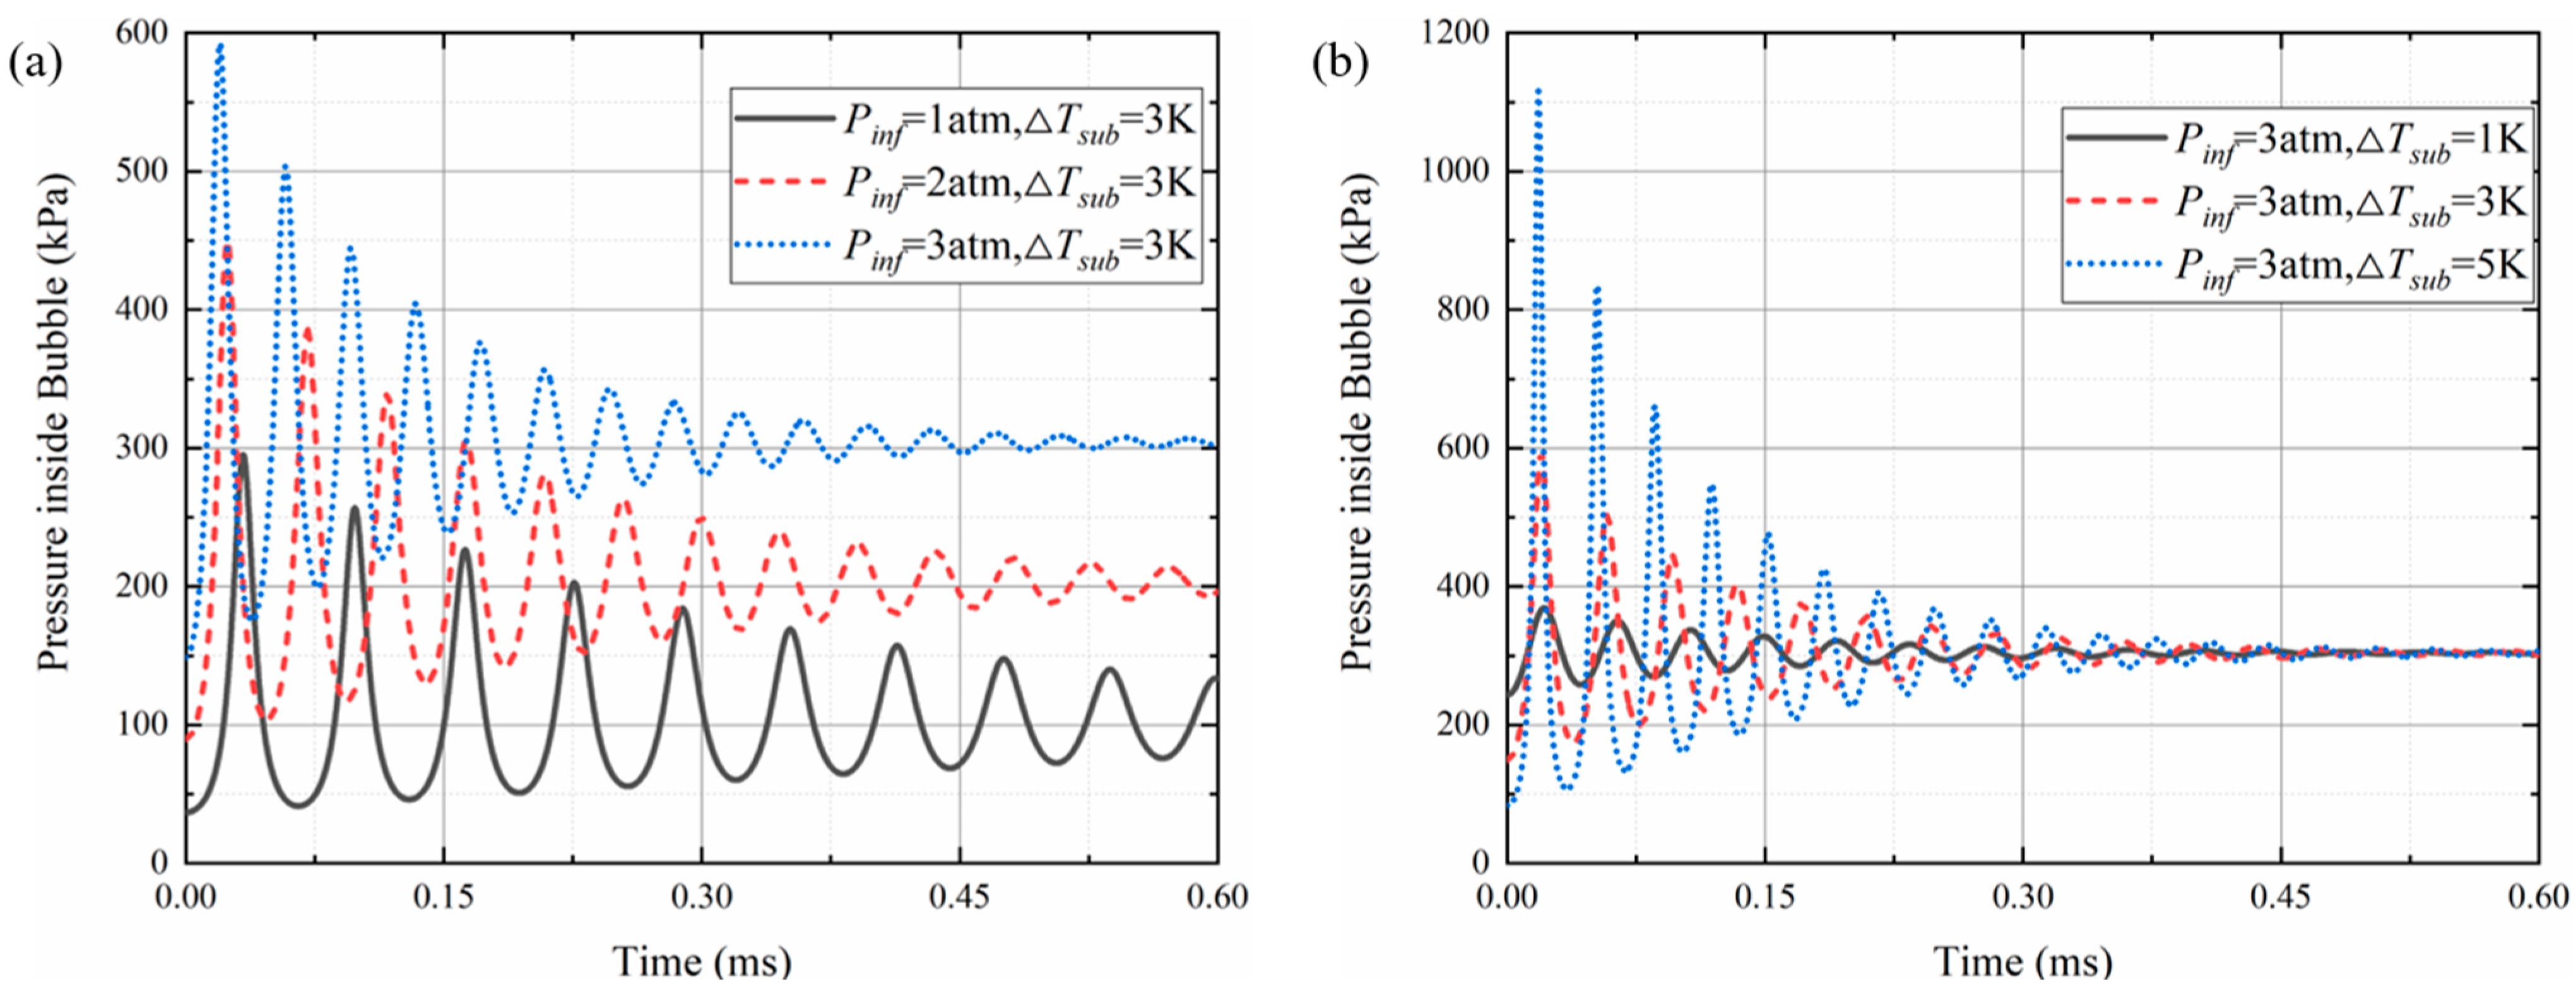
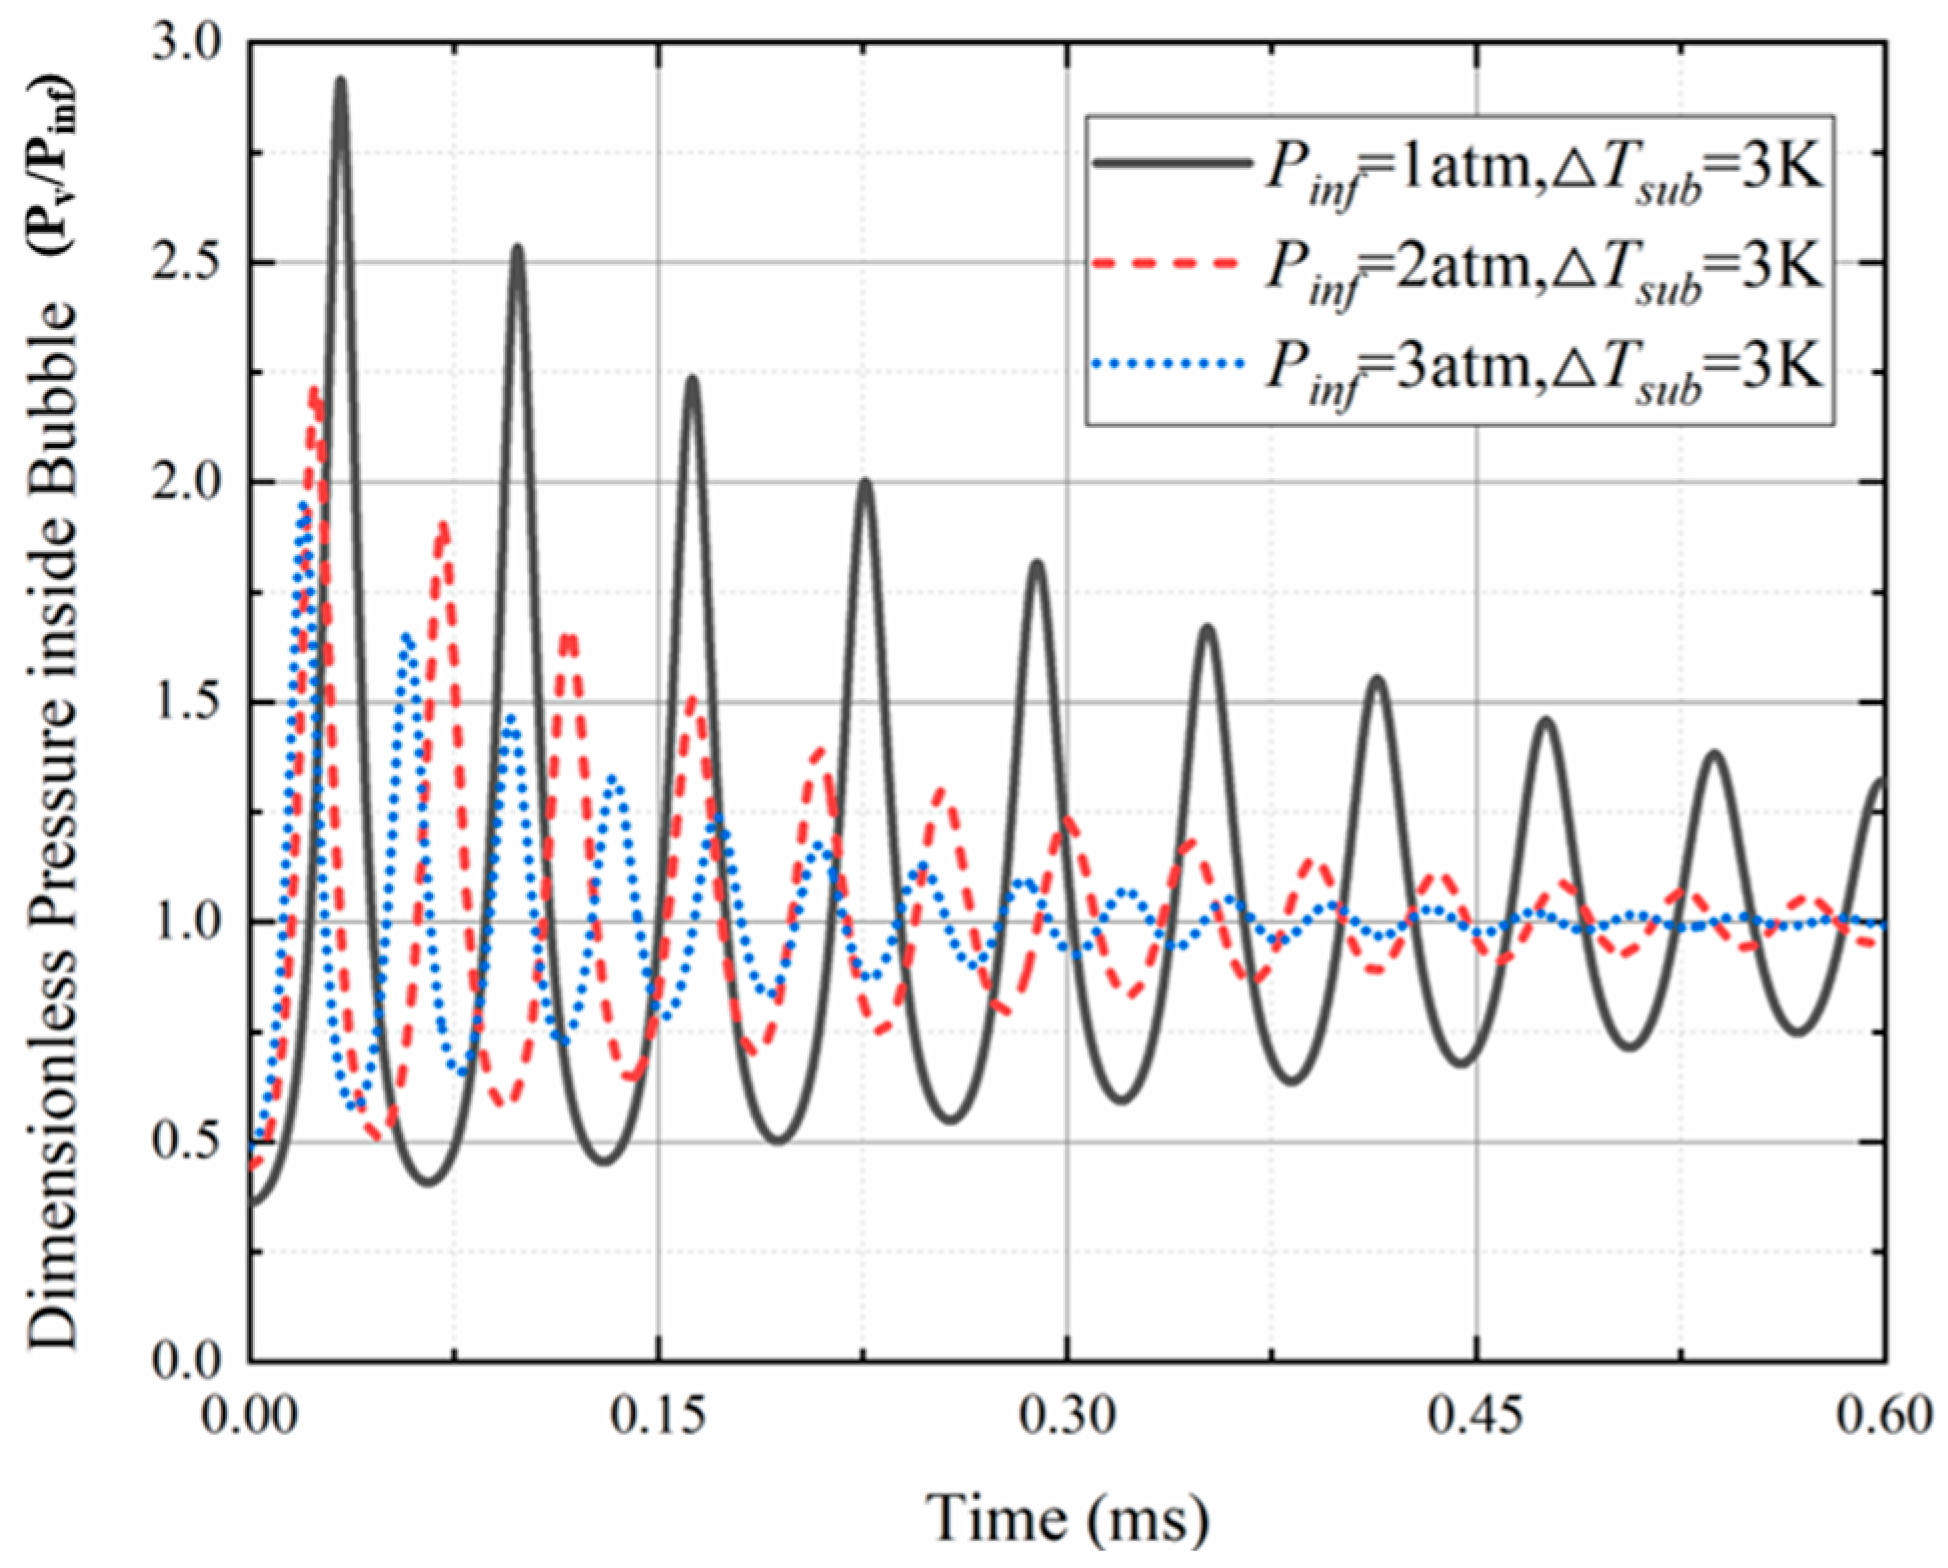
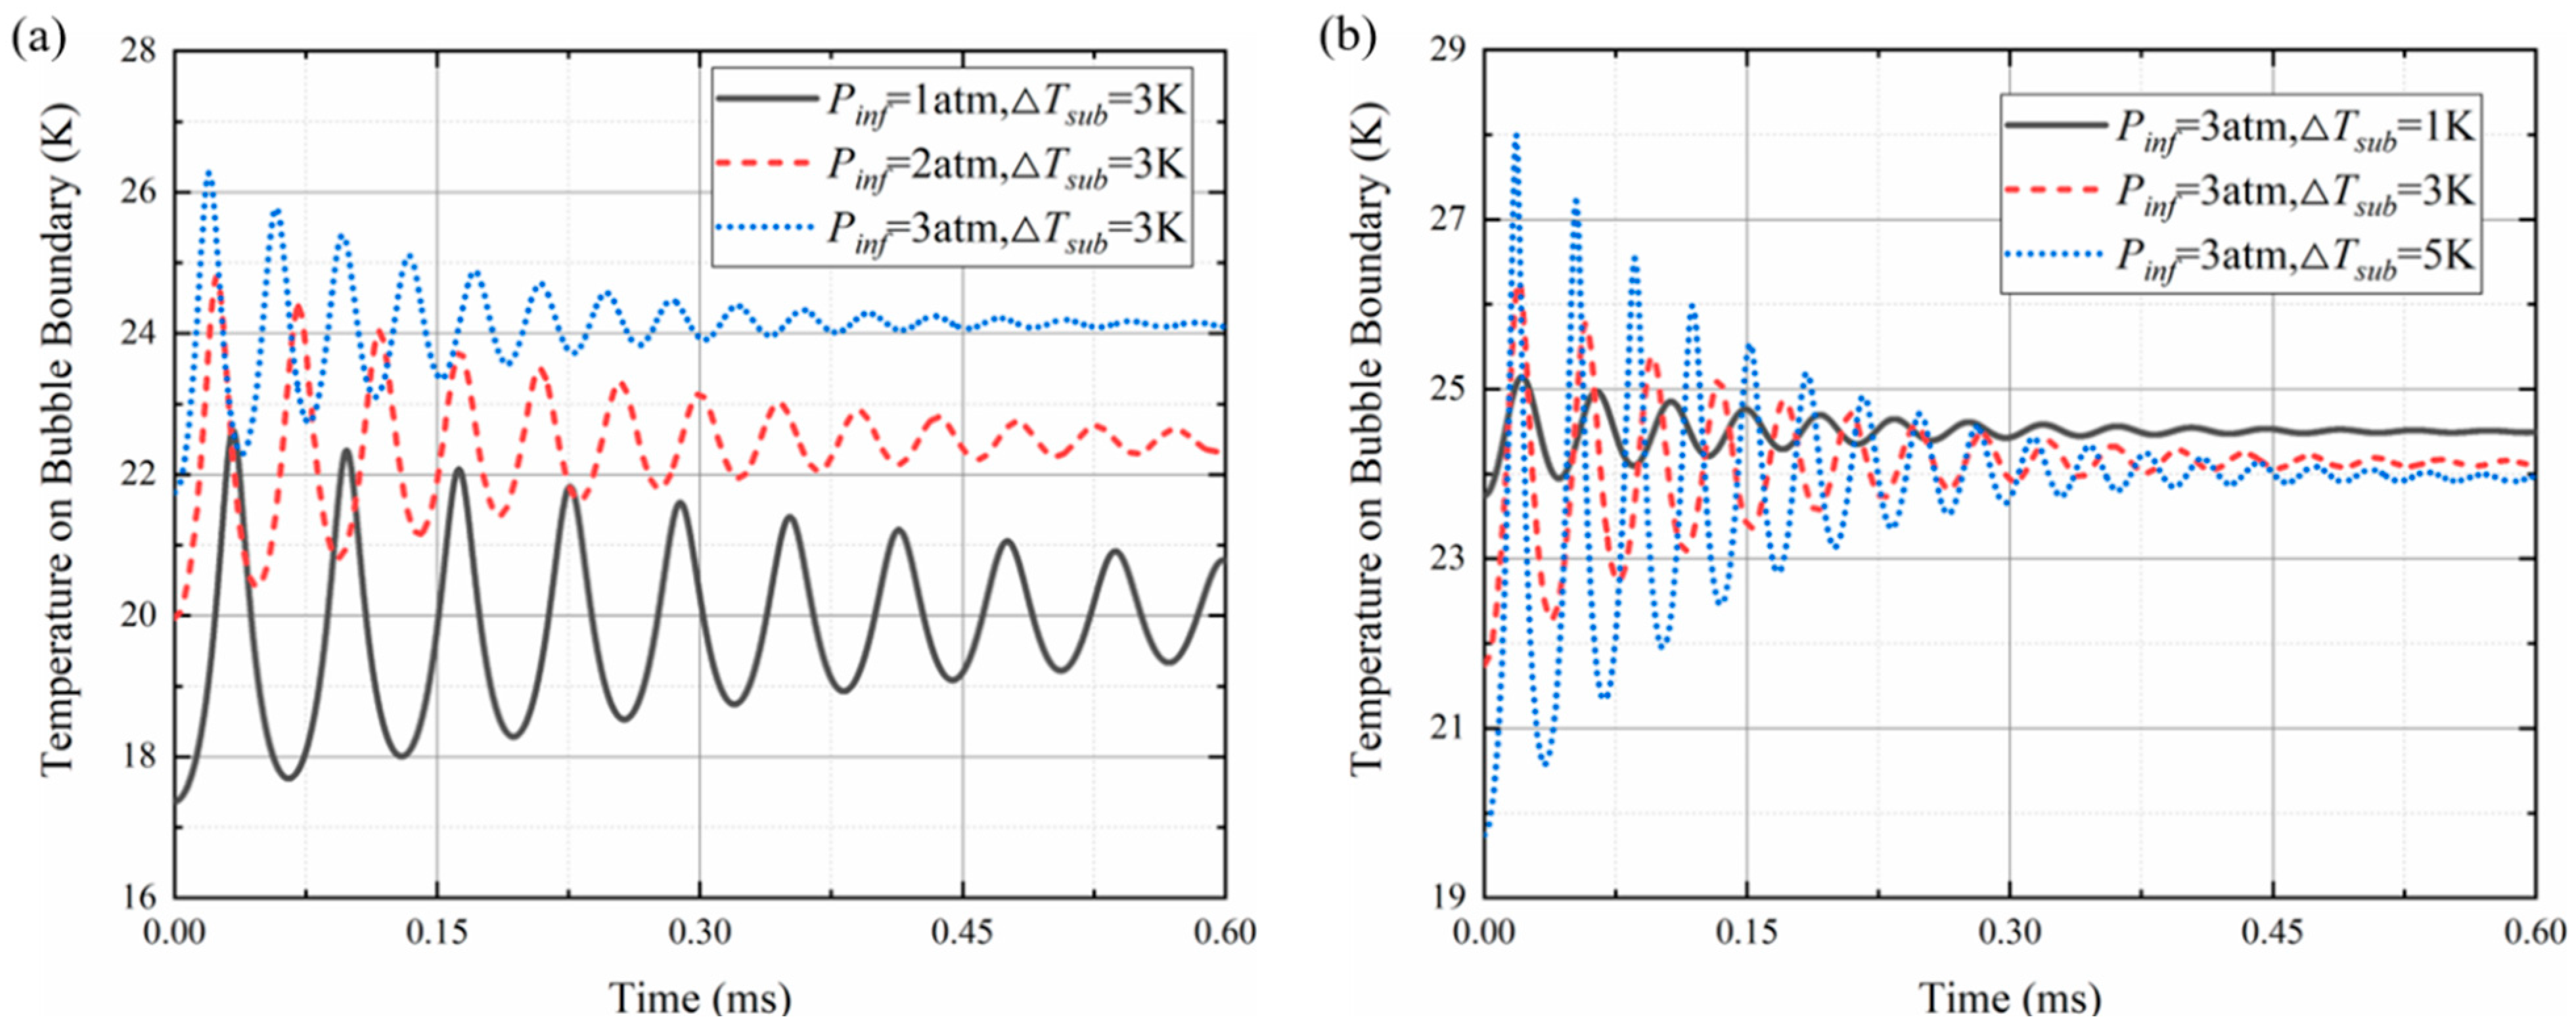
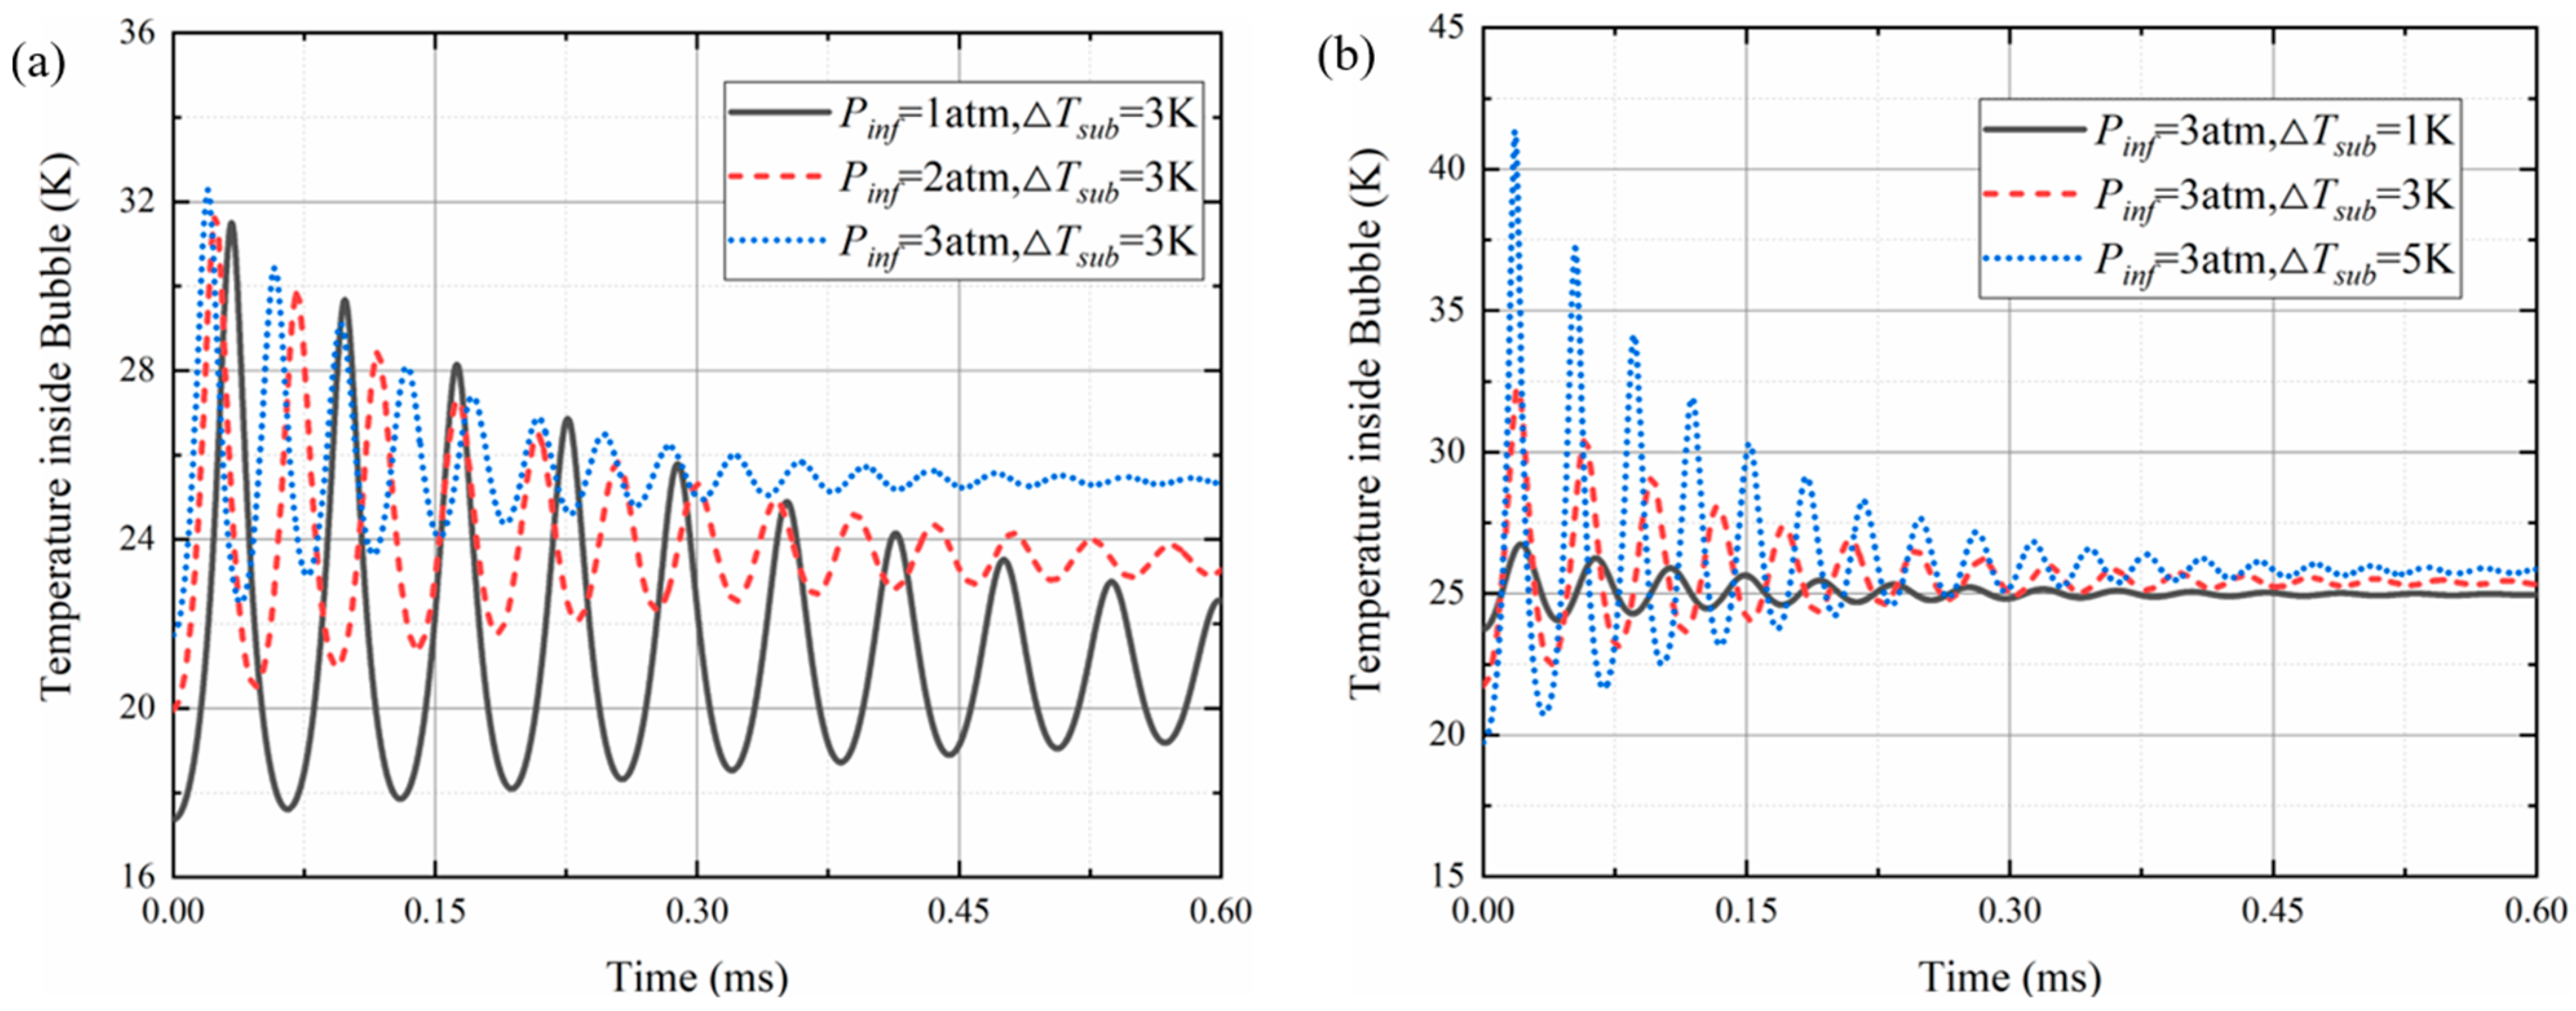
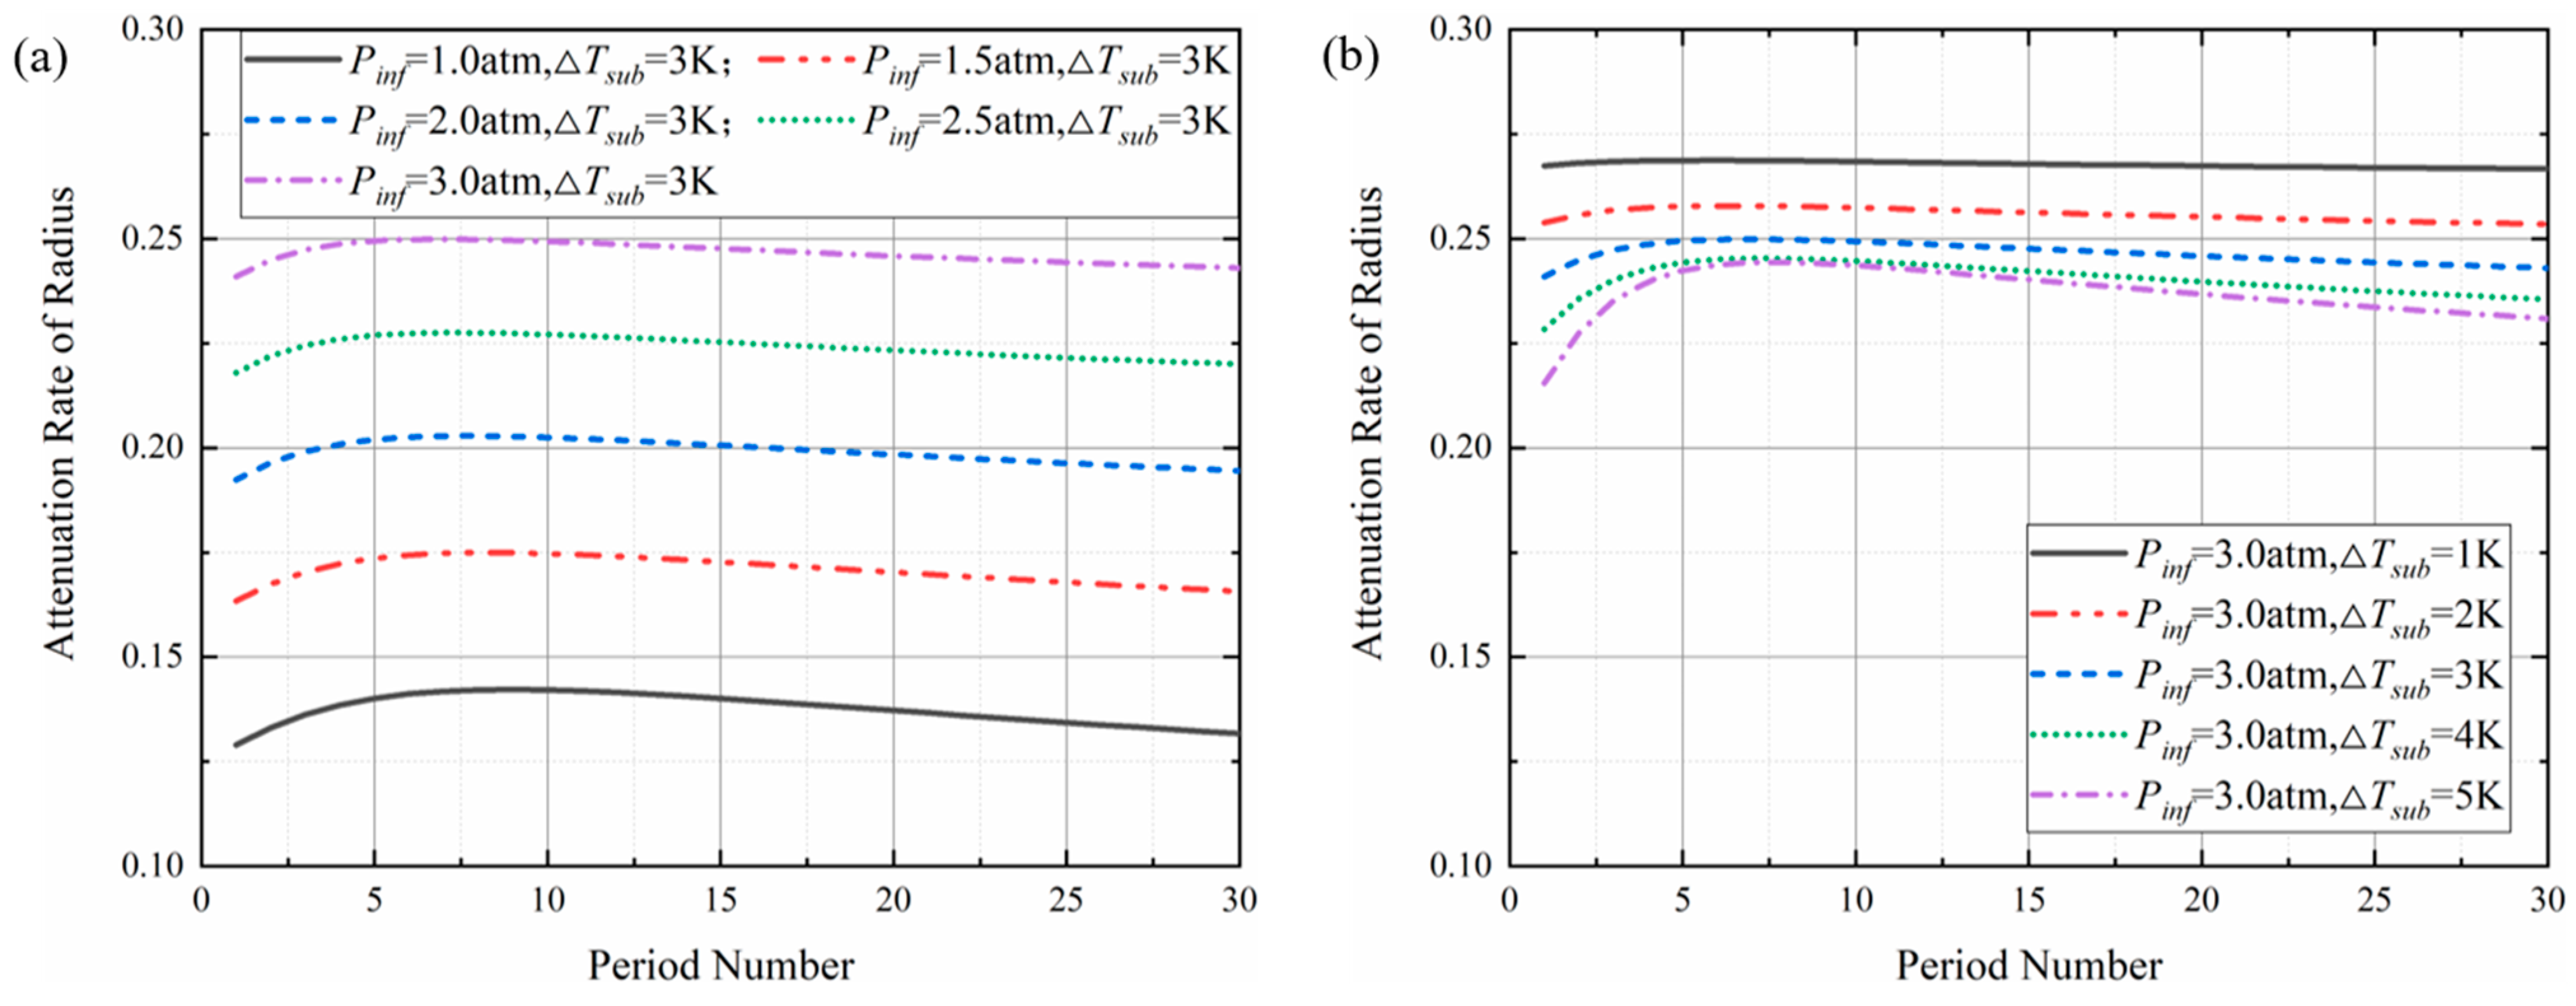
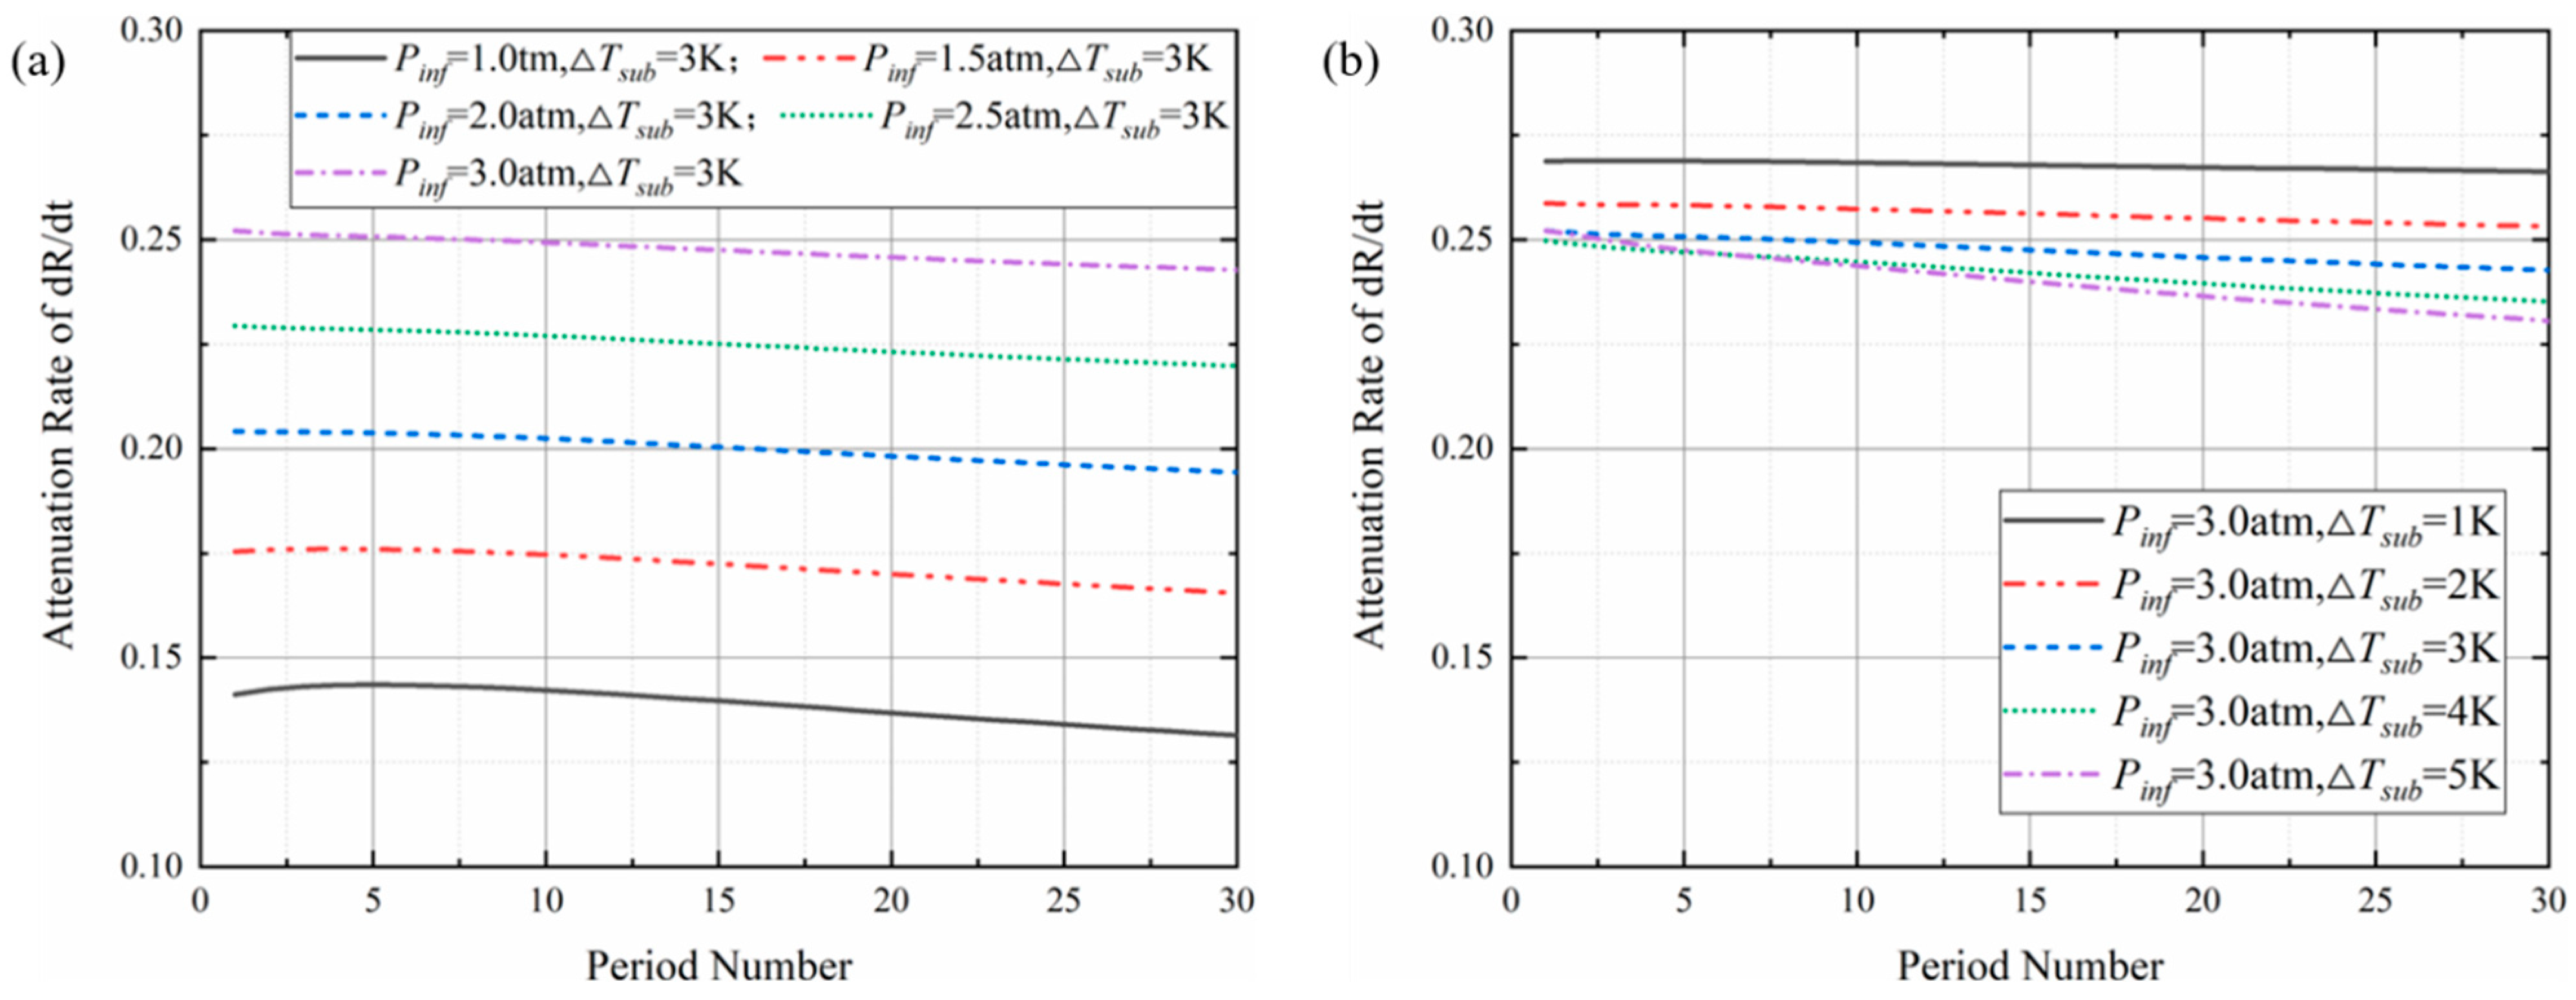
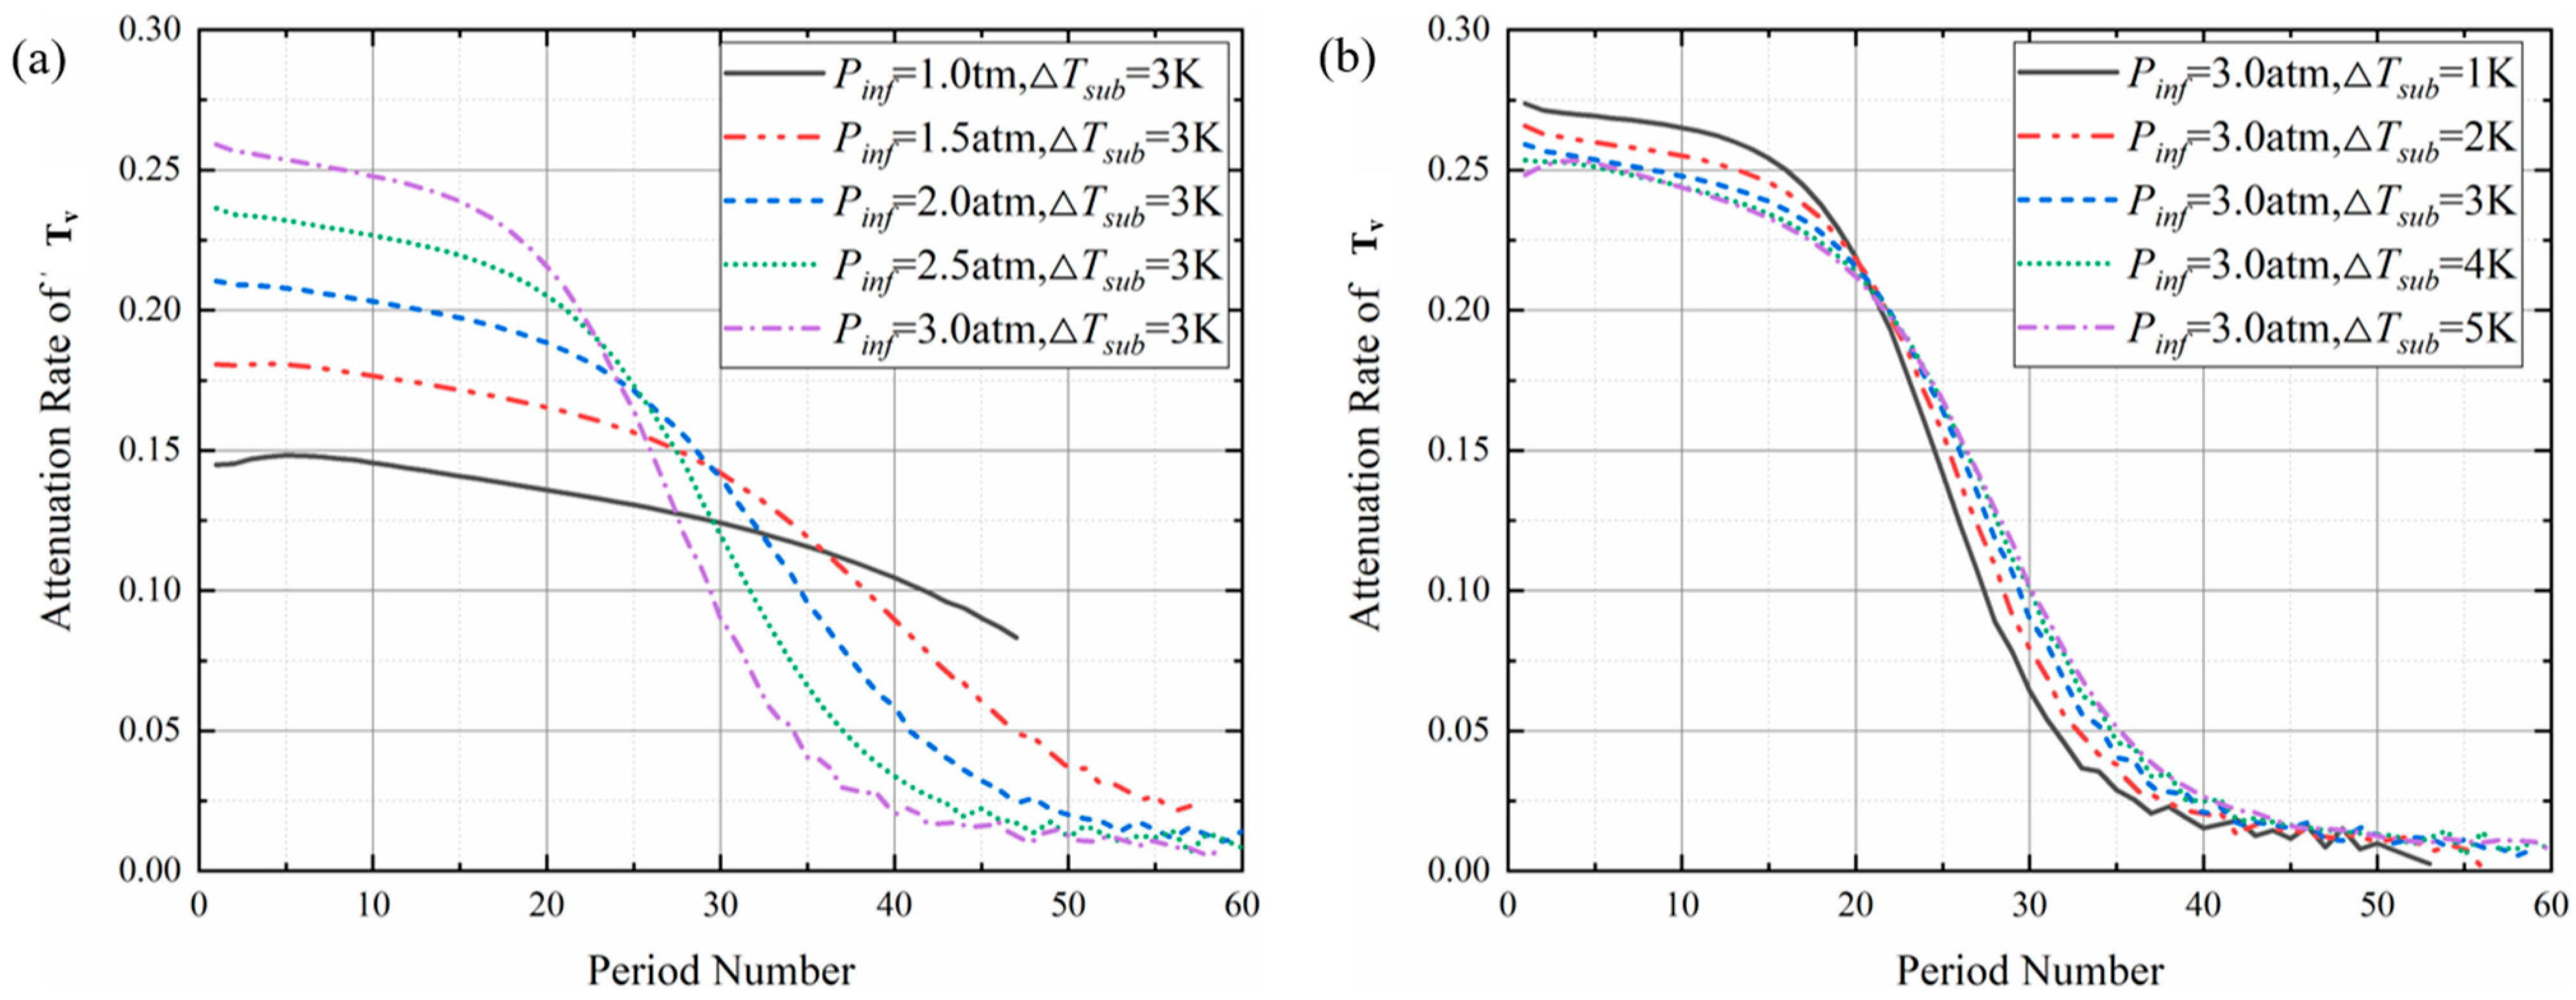
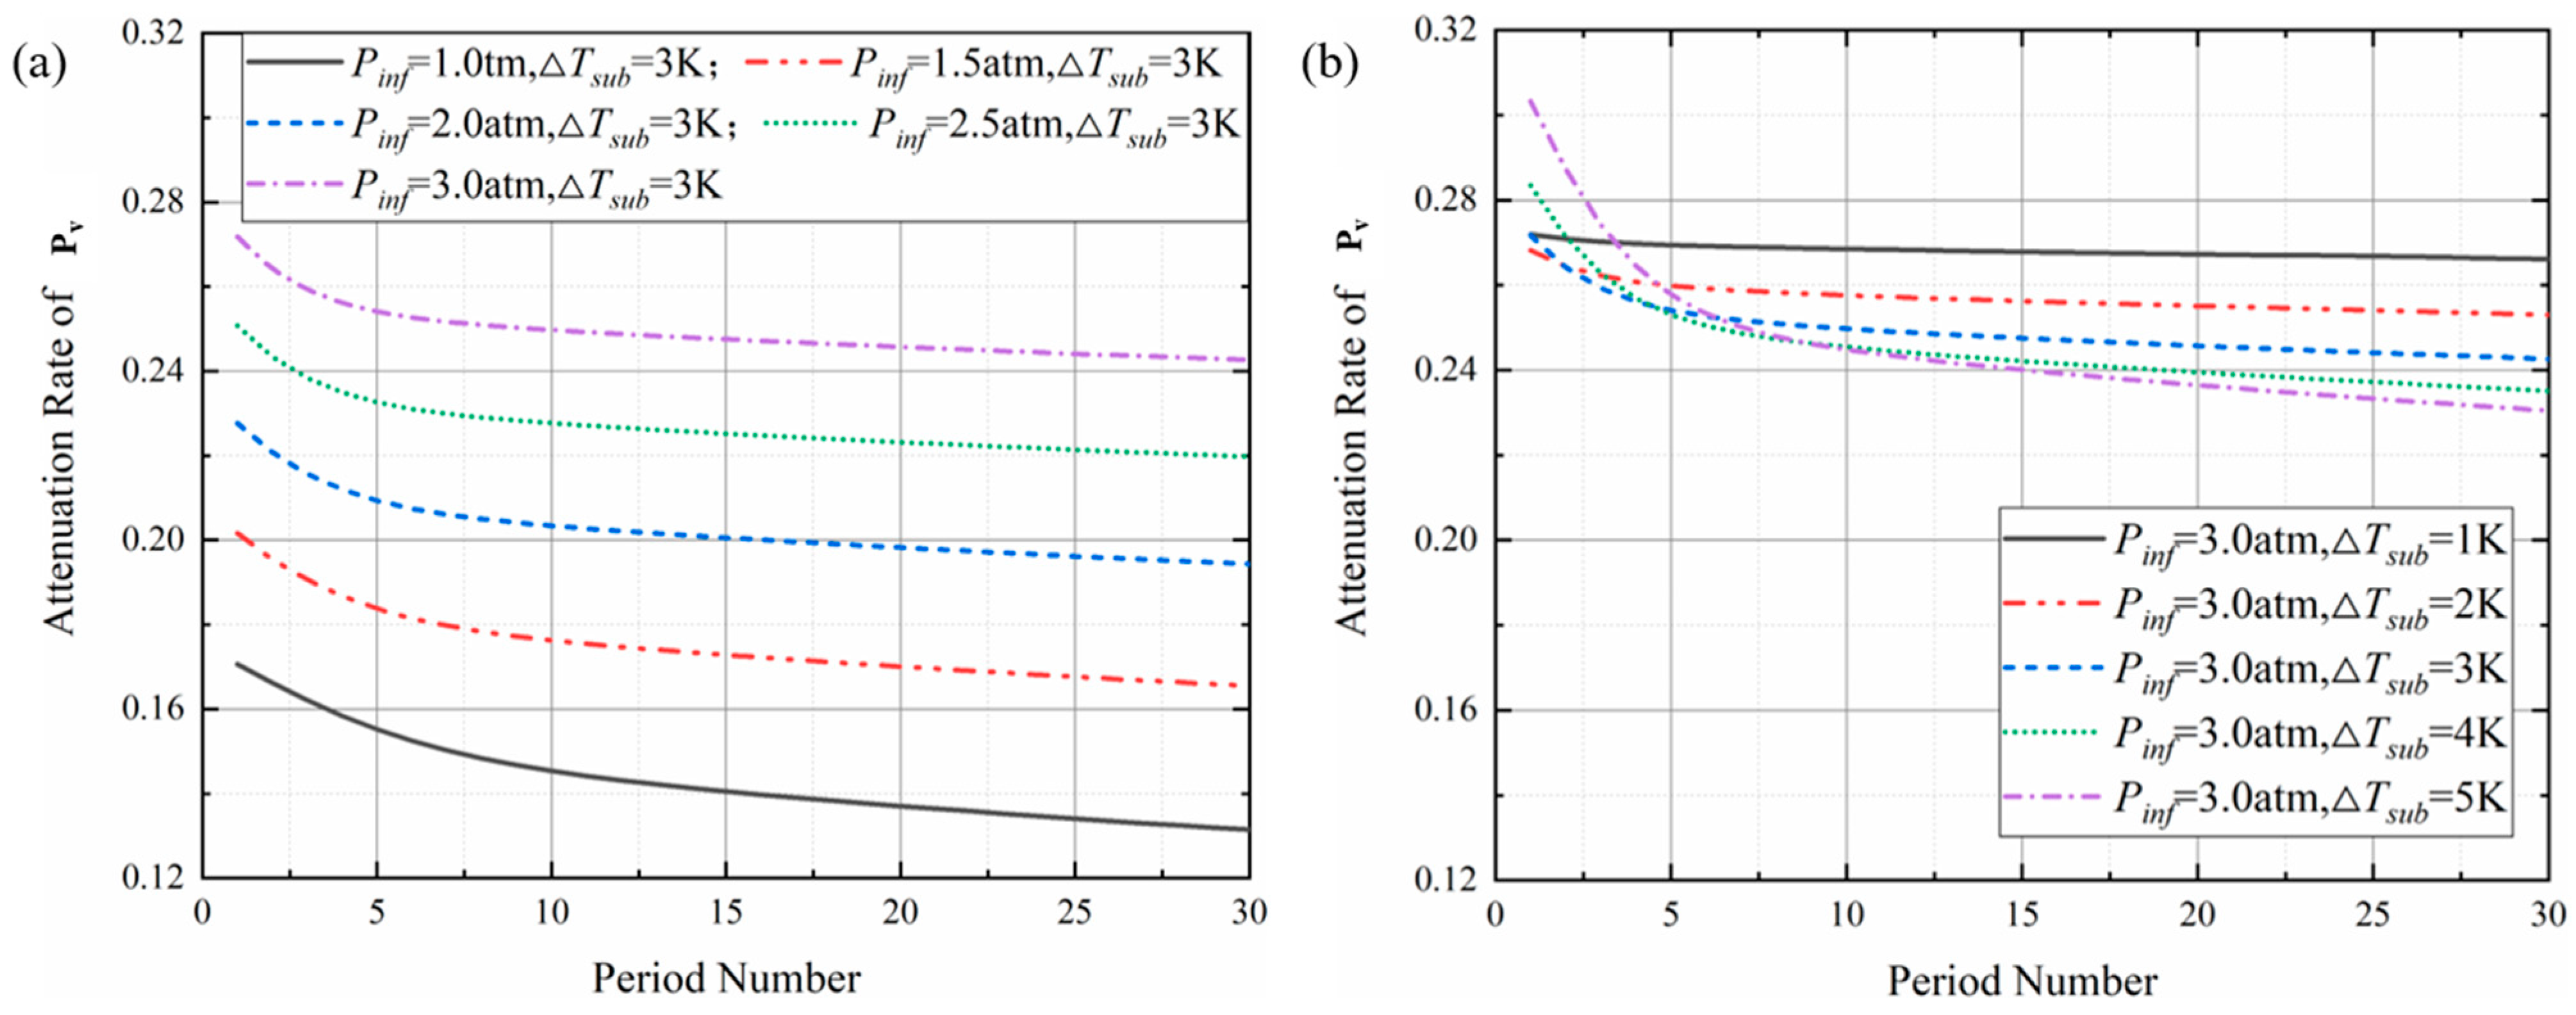
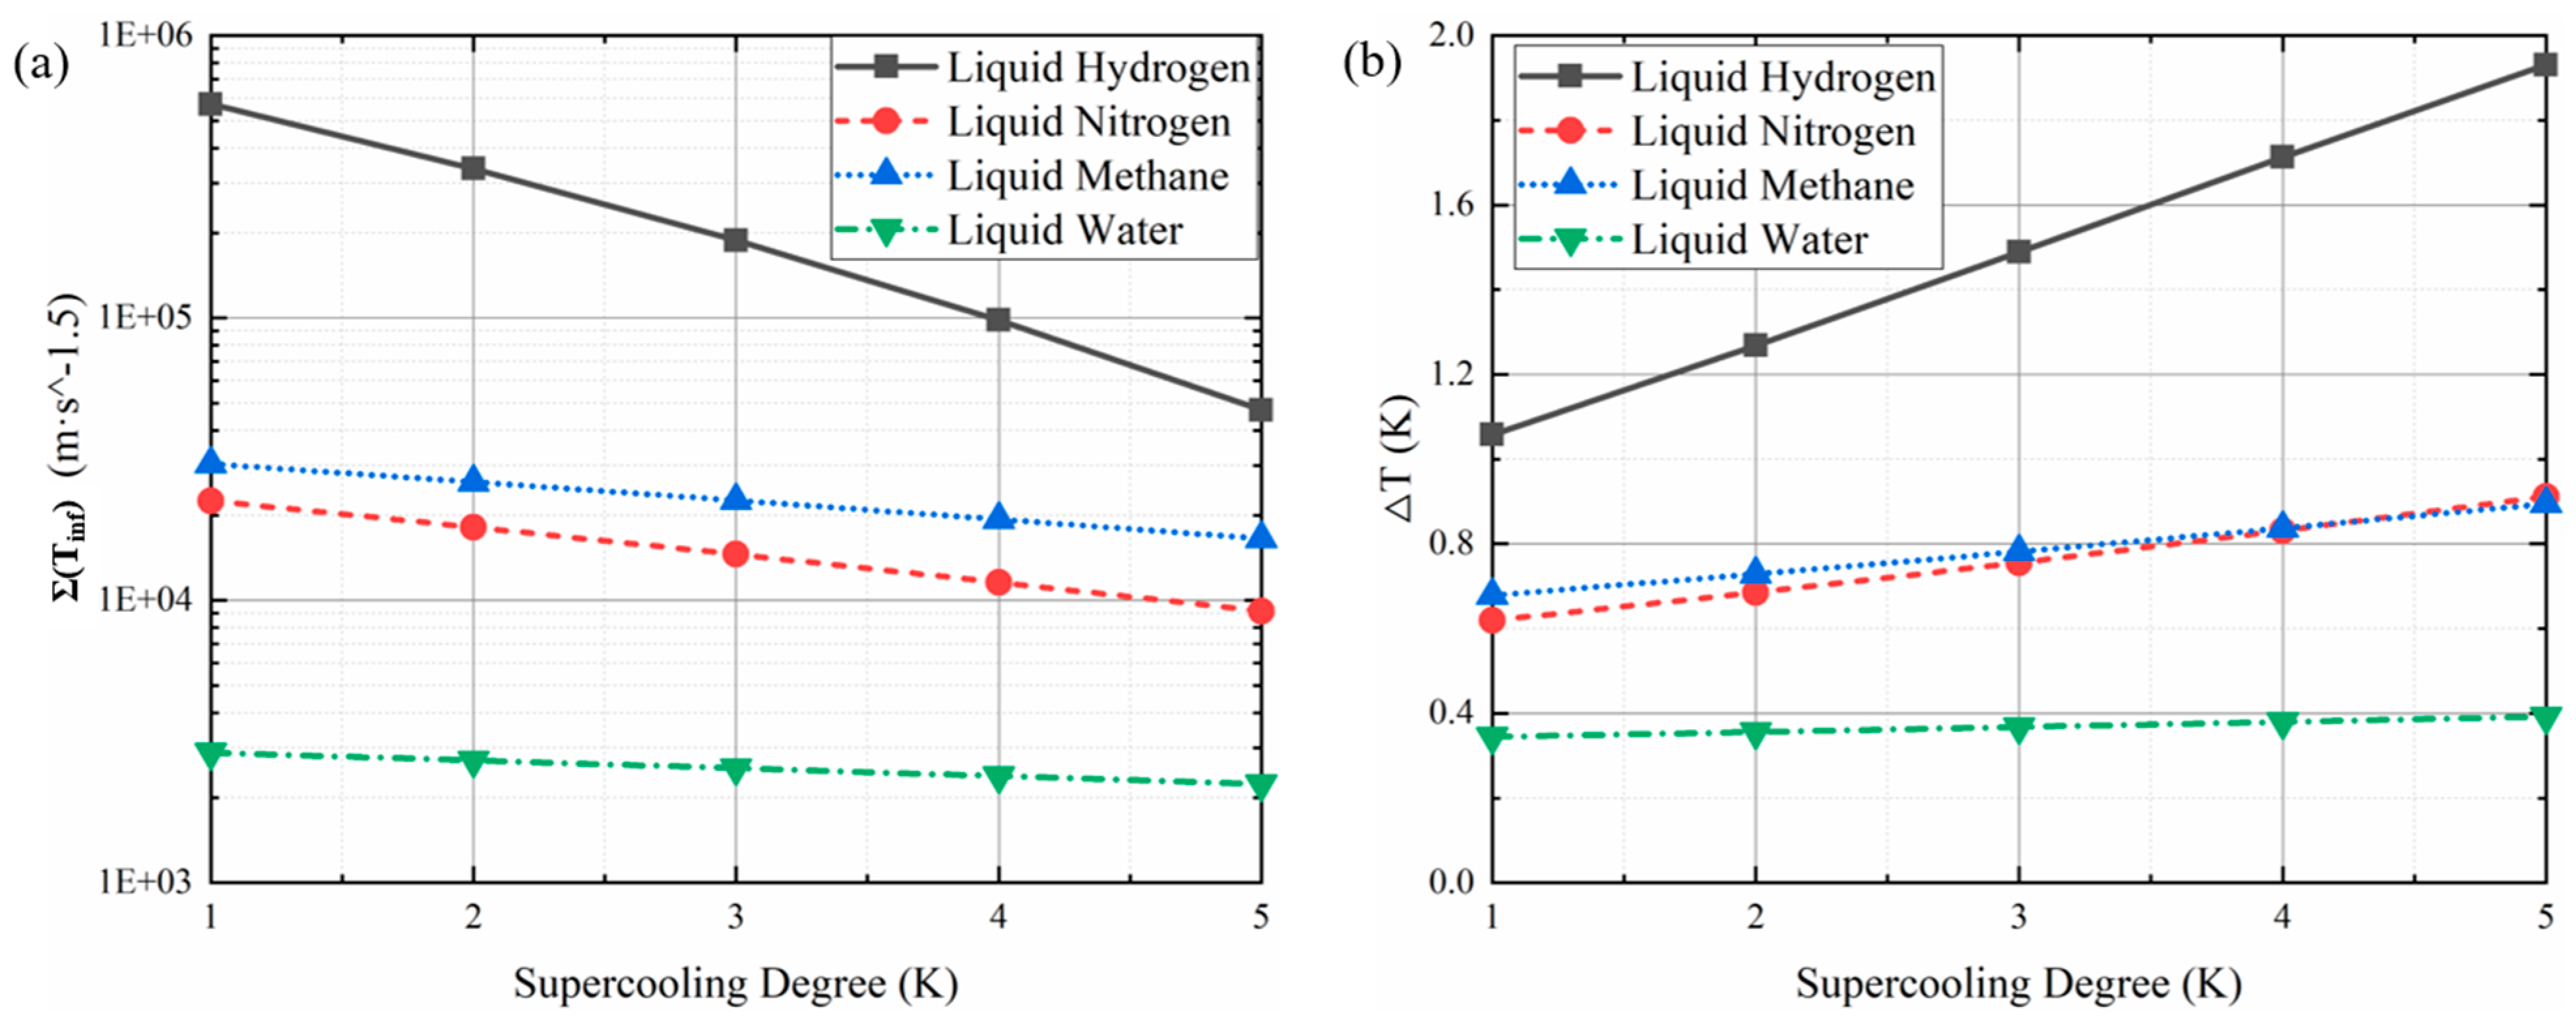
  • The amplitude of physical parameters increased with the supercooling degree and decreased with the operating pressure. The influence of the supercooling degree on the bubble collapse process was larger than that of the operating pressure. However, the supercooling degree and the operating pressure had different effects on the attenuation rates of the physical parameters. The attenuation rate of every parameter was suppressed with higher operating pressure obviously, and slightly decreased with the supercooling degree. For bubbles in various fluids, the oscillation period was shortened under larger operating pressure and supercooling degree.
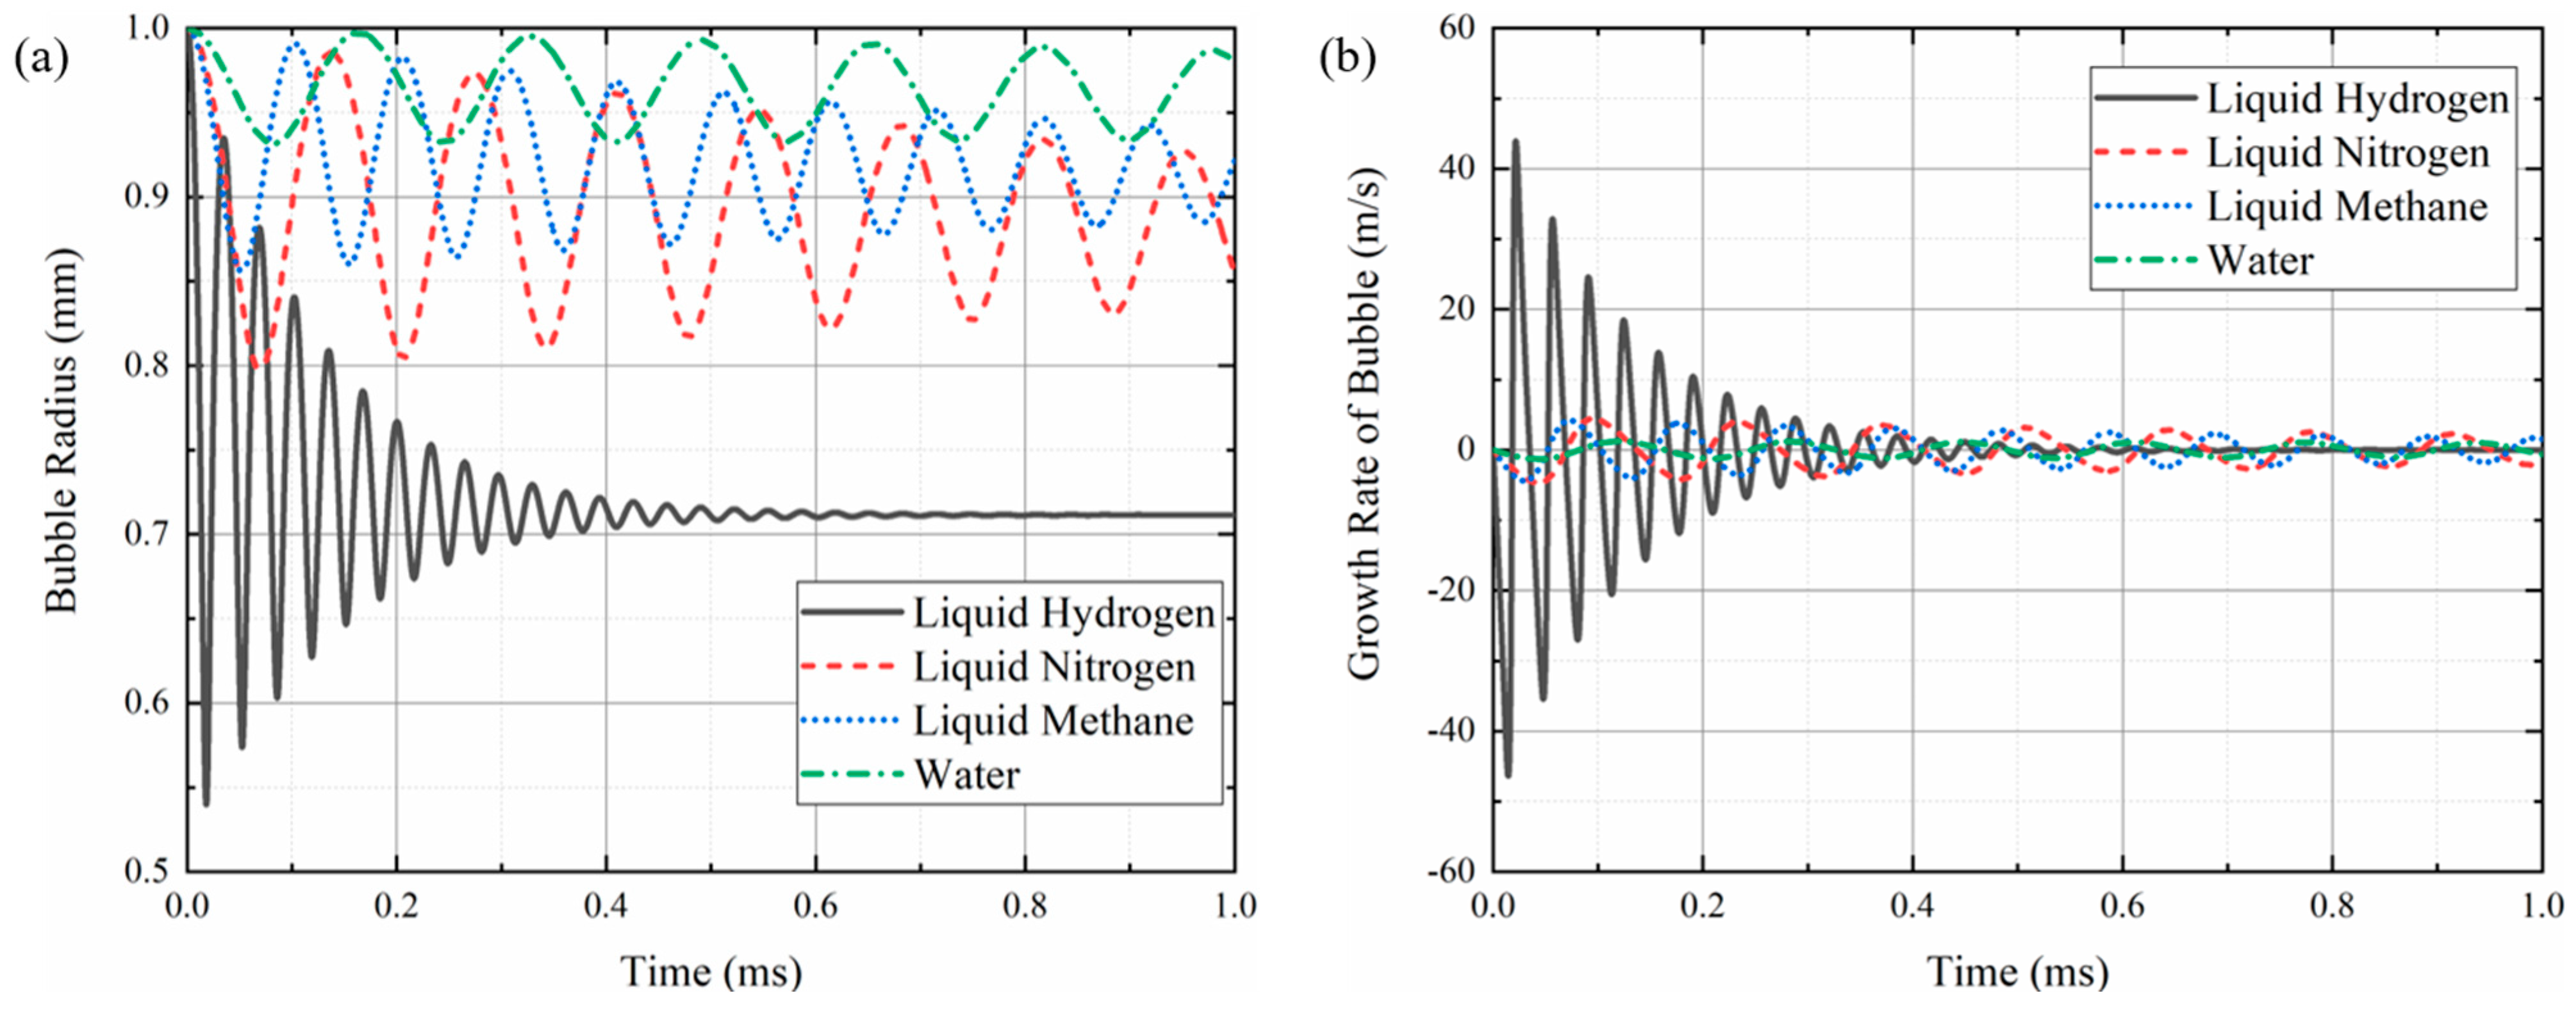
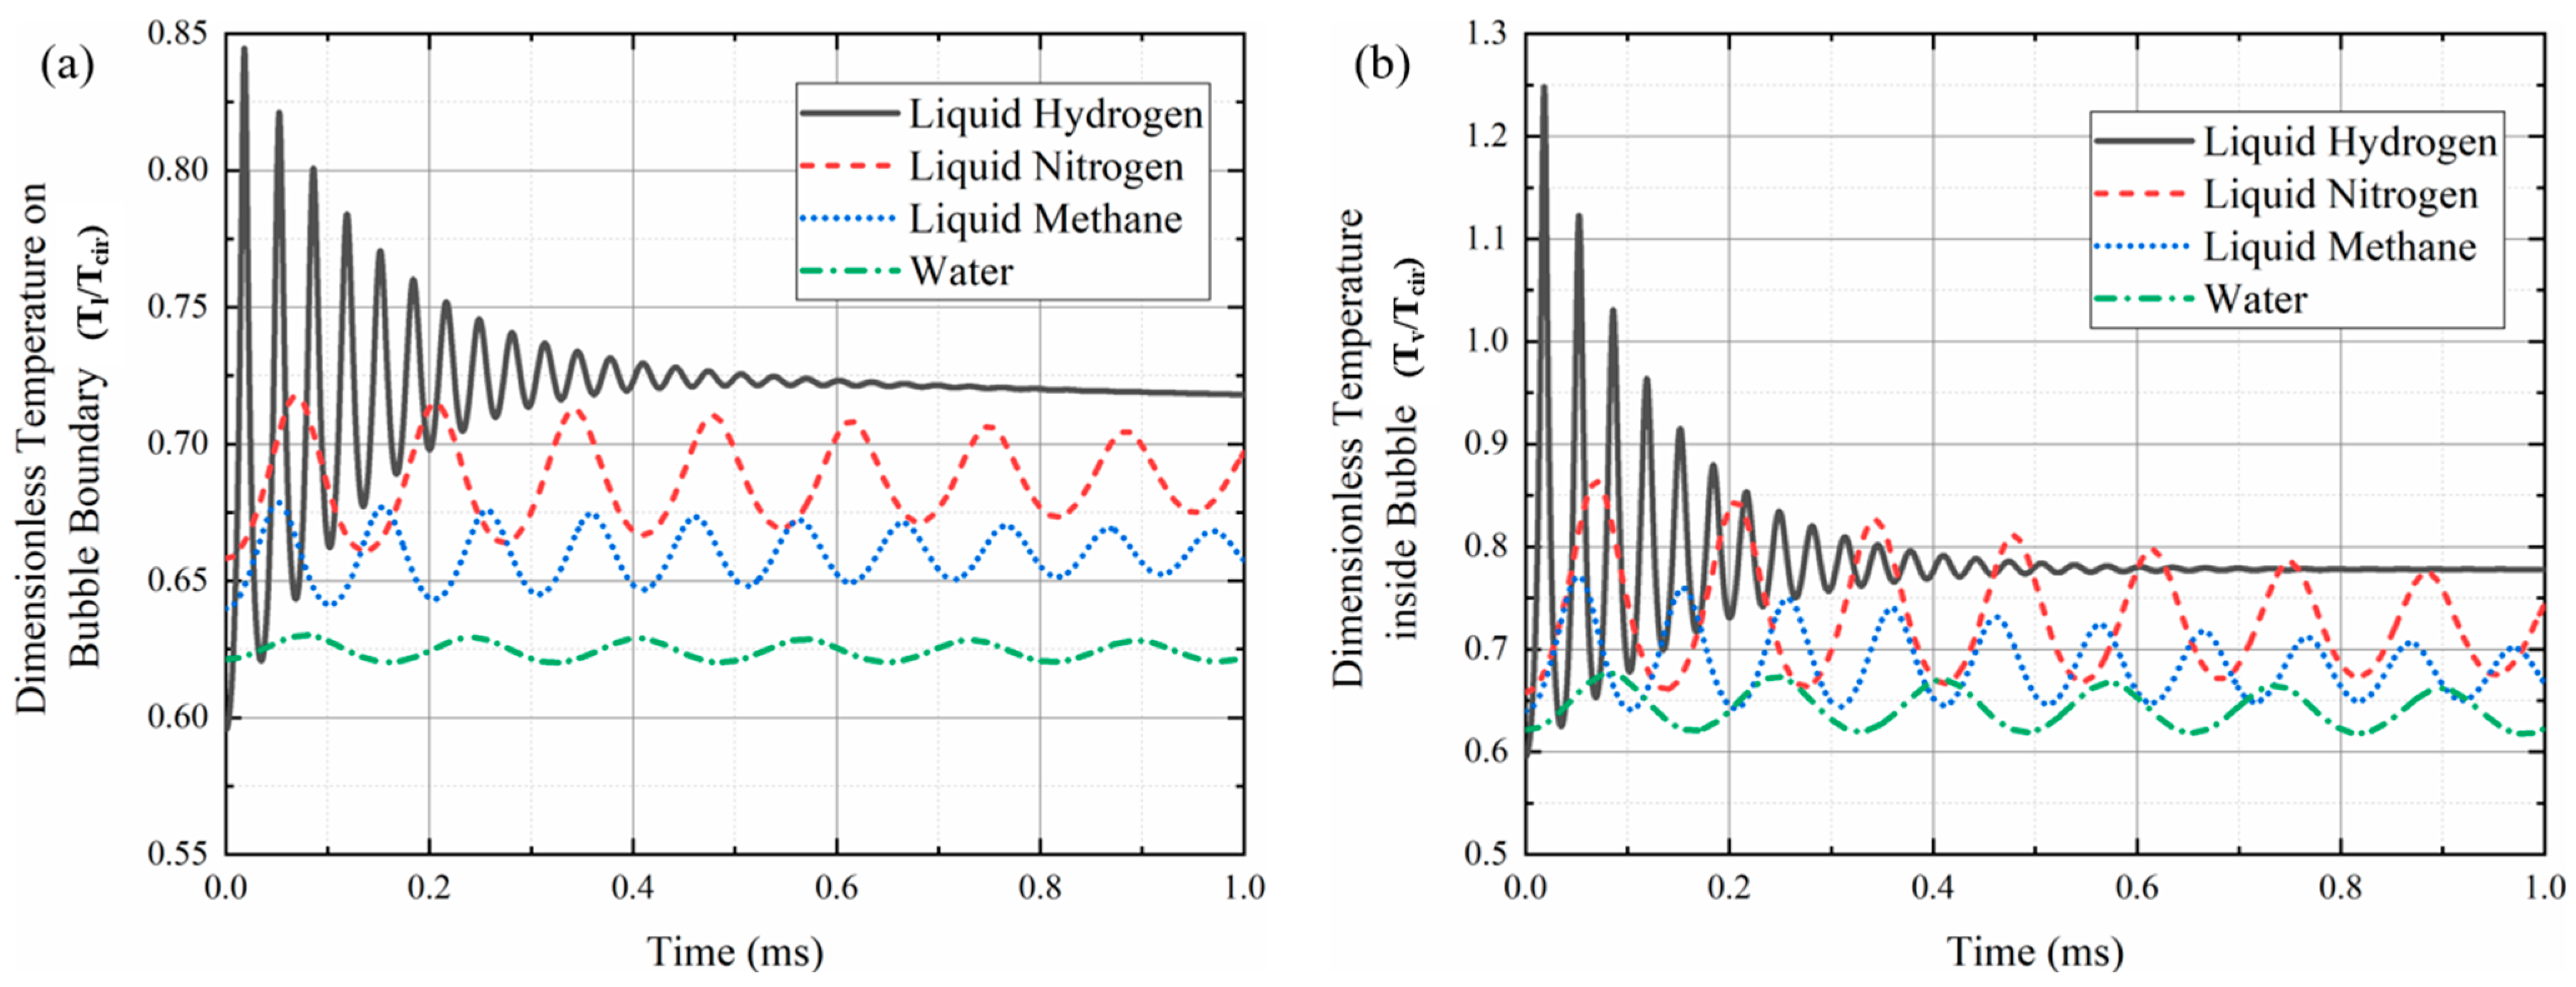
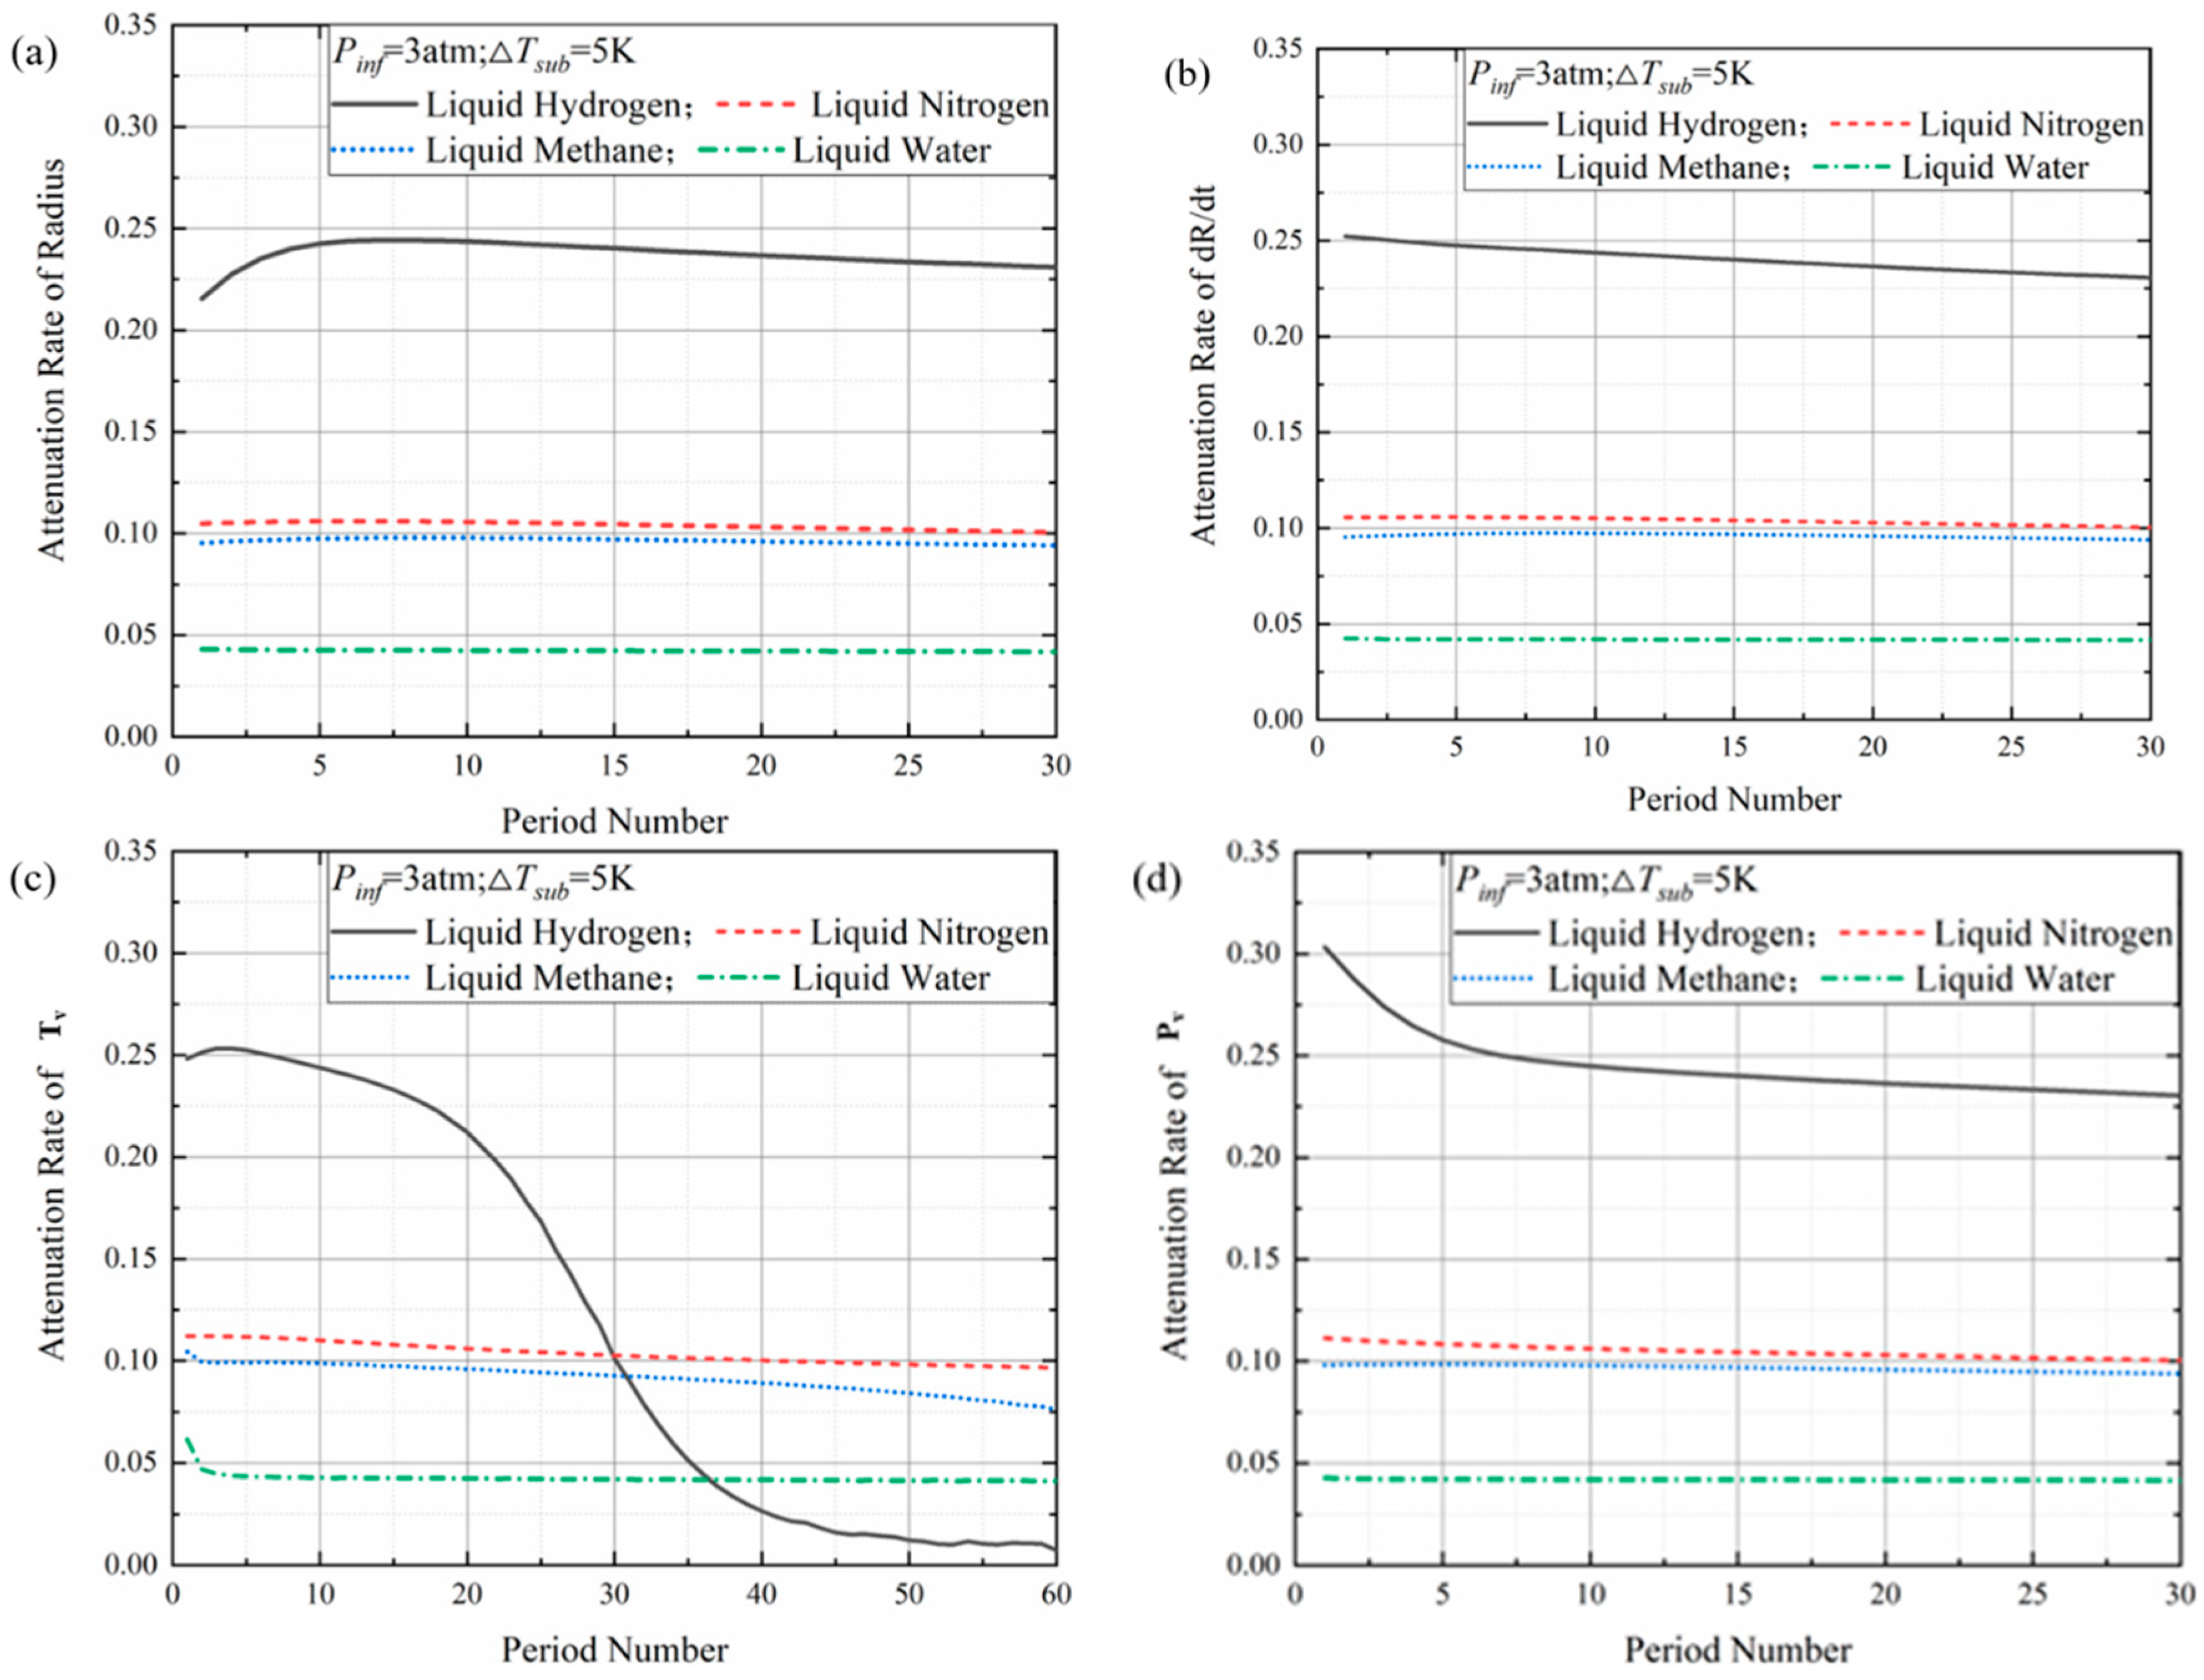
  • The amplitudes and frequencies of various parameters of bubbles in cryogenic media were higher than those in normal media. Specifically, the amplitude and frequency of every bubble parameter in liquid hydrogen were much larger than that in the other fluids. Moreover, it took the liquid hydrogen bubble the shortest time to reach equilibrium. For different liquids, the magnitude of the attenuation rates of parameters was roughly consistent with that of the standard temperature drop (ΔT) and thermal effect parameters (∑(Tinf)). Moreover, all attenuation rates of bubbles increased with the ambient pressure and decreased with the supercooling degree of the fluid.
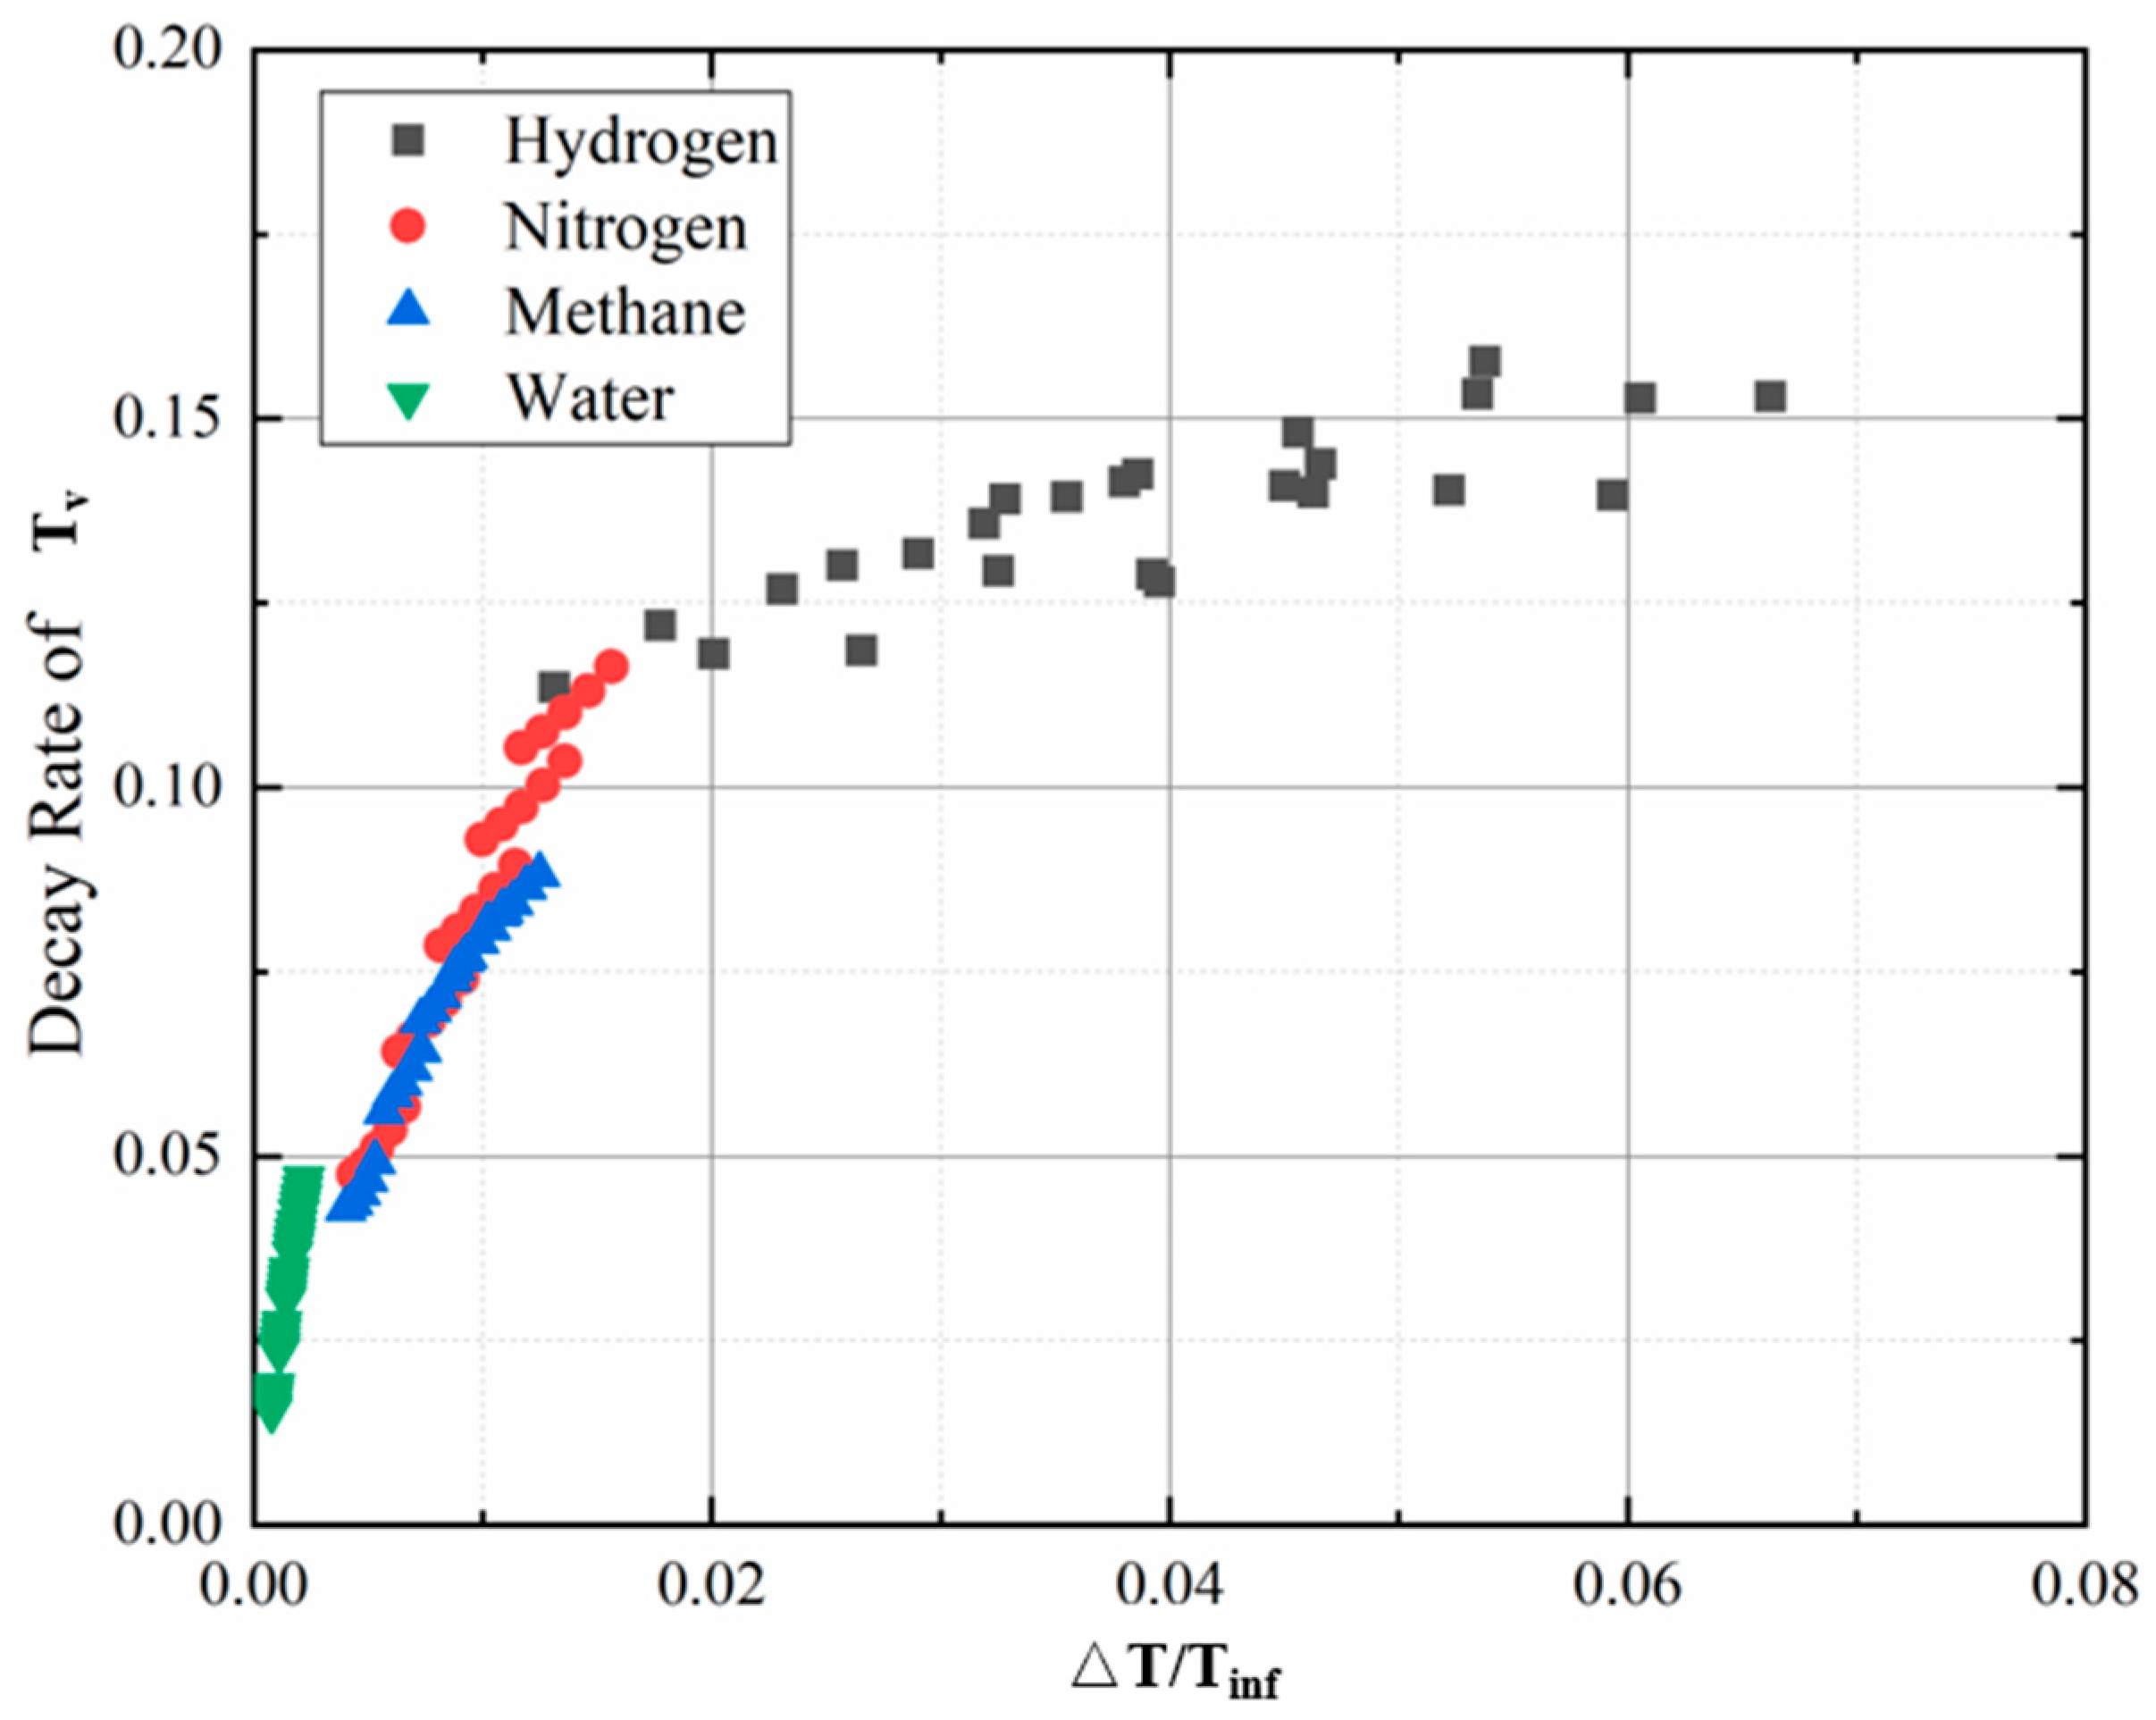
  • The maximum peak pressure and maximum attenuation rate of the temperature could be roughly predicted using dimensionless numbers. The maximum pressure peak increased monotonically with the dimensionless parameter (Wb/Re) and presented a roughly exponential relationship. Moreover, the maximum attenuation rate of temperature inside the bubble increased with the dimensionless parameter (ΔT/Tinf) monotonously and presented a roughly logarithmic relationship.

Author Contributions

Data curation, S.Y.; formal analysis, S.Y., M.Q., M.L., Y.L. and W.D.; resources, Q.Z.; supervision, T.L., Y.H.; validation, S.Y.; writing—original draft, S.Y.; writing—review and editing, S.Y. and T.L. All authors have read and agreed to the published version of the manuscript.

Funding

This project is supported by the National Natural Science Foundation of China (51976150), the China Postdoctoral Science Foundation (2021M692533) and the Youth Innovation Team of Shaanxi Universities.

Institutional Review Board Statement

This paper does not involve humans or animals.

Informed Consent Statement

This paper does not involve humans or animals.

Conflicts of Interest

The authors declare no conflict of interest.

Nomenclature

Llatent heat of the fluidμdynamic viscosity
Ppressureνkinematic viscosity
Rbubble radiusρdensity
Ssurface tension molar gas constant
Ttemperature
cspeed of soundSubscripts
kpolytropic exponentGnoncondensable gases
klthermal conductivity of liquidvvapor inside bubble
mmass in boundary layerlliquid near bubble boundary
nspecies of substancesinfoperating parameters at infinity
ttime0initial constant
uradial velocity
Superscript
Greek symbolsitime step
αthermal diffusivity

References

  1. Frank, D.; Nast, T.; Mix, J. Concept for on orbit liquid hydrogen test bed. Cryogenics 2012, 52, 226–230. [Google Scholar] [CrossRef]
  2. Zou, D.; Hao, Y.; Wu, H.; Sun, J.; Xu, L.; Li, J. Safety assessment of large-scale all steel LNG storage tanks under wind-borne missile impact. Thin-Walled Struct. 2022, 174, 109078. [Google Scholar] [CrossRef]
  3. Li, C.; Zheng, S.; Chen, Y.; Zeng, Z. Proposal and parametric analysis of an innovative natural gas pressure reduction and liquefaction system for efficient exergy recovery and LNG storage. Energy 2021, 223, 120022. [Google Scholar] [CrossRef]
  4. Nitin, B.; Sandilya, P.; Chakraborty, G. Revisiting the dewar design for liquid oxygen storage in fuel cell energy systems. Int. Commun. Heat Mass Transf. 2022, 134, 105975. [Google Scholar] [CrossRef]
  5. Yang, Q.; Shi, W.; Chang, J.; Bao, W. Maximum thrust for the rocket-ejector mode of the hydrogen fueled rocket-based combined cycle engine. Int. J. Hydrogen Energy 2015, 40, 3771–3776. [Google Scholar] [CrossRef]
  6. Sun, X.-W.; Guo, Z.-Y.; Huang, W. Passive zero-boil-off storage of liquid hydrogen for long-time space missions. Int. J. Hydrogen Energy 2015, 40, 9347–9351. [Google Scholar] [CrossRef]
  7. Mayer, T.; Semmel, M.; Morales, M.A.G.; Schmidt, K.M.; Bauer, A.; Wind, J. Techno-economic evaluation of hydrogen refueling stations with liquid or gaseous stored hydrogen. Int. J. Hydrogen Energy 2019, 44, 25809–25833. [Google Scholar] [CrossRef]
  8. Bauer, A.; Mayer, T.; Semmel, M.; Morales, M.A.G.; Wind, J. Energetic evaluation of hydrogen refueling stations with liquid or gaseous stored hydrogen. Int. J. Hydrogen Energy 2019, 44, 6795–6812. [Google Scholar] [CrossRef]
  9. Chen, T.; Wang, G.; Huang, B.; Wang, K. Numerical study of thermodynamic effects on liquid nitrogen cavitating flows. Cryogenics 2015, 70, 21–27. [Google Scholar] [CrossRef]
  10. Brennen, C.E. Cavitation and Bubble Dynamics; Oxford University Press: Oxford, UK, 1995. [Google Scholar]
  11. Li, G.; Caldwell, S.; Clark, J.A.; Gulick, S.; Hecht, A.; Lascar, D.D.; Levand, T.; Morgan, G.; Orford, R.; Savard, G.; et al. A compact cryogenic pump. Cryogenics 2016, 75, 35–37. [Google Scholar] [CrossRef]
  12. Lien, Y.C. Bubble Growth Rates at Reduced Pressure; Massachusetts Institute of Technology: Cambridge, MA, USA, 1969. [Google Scholar]
  13. Board, S.; Duffey, R. Spherical vapour bubble growth in superheated liquids. Chem. Eng. Sci. 1971, 26, 263–274. [Google Scholar] [CrossRef]
  14. Abdelmessih, A.H. Cocurrent Gas-Liquid Flow; Plenum Press: New York, NY, USA, 1969. [Google Scholar]
  15. Anderson, L.M.; Hord, J.; Hall, W.J. Cavitation in Liquid Cryogens. 1: Venturi; NASA Center for Aerospace Information (CASI): Cleveland, OH, USA, 1972. Available online: http://ntrs.nasa.gov/search.jsp?R=19720016713 (accessed on 23 September 2022).
  16. Hord, J. Cavitation in Liquid Cryogens. 2: Hydrofoil; NASA Center for Aerospace Information (CASI): Cleveland, OH, USA, 1973. Available online: http://ntrs.nasa.gov/search.jsp?R=19730007528 (accessed on 23 September 2022).
  17. Hord, J. Cavitation in Liquid Cryogens. 3: Ogives; NASA Center for Aerospace Information (CASI): Cleveland, OH, USA, 1973. Available online: http://ntrs.nasa.gov/search.jsp?R=19730019421 (accessed on 23 September 2022).
  18. Hord, J. Cavitation in Liquid Cryogens. 4: Combined Correlations for Venturi, Hydrofoil, Ogives, and Pumps; NASA Center for Aerospace Information (CASI): Cleveland, OH, USA, 1974. Available online: http://ntrs.nasa.gov/search.jsp?R=19740026591 (accessed on 23 September 2022).
  19. Ball, C.L.; Meng, P.R.; Reid, L. Cavitation Performance of 84deg Helical Inducer Operated in 37degR and 42degR Liquid Hydrogen; National Aeronautics and Space Administration: Washington, DC, USA, 1969; Report No. TM X-1360.
  20. Ito, Y. The World’s First Test Facility That Enables the Experimental Visualization of Cavitation on a Rotating Inducer in Both Cryogenic and Ordinary Fluids. J. Fluids Eng. 2021, 143, 121105. [Google Scholar] [CrossRef]
  21. Hewitt, H.C.; Parker, J.D. Bubble Growth and Collapse in Liquid Nitrogen. J. Heat Transf. 1968, 90, 22–26. [Google Scholar] [CrossRef]
  22. Zwart, P.J.; Gerber, A.G.; Belamri, T. A two-phase flow model for predicting cavitation dynamics. In Proceedings of the Fifth International Conference on Multiphase Flow, Yokohama, Japan, 30 May–3 June 2004. [Google Scholar]
  23. Habil, S.I. Physical and Numerical Modeling of Unsteady Cavitation Dynamics. In Proceedings of the ICMF-2001, 4th International Conference on Multiphase Flow, New Orleans, LA, USA, 27 May–1 June 2001. [Google Scholar]
  24. Singhal, A.K.; Athavale, M.M.; Li, H.; Jiang, Y. Mathematical Basis and Validation of the Full Cavitation Model. J. Fluids Eng. 2002, 124, 617–624. [Google Scholar] [CrossRef]
  25. Robinson, A.; Judd, R. Bubble growth in a uniform and spatially distributed temperature field. Int. J. Heat Mass Transf. 2001, 44, 2699–2710. [Google Scholar] [CrossRef]
  26. Robinson, A.; Judd, R. The dynamics of spherical bubble growth. Int. J. Heat Mass Transf. 2004, 47, 5101–5113. [Google Scholar] [CrossRef]
  27. Zhang, X.; Qiu, L.; Gao, Y. Computational fluid dynamic study on cavitation in liquid nitrogen. Cryogenics 2008, 48, 432–438. [Google Scholar] [CrossRef]
  28. Xu, B.; Feng, J.; Wan, F.; Zhang, D.; Shen, X.; Zhang, W. Numerical investigation of modified cavitation model with thermodynamic effect in water and liquid nitrogen. Cryogenics 2020, 106, 103049. [Google Scholar] [CrossRef]
  29. Le, A.D.; Okajima, J.; Iga, Y. Numerical simulation study of cavitation in liquefied hydrogen. Cryogenics 2019, 101, 29–35. [Google Scholar] [CrossRef]
  30. Li, D.; Ren, Z.; Li, Y.; Gong, R.; Wang, H. Thermodynamic effects on the cavitation flow of a liquid oxygen turbopump. Cryogenics 2021, 116, 103302. [Google Scholar] [CrossRef]
  31. Ito, Y. Numerical Model and Validation for Cryogenic High-Speed Cavitating Flow Based on Bubble Size Distribution Model in Consideration of Rigorous Heat Transfer around Bubble and Bubble Oscillation. J. Jpn. Soc. Aeronaut. Space Sci. 2008, 56, 456–463. [Google Scholar] [CrossRef] [Green Version]
  32. Ito, Y.; Zheng, X.; Nagasaki, T. One-way Coupling Numerical Simulation of Cryogenic Cavitation Around an Inducer. Int. J. Fluid Mach. Syst. 2019, 12, 235–243. [Google Scholar] [CrossRef]
  33. Kimoto, H. Experimental Evaluation of the Effects of a Water Microjet and a Shock Wave by a Local Pressure Sensor; American Society of Mechanical Engineers, Fluids Engineering Division (Publication) FED: New York, NY, USA, 1987; Volume 57, pp. 217–224. Available online: https://0-search-ebscohost-com.brum.beds.ac.uk/login.aspx?direct=true&db=edselc&AN=edselc.2-52.0-0023566640&lang=zh-cn&site=eds-live. (accessed on 23 September 2022).
  34. Rayleigh, L. VIII. On the pressure developed in a liquid during the collapse of a spherical cavity. Lond. Edinb. Dublin Philos. Mag. J. Sci. 1917, 34, 94–98. [Google Scholar] [CrossRef]
  35. Plesset, M.S. The Dynamics of Cavitation Bubbles. J. Appl. Mech. 1949, 16, 277–282. [Google Scholar] [CrossRef]
  36. Herring, G. Theory of the pulsations of the gas bubble produced by an underwater explosion. OSRD Rpt. 1950, 236, 1941. [Google Scholar]
  37. Trilling, L. The Collapse and Rebound of a Gas Bubble. J. Appl. Phys. 1952, 23, 14–17. [Google Scholar] [CrossRef]
  38. Liu, Y.; Chen, W.; Huang, W.; Gao, X.; Jiang, L.; Xu, J.; Zhu, Y. High Precision Measurement Technique of Steady State Acoustic Cavitation Bubble. Chin. Sci. Bull. 2005, 50, 2458–2462. (In Chinese) [Google Scholar] [CrossRef]
  39. Akira, S.; Yukio, T. On the Behavior of a Spherical Bubble and the Impulse Pressure in a Viscous Compressible Liquid. Bull. JSME 2011, 20, 1453–1460. [Google Scholar]
  40. Moradi, R.; Groth, K.M. Hydrogen storage and delivery: Review of the state of the art technologies and risk and reliability analysis. Int. J. Hydrogen Energy 2019, 44, 12254–12269. [Google Scholar] [CrossRef]
Figure 1. Single-bubble experimental photos [38] (a) and collapse model schematic diagram (b).
Applsci 12 10839 g001
Figure 2. The flow chart of solving the bubble collapse model.
Applsci 12 10839 g002
Figure 3. Comparison of the calculation results of the growth–collapse model with the experimental results (a) and the calculation results of the Yukio [39] model (b).
Applsci 12 10839 g003
Figure 4. Radius of liquid hydrogen bubbles under different operating pressures (a) and different supercooling degrees (b) during collapse.
Applsci 12 10839 g004
Figure 5. Radius growth rate of liquid hydrogen bubbles under different operating pressures (a) and different supercooling degrees (b) during collapse.
Applsci 12 10839 g005
Figure 6. Pressure inside liquid hydrogen bubbles under different operating pressures (a) and different supercooling degrees (b) during collapse.
Applsci 12 10839 g006
Figure 7. Dimensionless pressure inside liquid hydrogen bubbles under different operating pressures.
Applsci 12 10839 g007
Figure 8. Temperature at liquid hydrogen bubble boundaries under different operating pressures (a) and different supercooling degrees (b) during collapse.
Applsci 12 10839 g008
Figure 9. Temperature inside liquid hydrogen bubbles under different operating pressures (a) and different supercooling degrees (b) during collapse.
Applsci 12 10839 g009
Figure 10. Comparison of boundary temperature and internal temperature of liquid hydrogen bubble during collapse.
Applsci 12 10839 g010
Figure 11. Bubble radius (a) and radius growth rate (b) in different fluids under 3 atm operating pressure and 5 K supercooling degree during collapse.
Applsci 12 10839 g011
Figure 12. Dimensionless temperature at bubble boundaries (a) and inside bubbles (b) in different fluids under 3 atm operating pressure and 5 K supercooling degree during collapse.
Applsci 12 10839 g012
Figure 13. Pressure inside bubbles in different fluids under 3 atm operating pressure and 5 K supercooling degree during collapse.
Applsci 12 10839 g013
Figure 14. The relationship between the maximum peak pressure and Wb/Re.
Applsci 12 10839 g014
Figure 15. Bubble period of liquid hydrogen (a), liquid nitrogen (b), liquid methane (c) and liquid water (d) during collapse.
Applsci 12 10839 g015aApplsci 12 10839 g015b
Figure 16. Attenuation rate of liquid hydrogen bubble radii under different operating pressures (a) and different supercooling degrees (b) during collapse.
Applsci 12 10839 g016
Figure 17. Attenuation rate of liquid hydrogen bubble growth rate under different operating pressures (a) and different supercooling degrees (b) during collapse.
Applsci 12 10839 g017
Figure 18. Attenuation rate of temperature inside liquid hydrogen bubbles under different operating pressures (a) and different supercooling degree (b) during collapse.
Applsci 12 10839 g018
Figure 19. Attenuation rate of pressure inside liquid hydrogen bubbles under different operating pressures (a) and different supercooling degrees (b) during collapse.
Applsci 12 10839 g019
Figure 20. Attenuation rates of bubble radius (a), radius growth rate (b), temperature inside bubble (c) and pressure inside bubble (d) in different fluids under 3 atm operating pressure and 5 K supercooling degrees during collapse.
Applsci 12 10839 g020
Figure 21. Thermodynamic effect parameter ∑(Tinf) (a) and standard temperature drop ΔT (b) in different fluids at 3 atm.
Applsci 12 10839 g021
Figure 22. Relationship between attenuation rate of temperature inside the bubble and ΔT/Tinf.
Applsci 12 10839 g022
Publisher’s Note: MDPI stays neutral with regard to jurisdictional claims in published maps and institutional affiliations.

