Article

Effectiveness of Food Processing By-Products as Dust Suppressants for Exposed Mine Soils: Results from Laboratory Experiments and Field Trials

Institute of Mineral Resources Engineering, RWTH Aachen University, 52062 Aachen, Germany
*
Author to whom correspondence should be addressed.
Submission received: 10 October 2022 / Revised: 8 November 2022 / Accepted: 9 November 2022 / Published: 14 November 2022
(This article belongs to the Special Issue Soil Erosion: Dust Control and Sand Stabilization, Volume II)

Abstract

:
In this study, the effectiveness of biodegradable food processing by-products (chicory vinasses, corn steep liquor, decantation syrup, and palatinose molasses) as dust suppressants on mine soils has been precisely quantified using controlled laboratory experiments and field trials. Laboratory experiments using a wind tunnel indicate that rainfall intensity and repetitive wetting and drying cycles affect the by-products’ effectiveness. In addition, field trials conducted using soil plots at an open-pit lignite mine (Germany) demonstrate that the tested biomaterials can effectively reduce dust emissions under field conditions, despite the fact that rainfall led to the leaching of the applied biomaterials, decreasing the additives’ concentrations on the soil surface and impairing the materials’ effectiveness to suppress wind erosion. Thus, food processing by-products may be used for short-term dust mitigation at mine sites and represent environmentally benign alternatives to dust control chemicals detrimental to the environment.

1. Introduction

Dust suppressants effectively mitigate particulate matter emissions from exposed mine soils by changing the physical properties of soil surfaces [1]. Their effectiveness and durability are decisively impacted by environmental factors such as precipitation, radiation or the presence of microorganisms. For example, heavy rainfall can significantly impair the performance of ligninsulfonates, which are widely applied as non-traditional dust suppressants, due to their water solubility [2]. Exposure to ultraviolet radiation causes photo-oxidation of polymer-based reagents, where polymer chains cleave into smaller segments, resulting in deterioration of the mechanical properties [3]. Biogenic amendments (e.g., biopolymers or molasses), in turn, can be naturally decomposed by microorganisms. Carbohydrates and proteins are recognized as food sources and are split into oligomers, dimers, and monomers by microorganisms’ intra- and extracellular enzymes [4]. Hence, field trials are imperative to evaluate the actual performance of dust suppressants and to enable an appropriate product selection for applications at mine and mineral processing sites. A variety of field studies (e.g., [5,6,7]) have examined the effectiveness of dust suppressants on heavily trafficked surfaces such as unpaved roads. However, there is a lack of experimental research investigating the effects of amendments on reducing wind-blown dust emissions from exposed mine soils under field conditions [8].
Currently applied and investigated dust suppressants (e.g., electrochemical products, magnesium chloride, ligninsulfonates, biopolymers) have limitations and disadvantages, such as high product prices, detrimental effects on the environment, insolubility in cold water, or yielding viscous solutions at low concentrations [9,10,11,12]. Food processing wastes and by-products may pose sustainable alternatives to established dust suppressants. They are usually inexpensive, readily available and generated in high volumes [13,14,15]. Moreover, many of these materials are biodegradable and contain carbohydrates and proteins, which provide techno-functional properties to bind single soil particles [14]. A study has recently shown that wastes and by-products from the food industry can enhance the unconfined compressive strength of soils, which indicates an improved wind erosion resistance and thus an enhanced dust control effectiveness [16]. Freer et al. [16] concluded that among the biomaterials studied, chicory vinasses, corn steep liquor, decantation syrup, and palatinose molasses have the highest potential to be applied as dust suppressants. In a follow-up study, Freer et al. [17] conducted laboratory-based wind tunnel tests and demonstrated that these biomaterials could indeed effectively mitigate wind-induced soil losses. Even though these results are promising for the actual application of wastes and by-products from the food industry as dust suppressants on mine soils, the study did not consider abiotic (e.g., radiation, water) and biotic factors (e.g., bacteria), which may diminish the effectiveness of reagents to reduce dust emissions [5]. Rainfall, in particular, may be a controlling factor on the amendments’ effectiveness because water-soluble reagents can be leached from the surfaces of treated soils and substrates.
This study aimed to evaluate the effectiveness of four biodegradable by-products from the food industry (chicory vinasses, corn steep liquor, decantation syrup, and palatinose molasses) in reducing dust emissions from mine soils. The effectiveness of dust suppression from soils is defined herein as the degree to which by-products from the food industry successfully reduce wind erosion from a selected sandy mine soil as measured with and without dust control. Laboratory experiments were performed to study the effects of rainfall intensities and wetting–drying cycles on the wind erosion resistance of treated soil surfaces. In addition, field trials were conducted to establish the effectiveness of applied biomaterials under actual field conditions that are indicative of possible commercial-scale application and practice. For this study, a low-cost and low-maintenance experimental setup was applied that is feasible for remote and difficult-to-access areas and allows various dust control products to be tested. Thus, this research extends our knowledge of the application of biodegradable dust suppressants on mine soils and supports the implementation of sustainable dust control measures at mine and mineral processing sites.

2. Materials and Methods

2.1. Mine Soil

Test substrate used in this study was sampled from a sand and gravel pit in North-Rhine Westphalia, Germany. According to DIN EN ISO 14688-1:2018-05 [18], the mine soil can be classified as medium-coarse sand (D50 = 0.65 mm). X-ray diffraction analysis indicated that the sand is dominated by quartz, with minor amounts of orthoclase, microcline and clinochlore. Detailed material characterization of the test substrate can be found in Freer et al. [16].

2.2. By-Products from the Food Industry

Four by-products from the food industry were investigated as dust suppressants. Each reagent is biodegradable and readily soluble in water. Further information on the tested biomaterials can be taken from Freer et al. [17].

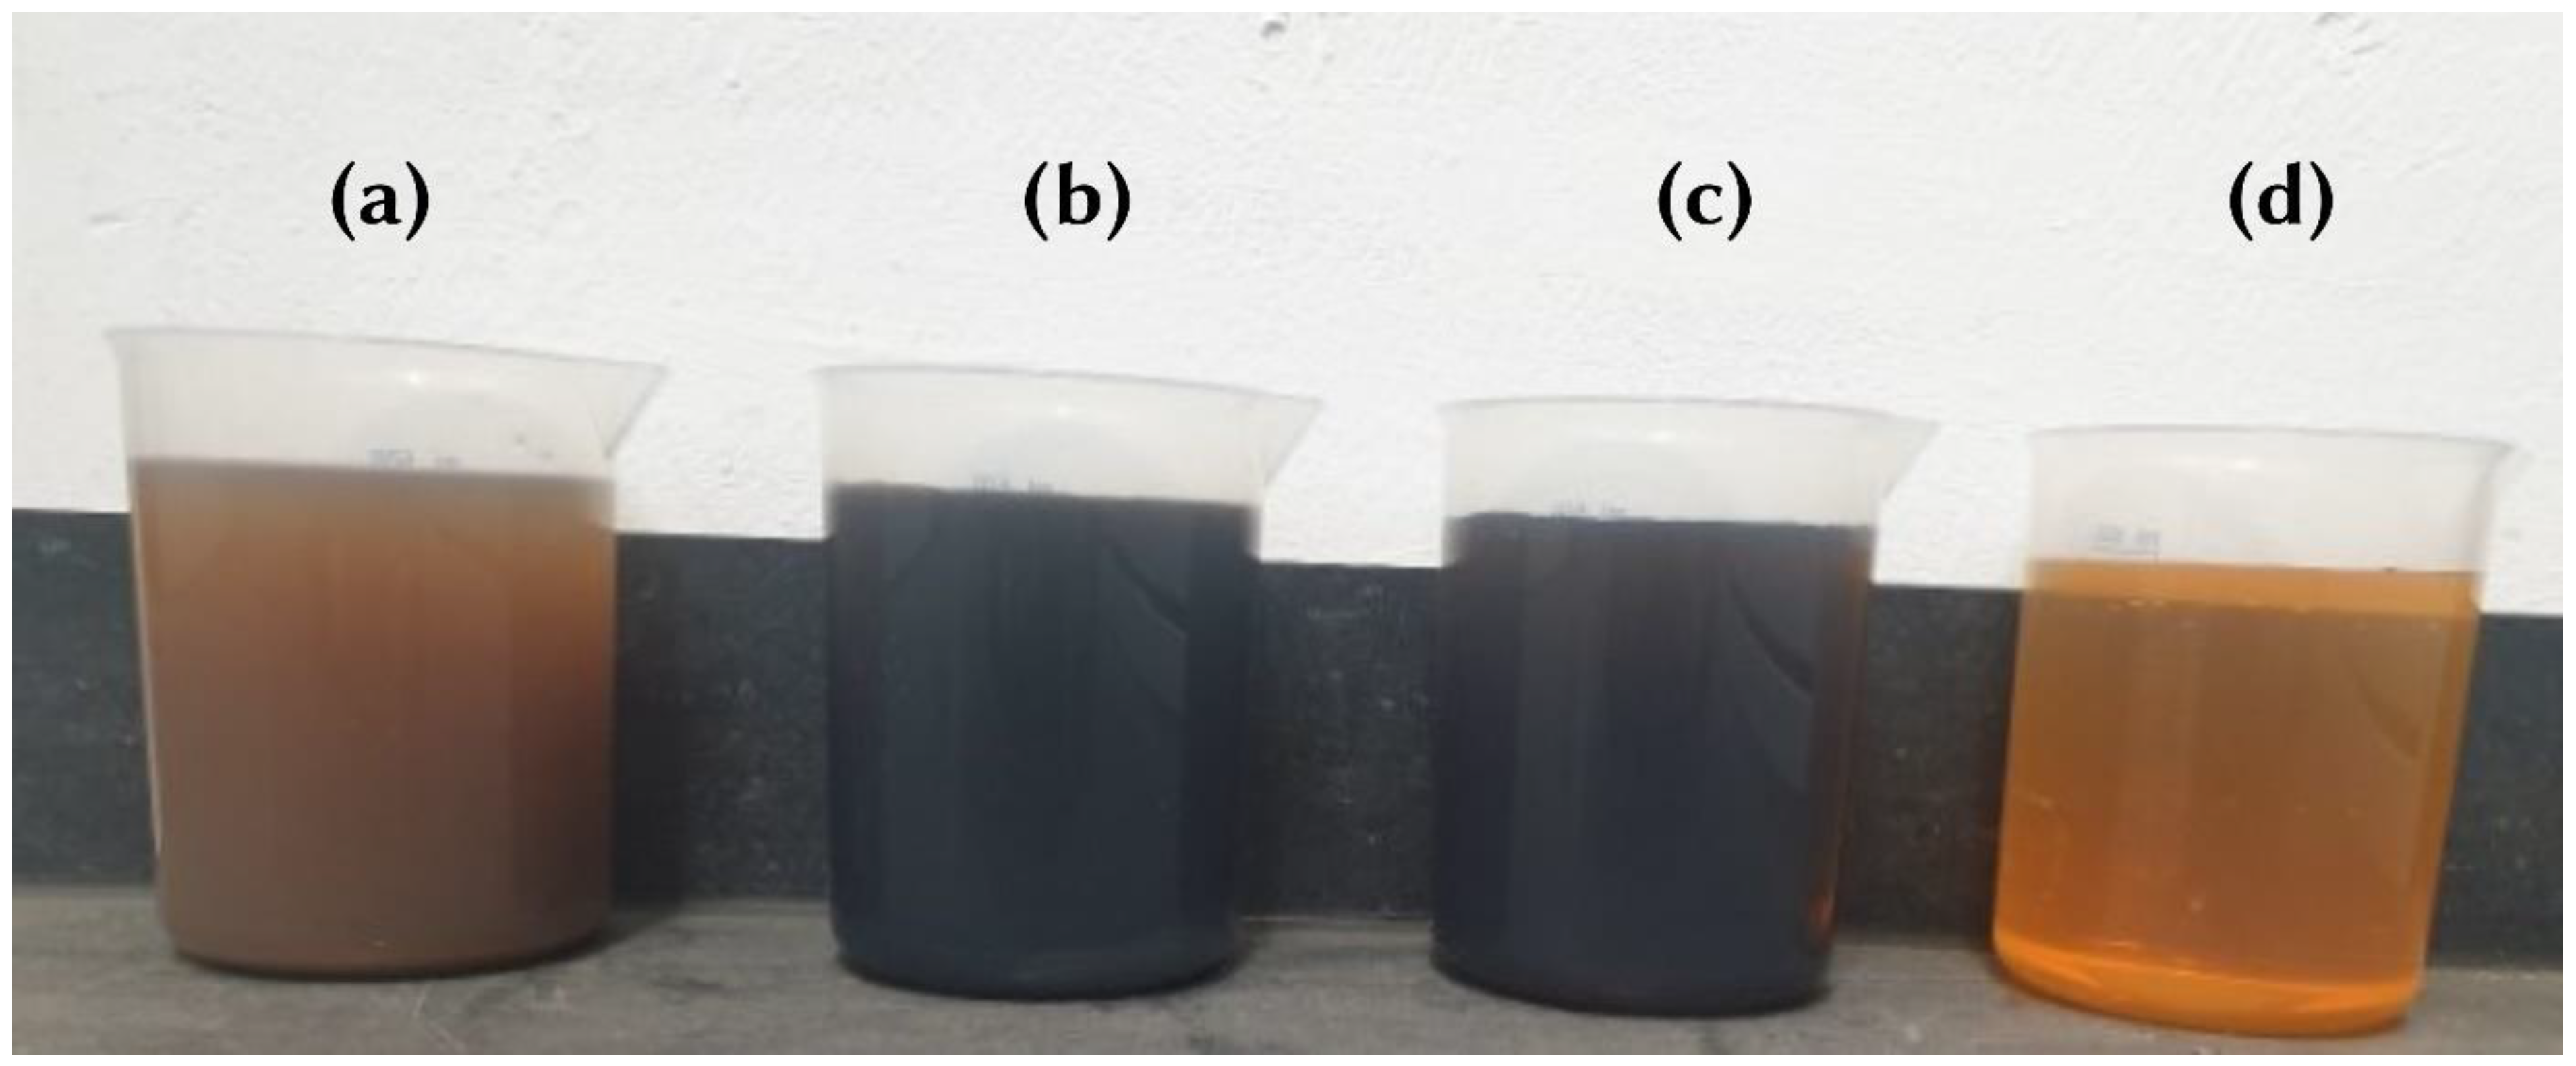
2.2.1. Chicory Vinasses

Chicory vinasses is a viscous liquid obtained as a by-product during inulin and oligofructose production from chicory. Its dry matter (DM) content is 63.3%, crude protein being the main component (45–51% of DM). Samples of chicory vinasses were acquired from BENEO-Orafti S.A., Tienen, Belgium [16].

2.2.2. Corn Steep Liquor

Corn steep liquor is a by-product of the steeping process of corn and has a DM content of 27.0%. DM components are crude protein (36–49% of DM), starch, reducing sugars and crude fiber. Cargill Deutschland GmbH, Düsseldorf, Germany supplied samples of corn steep liquor [16].

2.2.3. Decantation Syrup

Decantation syrup is obtained as a viscous liquid during the production of candy sugar and has a DM content of 72.0%. Its DM consists mainly of sucrose, besides small amounts of fructose, glucose, and oligosaccharides. BENEO-Orafti S.A. provided samples of decanter syrup [16].

2.2.4. Palatinose Molasses

Palatinose molasses is the concentrated liquid fraction from the isomaltulose production from sugar beets and has a DM content of 68.2%. DM components are isomaltulose and trehalulose (>50% of DM) and sucrose, isomaltose, fructose and glucose (28–42% of DM). Samples of palatinose molasses were acquired from BENEO-Orafti S.A. [16].

2.3. Laboratory Experiments

2.3.1. Materials

Selected biomaterials were dissolved in pure water to their specific concentration using a magnetic stirrer to prepare homogeneous solutions (Figure 1). Chosen reagent concentrations are shown in Table 1. It should be noted that the reagent concentration is referred to as the dry matter content of the additive. The specific concentration of each additive and its application rate were selected based on Freer et al. [17] who identified the optimum parameters, whereby a further increase in concentration and application rate has an insignificant effect on the biomaterial’s effectiveness to reduce dust emissions.
Three soil replicates were prepared for each wind erosion test to evaluate the precision of measured soil losses, while dry, untreated soil was selected for control samples to determine the applied biomaterials’ quantitative dust control effectiveness. The prepared solutions were then sprayed on soil surfaces according to their specific application rate (Table 1). In order to ensure consistent solution application covering the entire soil surfaces and to prevent any disturbance of soil surfaces, the solutions were carefully applied with a hand-held trigger sprayer. As other studies have stated (e.g., [19]), the effective performance of dust suppressants requires careful and uniform product application. Prior to wind tunnel experimentation, prepared soils were air-dried for seven days at ambient laboratory temperature.

2.3.2. Experimental Methodology

Wind erosion tests were performed using a laboratory wind tunnel at the Institute of Mineral Resources Engineering, RWTH Aachen University, Germany (Figure 2). This facility has already been used for evaluating the effectiveness of biogenic dust suppressants [17]. Sample trays were placed centrally in the test section and exposed to a laminar airflow of 13.57 m/s for 120 s.
In subsequent laboratory experiments, treated soil surfaces were investigated to find whether different rainfall intensities and repetitive wetting-drying cycles impact the dust control effectiveness of the investigated biomaterials. Four different rainfall intensities were tested: (a) 0.25 L/m2, (b) 1 L/m2, (c) 2 L/m2, and (d) 4 L/m2. For this, pure water was applied on the soil surfaces using a hand-held trigger sprayer. The first application of water was carried out seven days after applying biomaterials. Then, individual samples were moistened with their chosen rainfall intensities (wet–dry cycle 1) and stored in a room at ambient temperature. After seven days of drying, the specimens were tested again in the wind tunnel and then wetted once again (wet–dry cycle 2). The same procedure was used for the following three wet–dry cycles (3–5). The sample tray was weighed before and after each measurement using a PES 4200-2M (Kern & Sohn, Balingen-Frommern, Germany) with a resolution of 0.01 g. Untreated mine soil was selected as a control to calculate the dust control effectiveness for each experimental setup. Quantitative dust control effectiveness is therefore defined as the ratio of total weight loss between treated and untreated mine soil after four wet–dry cycles. Statistical analysis of measured soil losses included calculating arithmetic mean and standard deviation values.

2.4. Field Trials

2.4.1. Test Site and Materials

A field test site was established at an open-pit lignite mine in North Rhine-Westphalia, Germany (Figure 3c), where field experimentations were conducted between July and August 2020. Initially, the test site was cleared of vegetation and topsoil. Then, 18 test plots were constructed using wooden frames (length 700 mm, width 400 mm, height 56 mm) and geotextile fabric, which was attached to the bottom surface of each frame to separate the test substrate from the underlying soil and to allow for water drainage (Figure 3a). Then, each test plot was filled with mine soil up to the top of each wooden frame. Each soil surface was then levelled, and finally, soil surfaces were treated with selected additives. The reagent solutions’ preparation and application on the substrate surface were identical to the procedure described in Section 2.3.1. Untreated mine soil and soil only treated with water were set up as a control group to establish the dust control effectiveness of selected biomaterials.
Three measurement series were carried out on each sampling day to determine the average background particulate matter concentration at the test site (cf. Table A4, Appendix A). Meteorological data were obtained from a nearby weather station for the duration of the study (12:00, 17 July 2020–12:00, 14 August 2020). Daily mean data included temperature (°C), solar radiation (W/m2), humidity (%) and precipitation (L/m2). A summary of the recorded meteorological data is given in Table A1, Appendix A. The lowest daily mean temperature for the study period was 16.04 °C, with the highest daily mean temperature of 28.04 °C. In total, a precipitation amount of 39.44 L/m2 was measured. The highest rainfalls were recorded at 9, 23, 26 and 27 days after soil treatment with 4.8 L/m2, 4.25 L/m2, 17.48 L/m2, and 8.84 L/m2, respectively.

2.4.2. Experimental Methodology

To simulate wind erosion events, a commercially available electric blower was repetitively applied to each treated soil plot surface, and dust measurements were carried out at particular times over a period of 28 days. At each test plot, suspended dust concentrations were measured 3, 7, 14, 21 and 28 days after substrate treatment, whereby PM2.5, PM10, and total suspended particle (TSP) concentrations were determined in the air (i.e., mg per m3), using a DustTrak DRX 8533 from TSI with a log interval of 1 s. The DustTrak DRX 8533 records aerosol concentrations in a range of 0.001–150 mg/m3 (±0.1% of reading). Isokinetic sampling was applied to avoid biased measurements of particulate concentration, using a 90-degree bent tubing with a streamlined inlet. A 2 mm inlet diameter was selected to match the probe inlet velocity to the generated airflow velocity. The isokinetic probe was placed centrally opposite the applied wind direction at the height of 450 mm above the wooden frame (Figure 3b). The duration of each measurement was 60 s, whereby the test plot surface was subjected to a continuous airstream from the electric blower for 45 s, which generated a constant wind speed of 14.65 m/s (i.e., 52 km/h). The wind speed was measured using an anemometer positioned at the test plot end. However, it should be noted that such blowers generate a turbulent flow and do not meet the aerodynamic criteria of portable field wind tunnels, simulating the atmospheric flow causing natural wind erosion [20]. Consequently, the measured dust emissions do not equate to dust emissions caused by natural wind erosion. Measured particulate matter concentrations were initially analyzed for the presence of outliers and extreme values using box-plot graphics. Implausible or illogical values (e.g., negative values) were removed from the data set before the mean concentration of TSP, PM10, and PM2.5 were calculated. In addition, photographic images were taken before and after each measurement to document changes in the soil plot surfaces.

3. Results

3.1. Laboratory Testing

3.1.1. Effect of Rainfall Intensities on Wind-Induced Soil Losses

The wind-induced soil losses of samples treated with different biomaterial solutions and wetted with four varying rainfall intensities are shown in Figure 4. Each bar represents the calculated mean from triplicates and indicates the total weight loss (TWL) after four wet–dry cycles. Prior to the first wet–dry cycle, soil treated with chicory vinasses, corn steep liquor, decantation syrup, and palatinose molasses showed only negligible weight losses of 0.09 g (SD = 0.02), 0.12 g (SD = 0.16), 0.04 g (SD = 0.01), and 0.03 g (SD = 0.01), respectively. From Figure 4, it can be seen that wetting of samples increased mass losses at any investigated rainfall intensity. Samples treated with chicory vinasses can be considered the most susceptible to wind erosion, showing the highest mass losses at a rainfall intensity of 0.25 L/m2 with a TWL of 63.04 g. Samples treated with corn steep liquor, decantation syrup, and palatinose molasses were less prone to wetting and peaked in mass losses at a rainfall intensity of 0.25 L/m2 with a TWL of 4.38 g, 2.79 g, and 13.52 g, respectively. By comparison, untreated soil has a TWL of 125.28 g (SD = 19.34) after four measuring cycles.
Mass losses of each biomaterial-treated soil wetted with higher rainfall intensities (1–4 L/m2) were significantly lower than those moistened with only 0.25 L/m2. With increasing rainfall intensity, the TWL of soil treated with chicory vinasses decreased to 5.35 g (1 L/m2), 0.6 g (2 L/m2), and 2.12 g (4 L/m2), respectively. Corn steep liquor behaved similarly and showed a reduced TWL of 1.24 g (1 L/m2), 0.7 g (2 L/m2), and 2.38 g (4 L/m2). By contrast, all soil samples treated with decantation syrup and palatinose molasses had a TWL of <1 g. A summary of the laboratory test data is shown in Table A2, Appendix A.

3.1.2. Effect of Wet–Dry Cycles on Wind-Induced Soil Losses

Figure 5 depicts the effect of wet–dry cycles on wind-induced soil losses of biomaterial-treated sand wetted with different rainfall intensities. Each bar represents the calculated mean of three replicates. It is apparent from the diagrams (Figure 5a–d) that (i) the soil losses varied for each wet–dry cycle and rainfall intensity, and (ii) the biomaterials behaved differently. Chicory vinasses and corn steep liquor showed similar characteristics at a rainfall intensity of 0.25 L/m2. The lowest soil losses occurred after the first wet–dry cycle, while a considerable increase was observed after the fourth. Samples treated with decantation syrup behaved slightly differently, whereby the soil losses achieved their minimum at wet–dry cycle 3 and its peak at wet–dry cycle 4. By contrast, the weight losses of palatinose molasses-treated soil peaked at wet–dry cycle 1, then decreased and subsequently increased at wet–dry cycle 4 (to a similar level to wet–dry cycle 1). At higher rainfall intensities (1–4 L/m2), the mass loss data followed no clear trend. Either the soil losses per wet–dry cycle did not differ significantly, or there were isolated outliers. In part, samples showed almost no soil losses with increasing wet–dry cycles. A summary of the soil loss data after each wet–dry cycle is given in Table A3, Appendix A.

3.2. Field Trials

3.2.1. Measured Dust Concentrations

Figure 6 illustrates the concentrations of dust particle sizes (PM2.5, PM10, TSP) measured for soils treated with different biomaterial solutions. Each bar represents the calculated mean value from triplicate analyses. The data demonstrate that mine soils treated with any of the biomaterials showed a significant reduction of dust emissions after 3 days. With increasing exposure time, dust emissions increased steadily and peaked 21 days after the solutions were applied. By comparison, the data of water-treated and untreated mine soil show a different trend. The highest dust emissions were recorded on day 3 and continued to decline subsequently. In some cases, dust emissions of the control group (i.e., water-treated and untreated mine soil) achieved lower PM concentrations than treated soil samples. For example, untreated mine soil emitted less dust emissions from day 21 onwards than all test plots prepared with biomaterials.
The peak values of biomaterial-treated plots were significantly lower than those of the control group (i.e., water-treated and untreated soil). For untreated soil, PM10 emissions amounted to 59.026 mg/m3 (PM2.5: 32.078 mg/m3, TSP: 77.075 mg/m3). Soil treated with pure water achieved a PM10 concentration of 27.649 mg/m3 (PM2.5: 20.981 mg/m3, TSP: 39.176 mg/m3). By contrast, applications of palatinose molasses and corn steep liquor produced a decrease of PM10 emissions to 5.003 mg/m3 (PM2.5: 3.152 mg/m3, TSP: 8.482 mg/m3), and 3.184 mg/m3 (PM2.5: 2.351 mg/m3, TSP: 5.169 mg/m3), respectively. In comparison, chicory vinasses and decantation syrup reduced PM10 emissions to 2.148 mg/m3 (PM2.5: 1.863 mg/m3, TSP: 2.697 mg/m3), and 1.756 mg/m3 (PM2.5: 0.900 mg/m3, TSP: 2.896 mg/m3), respectively. Among the investigated biomaterials, decantation syrup demonstrated the highest effect on reducing PM2.5 and PM10 emissions after 21 days, while chicory vinasses was the most effective additive in suppressing TSP emissions. The lowest dust emissions were measured for all soil plots, including the control group (i.e., water-treated and untreated mine soil), 28 days after soil treatment. A summary of the mean dust particle concentrations in air as detected during the field trial from variously treated mine soils is shown in Table A4, Appendix A.

3.2.2. Visual Inspection of Soil Surfaces

Figure 7 illustrates the typical surface characteristics of eroded soils as observed during the field trials. Surfaces of the control group (i.e., water-treated and untreated mine soil) and the treated soil samples changed differently over time. Soil surfaces prepared with food processing by-products showed minor indications of wind erosion (i.e., disturbance of soil surfaces, removal of smaller soil particles) after 14 days and 21 days, respectively, without any significant changes in horizontal soil thickness (Figure 7b). By contrast, plots with water-treated and untreated soil formed a conical-shaped depression that expanded slightly in depth over time (Figure 7a). The highest soil losses were observed at the beginning of the study. Almost all test plots indicated wildlife tracks that can be attributed primarily to birds. One of the water-treated plots had to be removed from the field trial after seven days because it was extensively damaged. On day 28, all specimens appeared to have a high moisture content, and their surfaces showed visible traces of raindrops and thus were exposed to obvious rainfall events.

4. Discussion

4.1. Laboratory Experiments

Results of this study demonstrate that exposure of treated mine soils to different rainfall intensities influenced the amount of soil loss. In particular, increasing rainfall intensities from 0.25 to 4 L/m2 led to decreasing soil losses (Figure 4). Possible explanations for this reduced wind erosion might be that greater amounts of applied water led to greater particle cohesion in treated mine soils, or that the infiltrated water had not completely evaporated. As shown in several studies (e.g., [21,22,23,24,25]), higher moisture content improves soil cohesion and thus the resistance to wind erosion. The increase in soil cohesion can be attributed to adsorptive and capillary forces [25,26]. Regardless, it appears that more water retained in the soil samples improved the inter-particle bonding. This effect might be intensified by the food processing by-products as they consist of carbohydrates and proteins, which can augment the water retention capacity of soils and retard moisture loss from soils [27,28].
By contrast, exposure of treated samples to repeated wet–dry cycles resulted in increased soil losses and thus reduced the effectiveness of tested food processing by-products to suppress dust emissions (Figure 5). It appears that water applied at frequent intervals leached the water-soluble amendments from the substrates to such an extent that it reduced the cohesion between soil particles. This created soil surfaces that were less resistant to aerodynamic lift forces and saltation bombardment, resulting in higher soil losses. In fact, saltating sand grains are mainly responsible for aeolian dust entrainment [29,30,31]. Further analysis of the soil loss data (Table A2, Appendix A) reveals differences between the food processing by-products in their susceptibility to leaching. While chicory vinasses showed the highest soil losses, palatinose molasses, corn steep liquor and decantation syrup were less prone to leaching. Such different responses to wetting and rainfall intensities may be explained by the composition of the tested additives. The chosen biomaterials comprise mixtures of carbohydrates and proteins, which have different affinities to water molecules. Mono- and disaccharides provide multiple hydroxyl groups that form hydrogen bonds with water [32]. Structural features such as branching structure, charged groups and, molecular weight affect the solubility of polysaccharides, which can promote or hinder intra- and intermolecular association [33]. Protein solubility is primarily influenced by the hydrophobic and hydrophilic amino acid residues exposed to water [34,35]. However, it is not possible to explain why some biomaterials are more water-soluble than others because the exact material compositions are not accessible.

4.2. Field Trials

Field experiments are subject to interferences that need to be considered when interpreting and comparing the effectiveness of dust suppressants. The test site is located close to an open-pit mine and to other sources of PM (e.g., unpaved roads), which could have led to dust deposition between measurements. However, it can be expected that such an additional dust input would have impacted all soil plots in a similar manner. Observed physical impairments of soil plot surfaces caused by wildlife may also be a potential source of error (Figure 7b). Disturbances affect the erodibility of soil surfaces and thus the generation of dust emissions [36,37]. Consequently, results should be interpreted cautiously as to which amendments were most effective in suppressing dust emissions.
Conducted field trials demonstrate that investigated food processing by-products can significantly reduce wind erosion and dust emissions (PM2.5, PM10, and TSP) from coarse mine soils (Figure 6). The observed decrease in dust emissions is likely attributed to carbohydrates and proteins contained in the tested amendments, which agglomerate soil particles through adhesive and cohesion forces. The aforementioned carbohydrates and proteins likely bind to soil particles upon evaporation of applied solutions. The resulting improvement in inter-particle bonding enhances the soil’s mechanical properties, creating a surface with a higher erosion threshold [16].
Field trial data also demonstrate that dust emissions from soil plots treated with food processing by-products progressively increased with time. Such a decrease in dust suppression effectiveness probably resulted from reactions at the soil surface, which weakened the bonding between soil particles and thus reduced the resistance to wind erosion. It is assumed that rainfall during the study period (Table A1, Appendix A) resulted in the leaching of the amendments from the soils since they are water-soluble. However, visual inspections of the treated soil plots show intact surfaces unlike that of the untreated soil (Figure 7). Hence, natural rainfall did not impact on the integrity of treated soil surfaces, allowing amendments to bind surficial soil particles and prevent their erosion.
By contrast to the treated soil plots, dust emissions from the untreated mine soil and mine soil treated only with water constantly decreased with time (Figure 6). These trends can be explained by the observed changes in surface textures (Figure 7a,b) and the experimental setup. Near-surface wind velocity is crucial for the dynamics of wind erosion [38]. Soil particles are detached and transported when the aerodynamic drag and lift forces exceed the gravitational and inter-particle forces [39]. Moreover, dust particles are entrained by the impact of saltating sand grains [29]. During the study period, erosion of the control group plots formed conical-shaped depressions and changes in horizontal soil thickness (Figure 7a). In parallel, the position and orientation of the electric blower did not change. Hence, it is assumed that the wind velocity at the soil surface decreased over time, which reduced the forces available to erode soil and consequently dust emissions from water-treated and untreated soil plots.
At the end of the field trial (i.e., after 28 days), the lowest dust concentrations in air were measured for all soil plots, including the control group. From the meteorological data (Table A1, Appendix A), it can be concluded that previous rainfall (i.e., 27.7 L/m2 between days 25–27) significantly increased the moisture content of the soil. Soil moisture directly contributes to soil cohesion and substantially affects the resistance to wind erosion [21]. It is generally recognized that an increase in inter-particle forces is induced by the absorbed water film and capillary forces [26]. However, Ravi et al. [40] state that capillary forces are mainly responsible for increasing cohesion forces in sandy soils, and water adsorption around the soil particles can be neglected when the soil is relatively wet.
Only a few studies have conducted field experiments simulating wind erosion on exposed mine soils treated with biodegradable reagents. Hence, only limited field trial data on dust suppressants exist to compare the study results. Chang et al. [41] have already stated a lack of studies evaluating the durability and reliability of biopolymers for geotechnical applications (i.e., dust control, soil stabilization, erosion control) under field conditions. For example, Park et al. [42] tested two biocompatible polymers, polyethylene glycol and poloxamer, to suppress wind-blown dust emissions from a bauxite tailings substrate. Their experiments showed that polyethylene glycol and poloxamer solutions could reduce PM10 emissions by up to 44% and 66%, respectively, compared to water-treated samples. Katra [8] demonstrated similar performances for calcium lignosulfonate and tree resin on bedding substrate used for unpaved roads in a calcareous quarry. Conducted wind tunnel experiments indicated a 63% and 53% reduction in PM10 emissions from lignosulfonate and tree resin solutions, respectively, compared to untreated samples [8]. However, only limited conclusions can be drawn due to partially substantial distinctions in experimental design, substrate type, climatic conditions, and other factors. Regardless, the chosen food processing by-products displayed a distinct ability to suppress PM emissions in the field (Figure 6).

4.3. Possible Applications of Food Processing By-Products as Dust Suppressants at Mine Sites

4.3.1. Technical Aspects

The present study demonstrates that food processing by-products can considerably suppress dust emissions from sandy mine soils (Figure 6). However, the results also demonstrate that the tested biomaterials are more likely to be used only for temporary or short-term dust control practices due to their susceptibility to be leached from soil surfaces upon rainfall events and possible degradation in the environment. Factors that may contribute to the degradation of biomaterials include solar radiation, heat, abiotic oxidation, biotic reactions of microorganisms and saltating soil particles’ impact force [1,5,43,44,45]. Repetitive application of the amendments to mine soils may counteract their diminishing dust control effectiveness over time.
Considering their water-solubility, tested amendments could either be sprayed on substrate surfaces or incorporated into mine soils, which is usually applied on traffic areas [1]. This method involves higher single application costs but extends the service life of treatments [46,47]. However, it appears challenging to exploit this durability benefit due to the amendments’ susceptibility to leaching and biodegradability.
The fact that the tested reagents could likely be applied using existing application equipment (e.g., water trucks with spray bars) already available at many mine sites is promising. The biomaterials readily dissolve in water and have not notably impaired the rheology of the aqueous solution. By contrast, thermal-gelling biopolymers, such as gellan gum or agar gum, require heated water to be dissolved or applied, respectively, and yield highly viscous solutions even at low concentrations [11,12]. As Chang et al. [41] already stated, any application equipment may need to be modified or developed considering the rheological properties of biopolymers.
The tested biomaterials contain carbohydrates and proteins, which promote seed germination and plant growth and serve as sources of energy for soil bacteria [48,49]. Therefore, an application of food processing by-products can provide nutrients to plants while simultaneously stabilizing the soil surface until the vegetation cover has been developed. Hence, the use of food processing by-products in mine closure and mine site rehabilitation activities might also support revegetation efforts of mined lands.

4.3.2. Financial Considerations

The application of food processing by-products as dust suppressants appears to have financial benefits compared to commercially available biopolymers. By-products from the food industry are usually inexpensive, generated in high volumes, and readily available [13,14,15]. Chicory vinasses, for example, is priced at less than 100 USD/t (data according to the supplier). By contrast, the biopolymer xanthan gum, extensively investigated for soil stabilization and wind erosion control in previous studies, ranges in price from 1500 to 4000 USD/t [41,50]. However, growing demand for biopolymers and the associated increase in production volume are expected to reduce biopolymer prices in the future [41,50,51].
Specific emphasis should be paid to equipment operating costs, which can frequently escalate the total costs of dust suppression [52]. Here, significant cost drivers include the suppressants’ durability and their related re-application intervals required to sustain a sufficient level of dust control [46]. Compared to biopolymers, tested biomaterials will likely need shorter re-application intervals because rainfall may leach them from surface substrates more easily. Some biopolymers have thermal-gelation properties, such as gellan gum or agar gum, which only dissolve entirely in hot water [53]. Likewise, proteins (e.g., casein) with lower hydrophilicity probably provide higher resistance to rainfall and subsequent leaching [54]. However, a reliable cost-effectiveness assessment requires further research, considering biomaterials durability, application intervals and application rates. One possible approach to progress this knowledge would be the economic evaluation model developed by Thompson and Visser [46], which enables the costing of the establishment, application and maintenance activities associated with the use of dust suppressants.

4.3.3. Environmental Issues and Implications

Even though this study shows encouraging results for applying food processing by-products as dust suppressants, potential adverse effects and issues associated with the future application on mine soils need to be considered. Rainfall events could leach the tested biomaterials through soils to receiving ground and surface waters, adding an organic load to aquatic ecosystems [9,55]. Organic matter decreases dissolved oxygen concentration in freshwater bodies due to bacteria and other microorganisms’ growth, resulting in stresses on aquatic life [56]. Also, carbohydrates and proteins in the tested reagents could attract animals and insects or cause problems with mould growth on the treated surface or inside the application equipment [7,57].
If such amendments are applied to tailings surfaces, further problems could arise. Recycled water from tailings storage facilities may contain appreciable concentrations of dust suppressant residues, which could adversely affect mineral processing methods such as flotation due to reactions with other reagents [42]. Park et al. [42] also remarked that polymers could impair tailings ponds stability because of augmented water retention and associated changes in substrate properties (e.g., pore pressure).

4.4. Outlook

Any comparison of field trial data on dust suppressants is hampered by the fact that different studies pursue individual experimental designs and measurement methods. Hence, there is a clear need for standardized simulated dust suppression tests that provide information that can be used to predict dust emissions from soils. Such a method would be used to determine probable dust dispersion and develop cumulative dust emission and suppression data to support mine permit application requirements. Those methods could also be tools to generate data used to design and implement best management practices and treatment processes needed by mining operations to meet compliance requirements.
In the mining industry context, a standard testing methodology should be feasible in remote and relatively inaccessible areas (e.g., tailings sites), easy to implement and allow for comparative sampling of various dust control products with minor financial and personnel requirements. Accordingly, experimental setups with field boundary layer wind tunnels, usually used to quantify dust emissions from soils, are not expedient because they are difficult to transport, labor-intensive and pose substantial methodological challenges [58,59].
By contrast, methodologies adopting soil plots eroded with commercial electric blowers do pose suitable alternatives, even though measured dust emissions do not reflect dust emissions caused by natural wind erosion since electric blowers do not simulate the atmospheric flow. Those experiments can establish the effectiveness of dust suppressants over different test intervals at locations where they are intended to be applied, indicative of possible commercial-scale application and practice [59]. Moreover, such field trials are easy to conduct and enable cost-effective and low-maintenance testing of various soil treatments with replicates. Future steps that need to be taken to establish a standardized methodology are (i) harmonization of experimental parameters (e.g., applied wind speed, exposure time to simulated wind erosion) and sample preparation, and (ii) definition of requirements on electric blowers (e.g., outlet diameter), dust monitors and test site. It is also recommended to compare measurements of the proposed methodology with the portable in situ wind erosion lab (PI-SWERL) concept. The PI-SWERL is a cost-effective method to assess the potential of soil surfaces to generate dust emissions and correlates with traditional wind tunnel tests [60].

5. Conclusions

This study investigated the effectiveness of four biodegradable by-products from the food industry in suppressing fugitive dust emissions from mine soils. The following main conclusions can be drawn:
  • Carbohydrate- and protein-rich by-products from food processing reduce PM emissions from sandy mine soils as tested in the laboratory and field trials, indicating their potential to be applied as dust suppressants at mine and mineral processing sites.
  • Rainfall impairs the effectiveness of tested biomaterials due to progressive leaching and loss of the amendments from treated soils. While rain may decrease the additives’ concentration in surface layers, treated soil surfaces remain physically intact.
  • Soil loss data from laboratory tests indicate that biomaterials’ effectiveness decreases with repetitive wet–dry cycles. Exposure of treated mine soils to increasing rainfall intensities led to decreasing soil losses, possibly due to enhanced inter-particle bonding, incomplete evaporation of infiltrated water or the augmented water retention capacity of the soil.
  • There is a clear need for standardized simulated dust suppression tests.
In conclusion, this study demonstrates that food processing by-products can be used for short-term dust mitigation at mine and mineral processing sites. Their application as dust suppressants would reduce dust control expenses and diminish chemical products detrimental to the environment.

Author Contributions

Conceptualization, J.F., J.L.S. and M.B.; methodology, J.F. and J.L.S.; formal analysis, J.F.; investigation, J.F. and M.L.; data curation, J.F.; writing—original draft preparation, J.F.; writing—review and editing, J.F., J.L.S. and B.G.L.; visualization, J.F.; project administration, J.F. All authors have read and agreed to the published version of the manuscript.

Funding

This research received no external funding.

Institutional Review Board Statement

Not applicable.

Informed Consent Statement

Not applicable.

Data Availability Statement

The data that support the findings of this study are available from the corresponding author, upon reasonable request.

Acknowledgments

The authors would like to thank the anonymous reviewers for their helpful comments and suggestions.

Conflicts of Interest

The authors declare no conflict of interest.

Appendix A

Table A1. Meteorological data for the study site and study period (12:00, 17 July 2020–12:00, 14 August 2020).
Days after ApplicationDateTemperature (°C)Humidity (%)Global Radiation (W/m2)Precipitation (L/m2)
MinMaxMean
017.07.2018.6121.8420.1068.48217.510.01
118.07.2012.9027.5621.2165.89292.440.29
219.07.2015.2128.3022.2459.82278.160.08
320.07.2014.3322.4817.7868.82135.690.00
421.07.2010.0421.7816.0462.25306.560.05
522.07.209.8022.0616.3762.31293.560.00
623.07.209.3525.8918.6956.23310.890.18
724.07.2017.2924.8420.4658.70202.740.02
825.07.2014.9425.3021.0564.87109.040.21
926.07.2016.0423.2519.5372.65220.624.80
1027.07.2012.8730.2521.4058.40175.060.74
1128.07.2016.4623.6320.4557.46222.270.01
1229.07.2013.1923.3918.2959.13267.380.04
1330.07.2010.6028.2220.0755.16298.250.04
1431.07.2015.1535.5625.7842.94309.940.06
1501.08.2021.4630.9525.4355.01205.480.67
1602.08.2016.9223.9220.3363.76191.840.01
1703.08.2010.9923.2717.7361.83202.760.09
1804.08.2012.9823.3317.7960.71279.160.02
1905.08.2012.3930.3721.7944.47300.260.03
2006.08.2017.1731.6724.8239.82290.720.02
2107.08.2016.9133.9826.5241.35293.580.07
2208.08.2017.5435.8428.0442.61282.540.03
2309.08.2021.2733.2025.0858.56114.014.25
2410.08.2019.0933.4426.7458.13242.120.02
2511.08.2021.6334.4226.6557.93179.421.38
2612.08.2019.8631.6823.6875.36182.3417.48
2713.08.2020.0531.9824.8471.71196.228.84
2814.08.2018.6225.7921.8474.6796.420.00
Table A2. Total weight loss (g) of mine soils treated with different food processing by-products and rainfall intensities (arithmetic mean with standard deviation, n = 3). The quantitative dust control effectiveness represents the ratio of total weight loss between treated and untreated mine soil. Untreated mine soil showed a total weight loss of 125.28 g after four measuring cycles.
Rainfall
Intensity
Total Weight Loss (g)Dust Control
Effectiveness (%)
MSD
Chicory vinasses
0.25 L/m263.0431.2949.68
1 L/m25.352.7295.73
2 L/m20.600.0999.52
4 L/m22.120.4098.31
Corn steep liquor
0.25 L/m24.381.1296.50
1 L/m21.240.2799.01
2 L/m20.700.2399.44
4 L/m22.380.9698.10
Decantation syrup
0.25 L/m22.790.7997.78
1 L/m20.210.0899.84
2 L/m20.270.0599.78
4 L/m20.490.2299.61
Palatinose Molasses
0.25 L/m213.523.2789.21
1 L/m20.810.2099.35
2 L/m20.250.0699.80
4 L/m20.500.1199.60
Note. M = mean, SD = standard deviation.
Table A3. Summary of soil loss (g) from treated mine soils after each wet–dry cycle at different rainfall intensities (arithmetic mean, n = 3).
Rainfall
Intensity
Soil Loss (g)
WDC-1WDC-2WDC-3WDC-4
Chicory vinasses
0.25 L/m22.68 20.37 13.03 26.97
1 L/m24.65 0.38 0.07 0.25
2 L/m20.18 0.07 0.04 0.32
4 L/m20.74 0.56 0.17 0.65
Corn steep liquor
0.25 L/m20.08 0.19 1.14 2.98
1 L/m21.12 0.04 0.04 0.05
2 L/m20.31 0.05 0.05 0.29
4 L/m20.34 0.21 0.24 1.58
Decantation syrup
0.25 L/m20.58 0.80 0.19 1.21
1 L/m20.11 0.01 0.07 0.02
2 L/m20.08 0.07 0.05 0.07
4 L/m20.22 0.12 0.11 0.03
Palatinose molasses
0.25 L/m25.18 2.52 1.34 4.48
1 L/m20.61 0.02 0.01 0.17
2 L/m20.11 0.05 0.04 0.05
4 L/m20.27 0.11 0.07 0.06
Note. WDC = wet–dry cycle.
Table A4. Mean concentrations of dust particles (PM2.5, PM10, TSP) in air from mine soils treated with various food processing by-products. Dust emissions were measured 3, 7, 14, 21, and 28 days after application of dust suppressants.
Concentrations of Dust Particles (mg/m3)
PM2.5PM10TSPPM2.5PM10TSPPM2.5PM10TSPPM2.5PM10TSPPM2.5PM10TSP
Day 3Day 7Day 14Day 21Day 28
Chicory vinasses
M 0.0310.0530.0930.0390.0490.0700.0480.0880.1801.8632.1482.6970.0220.0340.078
SD 0.0650.0940.1710.0390.0450.0680.1540.3060.7253.2743.5193.9330.0550.0760.194
Corn steep liquor
M 0.1180.1740.3030.1540.2340.3740.6170.7961.1232.3513.1845.1690.0250.0510.096
SD0.3400.4380.6970.7491.0421.5860.9431.1351.5226.0437.87212.1400.0480.1090.232
Decantation syrup
M 0.0160.0230.0360.1240.1910.3010.0550.0850.1500.9001.7562.8960.0110.0170.028
SD0.0240.0400.0830.2230.6321.3640.1520.2320.4955.0479.79915.4720.0080.0150.041
Palatinose molasses
M 0.0170.0230.0320.0500.0670.1040.0880.1440.2473.1525.0038.4830.0140.0180.030
SD0.0430.0570.0850.0500.0750.1520.1380.2040.35411.44514.40922.2960.0260.0280.037
Pure water
M 20.98127.64939.1769.19711.29715.1141.4411.6231.9051.3351.7562.8490.0270.0390.064
SD20.42224.39432.3209.93811.20613.9602.9263.1703.5542.2412.7474.2650.0440.0540.098
Untreated soil
M32.07859.02677.07510.92619.47628.2180.9801.1421.4610.2420.3600.6030.0130.0240.043
SD31.21652.37158.9568.33214.30120.8371.2241.3261.5610.4330.7171.2560.0200.0330.063
Background load
M0.0080.0090.0100.0160.0190.0230.0190.0250.0320.0180.0210.0260.0070.0090.014
SD0.0030.0060.0100.0670.0680.0800.0050.0100.0260.0030.0060.0140.0020.0060.026
Note. M = mean, SD = standard deviation.

References

  1. Piechota, T.; van Ee, J.; Batista, J.; Stave, K.; James, D. Potential Environmental Impacts of Dust Suppressants: Avoiding Another Times Beach; University of Nevada: Las Vegas, NV, USA, 2004. [Google Scholar]
  2. Bolander, P.; Yamada, A. Dust Palliative Selection and Application Guide; San Dimas Technology & Development Center: San Dimas, CA, USA, 1999. [Google Scholar]
  3. Yousif, E.; Haddad, R. Photodegradation and photostabilization of polymers, especially polystyrene: Review. Springerplus 2013, 2, 398. [Google Scholar] [CrossRef] [PubMed] [Green Version]
  4. Nair, N.R.; Sekhar, V.C.; Nampoothiri, K.M.; Pandey, A. Biodegradation of biopolymers. In Current Developments in Biotechnology and Bioengineering; Pandey, A., Negi, S., Soccol, C.R., Eds.; Elsevier: Amsterdam, The Netherlands, 2017; pp. 739–755. ISBN 978-0-444-63662-1. [Google Scholar]
  5. Edvardsson, K.; Gustafsson, A.; Magnusson, R. Dust suppressants efficiency study: In situ measurements of dust generation on gravel roads. Int. J. Pavement Eng. 2012, 13, 11–31. [Google Scholar] [CrossRef]
  6. Monlux, S.; Mitchell, M. Chloride stabilization of unpaved road aggregate surfacing. Transp. Res. Rec. 2007, 1989–2, 50–58. [Google Scholar] [CrossRef] [Green Version]
  7. Gillies, J.A.; Watson, J.G.; Rogers, C.F.; DuBois, D.; Chow, J.C.; Langston, R.; Sweet, J. Long-term efficiencies of dust suppressants to reduce PM10 emissions from unpaved roads. J. Air Waste Manag. 1999, 49, 3–16. [Google Scholar] [CrossRef] [PubMed]
  8. Katra, I. Comparison of diverse dust control products in wind-induced dust emission from unpaved roads. Appl. Sci. 2019, 9, 5204. [Google Scholar] [CrossRef] [Green Version]
  9. Chang, I.; Im, J.; Cho, G.-C. Geotechnical engineering behaviours of gellan gum biopolymer treated sand. Can. Geotech. J. 2016, 53, 1658–1670. [Google Scholar] [CrossRef] [Green Version]
  10. Mudgil, D.; Barak, S.; Khatkar, B.S. Guar gum: Processing, properties and food applications—A Review. J. Food Sci. Technol. 2014, 51, 409–418. [Google Scholar] [CrossRef] [Green Version]
  11. Hataf, N.; Ghadir, P.; Ranjbar, N. Investigation of soil stabilization using chitosan biopolymer. J. Clean. Prod. 2018, 170, 1493–1500. [Google Scholar] [CrossRef]
  12. Kunz, B.K.; Little, E.E.; Barandino, V.L. Aquatic toxicity of chemical road dust suppressants to freshwater organisms. Arch. Environ. Contam. Toxicol. 2021, 82, 294–305. [Google Scholar] [CrossRef]
  13. Mahro, B.; Gaida, B.; Schüttmann, I.; Zorn, H. Survey of the amount and use of biogenic residues of the German food and biotech industry. Chem. Ing. Tech. 2015, 87, 537–542. [Google Scholar] [CrossRef]
  14. Anal, A.K. Food Processing by-Products and their Utilization, 1st ed.; Wiley: Chichester, UK, 2017; ISBN 9781118432921. [Google Scholar]
  15. Jõgi, K.; Bhat, R. Valorization of food processing wastes and by-products for bioplastic production. Sustain. Chem. Pharm. 2020, 18, 100326. [Google Scholar] [CrossRef]
  16. Freer, J.; Bucher, P.G.; Braun, M.; Lottermoser, B.G. Food processing by-products and wastes as potential dust suppressants at mine sites: Results from unconfined compressive strength testing. J. Air Waste Manag. 2022, 72, 1012–1026. [Google Scholar] [CrossRef]
  17. Freer, J.; Sieger, J.L.; Lottermoser, B.G.; Braun, M. Effectiveness of Food Processing by-Products in Suppressing Wind-Induced Dust Emissions from Mine Soils: Results from Laboratory Wind Tunnel Experiments. 2022. Available online: https://ssrn.com/abstract=4220674 (accessed on 27 September 2022).
  18. German Institute for Standardization. Geotechnical Investigation and Testing—Identification and Classification of Soil—Part 1: Identification and Description; Beuth: Berlin, Germany, 2018; DIN EN ISO 14688-1:2018-05. [Google Scholar]
  19. Si, Z.; Herrera, C.H. Laboratory and field evaluation of base stabilization using cement kiln dust. Transp. Res. Rec. 2007, 1989, 42–49. [Google Scholar] [CrossRef]
  20. Van Pelt, R.S.; Zobeck, T.M. Portable wind tunnels for field testing of soils and natural surfaces. In Wind Tunnel Designs and Their Diverse Engineering Applications; Ahmed, N., Ed.; InTechOpen: London, UK, 2013; ISBN 978-953-51-1047-7. [Google Scholar]
  21. Neuman, C.M.; Sanderson, S. Humidity control of particle emissions in aeolian systems. J. Geophys. Res. 2008, 113, F02S14. [Google Scholar] [CrossRef] [Green Version]
  22. Chepil, W.S. Influence of Moisture on Erodibility of Soil by Wind. Soil Sci. Soc. Am. J. 1956, 20, 288–292. [Google Scholar] [CrossRef]
  23. Yuge, K.; Anan, M. Evaluation of the effect of wind velocity and soil moisture condition on soil erosion in andosol agricultural fields (model experiment). Water 2019, 11, 98. [Google Scholar] [CrossRef] [Green Version]
  24. Bisal, F.; Hsieh, J. Influence of moisture on erodibility of soil by wind. Soil Sci. 1966, 102, 143–146. [Google Scholar] [CrossRef]
  25. Chen, W.; Zhibao, D.; Zhenshan, L.; Zuotao, Y. Wind tunnel test of the influence of moisture on the erodibility of loessial sandy loam soils by wind. J. Arid Environ. 1996, 34, 391–402. [Google Scholar] [CrossRef]
  26. Fécan, F.; Marticorena, B.; Bergametti, G. Parametrization of the increase of the aeolian erosion threshold wind friction velocity due to soil moisture for arid and semi-arid areas. Ann. Geophys. 1999, 17, 149–157. [Google Scholar] [CrossRef] [Green Version]
  27. Toufigh, V.; Ghassemi, P. Control and stabilization of fugitive dust: Using eco-friendly and sustainable materials. Int. J. Geomech. 2020, 20, 4020140. [Google Scholar] [CrossRef]
  28. Chen, R.; Lee, I.; Zhang, L. Biopolymer stabilization of mine tailings for dust control. J. Geotech. Geoenviron. Eng. 2015, 141, 4014100. [Google Scholar] [CrossRef]
  29. Kok, J.F.; Parteli, E.J.R.; Michaels, T.I.; Karam, D.B. The physics of wind-blown sand and dust. Rep. Prog. Phys. 2012, 75, 106901. [Google Scholar] [CrossRef] [PubMed] [Green Version]
  30. Lu, H.; Shao, Y. A new model for dust emission by saltation bombardment. J. Geophys. Res. 1999, 104, 16827–16842. [Google Scholar] [CrossRef] [Green Version]
  31. Shao, Y.; Raupach, M.R.; Findlater, P.A. Effect of saltation bombardment on the entrainment of dust by wind. J. Geophys. Res. 1993, 98, 12719–12726. [Google Scholar] [CrossRef] [Green Version]
  32. BeMiller, J.N. Carbohydrate Chemistry for Food Scientists, 3rd ed.; WP: London, UK, 2019; ISBN 978-0-12-812069-9. [Google Scholar]
  33. Xu, Z. (Ed.) Solubility of Polysaccharides; InTechOpen: London, UK, 2017; ISBN 978-953-51-3649-1. [Google Scholar]
  34. Kumitch, H.M.; Stone, A.K.; Nickerson, M.T.; Korber, D.R.; Tanaka, T. Effect of fermentation time on the physicochemical and functional properties of pea protein-enriched flour fermented by Aspergillus oryzae and Aspergillus niger. Cereal Chem. 2020, 97, 416–428. [Google Scholar] [CrossRef]
  35. Zayas, J.F. Functionality of Proteins in Food; Springer: Berlin/Heidelberg, Germany, 1997; ISBN 978-3-642-59116-7. [Google Scholar]
  36. Belnap, J.; Gillette, D.A. Vulnerability of desert biological soil crusts to wind erosion: The influences of crust development, soil texture, and disturbance. J. Arid Environ. 1998, 39, 133–142. [Google Scholar] [CrossRef]
  37. Zhang, Y.M.; Wang, H.L.; Wang, X.Q.; Yang, W.K.; Zhang, D.Y. The microstructure of microbiotic crust and its influence on wind erosion for a sandy soil surface in the Gurbantunggut Desert of Northwestern China. Geoderma 2006, 132, 441–449. [Google Scholar] [CrossRef]
  38. Zhang, G.; Azorin-Molina, C.; Shi, P.; Lin, D.; Guijarro, J.A.; Kong, F.; Chen, D. Impact of near-surface wind speed variability on wind erosion in the eastern agro-pastoral transitional zone of Northern China, 1982–2016. Agric. For. Meteorol. 2019, 271, 102–115. [Google Scholar] [CrossRef]
  39. Shao, Y.; Lu, H. A simple expression for wind erosion threshold friction velocity. J. Geophys. Res. 2000, 105, 22437–22443. [Google Scholar] [CrossRef]
  40. Ravi, S.; D’Odorico, P.; Over, T.M.; Zobeck, T.M. On the effect of air humidity on soil susceptibility to wind erosion: The case of air-dry soils. Geophys. Res. Lett. 2004, 31. [Google Scholar] [CrossRef]
  41. Chang, I.; Lee, M.; Tran, A.T.P.; Lee, S.; Kwon, Y.-M.; Im, J.; Cho, G.-C. Review on biopolymer-based soil treatment (BPST) technology in geotechnical engineering practices. Transp. Geotech. 2020, 24, 100385. [Google Scholar] [CrossRef]
  42. Park, J.; Kim, K.; Lee, T.; Kim, M. Tailings storage facilities (TSFs) dust control using biocompatible polymers. Min. Metall. Explor. 2019, 36, 785–795. [Google Scholar] [CrossRef]
  43. Tian, K.; Bilal, M. Research progress of biodegradable materials in reducing environmental pollution. In Abatement of Environmental Pollutants: Trends and Strategies; Elsevier: Amsterdam, The Netherlands, 2020; pp. 313–330. ISBN 978-0-12-818095-2. [Google Scholar]
  44. Göpferich, A. Mechanisms of polymer degradation and erosion. Biomaterials 1996, 17, 103–114. [Google Scholar] [CrossRef]
  45. Briassoulis, D. The effects of tensile stress and the agrochemical Vapam on the ageing of low density polyethylene (LDPE) agricultural films. Part I. Mechanical behaviour. Polym. Degrad. Stab. 2005, 88, 489–503. [Google Scholar] [CrossRef]
  46. Rushing, J.F.; Tingle, J.S. Evaluation of products and application procedures for mitigating dust in temperate climates. Transp. Res. Rec. 2007, 1989-1, 305–311. [Google Scholar] [CrossRef]
  47. Thompson, R.J.; Visser, A.T. Selection, performance and economic evaluation of dust palliatives on surface mine haul roads. J. S. Afr. Inst. Min. Metall. 2007, 107, 435–450. [Google Scholar]
  48. Chang, I.; Prasidhi, A.K.; Im, J.; Shin, H.-D.; Cho, G.-C. Soil treatment using microbial biopolymers for anti-desertification purposes. Geoderma 2015, 253-254, 39–47. [Google Scholar] [CrossRef]
  49. Pylak, M.; Oszust, K.; Frąc, M. Review report on the role of bioproducts, biopreparations, biostimulants and microbial inoculants in organic production of fruit. Rev. Environ. Sci. Biotechnol. 2019, 18, 597–616. [Google Scholar] [CrossRef] [Green Version]
  50. Chang, I.; Jeon, M.; Cho, G.-C.; Shankar, S. Application of microbial biopolymers as an alternative construction binder for earth buildings in underdeveloped countries. Int. J. Polym. Sci. 2015, 2015, 326745. [Google Scholar] [CrossRef] [Green Version]
  51. Chang, I.; Im, J.; Cho, G.-C. Introduction of microbial biopolymers in soil treatment for future environmentally-friendly and sustainable geotechnical engineering. Sustainability 2016, 8, 251. [Google Scholar] [CrossRef] [Green Version]
  52. Thompson, R.J.; Visser, A.T. Mine haul road fugitive dust emission and exposure characterisation. In Proceedings of the Environmental Health Risk 2003, Catania, Italy, 17–19 September 2003; Brebbia, C.A., Fayzieva, D., Eds.; WIT Press: Southampton, UK, 2003; pp. 103–112. [Google Scholar]
  53. Chang, I.; Prasidhi, A.K.; Im, J.; Cho, G.-C. Soil strengthening using thermo-gelation biopolymers. Constr. Build. Mater. 2015, 77, 430–438. [Google Scholar] [CrossRef]
  54. Chang, I.; Im, J.; Chung, M.-K.; Cho, G.-C. Bovine casein as a new soil strengthening binder from diary wastes. Constr. Build. Mater. 2018, 160, 1–9. [Google Scholar] [CrossRef]
  55. Singh, V.; Piechota, T.; James, D. Hydrologic impacts of disturbed lands treated with dust suppressants. J. Hydrol. Eng. 2003, 8, 278–286. [Google Scholar] [CrossRef]
  56. Li, P.; Karunanidhi, D.; Subramani, T.; Srinivasamoorthy, K. Sources and consequences of groundwater contamination. Arch. Environ. Contam. Toxicol. 2021, 80, 1–10. [Google Scholar] [CrossRef]
  57. Jones, D. Guidelines for the Selection, Specification and Application of Chemical Dust Control and Stabilization Treatments on Unpaved Roads; University of California Pavement Research Center: Davis, CA, USA, 2017. [Google Scholar]
  58. Kavouras, I.G.; Etyemezian, V.; Nikolich, G.; Gillies, J.; Sweeney, M.; Young, M.; Shafer, D. A new technique for characterizing the efficacy of fugitive dust suppressants. J. Air Waste Manag. 2012, 59, 603–612. [Google Scholar] [CrossRef]
  59. McKenna Neuman, C.; Boulton, J.W.; Sanderson, S. Wind tunnel simulation of environmental controls on fugitive dust emissions from mine tailings. Atmos. Environ. 2009, 43, 520–529. [Google Scholar] [CrossRef]
  60. Etyemezian, V.; Nikolich, G.; Ahonen, S.; Pitchford, M.; Sweeney, M.; Purcell, R.; Gillies, J.; Kuhns, H. The portable in situ wind erosion laboratory (PI-SWERL): A new method to measure PM10 windblown dust properties and potential for emissions. Atmos. Environ. 2007, 41, 3789–3796. [Google Scholar] [CrossRef]
Figure 1. Prepared biomaterial solutions: (a) chicory vinasses, (b) corn steep liquor, (c) decantation syrup, and (d) palatinose molasses.
Applsci 12 11551 g001
Figure 2. Setup of laboratory experiments. Constructed wind tunnel includes different components to produce a laminar airflow: (a) fan, (b) diffuser, (c) honeycomb slits, (d) two screens, (e) contraction cone, and (f) test section. A dGAL4-30/30 axial fan (Korfmann Lufttechnik, Witten, Germany) with a diameter of 400 mm driven by a 1.5 kW electric motor was used to generate a constant wind speed of 13.57 m/s.
Applsci 12 11551 g002
Figure 3. Images of field test site: (a) construction design of individual test plot showing wooden frame and geotextile base, (b) experimental setup of a single test plot with electric blower, isokinetic sampling probe and dust monitor DustTrak DRX 8533 (TSI, Shoreview, USA), and (c) entire test site with installed soil plots and nearby weather station.
Applsci 12 11551 g003
Figure 4. Wind-induced total weight loss (g) of treated mine soils wetted with four different rainfall intensities after four wet–dry cycles (mean values, n = 3). By comparison, untreated soil showed a total weight loss of 125.28 g after four measuring cycles.
Applsci 12 11551 g004
Figure 5. Effect of wet–dry cycles on wind-induced soil losses (g) from mine soils treated with different food processing by-products (mean values, n = 3): (a) chicory vinasses, (b) corn steep liquor, (c) decantation syrup, and (d) palatinose molasses.
Applsci 12 11551 g005aApplsci 12 11551 g005b
Figure 6. Wind-induced dust emissions from treated and untreated mine soils (mean values, n = 3): (a) PM2.5, (b) PM10, and (c) TSP. Dust emissions were measured 3, 7, 14, 21, and 28 days after application of dust suppressants. Abbreviations: CV = chicory vinasses, CSL = corn steep liquor, DS = decantation syrup, PAM = palatinose molasses, H2O = water-treated soil, US = untreated soil.
Applsci 12 11551 g006
Figure 7. Photographic images of soil surfaces observed on day 3, 7, 14, 21, and 28 after the dust suppressants were applied: (a) untreated mine soil, and (b) mine soil treated with palatinose molasses. The size of each plot is 0.7 m × 0.4 m.
Applsci 12 11551 g007
Table 1. Applied additive concentration and application rate of each biomaterial.
BiomaterialConcentration (%)Application Rate (L/m2)
Chicory vinasses10.01.5
Corn steep liquor5.0 0.75
Decantation syrup6.01.0
Palatinose molasses6.01.0
Publisher’s Note: MDPI stays neutral with regard to jurisdictional claims in published maps and institutional affiliations.

