Article

High-Accuracy Insulator Defect Detection for Overhead Transmission Lines Based on Improved YOLOv5

1
School of Electrical & Information Engineering, Anhui University of Science and Technology, Huainan 232001, China
2
School of Electrical and Opto Electronic Engineering, West Anhui University, Lu’an 237012, China
*
Author to whom correspondence should be addressed.
Submission received: 22 November 2022 / Revised: 8 December 2022 / Accepted: 9 December 2022 / Published: 10 December 2022
(This article belongs to the Special Issue Computer Vision and Pattern Recognition Based on Deep Learning)

Abstract

:
As a key component in overhead cables, insulators play an important role. However, in the process of insulator inspection, due to background interference, small fault area, limitations of manual detection, and other factors, detection is difficult, has low accuracy, and is prone to missed detection and false detection. To detect insulator defects more accurately, the insulator defect detection algorithm based on You Only Look Once version 5 (YOLOv5) is proposed. A backbone network was built with lightweight modules to reduce network computing overhead. The small-scale network detection layer was increased to improve the network for small target detection accuracy. A receptive field module was designed to replace the original spatial pyramid pooling (SPP) module so that the network can obtain feature information and improve network performance. Finally, experiments were carried out on the insulator image dataset. The experimental results show that the average accuracy of the algorithm is 97.4%, which is 7% higher than that of the original YOLOv5 network, and the detection speed is increased by 10 fps, which improves the accuracy and speed of insulator detection.

1. Introduction

In order to ensure the safe and reliable work of high-voltage transmission lines, the power business department needs to regularly patrol and maintain the substation system of transmission lines to ensure and reduce faults and hidden dangers. With the rapid development of China’s market economy, higher technical requirements are put forward for the proper and safe operation of major facilities such as power transmission network equipment. In the reality of China’s vast territory, the network lines in the power transmission system are widely distributed and the layout of the equipment is complicated. Insulators, as special insulating devices in the transmission lines, are required to withstand the power load and mechanical loads brought by the transmission lines when they work [1]. As a result of long-term exposure to the natural environment, but also subject to dirt, lightning, strong winds, and bird damage, as well as other external factors, these factors will make the insulators on the transmission line gradually age and break [2]. In the operation of transmission lines, defects of insulators often include zero value, broken string, corrosion, etc. The main defect fault studied in this paper is the phenomenon of broken insulator string. The main reasons for this defect are as follows: the poor quality of the insulator device itself making it easy to crack during the long-term operation of the insulator, resulting in broken strings; insulator impulse voltage during lightning—multiple lightning strikes damaging insulators, resulting in cracks and broken string; rainy and snowy weather overloading the insulator’s mechanical stress, easily leading to insulator cracking and broken string. If there is no timely detection and elimination of these potential hazards, they eventually develop into a variety of serious failures, the safe operation of the power system poses a serious threat, ref. [3] and the insulator’s working condition directly affects the safety and stability of the power grid [4]. The traditional insulator inspection method is mostly manual inspection, which is labor-intensive and has low safety [5]. The detection process is susceptible to environmental and human factors. Based on many factors, Unmanned aerial vehicles (UAVs)are now used to detect insulators and other electrical equipment in transmission lines [6]. The main methods commonly used for insulator detection are artificial-based detection methods and machine learning-based detection methods.
In the artificial detection algorithm, Zheng [7] used ultrasonic technology to detect the density of basin insulators. Li et al. [8]. proposed a new data augmentation method to reduce the adverse effect of unbalanced dataset distribution on detection performance during network model training, and optimized the parameters of the support vector machine by genetic algorithm. The authors of [9,10] extracted feature information for insulator detection based on different color models. Zhai et al. [11] combined the spatial characteristics and color characteristics of insulators to segment the insulators and background in the image and used the morphological algorithm [12] to locate the insulator defect area. The authors of [13,14,15] detected insulators according to their texture and shape characteristics. Yu et al. [16]. extracted the shape and texture information of the insulator as a priori conditions, combined with the active contour model, to realize the segmentation of the insulator in a complex background. In the artificial detection algorithm, the color and shape of the image will change due to the influence of illumination, shooting distance, and angle when the UAV captures the image. The detection results of this method are susceptible to interference from the surrounding environment, and the experience of inspectors will also affect the detection accuracy is limited by specific conditions.
In the algorithm based on machine learning, Zhou et al. [17] based on the mask region convolutional neural network (R-CNN) model, changed the network structure according to the size of the detected target insulator and used a genetic algorithm to optimize the hyperparameters in the network. Based on fast R-CNN [18], Hu et al. [19] replaced the original Visual Geometry Group16 (VGG16) with a more complex feature extraction network to improve the ability of the network model to obtain image feature information and reduce information redundancy by adding an attention module. In 2016, Redmon et al. [19] first proposed a single-stage object detection algorithm, which pioneered the You Only Look Once (YOLO) [20,21,22,23] series. In [24], an end-to-end YOLO network model is used and a more accurate position of component defects in the transmission line is obtained by adding a coordinate attention module. In [25], the features of insulators with different specifications were extracted based on a deep neural network. The INSU-YOLO detection method was proposed, and the insulator defect dataset was constructed to avoid the problem of network overfitting caused by insufficient data. During the training process of the selected target detection network model, the training results are susceptible to the influence of the dataset, where the one-stage network model improves the detection speed compared to the two-stage network model, but its detection accuracy needs to be improved.
To solve the problems of insufficient accuracy and lack of robustness in the process of insulator defect fault detection, this paper proposes a YOLOv5 based on a receptive field module and multiscale. The main work is as follows: anchor frames are obtained that match the size of the detected target by k-means clustering to improve the detection accuracy of the network for target objects with different proportions; the low-level detail features are extracted from the network and fused with the deepest semantic features to the small-scale detection layer designed in this paper to improve the detection performance of the network model for small-area targets; a lightweight backbone network is built using the GhostNet [26] lightweight network to reduce convolution operations and improve the real-time performance of the model while ensuring detection accuracy; the channel receptive field block (CRF) receptive field module that integrates channel information is designed at the network head to replace the original SPP module [27], integrate channel information, fuse multiscale feature information, and use dilated convolution to reduce the calculation of redundant information.

2. Materials and Methods

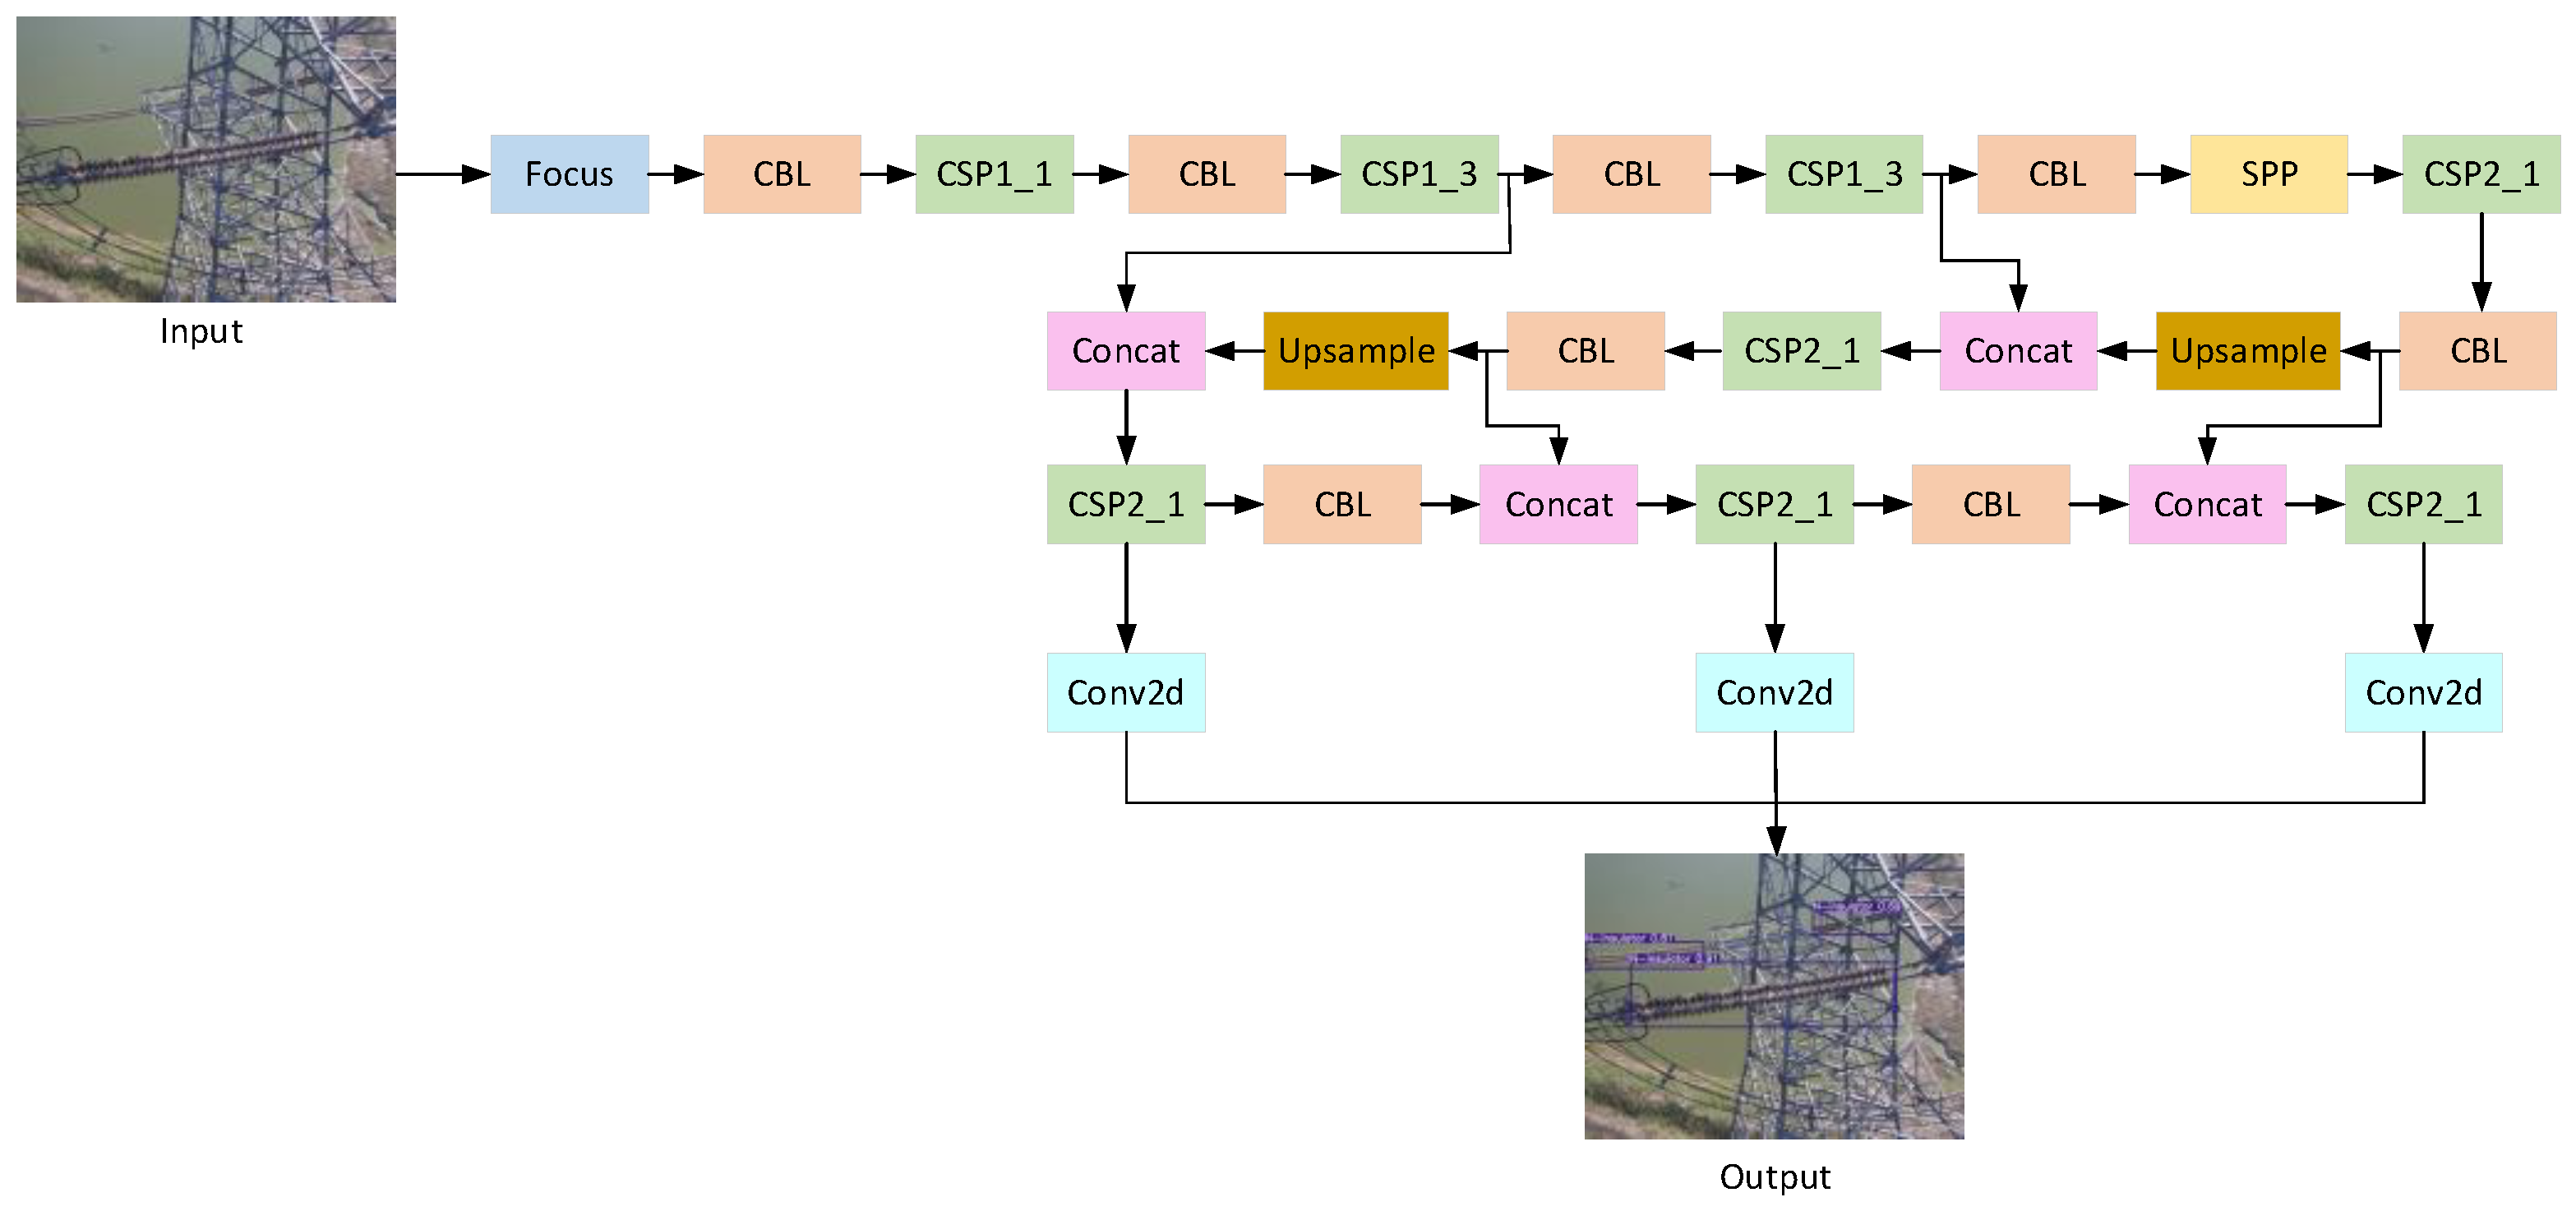
2.1. Original YOLOv5 Algorithm

YOLO series is widely used in many fields with its fast speed and strong portability. The YOLOv5 network model [28] is mainly composed of five parts: Input, Backbone, Neck, Prediction, and Output. As shown in Figure 1, the image entered into the network is sliced first, and the downsampling effect is achieved when the complete image information is saved. The backbone network mainly completes the feature extraction of the image through the convolution module and the cross-stage partial module with residual structure. The neck of the network mainly fuses the image feature information extracted from the backbone network through the spatial pyramid pooling module, retaining rich image feature information for subsequent target object detection. The detection part of the network obtains the category of the target object, the category confidence, and the coordinate information of the object position, and the target area is marked by the anchor frame.
As shown in Figure 1, in the original YOLOv5 network, for the image input network containing insulators to be detected, the image information is obtained through a series of operations such as slicing, convolution, and sampling, and finally, the detection result map with a detection frame is output to realize end-to-end insulator region recognition.

2.2. Improved YOLOv5 Algorithm

In this paper, based on the YOLOv5 network architecture, we introduce the Ghost lightweight module to reduce the network parameters, add detection layers to the network, and increase the detection scale. The CRF perceptual field module is designed to obtain more detailed feature information and improve detection accuracy.

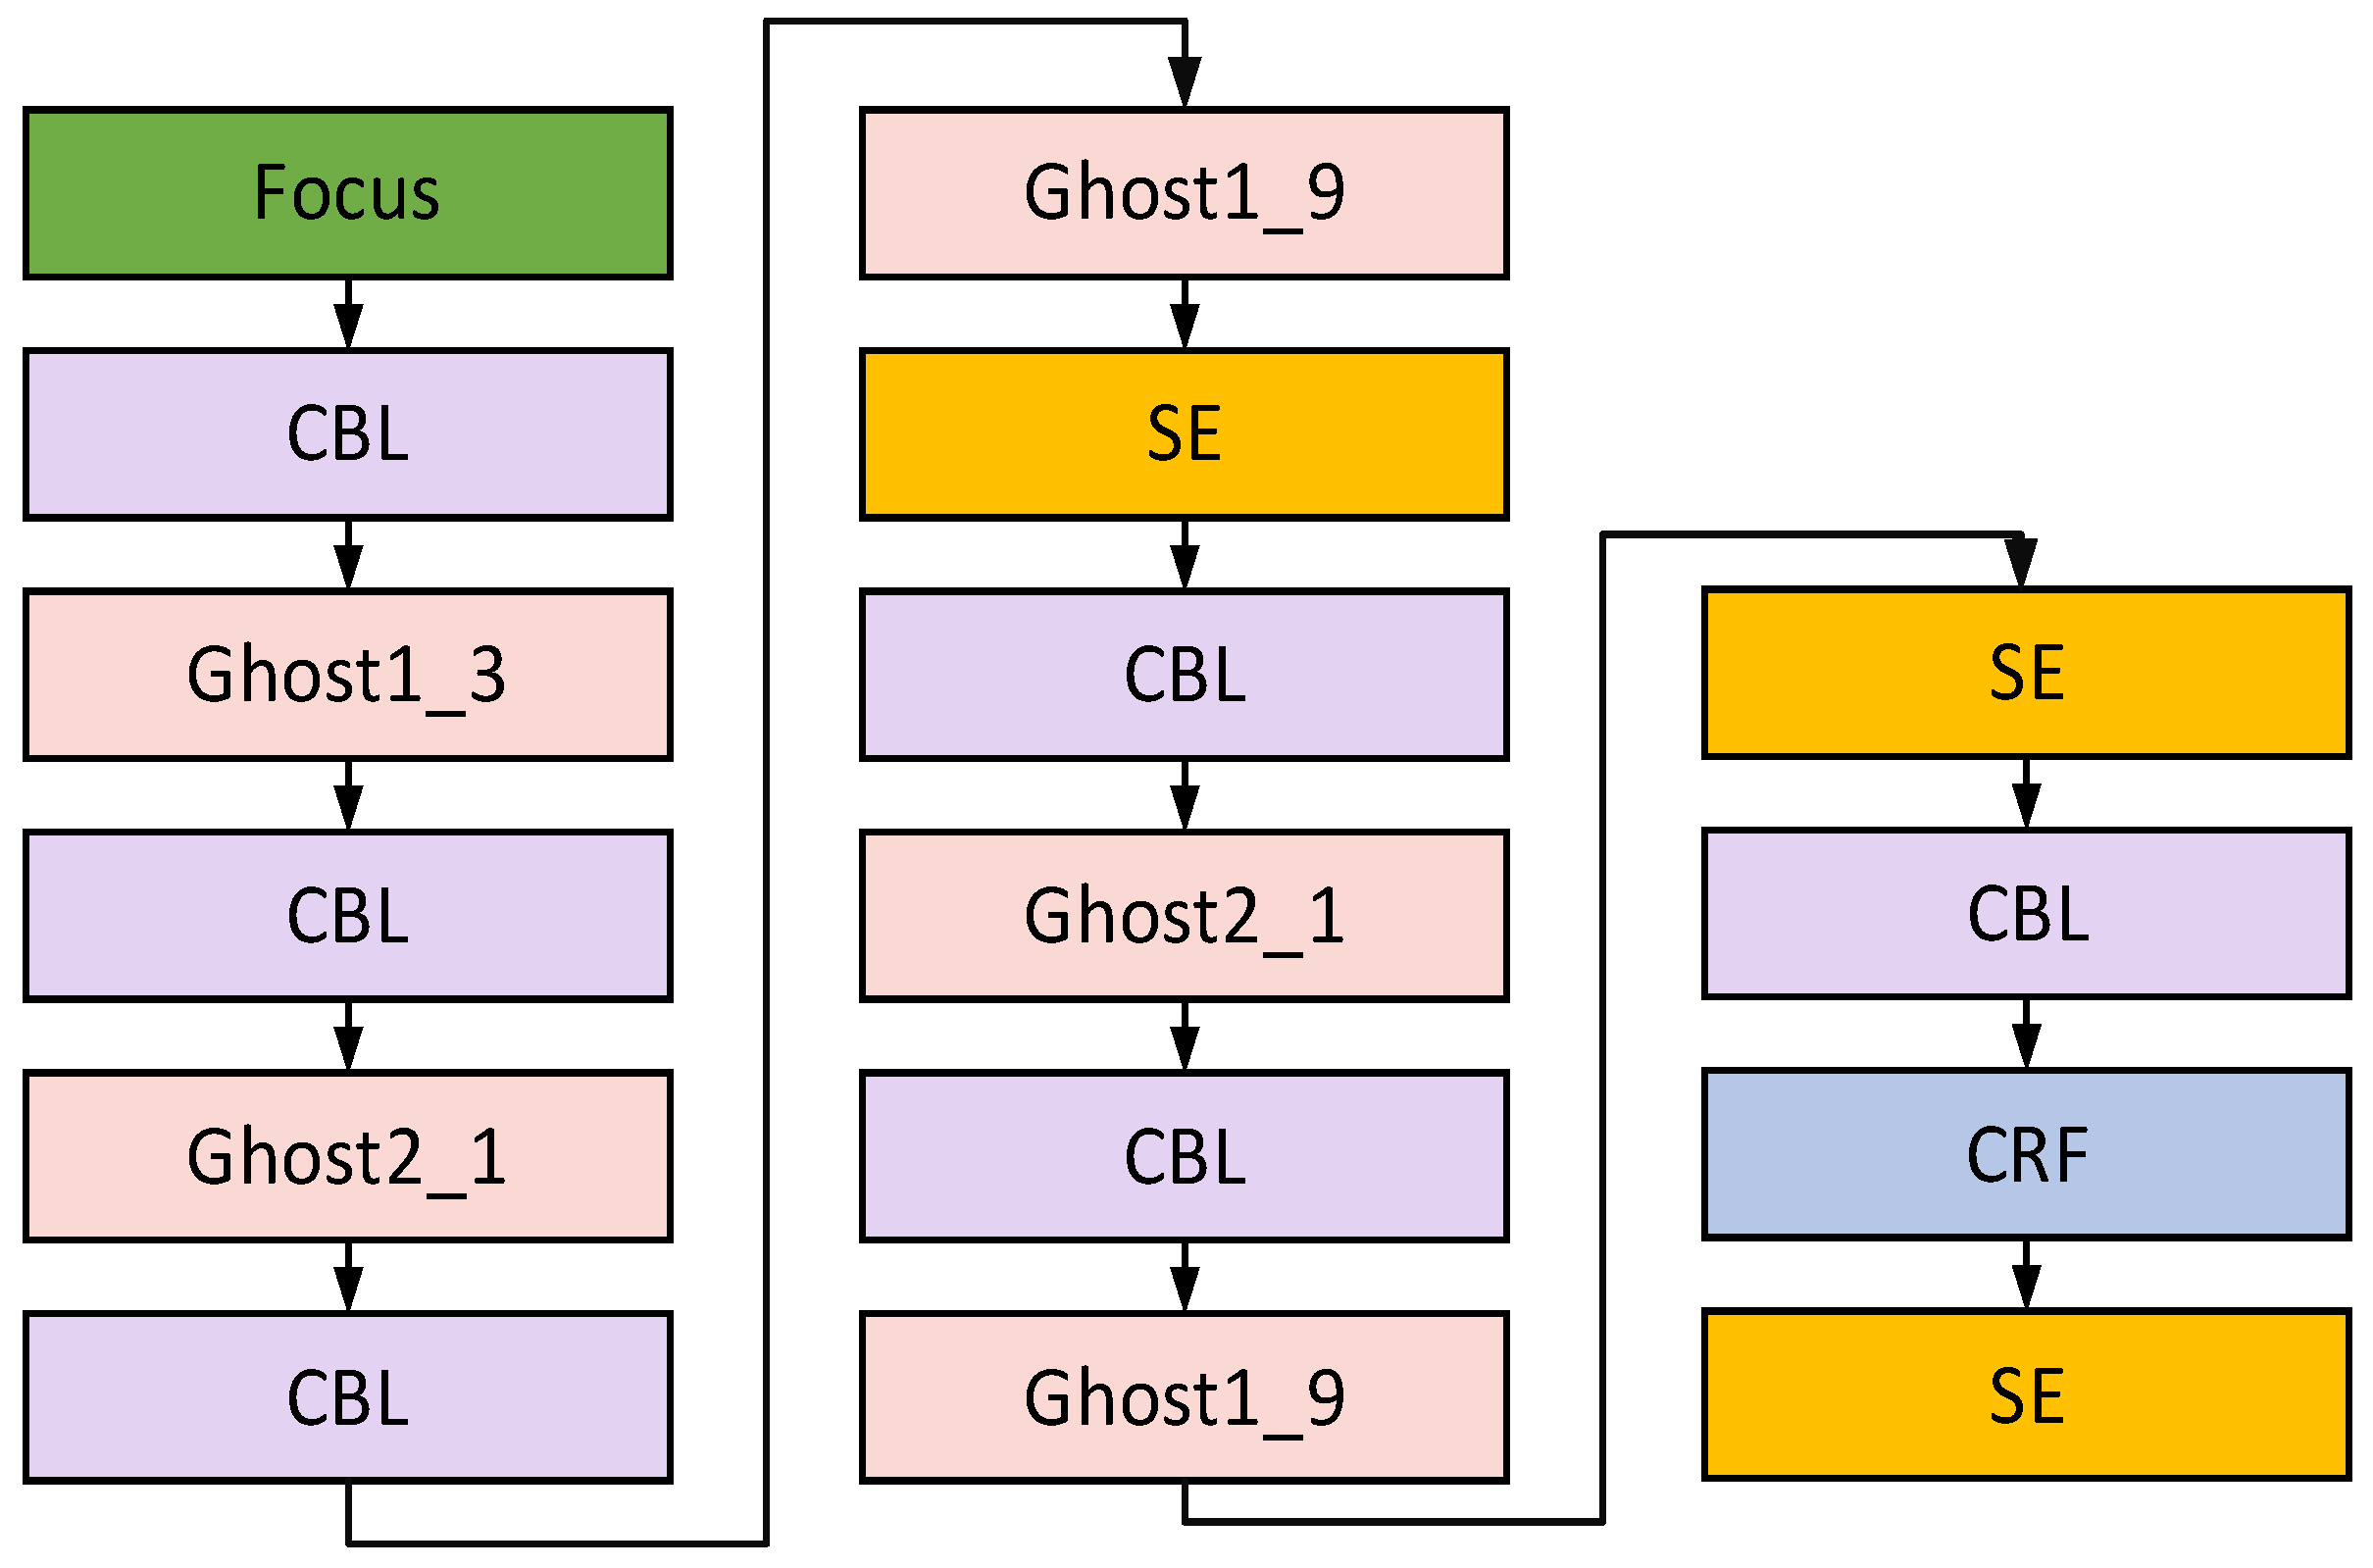
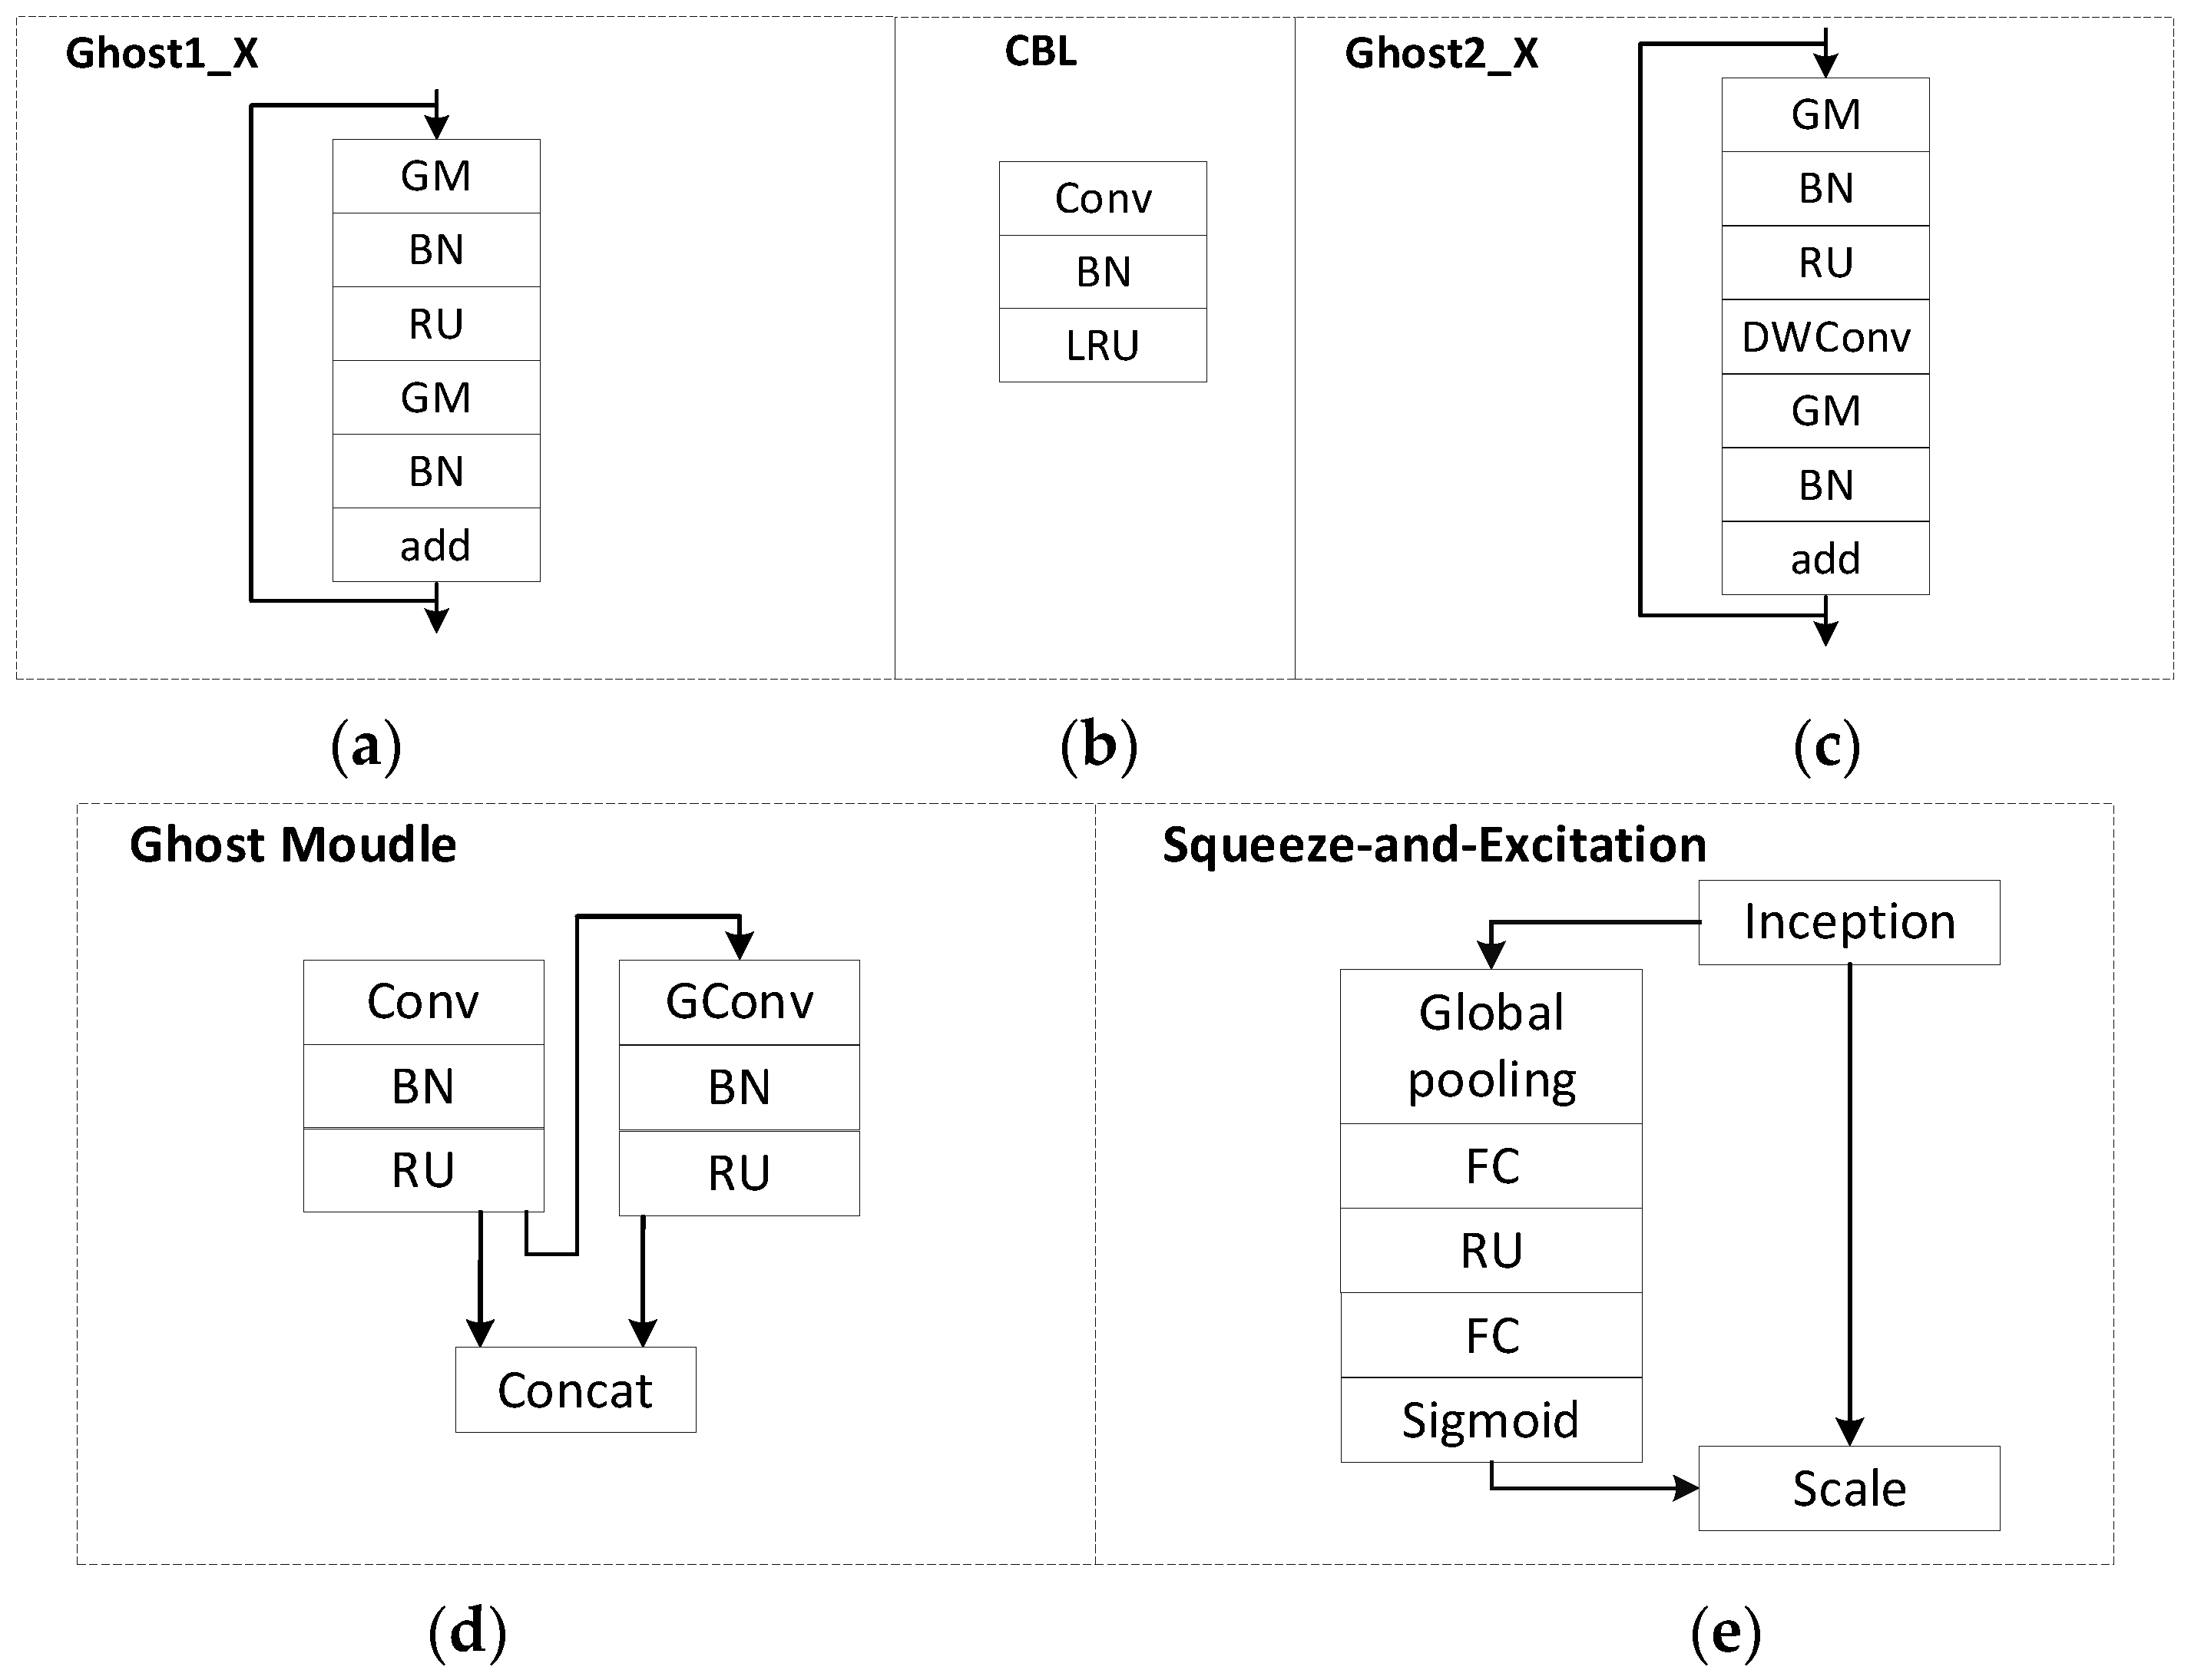
2.2.1. Backbone Network

The original backbone network is sliced, and three scale feature maps of 128 × 80 × 80, 256 × 40 × 40, and 512 × 20 × 20 are obtained by threefold downsampling. The Ghost lightweight module is added to the backbone network to replace the cross-stage partial (CSP) [29] convolution module in the original backbone network and reduce the computational overhead of the network model. The Ghost module mainly uses the linear operation method with less computation to replace the original convolution operation while ensuring the performance of the network detection accuracy. The feature map is obtained through the 3 × 3 convolution kernel, and the depthwise convolution performs the linear operation on each channel of the feature map to expand the channel, which is equivalent to the hierarchical convolution processing of the input feature map.
The backbone network structure is shown in Figure 2. The network designed in this paper makes full use of the feature map generated during the sampling process on the backbone network. Based on the original YOLOv5 three-layer detection layer, the feature map with a scale of 64 × 160 × 160 generated by downsampling is combined with the same scale feature map of the head to form a minimum scale detection layer. Among them, the internal structure diagram of each module in the backbone network of Figure 2 is further explained in detail in Figure 3.
Figure 3 is the internal structure of each module of the backbone network. As shown in Figure 3a, 1 in the Ghost1 _ X module is the convolution step size, and X is the number of times the module is repeated. GM in Ghost1 _ X module represents the Ghost lightweight module in (d), and BN represents batch normalization to speed up the network proficiency. RU represents the ReLu activation function to alleviate network overfitting. The add module combines the output of the previous layer with the output of this layer in the form of residual edges. As shown in Figure 3b, the CBL module is composed of three network layers: Conv, batch normalization, and Leaky ReLu. The LRU in the CBL module refers to the Leaky ReLu. As shown in Figure 3c, in the Ghost2 _ X module, 2 in the Ghost2 _ X module is the convolution step size, and X is the number of times the module is repeated. DWConv refers to depthwise separable convolution. As shown in Figure 3d, in the Ghost module, GConv refers to group convolution. As shown in Figure 3e, in the squeeze-and-excitation (SE) module, global average pooling is used to obtain global features, and the sigmoid activation function is used to introduce the nonlinear relationship between channels; FC refers to fully connected layers.
Among them, the SE attention mechanism finally obtained the weight matrix calculation process as follows [30]:
The calculation is mainly divided into two parts: the first is to compress the feature map to obtain a matrix containing only channel information.
z c = F s q ( u c ) = 1 H × W i = 1 H j = 1 W u c ( i , j ) ,
In the formula, H and W are the height and width of the input feature map, respectively, and uc is the feature map with c input channels.
The second is to weigh each channel.
s = F e x ( z c , W ) = σ ( g ( z c , W ) ) = σ ( W 2 σ ( W 1 z ) ) ,
In the formula, zc is the output of 1 × 1 × c after F s q operation, W1 and W2 are two fully connected operations, respectively, and σ refers to the sigmoid function.

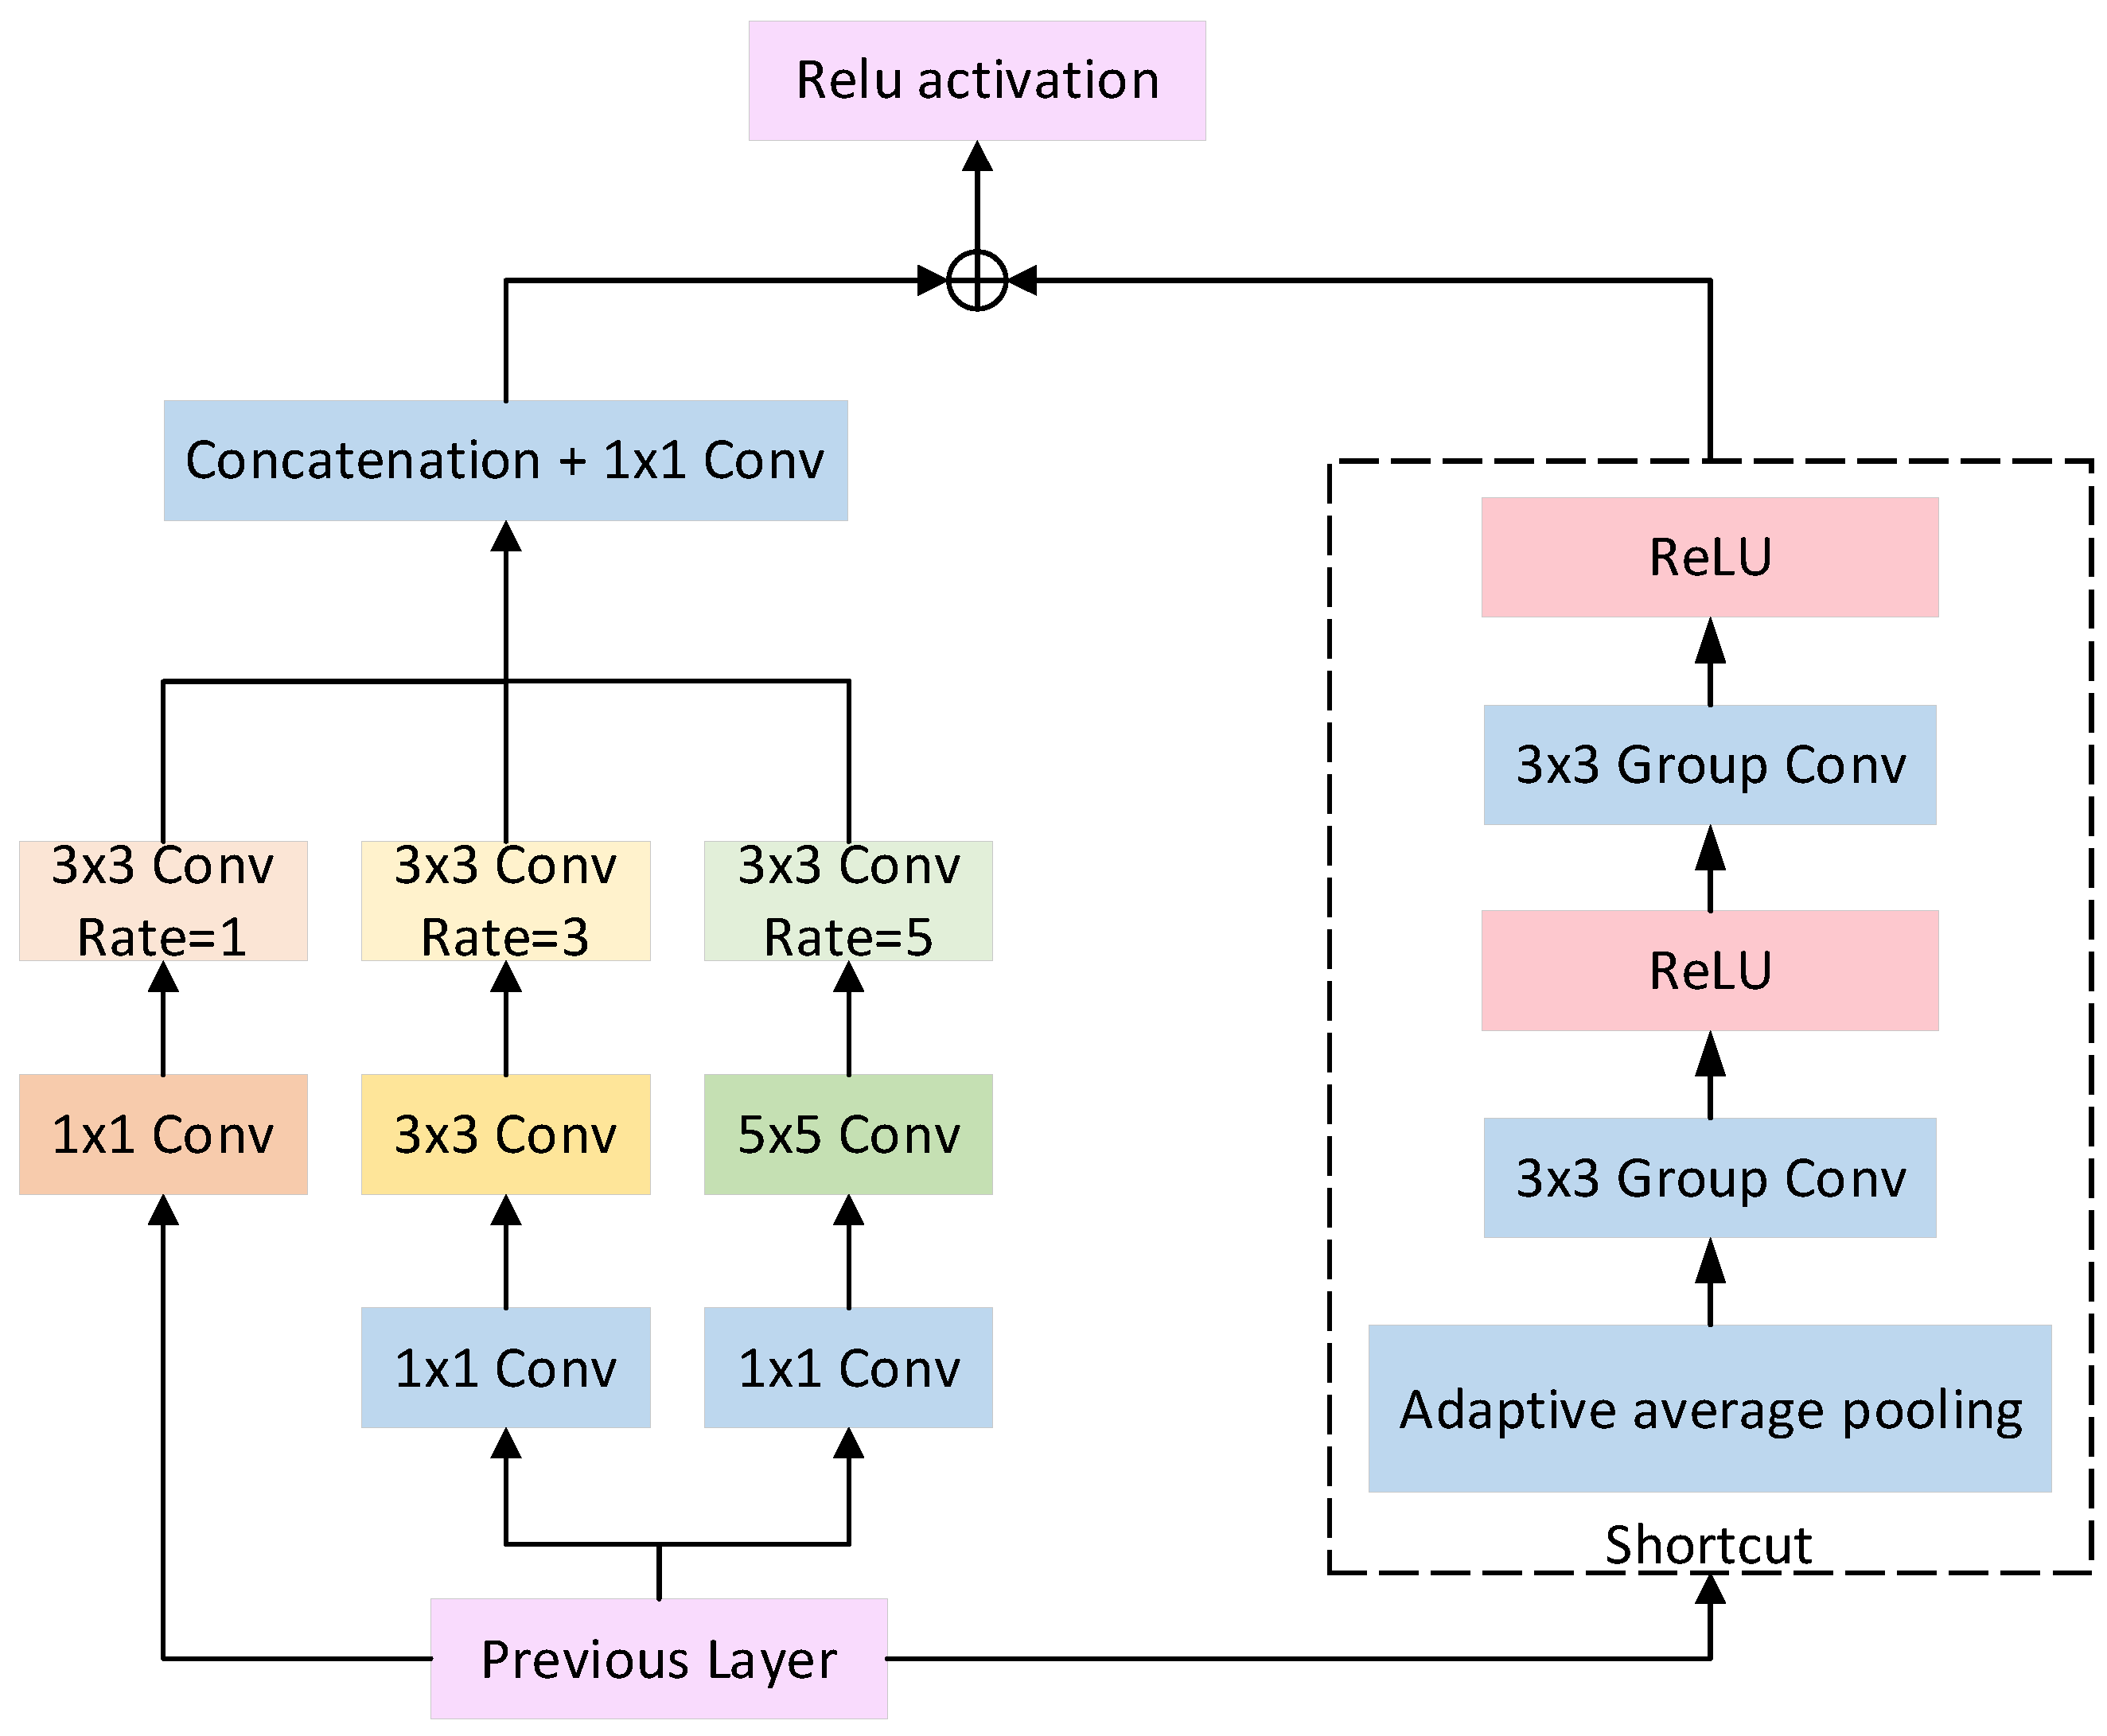
2.2.2. CRF Receptive Field Module

Due to the small receptive field in the shallow feature map, it is not conducive to large target detection, and the large receptive field in the deep feature map is not conducive to small target detection. In this paper, we design the channel receptive field block receptive field module to enhance the receptive field of the network while introducing the residual edges of the channel attention mechanism to achieve deep features in a lightweight convolutional network by designing the network mechanism.
As shown in Figure 4, for the input feature map, the number of feature map channels is reduced by the convolution layer of 1 × 1 to reduce the computational overhead. Then, 1 × 1, 3 × 3, and 5 × 5 convolution kernels of different sizes are used to form a convolution layer of three branches to obtain receptive fields of different sizes, obtain more detailed feature information, and form receptive fields of different scales. Connect the dilated convolution corresponding to the expansion rate, and set the expansion rate as 1, 3, and 5, respectively. The convolution kernel is a 3 × 3 dilated convolution. By setting different expansion rates on different scale receptive fields, the eccentricity of each branch is obtained. Based on ensuring the resolution, the receptive field is increased, the discrimination ability of feature information is improved, and all branches are connected by Concat function.
The designed channel attention is embedded into the receptive field module in the form of residual edges. The designed channel attention mechanism first performs downsampling through adaptive pooling to compress the feature map. The embedded channel attention measures the features captured by the convolution kernel from different channels, effectively retaining data information and reducing calculation parameters.
Calculation of receptive field size for each layer:
R i + 1 = R i + ( K i + 1 1 ) × S i ,
In the formula, R is the receptive field size of the convolution layer, i represents the number of different convolution layers, Si is the step size of the convolution kernel of the i layer, and Ki is the size of the convolution kernel of the i layer.
The CRF receptive field module designed in this paper uses dilated convolution. For the calculation of the size of the dilated convolution receptive field:
R i + 1 = R i + ( K i + 1 1 ) × S i × D i + 1 ,
In the formula, D is the dilation rate of the hole convolution. The output of the network model to the input of each network layer is marked as 0~i, and the receptive field of the highest output layer is recorded as R0. The size of the receptive field of each layer is obtained by recursion layer by layer. When the R0 value is 1, the convolution kernel size is 3 × 3, the step size is 2, and the void rate is 2; the first layer receptive field R1 value is 9.

2.2.3. Multiscale Detection Layer

In the process of insulator image detection, the large-scale detection target area accounts for a large proportion, the feature information is rich, and it is easy to detect, while the insulator defect fault area size is small, the feature information contained is small, and the defect fault accounts for a small proportion in the overall image. To reduce the impact of the unbalanced proportion of target categories, a small-scale detection layer is designed to increase the detection scale by increasing the detection layer. The improved overall network structure is shown in Figure 5.
As shown in Figure 5, by combining the feature map generated during the head upsampling process of the network with the same scale feature map generated during the downsampling process of the backbone network, the original three-layer detection is added to the four-layer detection layer. As shown in Figure 5, the insulator image with a size of 640 × 640 is input, and the image size of 320 × 320 is obtained by focus slicing. After fourfold downsampling, the network obtained four scale feature maps, denoted as P2, P3, P4, and P5. The P2 scale is 160 × 160, the P2 downsampling is P3, the scale is 80 × 80, and P4 and P5 are obtained. The network head obtains C5 with a scale of 20 × 20; C5 upsampling obtains C4 with a scale of 40 × 40; and similarly, upsampling obtains C3 and C2. At the same time as upsampling, the four feature maps downsampled by the backbone network are connected with the feature maps of the same scale as the head. Through the Concat connection, the texture information extracted from the bottom layer is combined with the semantic information of the high layer to improve the overall detection performance of the network.

3. Experiment and Dataset

3.1. Experiment Setting

This experiment is based on the Window10 operating system; CPU i5/4 core, GPU RTX3060/12GB, Python3.8, Cuda11.1 experimental platform. Considering that the anchor frames of the original YOLOv5 were set based on the target data in the public dataset COCO2017, the anchor frames were reclustered for the insulator dataset to obtain anchor frames with more accurate dimensions to obtain anchor frames that better match the detection target. When clustering the size of the anchor frame, the k-means clustering algorithm based on classification is used to obtain the anchor frame of the new size insulator dataset. The corresponding number of anchor frames is set for different detection scales. In this paper, four detection layers are used, and four different sizes of anchor frames are set accordingly. Each size has three types of aspect ratios. When clustering the sizes of anchor frames, a classification-based k-means clustering algorithm is used to obtain new sizes of anchor frames for the insulator dataset. The corresponding number of anchor frames is set for different detection scales; in this paper, four detection layers are used and four different sizes of anchor frames are set accordingly, each with three classes of aspect ratio.

3.2. Experimental Datasets

The dataset used in this experiment is based on the open-source Chinese Power Line Insulator Dataset (CBLID), and the dataset is expanded. The open-source Labellmg data annotation tool is used to annotate the dataset. The dataset is divided into two categories: N-insulator (normal insulator) and D-insulator (defective insulator), using YOLO label format file to save labels. The dataset is divided into a training set and a test set at a ratio of 8:2. In the network training, the original insulator image size of the input network is 1152 × 864. The insulator data are first scaled to the standard size of 640 × 640, and then input into the backbone network to process the image.

3.3. Evaluating Indicator

To evaluate the effectiveness of the modified network more objectively, it is mainly tested from two aspects: detection accuracy and detection speed. In this paper, precision (P), recall (R), mean precision (mAP), and the number of frames per second (FPS) are selected as evaluation indicators to detect network performance. P is used to determine the probability of correct detection, R is used to determine whether the target in the full dataset can be found, and mAP is the average accuracy of all categories. The calculation formula is as follows [31]:
P = T P T P + F P ,
R = T P T P + F N ,
A P = 0 1 P ( r ) d r ,
m A P = i = 1 K A P i K ,
There are two types of positive samples set in this paper, which are normal insulators and defective insulators. In Formulas (5) and (6), taking the normal insulator as an example, TP is the correct prediction of the normal insulator in the actual prediction, and FP is the detection of the abnormal insulator as the normal insulator, that is, the wrong prediction. FN is predicted as a defective insulator or undetected insulator for normal insulators, which is also an error prediction. Formula (7) is the average precision (AP), which means that the precision value obtained by the recall rate in the range of 0 to 1 is averaged. APi represents the average accuracy of the i category of samples. In Formula (8), K is the number of categories of samples in the dataset, and K = 2 is set in this paper. Where mAP @ 0.5 indicates that when the intersection–union ratio is set to 0.5, for the average accuracy of the set two types of samples, the sum of the two is averaged to obtain the overall average accuracy mean. The above evaluation metrics provide an objective description of the test results of the insulator dataset on various models.

4. Discussion

To evaluate the performance of the algorithm more objectively and reasonably, two kinds of experiments are designed to judge the effectiveness of the algorithm in this paper from the aspects of improving the effectiveness of each module of the algorithm itself on the network and comparing it with the same detection algorithm. Firstly, different feature extraction modules are compared. At the same position of the backbone network, the CSP module and Ghost module are used, respectively. Comparing the parameters of the two, the parameter size of the CSP module is 0.567 MB, while the parameter size of the Ghost module is 0.033 MB. The data show that the Ghost module is used to build the backbone network of the detection model. Compared to the convolution module in the original network, the number of parameters is significantly reduced, the memory footprint is lower, and the resource usage is reduced.

4.1. Comparison of Different Receptive Field Modules

At the end of the model backbone network, the receptive field module is added to fuse the feature information of each scale. The CRF receptive field module designed in this paper is compared with SPP and the receptive field block (RFB) [32] to verify the effectiveness of the CRF module. The results are shown in Table 1:
Three kinds of receptive field modules were compared by detecting the accuracy rate, recall rate of normal and defective insulators, and the average accuracy of the two categories when the confidence level was 50. As can be seen from the data in the table, for the CRF module of normal insulators, the accuracy rate is 0.915, while the RBF module shows a better recall rate. In the detection of defective insulator areas, the detection accuracy of the RBF module is the highest, the recall rate of the CRF module is 1, and the overall detection accuracy of the CRF module is the highest. In summary, the designed CRF module compares the first two receptive field modules, combines the proportion information of the target in the graph, sets convolution kernels of different sizes, better obtains global and local feature information, and enhances the network’s fusion of semantic and texture information.

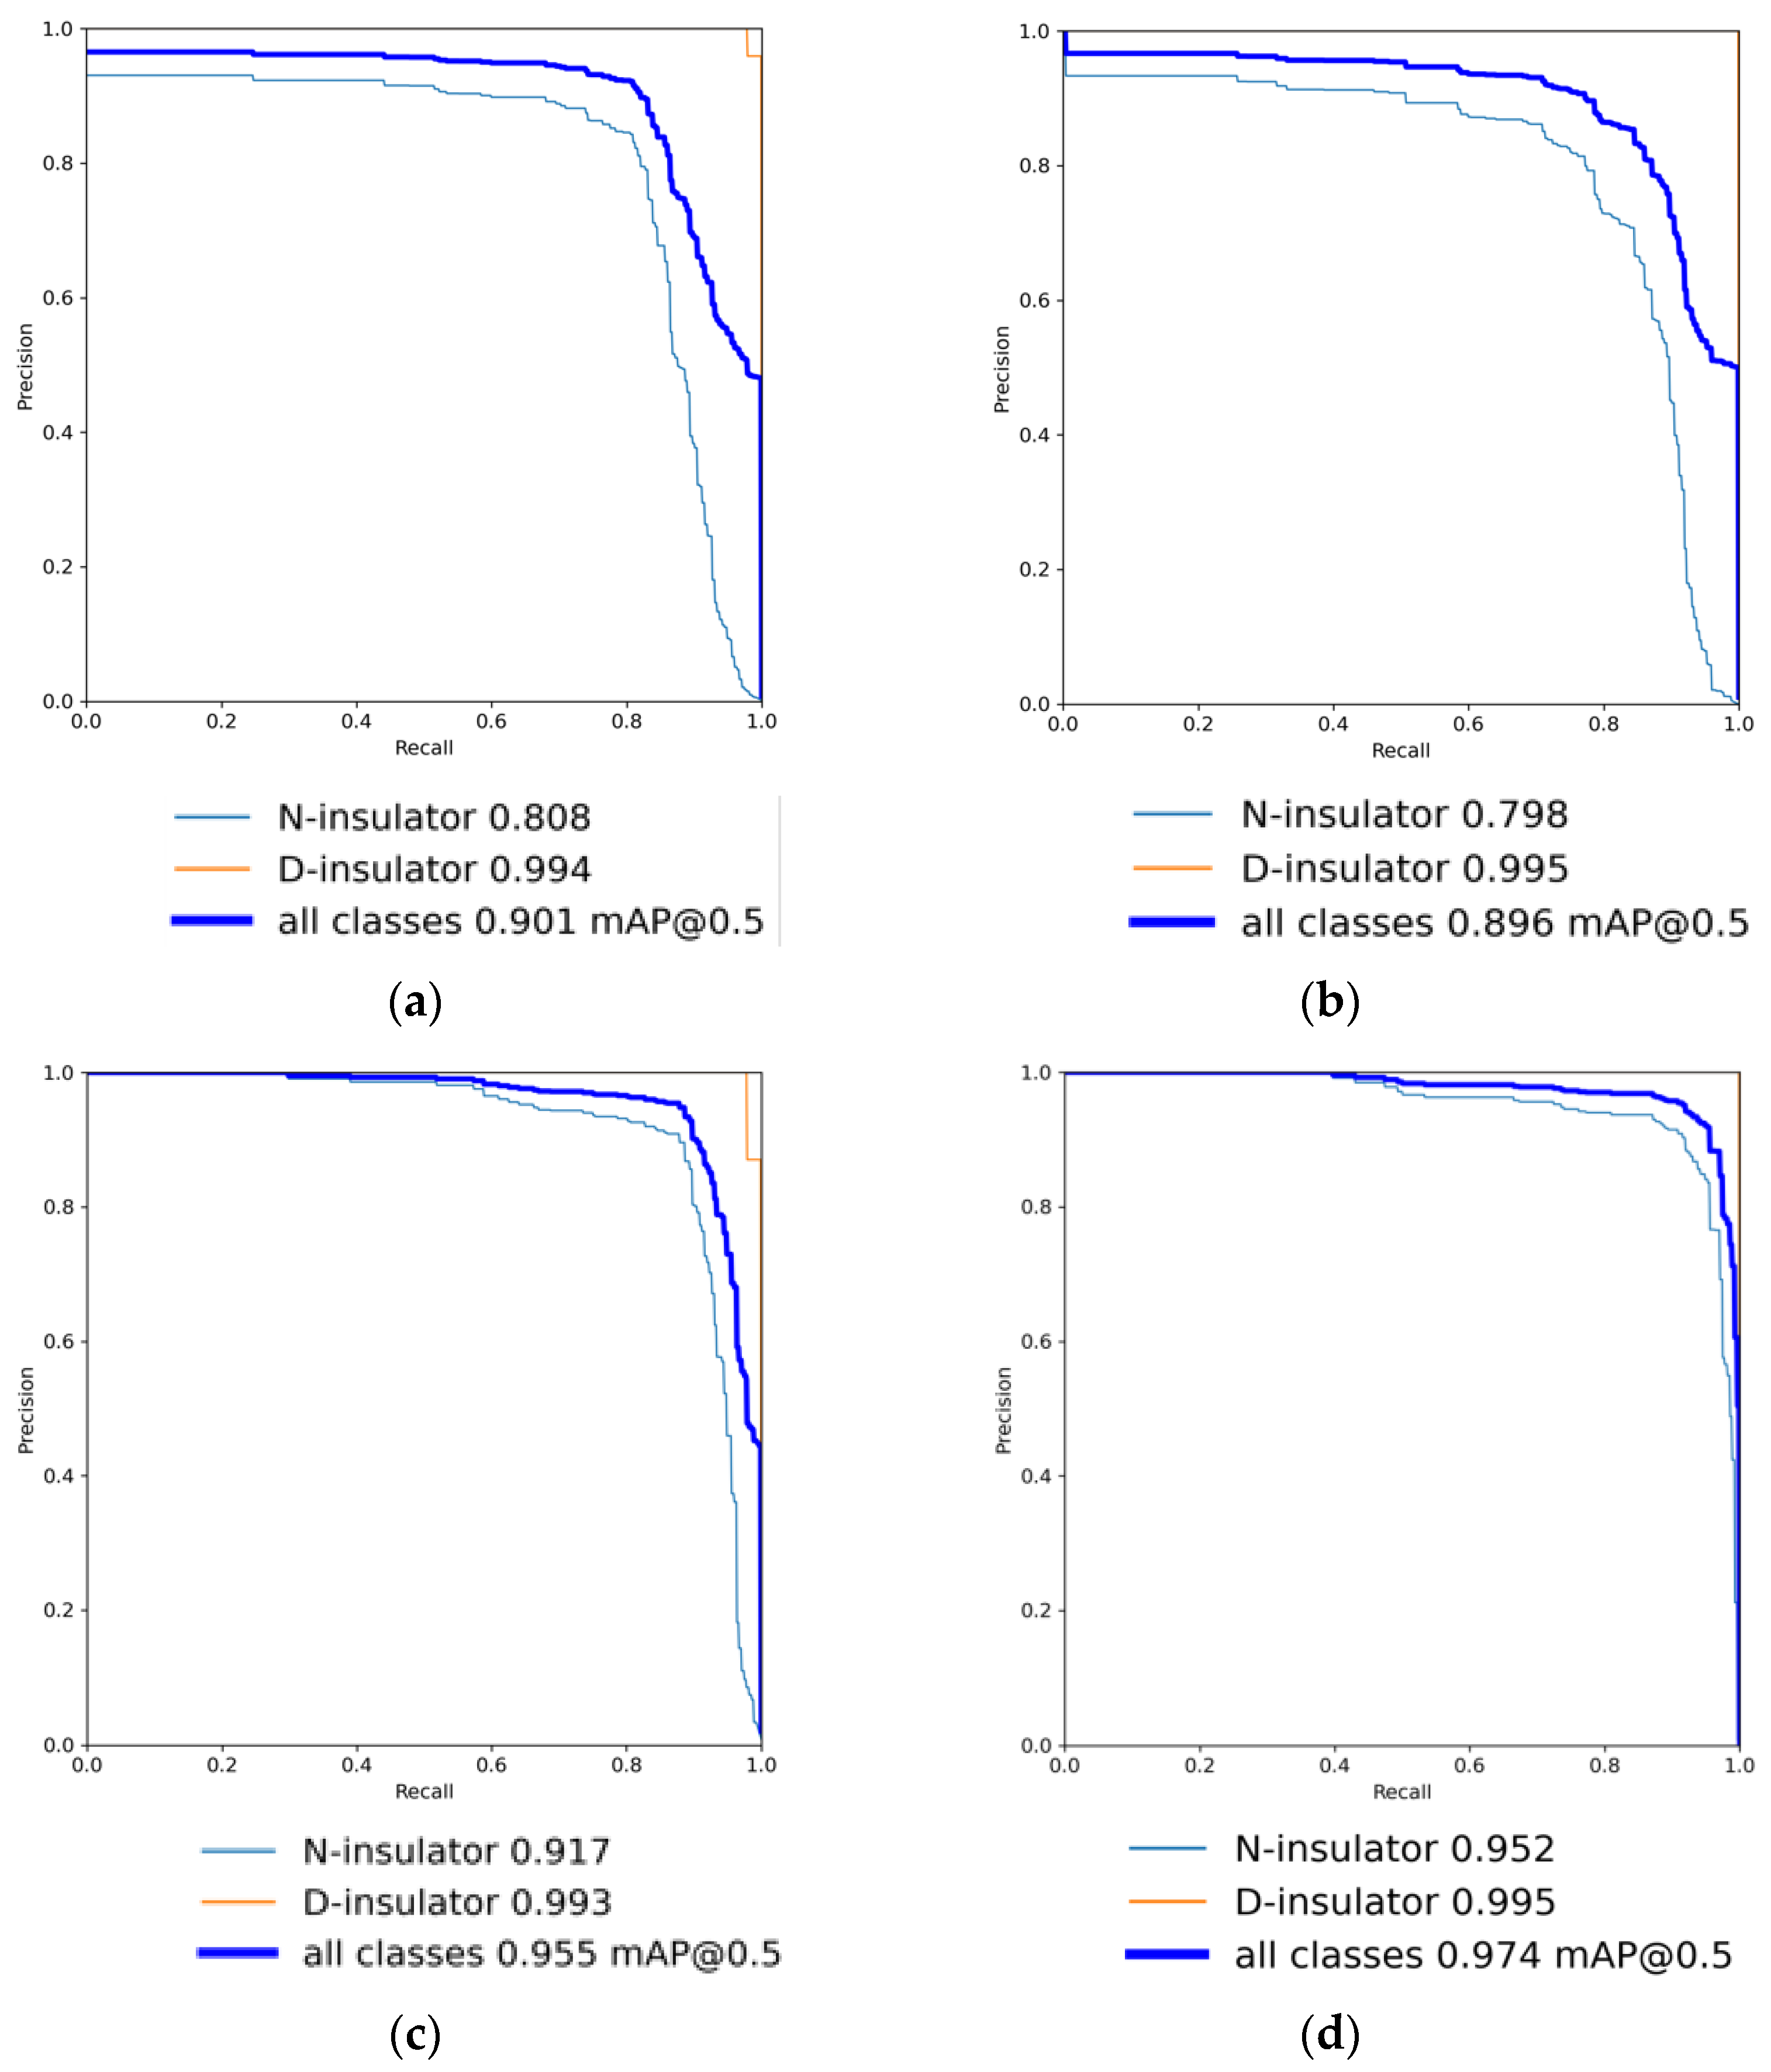
4.2. Ablation Experiment

In order to verify the effectiveness of the improved algorithm proposed in this paper, different experimental groups are set up, and different experimental modules are replaced and added for experimental verification. The experimental results are shown in Table 2 below:
Based on the original network, the Ghost lightweight module is set in turn, the network detection layer is increased, and the CRF receptive field module is designed. Comparing the modules added in this paper with the original network, comparing method 1 with method 2, the accuracy of model detection decreases by 0.5% on average with the Ghost lightweight module, but improves the speed of model detection and reduces the amount of network computation with the Ghost module. Comparing method 3 with method 2, the addition of detection layers reduces the recall for the category D-insulator but increases the accuracy due to the increased detection scale for the small area target of the defective insulator. The detection layer set up to constitute the new model architecture improves accuracy for both categories of detection, and the overall performance of the network improves. Comparing method 4 with method 3, replacing the SPP module with the CRF receptive field module improves the detection accuracy of the model by 1.9%. By analyzing the experimental results, we can see the effectiveness of the module designed in this paper.
As shown in Figure 6, the light blue curve is the P-R curve of the N-insulator category, the orange curve is the P-R curve of the D-insulator category, and the dark blue curve is the P-R curve of the overall average accuracy of the network. In the P-R graph, the abscissa is the recall rate, and the ordinate is the precision rate. The larger the area enclosed by the curve and the abscissa and ordinate axes, the closer the curve is to the upper right corner, and the better the network performance. The four experimental groups combined with the ablation experiment produced their corresponding P-R curves, arranged in order, as shown in Figure 6. By comparing the four graphs, it can be seen that the area enclosed by the curve and the horizontal and vertical axes in image (d) is larger, the accuracy and recall rate is higher, and the network model performance is better than the first four.

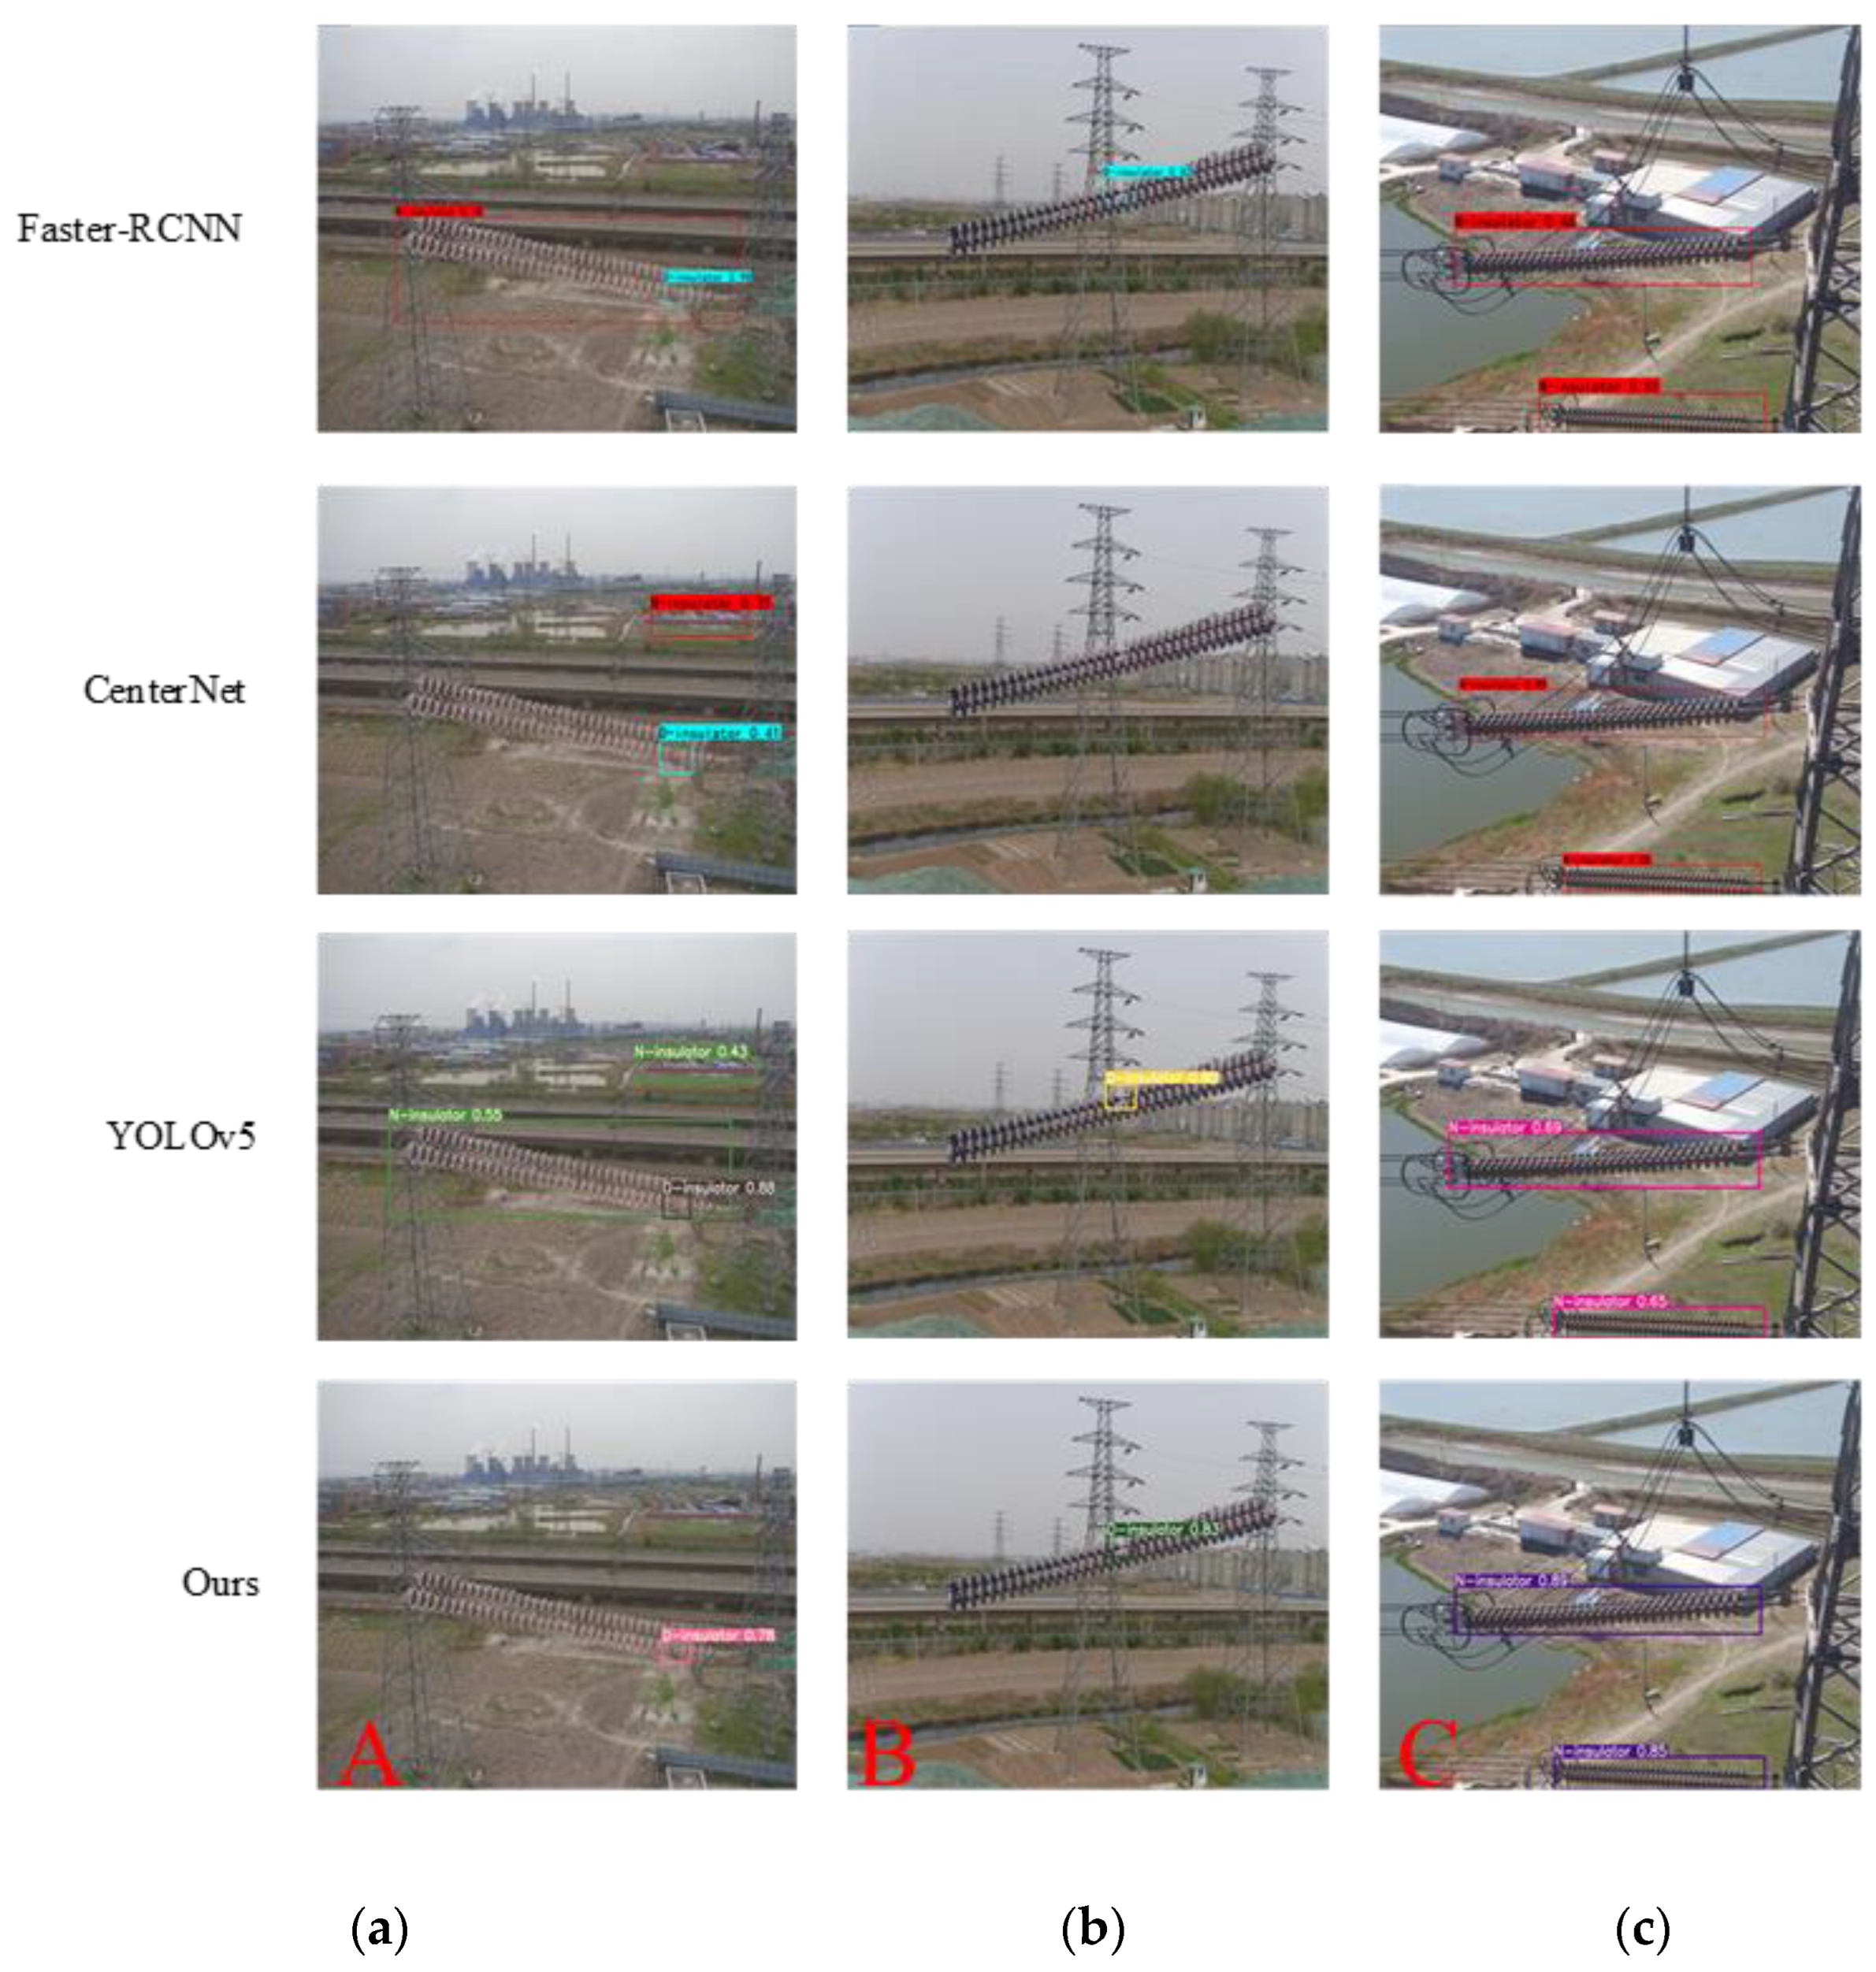
4.3. Contrast Experiment

The algorithm in this paper is compared with Faster R-CNN [33], which is the typical representative of the two-stage detection algorithm in the current target detection algorithm, CenterNet [34] based on anchor-free, and the original YOLOv5 algorithm.
As can be seen from Table 3, Faster R-CNN has a higher recall rate for normal insulators, but a lower detection accuracy and slower detection speed for defective insulators in small areas. The performance of CenterNet is significantly lower than that of other algorithms, and its detection accuracy of defective insulators is high. However, CenterNet cannot detect the number of defective insulator images in the dataset well. In the above network model, the detection of the category D-insulator is poor. Compared with the two-stage detection model, the detection accuracy is improved by 14.2%, and the detection speed is also improved by 50 FPS. Compared with the detection model without an anchor frame, the detection accuracy is improved by 19.8%, and the detection speed is also improved. Compared with the original model, the detection accuracy is improved by 7.3%, and the detection speed is also improved by 9FPS. At the same time, the improved network has the best detection accuracy for normal insulators, and the network running speed is also improved.
The image in Figure 7 is the detection result map under different network models, where (a), (b) and (c) columns are three different insulator images to be detected. The detection results of the four network models are in turn. Through the picture, it is more clear and more intuitive to see that Faster-RCNN in column (a) misdetects the defective insulator as a normal insulator. The CenterNet network model misdetects the enclosure in the background as a normal insulator and the CenterNet in column (b) does not detect the defective insulator, resulting in a missed detection. The original YOLOv5 model also shows false detection of the wall in the defective insulators in column (a) and false detection of defective insulators. For defective insulators listed in (a), the method presented in this paper has more advantages. For normal insulators listed in (c) for detection, it can be seen that the results of the four models are better for the detection of normal insulators. Combined with network detection indicators and intuitive picture results, it can be seen that this method has higher detection accuracy and faster detection speed. From the detection accuracy and speed, this algorithm has more advantages.

5. Conclusions

Based on the YOLOv5 model architecture, this paper designs an algorithm for insulator defect detection of overhead transmission lines. First, according to the label file corresponding to the image in the training set, the anchor frame size is obtained by k-means clustering, so that the network can obtain more accurate positioning. The lightweight Ghost module is used to replace the original convolution operation to construct a lightweight backbone network, which reduces the computational complexity, reduces the network computation, and improves the detection speed of the network to 62 FPS. The small-scale detection layer is added to reduce the loss of small-scale target features. At the same time, the CRF receptive field module is introduced to extract more effective feature information, which improves the detection accuracy of the network by 7.3%, and the average detection accuracy reaches 97.4%. It realizes a more intelligent detection of insulator defects, which reduces the manual input and improves the detection accuracy of defective insulators. In order to verify the effectiveness of the improved algorithm proposed in this paper, different experimental groups are set up, and different experimental modules are replaced and added for experimental verification.

Author Contributions

Methodology, Y.H., L.J., S.X. and T.H.; experiment conceptualization and design, Y.H. and L.J.; performing experiments, L.J., J.F. and Y.L.; data analysis, L.J.; writing, Y.H. and L.J.; funding acquisition, Y.H. All authors have read and agreed to the published version of the manuscript.

Funding

This research was funded by the National Natural Science Foundation of China (Yourui Huang), grant number 61772033 and Anhui University Collaborative Innovation Project (Yourui Huang), grant number GXXT-2019-048, GXXT-2020-54.

Institutional Review Board Statement

This studies not involving humans or animals.

Informed Consent Statement

This studies not involving humans.

Data Availability Statement

Research data can reasonably be obtained from the corresponding author.

Conflicts of Interest

The authors declare no conflict of interest.

References

  1. Zheng, H.; Liu, Y.; Sun, Y.; Li, J.; Shi, Z.; Zhang, C.; Lai, C.S.; Lai, L.L. Arbitrary-Oriented Detection of Insulators in Thermal Imagery via Rotation Region Network. IEEE Trans. Ind. Inform. 2022, 18, 5242–5252. [Google Scholar] [CrossRef]
  2. Zhao, Y.; Yan, J.; Wang, Y.; Jing, Q.; Liu, T. Porcelain Insulator Crack Location and Surface States Pattern Recognition Based on Hyperspectral Technology. Entropy 2021, 23, 486. [Google Scholar] [CrossRef] [PubMed]
  3. Pathak, D.; Satwani, M.; Patel, M.; Patel, C. The development of silicone rubber composite insulators in power system. In Proceedings of the 2009 International Conference on Control, Automation, Communication and Energy Conservation, Perundurai, India, 4–6 June 2009; pp. 1–4. [Google Scholar]
  4. Gao, S.; Jia, J.; Huang, X.; Liu, Y.; Zhang, B.; Zhang, Y.; Geng, J. Research on Electric Field Detection of Degraded Insulators Based on a Sensitive Detection Method under Complex Operating Conditions. Appl. Sci. 2022, 12, 5680. [Google Scholar] [CrossRef]
  5. Li, Z.; Zheng, Z.; Shi, S.; Rui, E. Design of Porcelain Insulator Defect Recognition System Based on UAV Line Inspection Image. In 6GN for Future Wireless Networks; Springer: Cham, Switzerland, 2022; Volume 5, pp. 397–408. [Google Scholar] [CrossRef]
  6. Liu, X.; Miao, X.; Jiang, H.; Chen, J. Data analysis in visual power line inspection: An in-depth review of deep learning for component detection and fault diagnosis. Annu. Rev. Control. 2020, 50, 253–277. [Google Scholar] [CrossRef]
  7. Zheng, Y.; Hao, Y.; Liu, L.; Zhang, Z.; Yang, L.; Wang, G.; Gao, C.; Zhou, F. An Ultrasonic Nondestructive Testing Method for Density Uniformity of Basin-Type Insulators in GIS. IEEE Trans. Instrum. Meas. 2021, 70, 6010308. [Google Scholar] [CrossRef]
  8. Li, Z.; Song, Y.; Li, R.; Gu, S.; Fan, X. A Novel Data Augmentation Method for Improving the Accuracy of Insulator Health Diagnosis. Sensors 2022, 22, 8187. [Google Scholar] [CrossRef]
  9. Chen, Z.; Xiao, Y.; Zhou, Y.; Li, Z.; Liu, Y. Insulator Recognition Method for Distribution Network Overhead Transmission Lines Based on Modified YOLOv3. In Proceedings of the 2020 Chinese Automation Congress (CAC), Shanghai, China, 6–8 November 2020; pp. 2815–2820. [Google Scholar] [CrossRef]
  10. Yang, L.; Fan, J.; Liu, Y.; Li, E.; Peng, J.; Liang, Z. A Review on State-of-the-Art Power Line Inspection Techniques. IEEE Trans. Instrum. Meas. 2020, 69, 9350–9365. [Google Scholar] [CrossRef]
  11. Zhai, Y.; Chen, R.; Yang, Q.; Li, X.; Zhao, Z. Insulator Fault Detection Based on Spatial Morphological Features of Aerial Images. IEEE Access 2018, 6, 35316–35326. [Google Scholar] [CrossRef]
  12. Vijayalakshmi, N.; Sindhu, S.; Suriya, S. Automatic Vehicle Number Recognition System using Character Segmentation and Morphological algorithm. In Proceedings of the 2020 IEEE International Conference on Advances and Developments in Electrical and Electronics Engineering (ICADEE), Coimbatore, India, 10–11 December 2020; pp. 1–5. [Google Scholar] [CrossRef]
  13. Wu, Q.; An, J.; Lin, B. A Texture Segmentation Algorithm Based on PCA and Global Minimization Active Contour Model for Aerial Insulator Images. IEEE J. Sel. Top. Appl. Earth Obs. Remote Sens. 2012, 5, 1509–1518. [Google Scholar] [CrossRef]
  14. Wu, Q.; An, J. An Active Contour Model Based on Texture Distribution for Extracting Inhomogeneous Insulators from Aerial Images. IEEE Trans. Geosci. Remote Sens. 2014, 52, 3613–3626. [Google Scholar] [CrossRef]
  15. Zhang, G.; Liu, Z.; Han, Y. Automatic recognition for catenary insulators of high-Speed railway based on contourlet transform and Chan–Vese model. Optik 2016, 127, 215–221. [Google Scholar] [CrossRef]
  16. Yu, Y.; Cao, H.; Wang, Z.; Li, Y.; Li, K.; Xie, S. Texture-and-Shape Based Active Contour Model for Insulator Segmentation. IEEE Access 2019, 7, 78706–78714. [Google Scholar] [CrossRef]
  17. Zhou, M.; Wang, J.; Li, B. ARG-Mask RCNN: An Infrared Insulator Fault-Detection Network Based on Improved Mask RCNN. Sensor 2022, 22, 4720. [Google Scholar] [CrossRef] [PubMed]
  18. Girshick, R. Fast R-CNN. In Proceedings of the 2015 IEEE International Conference on Computer Vision (ICCV), Santiago, Chile, 7–13 December 2015; pp. 1440–1448. [Google Scholar] [CrossRef]
  19. Hu, H.; Liu, Y.; Rong, H. Detection of Insulators on Power Transmission Line Based on an Improved Faster Region-Convolutional Neural Network. Algorithms 2022, 15, 83. [Google Scholar] [CrossRef]
  20. Redmon, J.; Divvala, S.; Girshick, R.; Farhadi, A. You Only Look Once: Unified, Real-Time Object Detection. In Proceedings of the 2016 IEEE Conference on Computer Vision and Pattern Recognition (CVPR), Las Vegas, NV, USA, 27–30 June 2016; pp. 779–788. [Google Scholar] [CrossRef] [Green Version]
  21. Redmon, J.; Farhadi, A. YOLO9000: Better, Faster, Stronger. In Proceedings of the 2017 IEEE Conference on Computer Vision and Pattern Recognition (CVPR), Honolulu, HI, USA, 21–26 July 2017; pp. 6517–6525. [Google Scholar] [CrossRef]
  22. Redmon, J.; Farhadi, A. YOLOv3: An Incremental Improvement. arXiv 2018, arXiv:1804.02767. [Google Scholar] [CrossRef]
  23. Bochkovskiy, A.; Wang, C.-Y.; Liao, H.-Y.M. YOLOv4: Optimal Speed and Accuracy of Object Detection. arXiv 2020, arXiv:2004.10934. [Google Scholar] [CrossRef]
  24. Bao, W.; Du, X.; Wang, N.; Yuan, M.; Yang, X. A Defect Detection Method Based on BC-YOLO for Transmission Line Components in UAV Remote Sensing Images. Remote Sens. 2022, 14, 5176. [Google Scholar] [CrossRef]
  25. Chen, W.; Li, Y.; Zhao, Z. Missing-Sheds Granularity Estimation of Glass Insulators Using Deep Neural Networks Based on Optical Imaging. Sensors 2022, 22, 1737. [Google Scholar] [CrossRef]
  26. Cao, M.; Fu, H.; Zhu, J.; Cai, C. Lightweight tea bud recognition network integrating GhostNet and YOLOv5. Math. Biosci. Eng. 2022, 19, 12897–12914. [Google Scholar] [CrossRef]
  27. He, K.; Zhang, X.; Ren, S.; Sun, J. Spatial Pyramid Pooling in Deep Convolutional Networks for Visual Recognition. IEEE Trans. Pattern Anal. Mach. Intell. 2015, 37, 1904–1916. [Google Scholar] [CrossRef] [Green Version]
  28. Ultralytics/yolov5. Available online: https://github.com/ultralytics/yolov5 (accessed on 25 June 2020).
  29. Wang, C.-Y.; Liao, H.-Y.M.; Wu, Y.-H.; Chen, P.-Y.; Hsieh, J.-W.; Yeh, I.-H. CSPNet: A new backbone that can enhance learning capability of CNN. In Proceedings of the IEEE/CVF Conference on Computer Vision and Pattern Recognition Workshops, Seattle, WA, USA, 14–19 June 2020; pp. 390–391. [Google Scholar] [CrossRef]
  30. Hu, J.; Shen, L.; Sun, G. Squeeze-and-Excitation Networks. In Proceedings of the 2018 IEEE/CVF Conference on Computer Vision and Pattern Recognition, Salt Lake City, UT, USA, 18–23 June 2018; pp. 7132–7141. [Google Scholar] [CrossRef]
  31. Zhou, J.; Jiang, P.; Zou, A.; Chen, X.; Hu, W. Ship Target Detection Algorithm Based on Improved YOLOv5. J. Mar. Sci. Eng. 2021, 9, 908. [Google Scholar] [CrossRef]
  32. Liu, S.; Huang, D. Receptive field block net for accurate and fast object detection. In Proceedings of the European Conference on Computer Vision (ECCV), Munich, Germany, 8–14 September 2018; pp. 385–400. [Google Scholar] [CrossRef]
  33. Ren, S.Q.; He, K.M.; Girshick, R.; Sun, J. Faster R-CNN: Towards Real-Time Object Detection with Region Proposal Networks. IEEE Trans. Pattern Anal. Mach. Intell. 2017, 39, 1137–1149. [Google Scholar] [CrossRef] [PubMed] [Green Version]
  34. Shi, X.; Su, Y.; Ti, Y.; Song, T. A_CenterNet: Object as a Point by Attention. Int. J. Pattern Recognit. Artif. Intell. 2022, 36, 2255011. [Google Scholar] [CrossRef]
Figure 1. Original YOLOv5 network model detection block diagram.
Applsci 12 12682 g001
Figure 2. Improving the backbone network of YOLOv5.
Applsci 12 12682 g002
Figure 3. Internal structure diagram of each module in the backbone network. (a) The internal structure of Ghost1 _ X module in the backbone network; (b) the internal structure of CBL module in the backbone network; (c) the internal structure of Ghost2 _ X module in the backbone network; (d) the internal structure of Ghost module in the backbone network; (e) The internal structure of SE module in the backbone network.
Applsci 12 12682 g003
Figure 4. CRF receptive field module.
Applsci 12 12682 g004
Figure 5. Improving the overall structure of YOLOv5.
Applsci 12 12682 g005
Figure 6. P-R curve. (a) P-R curve of method 1 in ablation experiment; (b) P-R curve of method 2 in ablation experiment; (c) P-R curve of method 3 in ablation experiment; (d) P-R curve of method 4 in ablation experiment.
Applsci 12 12682 g006
Figure 7. Detection results of different network models. (a) Figure (A) shows the detection results under different network models; (b) Figure (B) shows the detection results under different network models; (c) Figure (C) shows the detection results under different network models.
Applsci 12 12682 g007
Table 1. Comparison of different receptive field modules.
Receptive Field
Module
N-InsulatorD-InsulatormAP@50
PRPR
SPP0.8770.7390.9370.9560.913
RBF0.8740.91910.9670.966
CRF0.9150.9080.98810.974
Table 2. Performance index comparison of ablation experiment.
MethodGhost
Module
Increase of
Detection Layer
CRF Receptive
Field Module
N-InsulatorD-Insulator[email protected]
PRPR
1×××0.8450.8050.93310.901
2××0.8140.7710.97610.896
3×0.9090.8790.990.9790.955
40.9150.9080.98810.974
Table 3. Performance comparison of different models.
ModuleN-InsulatorD-Insulator[email protected]FPS
PRPR
Faster-RCNN0.75410.94590.43750.9130.83212
CenterNet0.8250.576610.13040.77656
YOLOv50.8450.8050.93310.90153
Ours0.9150.9080.98810.97462
Publisher’s Note: MDPI stays neutral with regard to jurisdictional claims in published maps and institutional affiliations.

