Article

An Improved Method to Obtain Fish Weight Using Machine Learning and NIR Camera with Haar Cascade Classifier

by
Samuel Lopez-Tejeida
1,
Genaro Martin Soto-Zarazua
1,*,
Manuel Toledano-Ayala
2,
Luis Miguel Contreras-Medina
1,
Edgar Alejandro Rivas-Araiza
2 and
Priscila Sarai Flores-Aguilar
1
1
Facultad de Ingeniería Campus Amazcala, Universidad Autónoma de Querétaro, Carretera a Chichimequillas S/N Km 1, Amazcala, El Marqués 76265, Querétaro, Mexico
2
Facultad de Ingeniería Centro Universitario, Universidad Autónoma de Querétaro, Cerro de las Campanas S/N, Santiago de Querétaro 76010, Querétaro, Mexico
*
Author to whom correspondence should be addressed.
Submission received: 29 November 2022 / Revised: 9 December 2022 / Accepted: 13 December 2022 / Published: 21 December 2022
(This article belongs to the Special Issue Agriculture 4.0 – the Future of Farming Technology)

Abstract

:
The calculation of weight and mass in aquaculture systems is of great importance, since with this task, it is decided when to harvest; generally, the above is manipulating the body manually, which causes stress in the fish body. Said stress can be maintained in the fish body for several hours. To solve this problem an improved method was implemented using artificial intelligence, near-infrared spectroscopy camera, Haar classifiers, and a mathematical model. Hardware and software were designed to get a photograph of the fish in its environment in real conditions. This work aimed to obtain fish weight and fish length in real conditions to avoid the manipulation of fish with hands for the process mentioned, avoiding fish stress, and reducing the time for these tasks. With the implemented hardware and software adding an infrared light and pass band filter for the camera successfully, the fish was detected automatically, and the fish weight and length were calculated moreover the future weight was estimated.

1. Introduction

Imaging object detection, nowadays, is widely used to identify objects. However, the most advantageous to the classification of moving objects [1], especially underwater object detection, has been a challenge because the water influences the recognition of the object [2]. The use of image analysis has produced applications that help in the agriculture to medicine fields [3]. On the other hand, in aquaculture, multiple tasks can be performed using imaging detection. However, there are also modern practices involving automation and intelligent technology [4]; technology such as the internet of thing (IoT) helps to obtain data from the tank culture with the use of sensors and avoid poor levels of oxygen, water contamination, parasites, or disease transmission [5]. Additionally, some examples are the regression methods used in aquaculture for the management and water quality predictions, time series methods, artificial neural network methods, and support machine methods [6]. Moreover, agriculture 4.0 contributes to the development of agriculture because crops can be cultivated much easier with less effort in less time, as well as every time the growing variables can be monitored by a sensor and displayed on a PC or cell phone screen: digital technologies such as cyber-physical (CPS), artificial intelligence (AI), wireless sensor networks (WSN), big data analytics (BDA), autonomous robots systems (ARS), and ubiquitous cloud computing (UCC) [7].
An essential aspect of aquaculture farms is fish growth; the fish’s body length and width are related to fish weight. This information calculates the feeding ratio, fish size classification, and harvest [8]. Regularly, these data are collected manually, transforming into an expensive and tiring, as well as a waste of time, experience for intensive systems [9]; moreover, handling the fish with hands causes stress to it, and stress causes cortisol. It is accepted that long-term elevation in cortisol results in reduced food intake and growth in fish [10]. In addition to avoiding stress fish, there are different non-invasive methods, such as mathematical models or the length–weight relationship (LWR). They are based on numerical observations that can estimate fish biomass [11]; moreover, there is substantial demand for automatic fish monitoring systems, because these could improve efficiency and reduce the labor requirements in the aquaculture industry [12]. A machine vision system (MVS) consists of an image acquisition system, image processing, and statistical analysis [13], and MVS is a non-invasive technique for estimating fish mass and size, which has been attracting the interest of researchers because it avoids stress and injury [14]. Another vital aspect of MVS is that these fish sampling systems involve two tasks: fish detection, which discriminates fish from non-fish objects in underwater videos, and fish species classification, which identifies the species of the detected fish [15]. The quality of the images will depend on the light conditions at the time of the shooting; otherwise, if this factor is ideal, more accurate processing results will be achieved [16].
Some aquaculture installations have poor lighting, and near-infrared (NIR) computer vision technology is not affected by visible light intensity. It can obtain good imaging results in relatively dim light environments [17]. The NIR had other advantages: autofluorescence, deeper tissue penetration, and minimum photodamage to biological samples [18]. Additionally, the NIR has the rapid acquisition of sample data, the potential for simultaneous determination of several parameters, and the ability to replace destructive, expensive, and time-consuming conventional reference methods [19]. Another tool is Haar cascading by machine learning method; this uses a classifier from many positive and negative photos [20]; the advantage of using the machine learning method is short detection time, high detection rate, and strong adaptability to light changes [21]. In the case of machine vision system, ref. [1] used convolutional neural network and machine vision to provide an automatic method for grading fish feeding intensity; additionally, ref. [2] used a machine vision system including a multi-column convolution neural network (MCNN) and deeper dilated convolution neural network (DCNN) for counting fishes; finally, ref. [3] used machine vision, acoustics. and sensors to analyze fish behavior in pro of production and management decisions.
This article aims to show a non-invasive method to obtain fish weight using image NIR plus Haar cascading classifiers. These tools are used to segment the fish and obtain fish length, then obtain accurate weight measurements with a mathematical model. Generally, the mathematical models used for aquaculture are logistics, exponential, Michaelis-Menten, Gompertz, Von Bertalanffy, and Janoschechk. Finally, this work is different from others; in the first instance, it used an infrared camera adding a pass-band filter lens to reduce the wavelength, obtain more focus in capturing the fish, and avoid the noise that can interfere; it also used Haar classifier to identify the fish in the culture system, and compared with other works, they used more complex analysis such as the convolution neural network, multi-column convolution neural network, artificial neural network, or wavelet; lastly, the system used a mathematical model to estimate fish future weight and length.

2. Materials and Methods

2.1. System Design

An essential aspect of the experiment was how to get the pictures; for this task, a way to place all the used elements was implemented, and it is shown in Figure 1.
Each number specifies an element:
  • PC was used with the NIR camera and MATLAB 9 software to program the Haar cascade classifier.
  • NIR camera iDS brand, made in Germany, Dimbacher Str. 10, UI-3240CP-NIR-GL model, this camera is infrared sensitive in the near-infrared range. The equipment was obtained in the web page of the brand.
  • Kowa lens sensor size 2/3″, focal length 1.4–12 mm, C mound, and this lens has a passband filter. The equipment was obtained in Midwest Optical System.
  • The species used in this case for the experiment was tilapia used.
  • Glass fishbowl 30 cm long × 20 cm wide × 22 cm high.
  • Infrared lamp INF-L-DBLIR082/16H.
  • Lighting controller, CCS Inc. (Tokyo, Japan) PD3-5024-4-EI(A); lastly, to subject the camera, two tripods were used, one DOLICA ST650 brand with clamp and another of the Manfrotto brand obtained the webpage
The operation of the system is as follows. First, the image is captured by the NIR camera this camera is connected to the PC, the information captured by the camera is used by an algorithm done with Haar cascade classifier and mathematical models. Lastly, the information related to fish actual length, future length, the actual weight, and future weight is shown in the user interface.

2.2. Image Acquisition System

An essential aspect of obtaining images is the light from the environment, which is the reason for the use of a NIR camera. To obtain the collection fish data, the fish species used was tilapia Oreochromis niloticus; a total of 1200 pictures were obtained with the NIR camera; the resolution of 1.3 MP, 1280 × 1024, and the image format used was PNG, later the software was trained whit these pictures. The camera was collocated in two places to get the pictures; first, the camera was placed in front of the fishbowl; an infrared lamp stood behind; this one was placed behind the fishbowl to increase the intensity of light images. The fishbowl was filled with water, and some fish got into it; this camera configuration is shown in Figure 2. The procedure to take the pictures was necessary to connect the NIR camera to the PC through the USB port. In the pc was installed, as well as the NIR infrared camera software, and using this software, the images were taken, and we saved them in the PC.
The second configuration considered the camera above the fishbowl and the infrared lamp above the fishbowl; because fish culture tanks are made of black geomembrane, it is impossible to set the NIR camera in front of the fish tank and the infrared lamp opposite to the fish tank Figure 3.

2.3. Fish Growth Models

An essential aspect of the experiment was to choose a growth model; fish growth is any change in size or amount of body. These changes could be positive or negative, and the fish length can be obtained the weight with the equation:
W = a L n
where W is the fish weight in grams; L is the fish length in cm; a is the intersection in the y-axis, and n is the exponent to estimate the fish’s well-being.
A relationship to know the fish’s fatness or well-being and the condition factor [22]. This relationship is shown in Equation (1). Additionally, can be transformed to:
log   W = log   a + b log   L
The formula expresses the following, in the case of b, it might not vary from the ideal value of 3.0, depicting an isometric growth; otherwise, if b has a value less than 3.0, the fish is turning slimmer with increasing length, and growth is considered negative allometric. On the other hand, if b is greater than 3.0, the fish is getting heavier, which is proof of positive allometric growth, which shows an optimum condition. However, depending on the kind of fish feed, this relates to the quantity of protein in the fish feed [23].
There is another model that uses some variables, precisely the temperature [24], taking into account that fish is a poikilothermic species; Equation (3) is shown a model growth based on temperature:
Δ L = 1.6707 + 0.09682   T
where L is the length in cm and T is the temperature in °C.
The result obtained in Equation (3) can be transformed to weight by Equation (4)
W = 1.861 × 10 8 · L 3
where W is weight in grams and L is the length in cm.
Mainly for the experiment was interested in the models that predict the growth of the fish, depending on the age and then thrown length in cm; the logistic, Michaelis-Menten, Gompertz, Von Bertalanffy, and Janoscheck models were the basis. Taking into account that the artificial vision device coupled with the processing software would show the length of the fish, the models used were the Michaelis-Menten model; the equation used in the algorithm was:
L e n g t h = 0.009 235.27 2.983 + 630.14 d a y 2.983 235.27 2.983 + d a y 2.983
The other mathematical model used was the Logistic, shown in Equation (6), unlike the Michaelis-Menten model, which predicts the weight in grams based on age in days.
W e i g h t = 427.64 1 + 85.9133 e 0.023612 d a y  

2.4. Algorithm Training

The software used for the experiment was MATLAB; this software has a tool called Haar Clasiffier, and this software can obtain the classification in real-time. The training algorithm was performed with 1200 images taken by the camera. The classifier has pre-trained classifier objects, but generally, they refer to body parts, so it is impossible to use the pre-trained classifiers for this work. For the experimental object detector, 1200 fish images were loaded into the algorithm; these were considered positive samples, and the algorithm also needed negative samples. The negative samples were pictures taken with the NIR camera, but these images were not fish and were considered negative. With this training, the algorithm could detect regions of interest and differentiate between fish and non-fish. Additionally, the algorithm can automatically generate negative samples to increase the training level, which improves the algorithm to detect fishes and objects that are not fishes. Figure 4 shows a positive image, and Figure 5 shows a negative image. After the training, the system could automatically identify the fish in the fishbowl using the Haar classifier. Then, the system will be collocated in an aquaculture system to be proven. Lastly, the image labeler was used, which provides an easy way to identify the positive samples by interactively specifying rectangular regions of interest. Additionally, the positive images previously saved can be made more positive by adding rotation noise or by varying brightness or contrast. In the case of negative images, as more stages are added, the detector’s overall false positive rate decreases, causing the generation of negative samples to be more difficult. An aspect to take into consideration is that Haar classifier can throw false positives. In this training, the false positive test was performed with the camera taking objects that can be in the fish environment, but are not fish, these were classified as negative images. In the first instances, there could be many false positives, but as the training continues, this false positive rate starts to reduce. The impact on the test result is that, in the beginning, the software could throw false positives, but with the use of the software, this will decrease.
For this reason, it is helpful to supply as many negative images as possible. To improve training accuracy, we supplied negative images with backgrounds typically associated with the objects of interest. Additionally, we included negative images that contained non-objects similar in appearance to the objects of interest.
The strong classifier used in this work was the Adaboost for searching a small number of features related to fish and not having a significant variation.

2.5. Image Processing

After algorithm training, the system was put to work in real-time; for this, the NIR camera was used to set communication with the computer through USB protocol and show live video in the software interface implemented in the previously designed PC. First, the system was tested with the first configuration; the way to do this was after the NIR camera and the infrared lamp were collocated in their respective positions. The software interface has the option to capture video, and when this is performed automatically in an interface implemented, it appears on the length and weight of the fish. Figure 6 shows how the algorithm performs the image processing.
As shown in Figure 6, the main algorithm comprises two main blocks: the pre-processing and the estimation. It starts when the NIR camera plays the captured video, and the algorithm instantly detects if the objects that appear in the camera are fish or not, and it is possible to perform by using Haar classifiers in the algorithm using only a region of interest for the investigation. The fish detector generates a box containing the fish detected correctly; that is, when the fish is entirely in a lateral position, this is shown in Figure 7. This performed through a process that is transparent for the user. Once the region of interest is delimited, the image is extracted and processed to extract its contour, obtaining the width and length measurements of the fish in pixel dimensions.
This kind of processing is considered a machine learning approach because later it could automatically identify the objects of interest by marking them with a box chart, as shown in Figure 7; the MATLAB software was used to train the algorithm. The way that the algorithm identifies the fish apart from the positive and negative images requires a way to identify the object rapidly; in this regard, the Haar classifiers are used. The image is detected, then the algorithm applies the Haar classifiers, and instantly the parts are discarded from the image that do have not the object of interest; this is made with statistics, and the Haar classifiers implemented in the algorithm use rectangles (Figure 8) to identify the objects of interest.
The below algorithm performs using the integral image at locations x, y that contains the sum of pixels above and left x, y, adding.
i i x , y = x x , y y i x , y ,  
where i i x , y is the integral image and i x , y is the original image, and the following occurrences are used:
s x , y = s x , y 1 + i x , y
i i x , y = i i x 1 ,   y + s x , y
where x , y is the cumulative row sum, s x , y = 0 , and i i 1 ,   y = 0 the integral image can be compounded in one pass over the original image [4]. All the basis to this processing was initiated by [25]

2.6. User Interface

A user interface was made to make the system easy to use; with a NIR camera, an image was obtained, then the initial weight, initial length, future weight, and future length appeared in the interface. Additionally, an option was needed for the number of days to estimate the future weight and length; for this, mathematical models were used. Figure 9 shows the user interface.

3. Results

3.1. NIR Camera

The distance between the camera and the center of the fish tank was adjusted to 30 cm to obtain an image that could capture both juvenile and adult fish. During the development of the prototype, tests were carried out at the laboratory under controlled conditions to prove the concept and verify the correct functioning of the algorithm and the integral system; they were also made with different lighting levels, and lamp positions are shown in Figure 10. The best position for the laboratory setting was opposite the fishbowl; in the case of the 500 L fish tank the best position was on the top.
To verify if the algorithm made the correct conversion from pixel to centimeters, Figure 11 shows the capture obtained with the NIR camera using a tape measure.
Infrared lighting and the infrared camera allow a high contrast between the object of interest and the rest of the habitat, thus allowing for elements that can be considered noise to be ruled out, with said noise being the color of the water in the fish tank or suspended particles. With the band-pass filter, it was possible to block everything below or above 850 nm wavelength, so all components within the visible spectrum of light, such as colors, were removed.

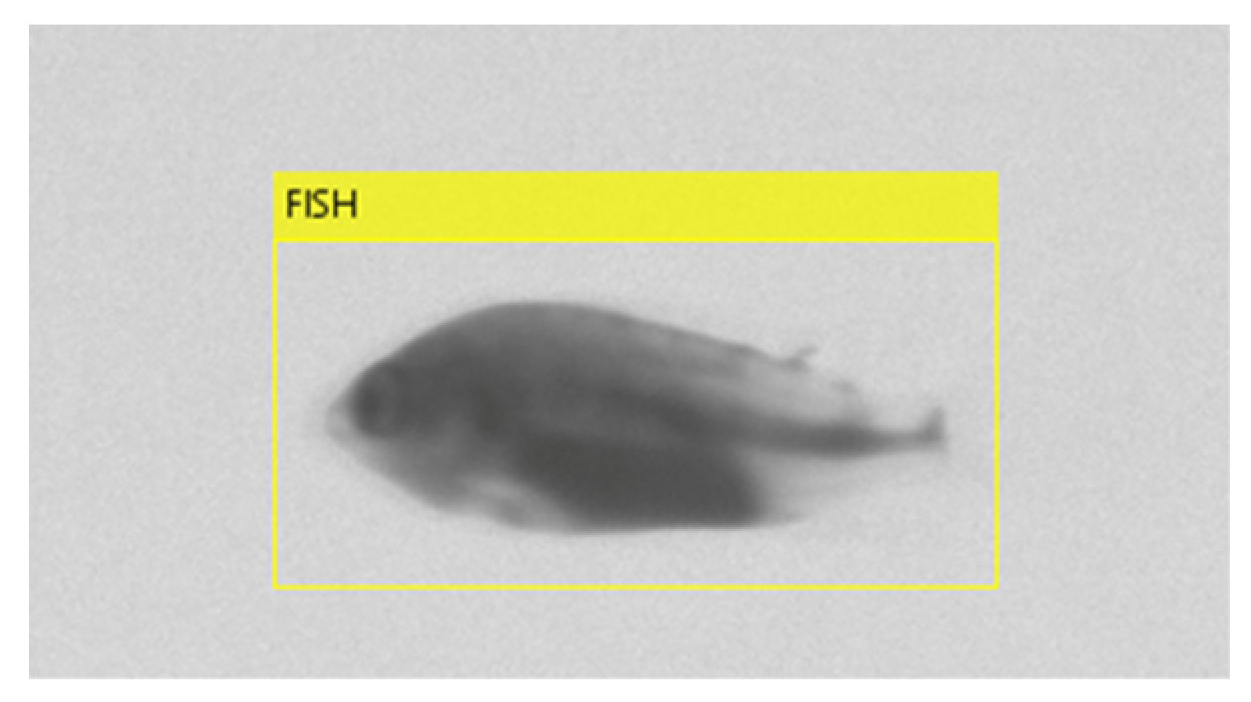
3.2. Haar Cascade Fish Detection

The work considered a non-intensive density, 20 kg/m3, and in an intensive system, the density was 80 kg/m3; the system was tested with both densities. The algorithm was capable of detecting fish within their typical development habitat. Processing time was around 1.5 s from image capture to fish measurement display.
The algorithm contributes to fish detection because the fish recognition is automatic, due to the camera or video [5], the algorithm can analyze a large amount of data in a short time, and the data previously was saved in the algorithm [6], also the algorithm allows segmenting the object in more difficult environments [7]; moreover, the algorithm can be combined with other methods to improve it [8].
The testing dataset was performed after the training, and this was performed using the first system configuration shown in Figure 12; several repetitions were made, which consisted of detecting the fish in the small fishbowl. The validation stage was performed using a 500 L fish tank, and in these tanks, a certain number of fish were placed, and the validation was performed on different days by taking photographs from different tanks. Additionally performed were weight and length measurements to corroborate the validation of the algorithm. The recognition performance obtained from the validation phase resulted in an average accuracy of 92%, a true positive rate equal to 95%, and finally, a false positive rate equal to 12%.
Several measurements were performed to validate the prototype and graphical interface, using the prototype and recording data in different tanks with fish of the same size and age. These measurements were performed at different times; Figure 13 shows the tanks and the camera collocated nearby by the tanks, Figure 14 shows the data interface with the algorithm.

3.3. Mathematical Model

The two models used in the experiment to obtain an equation based on the length in centimeters that can estimate the weight in grams were combined in a regression, taking the logistic model that estimates the weight based on age in days as the dependent variable. As an independent variable, the Michaelis-Menten model estimated the length based on age in days. Figure 15 shows the regression analysis.
As previously mentioned, the algorithm and the interface were used to have a complete system; the algorithm evaluated the images obtained with the camera, and the interface showed the length and weight that appeared in Figure 14.
With the previous regression obtained, the equation related the length in centimeters and the weight in grams
W e i g h t = 0.339061 + 0.482898 l e n g t h 2
Subsequently, the length in the previous equation was used to estimate the fish culture day. Additionally, a regression analysis was performed, taking the day as the dependent variable and length as rgw independent variable; the equation obtained was:
T i m e = 4.86558 + 0.013364 l e n g t h 2 2
With the day entered by the user, the interface returned the fish’s future weight and future length. Additionally, it took into account the resulting length and weight that the interface returns by the artificial vision system for these Equations (5) and (6) were used. Figure 16 shows the graph in which the future weight adjustment is made, taking into account the weight thrown by the interface based on the length of the artificial vision system.
An adjustment was made, considering the length thrown by the interface. With these adjustments, the weight and length prediction were more accurate (Figure 17).
In this part, the weight and length error analysis were performed with statistical software that estimated the r-square.

4. Discussion

Selecting an appropriate distance and illumination for using the NIR camera is essential and has to be fixed throughout the experiment. As used by [14], the distance from level water to the camera was 140 cm, whereas [17] used a distance of 150 cm. For the experiment, 150 cm was the distance, and the tank used had a depth of 50 cm; in this case, the system can only capture fish on the water’s surface. Another limitation is density, but if the system has the required flow water speed, this is not a limitation. The NIR camera has a harmless wavelength between 700 to 1400 nm and can penetrate biological tissues. Additionally, this is used in different fields, for example, to monitor leaf area [26], for iris recognition [27], automobile tasks [28], fire detection [29], detect chemical compounds [30], and finger veins recognition [31].
As previously mentioned, the Haar classifier is considered in machine learning tools; unlike other tools, such as convolutional works, big data analytics, or the internet of things, the Haar classifier just needs a one pc. For the other tools, an internet connection or cloud space is required. In the experiment, a pass band filter was used to reduce the wavelength, get focus in a specific wavelength, and help to have less range of experimentation.
The Haar classifiers are mainly used for face detection, but some applications are used for different challenges, such as automotive applications [32,33], agriculture [34], and cataract detection [35]. Generally, the Haar classifier can be adapted for every application, such as in this work. However, the essential part is the training part, and if this training is complex, the Haar classifier can be used for any application. Regarding this work, the training part can be more complicated, but this implies the waste of resources because, for aquaculture applications, the environment has fish and is less likely to have negative images considered as no fish.
The mathematical models were an essential part of this experiment. They helped to obtain a relation between length and weight. Models in aquaculture are used for feeding control [36], production in general [37], harvest [38], energy calculation [39], and monitoring culture variables [40], and the use of these models helps the aquaculture system to have a precision culture. However, the most crucial aspect of aquaculture is growth, such as the model used in this experiment. The mathematical model used in the experiment had good results, as shown in Figure 16 and Figure 17.

5. Conclusions

The method first allowed for the recognition of the fish and then the processing to obtain fish length and fish weight to avoid the fish stress because of the handling. The measurement task by hand takes consideration time; this method consumes less time for this task. If the environment of the fish changes or the species is different, new training in the software will be required.
As time goes, applications related to artificial intelligence will be more common; this technology allows to have a better control in the majority of systems of production.

Author Contributions

S.L.-T.: writing—original draft preparation. G.M.S.-Z.: review. M.T.-A.: software. L.M.C.-M.: validation. E.A.R.-A.: data curation. P.S.F.-A.: resources. All authors have read and agreed to the published version of the manuscript.

Funding

Consejo Nacional de Ciencia y Tecnologia (CONACY), and scholarship provided for the same institution.

Institutional Review Board Statement

Not applicable.

Informed Consent Statement

Not applicable.

Conflicts of Interest

The authors declare no conflict of interest.

References

  1. Kiaee, N.; Hashemizadeh, E.; Zarrinpanjeh, N. Using GLCM features in Haar wavelet transformed space for moving object classification. IET Intell. Transp. Syst. 2019, 13, 1148–1153. [Google Scholar] [CrossRef]
  2. Arvind, C.S.; Prajwal, R.; Bhat, P.N.; Sreedevi, A.; Prabhudeva, K.N. Fish Detection and Tracking in Pisciculture Environment using Deep Instance Segmentation. In Proceedings of the 2019 IEEE Region 10 Conference/TENCON, Kochi, India, 17–20 October 2019. [Google Scholar] [CrossRef]
  3. Saleh, A.; Sheaves, M.; Rahimi Azghadi, M. Computer vision and deep learning for fish classification in underwater habitats: A survey. Fish Fish. 2022, 23, 977–999. [Google Scholar] [CrossRef]
  4. Zhao, S.; Zhang, S.; Liu, J.; Wang, H.; Zhu, J.; Li, D.; Zhao, R. Application of machine learning in intelligent fish aquaculture: A review. Aquaculture 2021, 540, 736724. [Google Scholar] [CrossRef]
  5. Chiu, M.-C.; Yan, W.-M.; Bhat, S.A.; Huang, N.-F. Development of smart aquaculture farm management system using IoT and AI-based surrogate models. J. Agric. Food Res. 2022, 9, 100357. [Google Scholar] [CrossRef]
  6. Yu, H.; Yang, L.; Li, D.; Chen, Y. A hybrid intelligent soft computing method for ammonia nitrogen prediction in aquaculture. Inf. Process. Agric. 2021, 8, 64–74. [Google Scholar] [CrossRef]
  7. Abbasi, R.; Martinez, P.; Ahmad, R. An ontology model to represent aquaponics 4.0 system’s knowledge. Inf. Process. Agric. 2022, 9, 514–532. [Google Scholar] [CrossRef]
  8. Yu, C.; Fan, X.; Hu, Z.; Xia, X.; Zhao, Y.; Li, R.; Bai, Y. Segmentation and measurement scheme for fish morphological features based on Mask R-CNN. Inf. Process. Agric. 2020, 7, 523–534. [Google Scholar] [CrossRef]
  9. Rahman, A.; Xi, M.; Dabrowski, J.J.; McCulloch, J.; Arnold, S.; Rana, M.; George, A.; Adcock, M. An integrated framework of sensing, machine learning, and augmented reality for aquaculture prawn farm management. Aquac. Eng. 2021, 95, 102192. [Google Scholar] [CrossRef]
  10. Mccormick, S.D. General and Comparative Endocrinology Effects of long-term cortisol treatment on growth and osmoregulation of Atlantic salmon and brook trout. Gen. Comp. Endocrinol. 2021, 308, 113769. [Google Scholar] [CrossRef]
  11. Dash, G.; Sen, S.; Pradhan, R.K.; Ghosh, S.; Josileen, J.; Jayasankar, J. Modeling framework for establishing the power law between length and weight of fishes and a meta-analysis for validation of LWRs for six commercially important marine fishes from the northwestern Bay of Bengal. Fish. Res. 2023, 257, 106496. [Google Scholar] [CrossRef]
  12. Terayama, K.; Shin, K.; Mizuno, K.; Tsuda, K. Aquacultural Engineering Integration of sonar and optical camera images using deep neural network for fish monitoring. Aquac. Eng. 2019, 86, 102000. [Google Scholar] [CrossRef]
  13. Azarmdel, H.; Mohtasebi, S.S.; Jafari, A.; Muñoz, A.R. Developing an orientation and cutting point determination algorithm for a trout fish processing system using machine vision. Comput. Electron. Agric. 2019, 162, 613–629. [Google Scholar] [CrossRef]
  14. Saberioon, M.; Císa, P. Automated within tank fish mass estimation using infrared reflection system. Comput. Electron. Agric. 2018, 150, 484–492. [Google Scholar] [CrossRef]
  15. Salman, A.; Maqbool, S.; Hannan, A.; Jalal, A.; Shafait, F. Ecological Informatics Real-time fish detection in complex backgrounds using probabilistic background modelling. Ecol. Inform. 2019, 51, 44–51. [Google Scholar] [CrossRef]
  16. Rohani, A.; Taki, M.; Bahrami, G. Artificial Intelligence in Agriculture Application of arti fi cial intelligence for separation of live and dead rainbow trout fish eggs. Artif. Intell. Agric. 2019, 1, 27–34. [Google Scholar] [CrossRef]
  17. Zhou, C.; Zhang, B.; Lin, K.; Xu, D.; Chen, C.; Yang, X.; Sun, C. Near-infrared imaging to quantify the feeding behavior of fish in aquaculture. Comput. Electron. Agric. 2017, 135, 233–241. [Google Scholar] [CrossRef]
  18. Guo, R.; Ma, Y.; Tang, Y.; Xie, P.; Wang, Q.; Lin, W. Talanta A novel mitochondria-targeted near-infrared ( NIR ) probe for detection of viscosity changes in living cell, zebra fishes and living mice. Talanta 2019, 204, 868–874. [Google Scholar] [CrossRef]
  19. Zhou, J.; Wu, X.; Chen, Z.; You, J.; Xiong, S. Evaluation of freshness in freshwater fish based on near infrared reflectance spectroscopy and chemometrics. LWT-Food Sci. Technol. 2019, 106, 145–150. [Google Scholar] [CrossRef]
  20. Shetty, A.B.; Rebeiro, J. Facial recognition using Haar cascade and LBP classifiers. Glob. Transit. Proc. 2021, 2, 330–335. [Google Scholar] [CrossRef]
  21. Wang, G.; Zhang, L.; Sun, H.; Zhu, C. Longitudinal tear detection of conveyor belt under uneven light based on Haar-AdaBoost and Cascade algorithm. Meas. J. Int. Meas. Confed. 2021, 168, 108341. [Google Scholar] [CrossRef]
  22. Rodriguez, C.; Galli, O.; Olsson, D.; Tellechea, J.; Norbis, W. Length-weight relationships and condition factor of eight fish species inhabiting the Rocha Lagoon, Uruguay. Braz. J. Oceanogr. 2017, 65, 97–100. [Google Scholar] [CrossRef] [Green Version]
  23. Jisr, N.; Younes, G.; Sukhn, C.; El-Dakdouki, M.H. Length-weight relationships and relative condition factor of fish inhabiting the marine area of the Eastern Mediterranean city, Tripoli-Lebanon. Egypt. J. Aquat. Res. 2018, 44, 299–305. [Google Scholar] [CrossRef]
  24. Taylor, P.; Soderberg, R.W. A Linear Growth Model for Nile Tilapia in Intensive Aquaculture. North Am. J. Aquac. 2011, 68, 37–41. [Google Scholar] [CrossRef]
  25. Viola, P.; Jones, M. Rapid Object Detection using a Boosted Cascade of Simple Features. In Proceedings of the Accepted Conference on Computer Vision and Pattern Recognition, Kauai, HI, USA, 8–14 December 2001. [Google Scholar]
  26. Fan, X.; Kawamura, K.; Guo, W.; Xuan, T.D.; Lim, J.; Yuba, N.; Kurokawa, Y.; Obitsu, T.; Lv, R.; Tsumiyama, Y.; et al. A simple visible and near-infrared (V-NIR) camera system for monitoring the leaf area index and growth stage of Italian ryegrass. Comput. Electron. Agric. 2018, 144, 314–323. [Google Scholar] [CrossRef]
  27. Nguyen, D.T.; Pham, T.; Lee, Y.; Park, K.R. Deep learning-based enhanced presentation attack detection for iris recognition by combining features from local and global regions based on NIR camera sensor. Sensors 2018, 18, 2601. [Google Scholar] [CrossRef] [Green Version]
  28. Naqvi, R.A.; Arsalan, M.; Batchuluun, G.; Yoon, H.; Park, K.R. Deep learning-based gaze detection system for automobile drivers using a NIR camera sensor. Sensors 2018, 18, 456. [Google Scholar] [CrossRef] [Green Version]
  29. Burnett, J.D.; Wing, M.G. A low-cost near-infrared digital camera for fire detection and monitoring. Int. J. Remote Sens. 2018, 39, 741–753. [Google Scholar] [CrossRef]
  30. Zhou, X.; Geng, W.; Li, J.; Wang, Y.; Ding, J.; Wang, Y. An Ultraviolet–Visible and Near-Infrared-Responded Broadband NIR Phosphor and Its NIR Spectroscopy Application. Adv. Opt. Mater. 2020, 8, 1–8. [Google Scholar] [CrossRef]
  31. Kim, W.; Song, J.; Park, K.R. Multimodal biometric recognition based on convolutional neural network by the fusion of finger-vein and finger shape using near-infrared (NIR) camera sensor. Sensors 2018, 18, 2296. [Google Scholar] [CrossRef]
  32. Anggadhita, M.P.; Widiastiwi, Y. Breaches Detection in Zebra Cross Traffic Light Using Haar Cascade Classifier. In Proceedings of the 2020 International Conference on Informatics, Multimedia, Cyber and Information System (ICIMCIS), Jakarta, Indonesia, 19–20 November 2020; pp. 272–277. [Google Scholar] [CrossRef]
  33. Hakim, I.M.; Christover, D.; Marindra, A.M.J. Implementation of an image processing based smart parking system using haar-cascade method. ISCAIE 2019. In Proceedings of the 2019 IEEE 9th Symposium on Computer Applications & Industrial Electronics (ISCAIE), Kota Kinabalu, Sabah, Malaysia, 27–28 April 2019; pp. 222–227. [Google Scholar] [CrossRef]
  34. Marzan, C.S.; Marcos, N. Towards tobacco leaf detection using Haar cascade classifier and image processing techniques. ACM Int. Conf. Proceed. Ser. 2018, 173, 63–68. [Google Scholar] [CrossRef]
  35. Jacob, I.J. Data Intelligence and Cognitive Informatics. 2020. Available online: https://0-link-springer-com.brum.beds.ac.uk/10.1007/978-981-16-6460-1 (accessed on 20 November 2022).
  36. Zhou, C.; Xu, D.; Lin, K.; Sun, C.; Yang, X. Intelligent feeding control methods in aquaculture with an emphasis on fish: A review. Rev. Aquac. 2018, 10, 975–993. [Google Scholar] [CrossRef]
  37. Føre, M.; Frank, K.; Norton, T.; Svendsen, E.; Alfredsen, J.A.; Dempster, T.; Eguiraun, H.; Watson, W.; Stahl, A.; Sunde, L.M.; et al. Precision fish farming: A new framework to improve production in aquaculture. Biosyst. Eng. 2018, 173, 176–193. [Google Scholar] [CrossRef]
  38. Konovalov, D.A.; Saleh, A.; Efremova, D.B.; Domingos, J.; Jerry, D.R. Automatic Weight Estimation of Harvested Fish from Images. In Proceedings of the 2019 Digital Image Computing: Techniques and applications (DICTA), Perth, Australia, 2–4 December 2019. [Google Scholar] [CrossRef] [Green Version]
  39. Tirkolaee, E.B.; Goli, A.; Weber, G.W. Fuzzy Mathematical Programming and Self-Adaptive Artificial Fish Swarm Algorithm for Just-in-Time Energy-Aware Flow Shop Scheduling Problem with Outsourcing Option. IEEE Trans. Fuzzy Syst. 2020, 28, 2772–2783. [Google Scholar] [CrossRef]
  40. Parra, L.; Rocher, J.; Escrivá, J.; Lloret, J. Design and development of low cost smart turbidity sensor for water quality monitoring in fish farms. Aquac. Eng. 2018, 81, 10–18. [Google Scholar] [CrossRef]
Figure 1. Arrangement of materials.
Applsci 13 00069 g001
Figure 2. First system configuration.
Applsci 13 00069 g002
Figure 3. Second system configuration.
Applsci 13 00069 g003
Figure 4. Positive image.
Applsci 13 00069 g004
Figure 5. Negative image.
Applsci 13 00069 g005
Figure 6. Flow chart of the image processing.
Applsci 13 00069 g006
Figure 7. Fish detection by the algorithm.
Applsci 13 00069 g007
Figure 8. The process to identify a fish.
Applsci 13 00069 g008
Figure 9. User interface.
Applsci 13 00069 g009
Figure 10. Captures from NIR camera.
Applsci 13 00069 g010
Figure 11. Pixels to centimeters conversion.
Applsci 13 00069 g011
Figure 12. Weight and length measurement.
Applsci 13 00069 g012
Figure 13. The system used to test the algorithm.
Applsci 13 00069 g013
Figure 14. Interface and the algorithm.
Applsci 13 00069 g014
Figure 15. Regression analysis between two models (Logistic and Michaelis-Menten).
Applsci 13 00069 g015
Figure 16. Fish weight adjustment.
Applsci 13 00069 g016
Figure 17. Fish length adjustment.
Applsci 13 00069 g017
Disclaimer/Publisher’s Note: The statements, opinions and data contained in all publications are solely those of the individual author(s) and contributor(s) and not of MDPI and/or the editor(s). MDPI and/or the editor(s) disclaim responsibility for any injury to people or property resulting from any ideas, methods, instructions or products referred to in the content.

