Article

Analysis of Daily Activity Pattern to Estimate the Physical Activity Level and Energy Expenditure of Elite and Non-Elite Athletes

1
Department of Family Resource Management, Chaudhary Charan Singh Haryana Agricultural University, Hisar 125004, Haryana, India
2
Faculty of Health and Wellness, Sri Sri University, Cuttack 754006, Odisha, India
3
Sports Authority of India, NS NIS, Patiala 147001, Punjab, India
4
Department of Biological and Medical Sciences, Faculty of Physical Education and Sport, Comenius University in Bratislava, 81469 Bratislava, Slovakia
5
Faculty of Health Sciences, University of Ss. Cyril and Methodius in Trnava, 91701 Trnava, Slovakia
*
Author to whom correspondence should be addressed.
Submission received: 31 January 2023 / Revised: 12 February 2023 / Accepted: 16 February 2023 / Published: 21 February 2023

Abstract

:
Physical exercise and adequate energy intake are the most important needs for optimum health, and they are also strongly connected to the amount of energy used when participating in any kind of physical activity. Total energy expenditure (TEE) may be calculated by combining resting energy expenditure (REE) with the physical activity level (PAL). Validated PAL guidelines are generally accessible and used by the general public, however less is known about PAL in competitive athletes. This research aimed at analyzing the physical activity level and the energy expenditure of athletes who participate in various sports on a daily basis. The research included 53 female athletes (43.39% elite and 56.61% non-elite), and 47 male athletes (40.42% elite and 59.57% non-elite) who competed in athletics, basketball, badminton, cricket, hockey, kabaddi, volleyball, and wrestling. The PAL, the BMR—basal metabolic rate, and the TEE were used to measure energy expenditure throughout a regular training phase. The PAL was determined using the athletes’ 24 h activity profiles, which consisted of their practice, study, leisure, and sleep hours. The Harris–Benedict equation was used to calculate the BMR. The TEE was computed by multiplying the BMR by the PAL. The time spent on work/practice, rest, and leisure activities was used to calculate the athletes’ daily activity load. The PAL was 2.33 ± 0.47, the TEE was 3532.18 ± 827.75 kcal/day, and the BMR was 1515.06 ± 203.52 kcal/day. Field hockey players had the greatest physical activity load (3.0 ± 0.00), followed by wrestlers (2.6 ± 0.20), boxers (2.6 ± 0.30), basketball players (2.3 ± 0.40), athletics athletes (2.2 ± 0.43), volleyball players (2.0 ± 0.20), kabaddi players (1.8 ± 0.20), cricketers (1.8 ± 0.10), and badminton players (1.7 ± 0.10). The PAL values were higher in the elite than in the non-elite female athletes (2.81 ± 0.23, and 2.12 ± 0.34, respectively), as well as in the male athletes (2.60 ± 0.28, and 1.94 ± 0.30, respectively). These data showed that the PAL values of both the elite and the non-elite athletes were at the WHO-recommended threshold yet were characterized as intensely active.

1. Introduction

Physical fitness and a well-balanced diet are the most important prerequisites for good health [1,2]. Good health is determined by an individual’s ability to successfully and efficiently perform tasks, whether they be related to work or to other pursuits. It was determined that physical activity (PA) was important for long-term health, and that it promoted an active lifestyle [3]. To achieve the level of physical fitness required for a certain activity requires a unique combination of motor skills, which may be directly affected by the overall training load, as well as by the amount of energy that is expended. The training load is the most important concept in sports training. It leads to an increase in athletic performance, and is directly related to the intensity, length, and frequency of physical activity in a given sport carried out over the course of a daily or weekly session [4]. When determining an athlete’s physical load, and the amount of energy they need, the physical activity level (PAL) is a crucial factor [5]. As a result, the total energy expenditure (TEE), which is calculated using the resting energy expenditure (REE), and the PAL, is an effective and common method for determining the daily physical load and activity allowance. The World Health Organization (WHO) [6] report has also proposed that the average daily desirable PAL allowance for an adult can be expressed as different lifestyles. These lifestyles include sedentary (1.40), moderately active (1.70 to 1.99), vigorously active (2.00 to 2.40), and extremely active (>2.40). The perceived exercise load and energy expenditure of athletes that have a strenuous training program have been reported to be high, with the PAL ranging from 2.00 to 2.15 [6,7,8,9]. An athlete’s PAL and lifestyle are affected by the level of difficulty and the length of their workouts, as well as by the amount of time they take off for rest and pleasure [5].
However, there are no standardized PAL criteria available that can be used to estimate the amount of energy that is required by competitive athletes. In addition, there is the possibility of developing a systematic bias given many distinct PAL factors that have been validated in athletes of varying ages and levels of performance. The only practical method of assessing the amount of physical conditioning required to achieve a high level of physical performance at the elite level was to conduct an analysis of the requirements of the training [6]. Baptisla et al. [7] and Gholizadeh et al. [8] have compared weekly training demands, and accumulated fatigue during training, and concluded that the accumulated load during training sessions (7-days microcycle), or the increased volume of training without inadequate recovery can decrease performance [7,8]. Consequently, the current research hypothesized that the degree of physical activity that an athlete engages in has a direct influence on the amount of energy that is expended as a result of their physical activity level. Based on this, the present study investigated the energy expenditure and physical activity level in the context of the daily activity pattern of elite and non-elite athletes.

2. Materials and Methods

2.1. Sampling Procedure

In the current research, the city of Hisar, in the Indian state of Haryana, was chosen due to its impressive infrastructure, and to the outstanding performance of its athletes at the national and international levels. The Giri Centre, one of the most important multifunctional sports training facilities in Hisar, where more than 300 athletes engage in various sports activities every day, was chosen for the research. A list of athletes from the Giri Centre, who competed in various sports throughout the previous year, was made. From this list, one hundred athletes from various sports were chosen. A disproportional stratified sampling method was used to obtain the sample (Figure 1). The activity profile of the athletes was analyzed based on the time, and the activity pattern of the sports they engaged in.
Data were collected in the month of January and February, for morning or evening training sessions. Those who practiced under the sports authority of India (SAI) were categorized as elite athletes (male n = 19; female n = 23), while those who practiced under the university sports club were categorized as non-elite athletes (male n = 28; female n = 30). The activity profiles of the athletes were examined based on the time, and the activity patterns of the sports they were involved in.

2.2. Ethical Consideration

This study procedure was approved by the university ethical committee (letter no. is DR/IEC/2021/06-16, dated 1 April 2021). Those in charge of the sports training centers, and the coaches of all the sports consented to the study, and allowed us to recruit players to participate in the study.

2.3. Inclusion and Exclusion Criteria

Inclusion criteria consisted of a habitual physical training frequency of 3 times per week, and at least 1.5 h per day, and participation in university- or state-level, athletic competitions. Recent injuries or diseases that might interfere with regular physical activity or training throughout the 7-day assessment period were exclusion criteria [5].

2.4. Study Design

In this research, personal interviews were conducted. A questionnaire technique was used during the interview. A questionnaire was pre-tested on a group of 15 athletes from various sports, who were selected at random from athletes who were not included in the sample. Before participation in the study, a survey was administered to gather information about exercise habits and to assess eligibility. Before finalizing the study, revisions were made, in collaboration with an advisory group, based on the findings of the preliminary testing. To reduce seasonal changes in physical activity, data were gathered within eight weeks [5,10,11,12], and the athletes’ consent was obtained prior to the data collection.

2.5. Anthropometric Measurements

Data on the subjects’ age, sex, body height, body weight, fat percentage, and body mass index (BMI) were measured. Anthropometric measurements (height, weight, percentage of body fat, and BMI) were conducted in a fasting state. The body height of the subjects was determined to the nearest 1 mm using an anthropometric scale. Bioelectrical impedance analysis (Omron body composition monitor, HBF-375 karada scan) was used for the measurement of body weight, and the estimation of the percentage of body fat (BF) with a measurement error of 0.5 kg. BF% was calculated from the impedance value, and from the pre-entered personal data [13,14].

2.6. Participants

A total of 100 elite and non-elite athletes were included in the research. With a focus on competitive physical training, athletes were recruited from schools and universities. Fifty-three female athletes (age 19.09 ± 2.39 years; BMI 20.75 ± 2.53 kg/m2), and 47 male athletes (age 19.98 ± 1.78 years; BMI 21.75 ± 2.56 kg/m2) were involved in the athletics, basketball, badminton, cricket, hockey, kabaddi, volleyball, and wrestling (Table 1). Out of 53 female athletes, 43.39% were considered elite, while 56.61% were non-elite. Similarly, among 47 male athletes, 40.42% were considered elite, and 59.57% were non-elite. The elite athletes performed four primary sports—athletics, boxing, hockey, and wrestling—while the non-elite athletes practiced athletics, basketball, badminton, cricket, kabaddi, and volleyball.
The physical features of the elite and non-elite athletes are shown in Table 1. The average age of the athletes was 19.51 ± 2.16 years (95% confidence interval (CI): 19.09–19.96 years), their height was 166.50 ± 8.59 cm (95% CI: 164.84–168.28 cm), and their body mass was 59.23 ± 11.05 kg (95% CI: 56.93–61.35 kg). The BMI did not vary among these groups (21.22 ± 2.57 kg/m2; 95% CI: 20.66–21.68 kg/m2), although there were significant variations in the percentage of body fat (18.76 ± 5.66%; 95% CI: 17.53–19.75%). As shown in the Table 1, the mean age of the elite athletes was lower than that of the non-elite athletes, whereas the height, weight, BMI and fat percentage of the elite female and male athletes were higher than those of the non-elite athletes.

2.7. Physical Workload/Activity Load

To evaluate the total physical workload in particular sports, the physical activity level (PAL), and the total energy expenditure (TEE) were calculated using the Physical Activity Ratio (PAR), as described by FAO/WHO/UNU [15]. The following formula was used to calculate the PAL value.
PAL = (Total PAR-hr)/(Total time)
where PAR is referred to as the energy cost of an activity per unit of time expressed as a multiple of basal metabolic rate (BMR). The PAR values for the activities performed in a day were aggregated over a 24 h period to yield the PAL.
The TEE is the number of calories expended by the athlete in one day based on his or her type of activity (sedentary, moderate or strenuous). The TEE was analyzed during a habitual training period using the following formula.
TEE = Predicted BMR × PAL
where the BMR was estimated using the Harris–Benedict equation [16,17].
BMR (Men) = 66.5 + (13.76 × weight in kg) + (5.003 × height in cm) − (6.755 × age in years)
BMR (Women) = 655 + (9.563 × weight in kg) + (1.850 × height in cm) − (4.676 × age in years)

2.8. Data Analysis

Data were reported as mean ± SD. In addition, 95% confidence intervals (CI) were presented. Using the Shapiro–Wilk test, the normality of the PAL distribution was determined. Using a box plot, the dispersion of the PAL values was examined. It was determined what proportion of elite and non-elite athletes had PAL that fell below or above WHO guidelines. As advised by the expert FAO/WHO/UNU consultation [15], the PAL standards for athletes were provided as a range, and were calculated as a mean 8%. In addition, the Pearson correlation coefficient was computed to determine the link between the physical measurements, and the energy properties. The alpha value was selected between 0.01 and 0.05 to determine their statistical significance. The value 0.00 up to 0.30 (0.00 up to −0.30) shows negligible correlation, above 0.30 up to 0.50 (above −0.30 up to −0.50) shows low positive (negative) correlation, above 0.50 up to 0.70 (above −0.50 up to −0.70) shows moderate positive (negative) correlation, and above 0.70 up to 0.90 (above −0.70 up to −0.90) shows high positive (negative) correlation [18,19].

3. Results

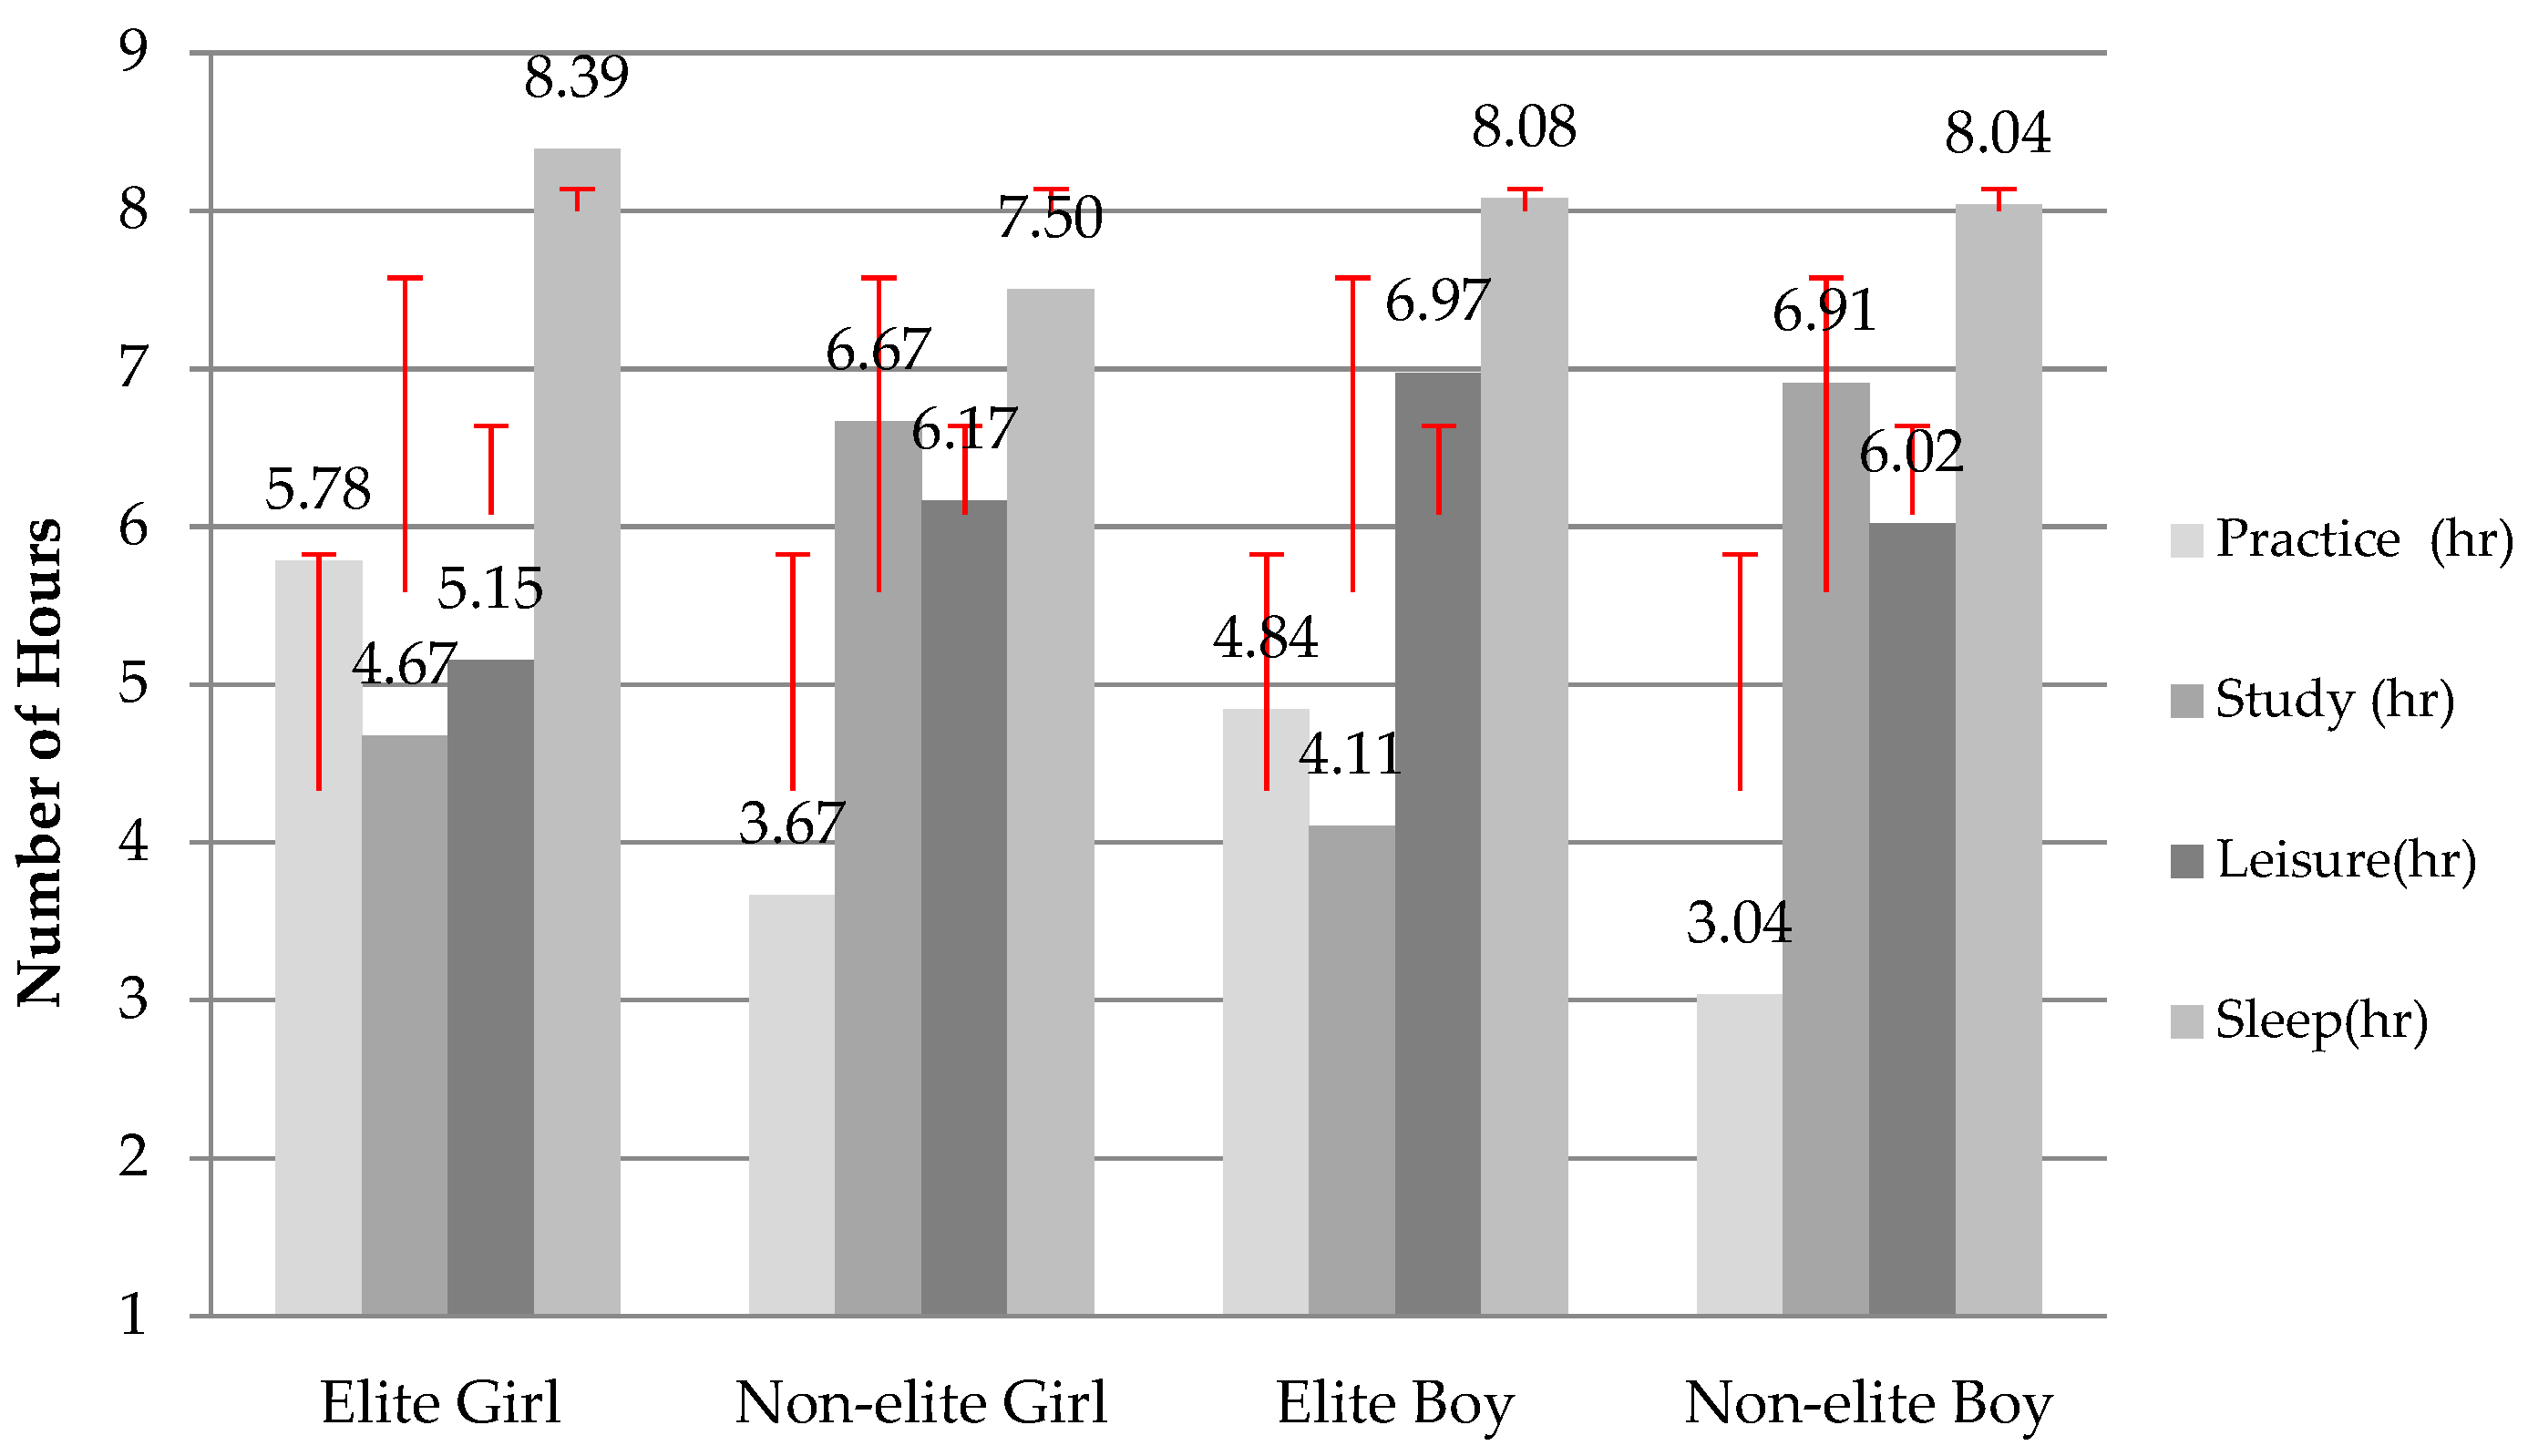
3.1. Daily Activity Pattern of the Athletes

The daily activity load of the athletes was assessed by the time spent in work/practice, rest, and leisure activities. The 24 h activity profiles of the athletes, which were divided into four categories—practice, study, leisure, and sleep hours—are described in Figure 2.
The athletes’ practice hours included both morning and evening sessions (warm-up and cool-down). Study hours included both school/college hours, and self-study hours. Refreshing, transportation (from hostel to stadium, to college or to school), dinner, common-room time (TV), and other everyday tasks comprised leisure time. The sleep time included both nighttime hours and afternoon naps.
The average practice time for the athletes was 4 h and 12 min (moderate intensity), study time was 5 h and 47 min, leisure time was 6 h and 3 min, and sleep time was 7 h and 58 min, with variances of 2 h and 10 min, 2 h and 24 min, 2 h and 4 min, and 33 min, respectively. Therefore, the typical ratio of practice:study:leisure:sleep was around 4:5:6:7. In accordance with the suggested range of 7–9 h for healthy adults, and 8–10 h for adolescents, all males and females obtained sufficient rest over 24 h, according to further data [20]. The elite women spent the most time by practice and sleep, but the least by study and leisure activities. In comparison to other respondents, the non-elite males spent fewer hours practicing, but more hours studying than the non-elite females, elite females and males.

3.2. Physical Contour Analysis of Elite and Non-Elite Athletes of Different Sports

The elite athletes mostly engaged in boxing, field hockey, wrestling, and athletics, while the non-elite athletes engaged in badminton, cricket, volleyball, and kabaddi. Using their BMR, and TEE, the athletes’ physical activity load was calculated (Table 2).
In order to determine the daily physical burden of the athletes, their usual physical activities, and the time spent on them were recorded. The average PAL of a healthy person plays a significant role in determining his/her total energy consumption. The average 24 h TEE and BMR were used (i.e., PAL = TEE/BMR) to determine the PAL. The actual energy needs were determined by multiplying the PAL by the BMR [21,22].
In respect to the TEE, the BMR usually accounted for 45% to 70% of the TEE [22], but our study showed that the BMR accounted for only 42.89% of the TEE, which is below average.
Box plots in Figure 3 illustrate the variance of the PAL values. The quartile range explains the large difference between the elite and the non-elite athletes. The PAL values were significantly higher in the elite male athletes (2.60 ± 0.28, 95% CI: 2.46–2.74, p = 0.01) than the non-elite male athletes (1.94 ± 0.30, 95% CI: 1.82–2.06, p = 0.12). However, there was no significant difference in the PAL values between the elite female athletes (2.81 ± 0.23, 95% CI: 2.70–2.91, p = 0.01) and the non-elite female athletes (2.12 ± 0.34, 95% CI: 1.98–2.24, p = 0.13), which is in contrast with previously published results [5]. Out of 100 athletes, 27% had a PAL below the WHO limit (i.e., 2.0–2.4), indicating a moderately active lifestyle, 34% were above the WHO recommendation (a highly active lifestyle), and 39% were at the recommended range (a vigorously active lifestyle).

3.3. Physical Activity Level in Athletes of Different Sports

In order to determine the exercise load in athletes of various sports, the regular physical activity and the intensity of their labor were recorded. As shown in Figure 4, the highest PAL was in field hockey players (3.0 ± 0.00), followed by wrestlers (2.6 ± 0.20), boxers (2.6 ± 0.30), basketball players (2.3 ± 0.40), athletics athletes (2.2 ± 0.43), volleyball players (2.0 ± 0.20), kabaddi players (1.8 ± 0.20), cricketers (1.8 ± 0.10), and badminton players (1.7 ± 0.10).

3.4. Physical Activity Contour of Athletes

As shown in Table 3, the BMR values were higher in the elite than in the non-elite female athletes (1414.45 ± 120.93 kcal/day; 95% CI: 1360.8–1468.1 kcal/day, and 1351.7 ± 64.01 kcal/day; 95% CI: 1327.3–1376 kcal/day, respectively; p = 0.05), as well as in the elite as opposed to the non-elite male athletes (1752.3 ± 137.93 kcal/day; 95% CI: 1683.7–1820.9 kcal/day, and 1589.80 ± 172.11 kcal/day; 95% CI: 1521.8–1657.9 kcal/day, respectively; p = 0.05). There was a significant positive correlation of the BMR with height (r = 0.844), weight (r = 0.909), and the BMI (r = 0.652) (Table 4). The total energy expenditure (TEE) was significantly greater in the female and male elite athletes (3964.5 ± 423.84 kcal/day; 95% CI: 3776.6–4152.4 kcal/day, and 4556.7 ± 591.48 kcal/day; 95% CI: 4262.5–4850.8 kcal/day, respectively; p = 0.01) than in the female and male non-elite athletes (2854.6 ± 452.66 kcal/day, and 3532.2 ± 827.75 kcal/day, respectively). The TEE moderately correlated with weight (r = 0.575), the BMI (r = 0.497), and the BMR (r = 0.557), and highly with the PAL (r = 0.806). There was also a moderate association between the BMI and the BMR (r = 0.652).

3.5. The Relationship between Physical Measures and Energy Attributes of Athletes

There was a negligible correlation of the age and with height, weight, BMI, and the BMR, and a negative weak to moderate correlation with the TEE and the PAL. The height highly correlated with the BMR whilst weight highly correlated with both the BMI and the BMR. Height and weight showed low to moderate correlations with the TEE. The BMI moderately correlated with the BMR. Age had no effect on these characteristics because of its negligible relationship with height, weight, BMI, and the BMR. Age, on the other hand, had a reverse impact on these parameters because of its negative low to moderate relationship with the TEE and the PAL.
Height exhibited a high association with weight (r = 0.777), but a low correlation with BMI (r = 0.328). Weight showed a high correlation with BMI (r = 0.847). The height, weight, and the BMI correlated significantly with the BMR (r = 0.844, 0.909, and 0.652, respectively), whereas low to moderate correlations were found with the TEE (r = 0.427, 0.575, and 0.497, respectively), and a very low correlation with the PAL (r = −0.070, 0.045, and 0.122, respectively). The BMR showed a moderate correlation with the TEE (r = 0.557), but a negligible with the PAL (r = −0.033). The TEE and the PAL highly correlated (r = 0.806).

4. Discussion

Athletes’ normal routines reveal their training habits, and have an immediate impact on their ability to perform at their peak. In a similar manner, an athlete’s body composition is proportional to his or her degree of fitness, training intensity, practice volume, and total daily practice hours [23]. In line with this, the current research supports the hypothesis that the degree of physical activity that athletes engage in has a direct influence on the amount of energy that is expended as a result of their physical activity level.
The training sessions consisted of a variety of activities, such as aerobics, anaerobics, speed work, strength, endurance, agility, and recovery. The activity or training load was defined by Foster et al. [24] as the total of training sessions per week, the total time per session, and the intensity of each session. The athletes in this research trained for their respective sports for a minimum of 90 min (high intensity), and a maximum of 180 min (moderate intensity) [25]. The WHO has similarly suggested that athletes exercise moderately for at least 60 min each day [26].
The physical activity level of the athletes was estimated utilizing their daily activity pattern, categorized as practice, study, leisure, and sleep hours. Time spent evenly on these four pursuits aided in pattern analysis, and in recuperation after exertion. The female elite athletes spent 24.09% of a day practicing their sport, while the male elite athletes spent 20.13% of a day practicing their sport. This compares to 15.27% and 12.70% for the female and male non-elite athletes, respectively. Ismail et al. [27] found different results based on national athletes, indicating that female athletes trained for 30 min fewer per week than male athletes. Across the board, the athletes spent roughly 33.19% of their day sleeping (7 h and 58 min) [28,29].
These athletes’ daily routines provided a good indicator of the daily physical demands placed on their bodies. The WHO separates people into four distinct lifestyle groups: inactive, moderately active, highly active, and very active. A healthy athlete’s average PAL plays a significant part in establishing his or her total energy needs. According to the results of the current research, athletes with high PAL values also have high TEE, demonstrating a strong association (r = 0.806, α = 0.01) between the two. This method is often used in everyday activities because of the predictability of energy usage, and the lack of a need for an in-depth examination. Athletes’ PALs are estimated by their energy needs [5]; however, there are currently no standardized PAL criteria for making such estimates.
Our research revealed that the PAL in the female athletes was 2.33 ± 0.42, placing them into the strongly active lifestyle category, and within the PAL value range (2.0–2.4) recommended by WHO [15]. In accordance with this, Carlsohn et al. [5] observed comparable results.
The lifestyles of the female elite athletes were deemed to be particularly active. In contrast, the PAL values for the non-elite female athletes varied from 1.65 to 2.68, including those with moderate (24.52%), vigorous (28.13%), and highly active lifestyles (30.77%). Similar to the female athletes, the male athletes’ lives were classed as strongly active within the range specified by WHO [25], with the top male athletes having vigorous to very active lifestyles, with the PAL values ranging from 2.04 to 2.87. These variations in the athletes’ lifestyles might be examined in connection with their particular training load. For instance, it will take longer for an athlete with a low training load who increases the training load by 10% each week to attain maximal capacity, but an athlete with a high training load may be able to tolerate only modest increases in the physical load because a high training load can sometimes cause over-exertion in the muscles. Smaller increases in the training load (less than 10%) may be recommended for athletes with either an exceedingly low or a chronically very high training load. These increases may also be required to expedite the recovery process [30,31].
The most variable component of physical activity is energy expenditure, which may range from 400 to 3000 kcal/day, depending on the individual. Because of the work needed in the exercise, the activity appears to have both immediate and long-term energy costs. Most of the impact of the physical activity is on the energy requirements, which are most likely related to the high energy cost of certain activities. As a result, the requirement for energy expenditure varies by sport. For example, a single bout/round in wrestling and boxing lasts around 3 min. The athletes’ intensity of effort, and the frequency of physical activity are quite high during this time, thus, their energy consumption is very high. In terms of the energy expenditure, the BMR should account for 45 to 70% of the TEE; however, in the current study, the BMR accounted for 42.89% of the TEE, which was lower than expected. The physical activity affected the BMR in the post-exercise phase by around 5% for at least 24 h, depending on the immediate energy expenditure of the various sports [32]. Thus, the adequate energy intake and the total energy expenditure, the nutritional aspects, and the body composition should all be evaluated, as they have a direct impact on the athletes’ physical activity.

5. Conclusions

The most essential requirements for optimal health are exercise and a healthy calorie intake, which are also strongly related to the energy used during any physical activity. In the current study, the elite athletes spent more time on sports practice (both morning and evening sessions) than the non-elite athletes, whereas the non-elite athletes spent more time on studies than the elite athletes. The elite female and male athletes had more balanced work and rest hours than the non-elite athletes. All the athletes got enough sleep (i.e., 7–8 h). The elite athletes had much greater physical activity levels (PAL) than the non-elite athletes, as suggested by WHO for adult athletes. However, the mean PAL in most elite and non-elite athletes was at a WHO-recommended level, and classified as strongly active. Wrestlers, boxers, basketball players, athletics athletes, volleyball players, kabaddi players, cricketers, and badminton players had the greatest physical activity load.
The participants were high school and college students; therefore, they had to balance their scholastic and athletic performances. Taking this fact into account, the performance demands on them were quite intense in both areas. It appears that the categories examined in this study, such as the daily activity pattern, the physical activity level, and the total energy expenditure, might be useful tools for assessing external stressors during training and competition. Coaches and professional athletes can utilize this information to plan their daily or weekly activities, and to design appropriate training programs.

Author Contributions

Conceptualization, E.K., S.D. and M.M.; data curation, E.K.; formal analysis, E.K.; investigation, E.K.; methodology, E.K. and M.M.; supervision, N.D. and E.Z.; visualization, N.D. and E.Z.; writing—original draft, E.K. and S.D.; writing—review & editing, E.K., S.D., M.M., N.D. and E.Z. All authors have read and agreed to the published version of the manuscript.

Funding

This research received no external funding.

Institutional Review Board Statement

The study was conducted in accordance with the Declaration of Helsinki, and approved by the Institutional Review Board. This study procedure was approved by the university ethical committee (letter no. Is DR/IEC/2021/06-16, dated 1 April 2021).

Informed Consent Statement

Informed consent was obtained from all subjects involved in the study.

Data Availability Statement

Data are available upon request.

Acknowledgments

Authors acknowledge the support and contribution of the coaches and the athletes of the sports training center.

Conflicts of Interest

The authors declare no conflict of interest.

References

  1. Loucks, A.B. Energy balance and body composition in sports and exercise. J. Sport. Sci. 2004, 22, 1–14. [Google Scholar] [CrossRef]
  2. Rodriguez, N.R.; Di Marco, N.M.; Angley, S. American College of Sports Medicine position stand. Nutrition and athletic performance. Med. Sci. Sport. Exerc. 2009, 41, 709–731. [Google Scholar] [CrossRef]
  3. World Health Organization. Global Recommendations on Physical Activity for Health; WHO: Geneva, Switzerland, 2010.
  4. Caspersen, C.J.; Powell, K.E.; Christenson, G.M. Physical activity, exercise, and physical fitness: Definitions and distinctions for health-related research. Public Health Rep. 1985, 100, 126. [Google Scholar]
  5. Carlsohn, A.; Scharhag-Rosenberger, F.; Cassel, M.; Weber, J.; de Guzman Guzman, A.; Mayer, F. Physical activity levels to estimate the energy requirement of adolescent athletes. Pediatr. Exerc. Sci. 2011, 23, 261–269. [Google Scholar] [CrossRef] [Green Version]
  6. Vázquez, M.Á.; Paulis, J.C.; Bendala, F.J.; Owen, A.L. Comparison of the physical and physiological demands of friendly matches and different types of preseason training sessions in professional soccer players. RICYDE. Rev. Int. Cienc. Deporte 2019, 15, 339–352. [Google Scholar] [CrossRef]
  7. Baptista, I.; Johansen, D.; Figueiredo, P.; Rebelo, A.; Pettersen, S.A. Positional differences in peak-and accumulated-training load relative to match load in elite football. Sports 2019, 8, 1. [Google Scholar] [CrossRef] [Green Version]
  8. Gholizadeh, R.; Nobari, H.; Bolboli, L.; Siahkouhian, M.; Brito, J.P. Comparison of Measurements of External Load between Professional Soccer Players. InHealthcare 2022, 10, 1116. [Google Scholar] [CrossRef]
  9. Eiholzer, U.; Meinhardt, U.; Petro, R.; Witassek, F.; Gutzwiller, F.; Gasser, T. High- Intensity Training Increases Spontaneous Physical Activity in Children: A Randomized Controlled Study. J. Pediatr. 2010, 156, 242–246. [Google Scholar] [CrossRef]
  10. Kriemler, S.H.; Hebestreit, S.; Mikami, T.; Bar-Or, B.V.; Ayub, O.; Bar-Or, O. Impact of a single exercise bout on energy expenditure and spontaneous physical activity of obese boys. Pediatr. Res. 1999, 46, 40–44. [Google Scholar] [CrossRef] [Green Version]
  11. Torun, B. Energy requirements of children and adolescents. Public Health Nutr. 2005, 8, 968–993. [Google Scholar] [CrossRef] [PubMed] [Green Version]
  12. Plasqui, G.; Westerterp, K.R. Seasonal variation in total energy expenditure and physical activity in Dutch young adults. Obes. Res. 2004, 12, 688–694. [Google Scholar] [CrossRef] [Green Version]
  13. Plasqui, G.; Kester, A.D.; Westerterp, K.R. Seasonal variation in sleeping metabolic rate, thyroid activity, and leptin. Am. J. Physiol.-Endocrinol. Metab. 2003, 285, E338–E343. [Google Scholar] [CrossRef] [PubMed] [Green Version]
  14. Jones, A.M.; Doust, J.H. The validity of the lactate minimum test for determination of the maximal lactate steady state. Med. Sci. Sport. Exerc. 1998, 30, 1304–1313. [Google Scholar] [CrossRef]
  15. Joint, F.A.O. WHO/UNU Expert Consultation Group. Human energy requirements. Scientific background papers from the Joint FAO/WHO/UNU Expert Consultation. October 17–24, 2001. Rome, Italy. Public Health Nutr. 2005, 8, 929–1228. [Google Scholar]
  16. Harris, J.A.; Benedict, F.G. A biometric study of human basal metabolism. Proc. Natl. Acad. Sci. USA 1918, 4, 370–373. [Google Scholar] [CrossRef] [Green Version]
  17. Roza, A.M.; Shizgal, H.M. The Harris Benedict equation reevaluated: Resting energy requirements and the body cell mass. Am. J. Clin. Nutr. 1984, 40, 168–182. [Google Scholar] [CrossRef] [Green Version]
  18. Hinkle, D.E.; Wiersma, W.; Jurs, S.G. Applied Statistics for the Behavioral Sciences; Houghton Mifflin College Division: Boston, MA, USA, 2003; p. 663. [Google Scholar]
  19. Hu, H.M.; Zhao, C.Y.; Zhang, X.; Ran, L.H.; Liu, T.J. Correlation Analysis on the Main and Basic Body Dimension for Chinese Adults. In Proceedings of the International Conference on Digital Human Modeling and Applications in Health, Safety, Ergonomics and Risk Management, Las Vegas, NV, USA, 15–20 July 2015; Springer: Cham, Switzerland, 2015; pp. 37–43. [Google Scholar] [CrossRef]
  20. Watson, N.F.; Badr, M.S.; Belenky, G.; Bliwise, D.L.; Buxton, O.M.; Buysse, D.; Dinges, D.F.; Gangwisch, J.; Grandner, M.A.; Kushida, C.; et al. Recommended Amount of Sleep for a Healthy Adult: A Joint Consensus Statement of the American Academy of Sleep Medicine and Sleep Research Society. Sleep 2015, 38, 843–844. [Google Scholar] [CrossRef]
  21. James, W.P.T.; Schofield, E.C. Human Energy Requirements. A Manual for Planners and Nutritionists; Oxford University Press: Oxford, UK, 1990. [Google Scholar]
  22. FAO. Food energy—Methods of analysis and conversion factors. In Report of a Technical Workshop; FAO Food and Nutrition Paper No. 77; FAO: Rome, Italy, 2003. [Google Scholar]
  23. Markantes, G.K.; Tsichlia, G.; Georgopoulos, N.A. Diet and exercise in the management of PCOS: Starting from the basics. In Polycystic Ovary Syndrome; Elsevier: Amsterdam, The Netherlands, 2022; pp. 97–115. [Google Scholar] [CrossRef]
  24. Foster, C.; Florhaug, J.A.; Franklin, J.; Gottschall, L.; Hrovatin, L.A.; Parker, S.; Dodge, C. A new approach to monitoring exercise training. J. Strength Cond. Res. 2001, 15, 109–115. [Google Scholar] [PubMed]
  25. Yang, Y.J. An overview of current physical activity recommendations in primary care. Korean J. Fam. Med. 2019, 40, 135–142. [Google Scholar] [CrossRef] [Green Version]
  26. World Health Organization. Global Strategy on Diet, Physical Activity and Health. Physical Activity and Young People; WHO: Geneva, Switzerland, 2002. Available online: https://apps.who.int/gb/ebwha/pdf_files/WHA57/A57_R17-en.pdf (accessed on 23 November 2021).
  27. Ismail, M.N.; WD, W.N.; Zawiah, H. Energy expenditure studies to predict requirements of selected national athletes. Malays. J. Nutr. 1997, 3, 71–81. [Google Scholar]
  28. Hanjabam, B.; Kailashiya, J. Study of ball hitting speed and related physiological and anthropometric characteristics in field hockey players. Asian Acad. Res. J. Multidiscip. 2014, 1, 398–410. [Google Scholar]
  29. Hanjabam, B.; Kailashiya, J. Gender difference in fatigue index and its related physiology. Indian J. Physiol. Pharmacol. 2015, 59, 170–174. [Google Scholar] [PubMed]
  30. Gabbett, T.J. Debunking the myths about training load, injury and performance: Empirical evidence, hot topics and recommendations for practitioners. Br. J. Sport. Med. 2020, 54, 58–66. [Google Scholar] [CrossRef] [PubMed]
  31. Physiopedia. Load Management. Available online: https://www.physio-pedia.com/Load_Management#cite_ref-:5_41-7 (accessed on 3 March 2022).
  32. Roberts, S.B.; Das, S.K. Energy requirements of men and women. In Principles of Gender Specific Medicine; Academic Press: San Diego, CA, USA, 2004; pp. 705–714. [Google Scholar]
Figure 1. Categorization of athletes practicing different sports.
Applsci 13 02763 g001
Figure 2. Daily activity pattern, including practice, study, leisure, and sleep hours in elite and non-elite athletes. Figure legend: Error bar shows the standard deviation (practice hr ±1.22, study hr ±1.41, leisure hr ±0.75, sleep hr ±0.37).
Applsci 13 02763 g002
Figure 3. Physical activity contour of athletes. Figure legend: box plot lower/first quartile (Q1), median, upper/third quartile (Q3), and outlier of PAL values in elite and non-elite athletes.
Applsci 13 02763 g003
Figure 4. PAL values in athletes of different sports.
Applsci 13 02763 g004
Table 1. Physical characteristics of athletes.
VariablesFemale (n = 53)Male (n = 47)
Elite (n = 23)Non-Elite (n = 30)Elite (n = 19)Non-Elite (n = 28)
Age (years)17.26 ± 1.6320.50 ± 1.8718.95 ± 1.5820.68 ± 1.56
Height (cm)163.33 ± 7.20161.83 ± 5.21174.44 ± 7.22168.73 ± 9.09
Weight (kg)57.96 ± 11.9552.78 ± 6.1769.68 ± 9.8460.09 ± 10.06
BMI (kg/m2)21.57 ± 3.1120.12 ± 1.7822.91 ± 2.8820.97 ± 2.01
Fat%23.75 ± 4.4422.25 ± 2.6315.53 ± 3.9913.12 ± 2.88
Table 2. Physical contour of elite and non-elite athletes of different sports (n = 100).
SportsFemale (n = 53)BMRTEESportsMale (n = 47)BMRTEE
Athletics Elite --AthleticsElite (n = 4)1738.054976.85
Non-elite (n = 10)1330.772913.19 Non-elite--
BasketballElite--BasketballElite--
Non-elite (n = 7)1354.363325.02 Non-elite (n = 6)1431.233053.10
BadmintonElite--BadmintonElite--
Non-elite (n = 2)1449.522391.70 Non-elite (n = 2)1758.833243.23
BoxingElite (n = 5)1488.714253.75BoxingElite (n = 7)1802.414279.56
Non-elite-- Non-elite--
CricketElite--CricketElite--
Non-elite (n = 3)1350.662534.65 Non-elite (n = 3)1591.392625.58
Field HockeyElite (n = 9)1361.774103.97KabaddiElite--
Non-elite-- Non-elite (n = 3)1834.753376.89
VolleyballElite--VolleyballElite--
Non-elite (n = 8)1350.312611.25 Non-elite (n = 8)1579.233129.86
WrestlingElite (n = 9)1436.113632.56WrestlingElite (n = 8)1756.144636.29
Mean (SD)1383.44 (54.97)3227.81 (633.85) 1631.61 (152.87)3467.65 (773.65)
BMR—Basal Metabolic Rate, TEE—Total Energy Expenditure.
Table 3. Physical activity contour of elite and non-elite athletes.
VariablesFemale (n = 53)Male (n = 47)Total
(n = 100)
Elite (n = 23)Non-Elite (n = 30)Elite (n = 19)Non-Elite (n = 28)
BMR (kcal/day)1414.45 ± 120.931351.70 ± 64.011752.30 ± 137.931589.80 ± 172.111515.06 ± 203.52
TEE (kcal/day)3964.5 ± 423.842854.6 ± 452.664556.7 ± 591.483080.4 ± 489.063532.2 ± 827.75
PAL2.79 ± 0.242.12 ± 0.342.59 ± 0.281.94 ± 0.292.33 ± 0.47
BMR—Basal Metabolic Rate, TEE—Total Energy Expenditure, PAL—Physical Activity Level.
Table 4. Correlations between physical measures and energy attributes.
VariablesAgeHeightWeightBMIBMRPALTEE
Age1
Height0.2111
Weight0.1530.777 *1
BMI0.0600.3280.847 *1
BMR0.1490.844 *0.909 *0.652 *1
PAL−0.504 *−0.0700.0450.122−0.0331
TEE−0.3320.4270.575 *0.4970.557 *0.806 *1
BMI—Body Mass Index, BMR—Basic Metabolic Rate, PAL—Physical Activity Level, TEE—Total Energy Expenditure; * p ≤ 0.05.
Disclaimer/Publisher’s Note: The statements, opinions and data contained in all publications are solely those of the individual author(s) and contributor(s) and not of MDPI and/or the editor(s). MDPI and/or the editor(s) disclaim responsibility for any injury to people or property resulting from any ideas, methods, instructions or products referred to in the content.

