
Sustainable Materials from Waste Paper: Thermal and Acoustical Characterization


Dipartimento di Architettura, Costruzione e Design, Politecnico di Bari, 70125 Bari, Italy
*
Author to whom correspondence should be addressed.
Appl. Sci. 2023, 13(8), 4710; https://0-doi-org.brum.beds.ac.uk/10.3390/app13084710
Submission received: 8 March 2023
/
Revised: 2 April 2023
/
Accepted: 6 April 2023
/
Published: 8 April 2023
(This article belongs to the Special Issue Biomass-Based Materials for Building Applications)
Abstract
:A growing research interest currently exists in the use of paper as a building material. This work aims to present the results of a measurement campaign developed on innovative waste paper-based building components. The research was carried out in Southern Italy and used some local by-product aggregates. Three different mixture designs were developed in the laboratory by adding three kinds of biomass to a pulp paper blend: fava bean residues (FB), sawdust powder (SP) and coffee grains (CG) extracted from exhausted chaffs. A physical characterization was carried out measuring the bulk density and bulk porosity. Scanning Electron Microscopy (SEM) analysis of the single aggregates was followed by a microstructure analysis of the final components. Bulk density evaluation showed a range between 200 and 348 kg·m−3. Furthermore, thermal performances were measured; the thermal conductivity of the experimented samples ranged from 0.071 to 0.093 W·m−1·K−1, thus it is possible to classify the tested materials as thermal insulators. Moreover, the acoustic properties were evaluated and tested. The normal incidence sound absorption coefficient was measured by the impedance tube on cylindrical specimens. In general, a different behavior was observed between the upper and lower base of each specimen due to the manufacturing process and the shrinkage caused by the different interactions occurring between the aggregates and the pulp paper waste; for example, the presence of sawdust reduced shrinkage in the final specimens, with consequent smaller physical variations among the two faces. The correlation existing between the manufacturing process and the microstructural properties was also investigated by the estimation of the non-acoustical parameters using the inverse method and taking into account the JCA (Johnson, Champoux and Allard) model as a reference.
1. Introduction
The international energy outlook [1] predicts that global energy consumption will grow by up to 42% by the end of 2050 due to several factors, such as the increase in building construction and the fast growth of the global population.
Conventional building materials, such as cement and polymeric components, are responsible for increasing the energy demand due to the huge consumption of non-renewable resources. Furthermore, plastic materials provoke 4.5% of global greenhouse gas emissions [2], significantly contributing to the pollution of oceans and seas [3]. The catastrophic scenario of a rise in the Earth‘s average surface temperature by about 5 °C by the end of 2100 is closer than expected [4,5].
According to [6], who develop an exhaustive report on the advanced techniques of by-products transformation, municipal waste can be divided into two categories: organic and inorganic waste. The first category includes food residues, wood waste, paper, textiles, rubber and plastics; the second includes metals, ash, glass and tiles. Several applications at the industrial scale and numerous studies have been conducted using different types of waste in the energy recovery and building sector [6,7,8]; for example, lignocellulosic biomasses such as sawdust are suitable residues to be converted into the new raw matter of biochemicals [6]. Recently, there has been growth in the literature on the use of organic components and natural fibers for the production of insulating panels, mortars, plasters and bricks [9,10,11,12,13]. Nayak et al. [9] gave a critical overview of recent technologies adopted for the conversion of different by-products from food waste. Martellotta et al. [10] proved that the use of different fractions (and dimensions) of olive pruning fibers may affect sound absorption in chitosan-based panels. Liuzzi et al. [11] carried out a study on almond skin waste for the creation of building panels. They demonstrated the great capacity of the almond skin residues to improve thermal performance, and from an acoustic point of view, the measured normal incidence sound absorption coefficient demonstrated the great capacity of the biomass aggregation to create a typical tortuous and complex structure able to reach a value typical of porous materials.
Ricciardi et al. [12] showed the results of thermal characterization and life cycle analysis of building insulation panels made with cork scraps, end-life granulated tires, rice husk and coffee chaff, demonstrating the great capacity of the biomass waste to enhance the thermal performance of the final products. Among the numerous tested mixes, the best solution was found by cross-tabulating the thermal test results with the minimum embodied energy. Schiavone et al. [13] proposed a review of conventional and unconventional insulators considering the main parameters by which they can be compared: thermal conductivity, thermal diffusivity, specific heat capacity, sound absorption coefficient and fire reaction.
Considering the current environmental need to convert waste components into new resources, supporting the re-use and recycling of by-products, the aim of the present paper is to show the potential use of waste paper with the addition of different biomass as new base components for innovative and efficient materials, demonstrating their potential suitability to be applied as thermal and acoustic insulators in sustainable buildings. Three different aggregates, considered as by-products, were used in addition to the basic mix: exhausted coffee grounds, sawdust powder and fava bean residues. The literature on the used components shown in the next sections was useful when approaching the innovative mix design. Each aggregate originated from the Apulian Region in order to use 0 km components, thus assuring a sustainable material in terms of environmental impact. A microstructure evaluation using SEM analysis was used to investigate the physical properties of the single vegetable aggregate and after the mixing and curing process to correlate the final performances of the specimens to changes in morphology. The manufactured specimens were finally investigated in terms of physical, thermal and acoustic performance.
1.1. Paper Waste
Paper is a material of ancient and natural origin, dating back to 105 AD [14,15], and is mainly composed of cellulose fiber, the most common natural polymer and one that is inexhaustible on the globe.
Several products are manufactured by the paper industry, such as printing paper, sanitary papers, newspaper and packaging products. Moreover, a great number of applications in the architectural field exist including those made of paperboard, corrugated cardboard, honeycomb panels and paper tubes [16]. Different researchers have tested the properties of paper waste-based components presenting the potential of using the waste paper, the physical properties of cellulose insulation and the environmental factors that affect these properties [17,18,19,20,21,22,23,24]. Mandili et al. [17] carried out a study investigating the physical and mechanical properties, ultrasound pulse velocity, and thermal and structural performance of waste paper aggregates mixed with lime, and found that the thermal conductivity varied between 0.097 W·m−1·K−1 and 0.12 W·m−1·K−1.
Rajput et al. [19] added cotton waste to fired bricks with paper mill waste and cement binder as developed by Raut et al. [18], achieving a great compressive strength and thermal conductivity ranging from 0.25 to 0.32 W·m−1·K−1.
Bryski et al. [20] examined the properties of cellulose fibers sourced from paper and cardboard waste, testing a thermal conductivity of 0.042 W·m−1·K−1. Shibib [21] studied the effects produced by the addition of waste paper to clay bricks, focusing on the thermal and mechanical behavior. The results showed that these bricks have values of compressive strength lower than 0.45 MPa and a thermal conductivity lower than 0.1 W·m−1·K−1, allowing their use for thermal insulation. Aksogan et al. [23] combined waste from newsprint paper with perlite and plaster on a cane body. Different combinations of raw materials were tested, demonstrating that samples produced with a double row of canes had the lowest thermal conductivity and ultra-sound permeability coefficients. Aigbomian et al. [23] developed bricks with a mixture of sawdust, waste paper aggregates from recycled newspapers and lime-based binders, showing that the addition of sawdust caused very low values of thermal conductivity (0.046–0.069 W·m−1·K−1).
Echeverria et al. [24] investigated the use of the hot-compression method in order to avoid the formation of microbes and fungi on three different cellulosic panels derived by the post-consumer coffee industry (jute textile, paper cups and coffee grounds) suitable as insulators. Hammond [25] carried out a comparison in terms of embodied energy per kg between cellulose and other insulation materials, demonstrating that the cellulose-based products had the lowest range, from 0.94 to 3.33 MJ/kg, comparable to cork (4 MJ/kg). Neri et al. [26] investigated the acoustic properties of some materials, such as cardboard, by means of the impedance tube. They found that they are suitable for building acoustic panels. Asdrubali et al. [27] studied some panels, overlapping corrugated cardboard panels from the packaging industry. They found that the panels presented promising acoustic insulation performance in terms of transmission loss, although not in terms of sound absorption coefficients.
According to Jun et al. [28] the absorption coefficient of a sound absorber produced using cellulose was 0.75, which was lower than that of glass wool but higher than that of polyester.
Paper Waste Trend Production in Italy and Apulia
In Italy, wastes are categorized as either municipal or special waste, and further as hazardous or non-hazardous according to their riskiness. Paper waste belongs to the municipal category. The Institutes involved in the collection of the waste are the Italian Chambers of Trade, Agriculture and Industry, Istituto Superiore per la Protezione e la Ricerca Ambientale (ISPRA), which updates the Registry of Waste database [29,30,31].
The data elaborated by Lo Storto [29] on the total and sorted amount of waste collected in Apulia between 2007 and 2017 show an increasing trend in separate collection. Fasano et al. [31] stated that with the increasing percentage of separate collection, the percentage of organic fraction increased, while the other fractions tended to decrease proportionally (paper, multi-material fraction and glass).
For a long time, the recovered paper sector has been considered a milestone for the development of the Italian circular economy. The lack of forest resources and gradual growth of separate waste collection contributes to the recycling of paper. Restrictions imposed by the Chinese government in 2017 due to the issue of paper contamination imported in the country caused the saturation of the paper market and a drop in price of recycled paper, along with the development of a serious crisis in the national companies [32].
Thus, the circular economy represents a fundamental method by which to vanquish this issue. Currently, in terms of European recycling objectives (Table 1), the sector of paper waste recycling is experiencing new growth. The prediction of European targets surpassing the goal for 2030 by about 2.4% has already been achieved [33]. Paper production can be considered both the starting point and the end point, with so-called “recovered paper” being used together with or as an alternative to the virgin material. In fact, 57% of Italian paper production uses recycled fibers.
The paper mills and “transformers” produce and create the finished products. The paper produced is used by companies (users) and end consumers in a multitude of different ways, such as for graphics, packaging, domestic use, hygiene needs, etc. After being thrown away, paper waste is collected by public or private, urban or industrial waste management companies. The paper waste is then handed over to a secondary raw materials company for recycling. Here, the paper is selected and recovered in order to make the secondary raw material, which is then sent to the paper mills, thereby closing the cycle.
In 2019 it was estimated [33] that out of 4.6 million tons of cellulosic packaging, 4 million tons were recycled and 347.000 tons were used as energy recovery.
In Italy there are 364 processing plants receiving paper and cardboard from municipal waste collection, 42% of which are in Southern Italy, 19% are located in the Central Italy and 39% are in Northern Italy.
In Apulia, there are no paper mills. However, in 2020, there were 22 paper processing plants that received paper and cardboard from municipal waste collection and there was a production of 49.7 tons of paper waste per inhabitant; in fact, cardboard and paper waste represent the second largest sector of waste production.
2. Materials and Methodologies
2.1. Coffee Waste
Coffee can be considered one of the most used beverages worldwide. Globally, according to the ICO (International Coffee Organization) [34], the yearly export in November 2022 was 9.21 million bags. Compared to 8.31 million bags in the same month of the previous year, this signals an increase of up to 10.8%.
Janissen et al. [35] stated that coffee residues can be classified into coffee pulp and husk, coffee silver skin and spent coffee grounds. Currently, the main ways of conversion of coffee by-products are biofuel [36], fertilizer [37], mushroom [38] and natural fibers for the nutrition sector [39]. However, Janissen et al. [35] highlighted that some applications can have an ecotoxicological concern due to the presence of caffein and tannins, which are dangerous to marine microorganisms and plants.
Tang et al. [40] described the use of spent coffee grounds in geopolymer components for several building applications, such as pavements and concrete aggregates. Arulrajah et al. [41] stated that the properties of spent coffee grounds are similar to sand.
Lachheb et al. [42] studied the effect on thermal insulation performances achieved when adding coffee grounds to plaster composites. The results show a significant decrease in thermal conductivity from 0.5 W·m−1·K−1 to 0.31 W·m−1·K−1 when adding higher percentage of coffee grounds to the initial mix. Consequently, coffee grounds are suitable to be used in insulating the building envelope.
2.2. Sawdust Waste
Sawdust is a residue obtained from the timber manufacturing process. It is used in several fields since wood is one of the most used raw materials. It can be produced in different grain sizes, as small chips or as a fine powder, depending on the timber type and sawing process. Mwango [43] affirmed that sawdust has great potential to reduce environmental pollution due to its use as a raw matter for building materials able to comply with international energy standards. Several researchers have investigated the recycling potential of this natural resource, with non-building usage including bedding for poultry and livestock, or, alternatively, soil composting and mulching [44,45,46,47].
Aigbomian et al. [25,48], used sawdust as an additive to waste paper pulp for the production of insulating panels [25], and in addition to concrete for the development of wood-crete [48]. They also found that the type of timber can influence the final properties of the composite, with wood-crete made from softwood having a lower thermal conductivity (about 20% less) than the mix developed with hardwood.
Charai et al. [49] tested the thermal properties of clayey brick with the addition of five different percentages of sawdust. Results demonstrated that sawdust induces a significant enhancement of thermal properties of the final composites, causing a significant drop of about 30%.
2.3. Fava Bean Residues
The crop residues, generated at the end of harvesting or crop processing, are the parts of the aboveground plant that are not suitable for eating and have no other primary uses [50]. Vicia faba, commonly known as “fava bean” or “broad bean”, is a food crop classified as a grain legume which is cultivated in several areas of the world, in particular in Mediterranean countries, the UK and China [51].
Gómez et al. [52] considered fava bean pods as a possible source of fibers suitable for plant protection.
Furthermore, a large amount of fava bean biomass residues are usually left on the field. Thus, they can be employed as feedstock or, alternatively, biofuels and biogas [53]. The Italian Statistical Institute (ISTAT) has estimated that in the Apulian Region in 2022 there was a production surface of 5935 hectares, meaning it represents the most harvested legume in the Region [54].
2.4. Binder
In 2019 the construction sector was responsible for more than 26% of the global demand for binders and adhesives [55]. Due to the economic advantages and the strength performances assured by the final composites, the typical adhesives used in the building sector are formaldehyde-based resins. However, it is well-known that exposure to toxic formaldehyde is harmful for human health. International Agencies [56] consider that one of the worst consequences for human health is cancer development.
Experimental research on new sustainable adhesives is needed to keep the same physical and mechanical performance as traditional binders [55].
Several attempts to study bio-based adhesives have been made [11,12,57,58], however, sometimes the presence of organic components can undermine the liquid and vapor water resistance of the final materials [55], compromising the long-term mechanical characteristics of the materials.
Liuzzi et al. [11] used PVA to bind almond skin waste residues in order to develop insulating building panels that yielded satisfying results in terms of thermal performance and acoustic sound absorption.
2.5. Sample Preparation
The literature previously discussed was propaedeutic for choosing and exploring the properties of the aggregates to use in the mix design. The main component of the mix was pulp paper sourced from paper residues disposed in local offices.
Three different mixes were developed using three types of lightweight aggregate: exhausted coffee ground (CG mix), sawdust powder (SP mix) and fava bean residues (FB mix). The coffee ground was obtained from exhausted domestic polypropylene pods usually adopted for making espresso. The particle size was set from 200 μm to 500 μm.
The sawdust powder used in this research was generated from the mechanical processing of raw wood in furniture manufacturing. It was in the form of a powder with a particle size of 600 μm and was taken directly from the disposal area near a local wood company. Fava bean by-products used in the experimental work were taken from local regional farm companies. The residues derived from the cultivation are a mix of beans and small fibers with a particle size between 500 μm to 30,000 μm.
An aqueous solution of polyvinyl acetate glue was used to bind the mix. It is mainly used to bind porous materials such as paper, clothes, wood and stone. This kind of glue is odorless and non-inflammable with specific thermoplastic properties (softening at 30–45 °C) and it has a density of 1009 kg·m−3.
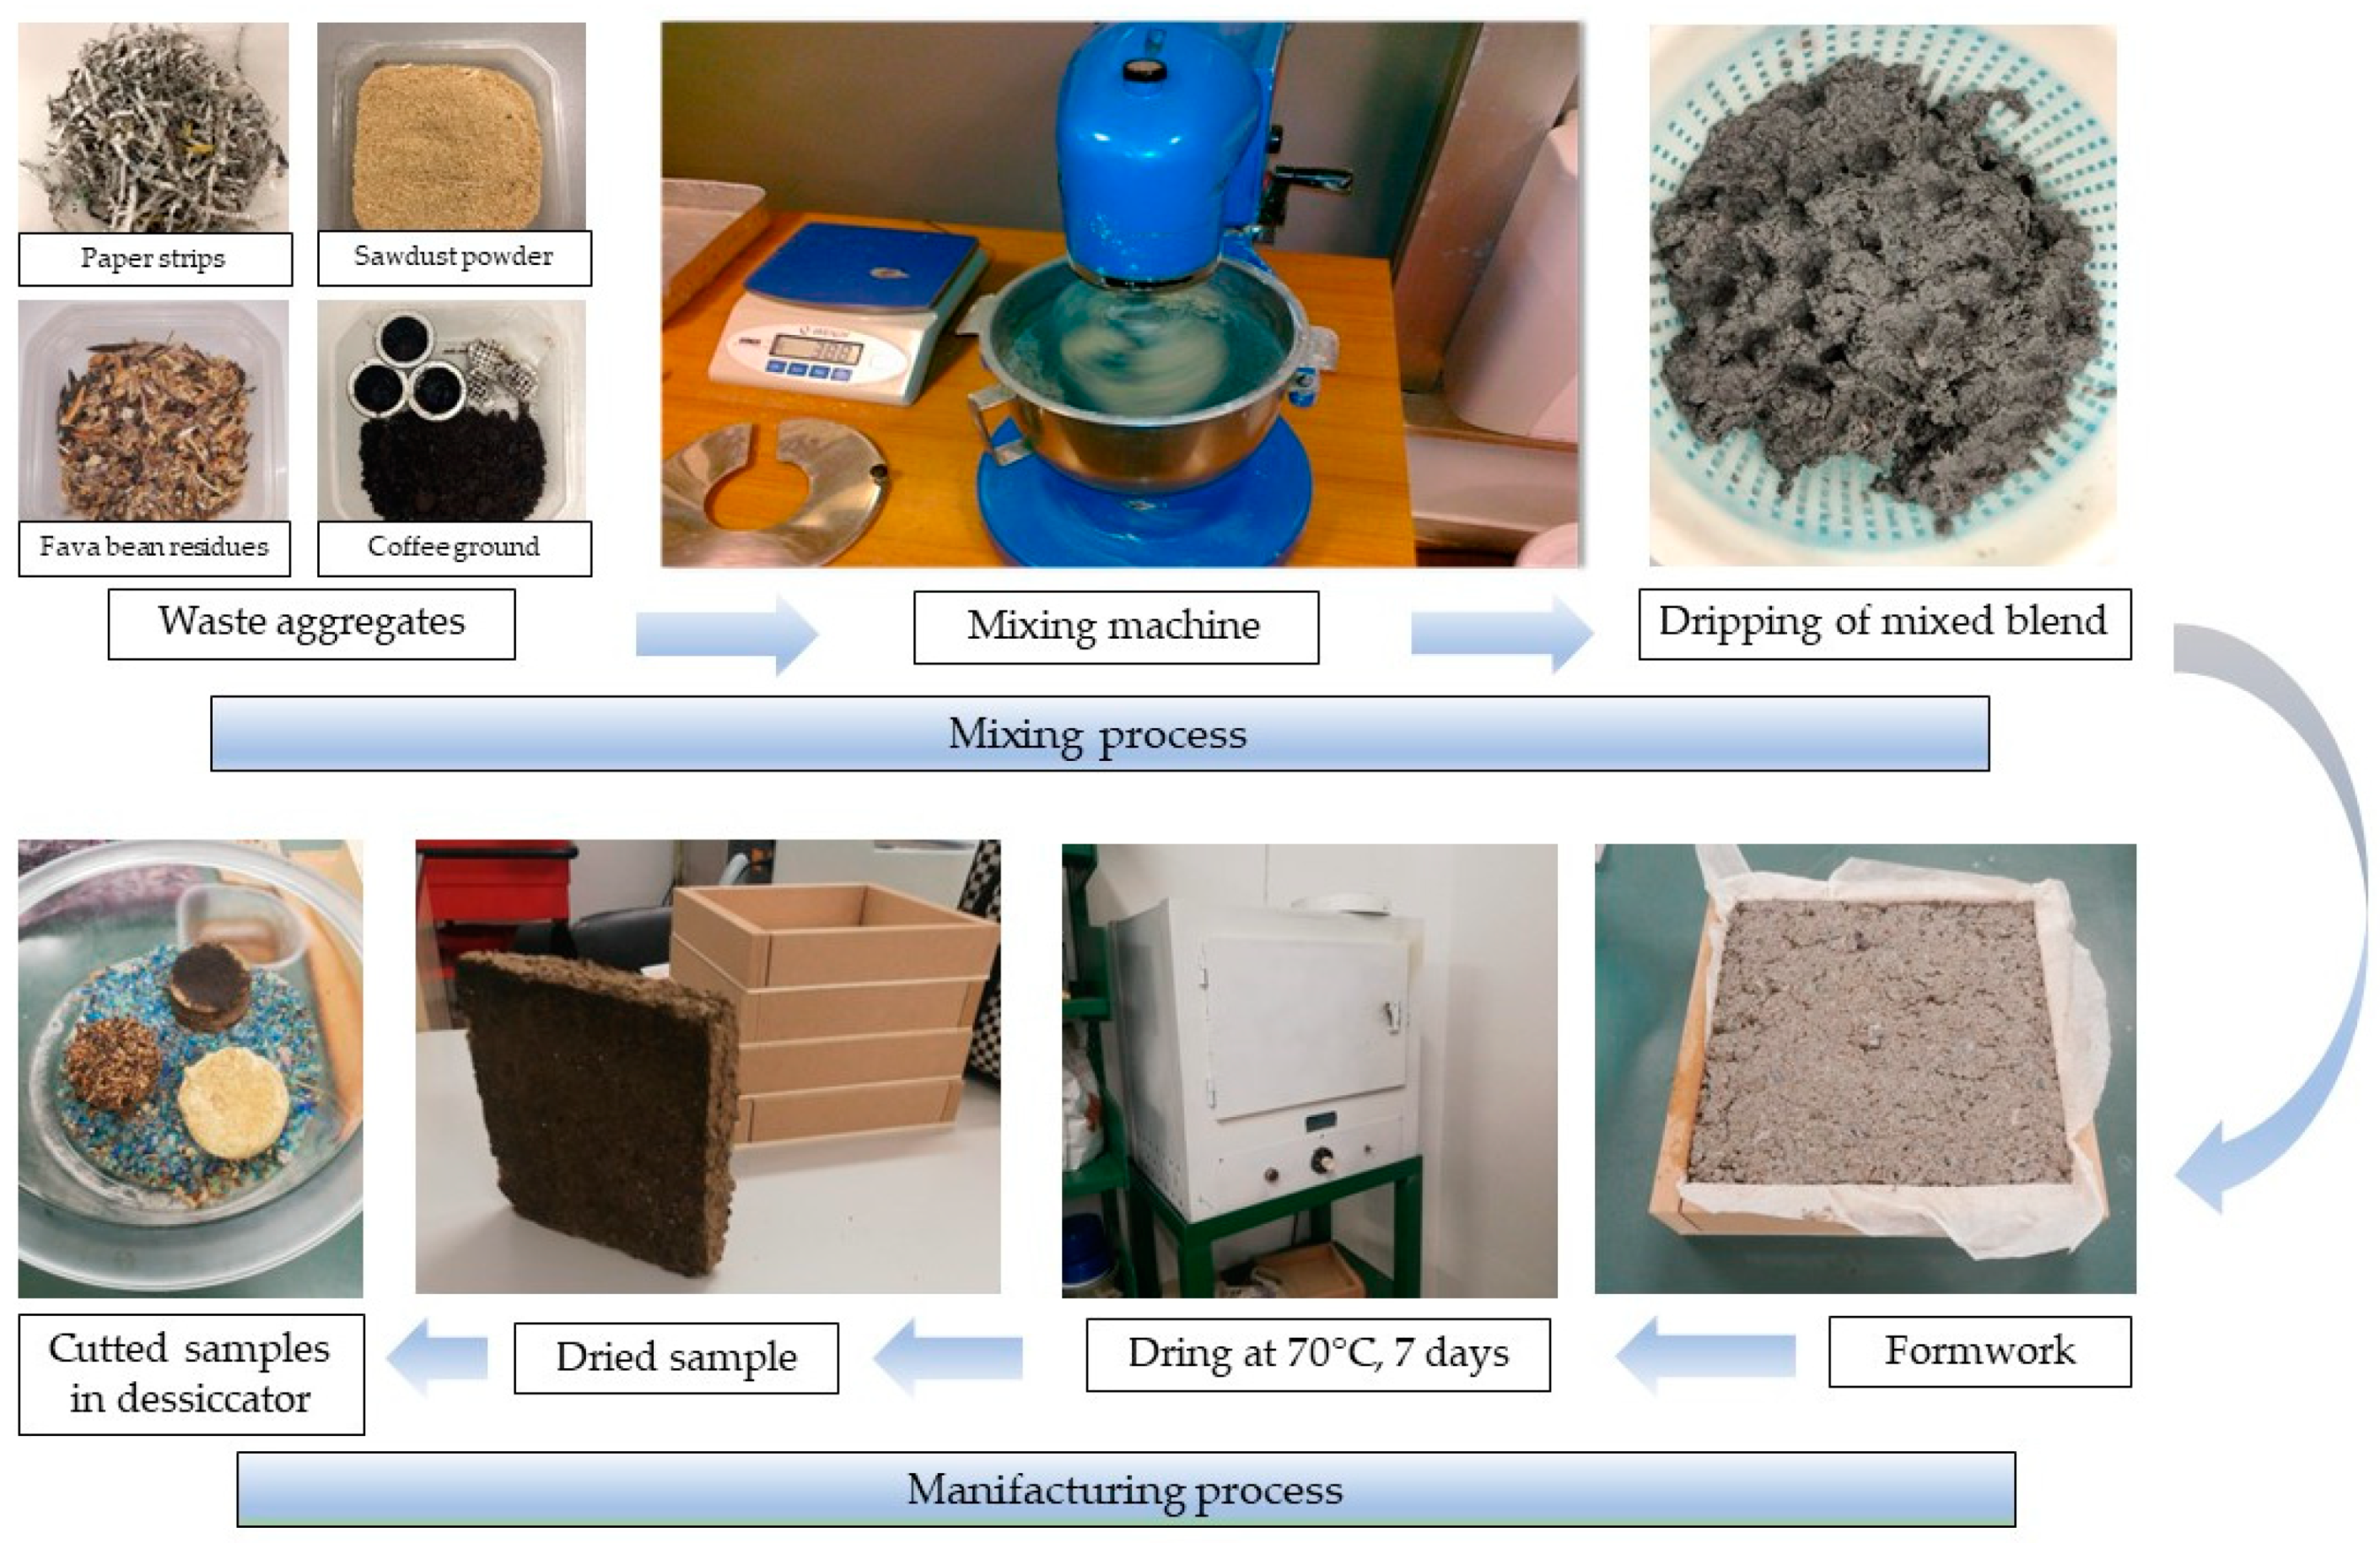
Strips of paper waste of about 4 cm length and 0.5 cm width were obtained by an office paper shredder and kept for 24 h in a water tank at room temperature in order to soften the paper matrix, allowing for better workability. The other aggregates were oven-dried at 90 °C until they reached a constant mass ±0.5%. Then, a mixing machine was used to obtain a homogeneous compound. In order to obtain the pulp paper, the excess water was removed by wringing out the mixture and leaving it to drip in a colander for 15 min.
The flow chart in Figure 1 highlights the main production process phases.
After mixing by a laboratory mixer machine (1400 rpm), the blend was settled in square wooden formworks with a 200 mm × 200 mm base and 40 mm thickness. The final specimens were cured at 70 °C for 7 days in a laboratory oven. Then, before starting the measurement campaign, different samples were cut with specific sizes and shapes according to the technical norms and left in a desiccator containing silica gel. The mix percentages shown in Table 2 were developed in the laboratory through a trial-and-error procedure, reaching a compromise between three fundamental aspects: (1) the best workability of the blend during the manufacturing process, (2) the compactness of the final specimens after the curing time and (3) the highest reachable bulk porosity and density. In fact, the numerous attempts performed in the laboratory demonstrated that the addition of the aggregates to the paper pulp blend can represent a real hang-up in the manufacturing process; on the other hand, the higher the target porosity, the more fragile the final specimens can be.
3. Test Procedure
3.1. Physical Tests
3.1.1. Micrograph Analysis
Scanning Electron Microscopy (SEM) was used to analyze the morphological structure, the textural features and the bond between the bio-based aggregates and the paper pulp of the composites. The examinations were carried out using a FESEM-EDX Carl Zeiss Sigma 300 VP (Carl Zeiss Microscopy GmbH, Jena, Germany).
Small samples of approximately 5 mm × 5 mm, previously prepared by depositing loose powder onto an adhesive carbon tab attached to an Al stub, were studied in the laboratory. Excess powder was removed using compressed air. Before introducing the samples in the microscope, they were sputtered with graphite (Sputter Quorum Q150 from Quorum Technologies Ltd., East Sussex, UK). The aim of SEM analysis is to study the nature of the structure of the single aggregates used and of the composite material after mixing, considering the adhesion between the pulp paper waste and the different aggregates (coffee ground, sawdust and fava bean residues).
3.1.2. Bulk Density
Bulk density, ρbulk (kg·m−3) is defined as the mass of particles in the material divided by the total volume occupied including particle volume, inter-particle void volume and internal pore volume. Bulk density cannot be considered an intrinsic property of materials as it changes according to the components, the composition and the voids. The bulk density of the composites was determined in accordance with ISO 12570 [59]. These requirements predict the dry mass and the structural dimensions of each sample. In this work, the mass of the samples was weighed using an electronic balance (0.01 g accuracy). For each mix three different samples were considered; the final value of the bulk density was obtained as the average value.
3.1.3. Bulk Porosity
The ASTM D4892 [60] was taken into account to measure the true density ρtrue (kg·m−3) of the specimens. A helium gas pycnometer (ULTRAPYC 1200-e, Quantachrome, Boynton Beach, FL, USA) was used to measure the bulk porosity. The open porosity ε was assessed according to Archimedes’ principles of gas displacement and the Boyle law of volume–pressure relationship. The measurement is based on the estimation of the pressure drop registered when the pressurized cell containing the sample is connected to the cell of reference volume. The true density ρtrue (kg·m−3) of the tested sample is defined as the ratio of the sample weight m (kg), previously measured by a laboratory scale (0.01 g accuracy) to the true volume Vtrue (m3) of the sample as measured by the pycnometer. Vtrue (m3) is the difference between the total volume Vtot (m3) and the pore volume Vpores (m3).
Chang et al. [61] emphasized that pores inaccessible to helium penetration are included in the sample volume. Conversely, the pores accessible by the gas are excluded by the volume of the tested sample.
3.2. Thermal Tests
The thermal tests were performed after conditioning the specimens in a laboratory air-oven at 50 °C until achieving a change in mass less than 0.5%. Before starting the measurements, the specimens were polished by a grinder and polisher (FORCIPOL 300–1 V, Kemet Metkon) to allow a suitable adhesion of the circular base of the sample to the thermal probe avoiding superficial air voids development.
In order to evaluate the thermal behavior of the experimental materials, measurement of the dry-state thermal conductivity λ (W·m−1·K−1), the thermal diffusivity a (m2·s −1), and the volumetric heat capacity ρc (J·m−3·K−1) were performed in laboratory conditions (22 ± 2 °C and 50 ± 5% RH) using the transient plane source device (ISOMET 2104, Applied Precision Ltd., Bratislava, Slovakia).
The specific heat capacity c (J·K−1·Kg−1) was indirectly calculated based on the volumetric heat capacity and the bulk density of the samples. For all the mixtures, the tests were performed on three representative samples of 100 mm diameter and 40 mm thickness. The values shown in Table 3 are the mean of three measurements.
3.3. Acoustic Tests
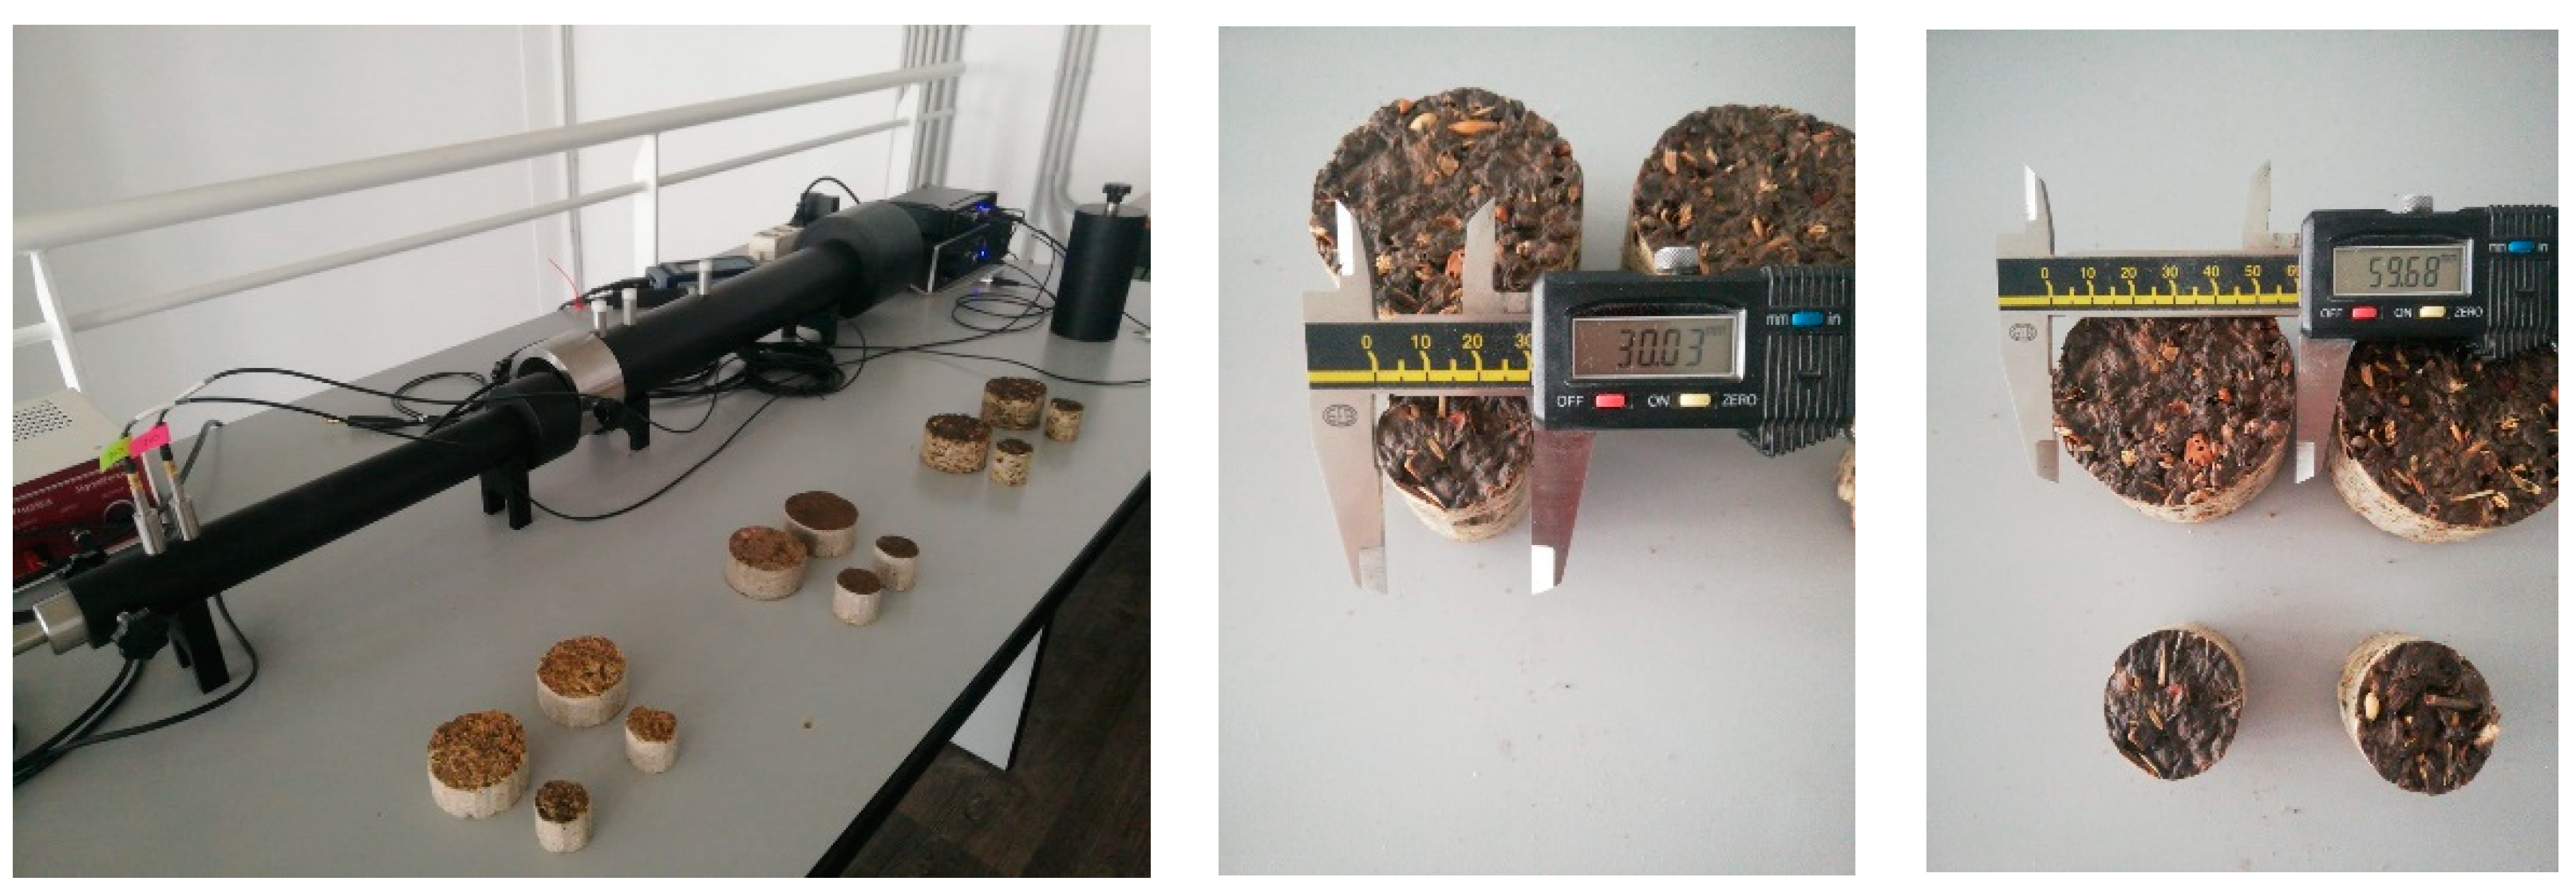
The normal incidence sound absorption coefficients α0 were measured by a BSWA SW 260 impedance tube, according to the ISO 10534-2 [62], following the transfer-function method. The measurements were performed at 18 ± 2 °C and 40 ± 2% RH. Two different cylindrical samples of 30 mm and 60 mm diameter were tested for each type of mix (Figure 2). The measurements were performed on both faces of each specimen. A 20 W loudspeaker was placed at the end of the tube in order to produce an acoustic plane wave on the front surface of the experimented sample set on the opposite side of the tube. Two ¼″ microphones on the tube wall measured the pressure at two fixed positions, allowing us to calculate the transfer function between the measured signals. The normal incidence reflection factor and the normal incidence sound absorption curve were estimated based on the complex transfer function between the measured signals and the distance between the two microphones and the exposed surface of the sample. The frequency range from 125 to 5000 Hz was taken into account, considering two different measurement configurations. The 60 mm tube was used for the low and medium frequency range (125 ÷ 2500 Hz), while the 30 mm tube was adopted for high frequency range (800 ÷ 5000 Hz).
The measurement procedure was controlled by means of a graphic user interface developed in MATLAB® (2018, Mathworks, Natick, MA, USA) and using a sine sweep to feed the loudspeaker. The measured sound absorption coefficients were then compared with the values estimated by the semi-phenomenological prediction model developed by Johnson, Champoux and Allard (later on referred as JCA) [63,64] to describe the complex density of an acoustical porous material with a motionless skeleton and an arbitrary pore shape. More refined models were not used at this stage to limit the number of estimated parameters.
According to the model, the absorption coefficients of the tested materials were obtained after determining the characteristic impedance Zc and the wavenumber k expressed as a function of the effective (or dynamic) bulk density ρe and bulk modulus ke as follows:
ZC = (ke ρe)0.5
k = (ρe/ke)0.5
These two parameters are correlated with the physical characteristics of porosity ε, tortuosity τ, viscous characteristic length Λ, thermal characteristic length Λ′, air flow resistivity σ (i.e., the air flow resistance per unit thickness) and bulk density. The two characteristic lengths are defined as the effects of viscosity and thermal dissipative forces produced inside the porous structure. The viscous characteristic ranges between 0.30 and 3; it takes into account the pore shape by the variable s reflecting the deviation of the pore shape from an ideal circle. It represents the weighted volume to surface area ratio of the pore. The thermal characteristic length is strictly correlated with the complex internal structure of such materials and usually it can be assumed Λ′ ≥ Λ.
Due to the complex determination of the input parameters useful for JCA (Johnson, Champoux and Allard), the missing values were estimated using the inverse method [65].
Taking into account the bulk density, bulk porosity and sound absorption coefficient, the values of the missing properties (i.e., flow resistivity, tortuosity, shape factor, characteristic lengths) were obtained by an optimized search algorithm, developed in the Matlab® software, that can reach the best match between measurements and predictions based on their average values and their uncertainty.
4. Results and Discussion
4.1. Morphological Results
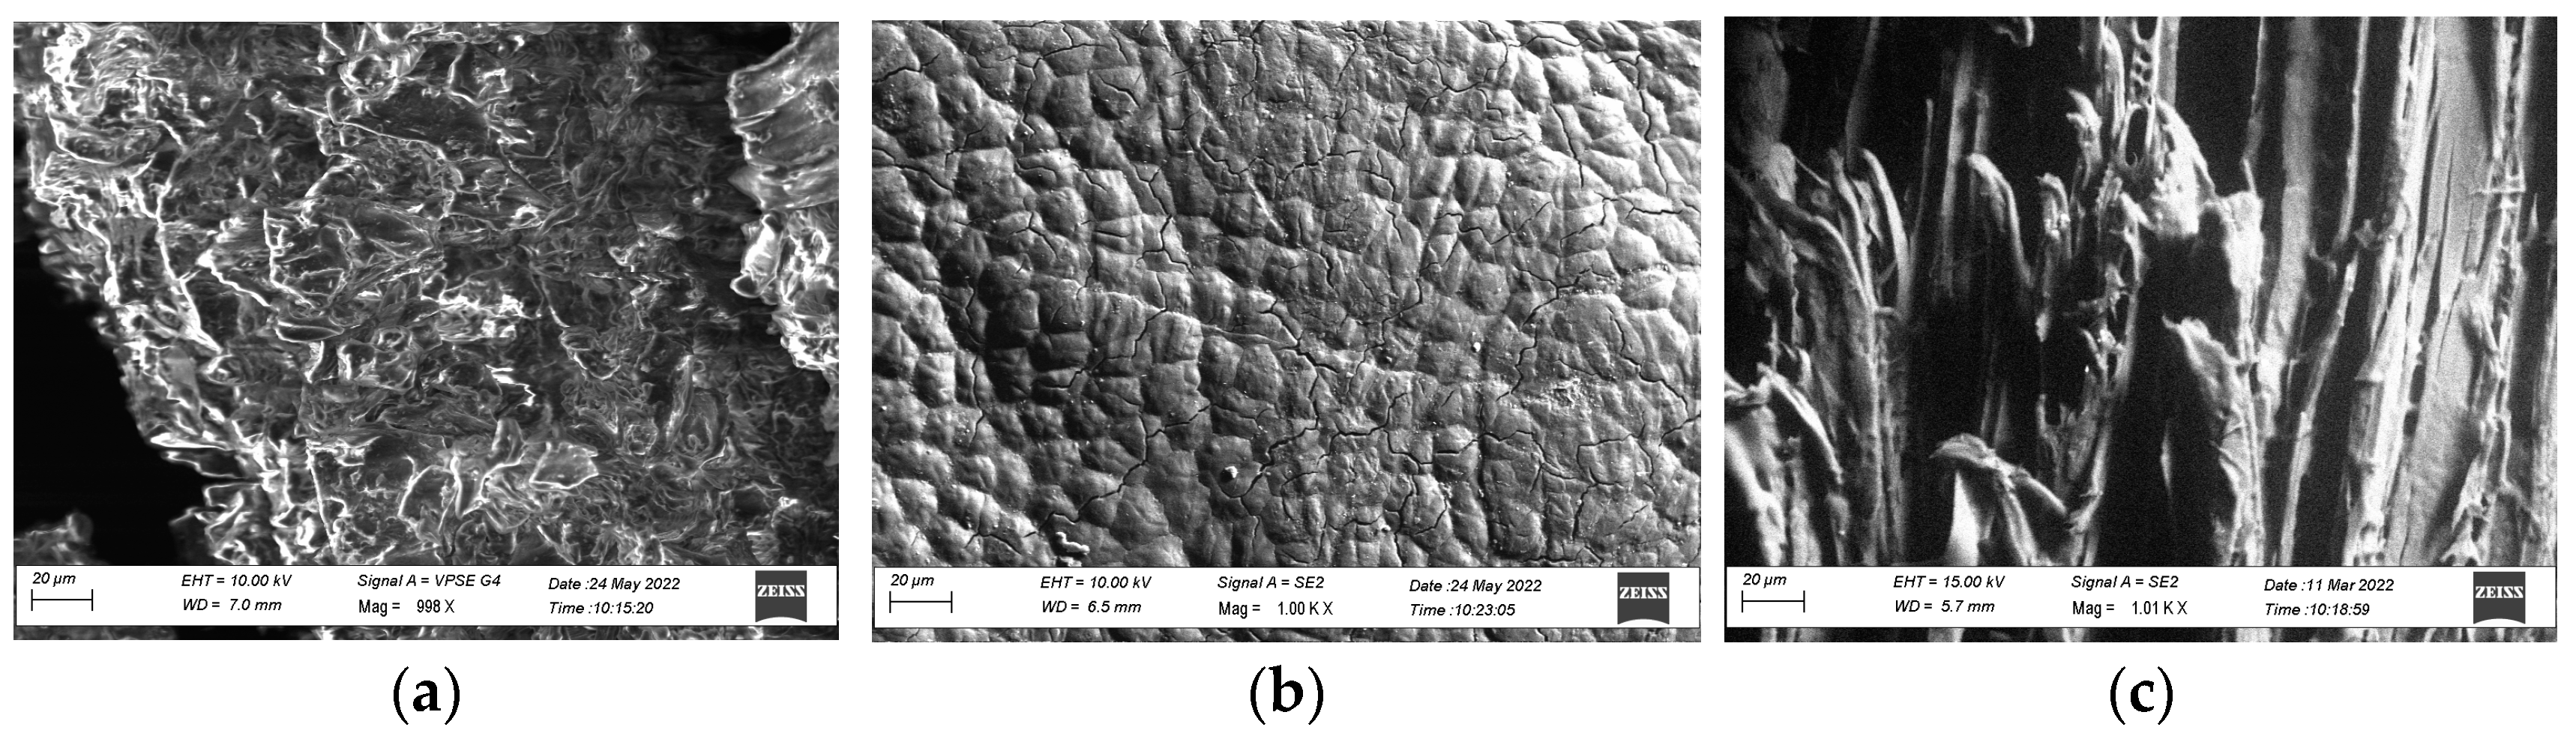
SEM micrographs (Figure 3a–c) highlight the morphology of the different single aggregates used in the mixes. The grains of the coffee waste (Figure 3a) have a convex surface, and several hollows can be seen. The microstructure appears untidy, and, as confirmed by Yun et al. [66], the coffee aggregates have a laminated structure. The analysis of the fava bean residues (Figure 3b) shows a complex cellular structure with closed pores. Based on this evidence, it might be hypothesized that the microstructure plays a relevant role in the physical, thermal and acoustical performance. As can be seen from Figure 3c, the sawdust residue has a fibrous morphology showing a porous structure suitable for good paper pulp adhesion.
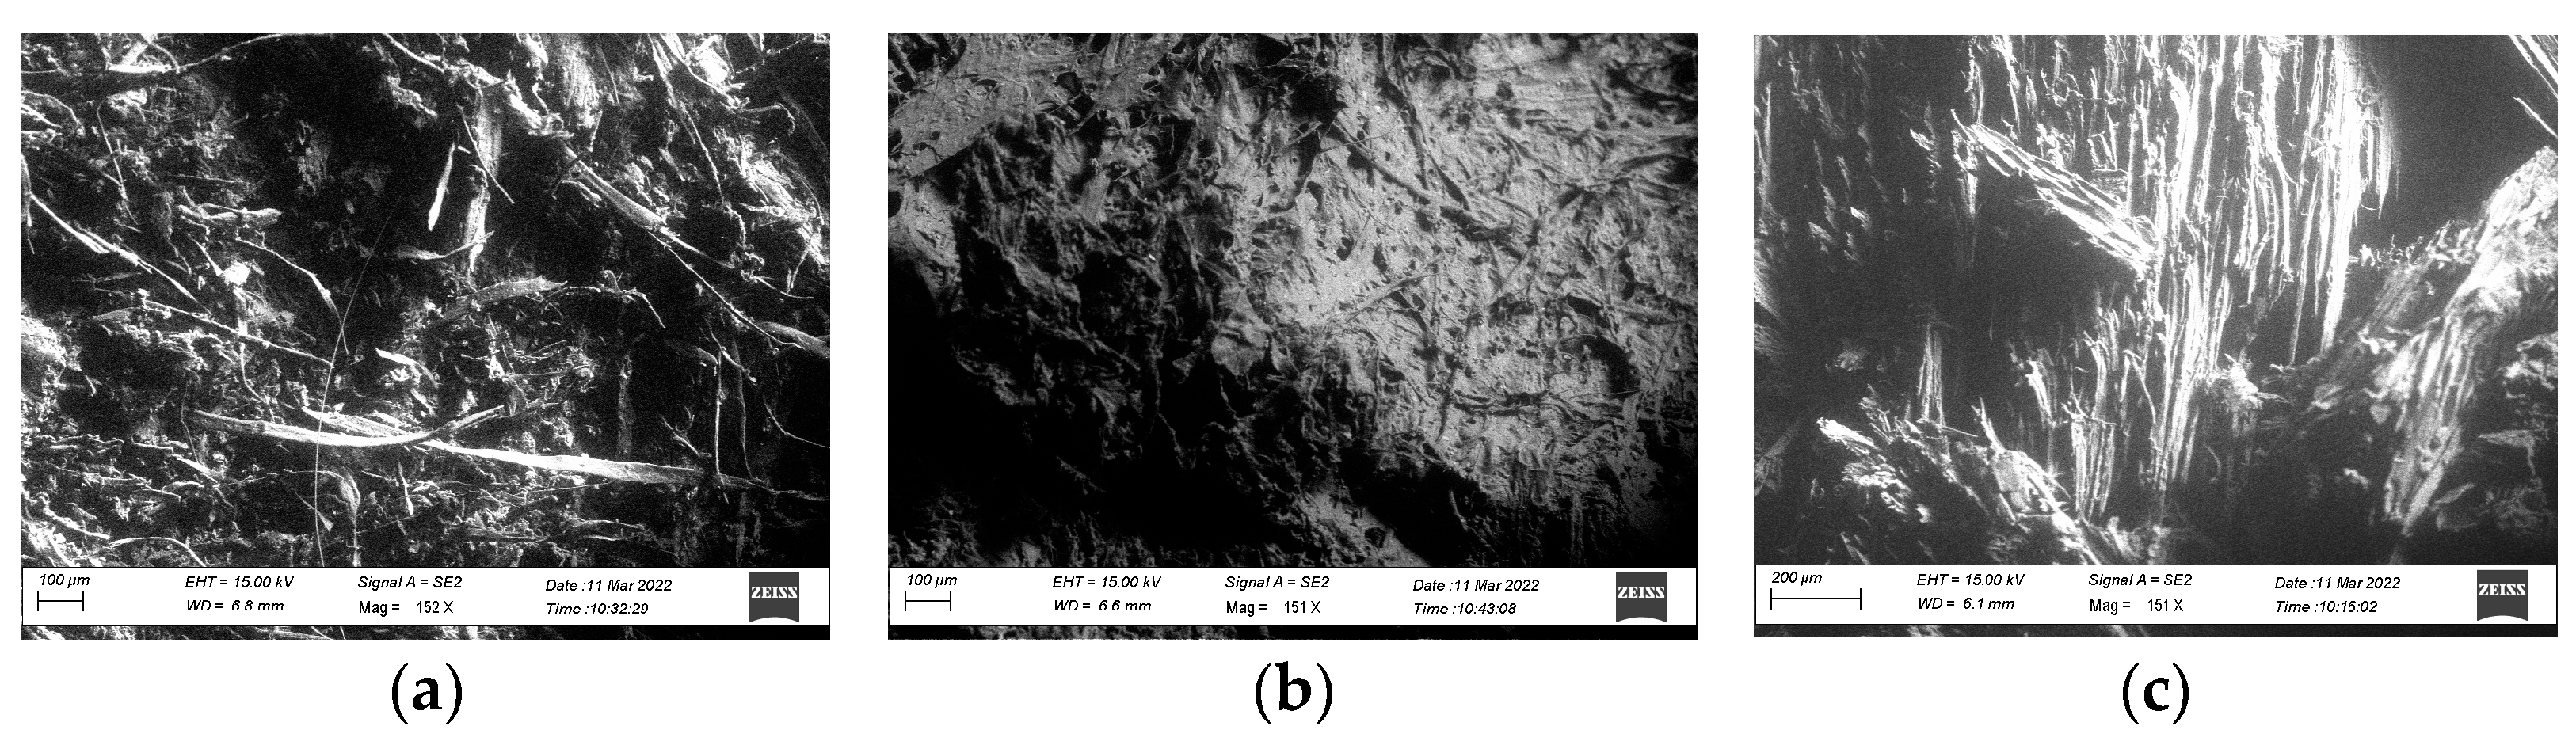
Depending on the waste by-products and the binder aggregation, Figure 4 shows the effect of mixing the by-product with the pulp paper and the polyvinyl glue. It can be observed that the presence of a more porous and fibrous structure, such as in the sawdust, allows a more porous final matrix (Figure 4c). As a matter of fact, the FB mix shows an evidently lower porosity (Figure 4b).
In particular, the specimen with coffee grounds shows a tangled structure, evidencing the irregular shape of coffee powder flakes (Figure 4a). The fibrous matrix of the paper strips used in the mix can be clearly seen when using coffee grounds and sawdust by-products (Figure 4a–c); it consists of various bundles of fibers knotted to each other. Instead, the presence of the more compacted fava bean residue matrix allows the binder to totally cover the components. The SP mix (with sawdust) (Figure 4c) clearly shows the highly oriented structure that was maintained in the sawdust also after mixing the different components; the tidy form of the filaments can be easily observed. This is likely to result in anisotropic (or strongly non-uniform) behavior, as suggested by Singh et al. [67]. Overall, the samples all show interesting absorption coefficients, particularly in the higher bands, considering that they are rigid and might be used either for wall paneling or false ceilings. However, the low frequency performance is interesting (particularly for the FB mix) and might further be improved by proper mounting of the panels to create air gaps and take advantage of the rigid behavior.
4.2. Thermal Performances
Thermal conductivity is related to the heat transfer process and it is strictly correlated with the density and the water content of the material. Furthermore, the effect of porosity on thermal conductivity has been observed by several researchers. Clarke [68] stated that the reduction in thermal conductivity is strictly dependent on the pore volume fraction, aspect ratio and their spatial distribution. Table 3 shows the results achieved by the thermal tests and the physical performances.
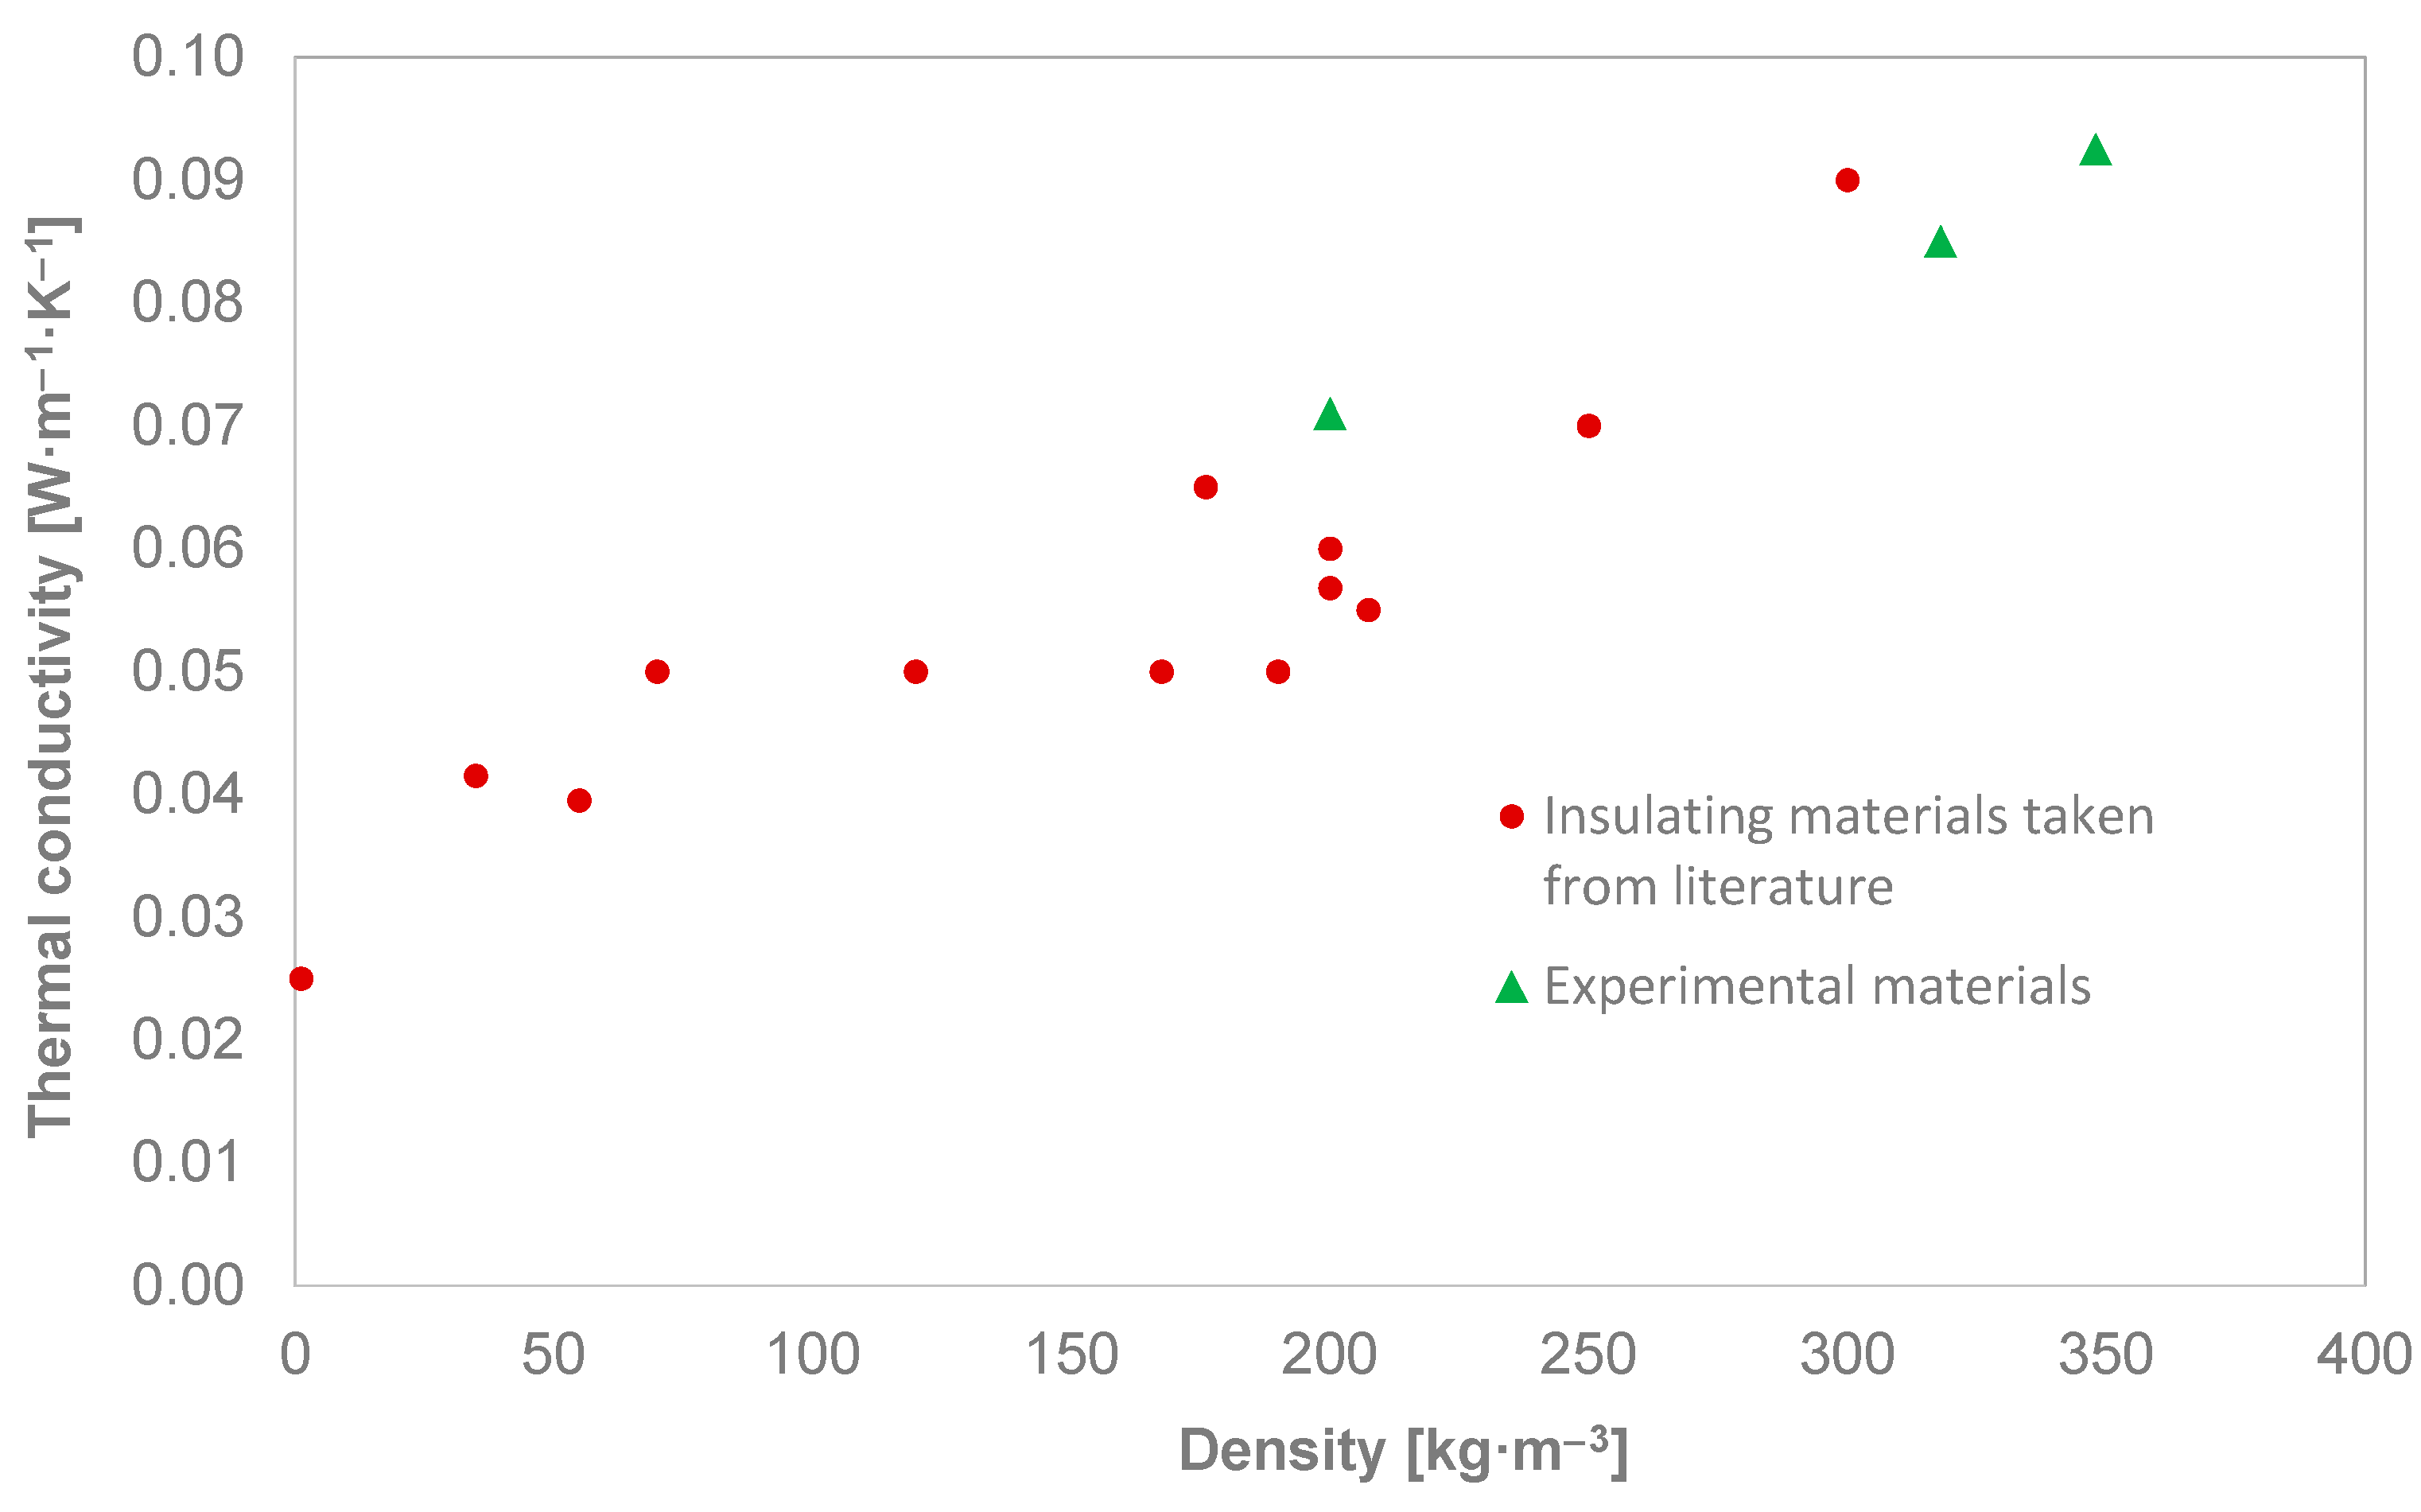
All the results refer to measurements performed after oven drying. The thermal conductivity of the tested samples ranges from 0.071 to 0.093 W·m−1·K−1. A material is considered a thermal insulator when it has a thermal conductivity λ (W·m−1·K−1) lower than 0.100 W·m−1·K−1 [69], thus it is possible to include the tested materials in the category of thermal insulators. The results presented in Table 3 and Figure 5 show that the thermal conductivity increased from 0.0710 W·m−1·K−1 with a density of 200 kg·m−3 to 0.093 W·m−1·K−1 with a density of 348 kg·m−3.
It can be noted that the best insulator was the SP sample; the presence of the sawdust in addition to the paper pulp improved the porosity, enhancing it, as expected also by the SEM analysis (Section 4.1). The fibrous morphology of the sawdust residue contributes to a good paper pulp adhesion, reducing the bulk density of the final specimens and increasing the bulk porosity. Table 4 shows a comparison between the experimental materials and traditional ones in terms of thermal properties, taking also into account some studies on thermal insulators. Moreover, Figure 5 focuses on the range of thermal conductivity changes versus bulk density.
A first comparison between the experimented materials and the most traditional insulators existing on the market, taken from the UNI EN ISO 10456 [70], allows us to assimilate the property of the SP mix into the wood-based panels (Fiberboard).
The CG and FB mix have a bulk density and thermal conductivity similar to plywood with a thermal conductivity of 0.090 W·m−1·K−1 and a density of 300 kg·m−3.
Furthermore, as previously demonstrated by the SEM analysis, it can be observed that the compacted cellular structure with closed pores of the fava bean grains provokes total coverage of the PVA glue and, as a consequence, the lowest porosity and the highest thermal conductivity in comparison with CG and SP mix.
Secondly, some studies were taken into account. Considering vegetable fibers such as straw [71] and hemp [72], it can be observed that the SP mix is comparable to the straw insulation. Schiavoni et al. [13] evaluated the thermal conductivity of some natural fibers such as cotton and cellulose, finding thermal values lower than 0.044 W·m−1·K−1. Considering the results given by Pfundstein et al. [73] the cellular materials with the highest density values, such as calcium silicate and cellular glass, have similar thermal conductivity values to the SP mix.
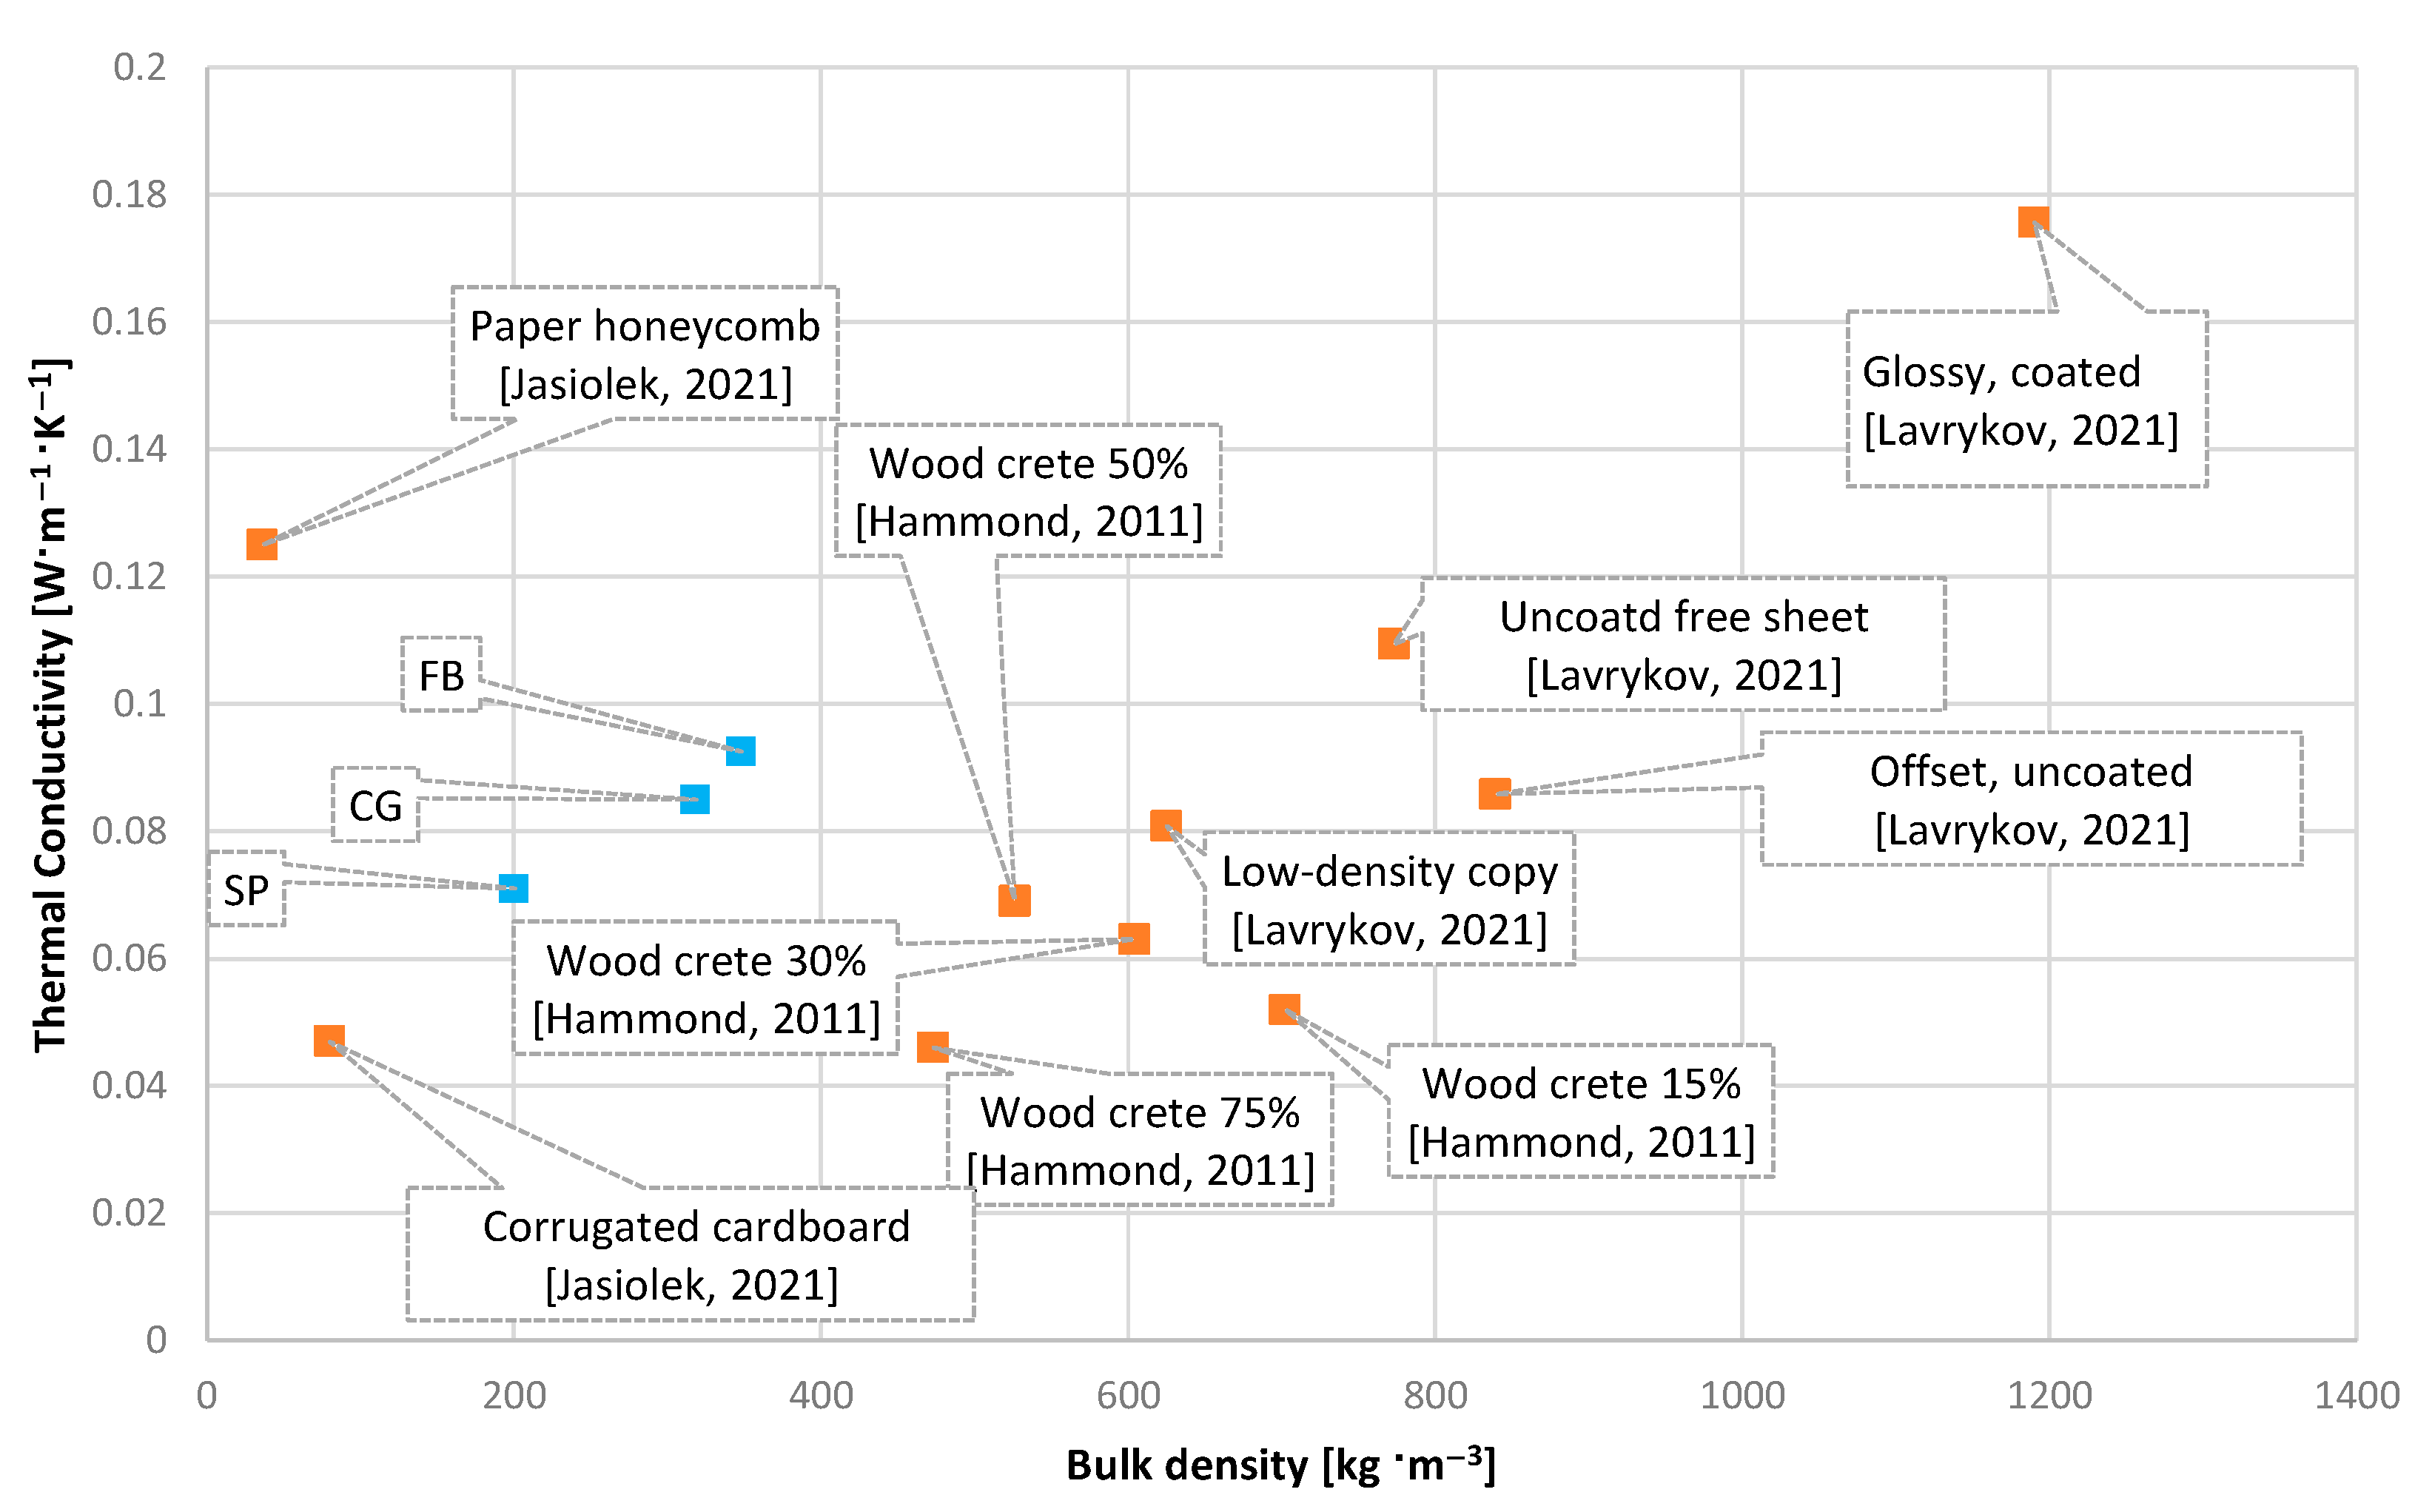
Figure 6 shows thermal conductivity versus bulk density for different paper-based materials compared to the experimented ones. Aigbomian et al. [25] tested the insulating blocks of wood-crete with sawdust, paper, lime and concrete, finding that the thermal conductivity varies from 0.046 to 0.069 W·m−1·K−1, according to the paper waste content (which changed from 15% to 50%). It can be noted that the SP mix had a thermal conductivity similar to that of the wood-crete mixed with 50% waste paper.
Jasiolek et al. [74] presented a review of paper-based material used for designing building envelopes; all the experimented mixes can be included in the thermal conductivity range of corrugated cardboard and paper honeycomb. Lavrykov et al. [75] tested the thermal conductivity and specific heat of paper suitable for copying or digital printing. The values shown in the graph demonstrate that, despite the bulk density difference, the CG mix has a thermal conductivity similar to that of uncoated paper.
4.3. Acoustic Analysis
Sound absorption is a fundamental parameter affecting indoor acoustic comfort. Porous materials offer optimal behavior in terms of noise mitigation either when used as surface treatments (due to sound absorption) or as intermediate layers (due to their good damping properties). The normal incidence sound absorption coefficient (α0) is the ratio of the absorbed to incident sound energy, varying from 0 to 1, where 0 corresponds to total reflection and 1 to total absorption. For porous materials, the absorption coefficient usually increases with frequency and also with the thickness of the absorptive layer.
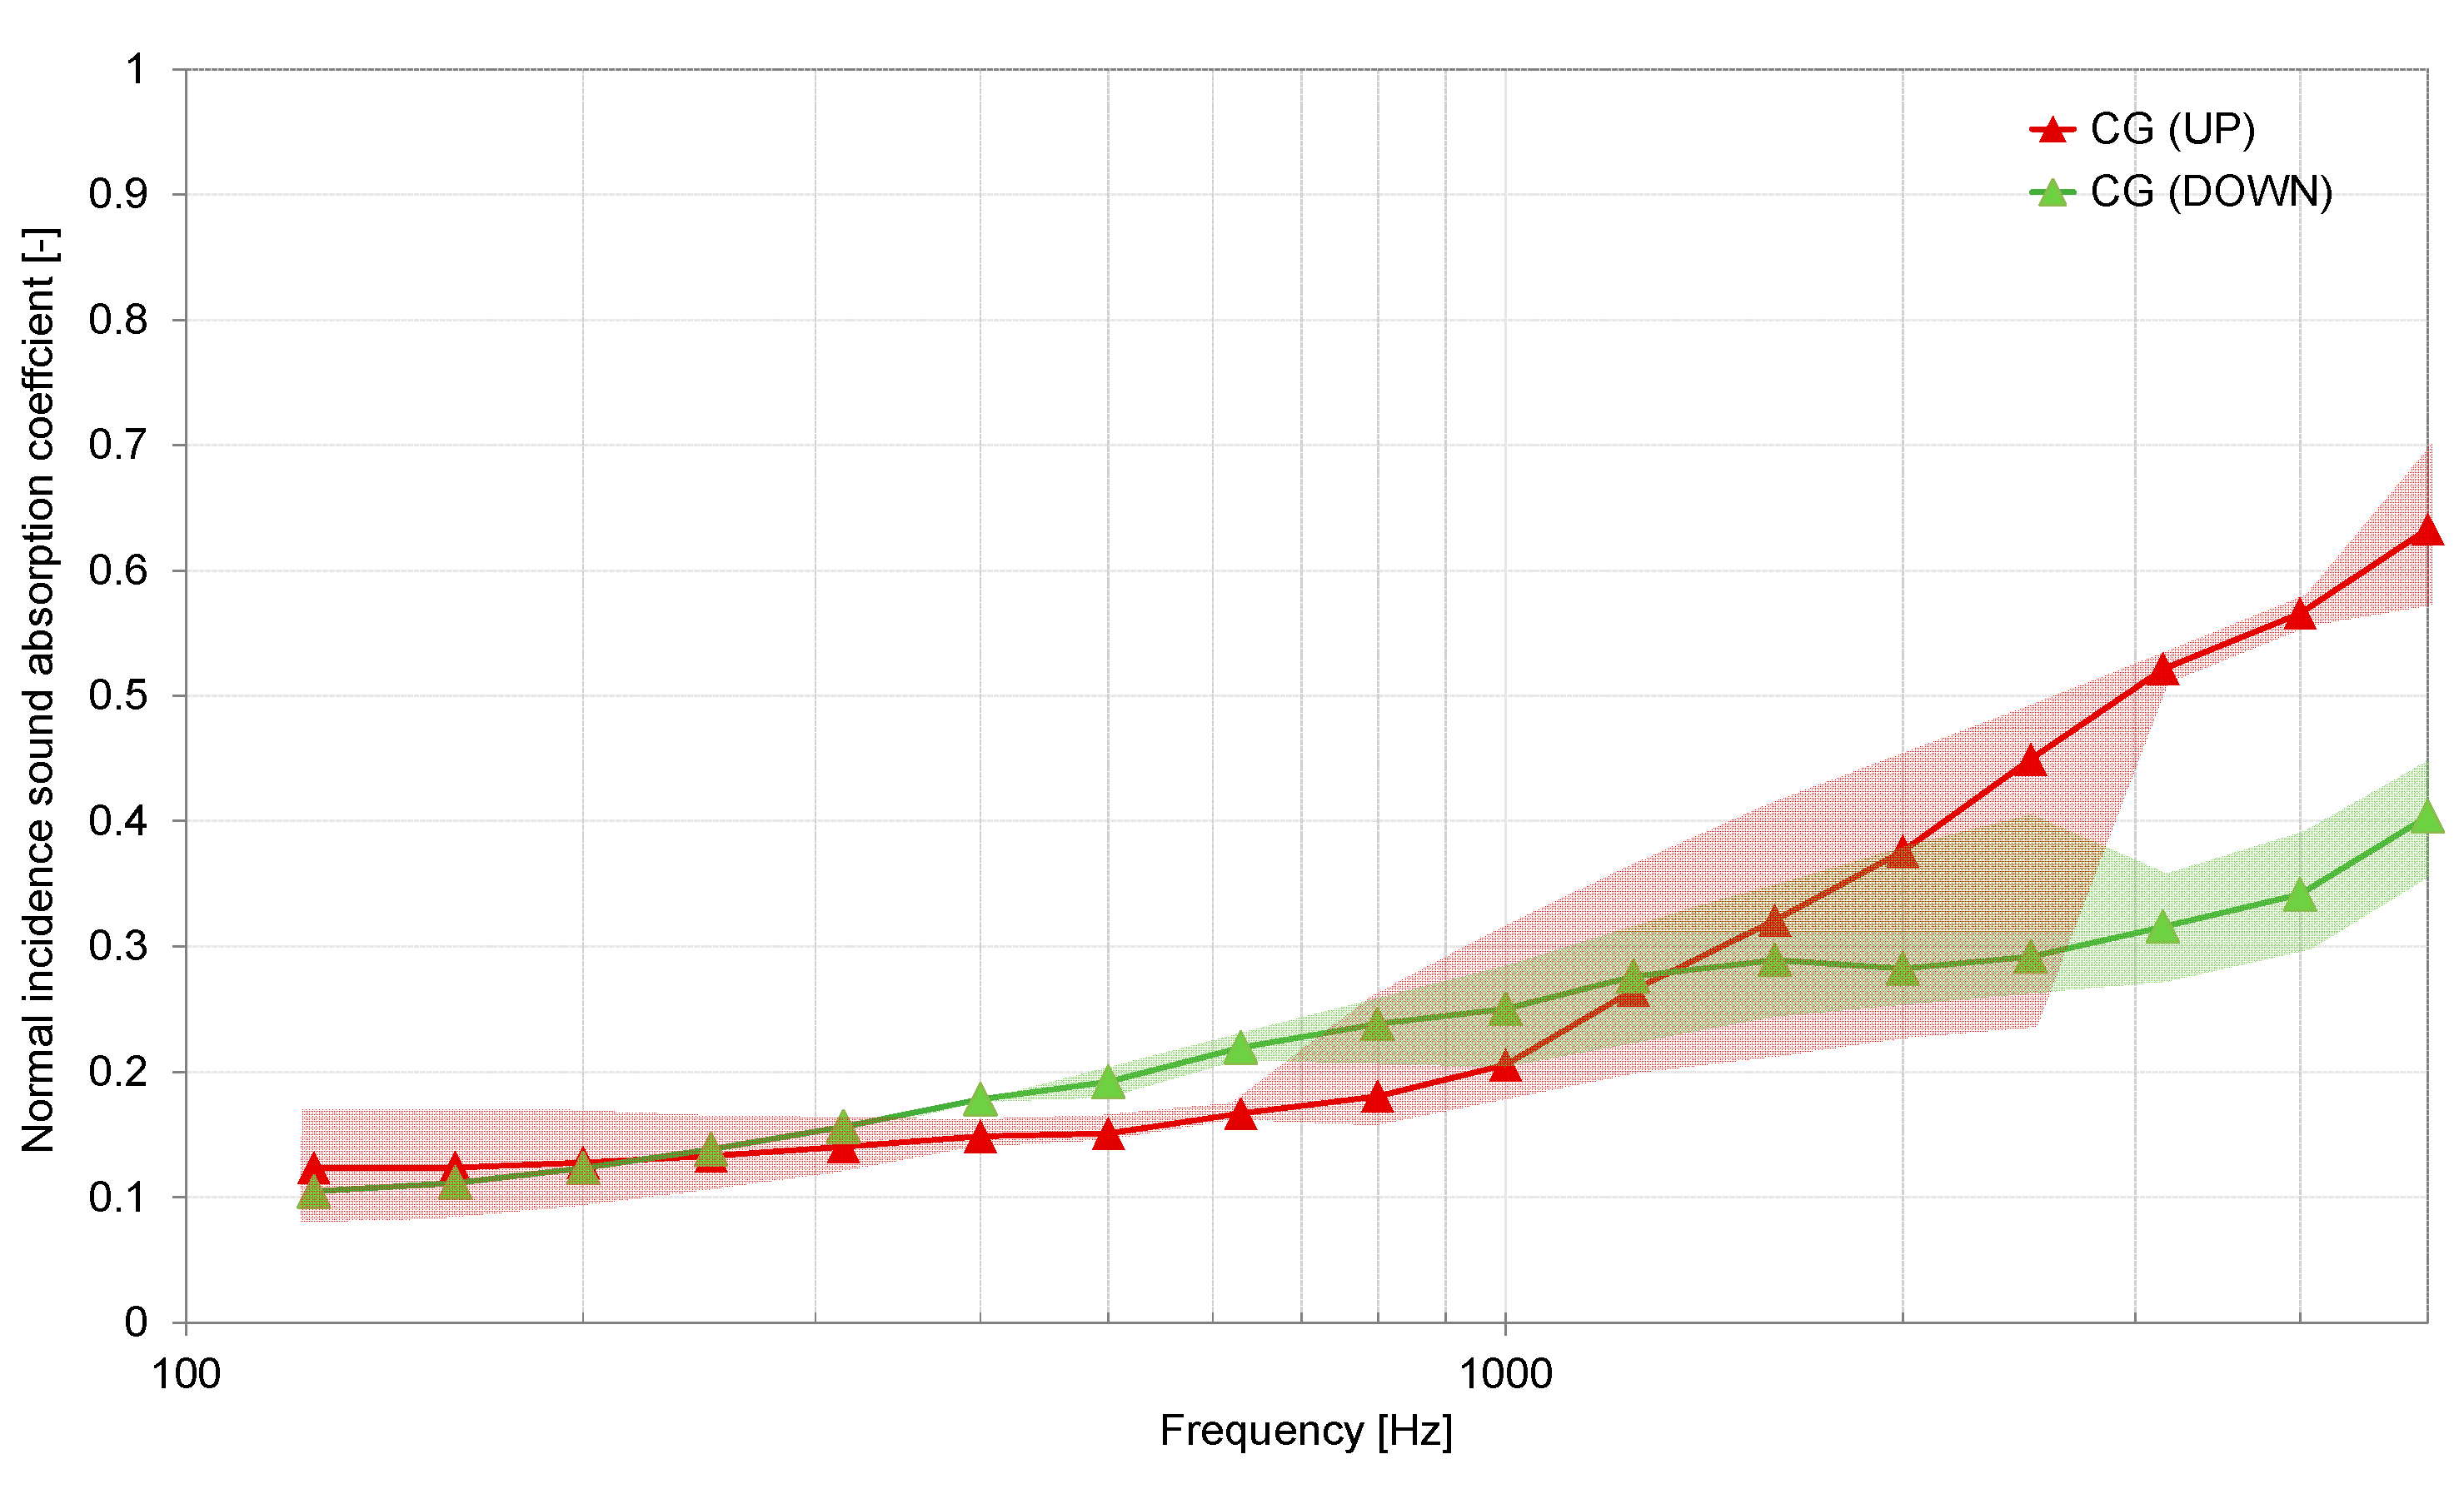
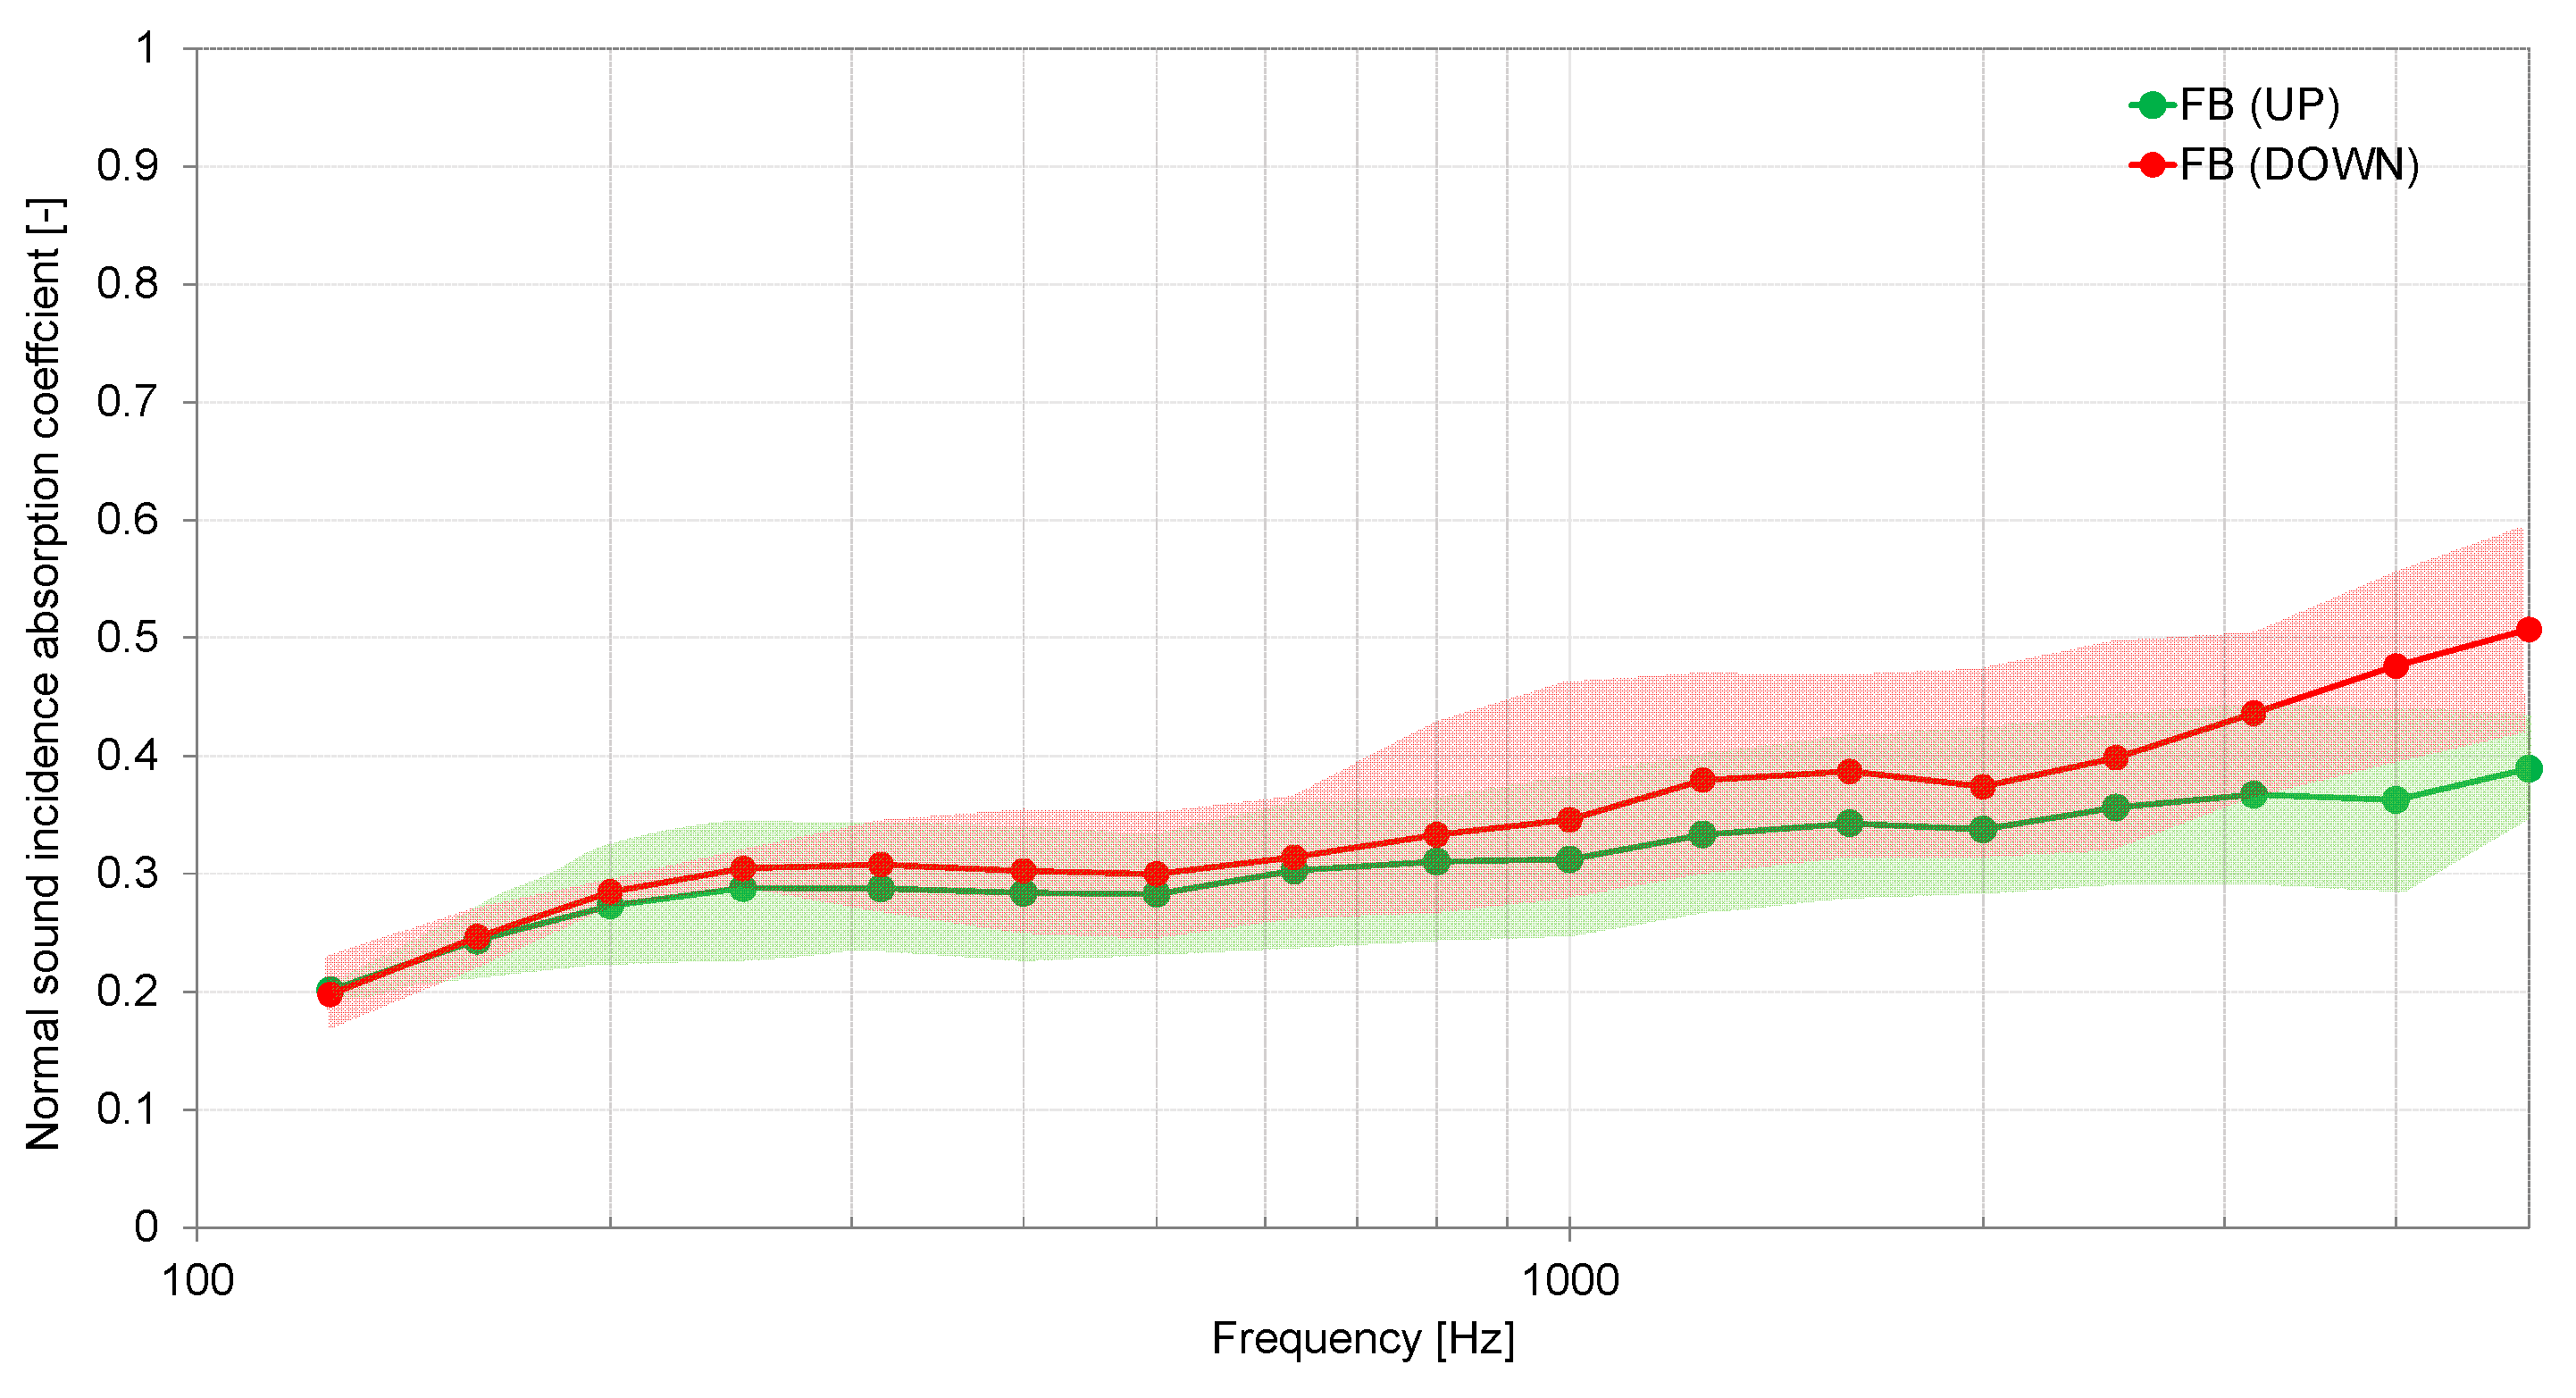
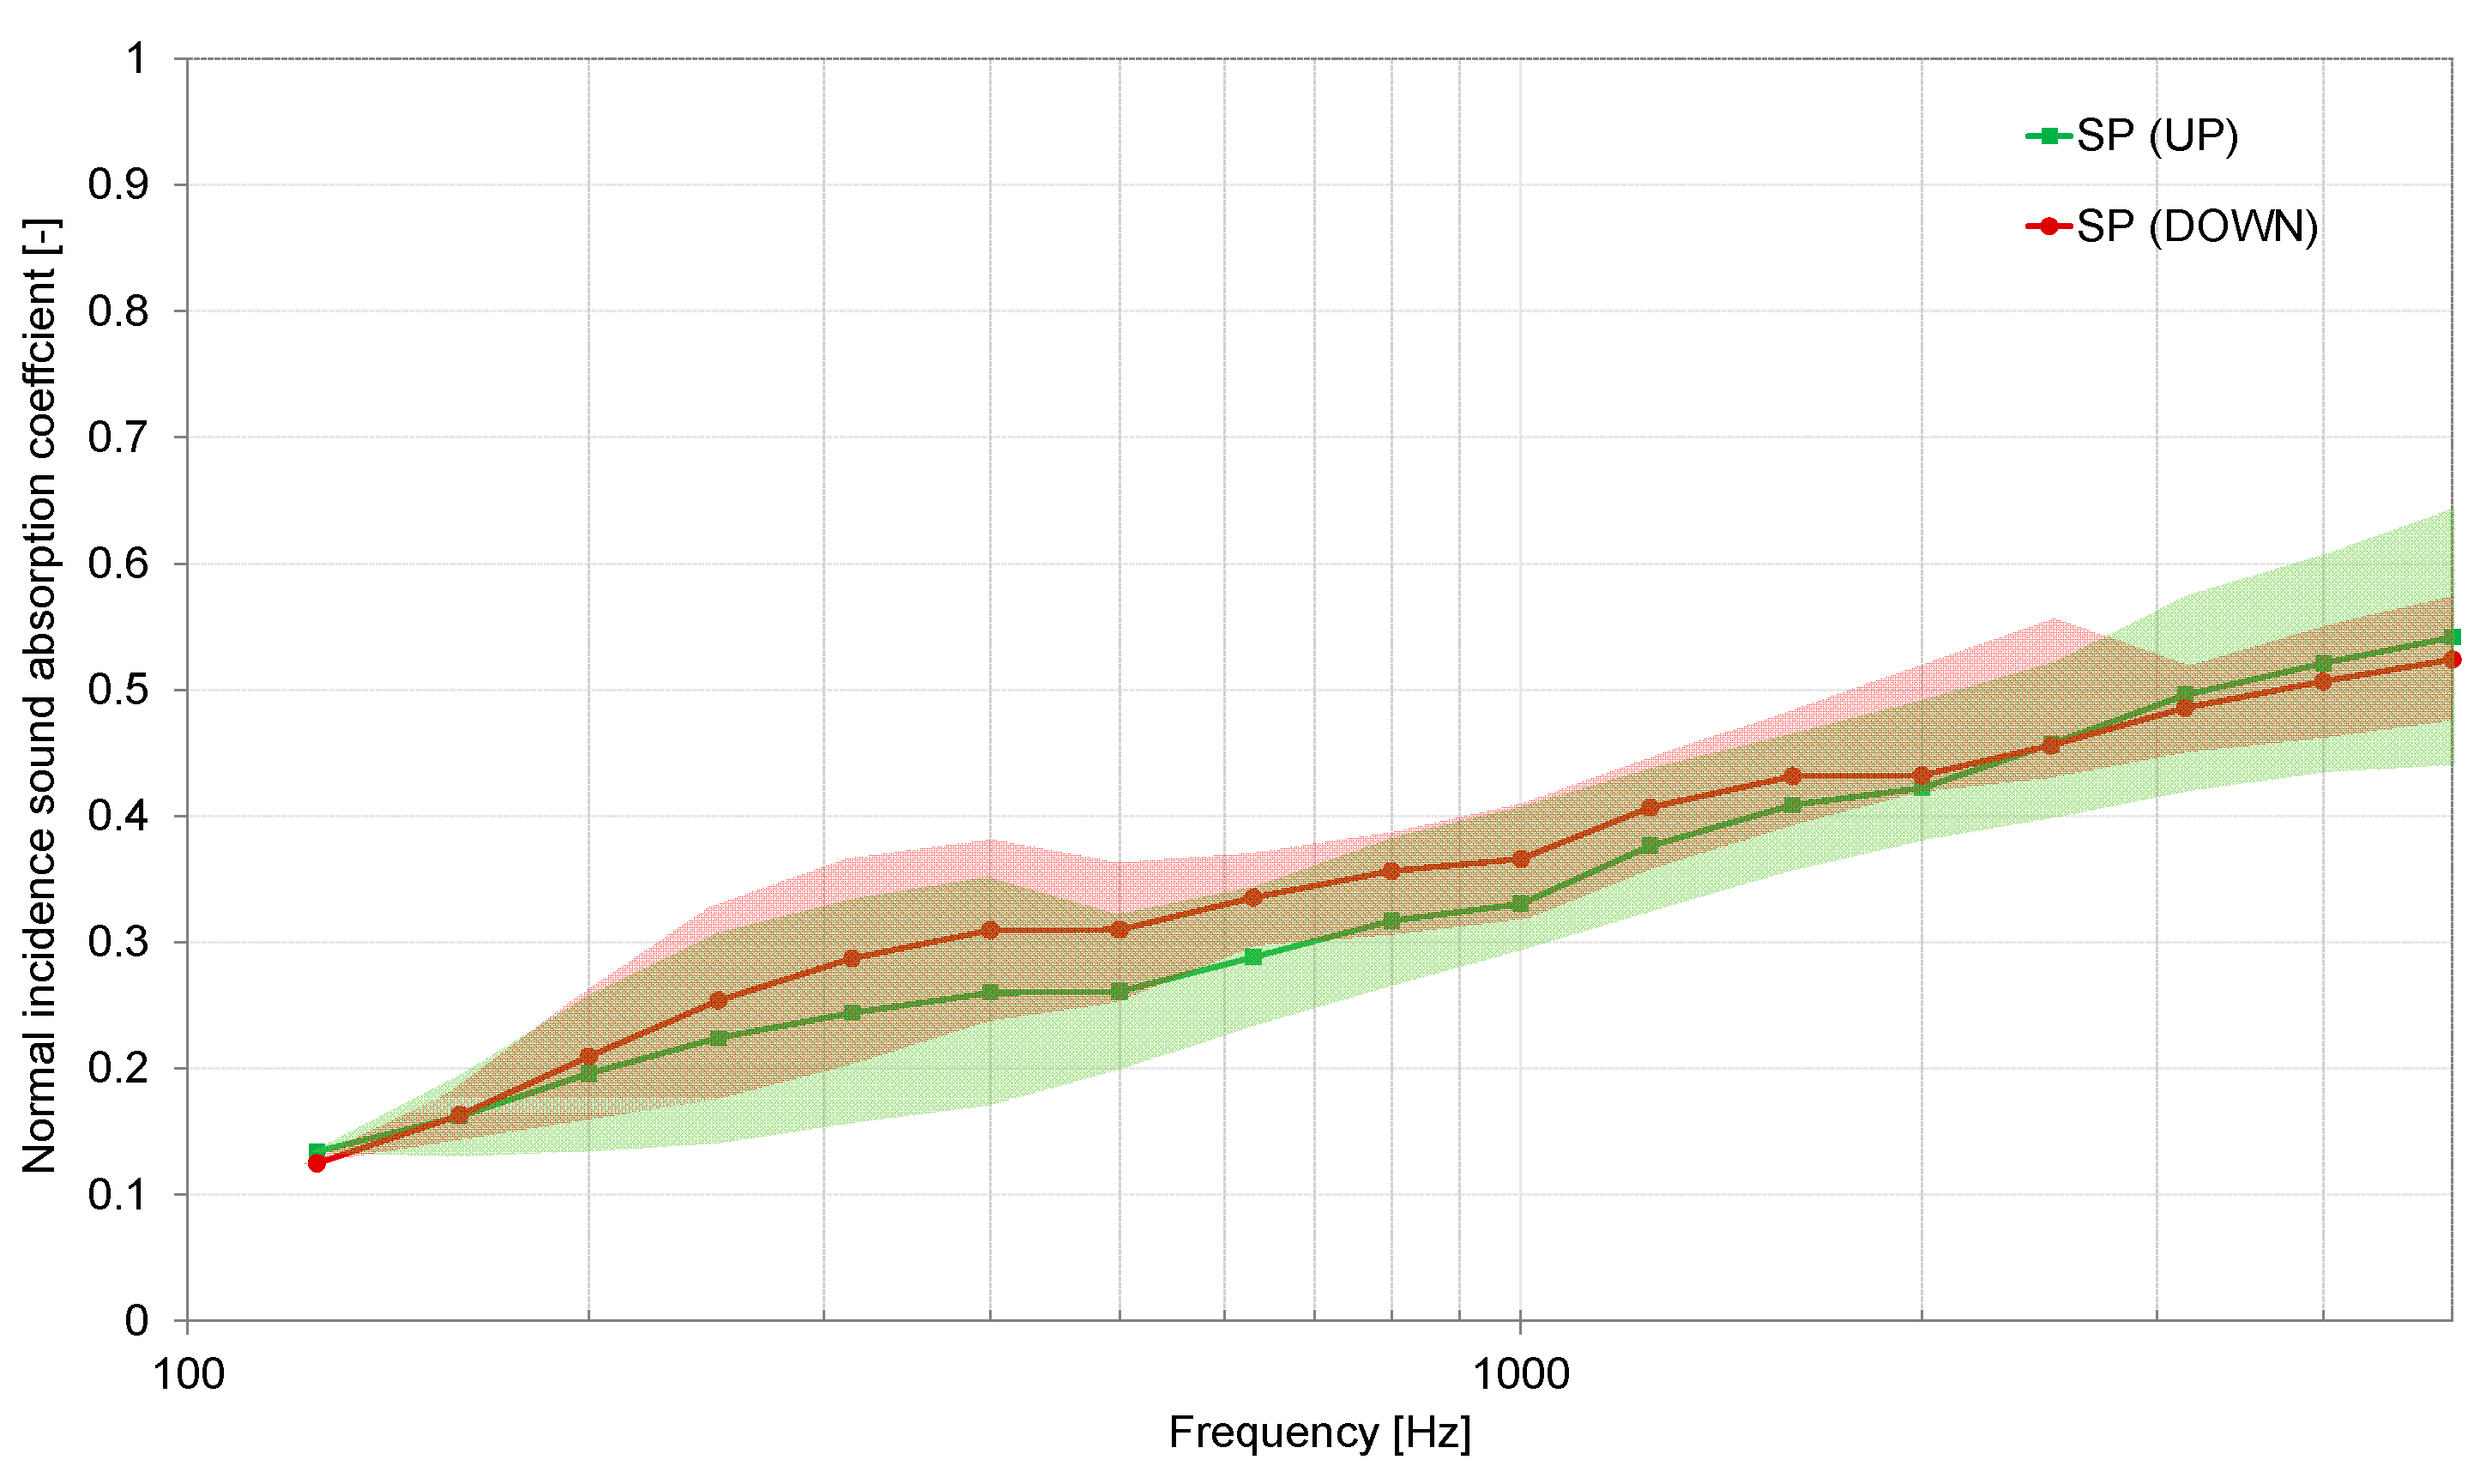
Figure 6, Figure 7 and Figure 8 show, for each mix, the average absorption coefficient curves measured in the impedance tube according to the ISO 10534-2 [62] of the bottom face (named “down”), which was directly in contact to the mold, and the top face (named “up”), which was exposed to air. The curves are plotted in one-third octave bands with center frequencies from 125 Hz to 5000 Hz. The colored area represents the range variation of the standard deviation. It can be observed that, in general, there is a significantly different behavior between the two faces due to the microstructure dissimilarity. This can be caused by the manufacturing process, the hand arrangement of the mix in the mold, and the different shrinkage of the two faces during the drying process, all of which resulted in measurable differences in the final physical properties of the two sides of the final specimen. The need to use different-sized samples depending on the frequency range further increased the risk of observing a non-uniform behavior among selected specimens.
For the CG mix, a significant dissimilarity between the two faces appeared for frequency values over 1300 Hz (Figure 7), i.e., the smaller (high frequency) samples. Standard deviation areas frequently overlapped, suggesting that the variations are not only due to the different faces, but also to different sample composition. The FB mix shows variations from 500 Hz in Figure 8, but the average extent is smaller and the standard deviation areas are mostly overlapped, with larger differences appearing only above 2 kHz where the granular nature of fava bean residue is more likely to influence the surface properties. The SP mix exhibited significantly smaller differences (Figure 9) between the two faces, likely thanks to the presence of sawdust that allowed a reduced shrinkage of the specimens, with smaller variations between faces, although the standard deviation areas are quite significant suggesting some inter-sample differences.
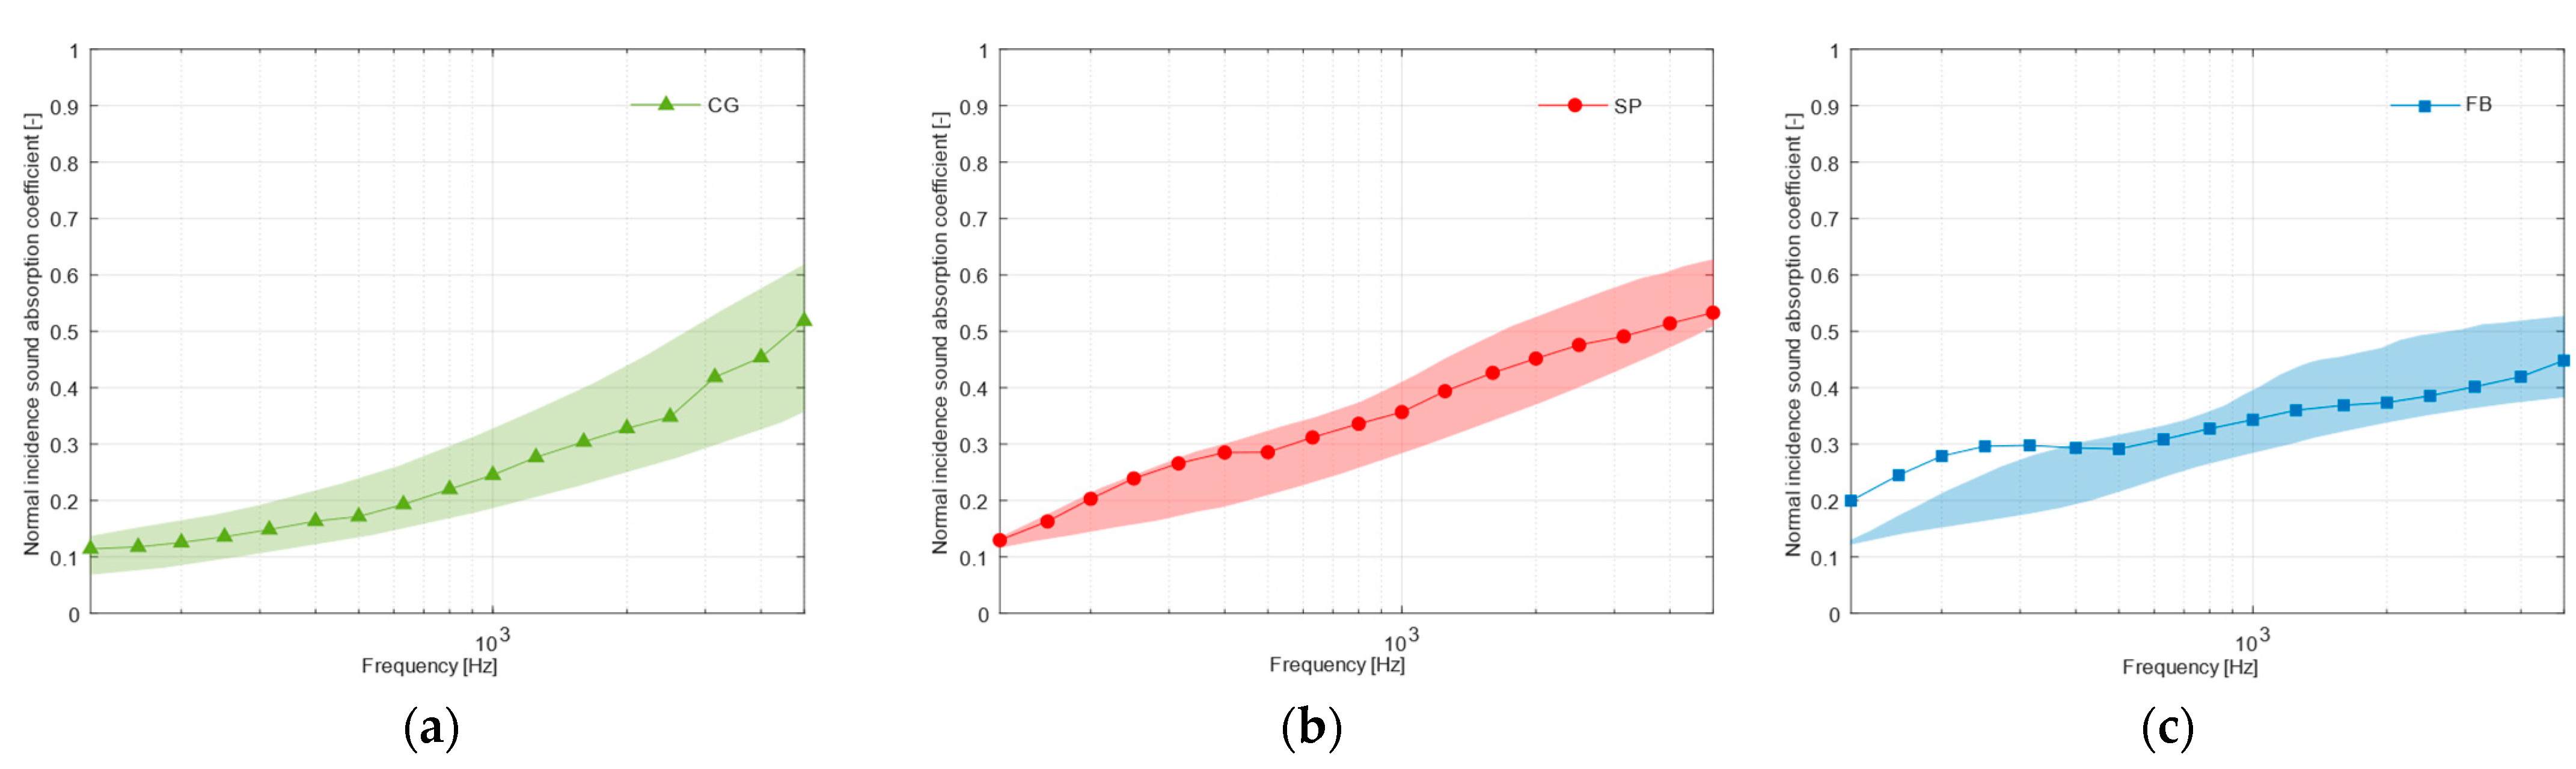
In order to better understand how the manufacturing process may have influenced the microstructural properties of the samples, the non-acoustic parameters described in Section 3.3 were determined using the inverse method and assuming the JCA model as a reference. Given the observed range of values, parameter estimation was carried out with reference to the overall average of the absorption coefficients and to the minimum and maximum “envelope” of the observed values, so that a possible range of values could be determined for each parameter in the model. In particular, the estimated parameters were air flow resistivity σ*, tortuosity τ*, shape factor s* and characteristic lengths Λ* and Λ’*.
Figure 10a–c shows the measured average sound absorption curves for each mix and the range (colored area) of variation of the predicted sound absorption coefficient obtained from the application of the inverse method to the envelope of minima and maxima for each sample. It can be observed for each mix that the medium and high frequency values lay inside the estimated area, while low frequencies tended to show more critical behavior. In particular, the FB mix shows measured values clearly outside the “predicted” range, at frequencies below 315 Hz. This can be due to either microstructural variations occurred during the manufacturing process caused by the non-homogeneous microstructure of the FB aggregates, or the presence of small cracks along the borders of the samples that might have induced some undesired border resonances.
The resulting parameters feeding the JCA model are given in Table 5.
As shown in Table 5, minima (usually associated with the bottom face) are due to increased flow resistivity values (with variations between 3.3 and 1.6 times the value on the upper face), realistically resulting from the compaction taking place during the manufacturing process (due to manual distribution of the mix in the mold), and during the drying process due to gravity. The most evident variations appear for the SP mix (with sawdust), while smaller changes take place in the FB mix (with fava beans) and particularly in the CG mix (with coffee grounds) which is better distributed in the mixture, also resulting in the highest resistivity values among the three samples. Fava beans showed a peculiar behavior with a flatter response resulting from an increased absorption in the low frequency range and reduced absorption in the high frequencies that resulted in lower flow resistivity and porosity and increased tortuosity values (up to 15) which may be associated with the more “granular” microstructure. In fact, it is known from the literature [76] that such very high tortuosity values are usually found in porous asphalts. Shape factor tends to confirm the lower values for coffee, which, due to its dimensions, results in smaller and more regular pores, while for sawdust and particularly fava beans, the value may become quite high, as typically observed in more granular media. More detailed investigations on the microstructure are underway to fully explain the observed results.
5. Conclusions
The present study has shown the results achieved by developing different mixes using pulp paper waste. The effect of the addition of three different aggregates (fava bean residue, sawdust powder, coffee grains) was investigated in a laboratory by performing physical, thermal and acoustic tests.
As shown by SEM analysis, the presence of a more porous and fibrous structure of the pure aggregate, as in sawdust, allows a more porous final matrix and a consequent higher porosity of the final specimens. Conversely, the presence of a more compacted fava bean residue, also in the form of grains, provokes a lower bulk porosity and a higher bulk density in the final specimens.
Overall, the thermal conductivity of the tested samples ranged from 0.071 to 0.093 W·m−1·K−1, allowing us to include the tested materials in the category of thermal insulators. As expected from the physical tests, the best insulator was the SP mix. Moreover, the CG and FB mix had a bulk density and thermal conductivity comparable to plywood.
In terms of acoustic behavior, generally, the measurement of the normal incidence sound absorption coefficient found that the upper and the lower faces of all the specimens were not uniform, due to the manufacturing process and to the different shrinkage provoked by the aggregates used. Additionally, the use of different sized samples based on the frequency range contributed to an increase in dissimilar acoustic behavior. The comparison between the measured average sound absorption curves for each mix and the variation range of the predicted normal sound absorption coefficient obtained from the inverse method allows us to observe that high frequency values range in the estimated area, except for the FB mix. Furthermore, for this latter mix, an increased absorption in the low frequency range and a reduced absorption in the high frequencies was observed.
Conclusively, the experimental results achieved and described in this paper demonstrate that the materials are suitable to be proposed as insulation panels due to the low thermal conductivity values. Moreover, taking into account the acoustic properties, it can be asserted that they might be used either for wall paneling or false ceilings.
Further detailed investigations are underway to evaluate the bond of the experimented materials with existing supports, mechanical performances and hygric properties. Moreover, an LCA (Life Cycle Analysis) will be carried out to support future potential commercial applications.
Author Contributions
Conceptualization, S.L.; Methodology, S.L., F.M., C.R. and P.S.; Investigation, S.L. and C.R.; Formal analysis, S.L., F.M., C.R. and P.S.; Data curation, S.L. and C.R.; Writing—original draft preparation, S.L. Writing—review and editing, S.L., F.M., C.R. and P.S.; Visualization, S.L. and C.R.; Software, F.M.; Supervision, P.S. and F.M.; Funding acquisition, S.L. All authors have read and agreed to the published version of the manuscript.
Funding
The research was carried out within the framework of the Italian REFIN (Research for Innovation) POR PUGLIA FESR-FSE 2014/2020 Asse X—Azione 10.4.
Institutional Review Board Statement
Not applicable.
Informed Consent Statement
Not applicable.
Data Availability Statement
The data presented in this study are available on request from the corresponding author.
Acknowledgments
The authors thank Andrea Petrella and Adriano Boghetich for their contribution during the SEM analysis.
Conflicts of Interest
The authors declare no conflict of interest.
References
- US Energy Information Administration, International Energy Outlook. 2021. Available online: https://www.eia.gov/outlooks/ieo/ppt/IEO2021_narrative_graphs_consumption.pptx (accessed on 27 December 2022).
- Cabernard, L.; Pfister, S.; Oberschelp, C.; Hellweg, S. Growing environmental footprint of plastics driven by coal combustion. Nat. Sustain. 2022, 5, 139–148. [Google Scholar] [CrossRef]
- Wilcox, C.; Van Sebille, E.; Hardesty, B.D. Threat of plastic pollution to seabirds is global, pervasive, and increasing. Proc. Natl. Acad. Sci. USA 2015, 112, 11899–11904. [Google Scholar] [CrossRef] [PubMed] [Green Version]
- Olivier, J.G.; Schure, K.; Peters, J. Trends in Global CO2 and Total Greenhouse Gas Emissions; 2021 Summary Report, PBL Netherlands Environmental Assessment Agency. 2021. Available online: https://www.pbl.nl/en/publications/trends-in-global-co2-and-total-greenhouse-gas-emissions-2021-summary-report (accessed on 27 December 2022).
- The Intergovernmental Panel on Climate Change (IPCC). Climate Change 2021: The Physical Science Basis. Available online: https://report.ipcc.ch/ar6/wg1/IPCC_AR6_WGI_FullReport.pdf (accessed on 27 December 2022).
- Siwal, S.S.; Zhang, Q.; Devi, N.; Saini, A.K.; Saini, V.; Pareek, B.; Gaidukovs, S.; Thakur, V.K. Recovery processes of sustainable energy using different biomass and wastes. Renew. Sustain. Energy Rev. 2021, 150, 111483. [Google Scholar] [CrossRef]
- Zaid, O.; Mukhtar, F.M.; M-García, R.; El Sherbiny, M.G.; Abdeliazim, M. Characteristics of high-performance steel fiber reinforced recycled aggregate concrete utilizing mineral filler. Case Stud. Constr. Mater. 2022, 16, e00939. [Google Scholar] [CrossRef]
- Maan Lardhi, M.; Mukhtar, F. Radiation shielding performance of seawater-mixed concrete incorporating recycled coarse aggregate and steel slag. J. Radiat. Res. Appl. Sci. 2023, 16, 100528. [Google Scholar]
- Nayak, A.; Bhushanb, B. An overview of the recent trends on the waste valorization techniques for food wastes. J. Environ. Manag. 2019, 233, 352–370. [Google Scholar] [CrossRef] [PubMed]
- Martellotta, F.; Cannavale, A.; De Matteis, V.; Ayr, U. Sustainable sound absorbers obtained from olive pruning wastes and chitosan binder. Appl. Acoust. 2018, 141, 71–78. [Google Scholar] [CrossRef]
- Liuzzi, S.; Rubino, C.; Stefanizzi, P.; Martellotta, F. Performance Characterization of Broad Band Sustainable Sound Absorbers Made of Almond Skins. Materials 2020, 13, 5474. [Google Scholar] [CrossRef]
- Ricciardi, P.; Belloni, E.; Merlo, F.; Buratti, C. Sustainable Panels Made with Industrial and Agricultural Waste: Thermal and Environmental Critical Analysis of the Experimental Results. Appl. Sci. 2021, 11, 494. [Google Scholar] [CrossRef]
- Schiavoni, S.; D’Alessandro, F.; Bianchi, F.; Asdrubali, F. Insulation materials for the building sector: A review and comparative analysis. Renew. Sustain. Energy Rev. 2016, 62, 988–1011. [Google Scholar] [CrossRef]
- Narita, K. A Life of Ts’ai Lung and Japanese Paper-Making; The Paper Museum: Tokyo, Japan, 1980. [Google Scholar]
- Goedvriend, G.J.M. Papermaking past and present. Endeavour 1988, 12, 38–43. [Google Scholar] [CrossRef]
- Latka, J.F. Paper in Architecture Research by Design, Engineering and Prototyping, A+BE|Architecture and the Built Environment. 2017. Available online: https://journals.open.tudelft.nl/abe/article/view/1875 (accessed on 27 December 2022).
- Mandili, B.; Taqi, M.; El Bouari, A.; Errouaiti, M. Experimental study of a new ecological building material for a thermal insulation based on waste paper and lime. Constr. Build. Mater. 2019, 228, 117097. [Google Scholar] [CrossRef]
- Raut, S.P.; Sedmake, R.; Dhunde, S.; Ralegaonkar, R.V.; Mandavgane, S.A. Reuse of recycle paper mill waste in energy absorbing light weight bricks. Constr. Build. Mater. 2012, 27, 247–251. [Google Scholar] [CrossRef]
- Rajput, D.; Bhagade, S.S.; Raut, S.P.; Ralegaonkar, R.V.; Mandavgane, S.A. Reuse of cotton and recycle paper mill waste as building material. Constr. Build. Mater. 2012, 34, 470–475. [Google Scholar] [CrossRef]
- Brzyski, P.; Kosinski, P.; Skoratko, A.; Motacki, W. Thermal properties of cellulose fiber as insulation material in a loose state. AIP Conf. Proc. 2019, 2133, 020006. [Google Scholar] [CrossRef]
- Shibib, S.K. Effects of waste paper usage on thermal and mechanical properties of fired brick. J. Heat Mass Trans. 2015, 51, 685–690. [Google Scholar] [CrossRef]
- Aksogan, O.; Resatoglu, R.; Binici, H. An environment friendly new insulation material involving waste newsprint papers reinforced by cane stalks. J. Build. Eng. 2018, 15, 33–40. [Google Scholar] [CrossRef]
- Aigbomian, E.P.; Fan, M. Development of wood-crete building materials from sawdust and waste paper. Constr. Build. Mater. 2013, 40, 361–366. [Google Scholar] [CrossRef]
- Echeverria, C.A.; Ozkan, J.; Pahlevani, F.; Willcox, M.; Sahajwalla, V. Effect of hydrothermal hot-compression method on the antimicrobial performance of green building materials from heterogeneous cellulose wastes. J. Clean. Prod. 2021, 280, 124377. [Google Scholar] [CrossRef]
- Hammond, G.; Jones, C. Inventory of Carbon & Energy (ICE Version 2.0); Department of Mechanical Engineering, University of Bath: Bath, UK, 2011; Available online: https://www.carbonsolutions.com/resources/ice%20v2.0%20-%20jan%202011.xls (accessed on 27 December 2022).
- Neri, M.; Levi, E.; Cuerva, E.; Pardo-Bosch, F.; Zabaleta, A.G.; Pujadas, P. Sound Absorbing and Insulating Low-Cost Panels from End-of-Life Household Materials for the Development of Vulnerable Contexts in Circular Economy Perspective. Appl. Sci. 2021, 11, 5372. [Google Scholar] [CrossRef]
- Asdrubali, F.; Pisello, A.L.; D’Alessandro, F.; Bianchi, F.; Cornicchia, M.; Fabiani, C. Innovative cardboard based panels with recycled materials from the packaging industry: Thermal and acoustic performance analysis. Energy Procedia 2015, 78, 321–326. [Google Scholar] [CrossRef]
- Jun-Oh, Y.; Kyoung-Woo, K.; Kwan-Seop, Y.; Jea-Min, K.; Myung-Jun, K. Physical properties of cellulose sound absorbers produced using recycled paper. Constr. Build. Mater. 2014, 70, 494–500. [Google Scholar]
- Lo Storto, C. Data on urban waste collection: The case of the Apulia region in Italy. Data Brief 2019, 25, 104380. [Google Scholar] [CrossRef] [PubMed]
- Istituto Superiore per la Protezione e la Ricerca Ambientale. Available online: https://www.isprambiente.gov.it/ (accessed on 27 December 2022).
- Fasano, F.; Addante, A.S.; Valenzano, B.; Scannicchio, G. Variables Influencing per Capita Production, Separate Collection, and Costs of Municipal Solid Waste in the Apulia Region (Italy): An Experience of Deep Learning. Int. J. Environ. Res. Public Health 2021, 18, 752. [Google Scholar] [CrossRef] [PubMed]
- Shang, D.; Diao, G.; Zhao, X. Have China’s regulations on imported waste paper improved its quality. For. Policy Econ. 2020, 119, 102287. [Google Scholar] [CrossRef]
- Comieco, Paper and Board Collection, Recycling, and Recovery in Italy in 2020. Available online: https://www.comieco.org/downloads/15345/8637/COMIECO_26Report-2021.pdf (accessed on 27 December 2022).
- International Coffee Organization (ICO). Available online: https://www.ico.org/ (accessed on 12 July 2022).
- Janissen, B.; Huynh, T. Chemical composition and value-adding applications of coffee industry byproducts: A review. Resour. Conserv. Recycl. 2018, 128, 110–117. [Google Scholar] [CrossRef]
- Woldesenbet, A.G.; Woldeyes, B.; Chandravanshi, B.S. Bio-ethanol production from wet coffee processing waste in Ethiopia. SpringerPlus 2016, 5, 1903. [Google Scholar] [CrossRef] [Green Version]
- Hachicha, R.; Rekik, O.; Hachicha, S.; Ferchichi, M.; Woodward, S.; Moncef, N.; Cegarra, J.; Mechichi, T. Co-composting of spent coffee ground with olive mill wastewater sludge and poultry manure and effect of Trametes versicolor inoculation on the compost maturity. Chemosphere 2012, 88, 677–682. [Google Scholar] [CrossRef]
- Thielke, C. Cultivation of edible fungi on coffee grounds. Mushroom Sci. 1989, 12, 337–343. [Google Scholar]
- Ballesteros, L.F.; Teixeira, J.A.; Mussatto, S.I. Chemical, functional, and structural properties of spent coffee grounds and coffee silverskin. Food Bioprocess Technol. 2014, 7, 3493–3503. [Google Scholar] [CrossRef] [Green Version]
- Tang, Z.; Li, W.; Tam, V.W.Y.; Xue, C. Advanced progress in recycling municipal and construction solid wastes for manufacturing sustainable construction materials. Resour. Conserv. Recycl. 2020, 6, 100036. [Google Scholar] [CrossRef]
- Arulrajah, A.; Maghoolpilehrood, F.; Disfani, M.M.; Horpibulsuk, S. Spent coffee grounds as a non-structural embankment fill material: Engineering and environmental considerations. J. Clean. Prod. 2014, 72, 181–186. [Google Scholar] [CrossRef]
- Lachheb, A.; Allouhi, A.; El Marhoune, M.; Saadani, R.; Kousksou, T.; Jamil, A.; Rahmoune, M.; Oussouaddi, O. Thermal insulation improvement in construction materials by adding spent coffee grounds: An experimental and simulation study. J. Clean. Prod. 2019, 209, 1411–1419. [Google Scholar] [CrossRef]
- Mwango, A.; Kambole, C. Engineering Characteristics and Potential Increased Utilisation of Sawdust Composites in Construction—A Review. J. Build. Constr. Plan. Res. 2019, 7, 59–88. [Google Scholar] [CrossRef] [Green Version]
- Rominiyi, O.; Adaramola, B.; Ikumapayi, O.; Oginni, O.; Akinola, S. Potential Utilization of Sawdust in Energy, Manufacturing and Agricultural Industry; Waste to Wealth. World J. Eng. Technol. 2017, 5, 526–539. [Google Scholar] [CrossRef] [Green Version]
- European Organisation of the Sawmill Industry (EOS). Annual Report of the European Sawmill Industry 2021–2022. EOS, Brussels. 2018. Available online: https://www.eos-oes.eu/downloads/eos-annual-report-2021-2022_web.pdf (accessed on 27 December 2022).
- Petrie, B. South Africa: A Case for Biomass? International Institute for Environment and Development, London. 2014. Available online: https://www.iied.org/sites/default/files/pdfs/migrate/16045IIED.pdf (accessed on 27 December 2022).
- Deac, T.; Fechete-Tutunaru, L.; Gaspar, F. Environmental Impact of Sawdust Briquettes Use-Experimental Approach. Energy Procedia 2016, 85, 178–183. [Google Scholar] [CrossRef] [Green Version]
- Aigbomian, E.O.; Fan, M. Development of wood-crete from hardwood and softwood sawdust. Open Constr. Build. Technol. J. 2013, 7, 108–117. [Google Scholar] [CrossRef] [Green Version]
- Charai, M.; Sghiouri, H.; Mezrhab, A.; Karkri, M.; Elhammouti, K.; Nasri, H. Thermal Performance and Characterization of a Sawdust-Clay Composite Material. Procedia Manuf. 2020, 46, 690–697. [Google Scholar] [CrossRef]
- Andrade, M.C.; Gorghulo Silva, C.O.; De Souza Moreira, L.R.; Ferreira Filho, E.F. Crop residues: Applications of lignocellulosic biomass in the context of a biorefinery. Front. Energy 2022, 16, 224–245. [Google Scholar] [CrossRef]
- Annicchiarico, P. Feed legumes for truly sustainable crop-animal systems. Ital. J. Agron. 2017, 12, 151–160. [Google Scholar] [CrossRef] [Green Version]
- Gómez, L.D.; Amalfitano, C.; Andolfi, A.; Simister, R.; Somma, S.; Ercolano, M.R.; Borrelli, C.; McQueen-Mason, S.J.; Frusciante, L.; Cuciniello, A.; et al. Valorising faba bean residual biomass: Effect of farming system and planting time on the potential for biofuel production. Biomass Bioenergy 2017, 107, 227–232. [Google Scholar] [CrossRef] [Green Version]
- Pakarinen, A.; Maijala, P.; Jaakkola, S.; Stoddard, F.L.; Kymäläinen, M.; Viikari, L. Evaluation of preservation methods for improving biogas production and enzymatic conversion yields of annual crops. Biotechnol. Biofuels 2011, 4, 20. [Google Scholar] [CrossRef] [Green Version]
- Italian Statistical Database. Available online: http://dati.istat.it/ (accessed on 5 December 2022).
- Gonçalves, D.; Bordado, J.M.; Marques, A.C.; Galhano dos Santos, R. Non-Formaldehyde, Bio-Based Adhesives for Use in Wood-Based Panel Manufacturing Industry—A Review. Polymers 2021, 13, 4086. [Google Scholar] [CrossRef]
- American Cancer Society. Formaldehyde and Cancer Risk. Available online: https://www.cancer.org/content/dam/CRC/PDF/Public/7671.pdf (accessed on 13 July 2022).
- Rubino, C.; Bonet Aracil, M.; Liuzzi, S.; Stefanizzi, P.; Martellotta, F. Wool waste used as sustainable nonwoven for building applications. J. Clean. Prod. 2021, 278, 123905. [Google Scholar] [CrossRef]
- Gadhave, R.; Dhawale, P. State of Research and Trends in the Development of Polyvinyl Acetate-Based Wood Adhesive. Open J. Polym. Chem. 2022, 12, 13–42. [Google Scholar] [CrossRef]
- ISO 12570:2000; Hygrothermal Performance of Building Materials and Products—Determination of Moisture Content by Drying at Elevated Temperature. International Organization for Standards: Geneva, Switzerland, 2000.
- ASTM D4892-14(2019)e1; Standard Test Method for Density of Solid Pitch (Helium Pycnometer Method). ASTM International: West Conshohocken, PA, USA, 2019.
- Chang, C.S. Measuring Density and Porosity of Grain Kernels Using a Gas Pycnometer. Cereal Chem. 1988, 65, 13–15. [Google Scholar]
- ISO 10534-2:1998; Determination of Sound Absorption Coefficient and Impedance in Impedance Tubes—Part 2: Transfer-Function Method. International Organization for Standards: Geneva, Switzerland, 1998.
- Johnson, D.L.; Koplik, J.; Dashen, R. Theory of dynamic permeability and tortuosity in fluid-saturated porous media. J. Fluid Mech. 1987, 176, 379–402. [Google Scholar] [CrossRef]
- Allard, J.F.; Champoux, Y. New empirical equation for sound propagation in rigid frame fibrous material. J. Acoust. Soc. Am. 1992, 91, 3346–3353. [Google Scholar] [CrossRef]
- Atalla, Y.; Panneton, R. Inverse acoustical characterization of open cell porous media using impedance tube measurements. Can. Acoust. 2005, 33, 11–24. [Google Scholar]
- Yun, B.Y.; Cho, H.M.; Kim, Y.U.; Lee, S.C.; Berardi, U.; Kim, S. Circular reutilization of coffee waste for sound absorbing panels: A perspective on material recycling. Environ. Res. 2020, 184, 109281. [Google Scholar] [CrossRef]
- Singh, J.; Mishra, N.S.; Sharma, U.; Banerjee, S.; Sharma, Y.C. Comparative studies of physical characteristics of raw and modified sawdust for their use as adsorbents for removal of acid dye. Bioresources 2011, 6, 2732–2743. Available online: https://bioresources.cnr.ncsu.edu/wp-content/uploads/2016/06/BioRes_06_3_2732_Singh_MUS_Compar_Char_Mod_Sawdust_Absorb_Dye_1403.pdf (accessed on 27 December 2022).
- Clarke, D.R. Materials selection guidelines for low thermal conductivity thermal barrier coatings. Surf. Coat. Technol. 2003, 163–164, 67–74. [Google Scholar] [CrossRef]
- Al-Homoud, M.S. Performance characteristics and practical applications of common building thermal insulation materials. Build. Environ. 2005, 40, 353–366. [Google Scholar] [CrossRef]
- UNI EN ISO 10456:2008; Materiali e prodotti per edilizia-Proprietà igrometriche-Valori tabulati di progetto e procedimenti per la determinazione dei valori termici dichiarati e di progetto. ISA: Milan, Italy, 2008.
- Buratti, C.; Belloni, E.; Merli, F.; Zanella, V.; Robazza, P.; Cornaro, C. An innovative multilayer wall composed of natural materials: Experimental characterization of the thermal properties and comparison with other solutions. Energy Procedia 2018, 148, 892–899. [Google Scholar] [CrossRef]
- Gaujena, B.; Agapovs, V.; Borodinecs, A.; Strelets, K. Analysis of Thermal Parameters of Hemp Fiber Insulation. Energies 2020, 13, 6385. [Google Scholar] [CrossRef]
- Pfundstein, M.; Gellert, R.; Spitzner, M.; Rudolphi, A. Insulating Materials: Principles, Materials, Applications; Birkhäuser Architecture: Basel, Switzerland, 2013. [Google Scholar]
- Jasiolek, A.; Latka, J.; Brzezicki, M. Comparative analysis of paper-based building envelopes for semi-permanent architecture: Original proposals and suggestions for designers. J. Facade Des. Eng. 2021, 9, 47–72. [Google Scholar] [CrossRef]
- Lavrykov, S.A.; Ramarao, B.V. Thermal Properties of Copy Paper Sheets. Dry. Technol. Int. J. 2012, 30, 297–311. [Google Scholar] [CrossRef]
- Sarradj, E.; Lerch, T.; Hubelt, J. Input parameters for the prediction of acoustical properties of open porous asphalt. Acta Acust. United Acust. 2006, 92, 86–96. [Google Scholar]
Figure 1.
Production process.

Figure 2.
The normal incidence sound absorption coefficient measurement set-up and specimen sizes.

Figure 3.
Morphology of the aggregates before mixing: (a) coffee grounds, (b) fava bean residues, (c) sawdust powder. Mean magnification level 1000 kx.
Figure 3.
Morphology of the aggregates before mixing: (a) coffee grounds, (b) fava bean residues, (c) sawdust powder. Mean magnification level 1000 kx.

Figure 4.
Morphology of the final specimens after mixing the pulp paper with aggregates: (a) coffee ground (CG), (b) fava bean residues (FB), (c) sawdust powder (SP). Mean magnification level 150 kx.
Figure 4.
Morphology of the final specimens after mixing the pulp paper with aggregates: (a) coffee ground (CG), (b) fava bean residues (FB), (c) sawdust powder (SP). Mean magnification level 150 kx.

Figure 5.
Comparison of thermal conductivity between tested samples and other traditional insulating materials, taken from the literature (Table 4).
Figure 5.
Comparison of thermal conductivity between tested samples and other traditional insulating materials, taken from the literature (Table 4).

Figure 6.
Comparison of thermal conductivity between tested samples and paper-based components, taken from the literature (Hammond et al. [25], Jasoliek et al. [74], Lavrykov et al. [75]).

Figure 7.
Normal incidence sound absorption coefficients experimentally measured (CG mix).

Figure 8.
Normal incidence sound absorption coefficients experimentally measured (FB mix).

Figure 9.
Normal incidence sound absorption coefficients experimentally measured (SP mix).

Figure 10.
Measured average sound absorption curves for each mix and range (colored area) of the variation of the predicted normal sound absorption coefficient: (a) CG mix, (b) SP mix, (c) FB mix.
Figure 10.
Measured average sound absorption curves for each mix and range (colored area) of the variation of the predicted normal sound absorption coefficient: (a) CG mix, (b) SP mix, (c) FB mix.


Table 1.
European recycling objectives achieved and to be reached (Adapted from COMIECO, [33]).
Table 1.
European recycling objectives achieved and to be reached (Adapted from COMIECO, [33]).
| European Directive | Directive 94/62/CE | Directive 2004/12/CE | Directive 2018/852/CE | Directive 2018/852/CE |
|---|---|---|---|---|
| Deadline to reach objective | 30 June 2001 | 31 December 2008 | 31 December 2025 | 31 December 2030 |
| Community recycling objectives for paper and cardboard packaging | General (all materials) between 25% and 45%, with a minimum threshold of 15% for each material | 60% | 75% | 85% |
| Paper and cardboard packaging recycling results in Italy | 50.7% | 62.4% | 80.4% | 87.4% |
Table 2.
Mix design.
| Mix Code | Sawdust Powder (SP) | Coffee Grains (CG) | Fava Bean (FB) |
|---|---|---|---|
| Pulp waste paper (wt%) | 80 | 75 | 75 |
| Sawdust (wt%) | 10 | - | - |
| Coffee ground (wt%) | - | 10 | - |
| Fava bean residues (wt%) | - | - | 10 |
| Glue (wt%) | 10 | 15 | 15 |
| Curing temperature (°C) | 70 | 70 | 70 |
| Oven drying time (days) | 7 | 7 | 7 |
| Dry bulk density (kg m−3) | 200 | 318 | 348 |
Table 3.
Physical and thermal properties (The values in the brackets are the standard deviation).
| Mix Type | Bulk Density ρbulk (kg·m−3) | Bulk Porosity ε (-) | Thermal Conductivity λ (W·m−1·K−1) | Thermal Diffusivity α (10−7·m2·s−1) | Volumetric Heat Capacity ρc (105 J·m−3·K−1) | Specific Heat Capacity c (J·K−1·Kg−1) |
|---|---|---|---|---|---|---|
| SP | 200 (7.1) | 0.868 (0.003) | 0.071 (0.0038) | 3.62 (0.0179) | 1.96 (0.0433) | 980 (37.7) |
| CG | 318 (5.4) | 0.784 (0.002) | 0.085 (0.0045) | 1.45 (0.0242) | 5.85 (0.5677) | 1839 (139.9) |
| FB | 348 (12.9) | 0.680 (0.002) | 0.093 (0.0065) | 2.89 (0.0278) | 3.20 (0.0678) | 919 (35.8) |
Table 4.
Comparison between traditional components and experimental materials.
| Insulating Material | Bulk Density ρbulk (kg·m−3) | Thermal Conductivity λ (W·m−1·K−1) | Specific Heat Capacity c (J·K−1·kg−1) | References |
|---|---|---|---|---|
| Felt | 120 | 0.050 | 1300 | [70] |
| Wool | 200 | 0.060 | 1300 | [70] |
| Cork | <200 | 0.050 | 1500 | [70] |
| Air | 1.23 | 0.0250 | 1008 | [70] |
| Polyethylene foam | 70 | 0.050 | 2300 | [70] |
| Plywood | 300 | 0.090 | 1600 | [70] |
| Fiberboard | 250 | 0.070 | 1700 | [70] |
| Straw Bale | 176 | 0.065 | - | [71] |
| Hemp fibers | 200 | 0.0568 | - | [72] |
| Cotton | 25–45 | 0.039–0.044 | - | [13] |
| Cellulose | 30–80 | 0.037–0.042 | 1300–1600 | [13] |
| Calcium silicate | 115–300 | 0.045–0.065 | - | [73] |
| Cellular glass | 115–220 | 0.040–0.060 | - | [73] |
| SP | 318 | 0.085 | 1839 | Experimental material |
| CG | 200 | 0.071 | 980 | Experimental material |
| FB | 348 | 0.093 | 919 | Experimental material |
Table 5.
Non-acoustic properties of experimental samples resulting from numerical estimation.
| FB | CG | SP | ||||
|---|---|---|---|---|---|---|
| Non-Acoustic Properties | Min abs | Max abs | Min abs | Max abs | Min abs | Max abs |
| σ* (kN·s/m4) | 37 × 104 | 22 × 104 | 160 × 104 | 48 × 104 | 68 × 104 | 32 × 104 |
| ε* (-) | 0.6664 | 0.6864 | 0.7683 | 0.7983 | 0.8506 | 0.8806 |
| τ* (-) | 14.8 | 6.6 | 4.9 | 4.3 | 2.2 | 4.9 |
| s* | 2.9 | 1.85 | 0.5 | 0.95 | 0.5 | 2.9 |
| Λ* | 5.1433 × 10⁻⁵ | 2.5901 × 10⁻⁵ | 4.80 × 10⁻⁵ | 4.24 × 10⁻⁵ | 4.61 × 10⁻⁵ | 1.73 × 10⁻⁵ |
| Λ′* | 5.1433 × 10⁻⁵ | 6.475 × 10⁻⁵ | 1.20 × 10⁻⁴ | 4.24 × 10⁻⁴ | 1.153 × 10⁻⁴ | 4.325 × 10⁻⁵ |
Note: σ*, ε*, τ*, s*, Λ*, Λ′* are air flow resistivity, porosity, tortuosity, shape factor, viscous and thermal characteristic lengths determined with the inverse method.
Disclaimer/Publisher’s Note: The statements, opinions and data contained in all publications are solely those of the individual author(s) and contributor(s) and not of MDPI and/or the editor(s). MDPI and/or the editor(s) disclaim responsibility for any injury to people or property resulting from any ideas, methods, instructions or products referred to in the content. |
© 2023 by the authors. Licensee MDPI, Basel, Switzerland. This article is an open access article distributed under the terms and conditions of the Creative Commons Attribution (CC BY) license (https://creativecommons.org/licenses/by/4.0/).
Share and Cite
MDPI and ACS Style
Liuzzi, S.; Rubino, C.; Martellotta, F.; Stefanizzi, P. Sustainable Materials from Waste Paper: Thermal and Acoustical Characterization. Appl. Sci. 2023, 13, 4710. https://0-doi-org.brum.beds.ac.uk/10.3390/app13084710
AMA Style
Liuzzi S, Rubino C, Martellotta F, Stefanizzi P. Sustainable Materials from Waste Paper: Thermal and Acoustical Characterization. Applied Sciences. 2023; 13(8):4710. https://0-doi-org.brum.beds.ac.uk/10.3390/app13084710
Chicago/Turabian StyleLiuzzi, Stefania, Chiara Rubino, Francesco Martellotta, and Pietro Stefanizzi. 2023. "Sustainable Materials from Waste Paper: Thermal and Acoustical Characterization" Applied Sciences 13, no. 8: 4710. https://0-doi-org.brum.beds.ac.uk/10.3390/app13084710
Note that from the first issue of 2016, this journal uses article numbers instead of page numbers. See further details here.