
A Small-Sample Text Classification Model Based on Pseudo-Label Fusion Clustering Algorithm

School of Computer, Electronic and Information, Guangxi University, Nanning 530004, China
*
Author to whom correspondence should be addressed.
Appl. Sci. 2023, 13(8), 4716; https://0-doi-org.brum.beds.ac.uk/10.3390/app13084716
Submission received: 12 March 2023
/
Revised: 4 April 2023
/
Accepted: 6 April 2023
/
Published: 8 April 2023
(This article belongs to the Special Issue Natural Language Processing (NLP) and Applications)
Abstract
:The problem of text classification has been a mainstream research branch in natural language processing, and how to improve the effect of classification under the scarcity of labeled samples is one of the hot issues in this direction. The current models supporting small-sample classification can learn knowledge and train models with a small number of labels, but the classification results are not satisfactory enough. In order to improve the classification accuracy, we propose a Small-sample Text Classification model based on the Pseudo-label fusion Clustering algorithm (STCPC). The algorithm includes two cores: (1) Mining the potential features of unlabeled data by using the training strategy of clustering assuming pseudo-labeling and then reducing the noise of the pseudo-labeled dataset by consistent training with its enhanced samples to improve the quality of the pseudo-labeled dataset. (2) The labeled data is augmented, and then the Easy Plug-in Data Augmentation (EPiDA) framework is used to balance the diversity and quality of the augmented samples to improve the richness of the labeled data reasonably. The results of comparison tests with other classical algorithms show that the STCPC model can effectively improve classification accuracy.
1. Introduction
Text classification is the process by which natural language processing techniques accurately and rationally correspond texts to corresponding categories based on the classification system or criteria developed by users’ needs and is widely used to analyze people’s emotions and attitudes toward products and services [1]. In recent years, deep learning-based training models have dominated the research on text classification methods. These models, such as Word2Vec [2], BERT [3], and ELECTRA [4], are first pre-trained on a large scale and then fine-tuned to transfer generic knowledge to specialized sentiment tasks. Such training methods can effectively meet the needs of sentiment classification tasks. However, the accuracy of the sentiment classification results produced by these models is limited when there is not enough labeled training data for practical production. Although a large amount of unlabeled text data can be easily collected in living scenarios, the labeling itself still requires quite a lot of cost, and there are problems such as uncontrollable labeling time, high cost of manual labeling, and uneven quality of labeling [5]. Such problems are more obvious in some niche and specialized fields, including but not limited to the legal field, medical field, and financial audit field. Therefore, those classification methods that require only a limited number of labeled data are receiving more and more attention.
Researchers begin by looking at the model and the data itself. Howard et al. [6] proposed universal language model fine-tuning (ULMFit) to fine-tune the language model by varying the learning rate in both longitudinal and cross-sectional dimensions, allowing the model to converge faster on small-sample datasets. However, limited by the differences between the source and target datasets, there are problems that can easily lead to overfitting of the prediction results. Nguyen-Nhat et al. [7] experimented with various pre-processing techniques, including semantic lexical complementation, synonym replacement, and random exchange, from the perspective of improving the diversity of labeled data, all of which effectively improved the accuracy of the classifier. Duong et al. [8], on the other hand, used various data augmentation means such as grammar tree transformation, back translation, random insertion, and random deletion to perform sentiment analysis on text. Some researchers use language models or agent networks for data augmentation. For example, the LAMBDA (language-model-based data augmentation) [9] technology proposed by the IBM team uses GPT-2, which has been pre-tuned on the training set, to generate labeled augmented sentences, and then filters the augmented sentences through the classifier to ensure data quality. Due to the confidence checking of the classifier, the sample data obtained by this method are better than other data enhancement methods, but the cost of over-emphasizing data confidence is at the expense of efficiency and data diversity. The data augmentation framework EPiDA (Easy Plug-in Data Augmentation) proposed by Zhao et al. [10] improves this point. Based on commonly used data augmentation methods, EPiDA uses classifier feedback to achieve relative entropy maximization (REM) and conditional entropy minimization (CEM). The diversity and quality of the enhanced samples are balanced by the sum of REM and CEM, and better-enhanced samples are selected. Compared with the LAMBADA method, the basis of EPiDA is the commonly used data enhancement method, which has high enhancement efficiency, strong applicability, and a more reasonable method for screening enhanced samples. This approach is easy to understand, effective, and has inspired us a lot. However, the data augmentation methods are mostly oriented to labeled data, which neither utilize the much larger amount of unlabeled data, which is prone to information loss nor substantially increase the feature information of the text, which is vulnerable to the small sample size. Therefore, to solve the training dilemma of little labeled data, a holistic perspective is needed.
The introduction of new feature information has become a new research direction for this problem. Hidetaka et al. [11] introduced new features from unlabeled data, such as lexical features, word clustering features of Word2Vec, and clustering features with constraints. Jedrzejowicz et al. [12] proposed a hybrid approach of the LDA algorithm and Word2Vec. This method classifies documents in an unsupervised way, obtains the Gibbs sampling results of LDA, and assigns the results to documents as the most representative words in the topic by means of a cosine distance metric, which results in new features. Self-training is likewise a good solution [13]. Self-training uses unlabeled data to generate pseudo-results that serve as new labels for the data and are used for further training. However, traditional self-training does not perform sample selection and does not consider the noise in the pseudo-labels generated during the training process. Noisy data were masking the true relationship between unlabeled data and their categories. This may lead to error accumulation. To address this problem, Villatoro-Tello et al. [14] reduced the sensitivity of the learning algorithm to noise in the labeled data by automatically generating a summary, effectively improving the accuracy of model training. However, noise is difficult to avoid, some processes, such as data augmentation, can generate noise at any time, and noise can diversify the data to improve model learning, and blanket rejection of noise is not always beneficial for model training. Therefore, we propose consistent training for pseudo-labeling, making full use of unlabelled data to introduce new feature information while using noise to improve model robustness and avoid model overfitting.
Besides, Zhang et al. [15] proposed a short text classification method based on weighted word vector representation. This method uses the expected cross-entropy to extract the strong category feature set from the labeled data and then generates word vectors as feature vectors to increase the semantic information of short texts and reduce their high-dimensional sparsity. Following these ideas, after being inspired by the use of clustering algorithms to obtain labels in image classification [16], we improve the data pre-processing process and design the implementation of a method to obtain pseudo-labels based on text clustering.
After combining the advantages and disadvantages of various algorithms in current semi-supervised learning, we propose a small-sample text classification model based on a pseudo-label fusion clustering algorithm (STCPC) by combining the advantages and disadvantages of various algorithms in current semi-supervised learning. The STCPC algorithm combines the advantages of the above methods, fully exploits the effective information of a large amount of unlabeled data, and uses a small amount of labeled data to achieve efficient semi-supervised text classification. The main contributions of our paper are summarized as follows:
- (1)
- Combining the similarity information between labeled and unlabeled data, we propose a pseudo-labeling algorithm based on text clustering, where the pseudo-labels are formed by mining the latent features of the unlabeled data. It is also proposed to use consistent training for the pseudo-labels to improve the robustness of the model.
- (2)
- Combining common data enhancement methods with EPiDA framework and made compatible with our enhanced methodology to filter out tagged enhanced data with high overall diversity and quality scores.
- (3)
- Using the BERT model as the basis for implementing our enhanced approach, the improvement effect is demonstrated in the experiments of four datasets, and it is also improved in comparison with other algorithms.
2. Related Work
Over the past few decades, there has been a great deal of interest and research in small sample methods, and the results have played a crucial role in many realistic scenario applications. In recent years, significant results have been achieved in a range of downstream natural language processing (NLP) tasks through pseudo-label and data augmentation. In this section, we review the theory and literature related to few-shot learning, pseudo-label method, and BERT models, respectively.
2.1. Few-Shot Learning
Our research focuses on scenarios with limited annotated data, also known as small-sample learning. Researchers have turned the method of solving small sample problems into few-shot learning, which aims to learn from a small number of samples to solve problems [17]. In earlier research results, ew-shot learning [18,19] was mostly applied in computer vision and based on statistical learning methods [20]. For example, Maas et al. [21] proposed a Bayesian network with an approach that captures the relationships between attributes using probability distributions, thus allowing a small number of labeled image samples to yield more information. With the development of deep neural networks, Few-shot learning has also seen some research and development in the field of natural language processing (NLP) [22]. According to the different approaches and goals taken, the most common small sample learning methods can be classified into three types: fine-tuning, data augmentation, and transfer learning.
Fine-tuning-based approach. The process is to learn from a large general corpus, train a classification model, and then fine-tune the parameters. For example, Nakamura et al. [23] proposed a fine-tuning approach for the small-sample problem to enhance the model capability by using a lower learning rate during training and an adaptive gradient optimizer during the fine-tuning phase. Such approaches often suffer from overfitting problems because the target data are too different from the pre-trained data, and a small amount of data does not reflect the true distribution of a large amount of data well.
Data-augmentation-based approach. The process is to enhance the classification features in the target dataset or expand the target dataset annotation information using auxiliary information or aids for the model to extract the dataset features. For example, Wei et al. [24] proposed the easy data augmentation method EDA (easy data augmentation), which uses four methods: synonym replacement, random insertion, random exchange, and random deletion to expand the text. Because of its rapidity and effectiveness, EDA is widely used. However, this type of approach causes a loss of information because it does not utilize the much larger amount of unlabeled data.
Transfer-learning-based approach. The process is to transfer the information learned by the model in advance to a new knowledge domain. In transfer learning, the existing knowledge is called the source domain, and the new knowledge to be learned is called the target domain, and as long as the source and target domains are related, the knowledge and features learned in the source domain can help train the classification model in the target domain and realize the transfer of knowledge between different domains [25]. Snell et al. [26] proposed a prototypical network that maps images into vectors and uses the average of sample vectors belonging to the same category as the prototype of that category. The correlation between the training data and the test samples is used to continuously train the model to make the samples of the same category closer to each other, thus achieving a better prediction effect. However, in many cases, the importance of the samples used to calculate the prototype is different, especially when the samples are noisy data. For this reason, Li et al. [27] proposed that the model can be used to integrate the information of all images in the support set so as to find the most discriminative features and enrich the extracted feature information. In addition, transfer learning-based methods such as meta-learning and graphical neural network methods are available, which fully exploit and match the correlation between source and target domains to improve the classification effect to different degrees, but because of this, they are inevitably affected by the differences between source and target domains.
2.2. Pseudo-Label Method
The pseudo-labeling approach [28] can increase the size of the training dataset and improve the model performance by labeling unlabeled data as labeled data. t-sne visualization of embedding in the paper of Lee et al. [29] clearly demonstrates the effect of the pseudo-label method. It is mentioned in that paper that using only pseudo-label methods may be more efficient compared to the semantic drift that most data augmentation methods introduce. Rizve et al. [30] used uncertainty–aware pseudo-label selection (UPS) combined with uncertainty estimation and negative learning to reduce the model’s noise effectively, but this method relies heavily on the predictive power of the original model and does not utilize a large amount of unlabeled data, and there is an upper limit to the prediction accuracy. When using pseudo-labeling for training, some noisy data may be misclassified, leading to a degradation of model performance, and pseudo-labeling is an unsupervised method that cannot solve the problem of label noise.
In conclusion, pseudo-labeling is an effective method to improve model performance when the dataset size is small, and there is insufficient labeled data. However, it is necessary to choose the appropriate model and parameters according to the actual situation to avoid introducing noisy data and to note the possible errors caused by pseudo-labeling.
2.3. BERT
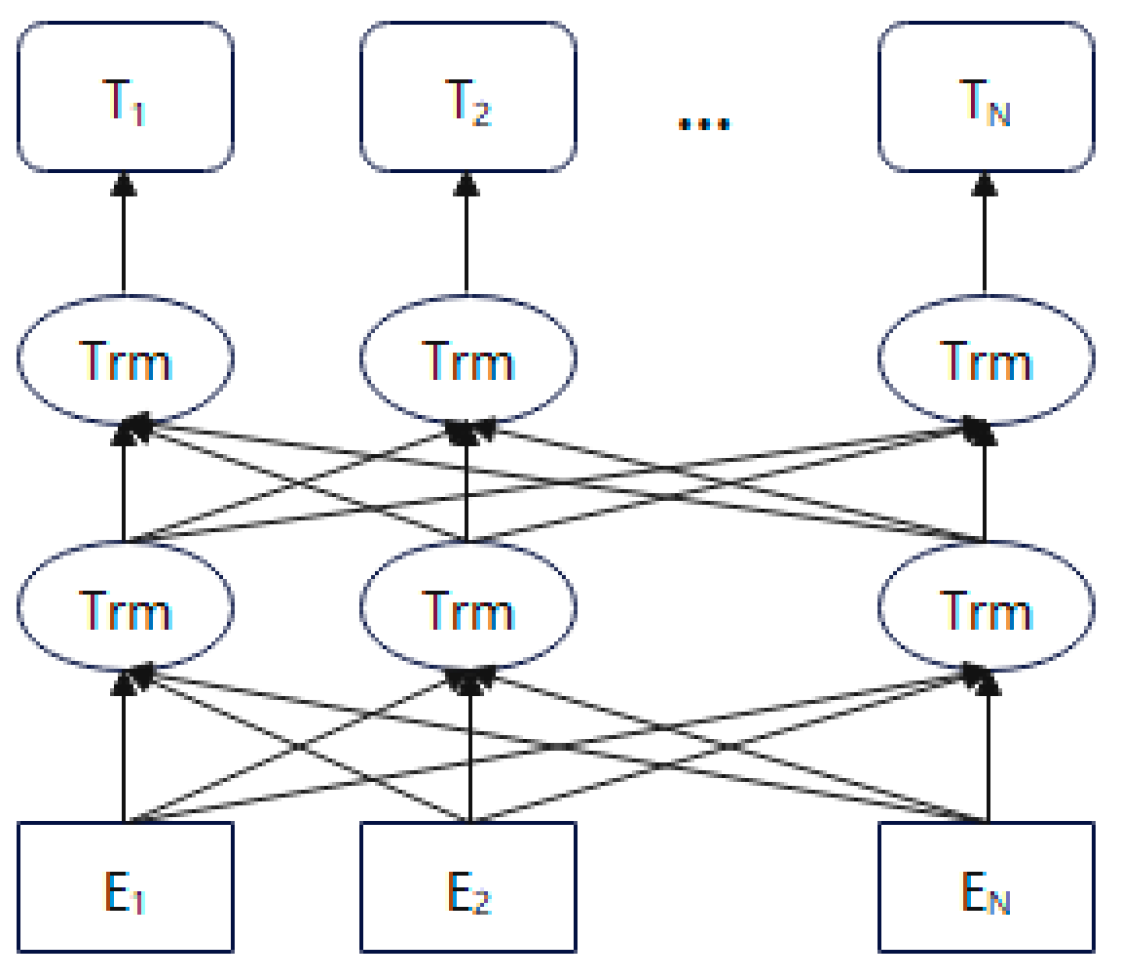
The BERT training model is based on the bi-directional Transformer [31] structure and uses a pre-training process based on two tasks, masked language model (MLM) and next sentence prediction (NSP) [32], which can output linguistic features that take into account contextual information, compared with the structure of BERT model shown in Figure 1.
The Trm module takes the core idea of the Self-attention technique as follows: the positional relationship of each word in a sentence text to all other words in that sentence text is calculated. The weight of each word is then derived from this relationship to construct a new expression for that word. The expression contains the semantics of the word itself while also characterizing the relationships with other words. Compared with the traditional single-word vector, the word vector obtained by Self-attention has a more comprehensive expressive power.
Thanks to the powerful pre-training process, the target domain of the BERT model in the fine-tuning phase can migrate a large amount of knowledge from the source domain to perform classification tasks with very high accuracy. However, unlike the unsupervised learning of the pre-training process, the fine-tuning phase of the BERT model is supervised learning and relies on a large amount of annotated data, which are limited in the scenario with the limited labeled data that we studied. Since the BERT model is an excellent and classic text classification model with proven results by researchers, we will use it as a base model and apply our improved methods to it.
3. Methodology
This section describes how to implement the text classification task with small samples using the STCPC algorithm, which on the one hand, makes full use of the information contained in the unlabeled data and uses the clustering algorithm to mine its potential features to make pseudo-labels, and at the same time enhances the accuracy of pseudo-labels through its enhanced samples to take consistent training to reduce noise. On the other hand, we improve the utilization efficiency of labeled data and use the EPiDA framework to expand the small amount of labeled data more reasonably. The two tasks are performed sequentially, feeding the classification model in turn, and the parameters of the model after the classification of the pseudo-labeled dataset are used as the input of the labeled data in the process. The overall framework diagram is shown in Figure 2.
We use to denote a large number of unlabeled datasets, which contain a large number of unlabeled texts, is the dataset generated by using back translation method data augmentation; is the generated pseudo-labeled dataset; we use to denote a small number of labeled datasets, which contain pairs of real labels and texts, is the data-augmented sample of . The details of and are specified in Equations (1) and (2):
where is the number of unlabeled data, is the unlabeled text; is the number of tagged data, is the tagged text, is the true label, is the one-hot vector and is the number of categories.
3.1. Clustering-Based Pseudo-Labeling
This section focuses on generating pseudo-labels by making full use of a large amount of unlabeled data. Firstly, the unlabeled data are pre-processed to reduce the dimensionality of the unlabeled data, and then the processed unlabeled data are subjected to an unsupervised k-means clustering task to obtain pseudo-labels. After the clustering is completed, each unlabeled data point is assigned to the center of the nearest class cluster to form the pseudo-labeled dataset. Finally, the noise of the pseudo-labeled dataset is reduced by a consistent training method, thus improving the pseudo-labeling accuracy.
3.1.1. Data Pre-Processing
Text data have high feature dimensionality, large data volume, and redundant data, showing the characteristics of high-dimensional sparsity. Therefore, pre-processing such as word separation, deactivation word filtering, and extracting features to construct virtual switch matrix (VSM), is needed for text information data. TextRank algorithm [33] can be used for keyword extraction, summary generation, and text similarity calculation. However, the TextRank algorithm involves the construction of word graphs and iterative calculations, which can be computationally complex for large volumes of untagged data, so the extraction speed is slow. The LDA algorithm [34] is used to extract topics from text and can identify and deal with noise and meaningless words. However, LDA also has the problem of high computational complexity and requires training in advance, which may encounter bottlenecks when dealing with large corpora. TD-IDF algorithm [35], as a commonly used text feature extraction method, is ideal for extracting information, easy to implement, and highly efficient. Therefore, it was finally decided to use the TF-IDF algorithm for text data processing.
The full name of TF-IDF algorithm is term frequency-inverse document frequency, which is mainly used to obtain features of high importance in text. The principle is that the importance of a word is proportional to its frequency of occurrence in a single text and inversely proportional to its number of occurrences in all texts. The TF-IDF value is calculated separately for each unlabeled data and is denoted as follows:
where Mw is the number of sentences containing the word w in a single data, and M is the total number of sentences in the data; indicates the number of times the word w appears in a sentence, and m is the total number of words in the sentence. indicates the importance of a word, and a higher value indicates that the word is more important for this text. After sorting, the top-ranked word is used as text representative, and pre-processing, such as vector-matrix construction, so that the original text’s high-dimensional hard-to-process original feature space is effectively transformed into a new easy-to-process low-dimensional feature space to better characterize the original text.
3.1.2. Constructing Pseudo-Labeled Datasets
Text feature clustering is mostly applied in the field of data mining. The principle is through multiple iterations, the points with high similarity are clustered together and divided into a cluster, and high aggregation and low coupling are achieved between clusters, and its class cluster center can be used as the unified feature of this part of similar data, and its characteristics are similar to the category. Thus, we introduce the class cluster center as a pseudo-label. The clustering algorithms are mainly divided into grid-based clustering algorithms, hierarchy-based clustering algorithms, and partitioning-based clustering algorithms [36]. Among them, the grid-based clustering algorithms represented by STING and WAVE-CLUSTER have high execution efficiency, but the accuracy of clustering is low and lacks consideration of the connection between grid cells. The hierarchical-based clustering algorithms represented by algorithms such as BIRCH and Chameleon are fast and use less memory, but the clustering results are strongly influenced by the input order of the objects. In contrast, the partition-based clustering algorithms such as K-means and CLARA are simple and easy to operate and have high accuracy, so the k-means [37] clustering algorithm was finally chosen for the pseudo-label generation.
The k-means algorithm is a classical clustering algorithm. The principle is that the data samples are divided into clusters according to the distance between data samples, the initial centers are randomly selected according to the given number of centers, the clusters are assigned to the cluster classes with the closest distance in one iteration, and the class cluster centers are dynamically adjusted by calculating the sum of the squares of the differences of the distances between clusters and cluster centers in each cluster class to make the distance between clusters and clusters as large as possible [38] to achieve the sample delineation, the specific process is as follows:
Step 1 Obtain the total number of classes from the annotated data text, noted as k-value, and input the dataset samples as clusters.
Step 2 Randomly select one cluster from all clusters as the initial center of the cluster class, then select the one farthest from the point as the second initial class cluster center point, then select the point with the largest nearest distance from the first two points as the third initial class cluster center point, and so on until k initial class cluster center points are selected.
Step 3 Assigning class clusters to the nearest cluster class set based on the distance between each class cluster and the centroid calculated by Equation (4).
Step 4 Recalculating the centroids of each class cluster after calculating the mean value of each cluster with respect to all class cluster centroids by Equation (5).
Step 5 When the change in the position of the new class cluster center and the previous class cluster center is less than a threshold, it can be judged that the clustering tends to be stable, indicating that the desired result is reached; if the change in the position of the new class cluster centroid and the previous class cluster center is greater than a threshold, it is necessary to loop the above steps Step 3, Step 4 and Step 5.
where c refers to the value of the samples of the dataset; is the total representation of a cluster class, is the center of class , and . When the clustering algorithm reaches the specified number of training rounds or the centroids tend to be constant, the k class cluster centers that are stabilized are the pseudo-labels we need. Then, each unlabeled data point is assigned to the nearest class cluster center to form the pseudo-labeled dataset .
3.1.3. Consistency Training
Since the k-means clustering algorithm is susceptible to noise points and outliers, there may be mislabeling in the pseudo-labeled dataset, and directly accessing the pseudo-labeled dataset for subsequent training will introduce too much noise. Therefore, the consistency training of the unlabeled data-enhanced samples is added. The forced model of the consistency loss function produces similar outputs for similar inputs, which contributes to the robustness and generalization performance of STCPC.
For a large number of unlabeled dataset , the output distribution of pseudo-label generation by clustering is denoted as , indicating that the pseudo-label y of the unlabeled dataset is obtained from its unlabeled data x by transformation; is the dataset generated from the unlabeled dataset using back translation method data augmentation, and its output distribution by clustering task is denoted as . Considering the consistency constraint between the unlabeled data and its augmented samples to minimize the metric between the two distributions, the pseudo-label consistency loss is
where θ is a model parameter, is a fixed replica of θ that is not involved in backpropagation. is the data augmentation function, and the distance between two distributions is measured using Kullback–Leibler (KL) Divergence. The consistency training technique forces the model to be insensitive to noise by aligning the clustering results of the unlabeled data with the clustering results of its augmented samples, resulting in smoother changes in the input space. Moreover, minimizing the consistency loss will achieve full utilization of a large amount of unlabeled data.
3.2. EPiDA Data Augmentation
In order to improve the classification effect of the method in this paper, we also focus on the enhancement of the labeled data. The augmentation method is represented by the expansion of a small amount of labeled data, and the quality and diversity of the expanded data significantly affect the performance of the model. We balance data diversity and quality by using the EPiDA framework to generate expanded data with a high level of synthesis.
EPiDA consists of three components: data augmentation, sample evaluation and selection (REM + CEM), and classifier. The data augmentation module is selected from the currently used methods: back translation and context enhancement. Moreover, the sample evaluation and selection module and the classifier are used to evaluate the enhanced samples generated by the data augmentation methods comprehensively through mutual feedback. The relative entropy maximization (REM) is used to consider diversity, i.e., try to select those augmented samples that differ the most from the original samples; the conditional entropy minimization (CEM) considers quality, i.e., try to select augmented samples that can minimize the uncertainty of the model. the flow chart of EPiDA data augmentation is shown in Figure 3.
Firstly, in order to generate diverse and rich samples, it is necessary to make the samples generated by data augmentation as different as possible from the original samples; therefore, for the augmented samples loss should be maximum, and the objective function is
where is the true label; is a finite-dimensional feature mapping, which is not affected by data augmentation; is a learnable parameter; H is the Shannon entropy, which is used to measure the information gain of the augmented samples; D is the relative entropy, which indicates the difference with and ; and p is the probability distribution. Since is the one-hot vector, .
According to Equation (7), we can understand that the difference between the original sample and the augmented sample is the largest when the relative entropy is maximized so that the diversity of the augmented data can be achieved. Therefore, the diversity of the augmented samples is scored as
Secondly, in order to generate high-quality augmented data, the semantic deviation of the augmented samples from the original samples is constrained by minimizing the conditional entropy, and the objective function is
Thus, the quality score of the augmented sample is
Finally, taking into account the diversity and quality of the augmented samples, the final score is
The loss of the EPiDA data augmentation framework is
Based on the final scores, the enhanced samples generated by back translation and context augmented are evaluated, and a reasonably augmented sample is selected and merged with a small amount of unlabeled data to realize the expansion of a small amount of labeled data.
3.3. Total Loss
To enhance the classification capability of the model, the fine-tuning phase is divided into two progressive parts. Firstly, the pseudo-labeled dataset is passed into the classification model for training, and the resulting cross-entropy of the classification labels and pseudo-labels is used as a weakly-supervised cross-entropy loss, denoted as
The parameters are retained, and then the labeled datasets and their data-augmented sample datasets are combined using to obtain . is passed into the classification model for training, and the resulting cross-entropy of the predicted labels and the true labels is used as the supervised cross-entropy loss, denoted as
The STCPC algorithm combines the loss of the EPiDA data augmentation framework, the weakly-supervised cross-entropy loss , the supervised cross-entropy loss , and the pseudo-label consistency loss to construct the total loss function :
The STCPC algorithm not only effectively mines the information of unlabeled data but also enriches a small amount of labeled data and strengthens the expressive power of the model.
4. Experiment
4.1. Implementation Details
The hardware environment is [email protected] CPU; the software environment is Windows 10 system, Python 3.9.7, Tensorflow_gpu-2.5.0. The basic classification model is selected as a case-insensitive BERT-based-uncased model trained by the general corpus only as a pre-trained model for the experiments, and all the parts involving data augmentation are selected back-translated by using Chinese as the intermediate language. The k-values of clustering are automatically adjusted according to the dataset categories, and the rest of the training parameters are shown in Table 1.
We study the classification problem in the case of training data with small labeled samples and focus on the accuracy of the classification results on the dataset, which is calculated from the ratio of the total number of correctly labeled classifications TP to the total number of classified samples N, expressed as shown in Equation (16). The performance of the model is judged by Precision, Recall, and F1 values, as shown in Equations (17)–(19), and the Confusion matrix of the classification results is shown in Table 2.
4.2. Comparison with Other Methods
4.2.1. Baseline Models
To verify the effectiveness of the STCPC algorithm, experiments were conducted to compare it with relevant mainstream text classification algorithms used for comparison, which are:
- (1)
- Mean Teacher [39]: a semi-supervised learning method based on deep neural networks using a student model and an average teacher model trained on unlabeled data. It was initially proposed for image analysis in small sample situations but has been shown to work well for natural language processing as well.
- (2)
- BERT: uses a pre-trained BERT-based-uncased model from Google.
- (3)
- RoBERTa [40] is an improved version of the BERT-based model that achieves excellence on several natural language processing tasks by optimizing the training data, training objectives, and training process.
4.2.2. Datasets
The experiment selects four general text classification datasets for experiments, including film review dataset IMDB, news domain dataset AG News, question answering corpus dataset Yahoo! Answer, and structured content dataset Dbpedia based on Wikipedia, where the test dataset is randomly selected from the original test dataset, and the unlabeled training dataset and labeled dataset are split and produced from the original training dataset. To strengthen the limitation in the small sample set, we assume that the model cannot utilize the development dataset to simulate a more barren number of tags. The dataset information is shown in Table 3.
4.2.3. Performance
To ensure fair experimental comparison, the number of labeled data was assigned by the number of categories, 50, 200, and 400, and the experimental results are shown in Table 3.
As can be seen in Table 4, the STCPC algorithm is better than other text classification algorithms in general in terms of accuracy on the four text classification datasets. For example, in the IMDB dataset, classifying only 50 annotated data, STCPC has 9.4%, 5.2%, and 2.4% improvement over BERT, Mean Teacher, and RoBERTa. The overall analysis of the latter three datasets shows that such a boost performs better with a smaller number of categories in the dataset, showing a better boost than other algorithms as the proportion of labeled data decreases. Such results indicate that STCPC does have better improvement in the case of small samples.
In order to better evaluate the STCPC algorithm, we introduced three metrics, Precision, Recall, and F1 score, and conducted experiments on the IMDB dataset. To make the comparison of the data more intuitive, we presented it in the form of graphs, as shown in Figure 4, Figure 5 and Figure 6.
From the comparison of the three plots in Figure 4, Figure 5 and Figure 6, we can find that the STCPC algorithm achieves good results for all three metrics, which indicates that the STCPC algorithm model is better than the compared methods in terms of its ability to distinguish negative samples, its ability to identify positive samples and its robustness. This shows that STCPC has significant significance in improving the classification effect of the model, which can effectively reduce overfitting and improve the classification performance of the model.
4.3. Ablation Experiment
To verify the effectiveness of each component of STCPC, we set up ablation experiments with the removal of each component. The IMDB dataset is used as the experimental object so that each category has labeled data of 50, and the comparison experiments of removing the data augmentation module, removing the pseudo-labeling module, and the original model are conducted. The experimental results are shown in Table 5.
From Table 5, it can be seen that the accuracy of the trained components decreases after different degrees of component removal, but overall they are all higher than the original BERT model. Among them, the accuracy decreases the most by removing the pseudo-label, which indicates that among all the components, the pseudo-label contributes the most to the training, and the semantic features of a large amount of unlabeled data are mined by clustering, which effectively improves the accuracy of the model. Moreover, the same decrease in accuracy after excluding the EPiDA data augmentation shows that the component also has the ability to improve the model effect, indicating the reasonableness of the STCPC design.
4.4. Performance under Different Conditions
After verifying the validity of STCPC, in order to test the variation of STCPC performance under different conditions, we choose to recreate the dataset for experimental testing.
4.4.1. Datasets
Four text classification datasets were selected for the experiment: the IMDB and Amazon reviews datasets were kept with the same number of classifications for comparison, and the Sogou news and Yahoo! Answer datasets were kept with the same amount of unlabeled data for comparison. The information on the datasets is shown in Table 6.
4.4.2. Experiment Result
Figure 7 and Figure 8 show the comparison of different numbers of unlabeled data for the same number of classifications. It can be seen that the rising range of STCPC is significantly higher than that of the BERT model when the number of unlabeled data is increased for the same number of classifications. It shows that the unlabeled data can be better exploited with the help of the STCPC algorithm.
Figure 9 and Figure 10 make a comparison of different numbers of classifications when the amount of unlabeled data is the same. It can be seen that the rising range of STCPC is not higher than that of the BERT model when the amount of unlabeled data is constant, and the number of classifications increases. Considering that this is because the increase in the number of classifications will increase the content of labeled data, whereas BERT, in this case, has access to more labeled data for supervised learning and can perform adequate learning. This shows that although STCPC can improve the classification ability of the BERT model in the case of small samples, it is not enough in an environment where the number of labeled samples is gradually increasing. This is where our algorithm needs to be improved in the future.
5. Conclusions
We propose a pseudo-label fusion clustering algorithm for text classification models by combining the features of both the pseudo-labeling method and data augmentation to address the problem that pre-trained models do not give accurate results for text classification tasks when there is a small amount of labeled data. STCPC makes full use of labeled data and non-labeled data to effectively avoid weak prediction ability in the training process due to the small amount of labeling in the training set and the limited learning ability of the pre-trained model. The comparative experimental results show that the accuracy of STCPC is higher than that of the existing model in the case of small labeled samples, and the lower the labeling ratio, or, the more classes labeled, the better the effect of the STCPC model. However, while we demonstrate that STCPC can significantly improve the training model in the case of small samples, the TF-IDF algorithm used in the pre-processing of the pseudo-tags is unable to identify synonyms and polysemous words, and the improvement does not reach the desired goal in scenarios where there is a gradual increase in labeled data. In future work, we will improve the TF-IDF algorithm and focus more on information mining of labeled data, starting from the improvement on the data itself and on the training model, and expect to enhance the overall improvement of STCPC by some more effective means.
Author Contributions
Conceptualization, L.Y.; data curation, L.Y. and S.G.; formal analysis, L.Y.; funding acquisition, B.H.; investigation, L.Y. and S.G.; methodology, L.Y.; project administration, L.Y. and T.Z.; resources, B.H.; software, L.Y., S.G. and Y.L.; supervision, B.H.; validation, L.Y. and B.H.; visualization, L.Y., S.G., Y.L. and T.Z.; writing—original draft, L.Y.; writing—review & editing, L.Y. and B.H. All authors have read and agreed to the published version of the manuscript.
Funding
This research was funded by National Natural Science Foundation of China, grant number 61962005.
Institutional Review Board Statement
Not applicable.
Informed Consent Statement
Not applicable.
Data Availability Statement
The data underlying this article will be shared upon reasonable request to the corresponding author.
Conflicts of Interest
The authors declare no conflict of interest.
References
- Nasukawa, T.; Yi, J. Sentiment Analysis: Capturing Favorability Using Natural Language Processing. In Proceedings of the 2nd International Conference on Knowledge Capture, Sanibel Island, FL, USA, 23–25 October 2003; pp. 70–77. [Google Scholar]
- Ma, L.; Zhang, Y. Using Word2Vec to Process Big Text Data. In Proceedings of the 2015 IEEE International Conference on Big Data (Big Data), Santa Clara, CA, USA, 29 October–1 November 2015; IEEE: Piscataway, NJ, USA, 2015. [Google Scholar]
- Devlin, J.; Chang, M.-W.; Lee, K.; Toutanova, K. BERT: Pre-Training of Deep Bidirectional Transformers for Language Understanding. arXiv 2018. [Google Scholar] [CrossRef]
- Clark, K.; Luong, M.-T.; Le, Q.V.; Manning, C.D. ELECTRA: Pre-Training Text Encoders as Discriminators Rather than Generators. arXiv 2020. [Google Scholar] [CrossRef]
- Yang, M. A Survey on Few-Shot Learning in Natural Language Processing. In Proceedings of the 2021 International Conference on Artificial Intelligence and Electromechanical Automation (AIEA), Guangzhou, China, 14–16 May 2021; IEEE: Piscataway, NJ, USA, 2021. [Google Scholar]
- Howard, J.; Ruder, S. Universal Language Model Fine-Tuning for Text Classification. arXiv 2018. [Google Scholar] [CrossRef]
- Nguyen-Nhat, D.-K.; Duong, H.-T. One-Document Training for Vietnamese Sentiment Analysis. In Computational Data and Social Networks; Springer International Publishing: Cham, Switzerland, 2019; pp. 189–200. [Google Scholar]
- Duong, H.-T.; Nguyen-Thi, T.-A. A Review: Preprocessing Techniques and Data Augmentation for Sentiment Analysis. Comput. Soc. Netw. 2021, 8, 1–16. [Google Scholar] [CrossRef]
- Anaby-Tavor, A.; Carmeli, B.; Goldbraich, E.; Kantor, A.; Kour, G.; Shlomov, S.; Tepper, N.; Zwerdling, N. Do Not Have Enough Data? Deep Learning to the Rescue! Proc. Conf. AAAI Artif. Intell. 2020, 34, 7383–7390. [Google Scholar] [CrossRef]
- Zhao, M.; Zhang, L.; Xu, Y.; Ding, J.; Guan, J.; Zhou, S. EPiDA: An Easy Plug-in Data Augmentation Framework for High Performance Text Classification. arXiv 2022. [Google Scholar] [CrossRef]
- Hidetaka, I.; Wang, Y. A Semi-Supervised Approach for Identification of the Sections in Charge of RFQ Documents. In Proceedings of the 2019 IEEE International Conference on Big Data (Big Data), Los Angeles, CA, USA, 9–12 December 2019; IEEE: Piscataway, NJ, USA, 2019. [Google Scholar]
- Jedrzejowicz, J.; Zakrzewska, M. Text Classification Using LDA-W2V Hybrid Algorithm. In Intelligent Decision Technologies 2019; Springer Singapore: Singapore, 2020; pp. 227–237. [Google Scholar]
- Zoph, B.; Ghiasi, G.; Lin, T.-Y.; Cui, Y.; Liu, H.; Cubuk, E.D.; Le, Q.V. Rethinking Pre-Training and Self-Training. arXiv 2020. [Google Scholar] [CrossRef]
- Villatoro-Tello, E.; Anguiano, E.; Montes-y-Gómez, M.; Villaseñor-Pineda, L.; Ramírez-de-la-Rosa, G. Enhancing Semi-Supevised Text Classification Using Document Summaries. In Lecture Notes in Computer Science; Springer International Publishing: Cham, Switzerland, 2016; pp. 115–126. [Google Scholar]
- Zhang, Z.; Luo, J.; Huang, G. A Semi-Supervised Short Text Classification Method Based on Weighted Word Vector Representation. In Proceedings of the 2019 IEEE 9th International Conference on Electronics Information and Emergency Communication (ICEIEC), Beijing, China, 12–14 July 2019; IEEE: Piscataway, NJ, USA, 2019. [Google Scholar]
- Fang, Z.; Zhang, G.; Dai, Q.; Kong, Y.; Wang, P. Semisupervised Deep Convolutional Neural Networks Using Pseudo Labels for PolSAR Image Classification. IEEE Geosci. Remote Sens. Lett. 2022, 19, 1–5. [Google Scholar] [CrossRef]
- Wang, Y.; Yao, Q.; Kwok, J.T.; Ni, L.M. Generalizing from a Few Examples: A Survey on Few-Shot Learning. ACM Comput. Surv. 2021, 53, 1–34. [Google Scholar] [CrossRef]
- Guo, G.; Dyer, C.R. Learning from Examples in the Small Sample Case: Face Expression Recognition. IEEE Trans. Syst. Man Cybern. B Cybern. 2005, 35, 477–488. [Google Scholar] [CrossRef] [Green Version]
- Liu, J.; Chen, S. Discriminant Common Vectors versus Neighbourhood Components Analysis and Laplacianfaces: A Comparative Study in Small Sample Size Problem. Image Vis. Comput. 2006, 24, 249–262. [Google Scholar] [CrossRef]
- Fei-Fei, L.; Fergus, R.; Perona, P. Learning Generative Visual Models from Few Training Examples: An Incremental Bayesian Approach Tested on 101 Object Categories. Comput. Vis. Image Underst. 2007, 106, 59–70. [Google Scholar] [CrossRef]
- Maas, A.; Kemp, C. One-Shot Learning with Bayesian Networks. In Proceedings of the Annual Meeting of the Cognitive Science Society, Amsterdam, The Netherlands, 29 July–1 August 2009; Volume 31. No. 31. [Google Scholar]
- Cohen, K.B.; Dolbey, A. Foundations of Statistical Natural Language Processing (Review). Language 2002, 78, 599. [Google Scholar] [CrossRef]
- Nakamura, A.; Harada, T. Revisiting Fine-Tuning for Few-Shot Learning. arXiv 2019. [Google Scholar] [CrossRef]
- Wei, J.; Zou, K. EDA: Easy Data Augmentation Techniques for Boosting Performance on Text Classification Tasks. arXiv 2019. [Google Scholar] [CrossRef]
- Yu, F.; Wang, H.; Zheng, D.; Fei, G. Research on Transfer Learning Approach for Text Categorization. In Proceedings of the 2010 International Conference on Artificial Intelligence and Computational Intelligence, Sanya, China, 23–24 October 2010; IEEE: Piscataway, NJ, USA, 2010. [Google Scholar]
- Snell, J.; Swersky, K.; Zemel, R.S. Prototypical Networks for Few-Shot Learning. arXiv 2017. [Google Scholar]
- Li, H.; Eigen, D.; Dodge, S.; Zeiler, M.; Wang, X. Finding Task-Relevant Features for Few-Shot Learning by Category Traversal. In Proceedings of the 2019 IEEE/CVF Conference on Computer Vision and Pattern Recognition (CVPR), Long Beach, CA, USA, 15–20 June 2019; IEEE: Piscataway, NJ, USA, 2019. [Google Scholar]
- Goel, A.; Jiao, Y.; Massiah, J. PARS: Pseudo-Label Aware Robust Sample Selection for Learning with Noisy Labels. arXiv 2022. [Google Scholar] [CrossRef]
- Lee, D.H. Pseudo-label: The simple and efficient semi-supervised learning method for deep neural networks. In Workshop on Challenges in Representation Learning; ICML: Atlanta, GA, USA, 2013; Volume 3, p. 896. [Google Scholar]
- Rizve, M.N.; Duarte, K.; Rawat, Y.S.; Shah, M. In Defense of Pseudo-Labeling: An Uncertainty-Aware Pseudo-Label Selection Framework for Semi-Supervised Learning. arXiv 2021. [Google Scholar] [CrossRef]
- Vaswani, A.; Shazeer, N.; Parmar, N.; Uszkoreit, J.; Jones, L.; Gomez, A.N.; Kaiser, L.; Polosukhin, I. Attention Is All You Need. arXiv 2017. [Google Scholar]
- Koroteev, M.V. BERT: A Review of Applications in Natural Language Processing and Understanding. arXiv 2021. [Google Scholar] [CrossRef]
- Yang, D.; Zhang, A.N. Performing Literature Review Using Text Mining, Part III: Summarizing Articles Using TextRank. In Proceedings of the 2018 IEEE International Conference on Big Data (Big Data), Seattle, WA, USA, 10–13 December 2018; IEEE: Piscataway, NJ, USA, 2018. [Google Scholar]
- Li, M.; Yuan, B. A Novel Statistical Linear Discriminant Analysis for Image Matrix: Two-Dimensional Fisherfaces. In Proceedings of the 7th International Conference on Signal Processing, 2004. Proceedings. ICSP ’04. 2004, Beijing, China, 31 August–4 September 2004; IEEE: Piscataway, NJ, USA, 2005. [Google Scholar]
- Havrlant, L.; Kreinovich, V. A Simple Probabilistic Explanation of Term Frequency-Inverse Document Frequency (Tf-Idf) Heuristic (and Variations Motivated by This Explanation). Int. J. Gen. Syst. 2017, 46, 27–36. [Google Scholar] [CrossRef] [Green Version]
- Fahad, A.; Alshatri, N.; Tari, Z.; Alamri, A.; Khalil, I.; Zomaya, A.Y.; Foufou, S.; Bouras, A. A Survey of Clustering Algorithms for Big Data: Taxonomy and Empirical Analysis. IEEE Trans. Emerg. Top. Comput. 2014, 2, 267–279. [Google Scholar] [CrossRef]
- Ikotun, A.M.; Ezugwu, A.E.; Abualigah, L.; Abuhaija, B.; Heming, J. K-Means Clustering Algorithms: A Comprehensive Review, Variants Analysis, and Advances in the Era of Big Data. Inf. Sci. (Ny) 2023, 622, 178–210. [Google Scholar] [CrossRef]
- Bock, H.-H. Clustering Methods: A History of k-Means Algorithms. In Selected Contributions in Data Analysis and Classification; Springer: Berlin/Heidelberg, Germany, 2007; pp. 161–172. [Google Scholar]
- Tarvainen, A.; Valpola, H. Mean Teachers Are Better Role Models: Weight-Averaged Consistency Targets Improve Semi-Supervised Deep Learning Results. arXiv 2017. [Google Scholar]
- Liu, Y.; Ott, M.; Goyal, N.; Du, J.; Joshi, M.; Chen, D.; Levy, O.; Lewis, M.; Zettlemoyer, L.; Stoyanov, V. RoBERTa: A Robustly Optimized BERT Pretraining Approach. arXiv 2019. [Google Scholar] [CrossRef]
Figure 1.
Structure of BERT model. Where E1, E2, …, EN represents the pre-processed text input, T1, T2,…, TN represents the vector output trained by the BERT model. The Trm module is an Encoder structure from Transformer.
Figure 1.
Structure of BERT model. Where E1, E2, …, EN represents the pre-processed text input, T1, T2,…, TN represents the vector output trained by the BERT model. The Trm module is an Encoder structure from Transformer.

Figure 2.
The illustration of the structure of the STCPC model. The STCPC is divided into two parts, the upper part is the pseudo-label generation route, and the lower part is the EPiDA data augmentation with tagged data.
Figure 2.
The illustration of the structure of the STCPC model. The STCPC is divided into two parts, the upper part is the pseudo-label generation route, and the lower part is the EPiDA data augmentation with tagged data.

Figure 3.
The illustration of the EPiDA data augmentation module.

Figure 4.
Precision results for the IMDb dataset.

Figure 5.
Recall results for the IMDb dataset.

Figure 6.
F1 score results for the IMDb dataset.

Figure 7.
IMDb dataset training results.

Figure 8.
Amazon Reviews dataset training results.

Figure 9.
Sogou News dataset training results.

Figure 10.
Yahoo Answers dataset training results.


Table 1.
Experiment settings.
| Parameter Name | Parameter Value |
|---|---|
| Cluster threshold | 0.02 |
| The maximum number of iterations of the cluster | 200 |
| Weight of consistency loss | 1 |
| Dropout random inactivation rate | 0.1 |
| Maximum sentence length | 256 |
| Number of model iterations | 10 |
| Learning rate | 3 × 10⁻⁵ |
| Random seed | 0 |
Table 2.
Confusion matrix.
| Real | Forecast | |
|---|---|---|
| Positive | Negative | |
| Positive | True positive (TP) | False positive (FN) |
| Negative | False positive (FP) | True Negative (TN) |
Table 3.
Datasets.
| Name | Categories | Train | Test |
|---|---|---|---|
| IMDB | 2 | 5000 | 5000 |
| AG News | 4 | 5000 | 5000 |
| Yahoo! Answer | 10 | 5000 | 5000 |
| DBpedia | 14 | 5000 | 5000 |
Table 4.
Comparison of the accuracy of each algorithm (%). Bold indicates that this data represents the best performance in this comparison.
Table 4.
Comparison of the accuracy of each algorithm (%). Bold indicates that this data represents the best performance in this comparison.
| Name | Model | Labels | ||
|---|---|---|---|---|
| 50 | 200 | 400 | ||
| IMDB | BERT | 78.3 | 82.2 | 85.2 |
| Mean Teacher | 82.5 | 86.5 | 89.7 | |
| RoBERTa | 85.3 | 87.2 | 90.4 | |
| Ours | 87.7 | 89.5 | 91.9 | |
| AG News | BERT | 81.6 | 85.3 | 88.0 |
| Mean Teacher | 83.0 | 87.1 | 89.3 | |
| RoBERTa | 88.3 | 90.2 | 90.9 | |
| Ours | 87.7 | 90.3 | 92.3 | |
| Yahoo! Answer | BERT | 86.2 | 89.3 | 91.1 |
| Mean Teacher | 86.7 | 89.1 | 90.5 | |
| RoBERTa | 87.0 | 89.6 | 91.4 | |
| Ours | 87.3 | 89.6 | 91.7 | |
| DBpedia | BERT | 88.7 | 90.2 | 92.1 |
| Mean Teacher | 88.0 | 89.4 | 90.2 | |
| RoBERTa | 88.9 | 90.3 | 92.2 | |
| Ours | 89.1 | 90.3 | 92.3 | |
Table 5.
The comparison between our proposed method with or without pseudo-labeling and EPiDA data augmentation (%).
Table 5.
The comparison between our proposed method with or without pseudo-labeling and EPiDA data augmentation (%).
| Algorithm | Accuracy |
|---|---|
| STCPC | 87.7 |
| - pseudo-labeling | 80.3 |
| - EPiDA data augmentation | 82.4 |
| - All | 78.3 |
Table 6.
Datasets.
| Name | Categories | Train | Test |
|---|---|---|---|
| IMDB | 2 | 5000 | 5000 |
| Amazon reviews | 2 | 10,000 | 5000 |
| Sogou news | 4 | 15,000 | 5000 |
| Yahoo! Answer | 10 | 15,000 | 5000 |
Disclaimer/Publisher’s Note: The statements, opinions and data contained in all publications are solely those of the individual author(s) and contributor(s) and not of MDPI and/or the editor(s). MDPI and/or the editor(s) disclaim responsibility for any injury to people or property resulting from any ideas, methods, instructions or products referred to in the content. |
© 2023 by the authors. Licensee MDPI, Basel, Switzerland. This article is an open access article distributed under the terms and conditions of the Creative Commons Attribution (CC BY) license (https://creativecommons.org/licenses/by/4.0/).
Share and Cite
MDPI and ACS Style
Yang, L.; Huang, B.; Guo, S.; Lin, Y.; Zhao, T. A Small-Sample Text Classification Model Based on Pseudo-Label Fusion Clustering Algorithm. Appl. Sci. 2023, 13, 4716. https://0-doi-org.brum.beds.ac.uk/10.3390/app13084716
AMA Style
Yang L, Huang B, Guo S, Lin Y, Zhao T. A Small-Sample Text Classification Model Based on Pseudo-Label Fusion Clustering Algorithm. Applied Sciences. 2023; 13(8):4716. https://0-doi-org.brum.beds.ac.uk/10.3390/app13084716
Chicago/Turabian StyleYang, Linda, Baohua Huang, Shiqian Guo, Yunjie Lin, and Tong Zhao. 2023. "A Small-Sample Text Classification Model Based on Pseudo-Label Fusion Clustering Algorithm" Applied Sciences 13, no. 8: 4716. https://0-doi-org.brum.beds.ac.uk/10.3390/app13084716
Note that from the first issue of 2016, this journal uses article numbers instead of page numbers. See further details here.