
Emergency Evacuation Simulation Study Based on Improved YOLOv5s and Anylogic


School of Civil Engineering and Transportation, Beihua University, Jilin City 132000, China
*
Author to whom correspondence should be addressed.
Appl. Sci. 2023, 13(9), 5812; https://0-doi-org.brum.beds.ac.uk/10.3390/app13095812
Submission received: 4 April 2023
/
Revised: 29 April 2023
/
Accepted: 5 May 2023
/
Published: 8 May 2023
(This article belongs to the Special Issue Computer Vision and Pattern Recognition Based on Deep Learning)
Abstract
:With the development of the social economy and the continuous growth of the population, emergencies within field stations are becoming more frequent. To improve the efficiency of emergency evacuation of field stations and further protect people’s lives, this paper proposes a method based on improved YOLOv5s target detection and Anylogic emergency evacuation simulation. This method applies the YOLOv5s target detection network to the emergency evacuation problem for the first time, using the stronger detection capability of YOLOv5s to solve the problem of unstable data collection under unexpected conditions. This paper first uses YOLOv5s, which incorporates the SE attention mechanism, to detect pedestrians inside the site. Considering the height of the camera and the inability to capture the whole body of the pedestrian when the site is crowded, this paper adopts the detection of the pedestrian’s head to determine the specific location of the pedestrian inside the site. To ensure that the evacuation task is completed in the shortest possible time, Anylogic adopts the principle of closest distance evacuation, so that each pedestrian can leave through the exit closest to him or her. The experimental results show that the average accuracy of the YOLOv5s target detection model incorporating the SE attention mechanism can reach 94.01%; the constructed Anylogic emergency evacuation model can quickly provide an evacuation plan to guide pedestrians to leave from the nearest exit in an emergency, effectively verifying the feasibility of the method. The method can be extended and applied to research related to the construction of emergency evacuation aid decision-making systems in field stations.
1. Introduction
With the development of society and the increase in population, there are increasingly more natural or man-made emergencies, such as fires, earthquakes, stampedes, and so on. These emergencies often occur in metro stations, large shopping malls, and other densely populated areas. If the emergency evacuation is not handled correctly, it can result in a large number of casualties and property damage, so how to do a good job of emergency evacuation in emergency situations has become an important part of research in safety science.
Researchers have already started to study the evacuation behavior of people in the early 1900s. Initially, the study of evacuation behavior was mainly conducted through surveys, experiments, and observations. Hankin and Wright found a relationship between speed, density, and flow of unidirectional pedestrian flow by investigating pedestrian flow in London underground passages and elaborating a preliminary pedestrian theory [1]. Bryan [2] and Wood obtained data on the behavioral responses of people escaping from fires through a survey of people escaping from fires. Pauls observed the activities of people at events by means of field observations and summarized the relevant patterns [3]. Zhang Shuping [4] obtained a conversion factor interval for the number of evacuees in the business part of a large shopping mall building by measuring and statistically analyzing the actual flow of people in the mall. Zhong Guangchun et al. conducted a questionnaire survey on safety awareness and evacuation in an earthquake disaster situation at a university in Nanjing and found that males were more familiar with evacuation sites than females, but the proportion of males waiting in line to pass through evacuation routes was smaller than that of females [5]. Guo Summer et al. investigated the evacuation behavior of people in the underground by means of a questionnaire and found that whether people in the underground chose to evacuate or not was related to education and age, but not much to gender [6].
After the 1980s, based on the rapid development of computers, people began to build computer models to describe the behavior of people on computers and carry out regularized research [7]. Fang et al. [8] proposed a spatial grid-based evacuation model, SGEM, and used the model to simulate the evacuation of people. They concluded that the network grid composite model could not only simulate the evacuation of large and complex buildings but also visualize the detailed evacuation process. Song Weiguo et al. [9] proposed a lattice gas model for evacuating people, taking into account the characteristics of the population distribution. The model not only predicts the interval value of the number of evacuees, but also derives the time required to evacuate a certain number of people, thus obtaining a quantitative relationship between the number of evacuees and evacuation time. Secondly, the model can also analyze the quantitative impact of the spatial distribution of people on the evacuation outcome and its uncertainty. Wang Yiheng et al. [10] established an emergency evacuation index system through a BP neural network, conducted a simulation evaluation with the underground stations around Beijing’s North Third Ring Road as the main research object, and proposed an improvement scheme. Yang Zhaosheng et al. [11] proposed an improved particle swarm optimization algorithm model based on ranking selection through an improved particle swarm algorithm, which can effectively evacuate vehicles in public places in an efficient and safe manner in emergency situations. Duan Xiaohong et al. [12] shortened the transit time of emergency vehicles through the bat algorithm, effectively improving the efficiency of emergency rescue, while the algorithm has good search capability and operation speed. Based on the social forces model, Cheng Yao et al. [13] used simulation to study the pedestrian emergency evacuation problem and experimentally demonstrated four factors that affect the evacuation process. The four factors include pedestrians’ familiarity with the layout of the place, pedestrians’ grouping behavior, the internal layout of the place, and the safe carrying capacity of the place. Qi et al. [14] demonstrated that all these non-adaptive evacuation behaviors have some negative impact on pedestrian evacuation efficiency by simulating non-adaptive evacuation behavior pairs such as inertial behavior, folding behavior, herding behavior, and partnering behavior of pedestrians. Cao Siqi et al. [15] used Dijkstra’s algorithm to calculate the optimal evacuation path under a fire scenario and demonstrated that the method is consistent with the actual evacuation road situation and can effectively determine the optimal evacuation route for traditional village complexes under fire. S. Peeta et al. [16] proposed an FL model based on fuzzy logic to cope with the heterogeneous behavior of evacuees after disasters such as earthquakes and chemical plant explosions, resulting in emergency evacuation measures due to large uncertainties. Khalid A. Albis et al. [17] proposed a model for sudden fire evacuation of large shopping malls through fire dynamics simulation. Khalili-Damghanin et al. [18] proposed a hybrid mathematical planning model for uncertain multi-objective, multi-commodity, multi-cycle location assignment using a multi-objective optimization and location assignment model. Amany et al. [19] developed an algorithm using the CFAST model to generate the shortest evacuation route in the form of a clear tree diagram in the shortest evacuation time.
On the basis of pedestrian traffic modeling, with the continuous improvement of computer models, a variety of commercial pedestrian traffic simulation software has emerged, including Legion, Vissim, Simwork, Anylogic, etc. The improvement of models and the development of simulation software have enabled the emergency evacuation problem to be solved to a certain extent, but in the process of extracting information about evacuation targets, most of the data acquisition methods used by research scholars are non-machine vision methods to acquire data, including the use of broadband satellite networks, wireless local area networks (WLAN), Bluetooth sensors, etc.
Although better research results have been achieved with non-machine vision-based methods, they are difficult to widely promote and apply due to the many uncertainties in the data acquisition process. Therefore, this paper, based on previous research, applies the YOLOv5 target detection algorithm to the emergency evacuation problem for the first time, with the aim of using the stronger detection capability of YOLOv5 to compensate for the shortcomings of traditional methods in the process of data acquisition. This paper also uses YOLOv5 in combination with Anylogic simulation software to input the pedestrian locations detected by YOLOv5 into Anylogic for emergency evacuation simulation and to simulate a suitable evacuation plan. This article uses Anylogic version 8.5.0. The method proposed in this paper has the advantage of faster data information collection than traditional methods and reduces the overall process time for emergency evacuation by reducing the time used in the data information collection process. In an emergency situation where time is of the essence, making a quick decision and choosing the most appropriate solution can greatly reduce the damage to people and property.
The remainder of the paper is structured as follows: Section 2 outlines the structure of the YOLOv5 target detection network and the improvement strategy of this paper, together with an introduction to the Anylogic simulation software. Section 3 outlines the experimental procedure, parameter configuration, and evaluation metrics, and analyzes the experimental results of the method in this paper. Finally, Section 4 concludes the paper and presents future research plans.
2. Materials and Methods
2.1. Analysis and Design of the YOLOv5s-SE Algorithm
The YOLO [20,21,22,23] (You Only Look Once) family of target detection algorithms accomplishes target location and classification by using direct prediction of the target’s bounding box, which has the benefit of increasing detection speed. YOLOv5 is an improvement of the YOLO series algorithm [24], YOLOv5 builds on the YOLOv4 target detection algorithm by using auto-scaling, cropping, and mosaic for data enhancement, adding automatic learning of the size of the anchor box. The network structure of YOLOv5 is divided into three parts. The first part is Backbone, whose role is mainly feature extraction; the second part is Neck, whose role is to mix and combine features and pass these features to the prediction; and the third part is Head, responsible for the final prediction and the output of the prediction results. In tests on the official dataset, YOLOv5 has shown some improvement in detection speed and accuracy over YOLOv4, and a nearly 90% reduction in model size compared to YOLOv4 [25]. The YOLOv5 algorithm is divided into YOLOv5s, YOLOv5m, YOLOv5l, and YOLOv5x according to network depth and feature map width from small to large, where the depth of the YOLOv5s model is 1/3 of YOLOv5l and the width of the feature map is 1/2 of YOLOv5l. Since this paper is to achieve the detection of pedestrians under emergency situation conditions, the importance of detection speed is greater than detection accuracy, so YOLOv5s, which has a faster detection speed, is chosen as the object of study in this paper.
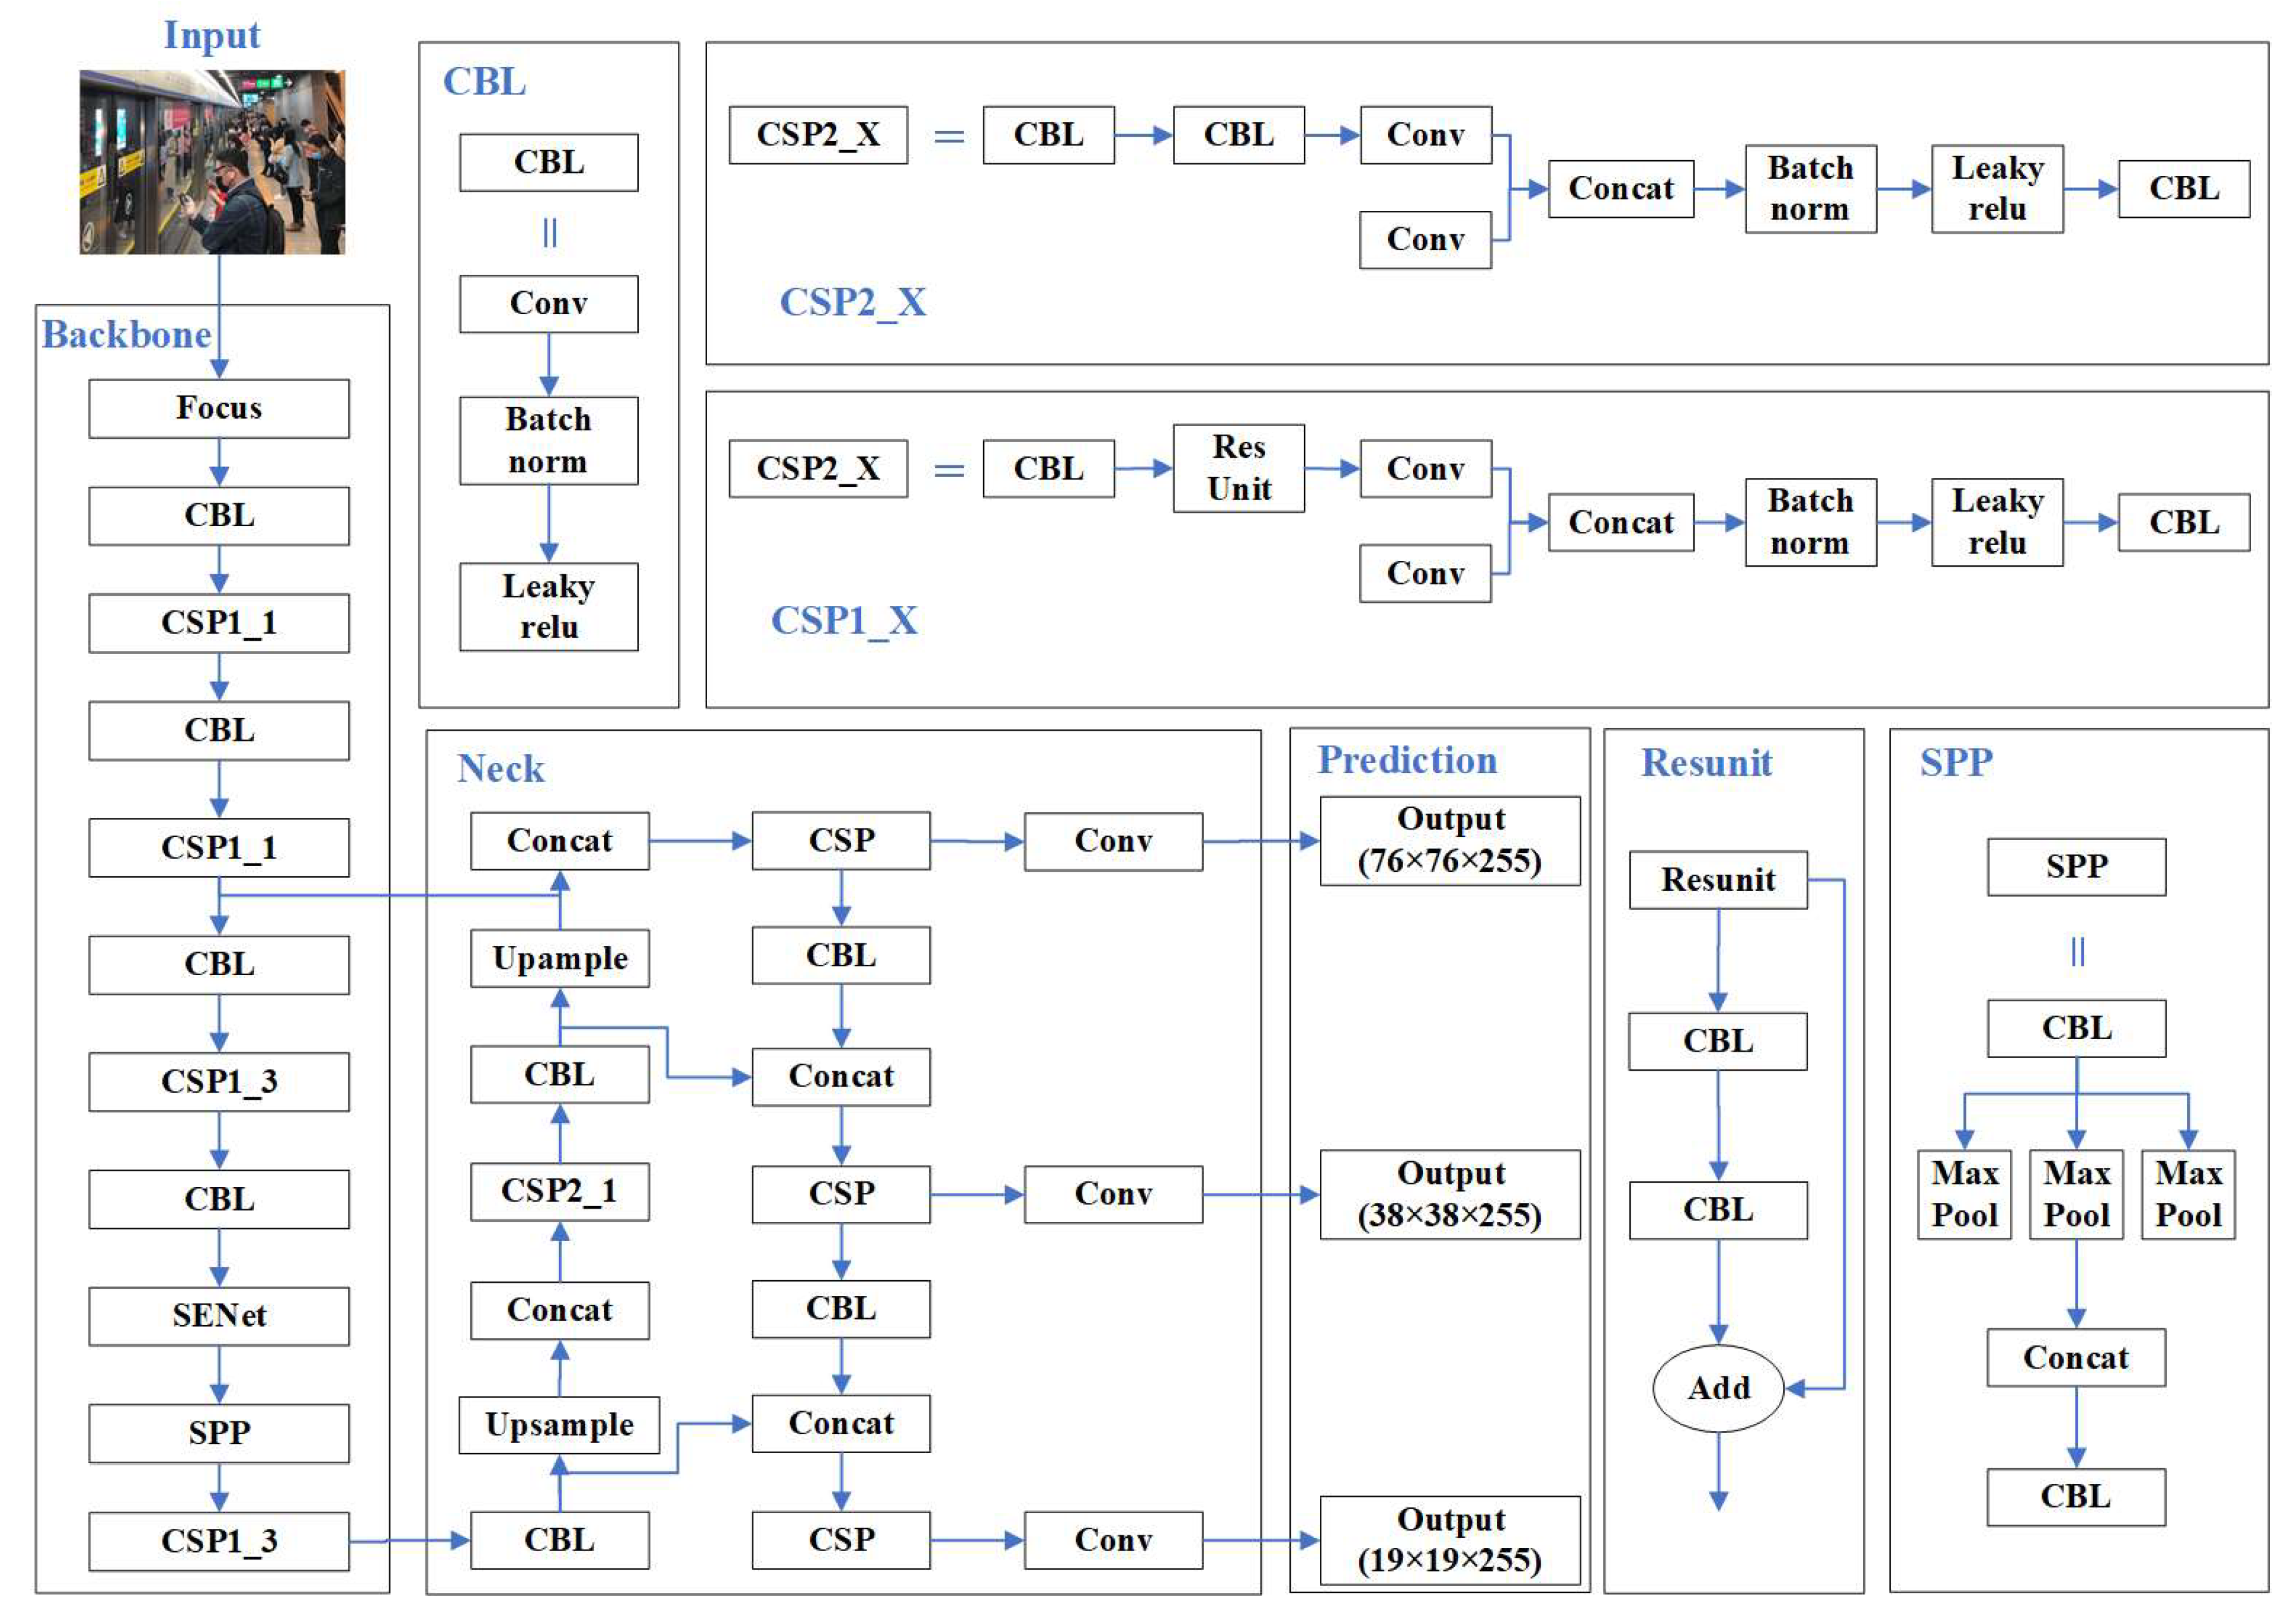
Although YOLOv5s has a fast detection speed, the detection results for small target groups are not satisfactory. As the YOLOv5s network level continues to deepen, the information extracted at the output becomes increasingly abstract, and the detection of distant pedestrian heads inside the field station becomes increasingly difficult to achieve. Therefore, in order to enhance the accuracy of YOLOv5s for small target group detection, this paper incorporates SENet [26] into the YOLOv5s network structure, and the improved network structure is shown in Figure 1.
On the input side, YOLOv5s adopts the Mosaic data enhancement technology, which can solve the problem of unsatisfactory training results and model overfitting caused by insufficient sample data to a certain extent. Secondly, it introduces the adaptive anchor frame calculation, which can obtain prediction frames based on predetermined a priori frames during network training. Thirdly, it adds the adaptive image scaling mechanism, which effectively improves the model training. Finally, an adaptive image scaling mechanism is added to effectively improve the model’s training speed. In the feature extraction backbone network, YOLOv5s uses the Focus structure and Cross Stage Partial [27] (CSP), and two different CSP: CSP1_X for the feature extraction network and CSP2_X for the feature fusion network. The Neck network layer of YOLOv5s consists of Feature Pyramid Networks [28] (FPN) and Path Aggregation Networks [29] (PAN), which deliver richer semantic and localization information from top to bottom and bottom to top, respectively, and then fuse features from different backbone layers to different FPN and PAN to deliver richer semantic and localization information from top to bottom and bottom to top, respectively. The prediction side of YOLOv5s consists of three detectors corresponding to three different scales of feature maps, large, medium, and small, for target detection, and the output prediction results correspond to target frame coordinates, confidence, and category information, respectively.
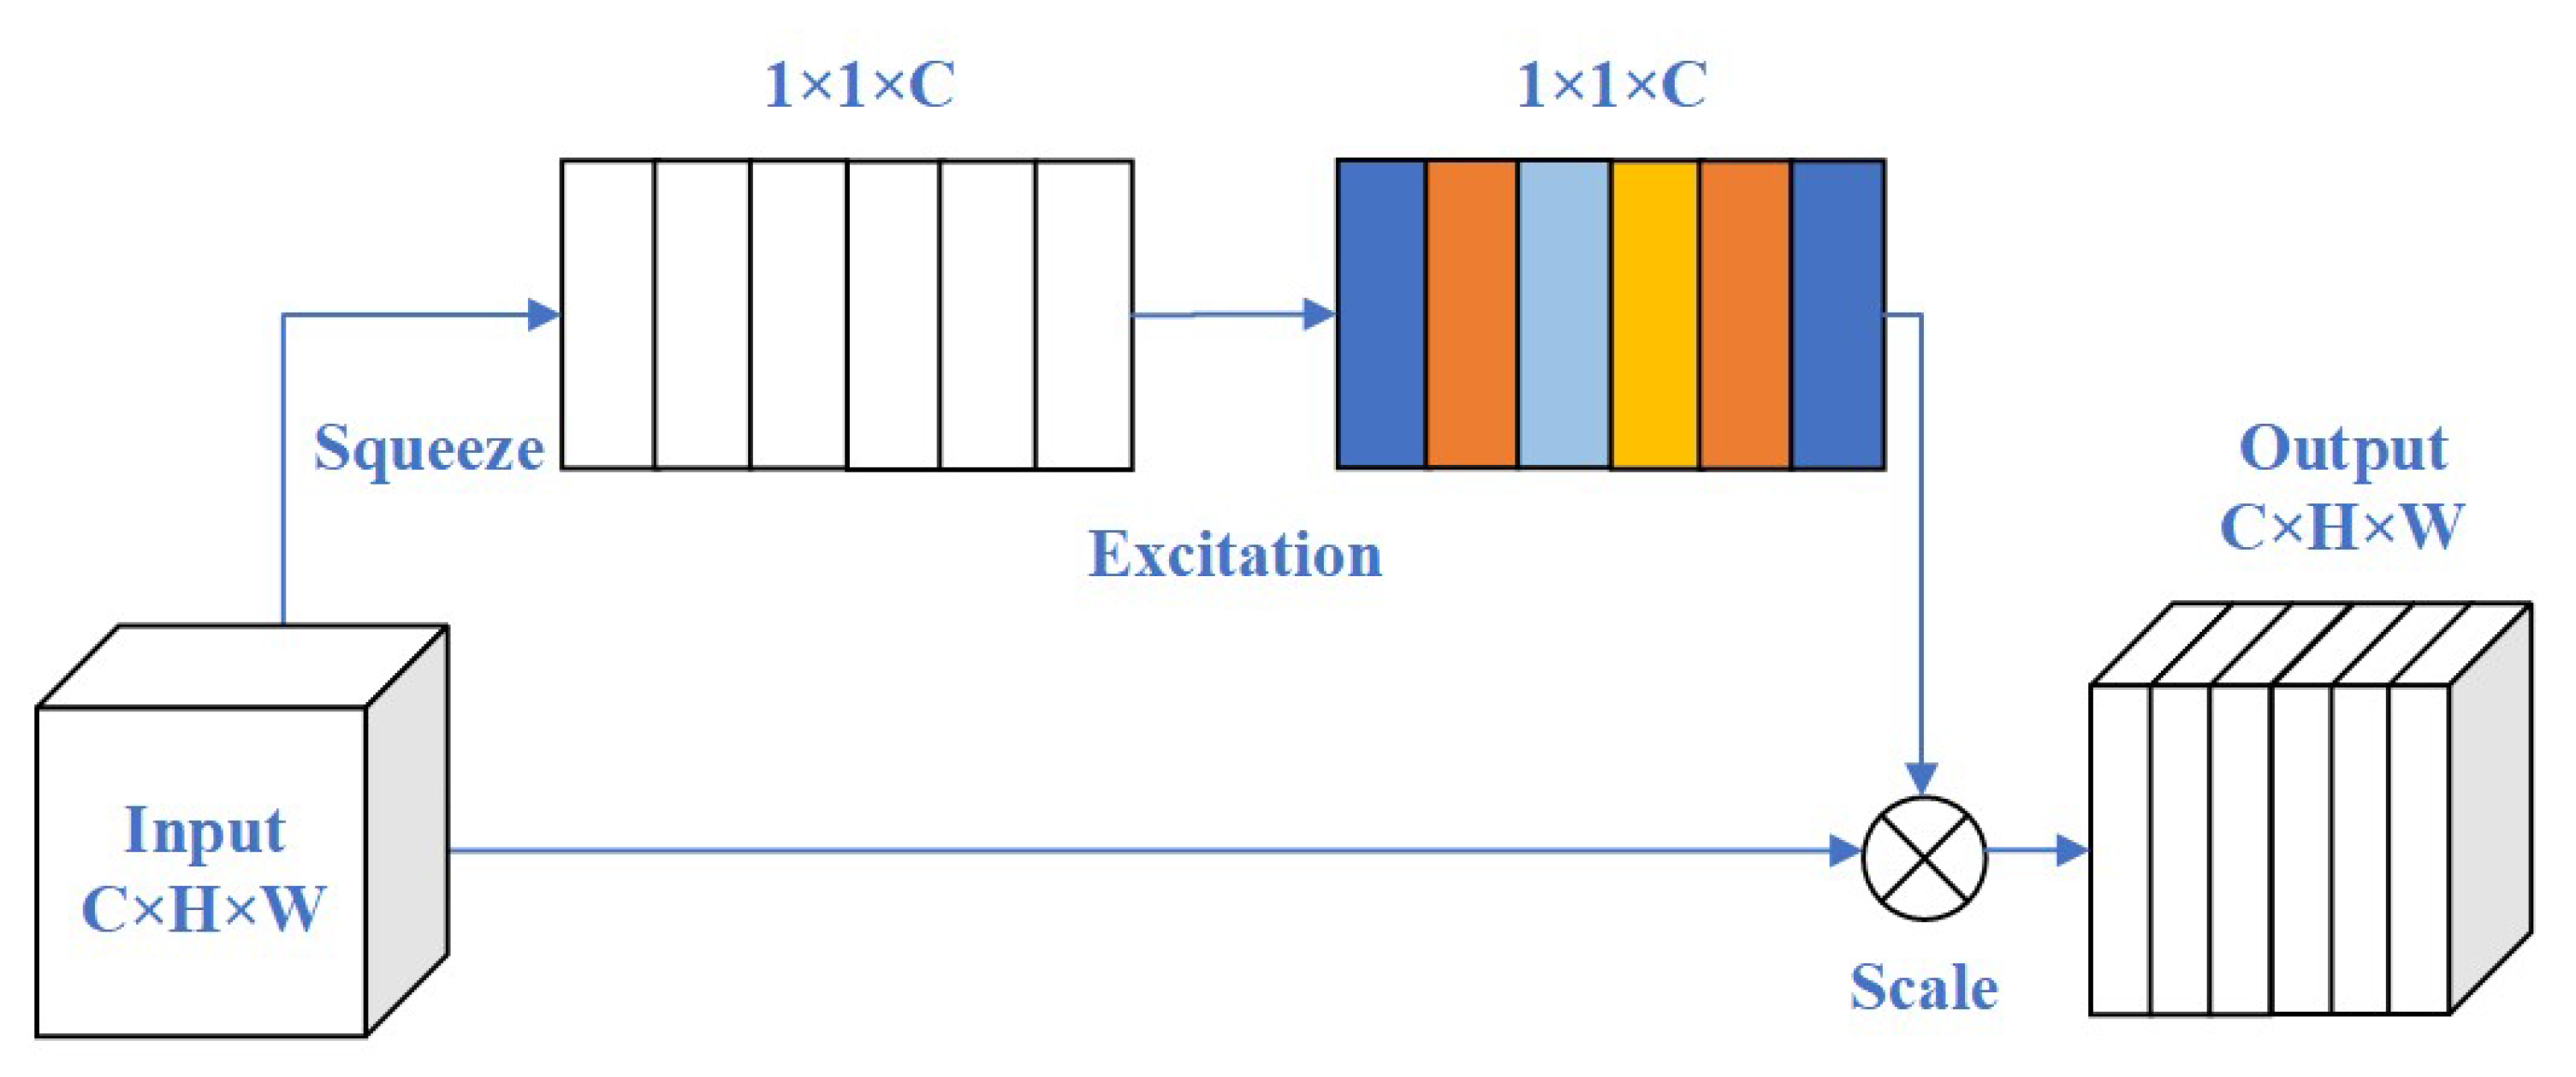
In YOLOv5s, the SPP [30] (Spatial Pyramid Pooling) module can further extract features by serial pooling to enhance the deep feature representation capability of the backbone network and improve the perceptual field of the model. In this paper, to increase the accuracy of YOLOv5s for distant small target detection, SENet is added before SPP, which allows the model to obtain more global features of the target. The structure of the SENet network is shown in Figure 2.
Excitation uses a fully connected neural network to perform a non-linear transformation on the result of Squeeze. Feature rescaling uses the results obtained by Excitation as weights to be multiplied by the input features. By incorporating the SE attention mechanism into the YOLOv5s network structure, it is possible to better enable YOLOv5s to focus on important features and suppress general features, improving the accuracy of pedestrian head detection. The detection results are then fed into Anylogic simulation software to simulate the pedestrian evacuation route after the detection is complete.
In order to further improve the accuracy of the network model for small target object detection, this paper also introduces Normalized Wasserstein Distance [31] (NWD) as a new metric. The original metric of YOLOv5 is IoU, based on the fact that IoU and its extensions are very sensitive to the position deviation of small target objects, which severely degrades the detection performance when used in the Anchor-based IoU and its extensions are very sensitive to the position deviation of small targets, which severely degrades the detection performance when used in Anchor-based detectors. The NWD metric can be easily embedded in the Assignment, Non-Maximum Suppression, and Loss functions of any Anchor-based detector to replace the commonly used IoU metric. However, in practice, we have found that replacing the NWD completely with the IoU metric can lead to too slow a convergence of the model. To avoid this, instead of replacing the IoU completely with NWD as the new metric, this paper uses NWD and IoU together and sets up a scaling relationship where the weight of using NWD and IoU can be changed by modifying the size of the scaling relationship. In this paper, it is proposed to further improve the accuracy of the network model for small target detection while avoiding too slow a convergence.
2.2. Anylogic Emergency Evacuation Modelling
In many practical cases of emergency evacuation, the efficiency of pedestrian evacuation is often influenced by two factors, namely the human factor and the external environment.
Human factors include human characteristics and psychological factors. These factors can have an impact on the speed of pedestrians, for example, men generally walk faster than women, young people generally walk faster than older people, and pedestrians in good health generally walk faster than those in poor health. Human psychological factors can also have an impact on the evacuation process. When people encounter a sudden dangerous event, their psychological state undergoes a relatively large change. The psychology of panic can lead pedestrians to make irrational choices in the event of an emergency. In an emergency, pedestrians may be unfamiliar with the interior of the premises and may be tempted to congregate with the crowd, which can cause serious overcrowding and greatly affect evacuation efficiency. When people help each other in the evacuation process, it will mostly have a positive impact on the evacuation efficiency, but if people hold a competitive mentality, there may be a stampede during the evacuation process due to the rush to escape, etc. Inertia refers to the fact that pedestrians are more familiar with the layout of the interior of the station and tend to choose routes that they normally walk more often or are more familiar with when evacuating. In addition, the choice of evacuation routes and the acceptance of evacuation instructions by the crowd are also related to their personalities.
External factors that influence evacuation efficiency are mainly the characteristics of the building and the internal lighting, announcements, and evacuation guidance signs. Building characteristics include the building’s fire detectors, fire-fighting facilities, emergency evacuation routes, and the width of emergency evacuation routes. The location and brightness of the emergency signage will have a great impact on the efficiency of the evacuation process. Reasonable and effective evacuation signs will quickly help people find their way out and escape to a safe area.
In order to meet the software requirements of this study, Anylogic simulation software was chosen to simulate the emergency evacuation process of pedestrians. AnyLogic is a multi-method simulation modeling software developed by XJ Technologies [32]. The software supports a variety of modeling methods, such as intelligent body modeling, dynamic system simulation, discrete events, and system dynamics [33]. Due to its open and flexible modeling environment, the software applications cover a wide range of areas, such as transport, logistics, control systems, the military, logistics, and education. AnyLogic allows the observation of system behavior over time at any level of detail, provides for increased accuracy and more precise forecasting, and can be animated in 2D/3D so that it can be more easily verified [34]. The AnyLogic software package is a powerful platform that has a developed pedestrian library and many methods to collect the statistical results of a simulation, making it is easy to implement the agent approach completely [35].
The Anylogic simulation modeling process is divided into three main parts. First, the physical model is built. The physical model is built to match the actual layout of the simulation environment, so it is necessary to import a base map of the building’s layout when drawing the physical model. It is important to note that Anylogic has its own scale, which can be set to suit one’s needs, and Anylogic’s pedestrian library model has corresponding spatial markers to help draw the graphics. As a multi-floor simulation environment is to be built, multiple layers are created to represent the different floors, with the height difference between floors matching the actual situation. Next, the people’s behavior flow is set up. Different modules are selected from the pedestrian library to represent the logical flow of pedestrians as required, the modules are matched to the corresponding spatial markers, and the parameters of the modules are determined as required. Finally, the simulation parameters are set. The parameters are set according to the actual situation of the people in the simulation object, such as the proportion of people’s gender and age, and the corresponding comfortable speed is set according to the different groups of people. In order to realize the evacuation function, events need to be set, functions need to be called to realize the emergency evacuation function, etc.
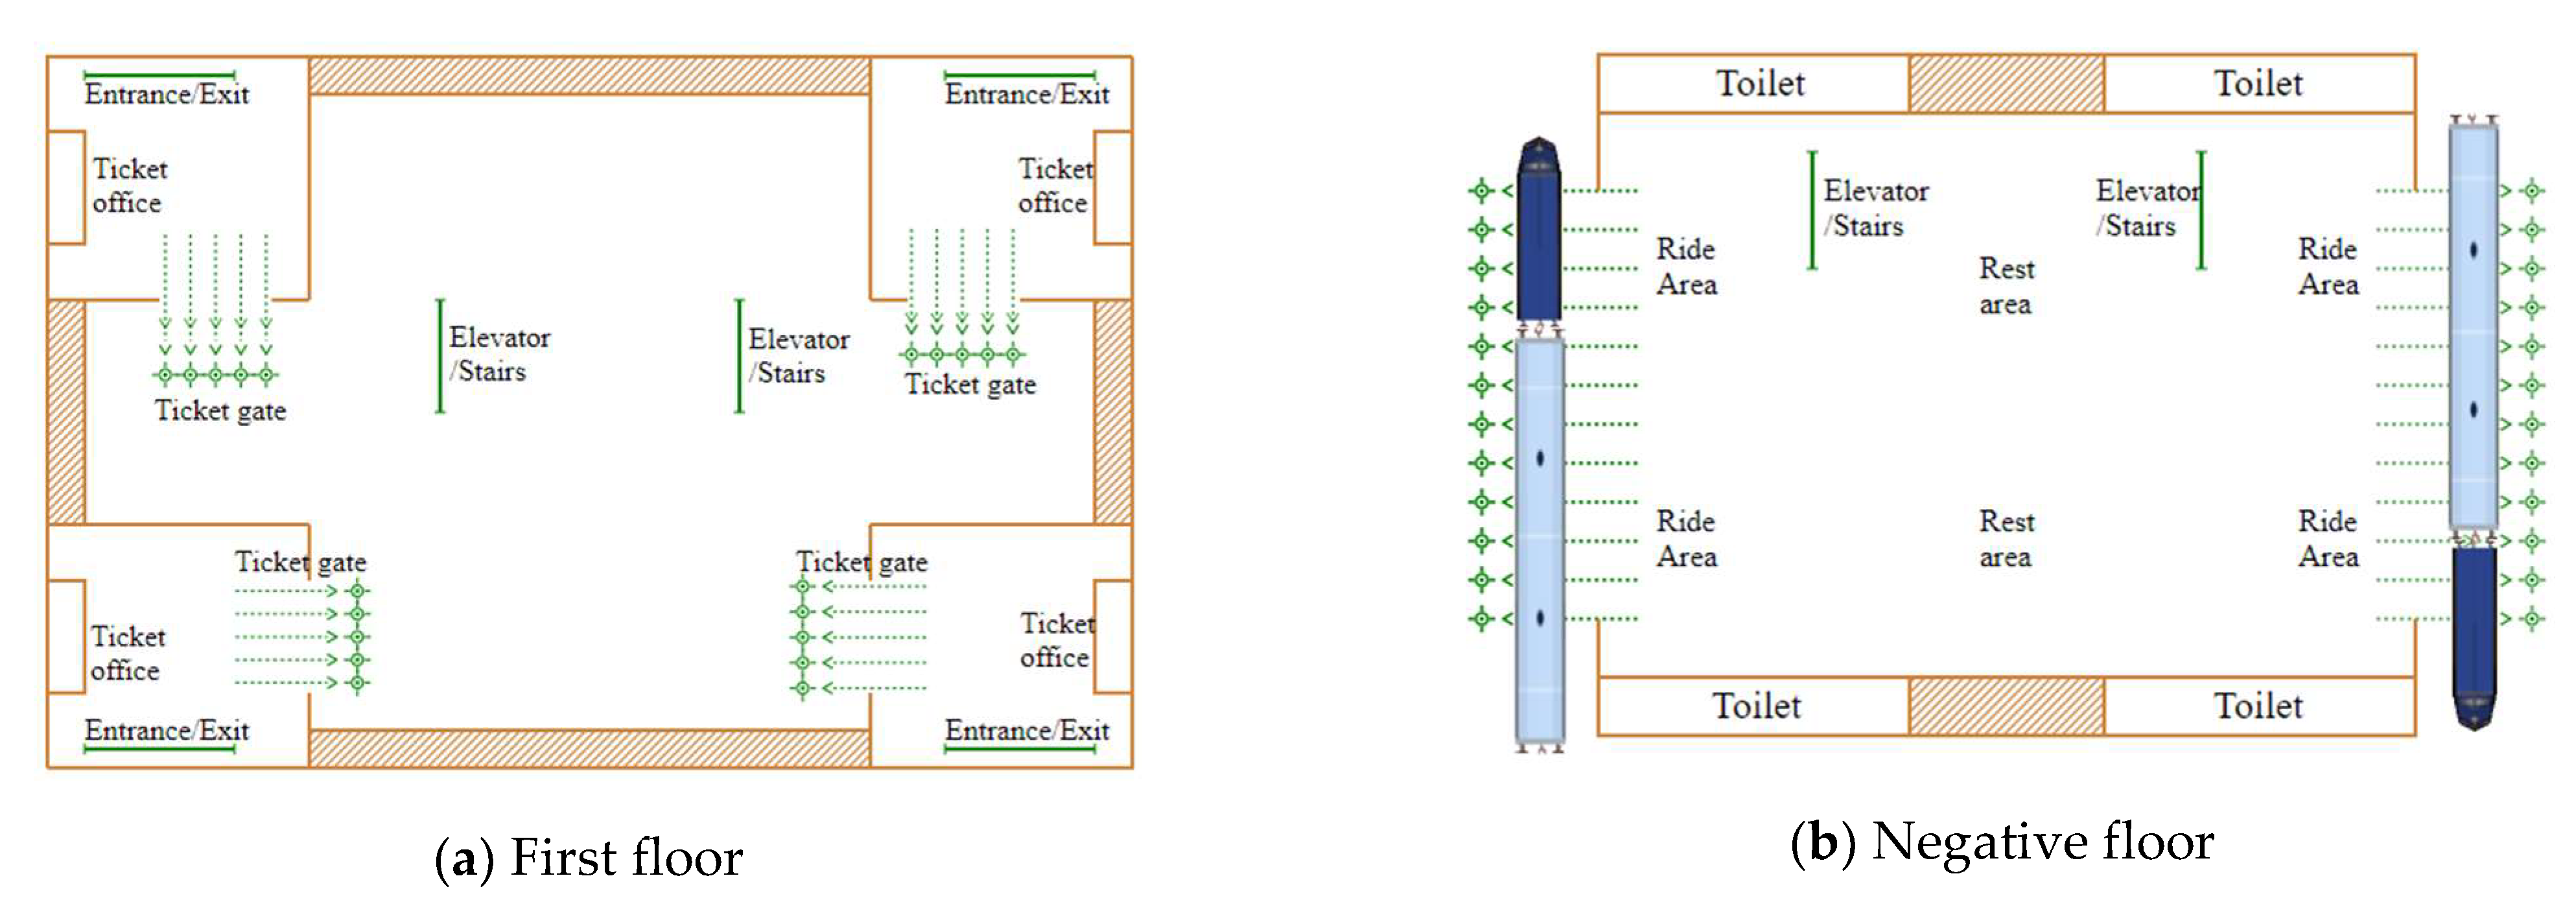
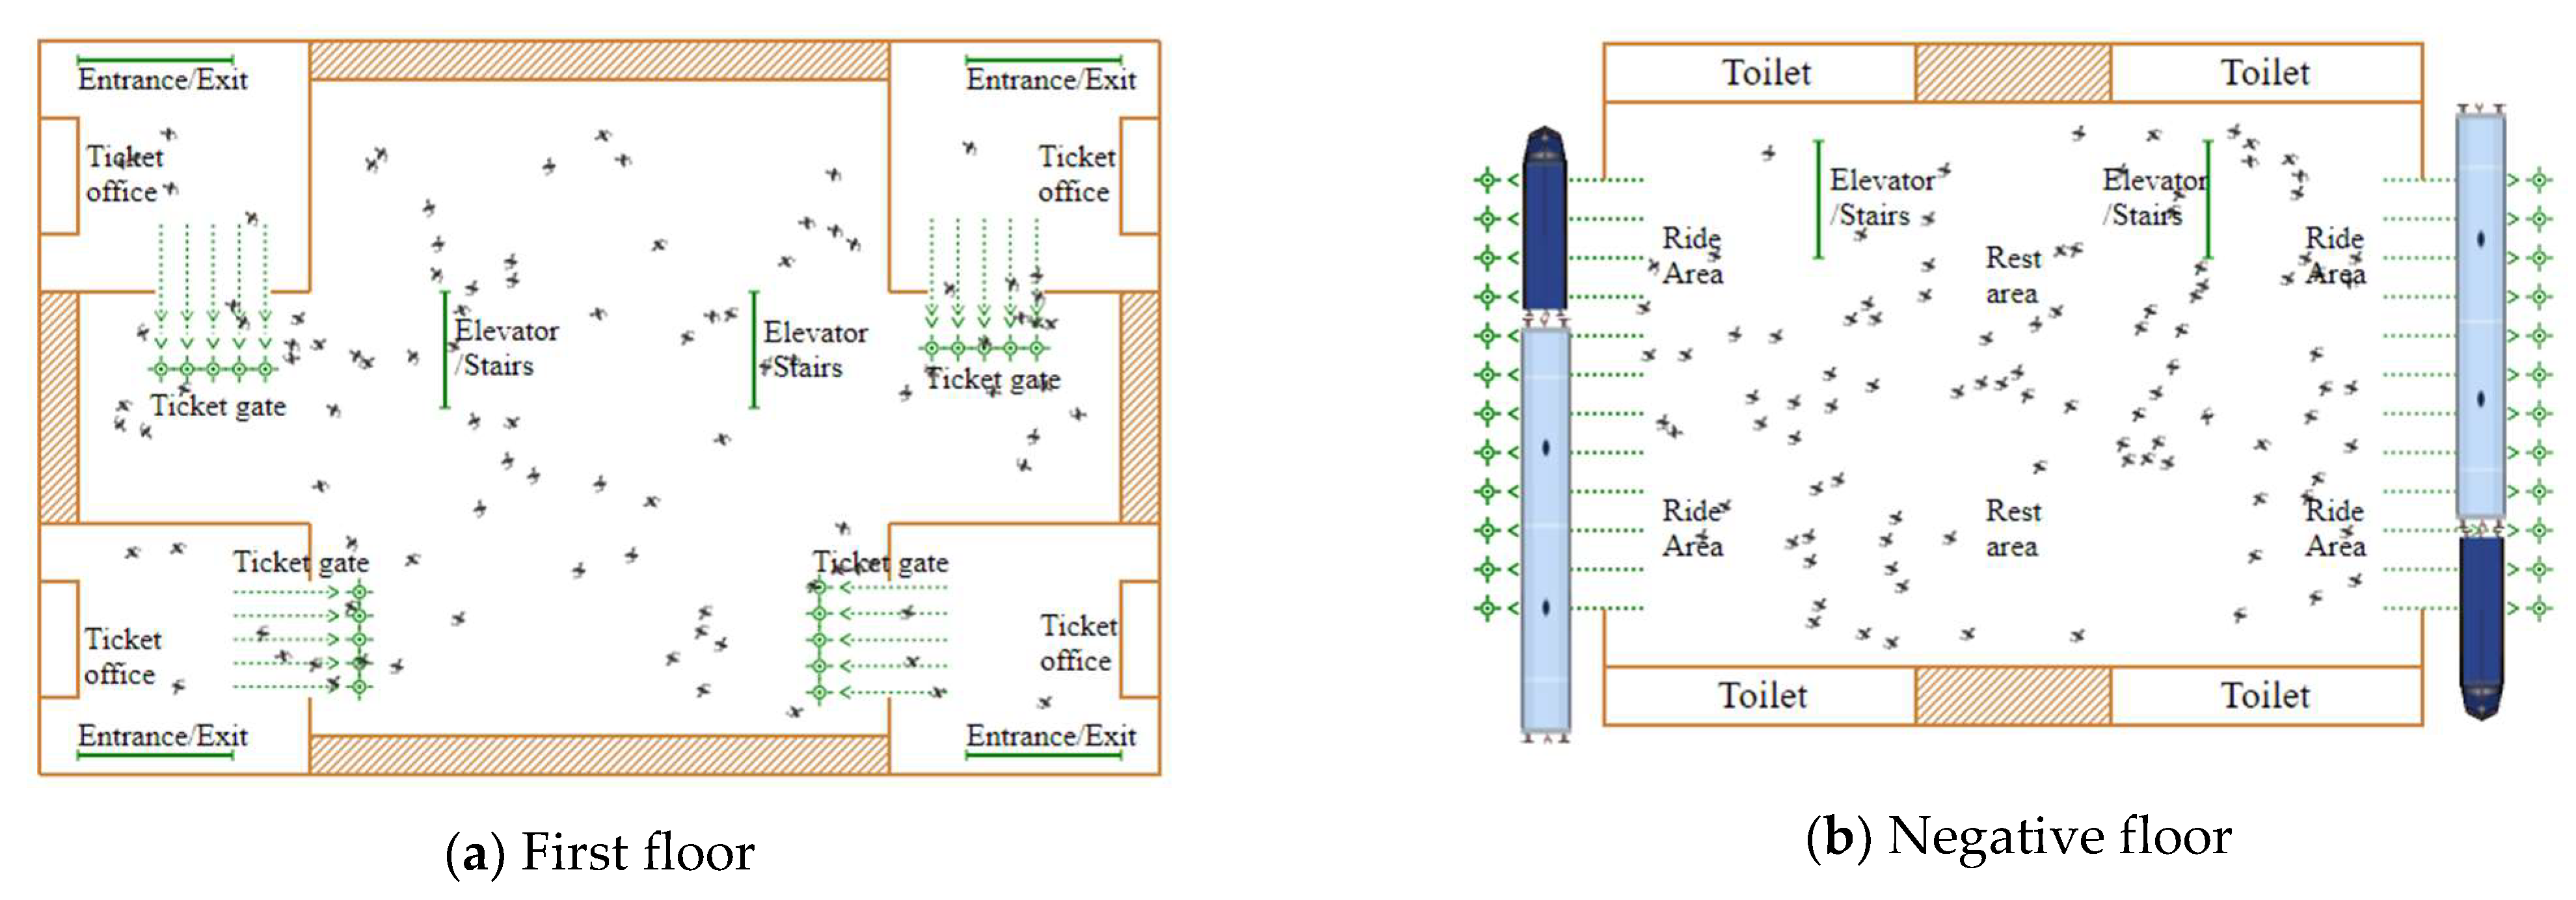
This study proposes to simulate the evacuation route of pedestrians in an emergency situation through Anylogic, with the aim of ensuring that pedestrians choose the nearest route and are able to leave the current scene as soon as possible and safely. This paper proposes to create an underground station scenario through Anylogic and divide it into two levels, as shown in Figure 3, the ground-level layout and the negative-level layout of the station, respectively.
As shown above, the ground floor of the station provides pedestrian access and ticketing services, while the negative level of the station is the main passenger area for pedestrians. At the same time, the ground and negative levels are connected by stairs and lifts to enable pedestrians to enter and exit the station. Once the metro station model has been created, the behavioral parameters of the people entering the station need to be set. The main modules used include PedSource, PedService, PedGoTo, PedWait, PedEnter, PedExit, and PedSink. Anylogic’s general pedestrian library module is introduced as shown in Table 1.
In this article, we generate a certain number of pedestrians through PedSource and set the age, gender, and comfort speed of the person in the Person smart body. Under normal circumstances, pedestrians entering the mall will go to the appropriate area on the appropriate floor to purchase tickets, queue for trains, etc. Which floor or area the pedestrians go to requires the use of the SelectOutput module for selection, which can be conditioned or probabilistic according to the actual situation. The PedSource or PedWait modules can be used to simulate this process when the pedestrian arrives at the corresponding area to stay in the normal behavioral flow. The service time or delay time can be set in the module to simulate the time that the person receives the service or stays here, and PedWait is used in this paper to indicate that the person stays in the corresponding area of the metro station to purchase tickets, check tickets, and queue for trains.
3. Analysis of Experimental Results
3.1. YOLOv5s-SE Based Target Detection Model
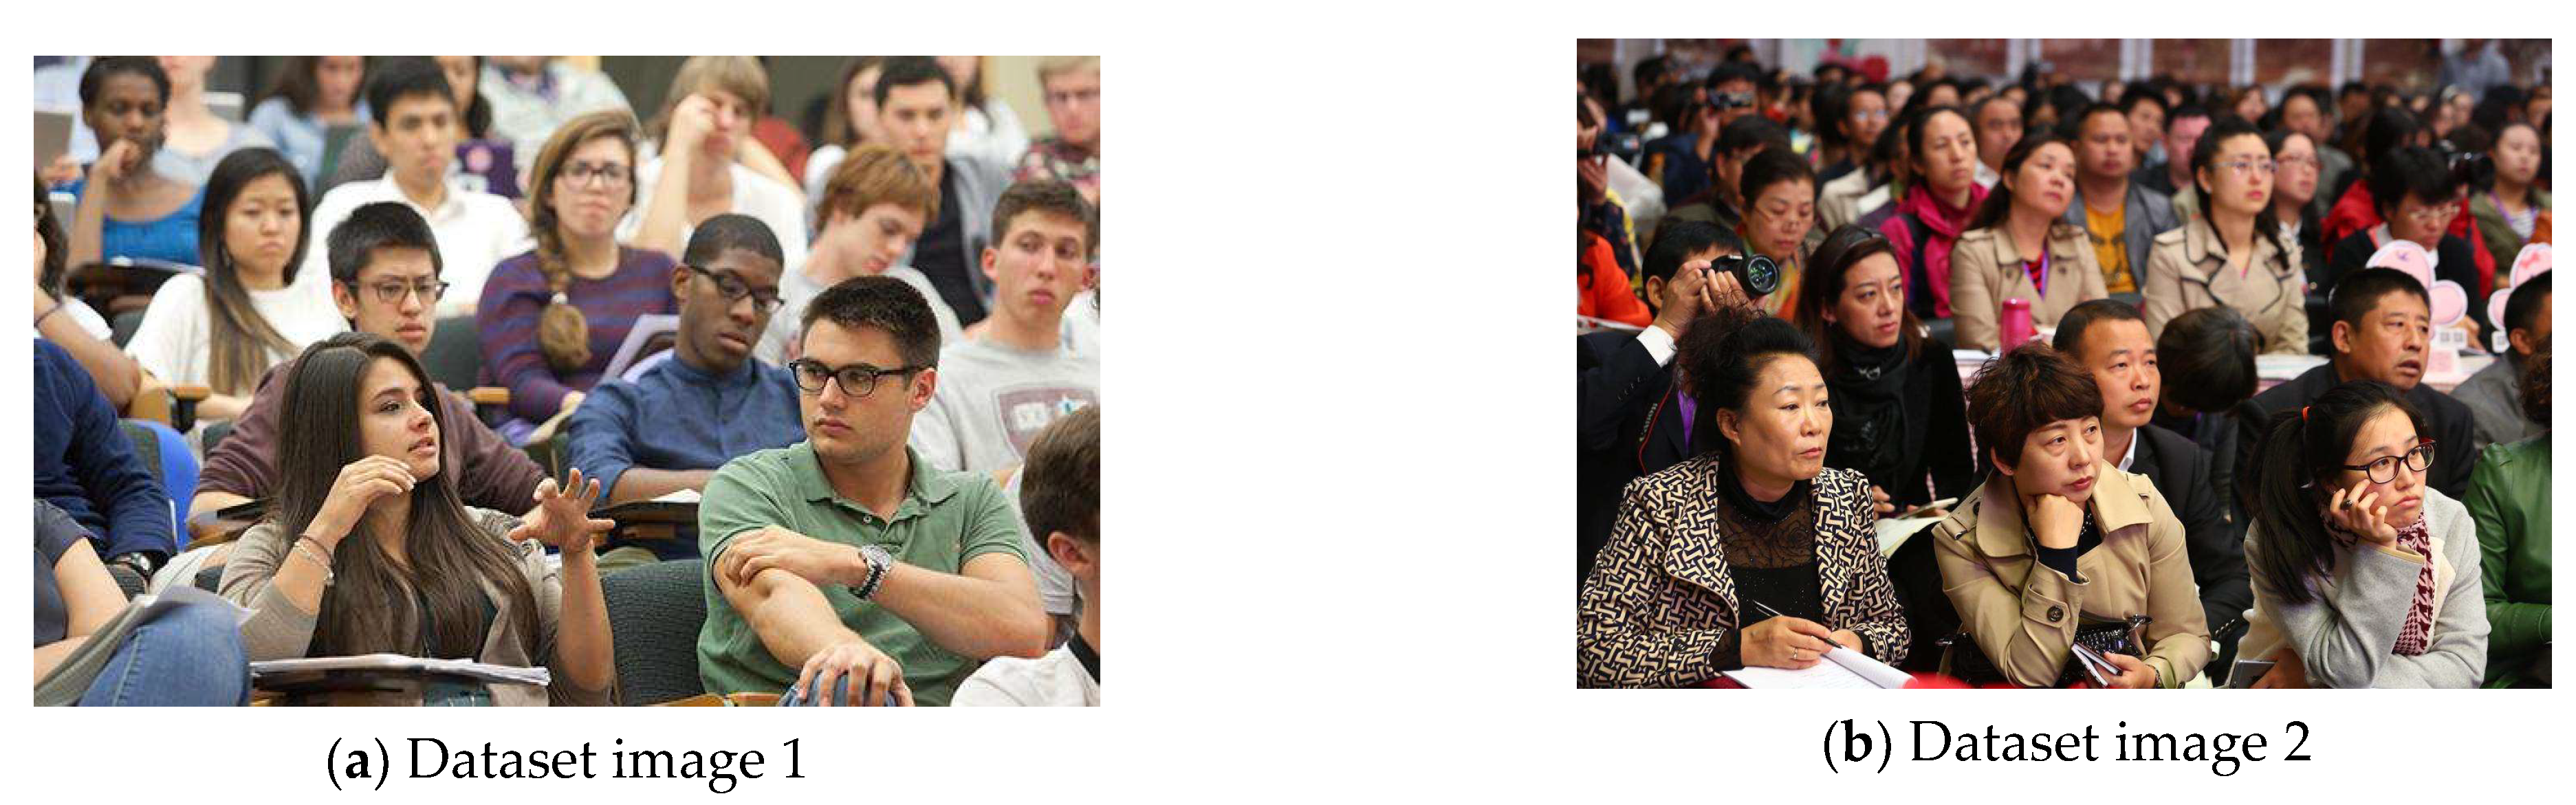
Firstly, we produced a pedestrian head detection dataset by field photography and network collection and collected a total of 4405 valid images, which were allocated to the training and validation sets according to a ratio of 80%, of which 3352 images were used for the training set and the remaining 882 images were used for the validation set. The dataset images are shown in Figure 4.
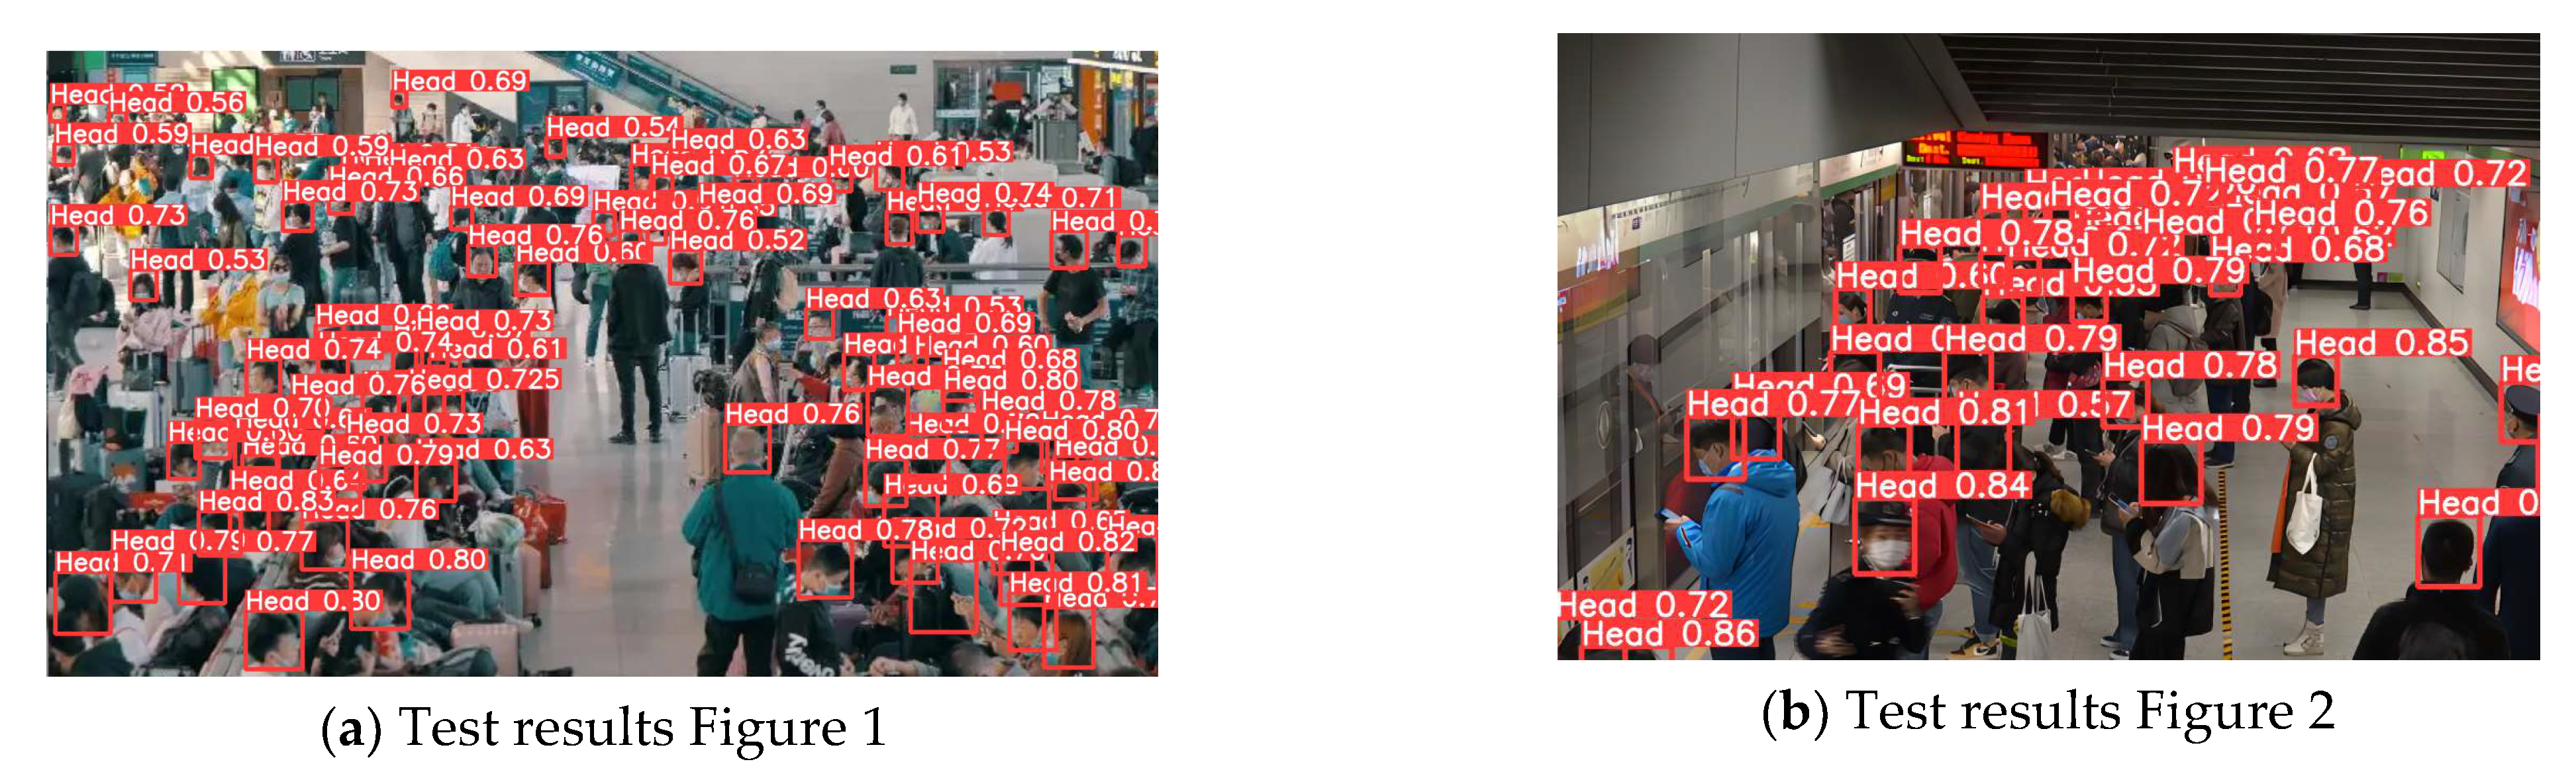
After determining the dataset, the images were next annotated one by one. The annotation principle was to annotate all the human head regions within the images as much as possible, and finally, the annotated dataset was imported into the network models of YOLOv5s and YOLOv5s-SE for training, after which the training models were obtained. We used the trained models to detect and validate the new images and randomly selected two maps of pedestrian head detection results from underground stations, as shown in Figure 5.
By analyzing Figure 5, we can obtain that YOLOv5s-SE can detect the head of a pedestrian relatively accurately in a dense crowd in an underground station, despite a large number of people and the relatively dense pedestrian population, and has a low miss detection rate, possessing ideal detection results. To further validate the performance of the model, this paper evaluates the trained network model by generally selecting the evaluation metrics of precision (P), recall (R), average precision (AP), and mean accuracy (mAP) [36]. The precision and recall are calculated as follows:
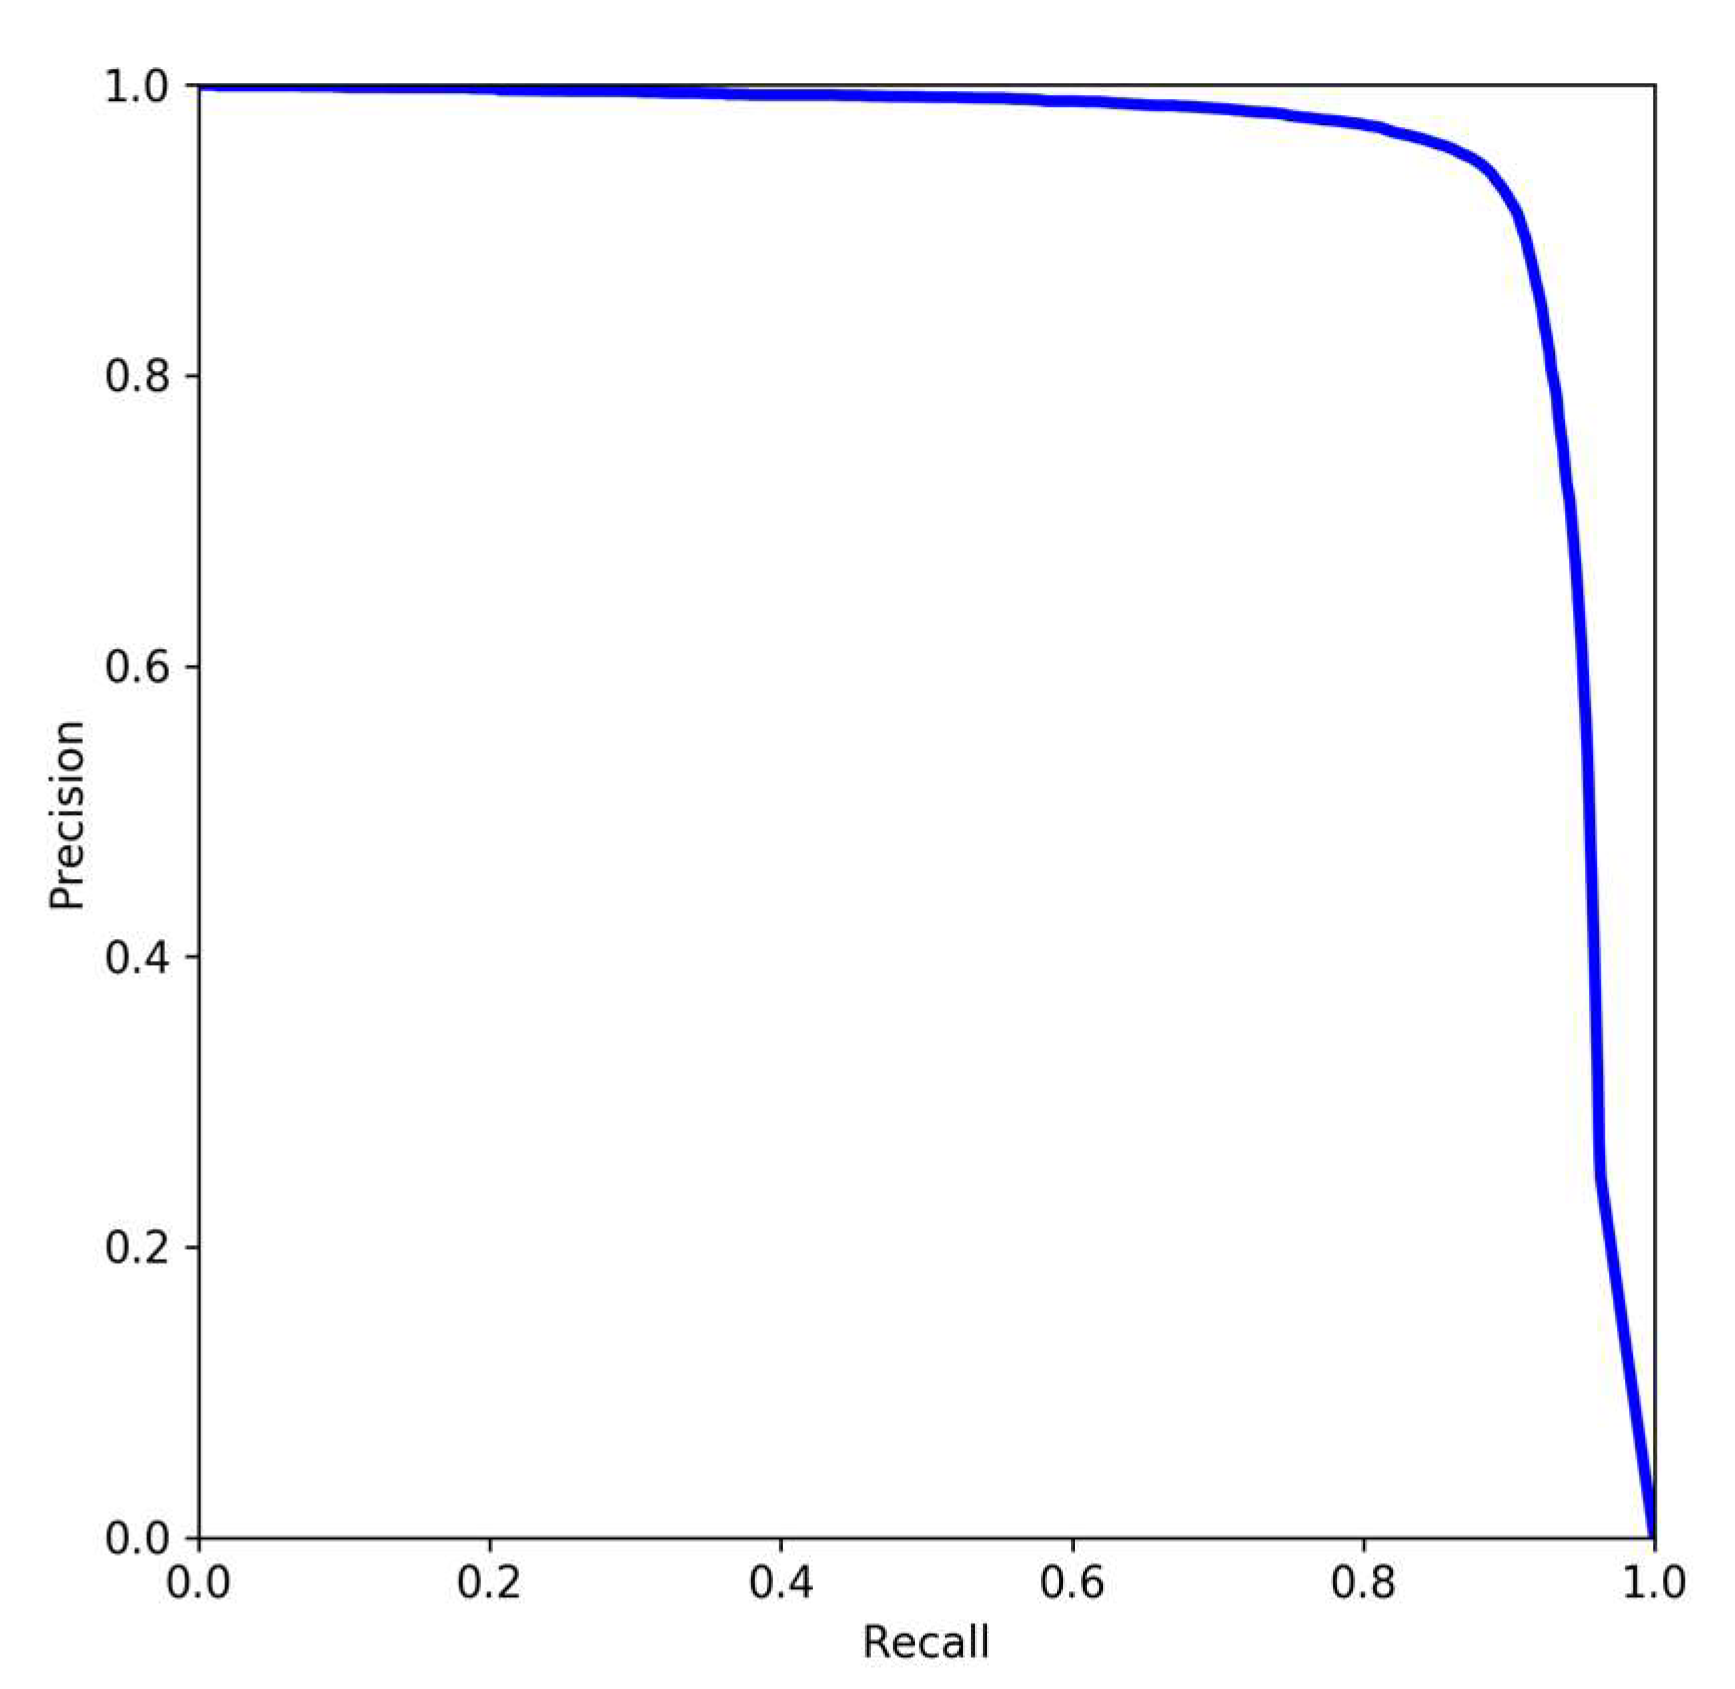
where TP denotes the number of correctly detected targets, FP denotes the number of incorrectly detected targets, and FN denotes the number of undetected samples. The accuracy-recall relationship based on the YOLOv5s-SE target detection model can be obtained by using equation. The precision–recall curve of the YOLOv5s-SE target detection model is shown in Figure 6.
By analyzing Figure 6, it can be found that the area under the precision–recall curve based on the YOLOv5s-SE target detection model can reach 0.958, which is a more desirable figure and proves that the model possesses high precision. In addition, the mean accuracy mean of the YOLOv5s-SE target detection model is obtained in this paper, and the mean accuracy mean is the average of multiple class APs. The mean accuracy and mean precision are calculated as follows:
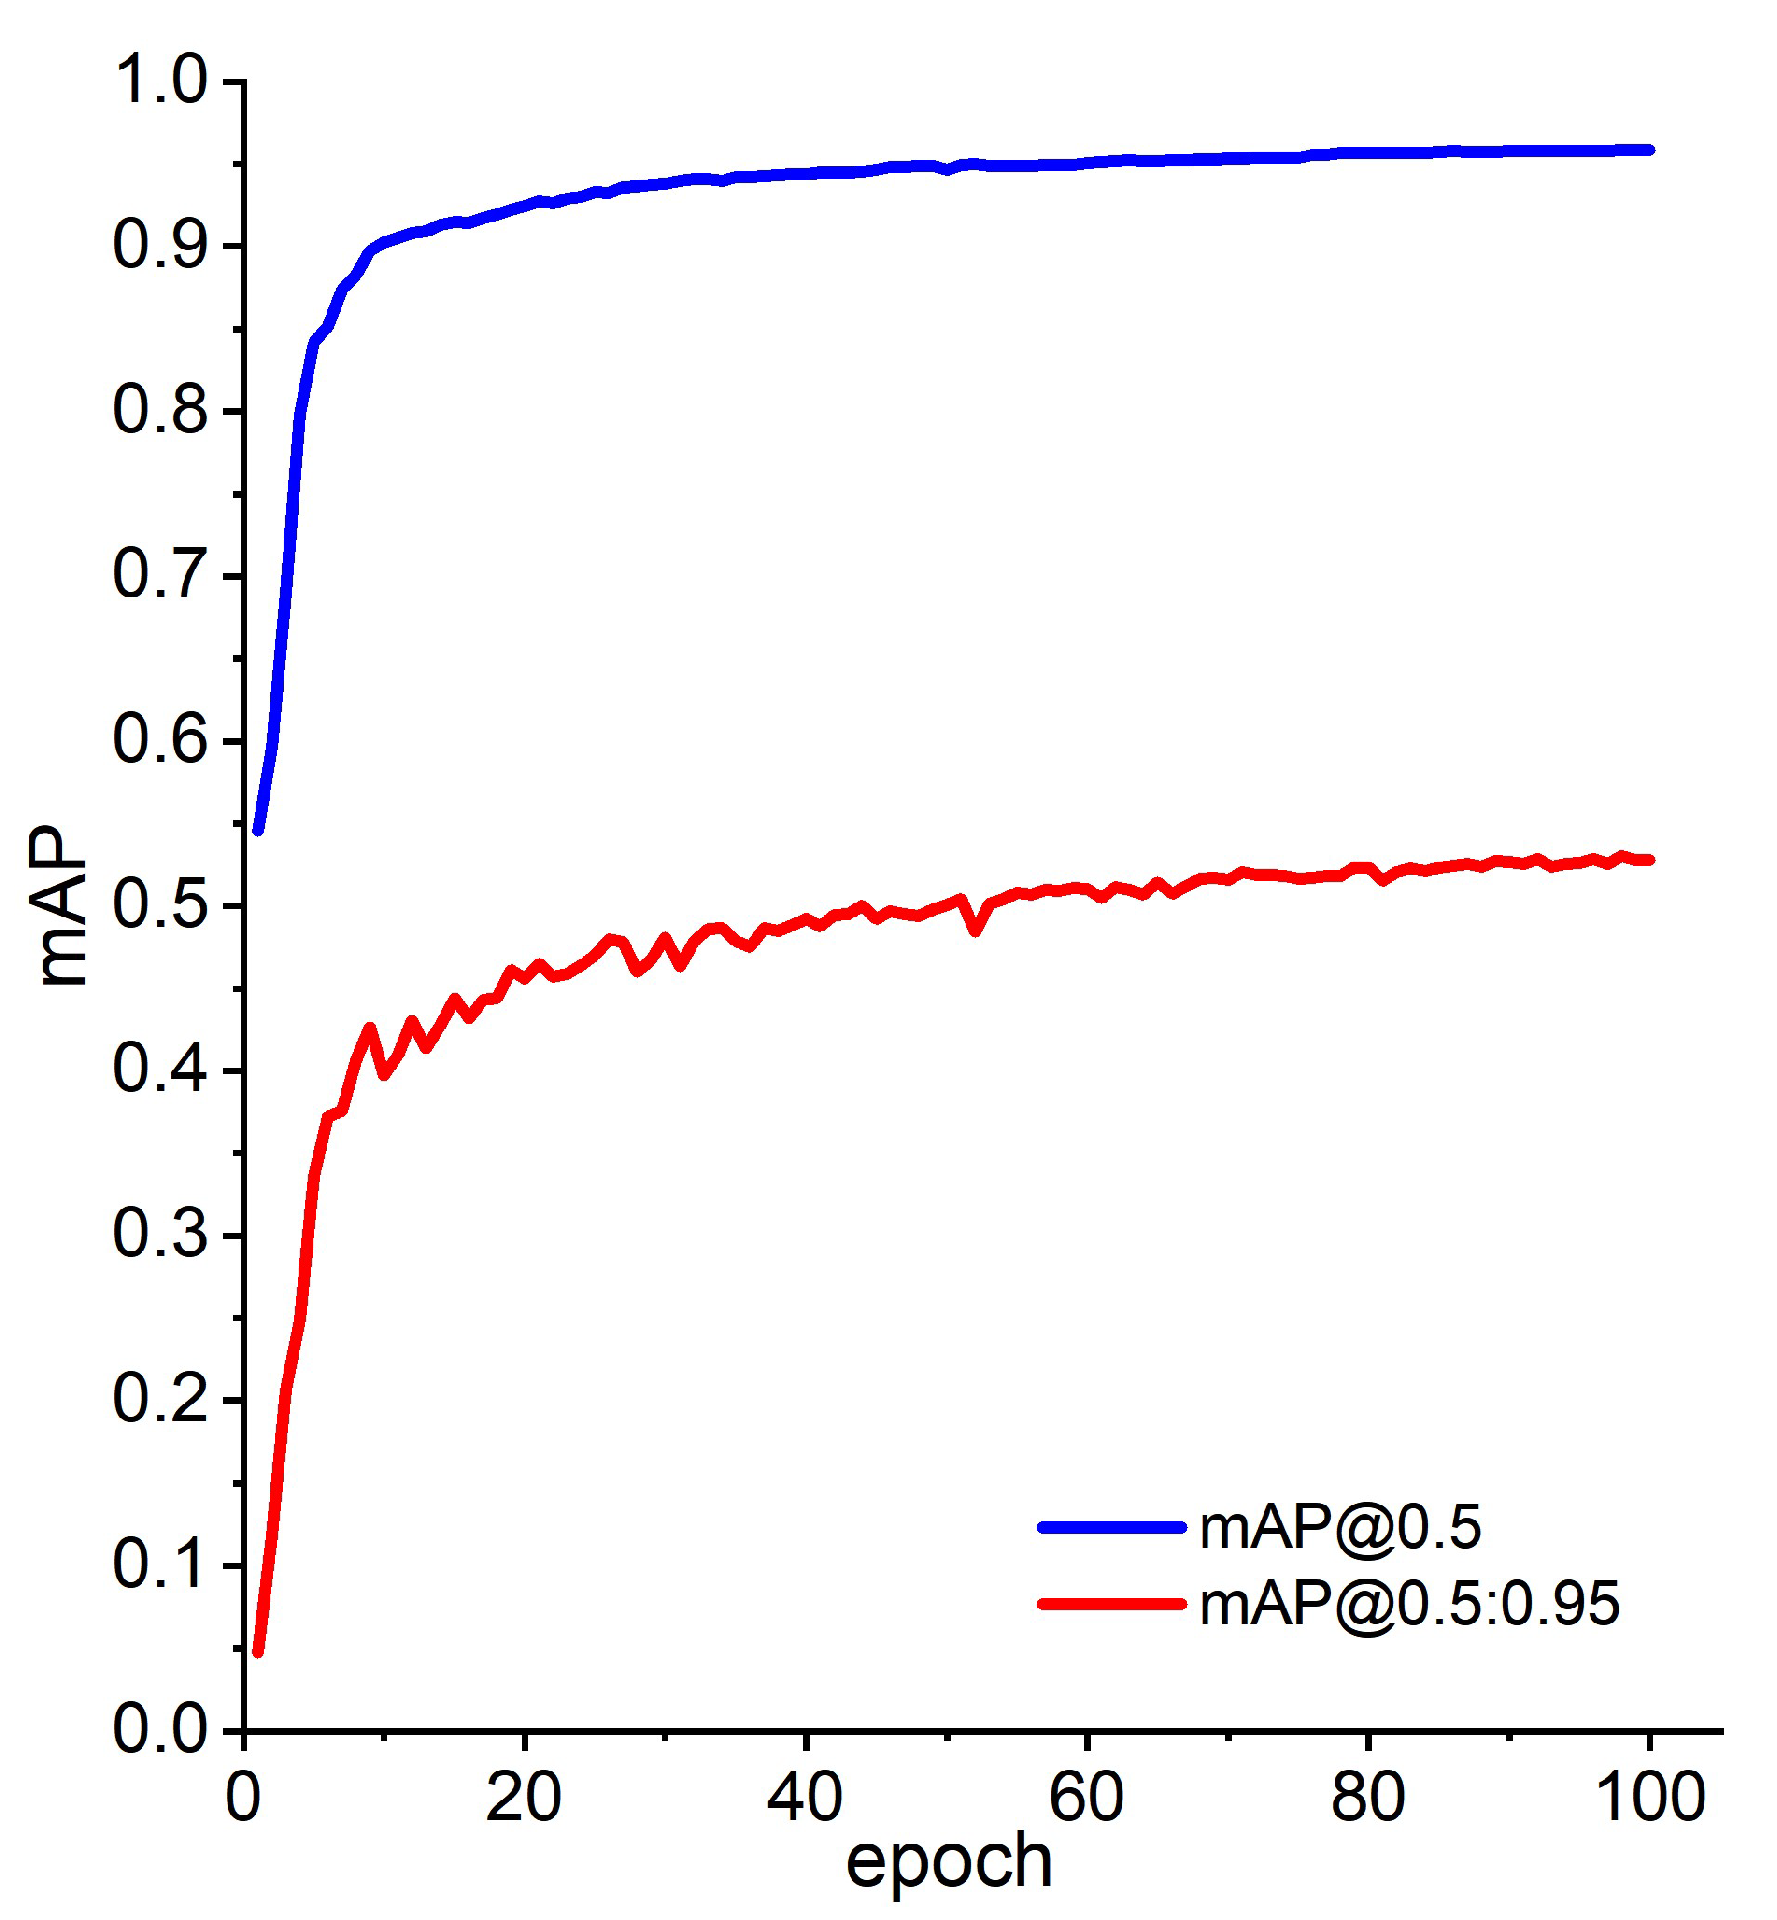
The mAP is one of the most important metrics in target detection algorithms, and its value is always in the interval [0, 1]. [email protected] is the average accuracy (IoU = 0.5), i.e., the average AP of all images under each category is calculated when the threshold IoU is set to 0.5. [email protected]:0.95 represents the average mAP over different IoU thresholds (0.5 to 0.95 in 0.05 steps, i.e., 0.5, 0.55, 0.6, 0.65, 0.7, 0.75, 0.8, 0.85, 0.9, 0.95). Larger values of mAP also demonstrate better network performance of the model. In this paper, the mAP curves based on the YOLOv5s-SE target detection model are shown in Figure 7.
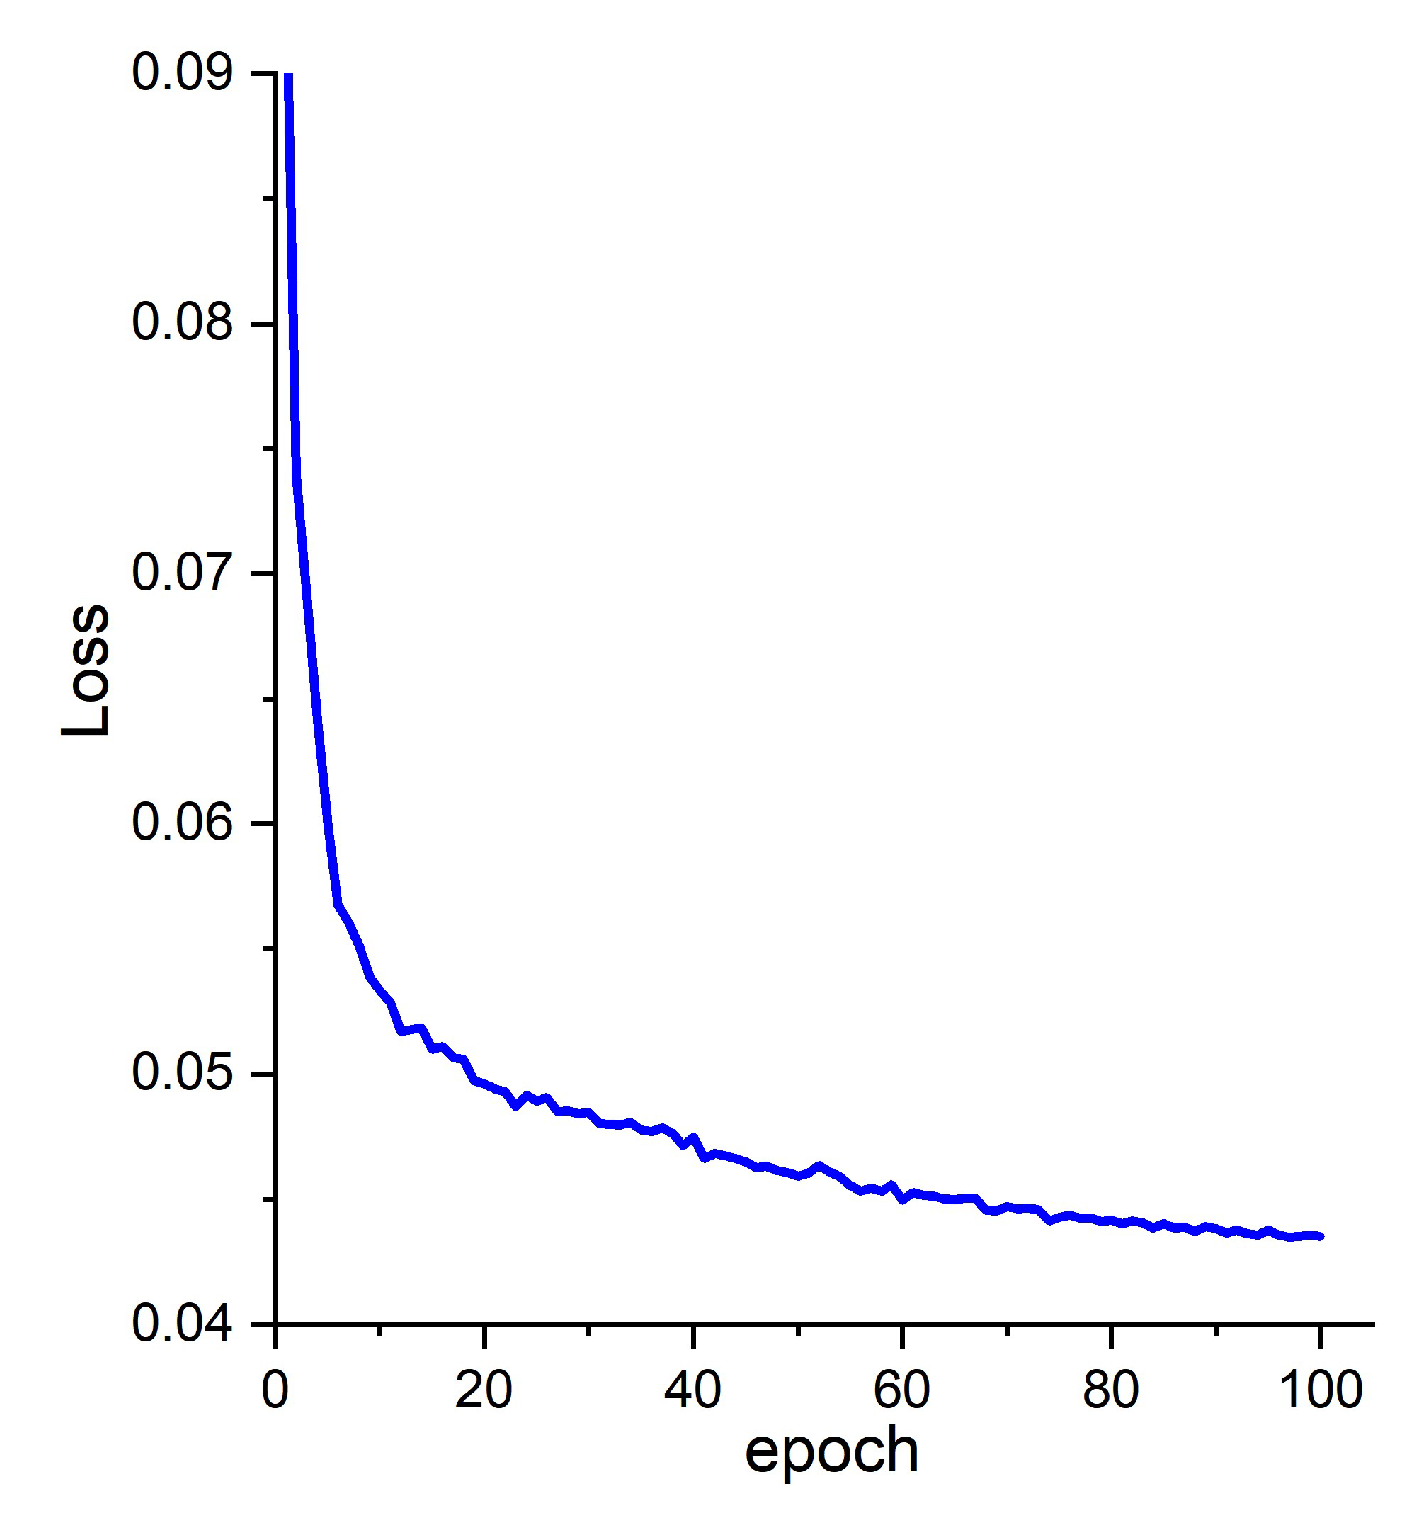
By looking at Figure 7, we can see that the values of [email protected] and [email protected]:0.95 increase with the number of training sessions. Ultimately, when the number of training sessions reaches 100, the value of [email protected] can reach 95.83%, while the value of [email protected]:0.95 can eventually reach 52.79%. Another important measure of network performance is the loss value, which measures the difference between actual network performance and perfect prediction when predicting the entire training image set. The loss function curves for this paper are shown in Figure 8.
It can be clearly seen from Figure 8 that the loss value gradually becomes smaller as the number of training times increases, and when the number of training times reaches about 30, the rate of decrease of the loss value gradually decreases, and the model starts to converge and level off. The experimental results show that the network model has relatively good network performance and can meet the needs of pedestrian head detection. Finally, we trained YOLOv4-Tiny, YOLOv5s, YOLOv7-Tiny, Faster-RCNN, and the improved YOLOv5s under the same dataset and compared them for their mAP and FPS. The comparison results are shown in Table 2.
Analysis of Table 2 shows that the [email protected] scores and FPS of YOLOv4-Tiny and YOLOv7-Tiny are both lower than the original YOLOv5s and are not suitable for application to data acquisition during emergency evacuation. Faster-RCNN has the highest [email protected] score, but its FPS is only 6.58, which is nearly 13 times lower than YOLOv5s and does not effectively solve the problems arising from traditional methods. The improved network model based on YOLOv5s proposed in this paper, although the FPS is 2.83 lower than the original YOLOv5s, has a [email protected] score that is 2.08% higher than the original YOLOv5s. Therefore, the improved YOLOv5s not only improves the accuracy of small target object detection, but also has excellent detection speed, which is very suitable for fast detection of pedestrians in emergency situations.
3.2. Analysis of Simulation Results Based on the Anylogic Emergency Evacuation Model
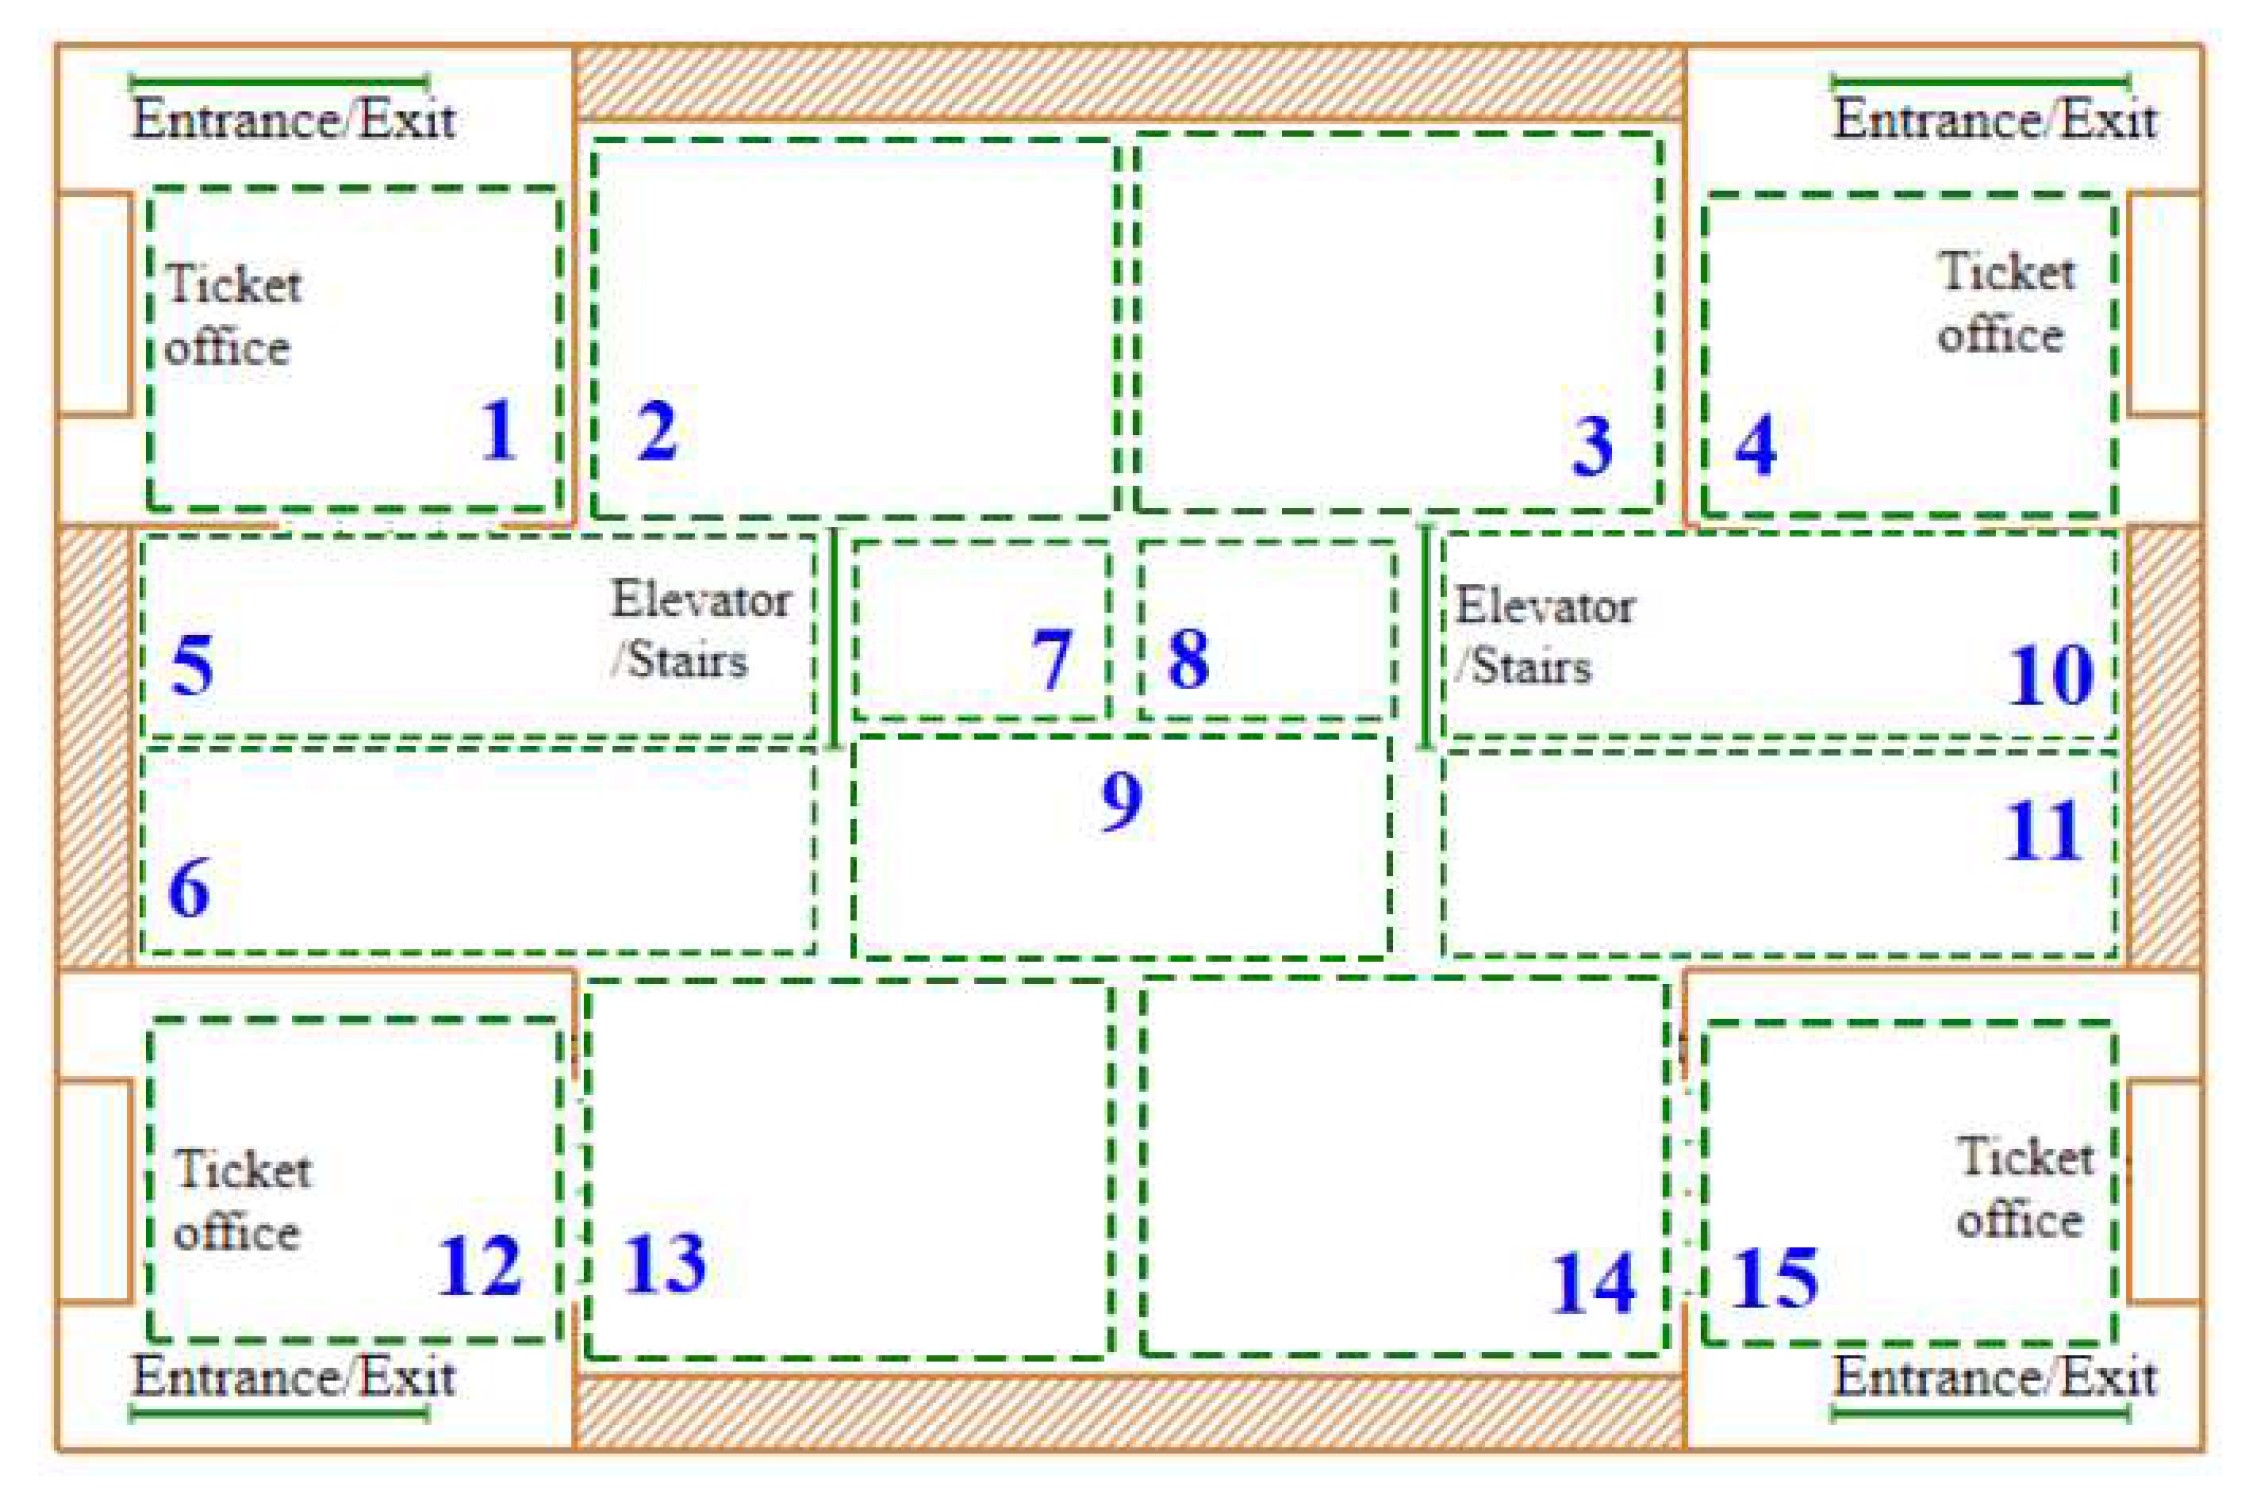
When YOLOv5 finishes detecting pedestrians in a specified area, it will output the number and location of pedestrians detected, and, at the same time, input the number and location of pedestrians obtained into the pre-built model in Anylogic. Since the detection field of view of a single camera inside a venue is limited, if we want to achieve detection of the whole venue, we need to install different cameras in different locations of the venue, so we have also set up many areas in In Anylogic, we also set up a number of areas to generate pedestrians, which all correspond to the areas detected by the cameras in the actual premises, as shown in Figure 9, where areas 1 to 15 are areas detected by different cameras, and when the cameras detect the number and location of pedestrians in the area, they will input them into the corresponding areas in Anylogic. At the start of the emergency evacuation simulation, these different areas will then generate pedestrians based on the actual detection results.
Anylogic’s simulation focuses on the process of simulating the movement of pedestrians within an underground station. This process can be achieved by setting the parameters of the PedSource, PedService, PedGoTo, and PedWait modules. Once the parameters are set, the pedestrian will follow the logic to enter the station, go through security checks, go downstairs, etc. To simulate the occurrence of an unexpected situation, an alarm button can be set in Anylogic. When an emergency occurs, pedestrians in this environment will quickly escape when the alarm button is pressed. In this paper, the pedestrian’s escape route is the nearest exit they have chosen for themselves. The logical judgment of this route can be achieved by setting variable parameters in the Anylogic software. After all the functional modules and logical relationships have been set up, the simulation experiments begin. The simulation runs start under normal conditions when the pedestrians are relatively distributed, as shown in Figure 9.
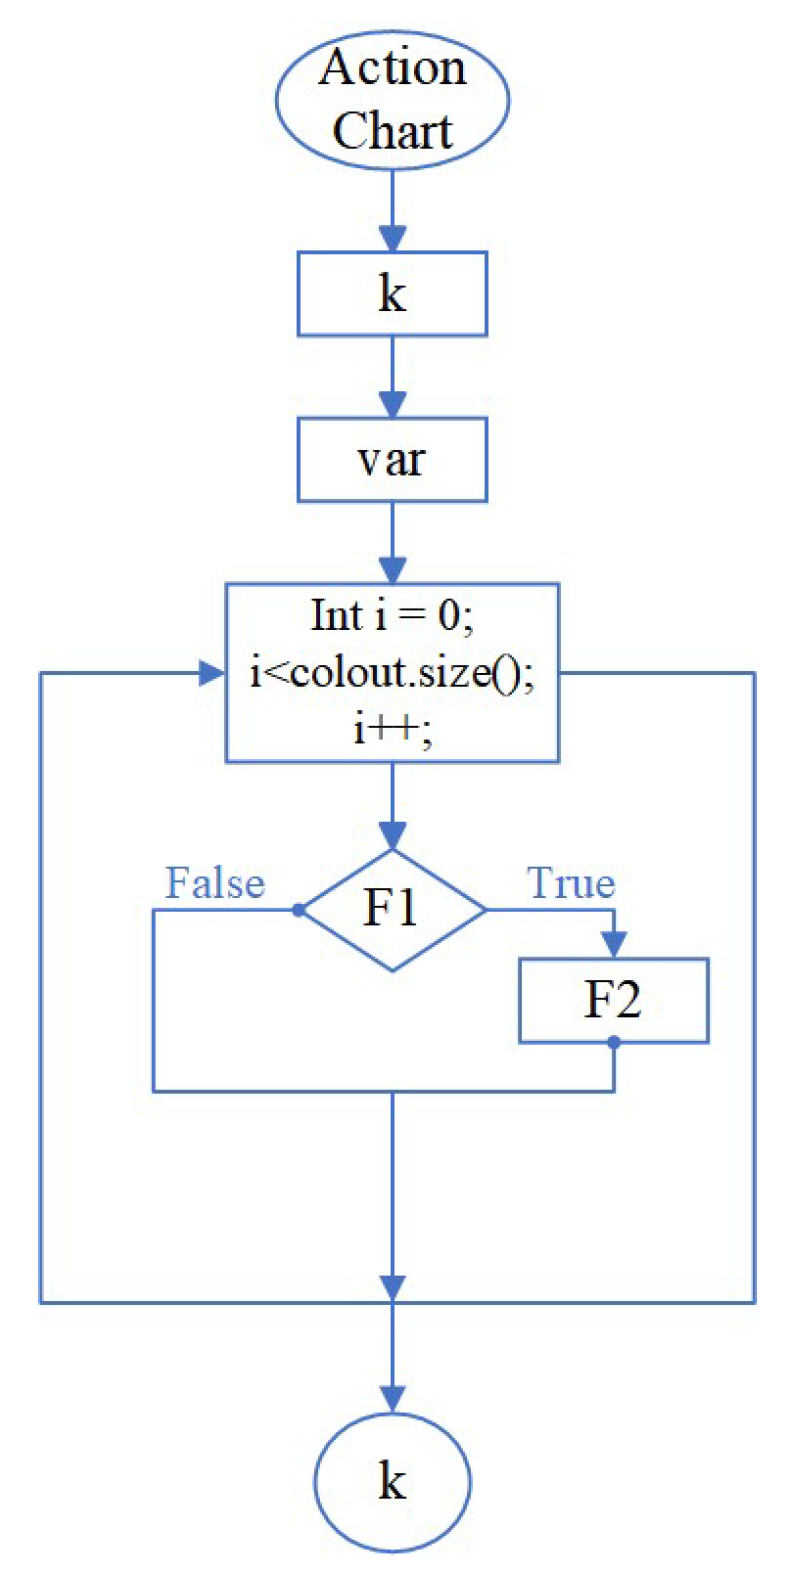
As shown in Figure 10, where the black objects are pedestrians, the appearance of the pedestrians can be modified by setting the smart body type, and the number of pedestrians on different floors or in different areas can also be set according to the actual situation. The pedestrians are randomly distributed in this area at the beginning of the operation and move according to the ride after it is activated. When an emergency occurs and the alarm button is triggered, pedestrians start evacuating according to the nearest exit. The shortest distance evacuation of pedestrians is achieved by setting the logic judgement module and pedestrian parameters in Anylogic, as shown in Figure 11.
F1 and F2 are shown in Equations (5) and (6), respectively.
ped.distanceTo(colOut.get(i).getX(), colOut.get(i).getY()) < var
var = ped.distanceTo(colOut.get(i).getX(), colOut.get(i).getY());
k = i;
k = i;
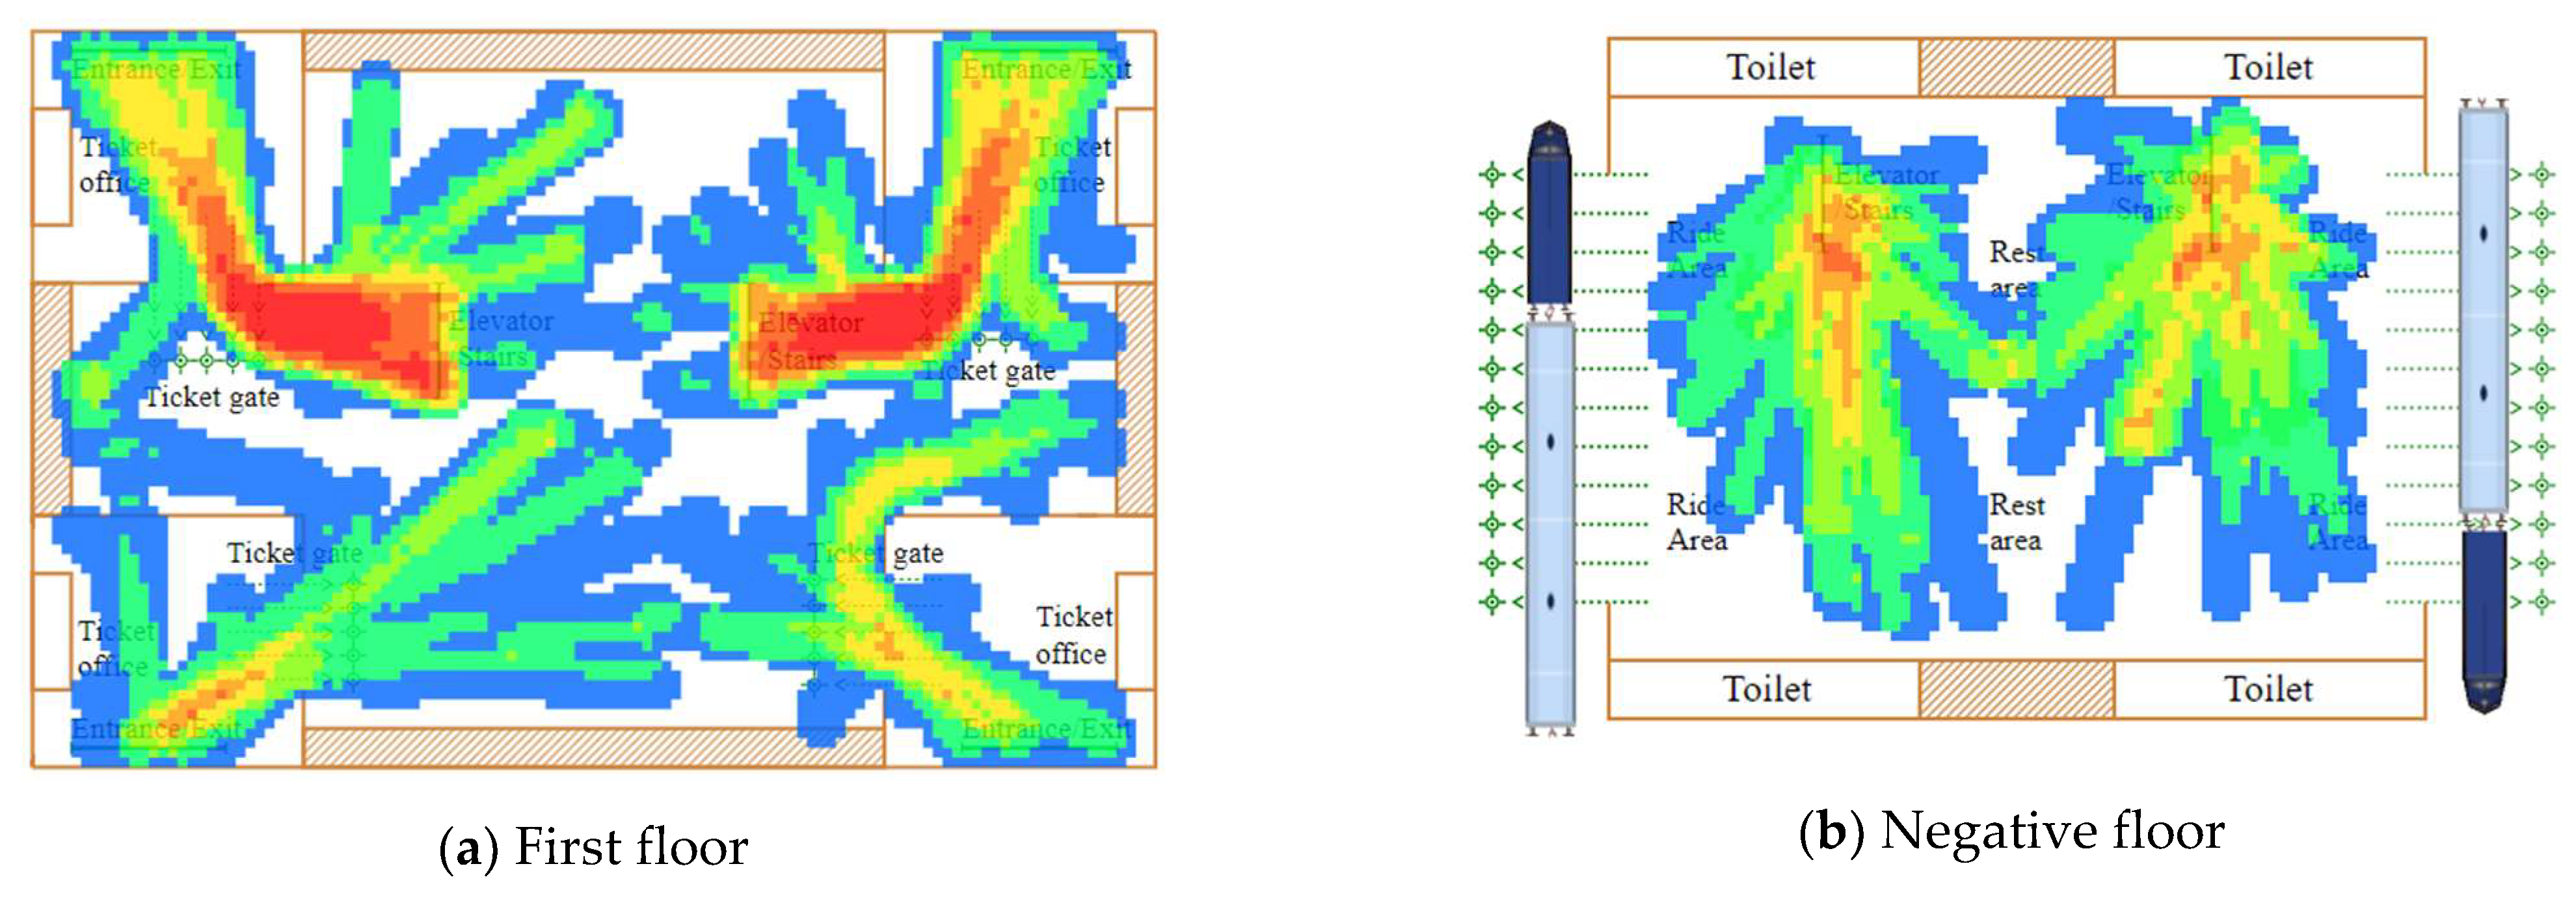
To achieve this function, we first set a local variable k and a large enough initial value var, and create a collection of all passable exits color, when the alarm button is triggered, pedestrians start to follow the process of selecting the exit they want to go to, first calculate the distance from the current position to the first exit, then compare the obtained distance with var, if the value is less than var then the value will be given to var, if the value is greater than var then go back to the previous step of the loop, to avoid the problem of infinite loops when comparing with var, we must set the value of var large enough to ensure that the value of var is always larger for the first time so that the pedestrian will compare the distance to each exit, at this time the value of I will also be equal to the value of the set of exits, jump out of the loop and outputs the value of k. The value of k is the nearest exit serial number, while the value of var is the distance from the pedestrian’s current position to exit k, i.e., the shortest distance. Following the above process, each pedestrian chooses the nearest exit or staircase to him or her. Once the evacuation route is determined, the pedestrian moves along that route. To see the trajectory of the pedestrian movement more clearly, we have added a pedestrian density map here, as shown in Figure 12.
The different colors in the simulation results represent different densities, from blue, green, yellow, and red, in four levels from small to large. Looking at Figure 7, we can see that pedestrians on the ground floor evacuate according to the nearest exit, while those on the negative floor go up the nearest stairs or lift first and then follow the nearest exit when they reach the ground floor. If an exit cannot be opened for a particular reason, it is also possible to delete or close that exit in the model and re-run the simulation to quickly obtain a new planned path. The results of this experiment also show that in unexpected situations, Anylogic can not only provide a quick evacuation plan but that the plan can also guide pedestrians away from the nearest exit.
4. Conclusions and Future Work
In this paper, we propose an emergency evacuation scheme based on a combination of YOLOv5s-SE target detection and Anylogic simulation. We first detect the head of a pedestrian inside a yard station by using the YOLOv5s target detection network. We added the SE attention mechanism to the YOLOv5s network and used both NWD and IoU metrics together to not only avoid the model converging too slowly, but also to improve the accuracy of the model for small target detection. To demonstrate the advantages of the improved YOLOv5s network, we compared the improved network with other advanced target detection networks, and the experimental results showed that the improved network model has higher detection accuracy and faster detection speed. Once the location of the pedestrians was determined, they were fed into Anylogic’s pre-built emergency evacuation model for simulation. The simulation results showed that pedestrians inside the yard station would eventually leave at the exit nearest to them, and those who were not on the ground floor would first reach the ground floor by the stairs nearest to them, and then follow the exit nearest to them. In practice, the simulation results can be communicated to pedestrians by means of screens, announcements, and staff inside the yard, guiding them to follow the simulated emergency evacuation route. The Anylogic-based emergency evacuation model is easy to modify, allowing staff to adapt the model to the actual situation on site and quickly simulate a new evacuation route. In summary, both the YOLOv5s target detection model and the Anylogicy emergency evacuation model are fast enough to provide a suitable solution within a short period of time after an emergency event and are well suited to the emergency evacuation of pedestrians within a yard.
Although the proposed method is able to detect pedestrians inside the station and simulate a reasonable emergency evacuation route, there are still areas for improvement. In terms of target detection, due to the complexity of the actual situation inside the station, there are still some missed detections. In terms of emergency evacuation simulation, the method only achieves the shortest distance for pedestrians under reasonable circumstances but does not take into account the impact on evacuation caused by unreasonable behavior of pedestrians due to fear and other psychological factors during actual emergencies.
In future research, on the one hand, the number of target detection datasets needs to be expanded, and a better-performing target detection model needs to be trained through continuous attempts to improve the network structure. On the other hand, the psychological factors of pedestrians, personality factors, and interactions between pedestrians will be taken into account in the emergency evacuation model to further improve the structure of the model and simulate the emergency evacuation process more realistically.
Author Contributions
Conceptualization, C.N.; Data curation, C.N., W.W. and H.G.; Formal analysis, C.N.; Funding acquisition, K.L.; Investigation, C.N.; Methodology, C.N.; Project administration, C.N.; Resources, C.N.; Software, C.N.; Supervision, K.L.; Validation, K.L.; Visualization, C.N.; Writing—original draft, C.N.; Writing—review and editing, C.N., W.W. and H.G. All authors have read and agreed to the published version of the manuscript.
Funding
This research was funded by the Science and Technology Research Project of the Jilin Provincial Education Department, grant number JJKH20220057KJ.
Institutional Review Board Statement
Not applicable.
Informed Consent Statement
Not applicable.
Data Availability Statement
Data openly available in a public repository.
Conflicts of Interest
The authors declare no conflict of interest.
References
- Hankin, B.D.; Wright, R.A. Passenger Flow in Subways. J. Oper. Res. Soc. 1958, 9, 81–88. [Google Scholar] [CrossRef]
- Bryan, J.L. Human behavior in fire: The development and maturity of a scholarly study. Fire Mater. 1999, 23, 249–253. [Google Scholar] [CrossRef]
- Pauls, J. Personal perspective on research, consulting and codes/standards development in fire-related human behaviour, 1969–1999, with an emphasis onspace and time factors. Fire Mater. 1999, 23, 265–272. [Google Scholar] [CrossRef]
- Zhang, S.-P.; Jing, Y.-J. Research of evacuation crowd in the business hall of large department stores. Fire Sci. Technol. 2004, 23, 133–136. [Google Scholar]
- Zhong, G.; Zhai, G.; Bi, X.; Ge, Y. Study of the Behaviour of the Campus Crowd during Emergent Evacuationand Its Influential Factors. J. Seismol. Res. 2022, 45, 150–159. [Google Scholar]
- Guo, Y.; He, L.; Shi, J.-H.; Xiao, G.-Q. Questionnaire research on the evacuation behavior characteristics of different crowds in subway. J. Saf. Sci. Technol. 2012, 8, 183–188. [Google Scholar]
- Thompson, P.A.; Marchant, E.W. A computer model for the evacuation of large building populations. Fire Saf. J. 1995, 24, 131–148. [Google Scholar] [CrossRef]
- Yuan, J.-P.; Fang, Z.; Yin, Z.-C.; Lo, S.-M. Combined Network Model for Occupant Evacuation in Building Fires. J. Civil Archit. Environ. Eng. 2009, 31, 90–94, 99. [Google Scholar]
- Song, W.; Zhang, J.; Xu, X. A lattice gas model for evacuation of people taking into account the distribution characteristics of the number of people. Prog. Nat. Sci. 2008, 552–558. [Google Scholar]
- Wang, Y.-H. Virtual assessment model on emergency evacuation capacity of Beijing subway based on BP neural network algorithm. J. Saf. Sci. Technol. 2012, 8, 5–10. [Google Scholar]
- Yang, Z.-S.; Song, S.-M.; Du, P.-C.; Yang, W. Traffic guidance evacuation model under the emergency state in public place. J. Jilin Univ. (Eng. Technol. Ed.) 2012, 42, 588–593. [Google Scholar]
- Duan, X.-H.; Wu, J.-X.; Zhou, Z.-Q. Collaborative Decision-making of Emergency Vehicle Scheduling and Traffic Evacuation Based on Bi-level Bat Algorithm. J. Transp. Syst. Eng. Inf. Technol. 2020, 20, 157–165. [Google Scholar]
- Cheng, Y.; Liu, X. Pesonnel Emergency Evacuation Simulation Modeling of Cultural Relic Scenic Spot Based on Social Force Model. Saf. Environ. Eng. 2023, 1–10. [Google Scholar]
- Qi, X.-Y.; Li, W.-L.; Liu, J. Emergency Evacuation of Terminal Building Considering Non-adaptive Evacuation Behavior. Sci. Technol. Eng. 2023, 23, 3106–3114. [Google Scholar]
- Cao, S.; Sun, Y.; Song, Z.; Zhang, J. Evacuation route planning for traditional village buildings under fire. Fire Sci. Technol. 2023, 42, 69–74. [Google Scholar]
- Hsu, Y.T.; Peeta, S. An aggregate approach to model evacuee behavior for no-notice evacuation operations. Transportation 2013, 40, 671–696. [Google Scholar] [CrossRef]
- Albis, K.A.; Gawad, A.F.A.; Radhwi, M.N. Fire Dynamics Simulation and Evacuation for a Large Shopping Center (Mall), Part II, Evacuation Scenarios. Am. J. Energy Eng. 2015, 3, 72–78. [Google Scholar] [CrossRef]
- Ghasemi, P.; Khalili-Damghani, K.; Hafezolkotob, A.; Raissi, S. Uncertain multi-objective multi-commodity multi-period multi-vehicle location-allocation model for earthquake evacuation planning. Appl. Math. Comput. 2019, 350, 105–132. [Google Scholar] [CrossRef]
- El-Aal, A.F.A.; Zaglool, A.; Kandil, M.M. Safest and Shortest Exit Algorithm for NPP Fire Evacuation. Appl. Eng. 2021, 5, 36–43. [Google Scholar] [CrossRef]
- Redmon, J.; Divvala, S.; Girshick, R.; Farhadi, A. You Only Look Once: Unified, Real-Time Object Detection. Comput. Vis. Pattern Recognit. 2016, arXiv:1506.02640. [Google Scholar]
- Redmon, J.; Farhadi, A. YOLO9000: Better, Faster, Stronger. In Proceedings of the IEEE Conference on Computer Vision & Pattern Recognition, Honolulu, HI, USA, 21–26 July 2017; pp. 6517–6525. [Google Scholar]
- Redmon, J.; Farhadi, A. YOLOv3: An Incremental Improvement. arXiv 2018, arXiv:1804.02767. [Google Scholar]
- Bochkovskiy, A.; Wang, C.Y.; Liao, H. YOLOv4: Optimal speed and accuracy of object detection. In Proceedings of the IEEE Conference on Computer Vision and Pattern Recognition (CVPR), Seattle, WA, USA, 13–19 June 2020. [Google Scholar]
- Sun, G.; Wang, S.; Xie, J. An Image Object Detection Model Based on Mixed Attention Mechanism Optimized YOLOv5. Electronics 2023, 12, 1515. [Google Scholar] [CrossRef]
- Zhao, Q.; Ma, W.; Zheng, C.; Li, L. Exploration of Vehicle Target Detection Method Based on Lightweight YOLOv5 Fusion Background Modeling. Appl. Sci. 2023, 13, 4088. [Google Scholar] [CrossRef]
- Hu, J.; Shen, L.; Albanie, S.; Sun, G.; Wu, E. Squeeze-and-Excitation Networks. IEEE Trans. Pattern Anal. Mach. Intell. 2019, 42, 2011–2023. [Google Scholar] [CrossRef] [PubMed]
- Wang, C.Y.; Liao, H.Y.M.; Yeh, I.H.; Wu, Y.H.; Chen, P.Y.; Hsieh, J.W. CSPNet: A New Backbone That Can Enhance Learning Capability of CNN. In Proceedings of the 2020 IEEE/CVF Conference on Computer Vision and Pattern Recognition Workshops (CVPRW), Seattle, WA, USA, 14–19 June 2020. [Google Scholar]
- Lin, T.Y.; Dollár, P.; Girshick, R.; He, K.; Hariharan, B.; Belongie, S. Feature Pyramid Networks for Object Detection. In Proceedings of the 2017 IEEE Conference on Computer Vision and Pattern Recognition (CVPR), Honolulu, HI, USA, 21–26 July 2017; pp. 936–944. [Google Scholar]
- Liu, S.; Qi, L.; Qin, H.; Shi, J.; Jia, J. Path Aggregation Network for Instance Segmentation. In Proceedings of the 2018 IEEE/CVF Conference on Computer Vision and Pattern Recognition, Salt Lake City, UT, USA, 18–22 June 2018; pp. 8759–8768. [Google Scholar]
- He, K.; Zhang, X.; Ren, S.; Sun, J. Spatial pyramid pooling in deep convolutional networks for visual recognition. IEEE Trans. Pattern Anal. Mach. Intell. 2015, 37, 1904–1916. [Google Scholar] [CrossRef]
- Wang, J.; Xu, C.; Yang, W.; Yu, L. A Normalized Gaussian Wasserstein Distance for Tiny Object Detection. arXiv 2021, arXiv:2110.13389. [Google Scholar]
- Cen, Y. Research and Simulation Optimization on the Transfer between Suburban Railway and Urban Rail Transit within the Same Platform. Master’s Thesis, Beijing Jiaotong University, Beijing, China, 2018. [Google Scholar]
- Ma, P. AnyLogic-Based Simulation of Air Logistics Park Planning and Its Optimization. Master’s Thesis, Tiangong University, Tianjin, China, 2019. [Google Scholar]
- Chasanah, F.; Sakakibara, H. Implication of Mutual Assistance Evacuation Model to Reduce the Volcanic Risk for Vulnerable Society: Insight from Mount Merapi, Indonesia. Sustainability 2022, 14, 8110. [Google Scholar] [CrossRef]
- Avdeeva, M.; Uzun, O.; Borodkina, Y. Simulation of the Evacuation Process at Various Economic Facilities Using the Anylogic Software Product. E3S Web Conf. 2020, 175, 11031. [Google Scholar] [CrossRef]
- Wang, Y.; Ding, H.; Li, B.; Yang, Z.; Yang, J. Mask Wearing Detection Algorithm Based on Improved YOLOv3 in Complex Scenes. Comput. Eng. 2020, 46, 12–22. [Google Scholar]
Figure 1.
Improved YOLOv5s network architecture.

Figure 2.
SE-Net network structure diagram.

Figure 3.
Subway station layout map.

Figure 4.
Dataset images.

Figure 5.
Graph of test results for YOLOv5s-SE.

Figure 6.
Precision–recall curve.

Figure 7.
mAP curve.

Figure 8.
Loss curve.

Figure 9.
Camera detection area.

Figure 10.
Anylogic simulation run chart.

Figure 11.
Shortest distance selection flow chart.

Figure 12.
Emergency evacuation pedestrian density map.


Table 1.
Introduction to Anylogic’s common pedestrian library modules.
| Module Name | Description |
|---|---|
| PedSource | Generate pedestrians, and by setting parameters, pedestrians entering the building can be simulated |
| PedService | Pedestrians will receive services at service points to simulate security checks, ticket purchases, and other actions |
| PedGoTo | Guiding pedestrians to designated areas |
| PedWait | Directs pedestrians to designated areas and sets waiting times |
| PedEnter | Pedestrian entry module, which can simulate pedestrian entry from other floors or areas |
| PedExit | Pedestrian departure module, which can simulate the departure of pedestrians from the current floor or area |
| Pedsink | Indicates the end of pedestrian flow, simulating pedestrians leaving the current scene |
Table 2.
Comparison of test results of YOLOv4-Tiny, YOLOv5s, YOLOv7-Tiny, Faster-RCNN, and the improved method.
Table 2.
Comparison of test results of YOLOv4-Tiny, YOLOv5s, YOLOv7-Tiny, Faster-RCNN, and the improved method.
| Method | [email protected] | FPS |
|---|---|---|
| YOLOv4-Tiny | 83.97% | 27.29 |
| YOLOv5s | 93.75% | 79.32 |
| YOLOv7-Tiny | 92.84% | 60.24 |
| Faster-RCNN | 96.77% | 6.58 |
| Improved YOLOv5s | 95.83% | 76.49 |
Disclaimer/Publisher’s Note: The statements, opinions and data contained in all publications are solely those of the individual author(s) and contributor(s) and not of MDPI and/or the editor(s). MDPI and/or the editor(s) disclaim responsibility for any injury to people or property resulting from any ideas, methods, instructions or products referred to in the content. |
© 2023 by the authors. Licensee MDPI, Basel, Switzerland. This article is an open access article distributed under the terms and conditions of the Creative Commons Attribution (CC BY) license (https://creativecommons.org/licenses/by/4.0/).
Share and Cite
MDPI and ACS Style
Niu, C.; Wang, W.; Guo, H.; Li, K. Emergency Evacuation Simulation Study Based on Improved YOLOv5s and Anylogic. Appl. Sci. 2023, 13, 5812. https://0-doi-org.brum.beds.ac.uk/10.3390/app13095812
AMA Style
Niu C, Wang W, Guo H, Li K. Emergency Evacuation Simulation Study Based on Improved YOLOv5s and Anylogic. Applied Sciences. 2023; 13(9):5812. https://0-doi-org.brum.beds.ac.uk/10.3390/app13095812
Chicago/Turabian StyleNiu, Chuanxi, Weihao Wang, Hebin Guo, and Kexin Li. 2023. "Emergency Evacuation Simulation Study Based on Improved YOLOv5s and Anylogic" Applied Sciences 13, no. 9: 5812. https://0-doi-org.brum.beds.ac.uk/10.3390/app13095812
Note that from the first issue of 2016, this journal uses article numbers instead of page numbers. See further details here.