
A Percentile Method to Determine Cold Days and Spells in Bangladesh


1
Department of Physics, Khulna University of Engineering & Technology, Khulna 9203, Bangladesh
2
Schulich School of Engineering, University of Calgary, Calgary, AB T2N 1N4, Canada
*
Author to whom correspondence should be addressed.
Appl. Sci. 2023, 13(12), 7030; https://0-doi-org.brum.beds.ac.uk/10.3390/app13127030
Submission received: 25 April 2023
/
Revised: 8 June 2023
/
Accepted: 9 June 2023
/
Published: 11 June 2023
(This article belongs to the Special Issue New Directions in Hazard and Disaster Science: Advances in Applied Sciences II)
Abstract
:The 10th percentiles (10P) of the daily minimum (Tmin) and maximum (Tmax) during 1971–2000 were determined to estimate a threshold for cold days. This 10P (a standard of extreme climatic condition suggested by the World Meteorological Organization) threshold was applied with the daily Tmin and Tmax in the winter months (December, January, and February) of 2000 to 2021 to calculate the number of cold days, and consecutively, cold spells, and their trends. A cold day was declared when the daily Tmax and/or Tmin was lower than that of the 10P threshold, and the average temperature was ≤17 °C in a weather station. In this research, the cold days and spells were categorized into five classes, namely extreme (≤13 °C), severe (>13–14 °C), very (>14–15 °C), moderate (>15–16 °C), and Mild (>16–17 °C). Moreover, a cold spell was considered when such cold days persisted for ≥2 consecutive days in at least two nearby stations. The results revealed a higher number of average cold days during winter in the western and northwestern districts of Bangladesh, and it reduced gradually in the south, southeast, and northeast. Dinajpur and Rajshahi districts showed the highest number of extreme and severe categories of cold days, i.e., 4.81 and 3.24 days/year, respectively. Rajshahi division had the highest number of cold spells on average (3.24/year), and Rangpur division had the highest number of extreme-category (the category that carries the lowest temperature range, ≤13 °C) cold spells (1.29/year). January was the coldest month, with the maximum number of cold days and spells. The highest average number of cold days (25.54%) was observed during the second ten days of January (i.e., 11–20 January). Significant increasing trends were found in the cold days of 11–20 December (5 stations), 21–31 December (3 stations), and the month of December (13 stations). In contrast, significant decreasing trends were noticed for the 1–10 January period in three weather stations. Our proposed 10P method could be used to determine the cold days and spells in Bangladesh that might be useful for the policy makers in formulating appropriate strategies in minimizing the impact of cold regimes during the winter season.
1. Introduction
Cold days and spells in the winter season are considered a natural disaster in many subtropical countries of the globe, including Bangladesh. Such a cold phenomenon is often accompanied by a sudden drop in air temperature, sometimes within a single day. The cold severity in Bangladesh during winter depends on several factors, which vary with space and time [1,2], including (i) high wind speed, (ii) high relative humidity, (iii) less solar radiation in winter, and (iv) cold waves from the north and northwest from the Himalayas. In fact, the country suffers from cold severity every winter, which has a devastating effect on the country’s economy. It disrupts the transportation sectors, especially waterways; causes extensive damage to agricultural crops; and impacts tourism [3]. Moreover, every winter, cold-related diseases such as pneumonia, asthma, diarrhea, influenza, respiratory complications, and cardiovascular diseases threaten public health [4,5,6]. In many cases, these diseases are the cause of death (mortality), especially for children, the elderly, and homeless people [4,7,8,9]. The mortality increases dramatically (two to three times) when the temperature exceeds a threshold value, for example, 34 °C in Shanghai [10]. Cold weather becomes more detrimental at the beginning of winter season because people are not well prepared and do not take any preventive measures against the cold at that time [11]. Recently, extreme weather events, including cold spells, are experiencing an increase, not only in intensity, but also in frequency, because of climate change [12,13,14,15]. Residents of altitudes and higher latitudes, with longer winters, are generally well prepared to deal with cold and their related effects [16]. However, countries located in the subtropical regions, such as Bangladesh, with a shorter winter season, are relatively less prepared to deal with the cold [17]. In addition, research related to cold weather phenomena has been carried out in developed countries more than in developing countries [17]. Thus, it is critical to conduct research on cold weather events in Bangladesh to address the adverse effects of cold days/spells that would facilitate policy development and adaptation strategies in minimizing mortality during the winter season.
To define cold days/spells, one of the simplified methods is to use a single threshold of a specific air temperature corresponding to the daily maximum (Tmax), minimum (Tmin), or average (Tavg) temperature [6,18,19]. Using such a single threshold of temperature for a country creates some issues, which are not appropriate for the following instances: (i) large waterbodies being present in some parts of a country [20], as areas adjacent to waterbodies usually have mild temperature; (ii) countries spanning over a larger range of latitudes [21,22], as higher latitudes predominate relatively cooler temperatures [23,24]; and (iii) diverse topography, which produces temperature variations, even in cases of narrow latitude [25]. In Bangladesh, a single Tmin threshold of ≤10 °C is used for the whole country to define a cold day, and a cold spell is declared when at least two nearby weather stations show three and more consecutive cold days [26,27]. Generally, northwestern and western regions of Bangladesh experience relatively low temperatures in the winter season compared to the rest of the country, especially the southeastern and southern regions close to the Bay of Bengal [4,28]. A fixed air temperature threshold is used to define cold days/spells in the case of long-term temperature data unavailability; however, the data are available now. Therefore, it is necessary to change the conventional method and introduce a contemporary method (e.g., relative approach) to determine the cold days/spells and their severity in the winter season in Bangladesh.
Relative methods, such as (i) standard deviation (SD), and (ii) percentile methods, are contemporary and commonly used in the literature to identify cold days using long-term temperature data. These approaches have significant advantages over the fixed threshold method of detecting cold days. For instance, (i) they identify extreme events more accurately and (ii) they provide proper analysis and comparison of the results [29]. In the SD method, long-term temperature data are used to calculate the daily normal and deviation (σ). Different SD values (e.g., 3, 2, 1.5, 1.25, and 1) are used to define cold days in different regions of the world. Furthermore, researchers have used the 1st, 3rd, 5th, and 10th percentiles of Tmax, Tmin, and/or Tavg over the long-term temperature data to identify cold days and spells in different regions and countries (see Table 1).
Here, the objective of this research is to implement the widely used percentile method (e.g., 10 percentile) to (i) determine the number of cold days and spells and (ii) perform their trend analyses using the Mann–Kendall (MK) test [42] and Sen’s slope estimator (SSE) [43], during the winter season in Bangladesh over the period 2000–2021.
2. Materials and Methods
2.1. Study Area
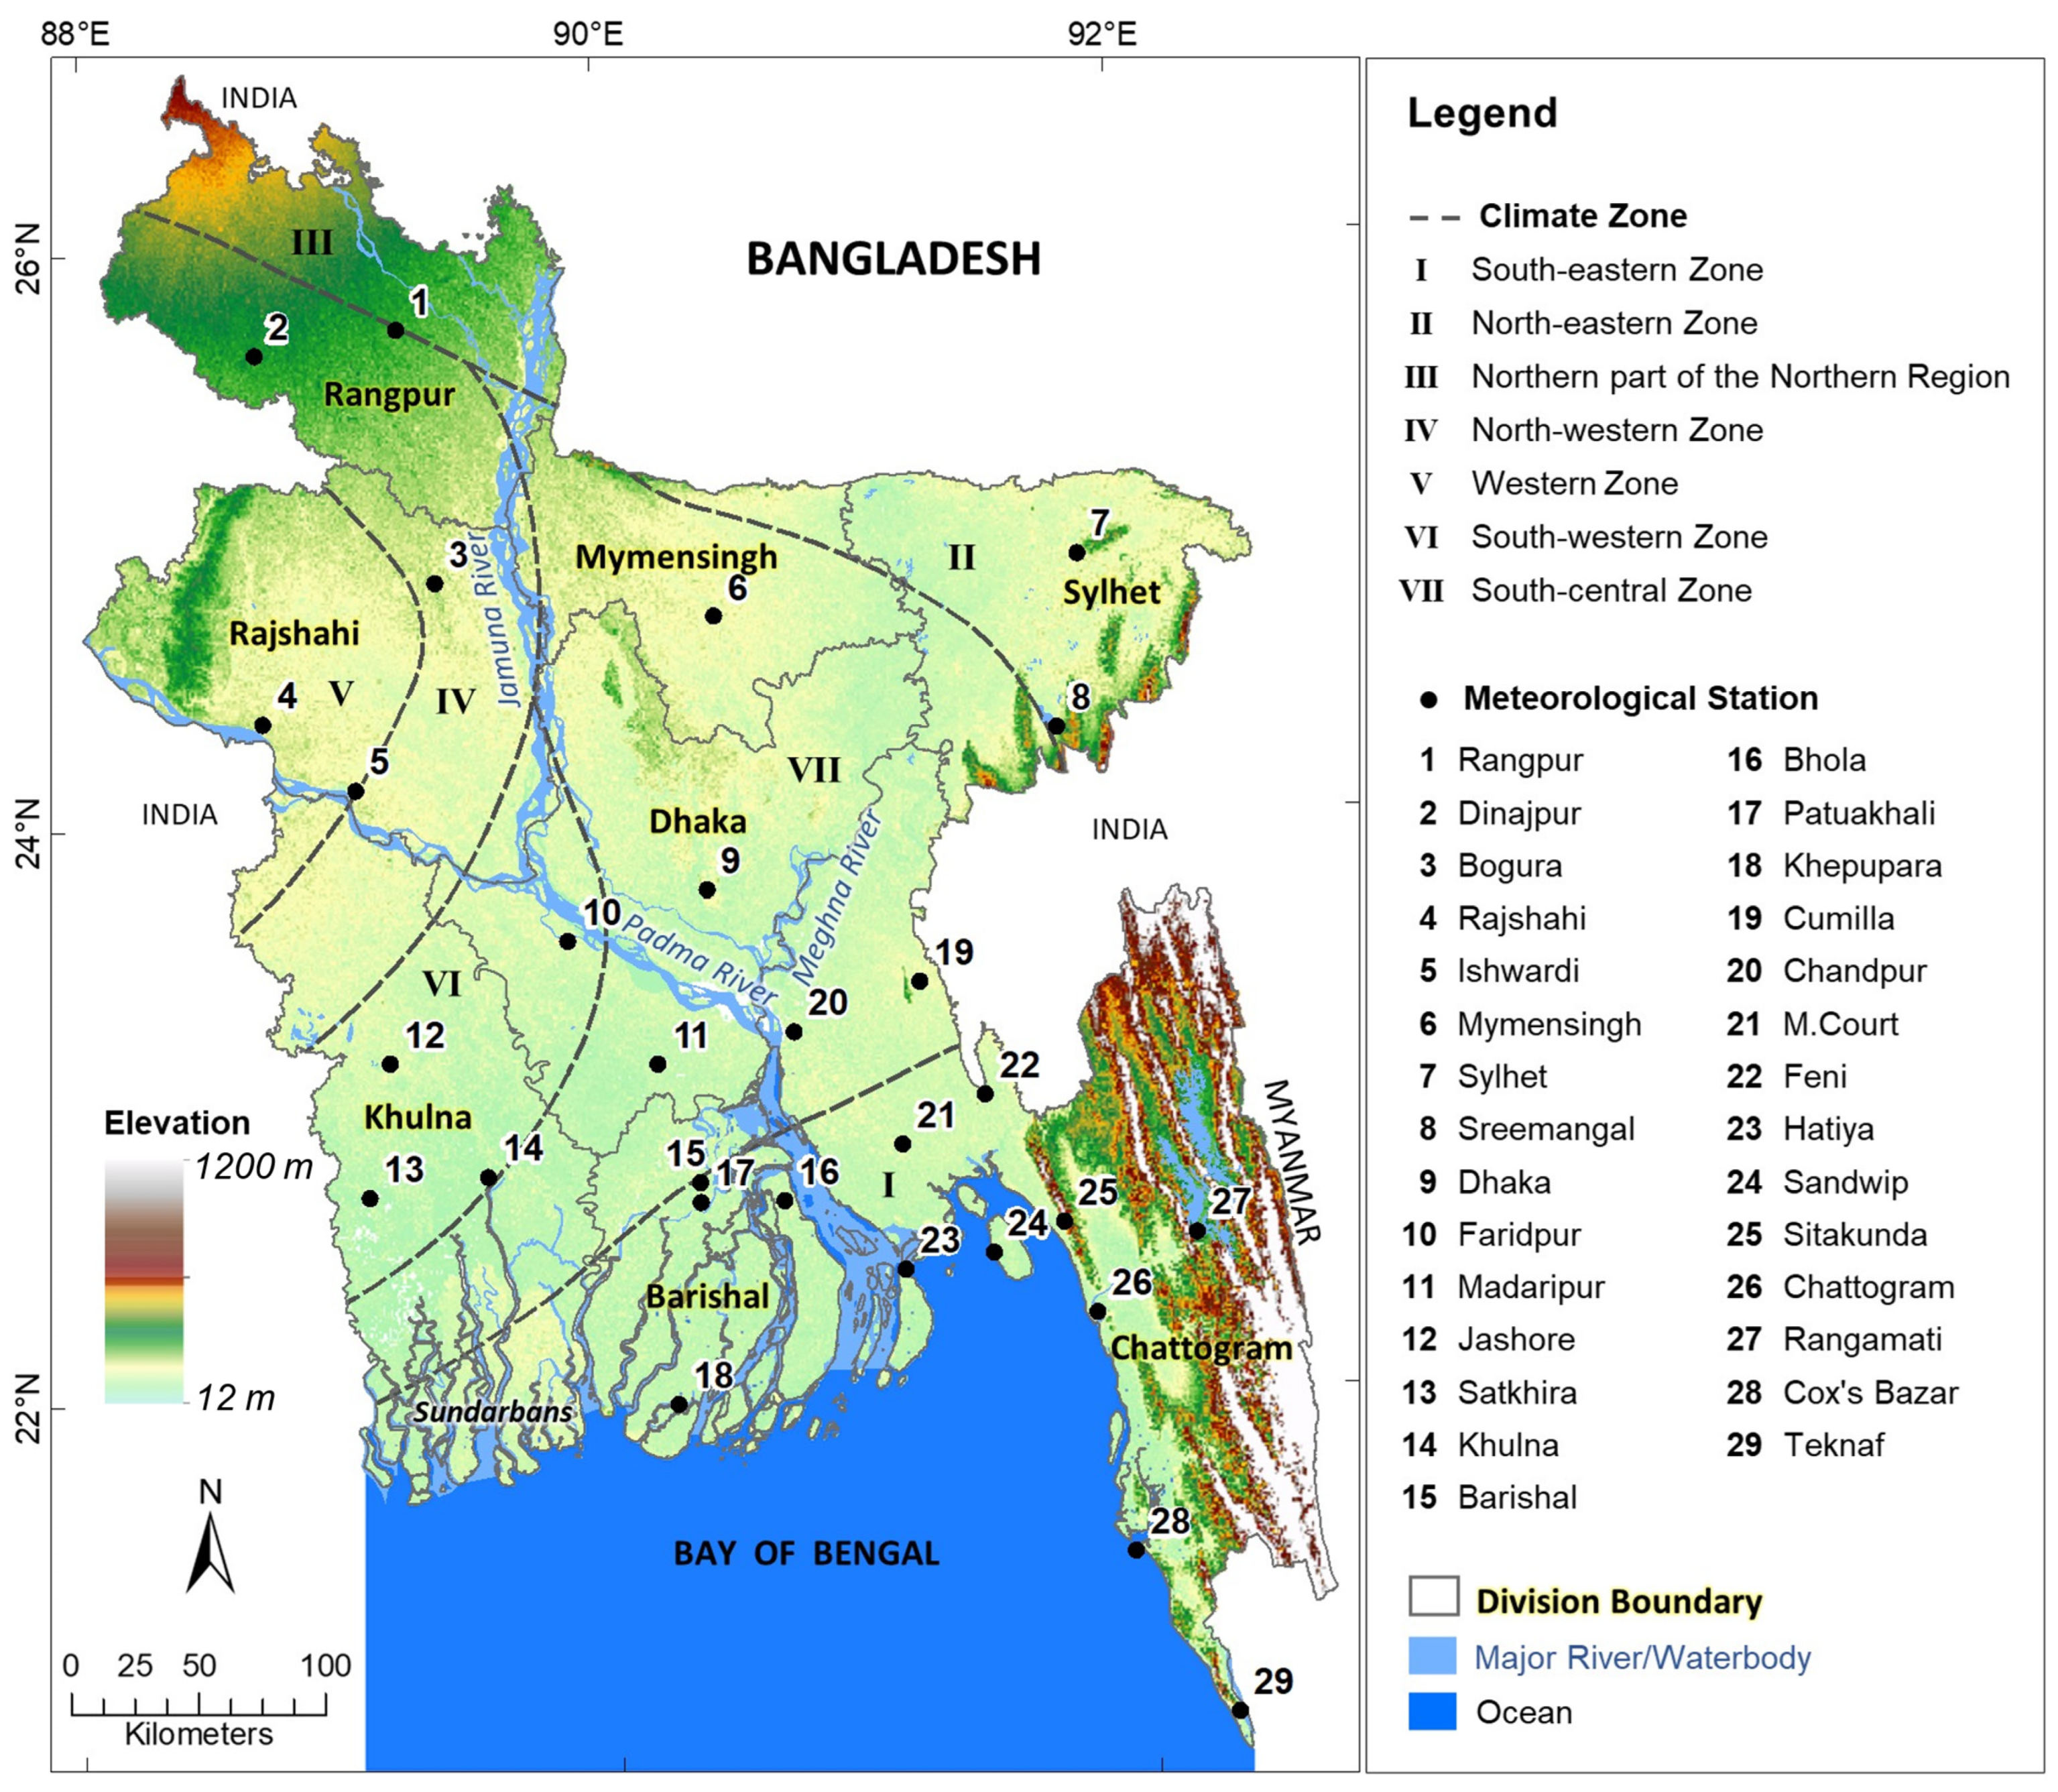
Bangladesh is in southern Asia, with an area of 147,540 km2 and extents between 88°01′–92°41′ E longitude and 20°34′–26°38′ N latitude (see Figure 1) [44]. The country consists of eight administrative divisions, namely Chattogram, Dhaka, Rajshahi, Khulna, Barishal, Sylhet, Rangpur, and Mymensingh. It is a plain land with an average elevation of 12 m (above mean sea level), except for the southeast mountainous region, with 600–1200 m; and the northeast and northwest hillock regions, with 60–150 and 105 m, respectively [45,46]. Major geographic features include the Bay of Bengal in the south, and the Himalayas in the north of the country. Typically, tropical climatic conditions, with seven subclimatic zones (see Figure 1), prevail in the country [4], which define the four discrete seasons, namely summer (March–May), monsoon (June–September), fall (October–November), and winter (December–February) [27]. The annual average rainfall is about 2400 mm [47], in which 71% occurs in the monsoon [27]. The annual average temperature is 25 °C, with an average of 17 to 20.6 °C during the winter [48].
2.2. Data
Observations of daily Tmax and Tmin at the 29 weather stations across the country (see Figure 1) were acquired from the Bangladesh Meteorological Department (BMD) for the period 1971–2021, except limited periods for Khepupara (1975–2021), Feni (1973–2021), and Patuakhali (1973–2021). Three-hourly air temperature (Ta) data were also collected from 2000 to 2021 for all weather stations.
The seven subclimatic zones of Bangladesh were based on Rashid [49]. The division boundary shapefile of Bangladesh was acquired from the HDX (Humanitarian Data Exchange) of OCHA (United Nations Office for the Coordination of Humanitarian Affairs) [50], and the coordinates and attributes of the weather stations from BMD.
2.3. Methods
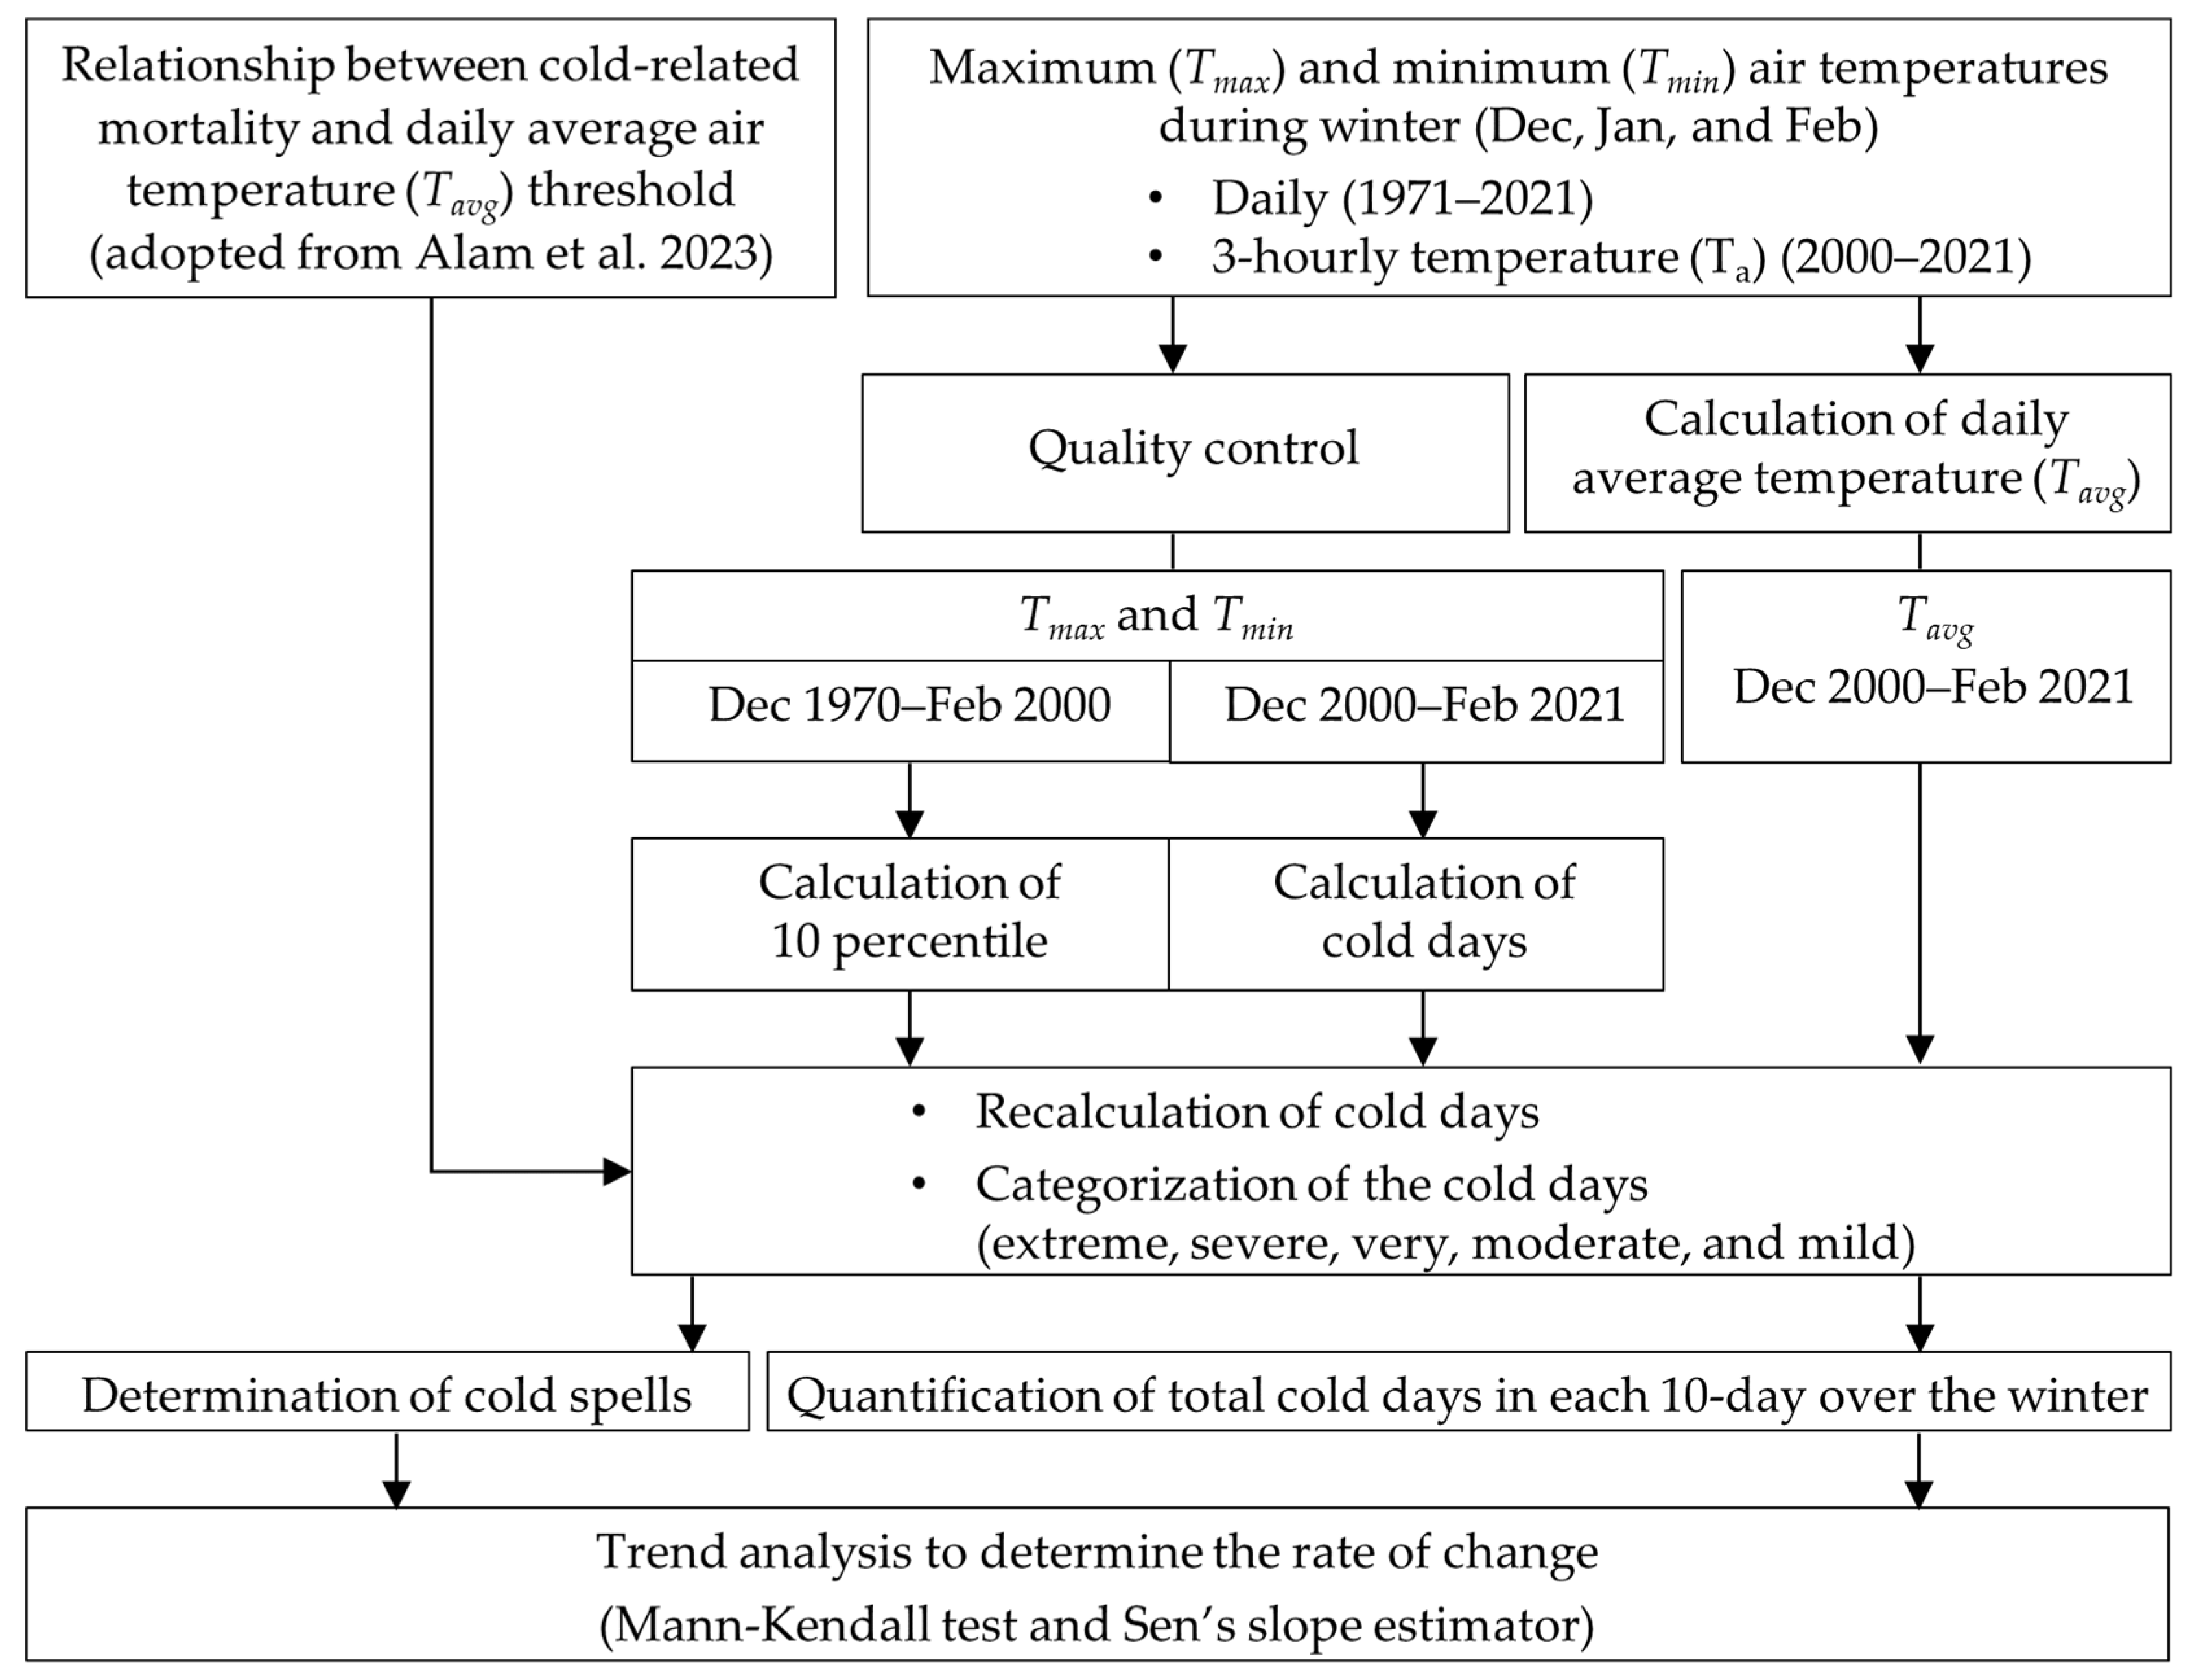
A schematic diagram (see Figure 2) illustrated the proposed methods applied in this study. The major approaches and steps to calculate cold days and spells in the winter season of Bangladesh are discussed in Section 2.3.1, Section 2.3.2 and Section 2.3.3.
2.3.1. Data Quality Control
During the quality inspection of the acquired air temperature data, the presence of outliers in the dataset were removed using the following conditions: (i) daily Tmax < Tmin, (ii) Ta, Tmax, or Tmin < 0 (zero), and (iii) irregular change in Ta, Tmax, or Tmin values in consecutive days for a station compared to the neighboring stations. Note that about 4.8% of the total data were unavailable, and data were missing for the Chattogram station during 2003–2007 due to reconstruction activities, which were made over with the data of Chattogram Ambagan weather station, 9 km away.
After removing any potential inconsistencies in the dataset, the daily time series of Tmax and Tmin were used as the input into the Climpact [51], a software package that quickly analyzes climate indices using daily weather data, to calculate the extreme events of cold days and spells during the winter months.
2.3.2. Calculation of Percentiles and Cold Days
The percentile method was implemented to calculate cold days during the winter months in this study. The 10th percentiles of Tmax and Tmin were used in this study to determine extreme temperatures such as cold days, a standard suggested by the World Meteorological Organization (WMO) [52]. First, 10th percentiles of daily Tmax and Tmin were calculated for each weather station from December 1970 to February 2000. Next, cold days were determined for the period December 2000–February 2021 in each station following the conditions of Equations (1) and (2). The indices for two extreme events out of the 27 WMO-proposed events were examined in this study: cold days (Tx10p) and cold nights (Tn10p).
where Tx and Tn are the daily maximum (Tmax) and minimum (Tmin) temperatures, respectively, on a day p for a period q; and and are the 10th percentiles for daily Tmax and Tmin, respectively.
2.3.3. Recalculation of Cold Days and Spells
A preliminary assessment of the determined cold days indicated more cold days in the southern coastal stations compared to others (see Figure 3). For the relationship between cold days/spells and cold-related mortality, the thresholds of Tavg were adopted from Alam et al. [28], including an assumption that modification would be required in the warmer coastal stations, where fewer deaths were observed in winter [4]. This is unusual, because the coastal stations are supposed to show fewer cold days due to the nearby Bay of Bengal. Hence, the cold days were recalculated by integrating the Tavg (calculated from 3-hourly air temperature, Ta) threshold (Tthreshold) of 17 °C (adopted from Alam et al. [28]) to the initial calculation. The recalculated cold days were further categorized into five classes according to the temperatures, namely (i) extreme (≤13 °C), (ii) severe (>13–14 °C), (iii) very (>14–15 °C), (iv) moderate (>15–16 °C), and (v) mild (>16–17 °C).
To determine a cold spell, the recalculated cold days were used with the criteria that at least two consecutive cold days were found in two or more surrounding stations.
2.3.4. Trend Analysis of Cold Days and Spells
The rate of change in cold days and spells over the study period was determined by a trend analysis using MK test [42] and SSE [43]. MK and SSE are commonly used approaches for nonparametric data such as air temperature. The seasonal (winter), monthly (three winter months), and 10-day scales (9 units over the 3 winter months) trends for cold days were determined for 29 meteorological stations, and seasonal and monthly trends of cold spells were estimated in the 8 divisions of the country.
The S statistics of MK test were performed using Equations (3) and (4).
where the number of observations is n; k is the number ranges from 1 to n − 1, (i.e., j increases the value of k by 1). The mean value of S is 0 (zero), and its change could be computed using Equation (5).
Furthermore, the Z statistics were calculated to determine the rate of change using Equation (6) when the number of observations was more than 10 (n > 10), with 99, 95, and 90 percent significant levels. Here, the positive and negative outcome values specify the increasing (upward) and decreasing (downward) rate of changes, respectively.
The magnitude of change was calculated using SSE through Equation (7).
where β is the magnitude of the extreme indices of the SSE.
3. Results
3.1. Primary Estimation of Cold Days
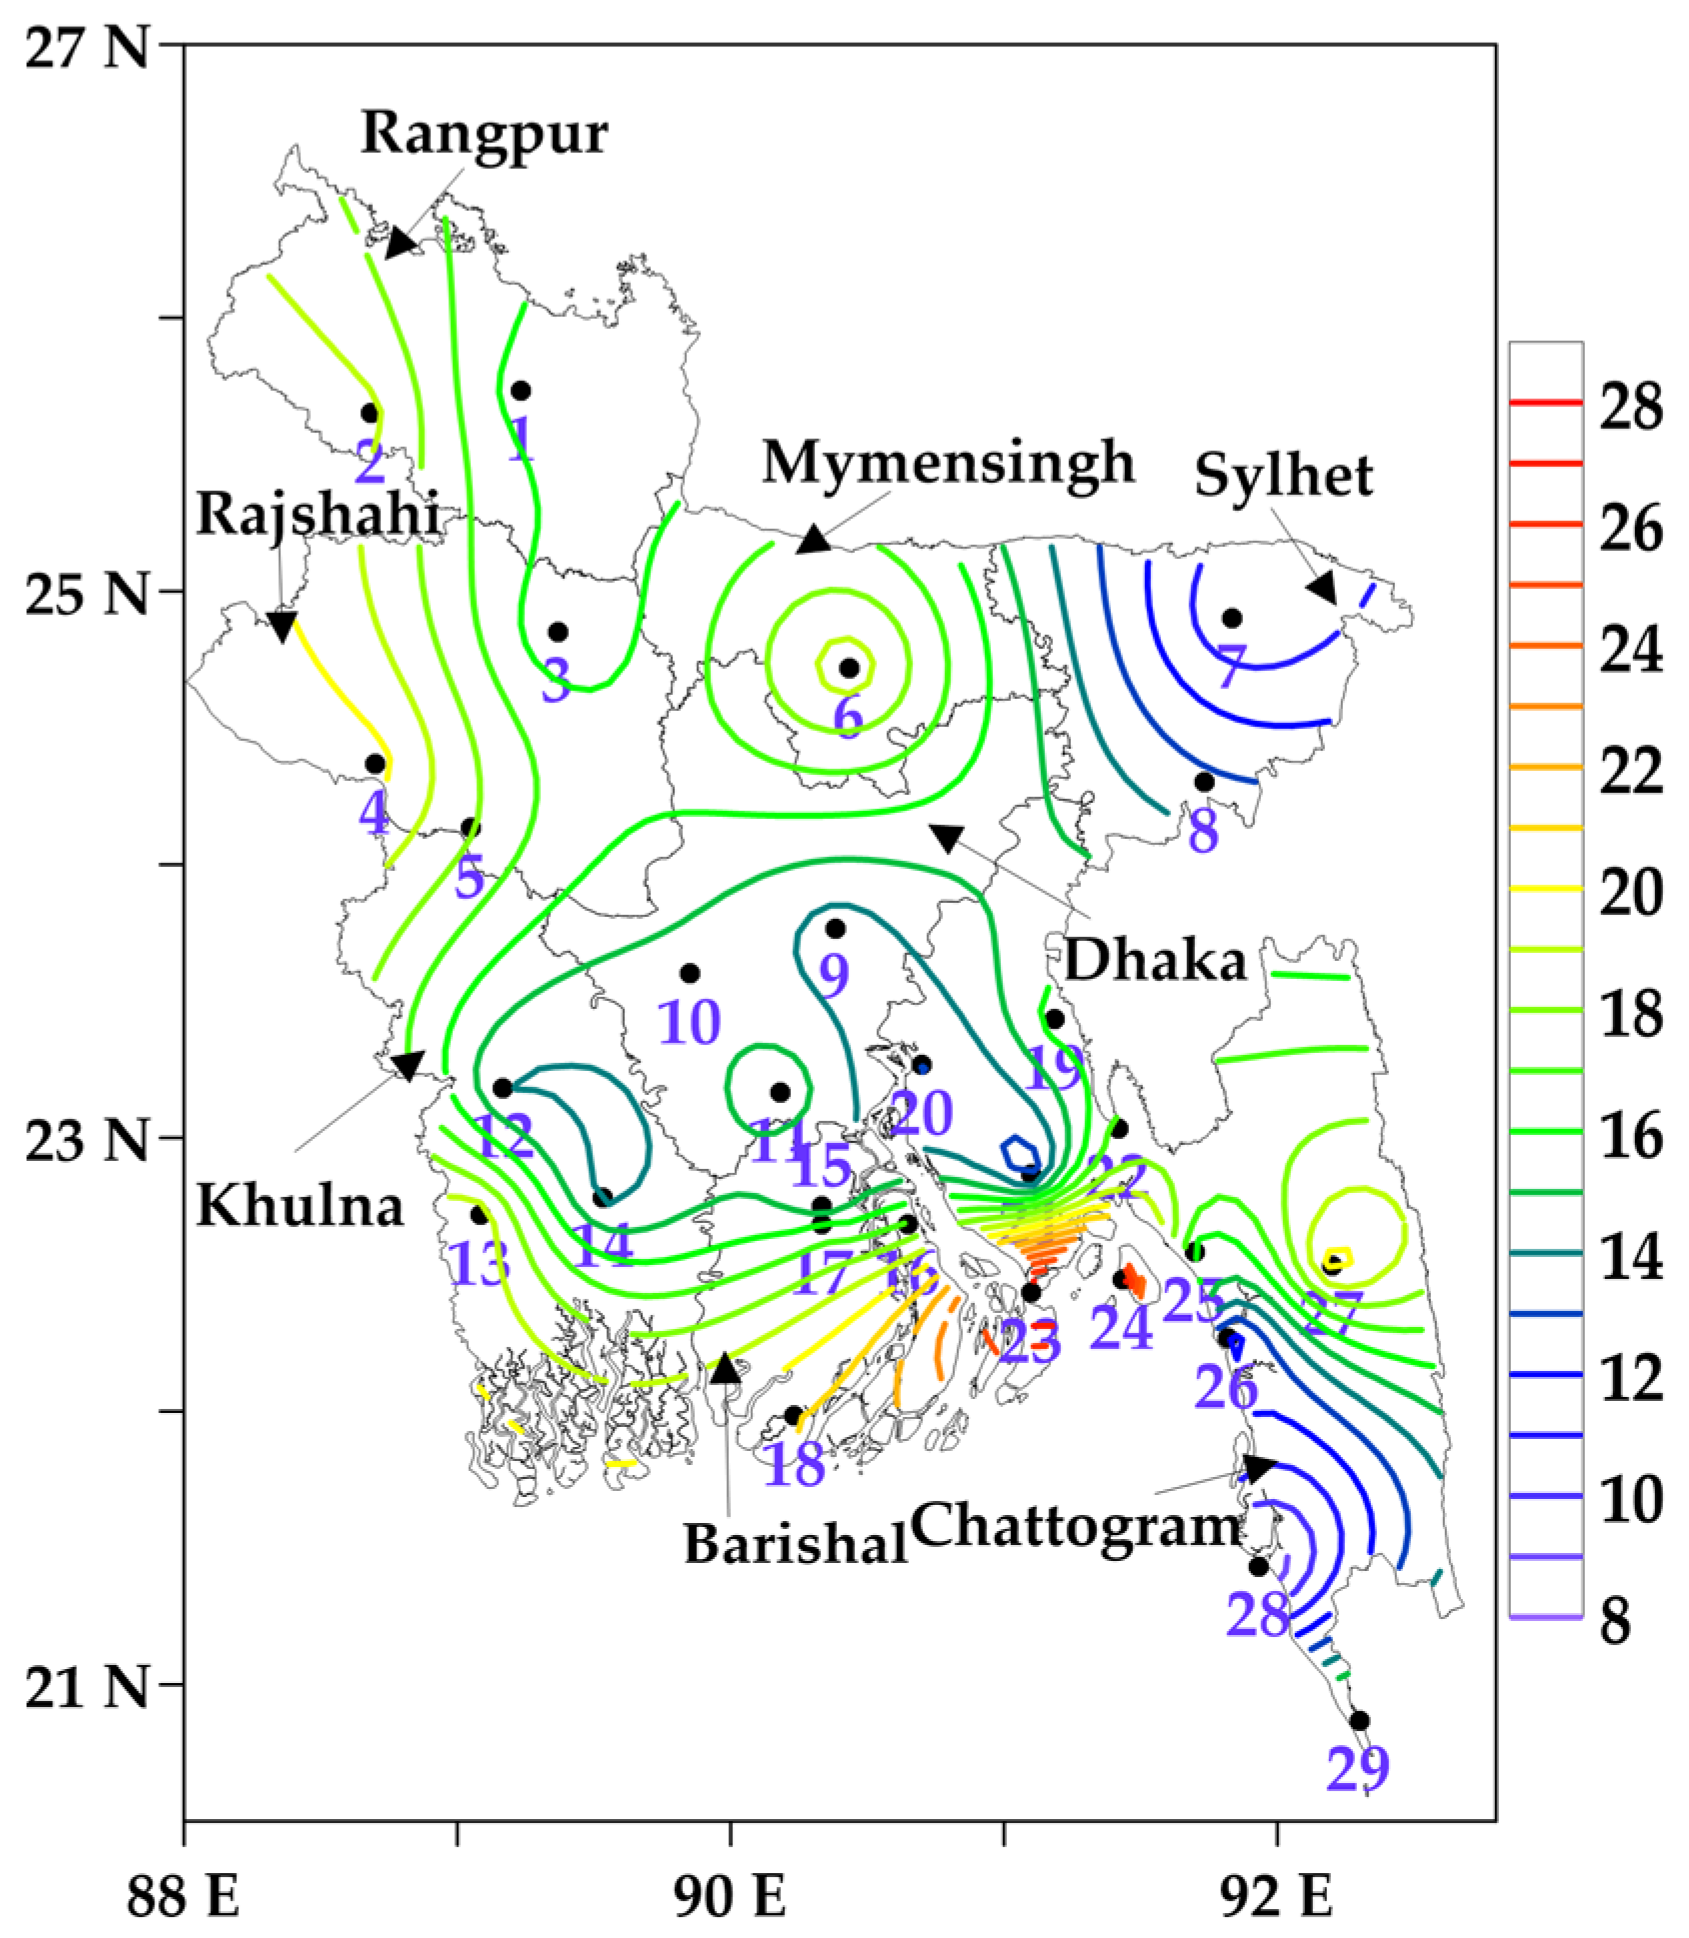
Spatial distribution of the primary estimation of average cold days across Bangladesh for the winters of 2000–2001 to 2020–2021 is shown in Figure 3. The highest numbers of cold days were found in the southeastern stations of Hatiya and Sandwip, with 28.24 and 27.71 days/year (d/yr), respectively. In contrast, the lowest numbers of cold days were observed in northeastern Sylhet (10.1 d/yr) and southeastern Cox’s Bazaar (7.76 d/yr) stations. In fact, higher numbers of cold days were exhibited at every station in the northern and northwestern parts of the country (i.e., Mymensingh, Rangpur, and Rajshahi divisions) in compared to the country average of ~16.51 d/yr, with the exception of the Rangpur (15.48 d/yr) and Bogura (15.19 d/yr) stations. In general, a higher number of cold days were seen in the southern, southwestern, and western stations of the country, and gradually decreased to the northeast and southeast.
3.2. Final Estimation of Cold Days
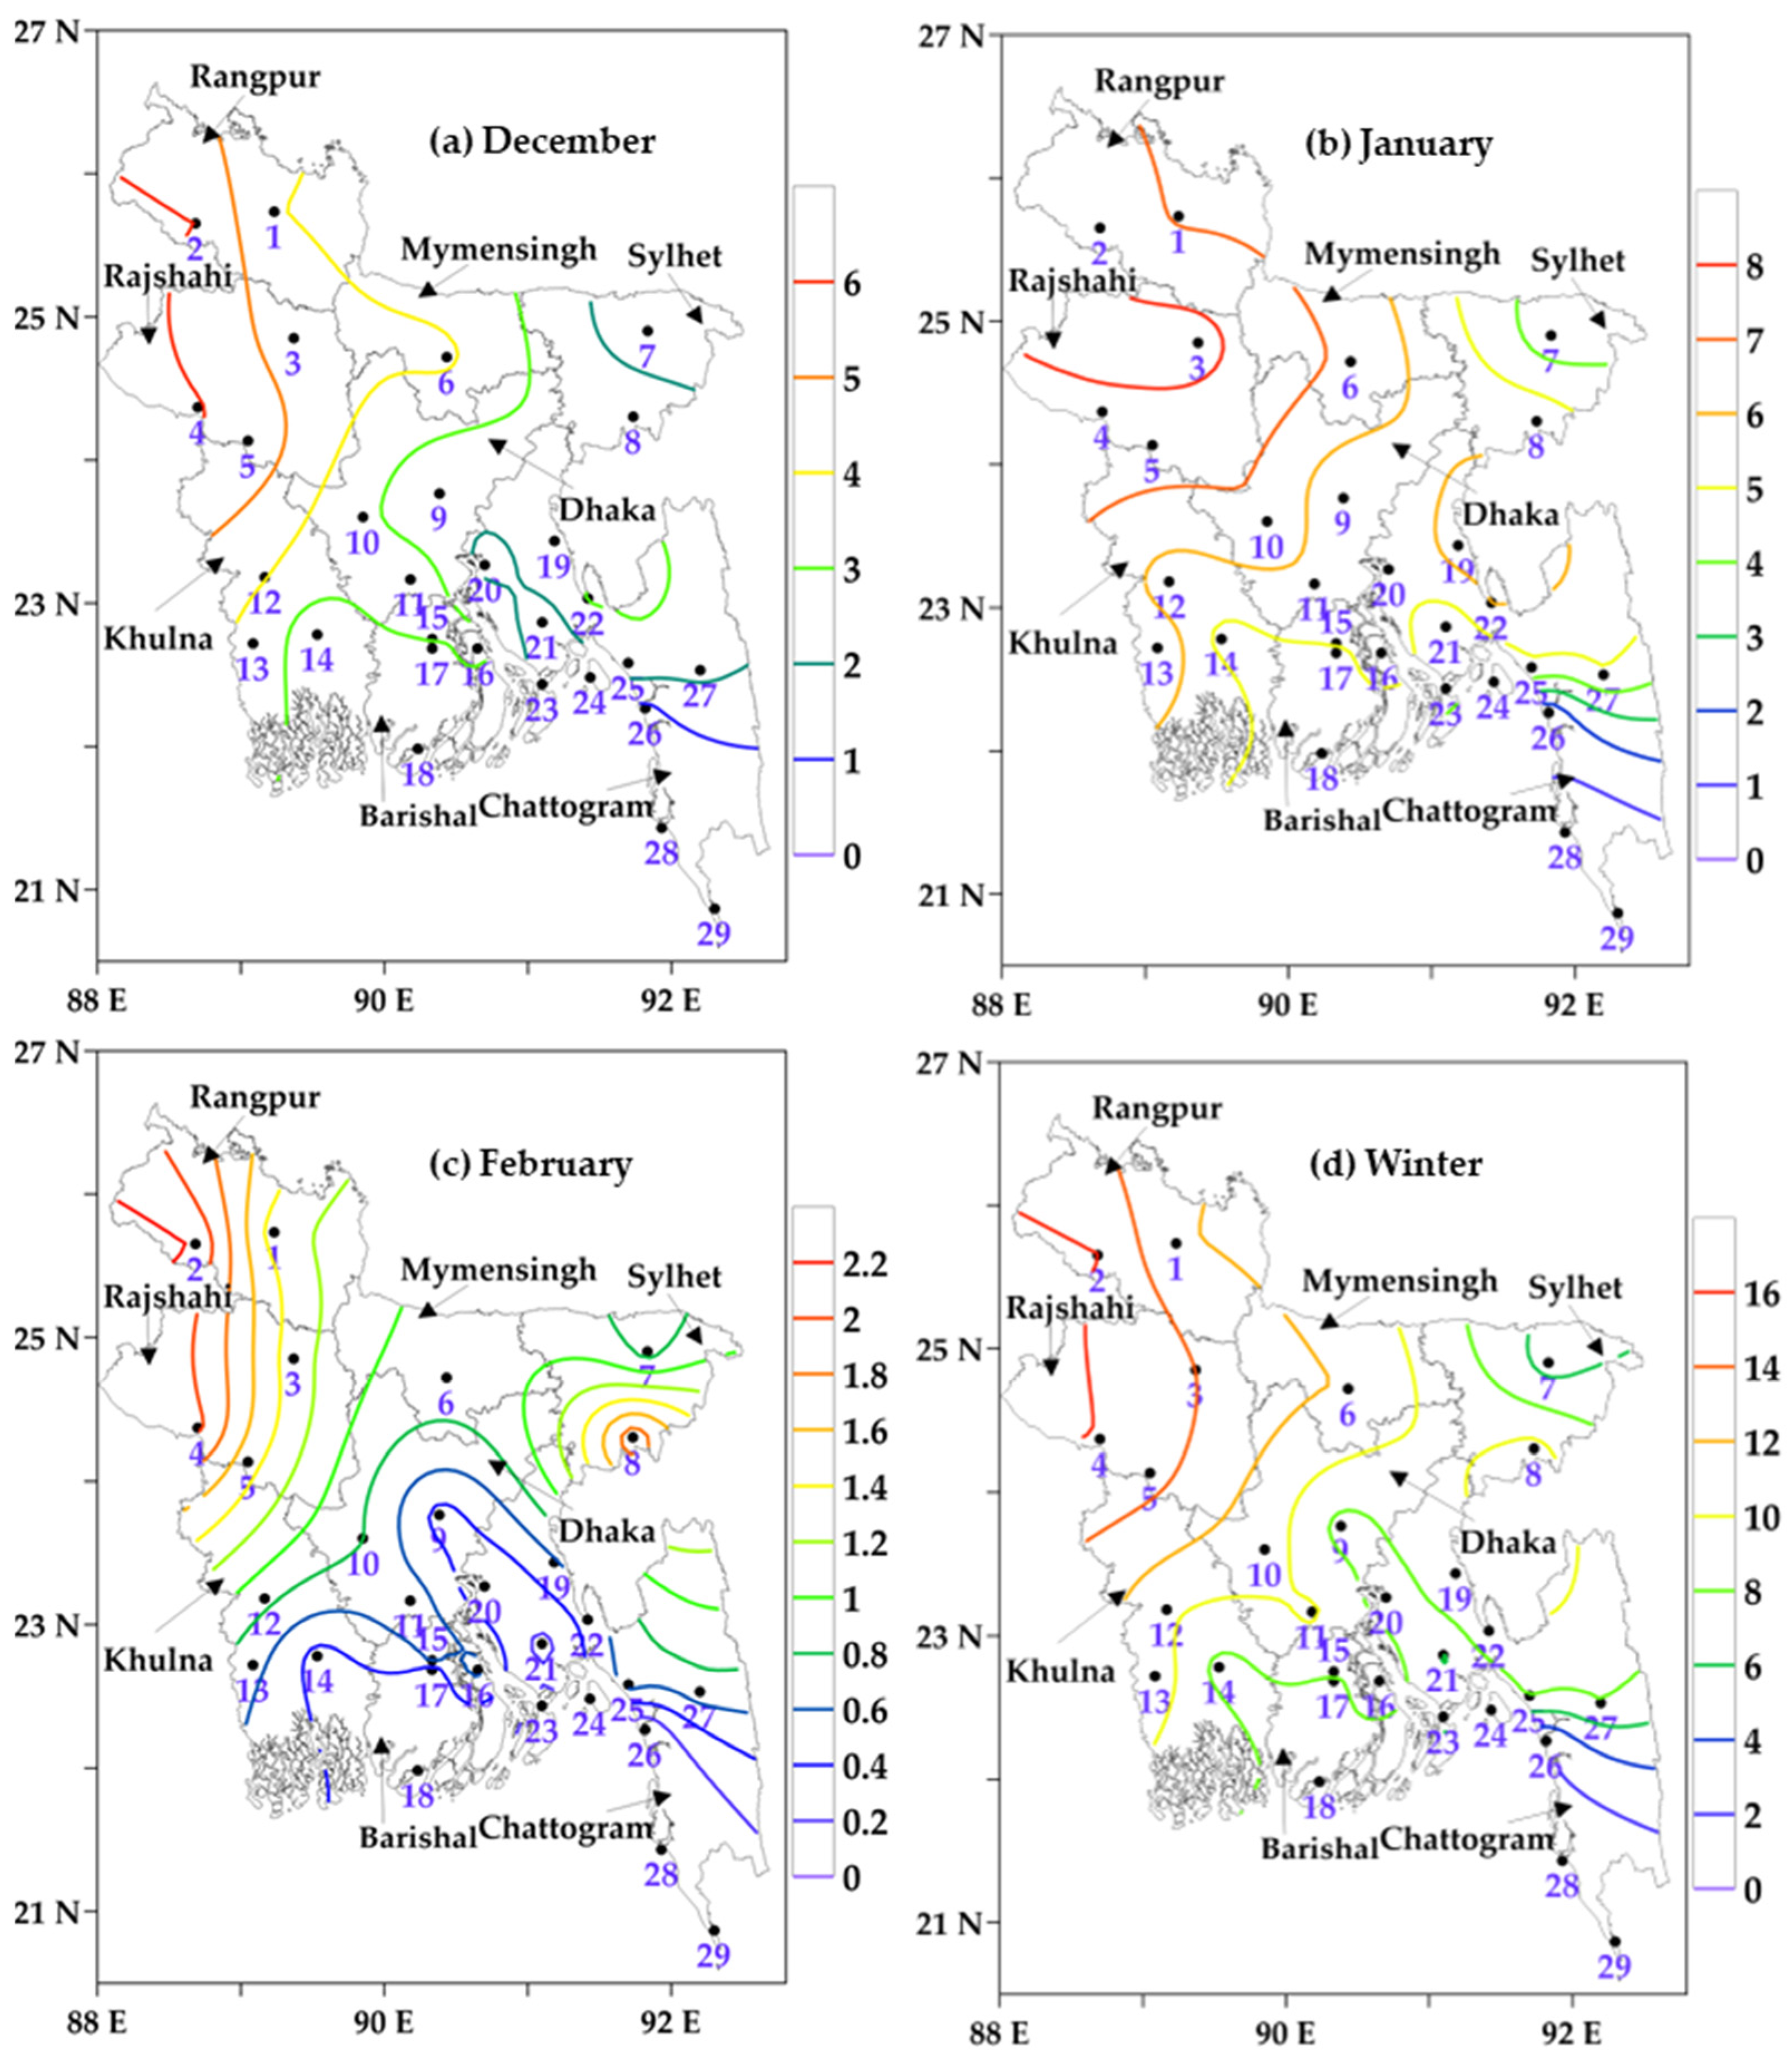
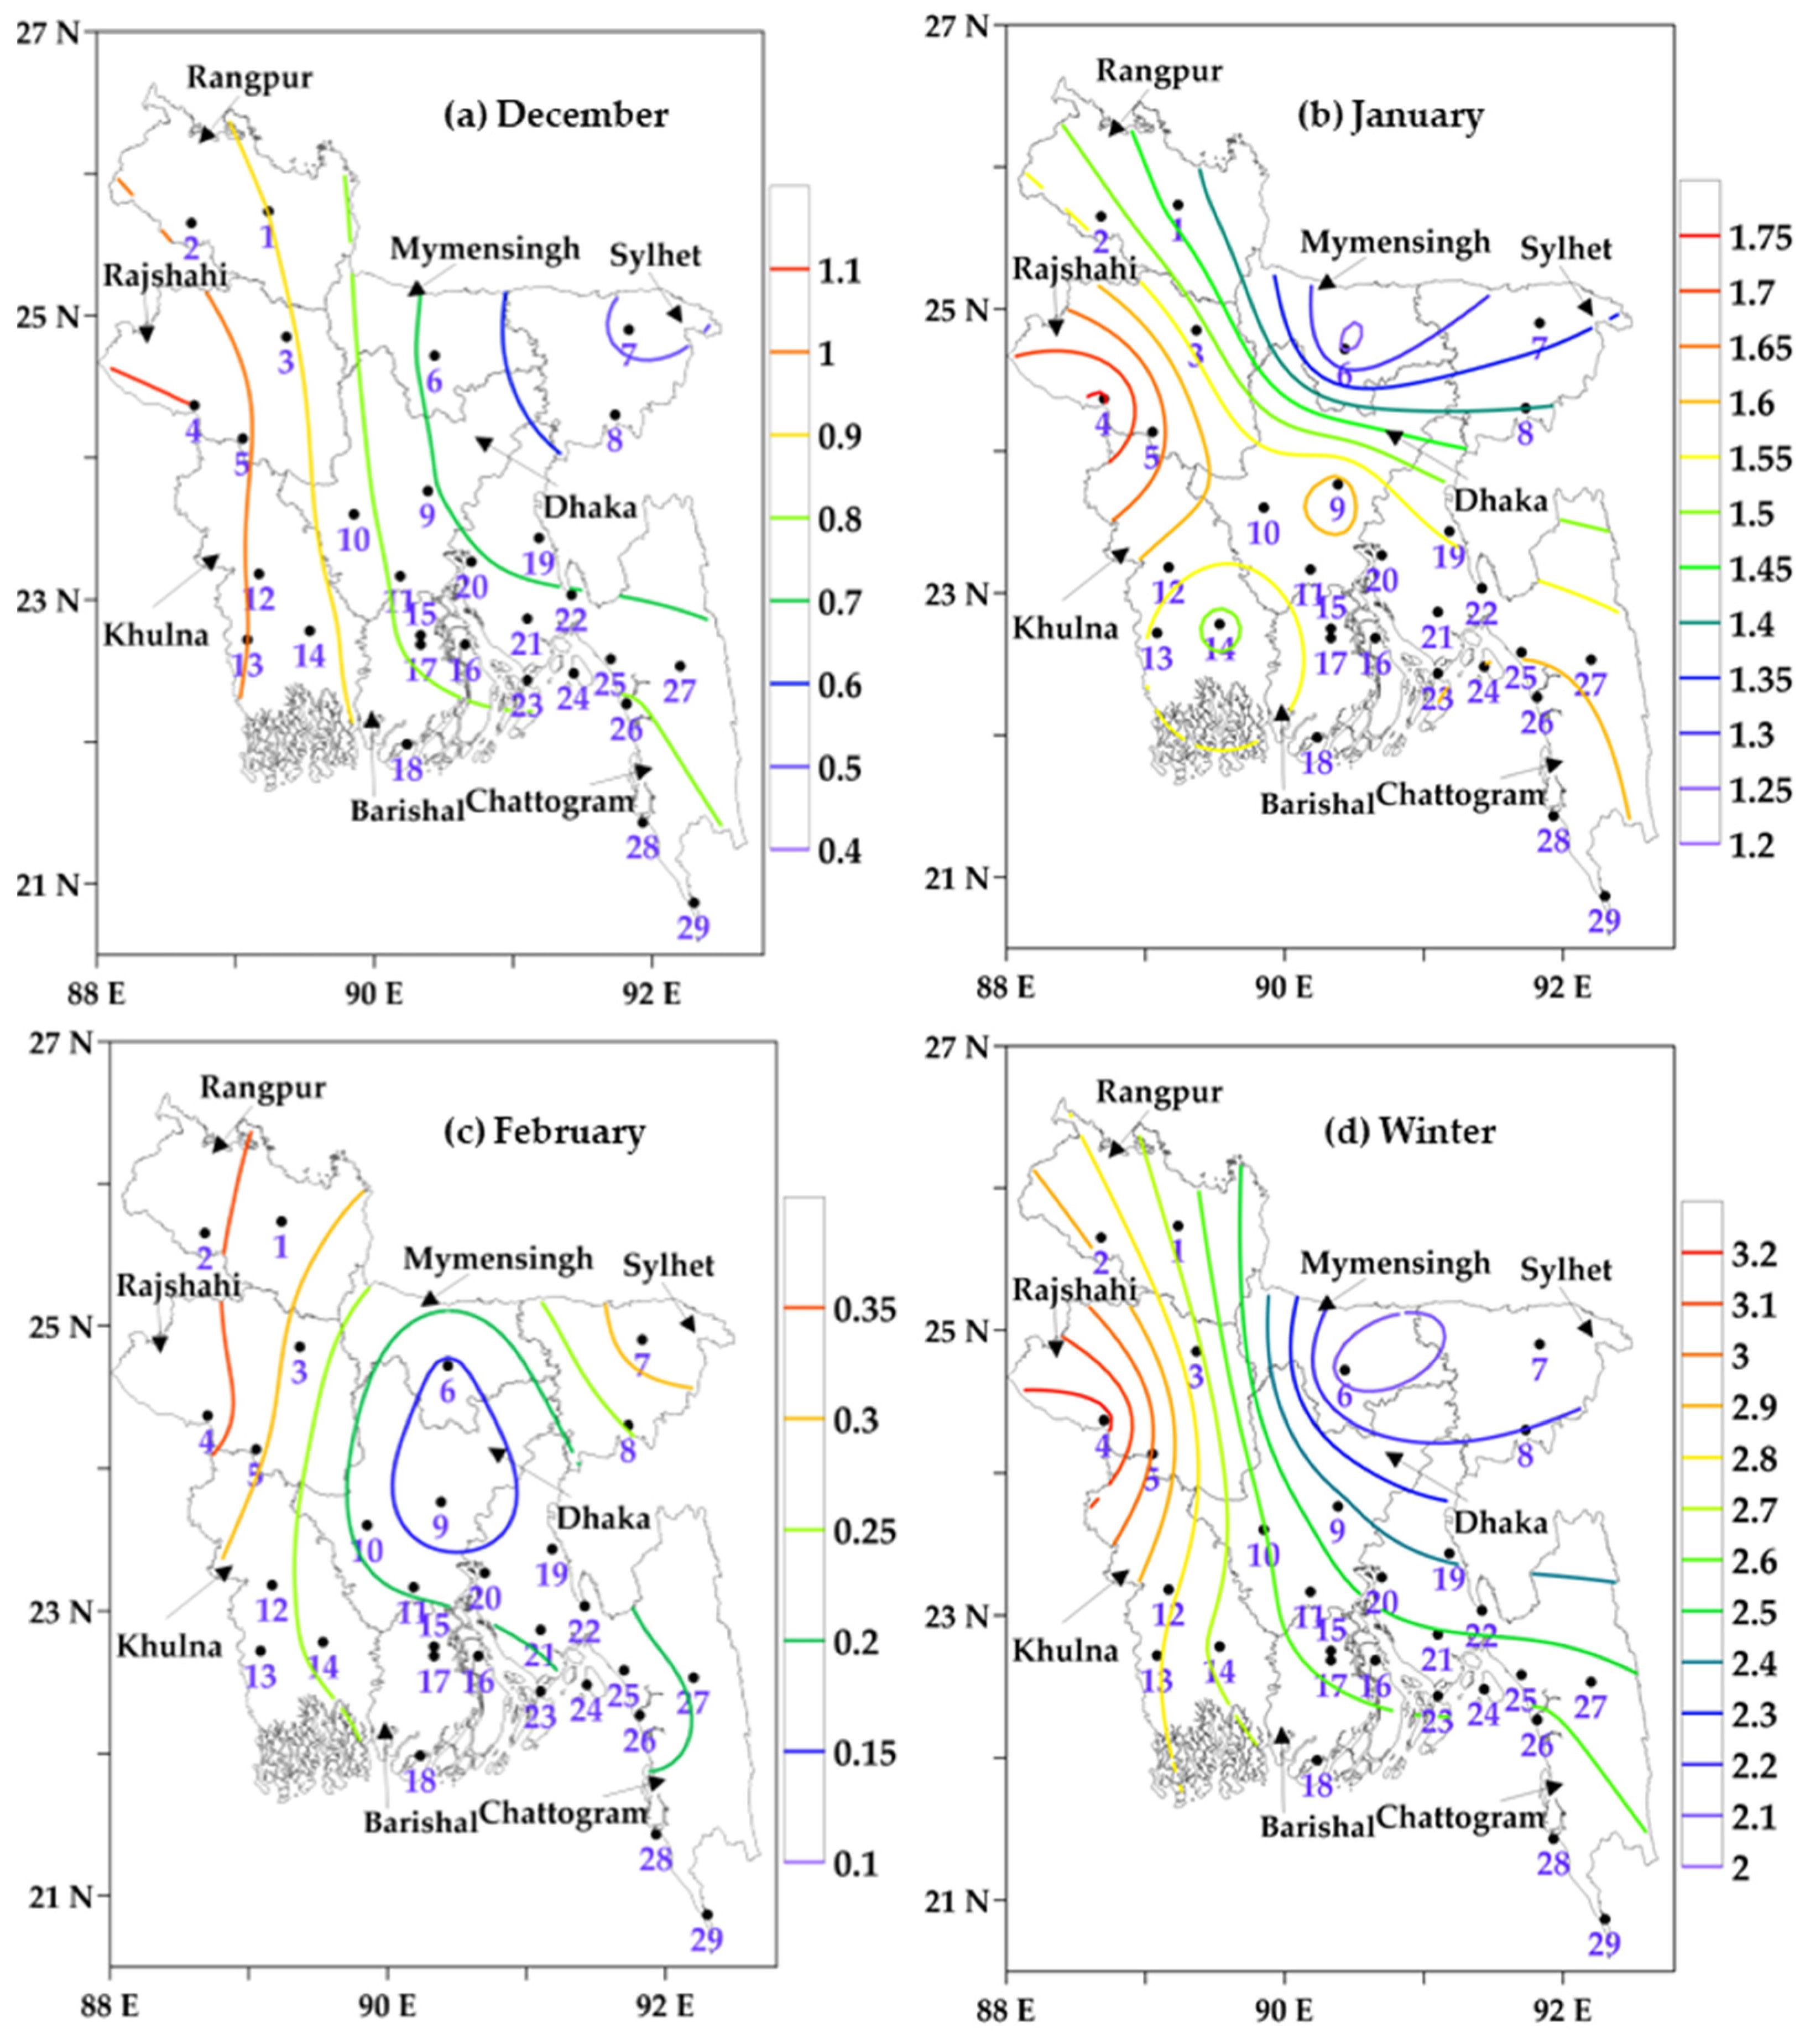
The final estimation of cold days across Bangladesh, using the Tthreshold of 17 °C in the winter months from 2000–2001 to 2020–2021, is shown in Figure 4a–d. The average number of cold days were reduced drastically in the southeastern and southern coastal stations in compared to the primary estimation (see Section 3.1) for the winter season (Figure 4d), including December (Figure 4a), January (Figure 4b), and February (Figure 4c). In contrast, when the Tthreshold value was used, not much effect was found in the western and northwestern regions. In general, the number of cold days in winter were higher in the northwest and west (Rangpur and Rajshahi divisions), and reduced gradually towards the northeast, east, south, and southeast of Bangladesh (Figure 4d). The highest average numbers of cold days were found in the districts of Rajshahi (6.05 d/yr) and Dinajpur (6.0 d/yr) in December (Figure 4a); Bogura (8.33 d/yr), Rajshahi (7.86 d/yr), Dinajpur (7.86 d/yr), and Ishwardi (7.48 d/yr) in January (Figure 4b); Dinajpur (2.19 d/yr) and Rajshahi (2.05 d/yr) in February (Figure 4c); and Dinajpur (16.05 d/yr), Rajshahi (15.95 d/yr), and Bogura (14.71 d/yr) in the whole winter season (Figure 4d). On the other hand, the lowest average numbers of cold days were noticed in Sylhet (5.14 d/yr), Chattogram (2.0 d/yr), Sandwip (4.86 d/yr), Teknaf (0.05 d/yr), and Cox’s Bazar (0.71 d/yr) stations. In the coastal regions, the average cold days ranged from 1–3, 1–5, 0.2–0.8, and 2–8 days/year in December, January, February, and the whole winter season, respectively. In addition, in the case of the entire country, the average numbers of cold days were 2.9, 5.2, 0.7, and 8.8 days/year in December, January, February, and the whole winter season, respectively. Overall, the highest and lowest numbers of cold days in the winter season were noted in January and February, respectively.
Cold Days Category
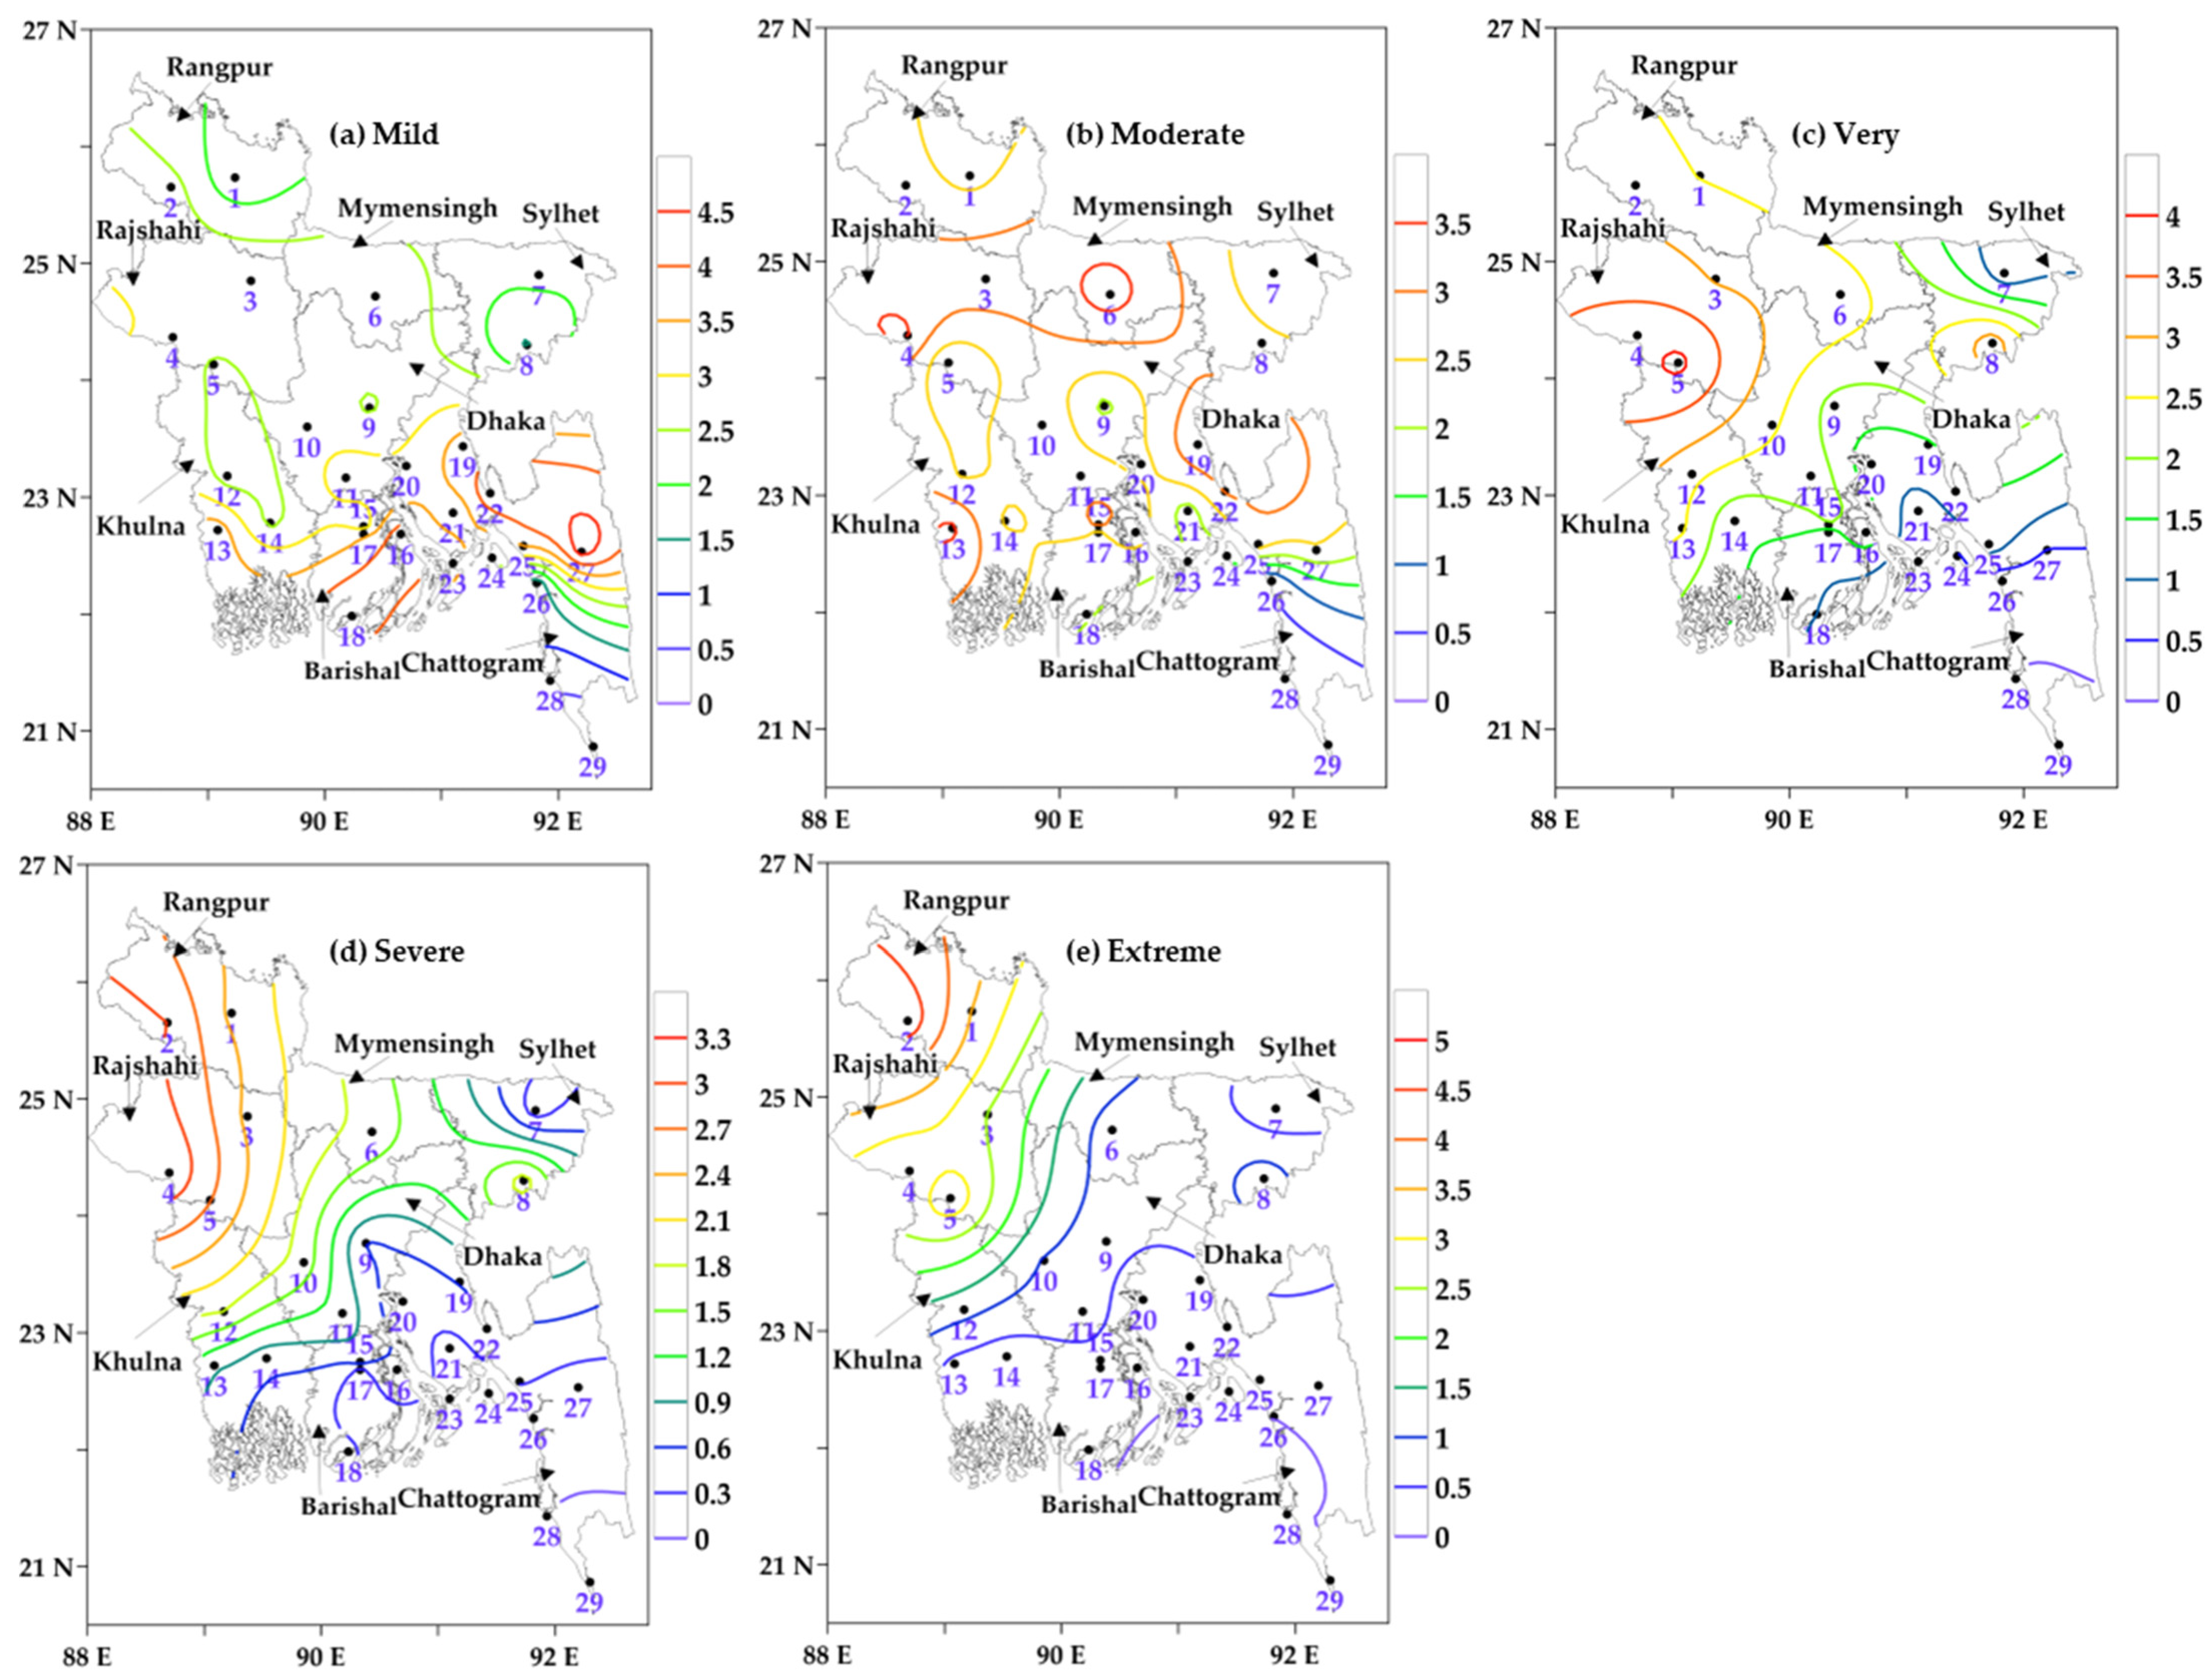
Spatial distribution of the average mild to extreme categories of cold days during the winter periods (2000–2001 to 2020–2021) across Bangladesh is presented in Figure 5a–e. The category of mild cold days (Figure 5a) was observed mostly in the southern coastal regions, including Khepupara (4.43 d/yr), Feni (4.38 d/yr), Bhola (4.33 d/yr), and Hatiya (3.90 d/yr); the hill district Rangamati (4.76 d/yr); and lower in the central regions. Moderate cold days (Figure 5b) occurred across Bangladesh, in an irregular fashion. Very (Figure 5c) and severe (Figure 5d) cold days were noticed highest in Rajshahi (3.24 d/yr) and Ishwardi (4.14 d/yr) stations. The highest numbers of extreme cold days (Figure 5e) were found in Dinajpur (4.81 d/yr) and Rangpur (3.48 d/yr) stations in the northwest of the country. In contrast, no severe and extreme categories of cold days were reported in the south and southeastern coastal stations, including Teknaf, Cox’s Bazar, Chattogram, Hatiya, Sandwip, M Court, and Khepupara (Figure 5e).
In terms of administrative divisions, the extreme-category cold days were in Dhaka (0.79 d), Rajshahi (2.79 d), and Rangpur (4.14 d) in each year, on average (Figure 5e). Moreover, Khulna (1.16 d/yr), Mymensingh (1.71 d/yr), Rangpur (2.67 d/yr), and Rajshahi (2.76 d/yr) divisions showed the severe category (Figure 5d). Moreover, Sylhet (1.98 d), Dhaka (2.24 d), Khulna (2.27 d), Rangpur (2.64 d), Mymensingh (2.76 d), and Rajshahi (3.6 d) divisions revealed very cold days each year (Figure 5c). In general, extreme, severe, and very cold days were predominant in the northwestern and western divisions, such as Rangpur, Rajshahi, the northern part of Khulna, and the western part of Mymensingh. In contrast, moderate-category cold days exhibited no pattern across the divisions, and the mild category occurred mostly in the southern and southeastern coastal divisions, i.e., Khulna (southern part), Barishal, and Chattogram.
3.3. Determination of Cold Spells
Administrative-division-level monthly and seasonal averages of cold spells during the winters from 2000-01 to 2020-21 are presented in Figure 6a–d. The results reveal that the highest number of average cold spells was found in January (Figure 6b). In December (Figure 6a), January (Figure 6b), and the winter season (Figure 6d), higher numbers of cold spells were found in Rajshahi division, decreasing gradually towards Sylhet division. In contrast, a lower number of average cold spells was observed in Dhaka division and the surrounding areas, in the central part of Bangladesh (Figure 6c). On the seasonal scale, the average number of cold spells was higher in Rajshahi division (3.24 spells/year) and lower in Mymensingh (2.05 spells/year) and Sylhet (2.14 spells/year) divisions.
Cold Spells Category
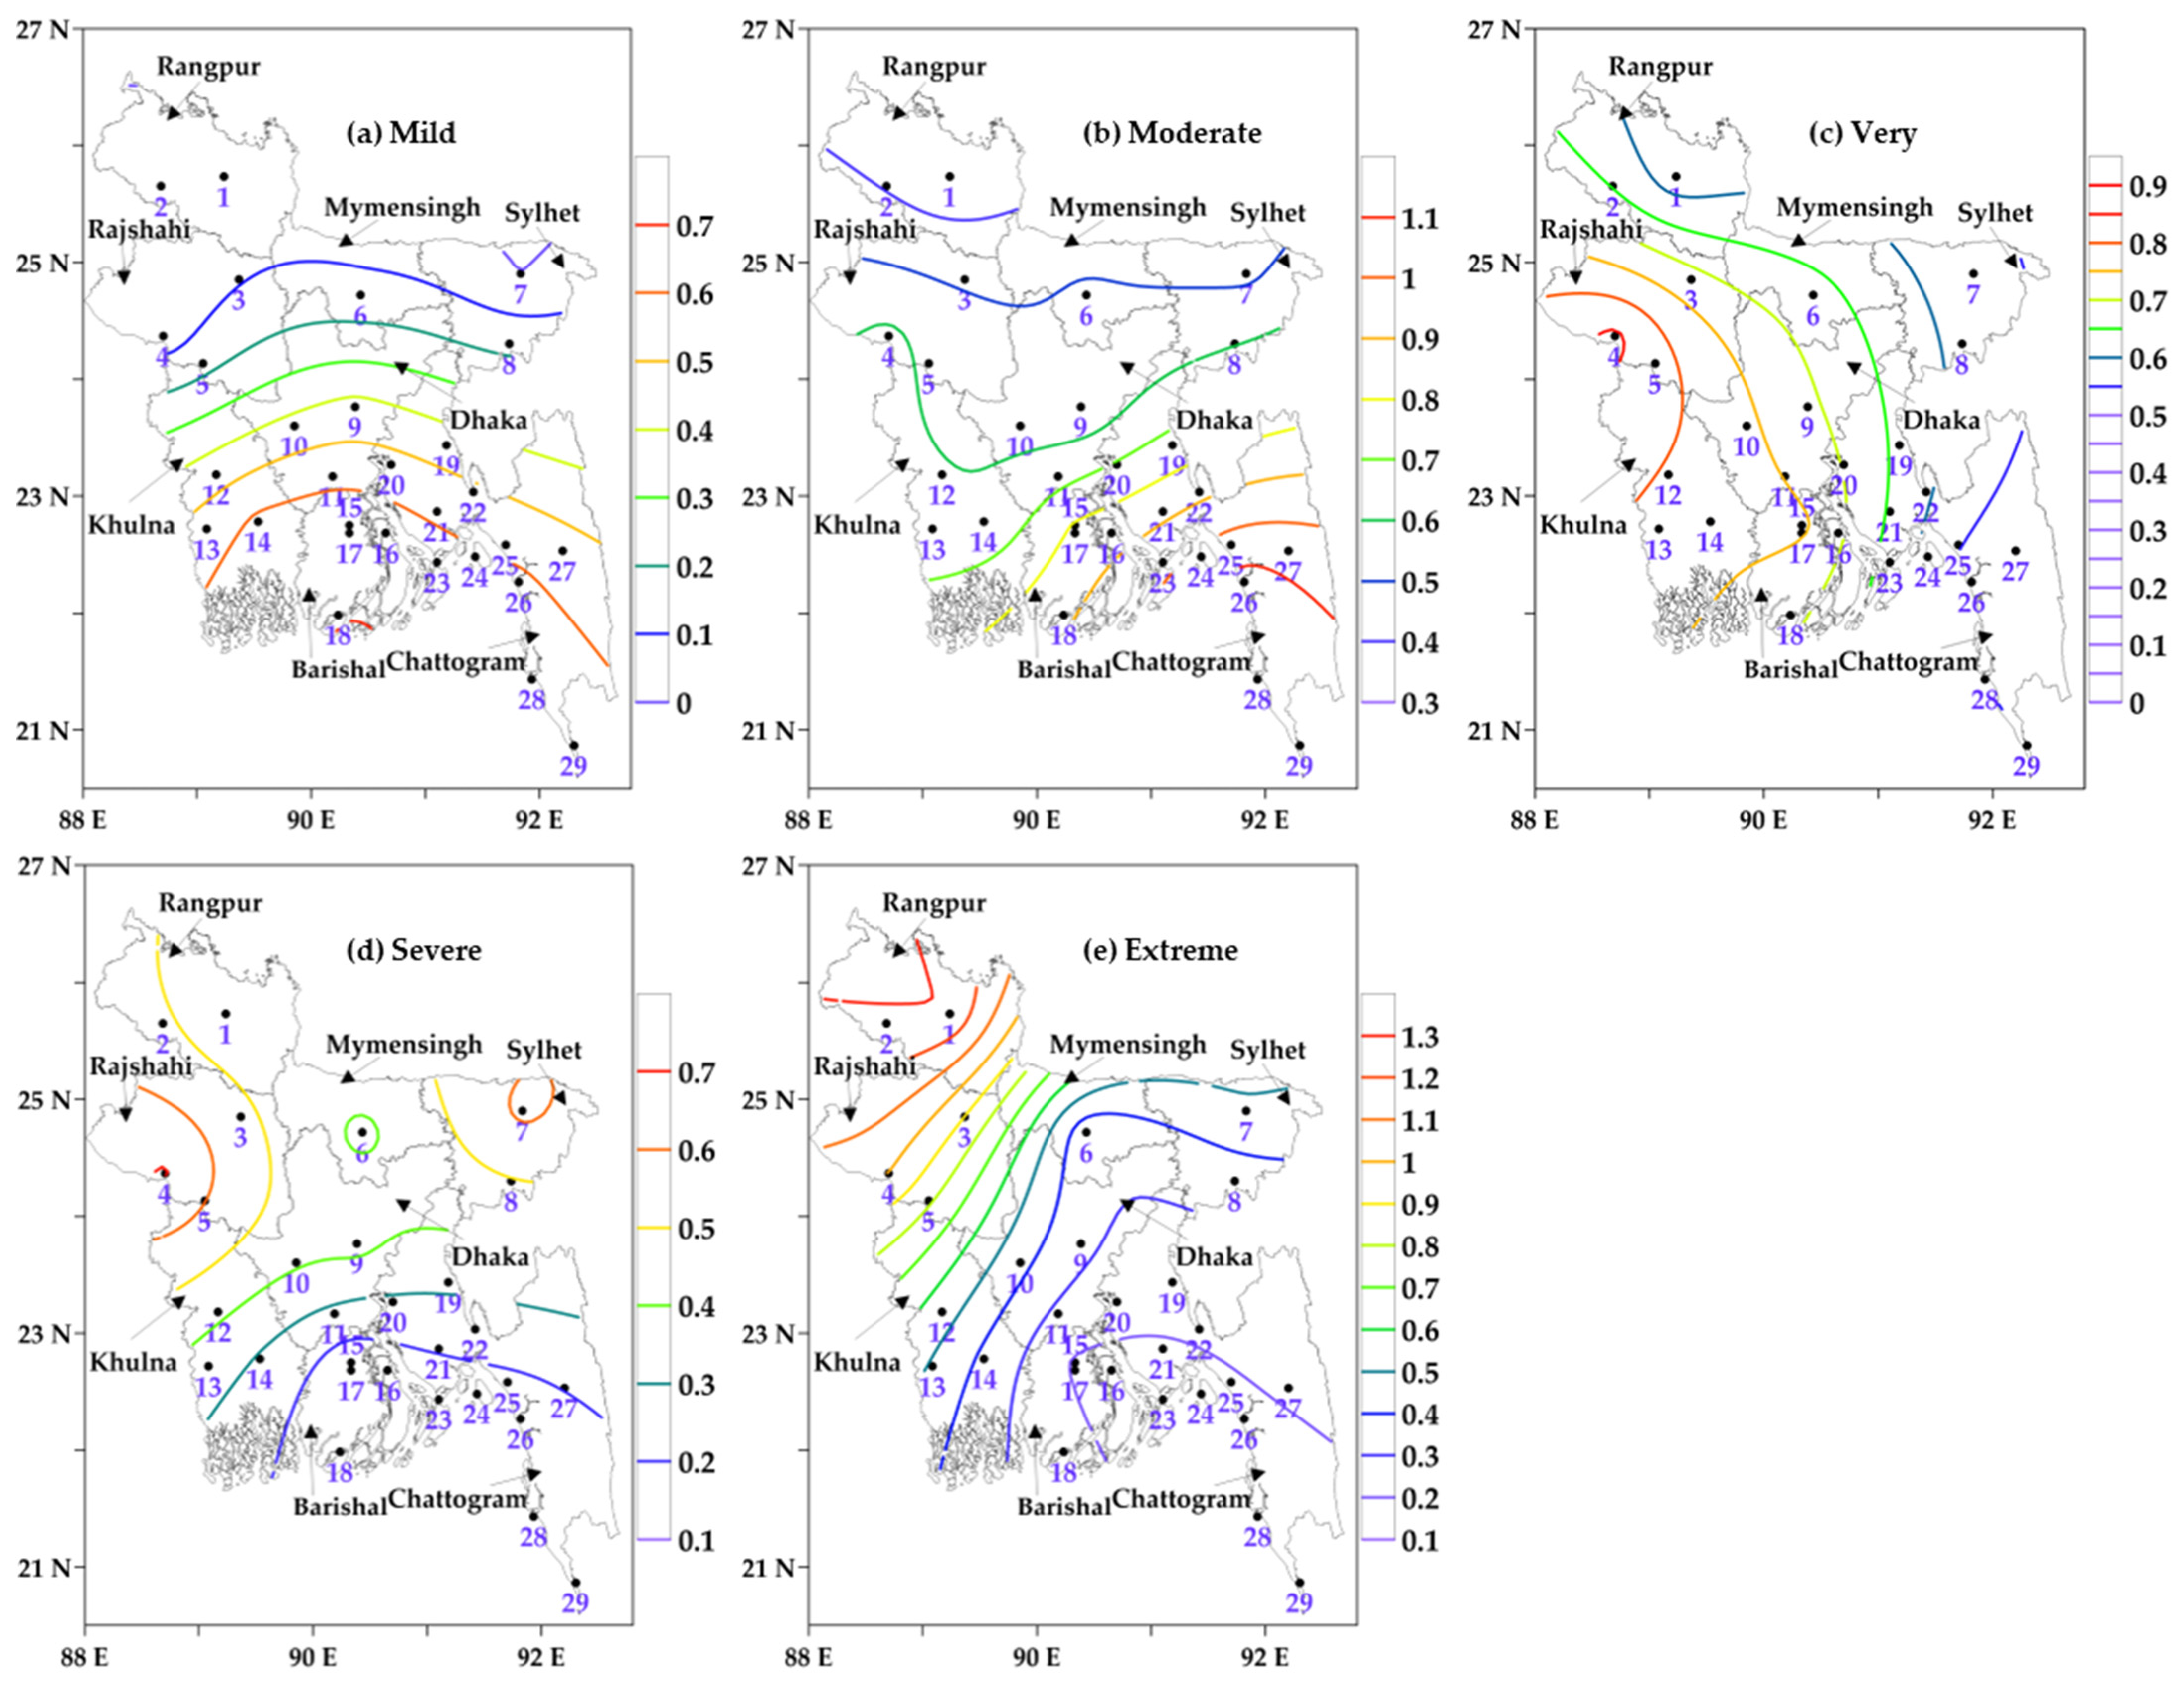
Figure 7a–e present five different categories of average cold spells from 2000-01 to 2020-21 winters. High values of the mild (Figure 7a) and moderate (Figure 7b) categories were mostly observed in the southern coastal stations. In contrast, high numbers of the very (Figure 7c) and severe (Figure 7d) categories were prominently found in the northeast, north and northwest, and west. Moreover, the highest average spells in the extreme (Figure 7e) category were noticed in the northwest, which gradually decreased towards the east, south, and southeastern regions. The extreme category was the highest in Rangpur (1.29 spells/year) and Rajshahi (1.0 spells/year) divisions, and the lowest in Barishal and Chattogram, with 0.19 spells/year.
3.4. Trends in Cold Days and Spells
Significant trends were observed in the number of cold days (≥90% confidence level) in three 10-day periods of the winter months, i.e., 11–20 December, 21–31 December, and 1–10 January (Table 2). For instance, cold days of six weather stations in Rajshahi, Rangpur, and Mymensingh divisions exhibited significant increasing trends for the period of 11–20 December, with magnitude ranges from 0.45 to 1.88 days/decade. In the period of 21–31 December, three stations in Dhaka, Barishal, and Chattogram divisions (southern part of the country), one in each, demonstrated increasing trends with magnitude ranges from 1.43 to 1.85 days/decade. However, three stations, one in Khulna division and two in Chattogram, indicated decreasing trends (magnitude ranges from −0.29 to −1.03 days/decade) in the cold days of the 1–10 January period. At the monthly scale, cold days in 13 weather stations showed significant trends in December, with 90 and 95% confidence levels; however, no significant trends were observed in January and February. The increasing trends of cold days were found to be highest in Rajshahi and Madaripur (3.33 days/decade), followed by Mymensingh (3.25 days/decade) and Bhola (3.04 days/decade). Furthermore, the total number of cold days in the winter season did not show any significant trend over the study period from 2000–2001 to 2020–2021.
Significant monthly and seasonal trends were not observed in the number of cold spells during the study period.
4. Discussion
The primary estimation showed a general pattern of having a higher number of cold days in the western and northwestern parts of the country, which decreased gradually towards the northeast and southeast, and some coastal stations in the south having a higher number of cold days (see Figure 3). However, coastal stations were supposed to have a smaller number of cold days compared to other parts of the country due to their close presence to a larger waterbody, the Bay of Bengal. This was discussed in detail by Alam et al. [4,28], including the relationship with water depth for any variations observed in the coastal stations [28]. The study also indicated that the occurrence of more cold days had a relationship with higher elevation. Nevertheless, the final estimation, using a Tthreshold (17 °C) approach to remove the discrepancies (between observed and calculated cold days), was able to minimize the number of cold days in the coastal stations, where appropriate. In fact, a similar approach was also reported in other studies when methods such as SD [28] and absolute threshold [53] were applied.
In this study, the application of the 10-percentile (10P) method was applied to calculate the final estimation of cold days and spells during the winter season in Bangladesh to understand its performance in comparison to the SD method and the traditional BMD threshold. The results were validated by Baten et al. [53], who determined cold days and spells from the daily temperature dynamics during 1988–2017, but the used method of the absolute Tmin threshold was different than our proposed 10P. At present, BMD uses 10 °C thresholds of Tmin for calculating cold days in Bangladesh. This threshold of Tmin is applicable all over the country (e.g., coastal stations, hilly stations, and plain land), but the dynamics of temperature are not uniform all through. The long-term average Tmin observed in the month of January at northeastern Sreemangal station for the periods of 1961–1990 and 1991–2020 is 8.89 °C and 9.84 °C, and at southeastern Cox’s Bazaar station is 14.80 °C and 15.54 °C, respectively. The long-term average minimum temperature at Sreemangal is found below 10 °C, but the threshold of minimum temperature for identification of cold is 10 °C, which is not justifiable. The threshold of minimum temperature should be a few degrees lower than that of the average minimum temperature. The 10P of temperature depends on the station itself, and it varies from station to station. In the case of the threshold of minimum temperature, the diurnal temperature range (DTR) is not considered. Alam et al. [4] observed when the maximum temperature is less than or equal to 21 °C, the cold-related mortality is found to be at its maximum, which indicates the dependence on maximum temperature. Therefore, a case study was considered for the period 3–7 January 2023, in winter, to evaluate the SD, 10P, and BMD threshold methods’ calculated categories of cold days (see Table 3) with the newspaper’s reported intensity of cold conditions. In fact, the daily national newspapers usually publish articles on the intensity of cold conditions in different parts of the country, including the number of cold-related deaths (mortality).
According to BMD, mild cold weather was occurring in certain regions of the country during the period 5–7 January 2023. However, it did not reflect the actual cold conditions reported in the newspapers, where felt like cold conditions were much worse in most parts of the country, except for the southern coast and few areas in the hill tracts (see Table 3). BMD is considered a cold day when the minimum temperature is less than or equal to 10 °C. According to BMD, the maximum temperature and or DTR has no effect on a cold day. Our calculation from the 10P method, including the SD method [28], presented stations in those areas with moderate (Mo) to extreme (Ex) cold days, where BMD provided only mild (Mi) cold days, even in fewer stations (see Table 3). Our 10P calculation nearly matched with the newspapers reporting cold conditions in different areas of the country during the case study period.
For instance, two leading national daily newspapers published the following articles related to the period of 5–7 January 2023. The intensity of cold conditions increased in Dhaka, and continued. The lowest temperature was recorded 8.4 °C in Chuadanga (The Daily Ittefaq, 7 January 2023) [54]. Severe cold and dense fog disrupted normal life in most parts of the country, including the capital city, with a temperature of 12.5 °C (Prothom Alo, 7 January 2023). The number of child patients increased in Khulna Medical College Hospital due to the cold weather severity in Khulna and the surrounding areas (Prothom Alo, 7 January 2023). Large areas of the country, including Dhaka, were shivering due to a continuous cold during the last few days. Although the minimum temperature at Dhaka was 11.5 °C on 7 January 2023, it felt like the condition was much lower (Prothom Alo, 8 January 2023).
- Therefore, it warrants declaring the cold days and spells in Bangladesh using a revised and effective method such as 10P for better preparedness and to save vulnerable lives.
Considering significant increasing trends observed in the number of cold days during the winter months in many weather stations, Bangladesh requires an institutional framework to mitigate the high cold-related mortality [4]. This could include building heated shelters to refuge the vulnerable population during the high intensity of cold days and spells, which would minimize cold-related mortality.
5. Conclusions
The temperature thresholds were used with the daily Tmin and Tmax for the winter seasons from 2000 to 2021 to calculate the cold days, cold spells, and their rate of change. The cold days and spells were further categorized into five classes, namely extreme (≤13 °C), severe (>13 to 14 °C), very (>14 to 15 °C), moderate (>15 to 16 °C), and mild (>16 to 17 °C). A higher number of cold days occurred in the western and northwestern parts of Bangladesh, with an average of 4–6, 6–8, 1–2, and 12–16 days per year in December, January, February, and the entire winter season, respectively. The period of 11–20 January showed the highest number of cold days (25.54%) in the winter months. In general, higher cold days were observed in the northwest and west, and it declined gradually towards the south, southeast, and east of the country. Likewise, the number of very, severe, and extreme categories of cold days was higher in the western to northwestern regions, reducing linearly towards the east and southeast and found minimum in the coastal areas. On the other hand, the mild and moderate categories of cold days were found to be higher in number in the southern coastal stations and gradually decreased towards the north and northwest. Cold spells followed nearly similar patterns of cold days in time and space, with few exceptions. The significant increasing trends of cold days were found during 11–20 December, 21–31 December, and the whole month of December for a total of 5, 3, and 13 weather stations, respectively. In contrast, significant decreasing trends were noticed during 1–10 January in three stations. Overall, the proposed 10P method portrayed a better scenario of cold days/spells in time and space, compared to the traditional single BMD threshold for the entire country. Based on the above findings, the proposed 10P method could be used in Bangladesh for calculating cold days and spells, with a thorough review before applying it for operational purposes.
Author Contributions
Conceptualization, M.M.A., A.S.M.M., M.R.A. and Q.K.H.; methodology, M.M.A., A.S.M.M., M.R.A. and Q.K.H.; formal analysis, M.M.A., A.S.M.M. and M.R.A.; writing—original draft preparation, M.M.A., A.S.M.M. and M.R.A.; writing—review and editing, Q.K.H.; supervision, Q.K.H. All authors have read and agreed to the published version of the manuscript.
Funding
This research received no external funding.
Institutional Review Board Statement
Not applicable.
Informed Consent Statement
Not applicable.
Data Availability Statement
Output data are available in the figures and tables of the manuscript.
Acknowledgments
The authors thank Bangladesh Meteorological Department (BMD) for providing air temperature data for this research.
Conflicts of Interest
The authors declare no conflict of interest.
References
- Medina-Ramón, M.; Schwartz, J. Temperature, temperature extremes, and mortality: A study of acclimatisation and effect modification in 50 US cities. Occup. Environ. Med. 2007, 64, 827–833. [Google Scholar] [CrossRef] [Green Version]
- Curriero, F.C.; Heiner, K.S.; Samet, J.M.; Zeger, S.L.; Strug, L.; Patz, J.A. Temperature and mortality in 11 cities of the eastern United States. Am. J. Epidemiol. 2002, 155, 80–87. [Google Scholar] [CrossRef]
- Rosselló, J.; Becken, S.; Santana-Gallego, M. The effects of natural disasters on international tourism: A global analysis. Tour. Manag. 2020, 79, 104080. [Google Scholar] [CrossRef]
- Alam, M.M.; Mahtab, A.S.M.; Ahmed, M.R.; Hassan, Q.K. Developing a Cold-Related Mortality Database in Bangladesh. Int. J. Environ. Res. Public Health 2022, 19, 12175. [Google Scholar] [CrossRef] [PubMed]
- Guo, Y.; Jiang, F.; Peng, L.; Zhang, J.; Geng, F.; Xu, J.; Zhen, C.; Shen, X.; Tong, S. The association between cold spells and pediatric outpatient visits for Asthma in Shanghai, China. PLoS ONE 2012, 7, e42232. [Google Scholar] [CrossRef] [PubMed] [Green Version]
- Kysely, J.; Pokorna, L.; Kyncl, J.; Kriz, B. Excess cardiovascular mortality associated with cold spells in the Czech Republic. BMC Public Health 2009, 9, 19. [Google Scholar] [CrossRef] [Green Version]
- Hwang, S.W.; Lebow, J.M.; Bierer, M.F.; O’Connell, J.J.; Orav, E.J.; Brennan, T.A. Risk factors for death in homeless adults in Boston. Arch. Intern. Med. 1998, 158, 1454–1460. [Google Scholar] [CrossRef] [Green Version]
- Ma, W.; Yang, C.; Chu, C.; Li, T.; Tan, J.; Kan, H. The impact of the 2008 cold spell on mortality in Shanghai, China. Int. J. Biometeorol. 2013, 57, 179–184. [Google Scholar] [CrossRef]
- Vuillermoz, C.; Aouba, A.; Grout, L.; Vandentorren, S.; Tassin, F.; Moreno-Betancur, M.; Jougla, É.; Rey, G. Mortality among homeless people in France, 2008–2010. Eur. J. Public Health 2016, 26, 1028–1033. [Google Scholar] [CrossRef] [PubMed] [Green Version]
- Kalkstein, L.S.; Smoyer, K.E. The impact of climate change on human health: Some international implications. Experientia 1993, 49, 969–979. [Google Scholar] [CrossRef] [PubMed]
- Montero, J.C.; Mirón, I.J.; Criado-Álvarez, J.J.; Linares, C.; Díaz, J. Mortality from cold waves in Castile—La Mancha, Spain. Sci. Total Environ. 2010, 408, 5768–5774. [Google Scholar] [CrossRef]
- Guo, S.; Yan, D.; Gui, C. The typical hot year and typical cold year for modeling extreme events impacts on indoor environment: A generation method and case study. Build. Simul. 2020, 13, 543–558. [Google Scholar] [CrossRef]
- Hu, Y.; He, Y.; Dong, W. Changes in temperature extremes based on a 6-hourly dataset in China from 1961–2005. Adv. Atmos. Sci. 2009, 26, 1215–1225. [Google Scholar] [CrossRef]
- Staddon, P.L.; Montgomery, H.E.; Depledge, M.H. Climate warming will not decrease winter mortality. Nat. Clim. Chang. 2014, 4, 190–194. [Google Scholar] [CrossRef]
- IPCC AR5 Climate Change 2013: The Physical Science Basis. Working Group I Contribution to the Fifth Assessment Report of the Intergovernmental Panel on Climate Change; Stocker, T.F., Qin, D., Plattner, G.K., Tignor, M.M.B., Allen, S.K., Boschung, J., Nauels, A., Xia, Y., Bex, V., Midgley, P.M., Eds.; Cambridge University Press: New York, NY, USA, 2013; Volume 9781107057, ISBN 9781107415324. [Google Scholar]
- Donaldson, G.C.; Ermakov, S.P.; Komarov, Y.M.; McDonald, C.P.; Keatinge, W.R. Cold related mortalities and protection against cold in Yakutsk, eastern Siberia: Observation and interview study. Br. Med. J. 1998, 317, 978–982. [Google Scholar] [CrossRef] [Green Version]
- Xie, H.; Yao, Z.; Zhang, Y.; Xu, Y.; Xu, X.; Liu, T.; Lin, H.; Lao, X.; Rutherford, S.; Chu, C.; et al. Short-term effects of the 2008 cold spell on mortality in three subtropical cities in Guangdong province, China. Environ. Health Perspect. 2013, 121, 210–216. [Google Scholar] [CrossRef] [PubMed] [Green Version]
- Domonkos, P.; Kyselý, J.; Piotrowicz, K.; Petrovic, P.; Likso, T. Variability of extreme temperature events in south-central Europe during the 20th century and its relationship with large-scale circulation. Int. J. Climatol. 2003, 23, 987–1010. [Google Scholar] [CrossRef]
- Huynen, M.M.T.E.; Martens, P.; Schram, D.; Weijenberg, M.P.; Kunst, A.E. The impact of heat waves and cold spells on mortality rates in the Dutch population. Environ. Health Perspect. 2001, 109, 463–470. [Google Scholar] [CrossRef]
- Sun, R.; Chen, L. How can urban water bodies be designed for climate adaptation? Landsc. Urban Plan. 2012, 105, 27–33. [Google Scholar] [CrossRef]
- All India Multi-Hazard Winter Weather Warnings Bulletin; Governement of India: New Delhi, India, 2020.
- Chen, J.; Yang, J.; Zhou, M.; Yin, P.; Wang, B.; Liu, J.; Chen, Z.; Song, X.; Ou, C.Q.; Liu, Q. Cold spell and mortality in 31 Chinese capital cities: Definitions, vulnerability and implications. Environ. Int. 2019, 128, 271–278. [Google Scholar] [CrossRef]
- Hassan, Q.K.; Rahman, K.M. Remote sensing-based determination of understory grass greening stage over boreal forest. J. Appl. Remote Sens. 2013, 7, 073578. [Google Scholar] [CrossRef]
- Sekhon, N.S.; Hassan, Q.K.; Sleep, R.W. Evaluating potential of MODIS-based indices in determining “snow gone” stage over forest-dominant regions. Remote Sens. 2010, 2, 1348–1363. [Google Scholar] [CrossRef] [Green Version]
- Vardoulakis, E.; Karamanis, D.; Fotiadi, A.; Mihalakakou, G. The urban heat island effect in a small Mediterranean city of high summer temperatures and cooling energy demands. Sol. Energy 2013, 94, 128–144. [Google Scholar] [CrossRef]
- Karmakar, S. Patterns of climate change and its impacts in Northwestern Bangladesh. J. Eng. Sci. 2019, 10, 33–48. [Google Scholar]
- Khatun, M.A.; Rashid, M.B.; Hygen, H.O. Climate of Bangladesh; no. 08/2016; Norwegian Meteorological Institute, and Bangladesh Meteorological Department: Dhaka, Bangladesh, 2016; 159 p., ISSN 2387-4201.
- Alam, M.M.; Mahtab, A.S.M.; Ahmed, M.R.; Hassan, Q.K. Characterizing Cold Days and Spells and Their Relationship with Cold-Related Mortality in Bangladesh. Sensors 2023, 23, 2832. [Google Scholar] [CrossRef] [PubMed]
- Burić, D.; Doderović, M. Trend of Percentile Climate Indices in Montenegro in the Period 1961–2020. Sustainability 2022, 14, 12519. [Google Scholar] [CrossRef]
- Fu, D.; Ding, Y. The study of changing characteristics of the winter temperature and extreme cold events in China over the past six decades. Int. J. Climatol. 2021, 41, 2480–2494. [Google Scholar] [CrossRef]
- Zhang, Y.; Yang, X.; Chen, C. Substantial decrease in concurrent meteorological droughts and consecutive cold events in Huai River Basin, China. Int. J. Climatol. 2021, 41, 6065–6083. [Google Scholar] [CrossRef]
- Ceccherini, G.; Russo, S.; Ameztoy, I.; Patricia Romero, C.; Carmona-Moreno, C. Magnitude and frequency of heat and cold waves in recent decades: The case of South America. Nat. Hazards Earth Syst. Sci. 2016, 16, 821–831. [Google Scholar] [CrossRef] [Green Version]
- Wang, L.; Liu, T.; Hu, M.; Zeng, W.; Zhang, Y.; Rutherford, S.; Lin, H.; Xiao, J.; Yin, P.; Liu, J.; et al. The impact of cold spells on mortality and effect modification by cold spell characteristics. Sci. Rep. 2016, 6, 38380. [Google Scholar] [CrossRef] [Green Version]
- Huang, C.; Barnett, A.G.; Wang, X.; Tong, S. Effects of extreme temperatures on years of life lost for cardiovascular deaths: A time series study in Brisbane, Australia. Circ. Cardiovasc. Qual. Outcomes 2012, 5, 609–614. [Google Scholar] [CrossRef] [Green Version]
- Lin, Y.K.; Ho, T.J.; Wang, Y.C. Mortality risk associated with temperature and prolonged temperature extremes in elderly populations in Taiwan. Environ. Res. 2011, 111, 1156–1163. [Google Scholar] [CrossRef]
- Revich, B.A.; Shaposhnikov, D.A. Extreme temperature episodes and mortality in Yakutsk, East Siberia. Rural Remote Health 2010, 10, 1338. [Google Scholar] [CrossRef] [PubMed]
- Revich, B.; Shaposhnikov, D. Excess mortality during heat waves and cold spells in Moscow, Russia. Occup. Environ. Med. 2008, 65, 691–696. [Google Scholar] [CrossRef] [PubMed]
- Barnett, A.G.; Hajat, S.; Gasparrini, A.; Rocklöv, J. Cold and heat waves in the United States. Environ. Res. 2012, 112, 218–224. [Google Scholar] [CrossRef] [Green Version]
- Wang, Y.; Shi, L.; Zanobetti, A.; Schwartz, J.D. Estimating and projecting the effect of cold waves on mortality in 209 US cities. Environ. Int. 2016, 94, 141–149. [Google Scholar] [CrossRef] [Green Version]
- Lee, W.; Choi, H.M.; Lee, J.Y.; Kim, D.H.; Honda, Y.; Kim, H. Temporal changes in mortality impacts of heat wave and cold spell in Korea and Japan. Environ. Int. 2018, 116, 136–146. [Google Scholar] [CrossRef] [PubMed]
- Lavaysse, C.; Naumann, G.; Alfieri, L.; Salamon, P.; Vogt, J. Predictability of the European heat and cold waves. Clim. Dyn. 2019, 52, 2481–2495. [Google Scholar] [CrossRef] [Green Version]
- Mann, H.B. Nonparametric Tests Against Trend. Econometrica 1945, 13, 245–259. [Google Scholar] [CrossRef]
- Sen, P.K. Estimates of the Regression Coefficient Based on Kendall’s Tau. J. Am. Stat. Assoc. 1968, 63, 1379–1389. [Google Scholar] [CrossRef]
- Statistical Year Book Bangladesh 2020; Bangladesh Bureau of Statistics: Dhaka, Bangladesh, 2021.
- Islam, M.N.; Uyeda, H. Comparison of TRMM 3B42 products with surface rainfall over Bangladesh. In Proceedings of the IEEE 2005 International Geoscience and Remote Sensing Symposium (IGARSS’05), Seoul, Republic of Korea, 29 July 2005; Institute of Electrical and Electronics Engineers Inc.: Seoul, Republic of Korea, 2005; Volume 6, pp. 4112–4115. [Google Scholar]
- Banglapedia National Encyclopedia of Bangladesh. Bangladesh Geography. Available online: https://en.banglapedia.org/index.php?title=Bangladesh_Geography (accessed on 5 August 2021).
- Shahid, S.; Khairulmaini, O.S. Spatio-Temporal Variability of Rainfall over Bangladesh During the Time Period 1969–2003. Asia-Pacific J. Atmos. Sci. 2009, 45, 375–389. [Google Scholar]
- Alamgir, M.; Ahmed, K.; Homsi, R.; Dewan, A.; Wang, J.J.; Shahid, S. Downscaling and Projection of Spatiotemporal Changes in Temperature of Bangladesh. Earth Syst. Environ. 2019, 3, 381–398. [Google Scholar] [CrossRef]
- Rashid, H.E. Geography of Bangladesh; Routledge: New York, NY, USA; Oxon, UK, 2019; ISBN 978-0-367-01823-8. [Google Scholar]
- OCHA Bangladesh—Subnational Administrative Boundaries. Available online: https://data.humdata.org/dataset/cod-ab-bgd (accessed on 3 April 2023).
- Climpact. Available online: https://climpact-sci.org/ (accessed on 5 April 2023).
- World Meteorological Organization (WMO). Guidelines on the Defintion and Characterization of Extreme Weather and Climate Events; WMO-No. 13: Publications Board, WMO: Geneva, Switzerland, 2023; ISBN 978-92-63-11310-8. [Google Scholar]
- Baten, N.; Hossain, M.A.; Rahman, M.H.; Rahman, M.A. Cold wave condition over Bangladesh for the period of 1988-2017. Dew Drop 2022, 8, 141–151. [Google Scholar]
- The Daily Ittefaq Lowest Temperature Recorded in Chuadanga. Available online: https://en.ittefaq.com.bd/3806/Lowest-temperature-recorded-in-Chuadanga (accessed on 17 April 2023).
Figure 1.
Meteorological stations in eight divisions of the study area, Bangladesh.

Figure 2.
A schematic diagram demonstrates identifying the cold days and spells during winter using the proposed percentile method.
Figure 2.
A schematic diagram demonstrates identifying the cold days and spells during winter using the proposed percentile method.

Figure 3.
Primary estimation of average cold days using 10 percentile extremes for the winters of 2000–2001 to 2020–2021. Black dots are the meteorological stations with their IDs in blue numbers.
Figure 3.
Primary estimation of average cold days using 10 percentile extremes for the winters of 2000–2001 to 2020–2021. Black dots are the meteorological stations with their IDs in blue numbers.

Figure 4.
Spatial distribution of average cold days at different stations using the 17 °C Tthreshold for the winter months—(a) December, (b) January, (c) February, and (d) the whole winter season, during the period 2000–2001 to 2020–2021. Black dots are meteorological stations, with their IDs in blue numbers.

Figure 5.
Categories of cold days—(a) mild, (b) moderate, (c) very, (d) severe, and (e) extreme, during the winter seasons from 2000–2001 to 2020–2021. Contour represents the average cold days, and the meteorological station IDs are in blue numbers.
Figure 5.
Categories of cold days—(a) mild, (b) moderate, (c) very, (d) severe, and (e) extreme, during the winter seasons from 2000–2001 to 2020–2021. Contour represents the average cold days, and the meteorological station IDs are in blue numbers.

Figure 6.
Spatial distribution of the average number of cold spells in the winter months: (a) December, (b) January, (c) February, and (d) the whole winter season, during the period 2000–2001 to 2020–2021. Black dots are meteorological stations with their IDs in blue numbers.
Figure 6.
Spatial distribution of the average number of cold spells in the winter months: (a) December, (b) January, (c) February, and (d) the whole winter season, during the period 2000–2001 to 2020–2021. Black dots are meteorological stations with their IDs in blue numbers.

Figure 7.
Categories of the average number of cold spells: (a) mild, (b) moderate, (c) very, (d) severe, and (e) extreme, for the winters of 2000–2001 to 2020–2021. Black dots are meteorological stations with their IDs in blue numbers.
Figure 7.
Categories of the average number of cold spells: (a) mild, (b) moderate, (c) very, (d) severe, and (e) extreme, for the winters of 2000–2001 to 2020–2021. Black dots are meteorological stations with their IDs in blue numbers.


Table 1.
Example studies that used the percentile method to define cold spell.
| Reference | Period | Region/Country | Temperature | Percentile | Data Used | Defining a Cold Spell |
|---|---|---|---|---|---|---|
| [17] | 2006–2009 | Guangdong, China | Tmin | 5th | 3 cities | Cold days continue for ≥5 consecutive days. |
| [11] | 1975–2003 | Castile—La Mancha, Spain | 5th | 5 weather stations | Tmin < 5th percentile, differs from station to station. | |
| [30] | 1961–2018 | China | 5th | 1629 weather stations | Cold days continue for more than 3 days. | |
| [31] | 1961–2018 | Huai River Basin, China | 10th | 134 weather stations | Cold days continue for at least 3 consecutive days. | |
| [32] | 1981–2014 | South America | 10th | 851 GSOD station data | Cold days continue for 3 consecutive days. | |
| [12] | 2007–2009 | Shanghai, China | Tavg | 5th | 1 weather station | Cold days continue for at least 4 consecutive days. |
| [33] | 2006–2011 | China | 5th | 66 communities | Cold days continue for 2 consecutive days. | |
| [22] | 2007–2013 | China | 5th | 31 provincial capitals | Cold days continue at least 2 consecutive days. | |
| [34] | 1996–2004 | Brisbane, Australia | 1st | 1 weather station | Cold days continue for 2–4 consecutive days. | |
| [35] | 1994–2007 | Taiwan | 1st or 5th or 10th | 4 cities | Cold days for 2–3 and >3 days for 1st percentile; and 3–8 days and >8 days for 5th and 10th percentiles. | |
| [8] | 2001–2009 | Shanghai, China | 3rd | 1 weather station | Two categories: cold days continue for at least 5 and 7 consecutive days. | |
| [36] | 1999–2007 | Yakutsk, East Siberia | 1st and 3rd | 1 weather station | Cold days continue for ≥9 and ≥3 consecutive days with 3rd and 1st percentiles. | |
| [37] | 2000–2006 | Moscow, Russia | 1st and 3rd | 1 weather station | Cold days continue for ≥9 and ≥6 consecutive days with 3rd and 1st percentiles. | |
| [38] | 1987–2000 | USA | 1st to 5th | 99 cities | Cold days continue for 2 or more consecutive days. | |
| [39] | 1962–2006 | USA | 3rd and 5th | 209 cities in 9 climatic regions | Cold days continue for 2, 3, or at least 4 consecutive days. | |
| [40] | 1992–2015 | Korea and Japan | 1st or 3rd or 5th | 47 prefectures (Japan) and 6 cities (Korea) | Cold days for 2 or more consecutive days. | |
| [22] | 2007–2013 | China | Tmin or Tavg | 3rd or 5th | 31 capital cities | Cold days for 2–5 consecutive days; 5th percentile and 2 consecutive days were more suitable. |
| [41] | 1995–2015 | Europe | Tmin and Tmax | 10th | Extended ensemblesystem of ECMWF; model resolution 32 km (T639). | Cold days continue for at least 3 consecutive days. |
Table 2.
Significant trends of cold days/decade in different meteorological stations of Bangladesh for the periods of 11–20 December, 21–31 December, 1–10 January, and the month of December, during 2000–2001 to 2020–2021. CL is the confidence level.
Table 2.
Significant trends of cold days/decade in different meteorological stations of Bangladesh for the periods of 11–20 December, 21–31 December, 1–10 January, and the month of December, during 2000–2001 to 2020–2021. CL is the confidence level.
| Period | Station | Days/Decade | CL | Period | Station | Days/Decade | CL |
|---|---|---|---|---|---|---|---|
| 11–20 December | Dinajpur | 1.88 | 99 | December | Dinajpur | 2.86 | 95 |
| Rangpur | 0.45 | 95 | Rangpur | 2.86 | 90 | ||
| Rajshahi | 1.14 | 90 | Rajshahi | 3.33 | 90 | ||
| Bogura | 0.57 | 95 | Jessore | 2.68 | 90 | ||
| Ishwardi | 1.43 | 95 | Khulna | 0.91 | 90 | ||
| Mymensingh | 1.18 | 99 | Satkhira | 2.40 | 90 | ||
| 21–31 December | Madaripur | 1.60 | 90 | Madaripur | 3.33 | 95 | |
| Bhola | 1.85 | 95 | Mymensingh | 3.25 | 95 | ||
| Feni | 1.43 | 90 | Barisal | 1.72 | 90 | ||
| 1–10 January | Satkhira | −0.67 | 90 | Bhola | 3.04 | 95 | |
| Chandpur | −1.03 | 90 | Khepupara | 1.34 | 90 | ||
| M. Court | −0.29 | 90 | Feni | 2.00 | 95 | ||
| Sitakunda | 1.21 | 90 |
Table 3.
Categories of the estimated cold days in the weather stations during 5–7 January 2023, using SD, 10P, and BMD threshold methods. Cold days were categorized as mild (Mi), moderate (Mo), very (Ve), severe (Se), and extreme (Ex).
Table 3.
Categories of the estimated cold days in the weather stations during 5–7 January 2023, using SD, 10P, and BMD threshold methods. Cold days were categorized as mild (Mi), moderate (Mo), very (Ve), severe (Se), and extreme (Ex).
| Station Name | 5 January | 6 January | 7 January | ||||||
|---|---|---|---|---|---|---|---|---|---|
| SD | 10P | BMD | SD | 10P | BMD | SD | 10P | BMD | |
| Dinajpur | Mi | Mi | Mi | ||||||
| Rangpur | |||||||||
| Bogura | Ve | Mi | Mo | Ve | Mo | ||||
| Rajshahi | Mo | Mo | Mi | Ve | Ve | Ve | Ve | Mi | |
| Ishurdi | Ve | Ve | Mi | Mo | Mo | Ve | Ve | Mi | |
| Mymensingh | Mi | Mi | Mo | Mo | Ve | Ve | Mi | ||
| Sylhet | |||||||||
| Sreemangal | Mi | Mi | |||||||
| Dhaka | Mi | Mo | Se | Se | |||||
| Faridpur | Mi | Ve | Ve | Ex | Ex | Mi | |||
| Madaripur | Ve | Ve | Se | Se | Ex | Ex | Mi | ||
| Jessore | Mo | Mo | Mi | Mi | Mi | Mi | Ex | Ex | Mi |
| Khulna | Mi | Mi | Mi | Mi | Se | Se | |||
| Satkhira | Mi | Mi | Mi | Mi | Se | Se | Mi | ||
| Barisal | Mo | Mi | Mo | Ve | Mi | ||||
| Bhola | Mi | Mi | Ve | Ve | |||||
| Patuakhali | |||||||||
| Khepupara | |||||||||
| Comilla | Mo | Mo | Ve | Ve | Ve | Ve | |||
| Chandpur | Mi | Mi | Ve | Ve | Ve | Ve | |||
| Feni | Mi | Mi | Mo | Mo | Mi | Mi | |||
| M. Court | Mi | Mi | Mi | Mi | |||||
| Hatiya | |||||||||
| Sandwip | |||||||||
| Sitakunda | |||||||||
| Chattogram | |||||||||
| Rangamati | |||||||||
| Cox’s Bazaar | |||||||||
| Teknaf | |||||||||
SD = standard deviation; 10P = 10 percentile; BMD = Bangladesh Meteorological Department.
Disclaimer/Publisher’s Note: The statements, opinions and data contained in all publications are solely those of the individual author(s) and contributor(s) and not of MDPI and/or the editor(s). MDPI and/or the editor(s) disclaim responsibility for any injury to people or property resulting from any ideas, methods, instructions or products referred to in the content. |
© 2023 by the authors. Licensee MDPI, Basel, Switzerland. This article is an open access article distributed under the terms and conditions of the Creative Commons Attribution (CC BY) license (https://creativecommons.org/licenses/by/4.0/).
Share and Cite
MDPI and ACS Style
Alam, M.M.; Mahtab, A.S.M.; Ahmed, M.R.; Hassan, Q.K. A Percentile Method to Determine Cold Days and Spells in Bangladesh. Appl. Sci. 2023, 13, 7030. https://0-doi-org.brum.beds.ac.uk/10.3390/app13127030
AMA Style
Alam MM, Mahtab ASM, Ahmed MR, Hassan QK. A Percentile Method to Determine Cold Days and Spells in Bangladesh. Applied Sciences. 2023; 13(12):7030. https://0-doi-org.brum.beds.ac.uk/10.3390/app13127030
Chicago/Turabian StyleAlam, Md. Mahbub, A. S. M. Mahtab, M. Razu Ahmed, and Quazi K. Hassan. 2023. "A Percentile Method to Determine Cold Days and Spells in Bangladesh" Applied Sciences 13, no. 12: 7030. https://0-doi-org.brum.beds.ac.uk/10.3390/app13127030
Note that from the first issue of 2016, this journal uses article numbers instead of page numbers. See further details here.