
A Comprehensive Framework for Industrial Sticker Information Recognition Using Advanced OCR and Object Detection Techniques
 , , ,
, , ,  , , ,
, , ,  , , and
Abstract
:1. Introduction
2. Background
2.1. You Only Look Once (YOLO)
2.2. PaddleOCR (PP-OCR)
3. Related Work
3.1. Sticker Information Extraction
3.2. PaddleOCR System and Post-Processing Information
4. Methodology
4.1. Databases
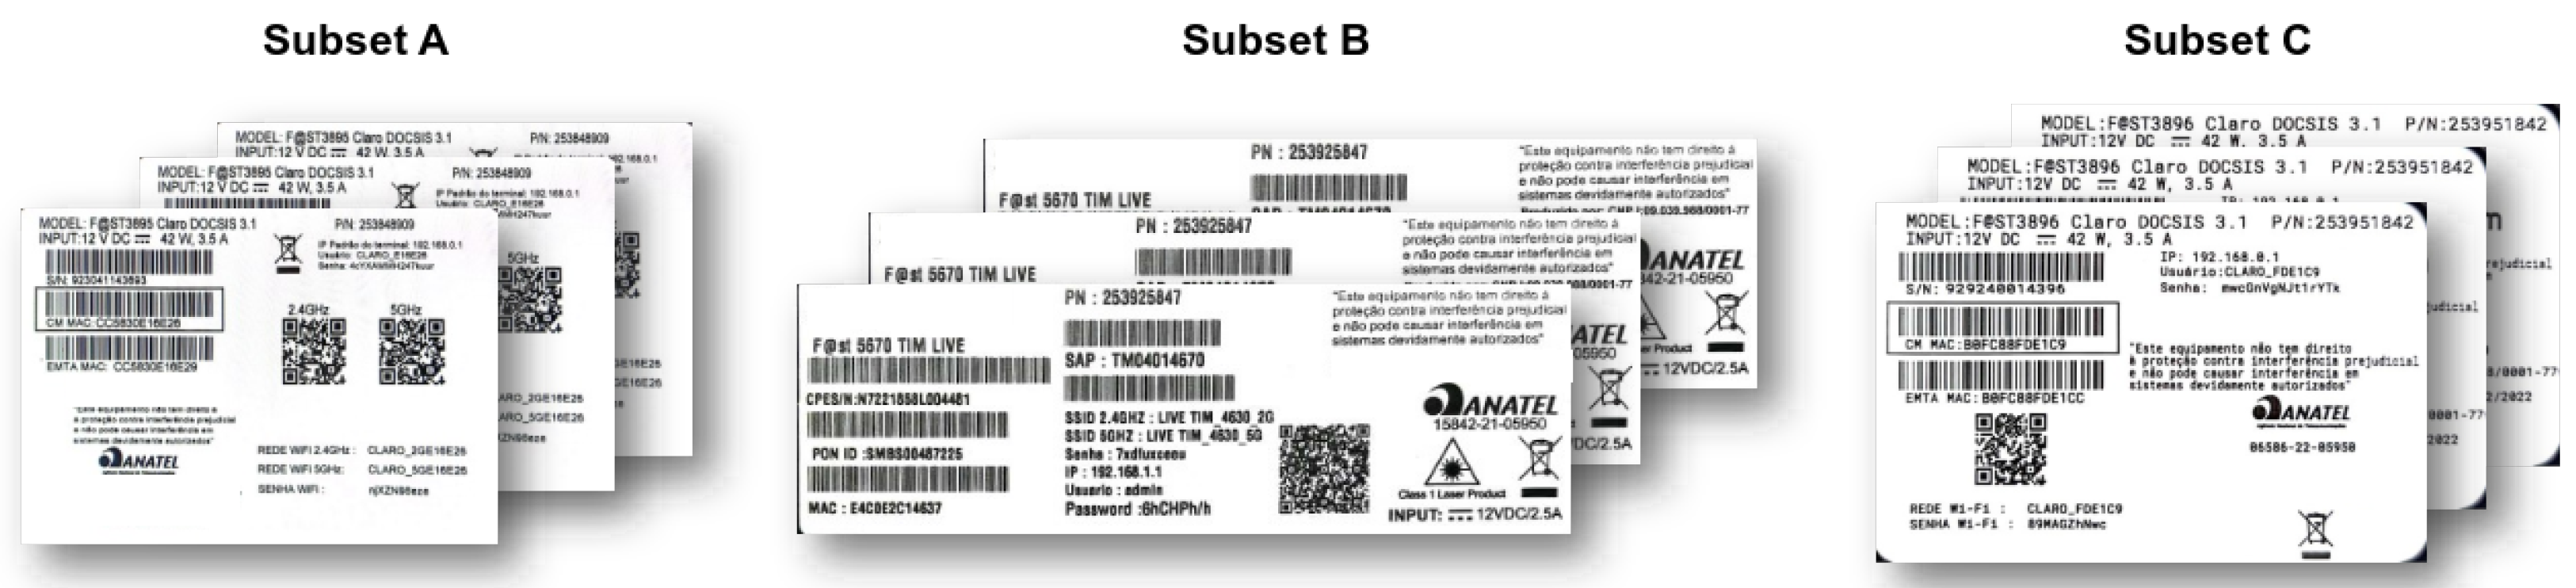
4.1.1. Stickers
4.1.2. QR Code and Barcode
4.1.3. OCR Evaluation
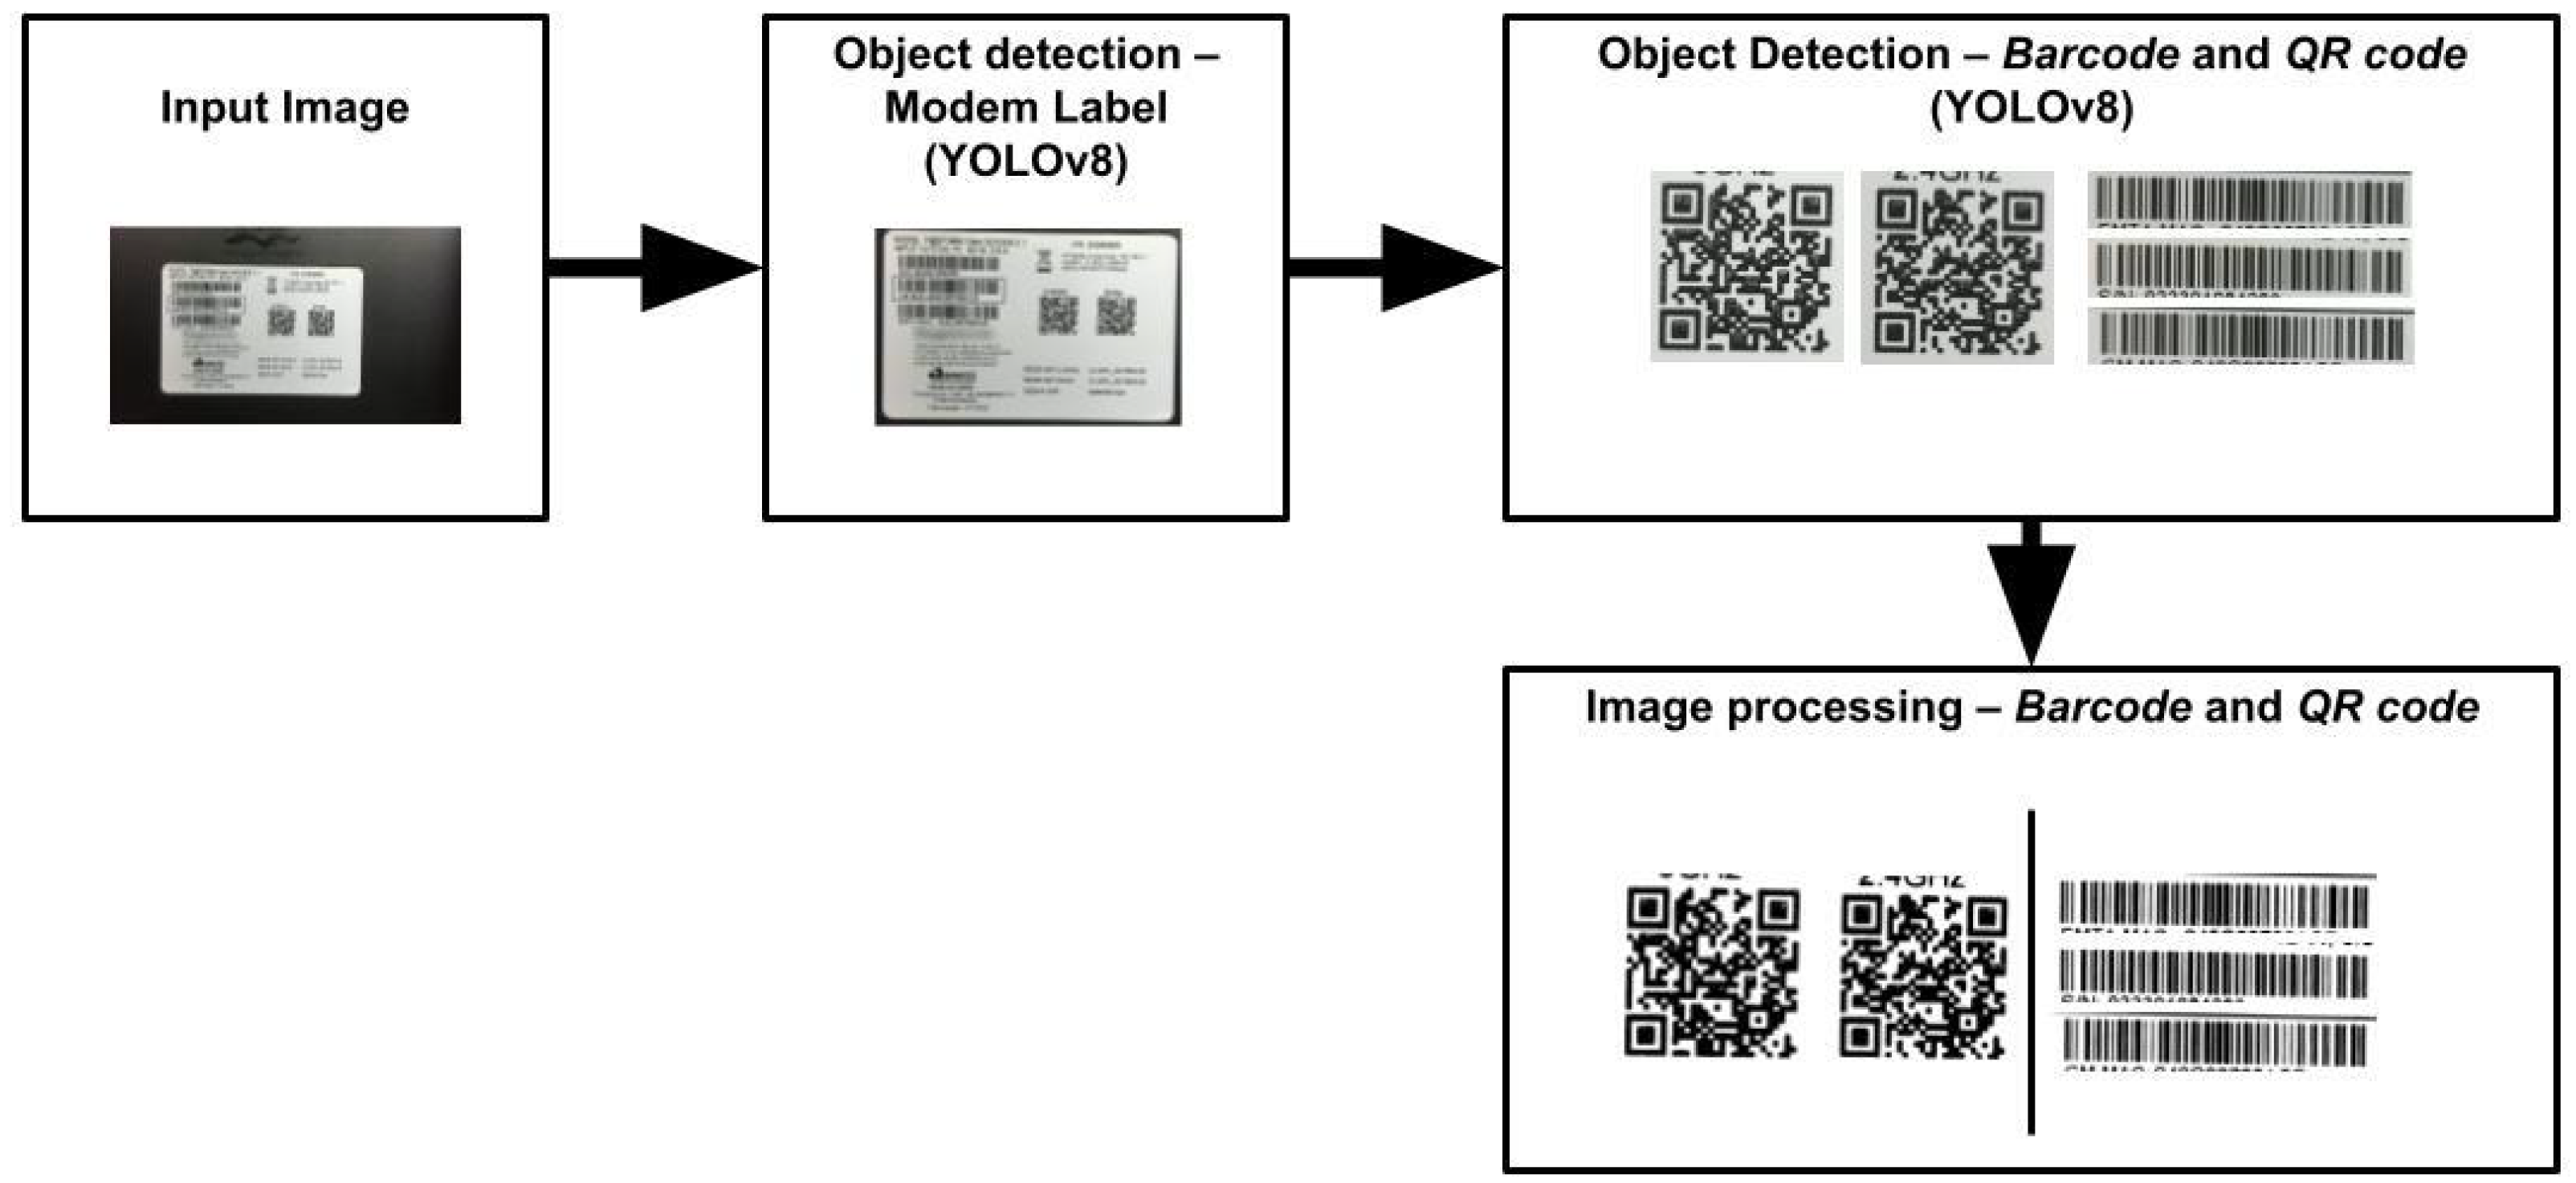
4.2. Sticker, QR Code and Barcode Detection
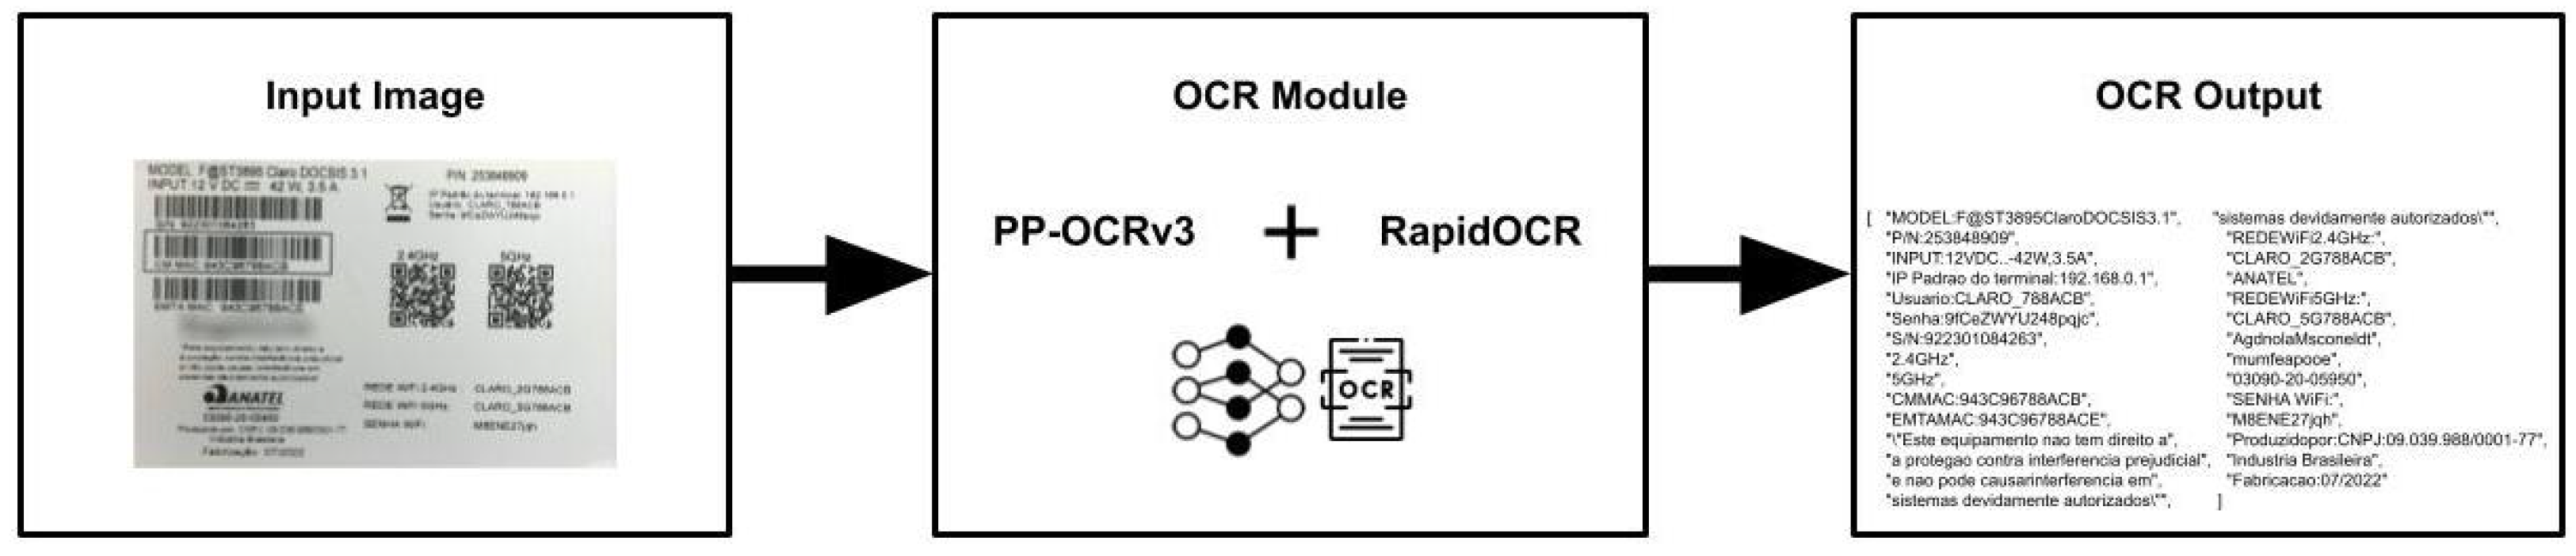
4.3. Sticker Character Recognition
4.4. Post-OCR
4.5. Evaluation Metrics
4.5.1. Object Detection
4.5.2. OCR
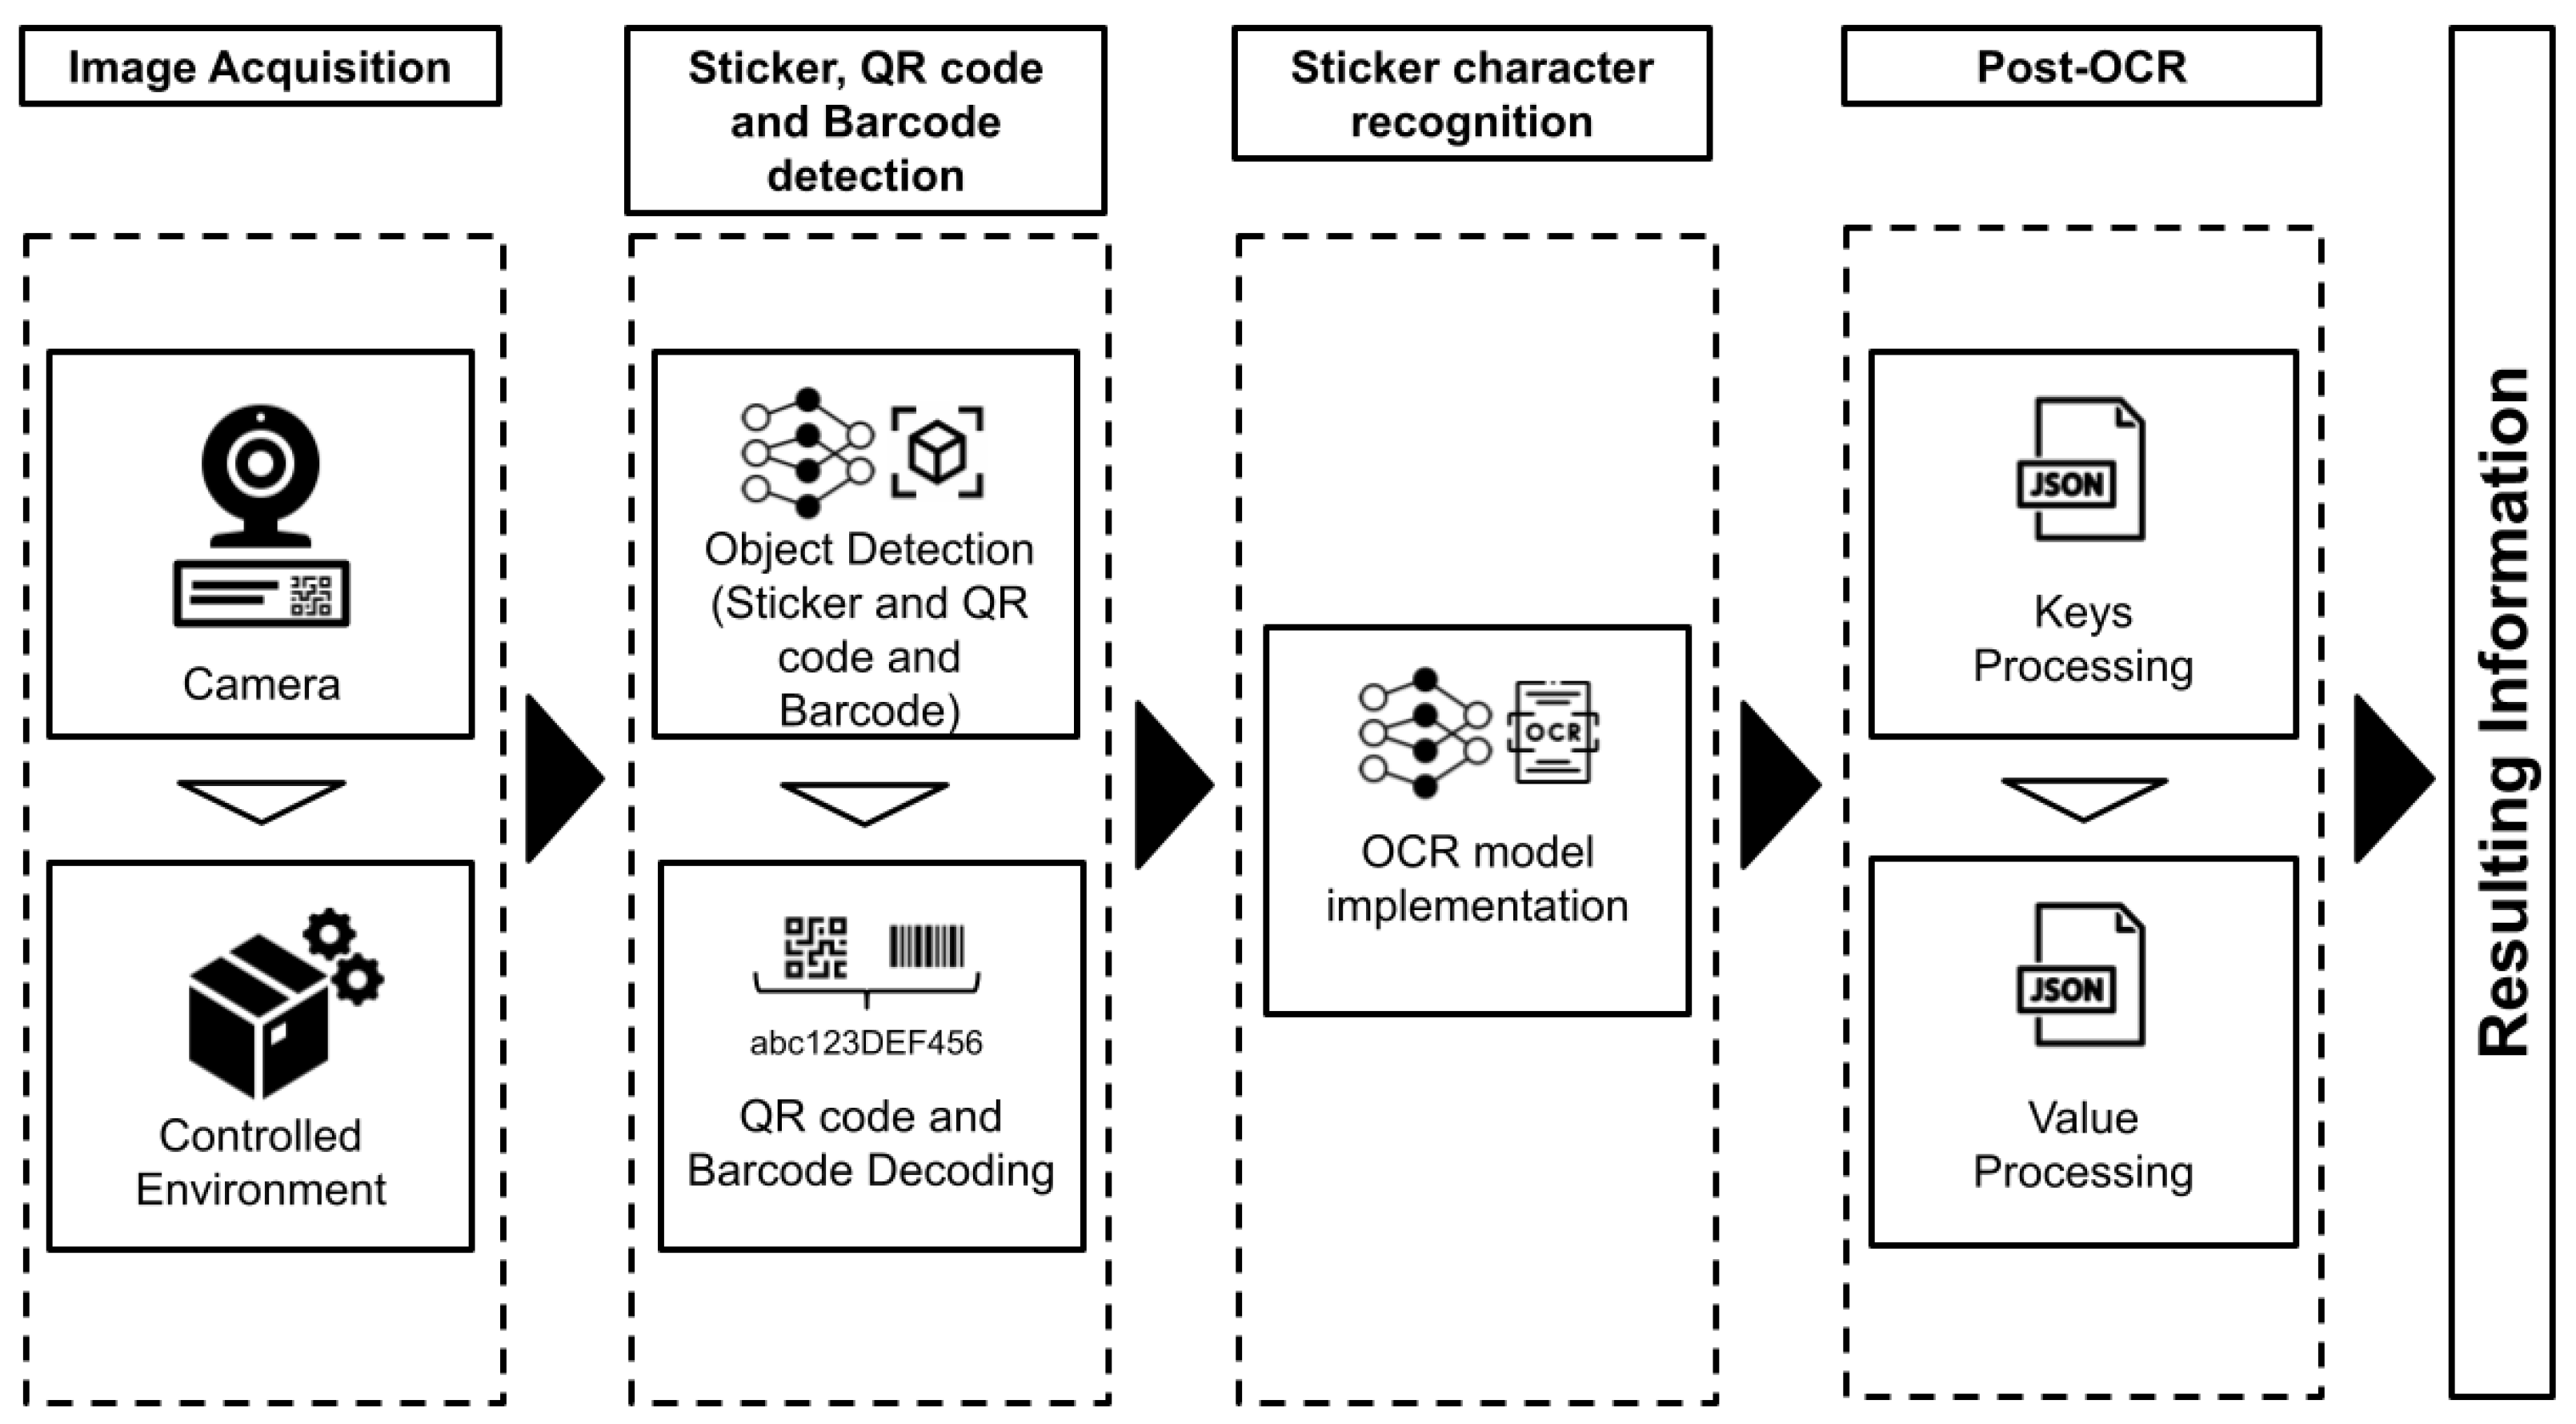
4.6. Proposed Framework
5. Results
5.1. Sticker Detection
5.2. Barcode and QR Code Detection
5.3. Sticker Textual Recognition
- (a)
- Substitution of “q” by “g”;
- (b)
- Removal of “W” when it appears more than once in a row;
- (c)
- Substitution of “j” by “i”;
- (d)
- Substitution of “t” by “f”;
- (e)
- Removal of “W” when followed by another “W”;
- (f)
- Substitution of “vv” by “w”;
- (g)
- Substitution of “w” by “W”;
- (h)
- Substitution of “z” by “Z”;
- (i)
- Removal of “v” when followed by another “v”.
6. Conclusions
Author Contributions
Funding
Institutional Review Board Statement
Informed Consent Statement
Data Availability Statement
Acknowledgments
Conflicts of Interest
References
- Peres, R.S.; Jia, X.; Lee, J.; Sun, K.; Colombo, A.W.; Barata, J. Industrial Artificial Intelligence in Industry 4.0—Systematic Review, Challenges and Outlook. IEEE Access 2020, 8, 220121–220139. [Google Scholar] [CrossRef]
- LeCun, Y.; Bengio, Y.; Hinton, G. Deep learning. Nature 2015, 521, 436–444. [Google Scholar] [CrossRef]
- Chauhan, R.; Ghanshala, K.K.; Joshi, R. Convolutional Neural Network (CNN) for Image Detection and Recognition. In Proceedings of the 2018 First International Conference on Secure Cyber Computing and Communication (ICSCCC), Jalandhar, India, 15–17 December 2018; pp. 278–282. [Google Scholar] [CrossRef]
- Aquino, G.; Costa, M.G.F.; Costa Filho, C.F.F. Explaining One-Dimensional Convolutional Models in Human Activity Recognition and Biometric Identification Tasks. Sensors 2022, 22, 5644. [Google Scholar] [CrossRef]
- Zhang, L.; Zhou, W.; Zhang, X.; Lou, X. An End-to-end Computer Vision System Architecture. In Proceedings of the 2022 IEEE International Symposium on Circuits and Systems (ISCAS), Austin, TX, USA, 27 May–1 June 2022; pp. 2338–2342. [Google Scholar] [CrossRef]
- Girshick, R.; Donahue, J.; Darrell, T.; Malik, J. Region-Based Convolutional Networks for Accurate Object Detection and Segmentation. IEEE Trans. Pattern Anal. Mach. Intell. 2016, 38, 142–158. [Google Scholar] [CrossRef]
- Redmon, J.; Farhadi, A. YOLOv3: An Incremental Improvement. arXiv 2018, arXiv:1804.02767. [Google Scholar]
- Hsu, M.M.; Wu, M.H.; Cheng, Y.C.; Lin, C.Y. An Efficient Industrial Product Serial Number Recognition Framework. In Proceedings of the 2022 IEEE International Conference on Consumer Electronics, Taipei, Taiwan, 6–8 July 2022; pp. 263–264. [Google Scholar] [CrossRef]
- Redmon, J.; Divvala, S.K.; Girshick, R.B.; Farhadi, A. You Only Look Once: Unified, Real-Time Object Detection. In Proceedings of the IEEE Conference on Computer Vision and Pattern Recognition, Las Vegas, NV, USA, 27–30 June 2016. [Google Scholar]
- Srivastava, S.; Verma, A.; Sharma, S. Optical Character Recognition Techniques: A Review. In Proceedings of the 2022 IEEE International Students’ Conference on Electrical, Electronics and Computer Science (SCEECS), Bhopal, India, 19–20 February 2022; pp. 1–6. [Google Scholar] [CrossRef]
- Jain, M.; Mathew, M.; Jawahar, C. Unconstrained OCR for Urdu using deep CNN-RNN hybrid networks. In Proceedings of the 2017 4th IAPR Asian Conference on Pattern Recognition (ACPR), Nanjing, China, 26–29 November 2017; pp. 747–752. [Google Scholar]
- Plamondon, R.; Srihari, S. Online and off-line handwriting recognition: A comprehensive survey. IEEE Trans. Pattern Anal. Mach. Intell. 2000, 22, 63–84. [Google Scholar] [CrossRef] [Green Version]
- Daraee, F.; Mozaffari, S.; Razavi, S.M. Handwritten keyword spotting using deep neural networks and certainty prediction. Comput. Electr. Eng. 2021, 92, 107111. [Google Scholar] [CrossRef]
- Vinjit, B.M.; Bhojak, M.K.; Kumar, S.; Chalak, G. A Review on Handwritten Character Recognition Methods and Techniques. In Proceedings of the 2020 International Conference on Communication and Signal Processing (ICCSP), Chennai, India, 28–30 July 2020; pp. 1224–1228. [Google Scholar] [CrossRef]
- Du, Y.; Li, C.; Guo, R.; Yin, X.; Liu, W.; Zhou, J.; Bai, Y.; Yu, Z.; Yang, Y.; Dang, Q.; et al. PP-OCR: A Practical Ultra Lightweight OCR System. arXiv 2020, arXiv:2009.09941. [Google Scholar]
- Li, C.; Liu, W.; Guo, R.; Yin, X.; Jiang, K.; Du, Y.; Du, Y.; Zhu, L.; Lai, B.; Hu, X.; et al. PP-OCRv3: More Attempts for the Improvement of Ultra Lightweight OCR System. arXiv 2022, arXiv:2206.03001. [Google Scholar]
- Ravi, N.; El-Sharkawy, M. Real-Time Embedded Implementation of Improved Object Detector for Resource-Constrained Devices. J. Low Power Electron. Appl. 2022, 12, 21. [Google Scholar] [CrossRef]
- Diwan, T.; Anirudh, G.; Tembhurne, J.V. Object detection using YOLO: Challenges, architectural successors, datasets and applications. Multimed. Tools Appl. 2023, 82, 9243–9275. [Google Scholar] [CrossRef] [PubMed]
- Li, Y.; Fan, Q.; Huang, H.; Han, Z.; Gu, Q. A Modified YOLOv8 Detection Network for UAV Aerial Image Recognition. Drones 2023, 7, 304. [Google Scholar] [CrossRef]
- Kim, J.H.; Kim, N.; Won, C.S. High-Speed Drone Detection Based On Yolo-V8. In Proceedings of the ICASSP 2023—2023 IEEE International Conference on Acoustics, Speech and Signal Processing (ICASSP), Rhodes Island, Greece, 4–10 June 2023; pp. 1–2. [Google Scholar] [CrossRef]
- Li, C.; Liu, W.L.; Guo, R.; Yin, X. Dive in to OCR; Baidu, PaddlePaddle. 2022. Available online: https://paddleocr.bj.bcebos.com/ebook/Dive_into_OCR.pdf (accessed on 9 May 2023).
- Du, Y.; Li, C.; Guo, R.; Cui, C.; Liu, W.; Zhou, J.; Lu, B.; Yang, Y.; Liu, Q.; Hu, X.; et al. PP-OCRv2:Bag of tricks for ultra lightweight OCR system. arXiv 2021, arXiv:2109.03144. [Google Scholar]
- Song, S.; Shi, X.; Song, G.; Huq, F.A. Linking digitalization and human capital to shape supply chain integration in omni-channel retailing. Ind. Manag. Data Syst. 2021, 121, 2298–2317. [Google Scholar] [CrossRef]
- Antonio, J.; Putra, A.R.; Abdurrohman, H.; Tsalasa, M.S. A Survey on Scanned Receipts OCR and Information Extraction. February 2022. Available online: https://www.researchgate.net/publication/358405430_A_Survey_on_Scanned_Receipts_OCR_and_Information_Extraction (accessed on 8 May 2023).
- Subedi, B.; Yunusov, J.; Gaybulayev, A.; Kim, T.H. Development of a low-cost industrial OCR system with an end-to-end deep learning technology. IEMEK J. Embed. Syst. Appl. 2020, 15, 51–60. [Google Scholar]
- Gromova, K.; Elangovan, V. Automatic Extraction of Medication Information from Cylindrically Distorted Pill Bottle Labels. Mach. Learn. Knowl. Extr. 2022, 4, 852–864. [Google Scholar] [CrossRef]
- Gregory, S.; Singh, U.; Gray, J.; Hobbs, J. A computer vision pipeline for automatic large-scale inventory tracking. In Proceedings of the 2021 ACM Southeast Conference, Virtual Event, 15–17 April 2021; pp. 100–107. [Google Scholar]
- Santiago Garcia, E. Country-Independent MRTD Layout Extraction and Its Applications. Master’s Thesis, University of Twente, Enschede, The Netherlands, 2022. [Google Scholar]
- Li, S.; Ma, X.; Pan, S.; Hu, J.; Shi, L.; Wang, Q. VTLayout: Fusion of Visual and Text Features for Document Layout Analysis. In Proceedings of the PRICAI 2021: Trends in Artificial Intelligence: 18th Pacific Rim International Conference on Artificial Intelligence, PRICAI 2021, Hanoi, Vietnam, 8–12 November 2021; Proceedings, Part I 18. Springer: Berlin/Heidelberg, Germany, 2021; pp. 308–322. [Google Scholar]
- Dahlberg, E.; Lehtonen, T.; Yllikäinen, M. Tag Recognition from Panoramic Scans of Industrial Facilities. 2022. Available online: https://www.utupub.fi/handle/10024/154486 (accessed on 10 May 2023).
- Smith, R. An Overview of the Tesseract OCR Engine. In Proceedings of the ICDAR ’07: Ninth International Conference on Document Analysis and Recognition, Washington, DC, USA, 23–26 September 2007; pp. 629–633. [Google Scholar]
- Nguyen, T.T.H.; Jatowt, A.; Coustaty, M.; Doucet, A. Survey of Post-OCR Processing Approaches; Association for Computing Machinery: New York, NY, USA, 2021; Volume 54. [Google Scholar] [CrossRef]
- Mei, J.; Islam, A.; Moh’d, A.; Wu, Y.; Milios, E. Statistical learning for OCR error correction. Inf. Process. Manag. 2018, 54, 874–887. [Google Scholar] [CrossRef]
- Khosrobeigi, Z.; Veisi, H.; Ahmadi, H.R.; Shabanian, H. A rule-based post-processing approach to improve Persian OCR performance. Sci. Iran. 2020, 27, 3019–3033. [Google Scholar] [CrossRef]
- Kaló, Á.Z.; Sipos, M.L. Key-Value Pair Searhing System via Tesseract OCR and Post Processing. In Proceedings of the 2021 IEEE 19th World Symposium on Applied Machine Intelligence and Informatics (SAMI), Herl’any, Slovakia, 21–23 January 2021; pp. 000461–000464. [Google Scholar]
- Desai, M.; Mewada, H. A novel approach for yoga pose estimation based on in-depth analysis of human body joint detection accuracy. PeerJ Comput. Sci. 2023, 9, e1152. [Google Scholar] [CrossRef]
- Bradski, G. The OpenCV Library. Dr. Dobb’s J. Softw. Tools. 2000. Available online: https://opencv.org/ (accessed on 9 May 2023).
- ZBar Development Team. ZBar: Barcode Reader Software. Available online: https://zbar.sourceforge.net/index.html (accessed on 9 May 2023).
- RapidAI. RapidOCR: Open-Source Optical Character Recognition. Available online: https://github.com/RapidAI/RapidOCR (accessed on 9 May 2023).
- Zhu, H.; Wei, H.; Li, B.; Yuan, X.; Kehtarnavaz, N. A review of video object detection: Datasets, metrics and methods. Appl. Sci. 2020, 10, 7834. [Google Scholar] [CrossRef]
- Padilla, R.; Passos, W.L.; Dias, T.L.; Netto, S.L.; Da Silva, E.A. A comparative analysis of object detection metrics with a companion open-source toolkit. Electronics 2021, 10, 279. [Google Scholar] [CrossRef]
- Padilla, R.; Netto, S.L.; Da Silva, E.A. A survey on performance metrics for object-detection algorithms. In Proceedings of the 2020 International Conference on Systems, Signals and Image Processing (IWSSIP), Niterói, Brazil, 1–3 July 2020; pp. 237–242. [Google Scholar]
- Jaccard, P. Étude comparative de la distribution florale dans une portion des Alpes et des Jura. Bull. Soc. Vaudoise Sci. Nat. 1901, 37, 547–579. [Google Scholar]
- Nguyen, T.T.H.; Jatowt, A.; Coustaty, M.; Doucet, A. Survey of post-OCR processing approaches. ACM Comput. Surv. (CSUR) 2021, 54, 1–37. [Google Scholar] [CrossRef]


| Key | Format | Value |
|---|---|---|
| P/N | DDDDDDDDD | 253951842 |
| IP | DDD$.$DDD$.$D$.$D | 192.168.0.1 |
| Usuário | $CLARO_$BBBBBB | CLARO_FDBBD5 |
| Senha | FFFFFFFFFF | ghykmcUG827zxVA |
| S/N | DDDDDDDDDDDD | 929240013008 |
| CM MAC | HHHHHHHHHHHH | B0FC88FDBBD5 |
| EMTA MAC | HHHHHHHHHHHH | B0FC88FDBBD8 |
| REDE Wi-Fi | $CLARO$BBBBBB | CLARO_FDBBD5 |
| SENHA Wi-Fi | FFFFFFFFFFFFFFF | jNyYUUnJtg |
| MODEL | $F@ST3895 Claro DOCSIS 3.1$ | F@ST3896 Claro DOCSIS 3.1 |
| Classes | Precision | Recall | [email protected] | [email protected]:0.95 |
|---|---|---|---|---|
| Modem Sticker | 0.972 | 0.966 | 0.992 | 0.930 |
| Classes | Precision | Recall | [email protected] | [email protected]:0.95 |
|---|---|---|---|---|
| All | 0.982 | 0.968 | 0.984 | 0.861 |
| QR code | 0.987 | 0.972 | 0.988 | 0.855 |
| Barcode | 0.977 | 0.964 | 0.979 | 0.868 |
| Subset | Number of Images | CER (%) | FER (%) | Sticker Accuracy |
|---|---|---|---|---|
| A | 43 | 0.21 (0.42) | 2.16 (3.87) | 0.76 |
| B | 40 | 0.04 (0.16) | 0.62 (2.19) | 0.92 |
| C | 22 | 0.31 (1.42) | 0.34 (1.56) | 0.95 |
| All | 105 | 0.17 | 1.04 | 0.88 |
| Field | CER (%) | FER (%) |
|---|---|---|
| CM MAC | 0 | 0 |
| EMTA MAC | 0 | 0 |
| IP address | 0 | 0 |
| MODEL | 0 | 0 |
| P/N | 0 | 0 |
| NETWORK Wi-Fi 2.4 GHz | 0 | 0 |
| NETWORK Wi-Fi 5 GHz | 0 | 0 |
| S/N | 0 | 0 |
| PASSWORD Wi-Fi | 1.19 | 9.52 |
| Password | 1.11 | 14.29 |
| User | 0 | 0 |
| Field | CER (%) | FER (%) |
|---|---|---|
| IP | 0 | 0 |
| MAC | 0.21 | 2.50 |
| Model | 0 | 0 |
| PN | 0 | 0 |
| PON/ID | 0 | 0 |
| Password | 0 | 0 |
| S/N | 0.33 | 5.00 |
| SAP | 0 | 0 |
| SSID 2.4 GHZ | 0 | 0 |
| SSID 5 GHZ | 0 | 0 |
| Senha 5 GHZ | 0 | 0 |
| User | 0 | 0 |
| Field | CER (%) | FER (%) |
|---|---|---|
| CM MAC | 0 | 0 |
| EMTA MAC | 0 | 0 |
| IP | 0 | 0 |
| MODEL | 0.31 | 0.34 |
| P/N | 0 | 0 |
| REDE Wi-Fi | 0 | 0 |
| S/N | 0 | 0 |
| SENHA Wi-Fi | 0 | 0 |
| Password | 0 | 0 |
| User | 0 | 0 |
Disclaimer/Publisher’s Note: The statements, opinions and data contained in all publications are solely those of the individual author(s) and contributor(s) and not of MDPI and/or the editor(s). MDPI and/or the editor(s) disclaim responsibility for any injury to people or property resulting from any ideas, methods, instructions or products referred to in the content. |
© 2023 by the authors. Licensee MDPI, Basel, Switzerland. This article is an open access article distributed under the terms and conditions of the Creative Commons Attribution (CC BY) license (https://creativecommons.org/licenses/by/4.0/).
Share and Cite
Monteiro, G.; Camelo, L.; Aquino, G.; Fernandes, R.d.A.; Gomes, R.; Printes, A.; Torné, I.; Silva, H.; Oliveira, J.; Figueiredo, C. A Comprehensive Framework for Industrial Sticker Information Recognition Using Advanced OCR and Object Detection Techniques. Appl. Sci. 2023, 13, 7320. https://0-doi-org.brum.beds.ac.uk/10.3390/app13127320
Monteiro G, Camelo L, Aquino G, Fernandes RdA, Gomes R, Printes A, Torné I, Silva H, Oliveira J, Figueiredo C. A Comprehensive Framework for Industrial Sticker Information Recognition Using Advanced OCR and Object Detection Techniques. Applied Sciences. 2023; 13(12):7320. https://0-doi-org.brum.beds.ac.uk/10.3390/app13127320
Chicago/Turabian StyleMonteiro, Gabriella, Leonardo Camelo, Gustavo Aquino, Rubens de A. Fernandes, Raimundo Gomes, André Printes, Israel Torné, Heitor Silva, Jozias Oliveira, and Carlos Figueiredo. 2023. "A Comprehensive Framework for Industrial Sticker Information Recognition Using Advanced OCR and Object Detection Techniques" Applied Sciences 13, no. 12: 7320. https://0-doi-org.brum.beds.ac.uk/10.3390/app13127320