1. Introduction
According to the Pan American Health Organization (PAHO), 1.35 million people die from road traffic crashes, and millions of people are injured worldwide. In middle- and low-income countries, 90 percent of deaths are caused by traffic accidents, accounting for approximately 3 percent of PBI [
1]. In the case of Peru, in the first seven months of 2022, more than 47,600 traffic accidents were reported, causing the death of 1853 people, which is a monthly average of 265 victims in traffic accidents. In 2021, there were more than 74,620 traffic accidents causing the death of 30,032 people [
2], which is alarming. Of all the possible causes, the human factor is one of the main factors, representing 93.9% (27,396) of road accidents caused by drivers in 2022 [
3]. The majority of vehicle accidents are caused by driver drowsiness while driving.
In order to reduce accidents due to drowsiness, there are current studies that provide different methods to detect driver drowsiness in time to avoid an accident. According to the study by Albadawi et al. [
4], four measures are determined for the detection of drowsiness, one of them is based on the vehicle, taking the angle of the steering wheel and the deviation from the highway lane; another is based on bio-signals such as electrocardiography (ECG), electroencephalography (EEG), electrooculogram (EOG), etc. Biosignal measures are very accurate but invasive for drivers. The other measure is based on image analysis, specifically focusing on the eyes, mouth and head position; this measure is widely used because it is non-invasive and does not cause discomfort to the driver. Furthermore, most drowsiness signals are presented in facial features, so it is easier to determine when a driver shows symptoms of drowsiness. The last method is a combination of the three measures mentioned above.
In the research by Vikranth et al. [
5], a compilation of 24 studies with various methods for drowsiness detection with deep learning is presented. The author presents the use of CNNs based on ResNet50, MobileNetV2, VGG16, Inception and GoogleLeNet as the best performers for drowsiness classification in images.
Currently, there are several databases for drowsiness detection, among them we have NTHU-DDD [
6], YawDDD [
7], MRL Eye [
8], UTA-RLDD [
9], NITYMED [
10], etc. The latter database, NITYMED, presents videos of people driving in a real uncontrolled environment with different light conditions, manifesting drowsiness symptoms through the eyes and mouth. The other databases are mostly in a controlled environment, where people simulate drowsiness symptoms. Therefore, in comparison with the aforementioned databases, NITYMED presents a more realistic approach to the presence of drowsiness in drivers, which makes it suitable for use in this research.
This paper presents an approach to determining driver drowsiness by digital image analysis, exploring the state of the eyes (open or closed) using methods that implement deep learning such as convolutional neural networks (CNNs). For the selection of the region of interest, an approach for the correction of points near the eyes is proposed. Based on Vikranth et al. [
5], three CNN architectures will be used as a basis: InceptionV3 [
11], VGG16 [
12] and ResNet50V2 [
13], which use transfer learning [
14] and MediaPipe [
15] for facial point detection and region of interest (ROI) extraction. The authors also adapted the fully connected network for the binary classification of drowsiness. For the identification of drowsiness in drivers in a real environment, the probability of the ROI belonging to the drowsiness class is evaluated and subsequently used as the proposal presented by [
16], which consists of counting the time of a normal blinking eye from 100 to 300 ms; when the eyes are closed for more than 300 ms it is considered a drowsy state.
The paper is organized as follows:
Section 2 describes the literature related to drowsiness detection;
Section 3 describes the materials and methods used;
Section 4 shows the results obtained and their analysis for each CNN architecture, obtaining a model for each. Finally,
Section 5 presents the conclusions and future research.
2. Related Work
In the research of Park et al. [
17], an architecture called deep drowsiness detection (DDD) is proposed, which processes RGB videos that focus on the driver’s entire face. The DDD architecture makes use of three architectures: AlexNet, VGG-FaceNet and FlowImageNet, where the output of the three networks are unified in order to classify the drowsiness in frames of the input videos. To test the proposed model, the authors use the NTHU drowsy driver detection (NTHU-DDD) database, achieving an average accuracy of 73.06% during their experimental results.
Chirra et al. [
18] proposed an architecture that specifically uses the eye region. For the extraction of the eye region, the Haar Cascade technique proposed by Viola Jones was used. To detect the face and eyes, the ROI of the eyes becomes the input of their CNN where they used a database collected for the training of their network, obtaining an accuracy of 98% in training, 97% in validation and 96.42% in the final test.
In the approach of Zhao et al. [
19], the authors used facial characteristic points for drowsiness detection and classification. They made use of an MTCNN (multi-task cascaded convolutional network) for face detection and characteristic point location, extracting ROIs from the eyes and mouth that pass to their network called EM-CNN, where they make a classification of four classes, two for the eyes state and two for the mouth state. Their tests were performed on a database provided by the company Biteda, where they obtained 93.623% accuracy compared to other types of architectures.
In the proposal by Phan et al. [
20], two methods were proposed for drowsiness detection, the first one uses characteristic points of the face focusing on the eyes and mouth using the Dlib library, applying thresholds to determine if it is yawning or blinking. The second method uses MobileNet-V2 and ResNet-50V2 networks using transfer learning. For the training of CNNs, the authors collected images from various sources to generate their dataset, obtaining an average result of 97% accuracy.
In the system presented by Rajkar et al. [
21], Haar Cascade was used to extract the eyes. The ROI extraction was performed for each eye separately after detecting the face, then the proposed architecture was used for training, using two databases: YawDDD and Closed Eyes In The Wild. The authors achieved an accuracy of 96.82%.
In the research presented by Hashemi et al. [
22], a drowsiness detection system was proposed by training three CNNs, one designed by the authors and the others by transfer learning using VGG16 and VGG19. The face detection was performed by Haar Cascade, and then Dlib was used to detect the eye points and thus delimit the region of interest for the training of the three networks using the ZJU Eyeblink database. Their results showed an accuracy of 98.15% with the proposed network.
In the proposal presented by Alameen and Alhothali [
23], a 3D-CNN was implemented for the extraction of spatio-temporal features; these learned features were used as inputs for a long-term short-term memory (LSTM). The authors propose two 3D-CNN+LSTM models (A and B) tested on two datasets (3MDAD and YawDDD), obtaining a 96% accuracy on YawDDD.
Gomaa et al. [
24] proposed several architectures combined with CNN and LSTM, the CNNs were based on ResNet, VGG-16, GoogleNet and MobileNet. The authors also propose their own architecture called “CNN-LSTM”, training and testing the architectures on the “NTHU” dataset. Their network “CNN-LSTM” obtained an accuracy of 98.3% in training and 97.31% in testing, outperforming the other four networks.
Singh et al. [
25] presented a system to detect drowsiness based on eye aspect ratio (EAR) combined with PERCLOS, which calculates the percentage of eye closure for a period of time. They used Dlib for eye point extraction, which is necessary for EAR. Their system had an 80% accuracy for their presented method.
Finally, in the research of Tibrewal et al. [
26], they proposed a CNN architecture. For learning and testing, the MRL eye database was used, which provides images of a single eye. For eye ROI extraction, the Dlib library was used. The authors obtained 94% average accuracy in drowsiness detection by focusing on the eye state.
3. Proposed Method
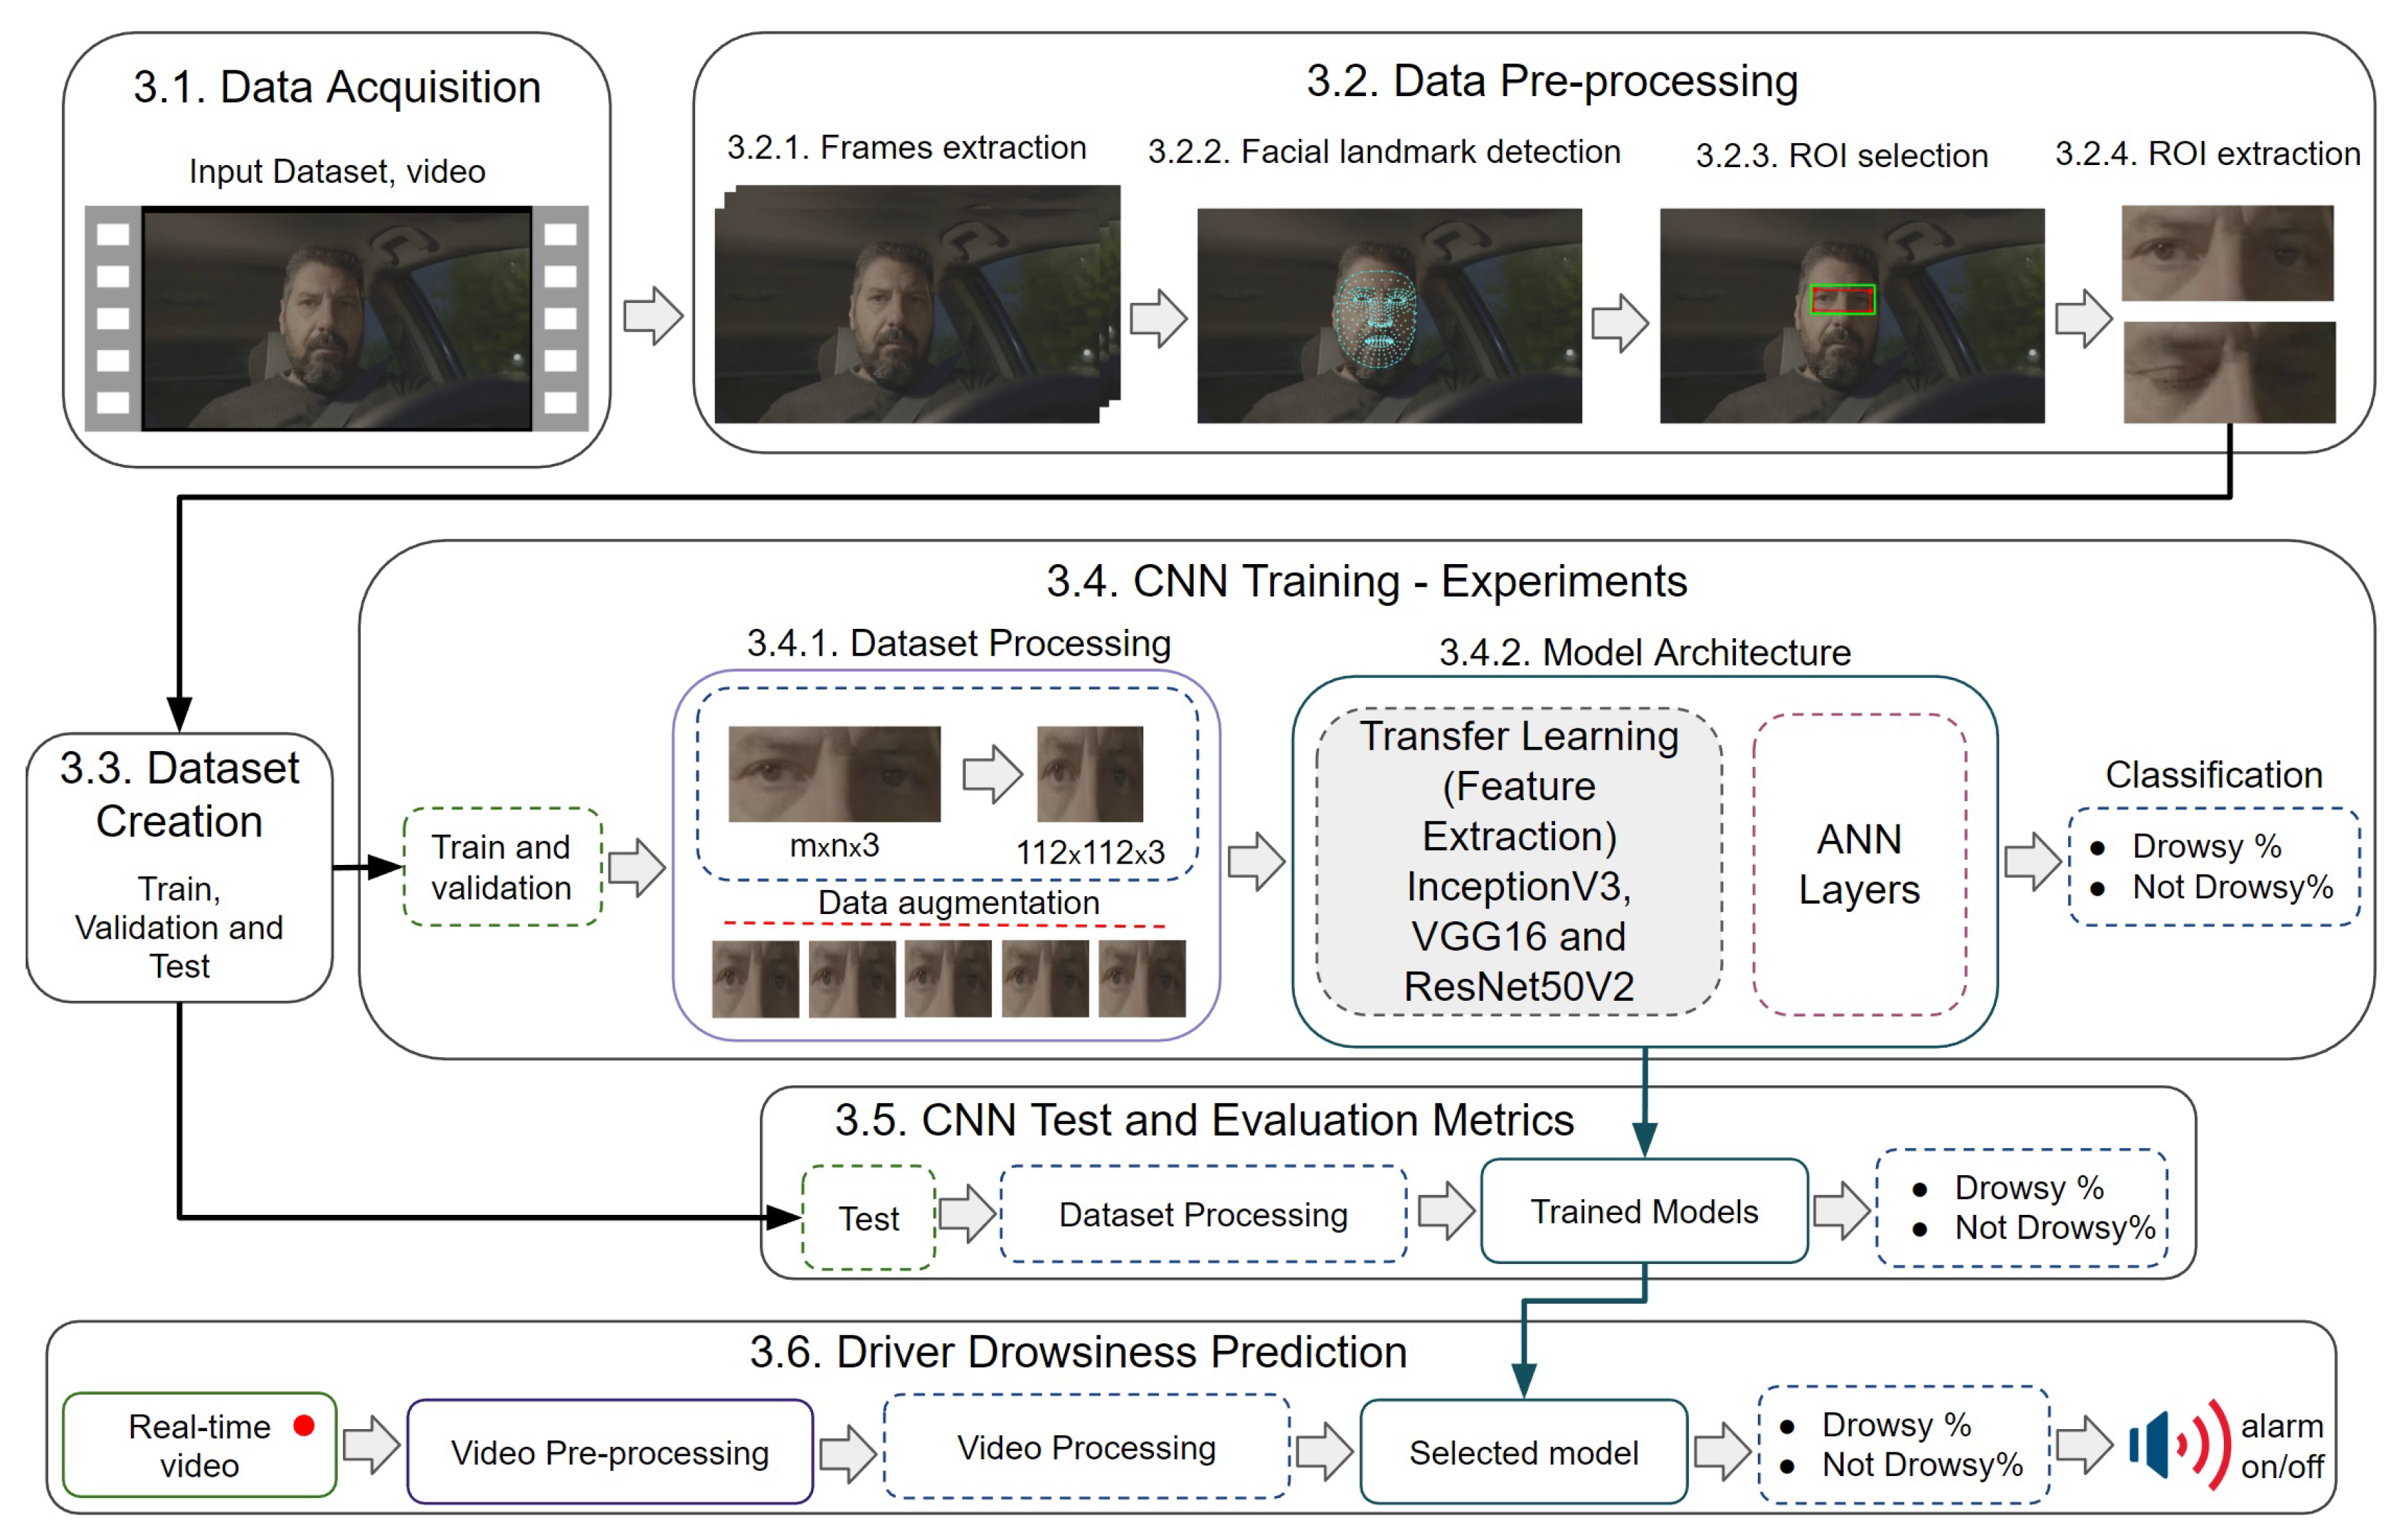
The proposed approach uses the methodology represented by the flowchart in
Figure 1, which consists of six stages: acquisition of the data (video), pre-processing of the images captured from the videos, creation of the dataset, training of the CNN architectures, testing of the trained models and subsequent prediction of driver drowsiness. Firstly, the acquisition of videos showing driver drowsiness is performed. After obtaining the data, pre-processing is conducted to extract the frames where the 468 facial points are detected by MediaPipe. For a better selection of the ROI, a methodology is proposed that uses 4 points around the eyes and—with the help of an intermediate point between the eyes—calculates the distances from the extreme point of the right eye to the extreme point of the left eye and the upper and lower extreme points of the right and left eyes, comparing them and thus selecting the most significant distance to create the ROI. This method guarantees the ROI of the eyes without losing information when the driver makes head movements looking up, down, right and left. This proposed method is described in detail in
Section 3.2.3 ROI selection. After having the ROI selected, the frames are extracted to create the dataset. All the images of the dataset go through a processing that resizes them to an image of 112 × 112 pixels and then normalizes them by dividing each pixel by 255. At this stage, data augmentation is also applied to the training set in order to avoid overfitting. Then, the processed images are used for the training of the 3 CNN architectures generating their respective accuracy and loss graphs. To run and evaluate the performance of the networks, a test is performed with the set of test images resulting in the selection of the best performing model. Finally, with the selected model, the driver drowsiness prediction test is performed.
3.1. Data Acquisition
Currently there are some databases that can be used for sleepiness detection such as NTHU-DDD, YawDDD, MRL Eye, UTA-RLDD, etc. This proposal uses the night-time yawning–microsleep–eyeblink–driver distraction (NITYMED) database, a database recently made available containing videos of males and females in a real night driving environment manifesting drowsiness symptoms through their eyes and mouth. NITYMED consists of 130 videos in mp4 format at 25 fps in 1080p (FullHD) and 720p (HD) resolutions. Compared to the other databases, NITYMED is more realistic for the purpose of this work, which justifies its use.
3.2. Data Pre-Processing
This subsection includes 4 steps, where the proposed ROI correction is shown in
Section 3.2.3. These steps were also used to create the training, validation and test dataset.
3.2.1. Frames Extraction
From the video database, consecutive frames were extracted using a counter
, according to the 25 fps and duration of each video. Considering the duration of the videos (30 s to 120 s), the fps was constant
, and the frames of each video were obtained using Equation (
1).
where the number of frames depends on the duration of each video in the dataset. An example is given with the time of 30 s and 120 s using Equation (
1).
3.2.2. Facial Landmark Detection
In this step, use is made of MediaPipe Face Mesh [
27], which estimates 468 facial reference points of the 3D face in real time, thus detecting the face in each image. MediaPipe Face Mesh works for different head positions, where the face can be detected at different head rotation angles by employing machine learning (ML) to infer the 3D facial surface.
3.2.3. ROI Selection
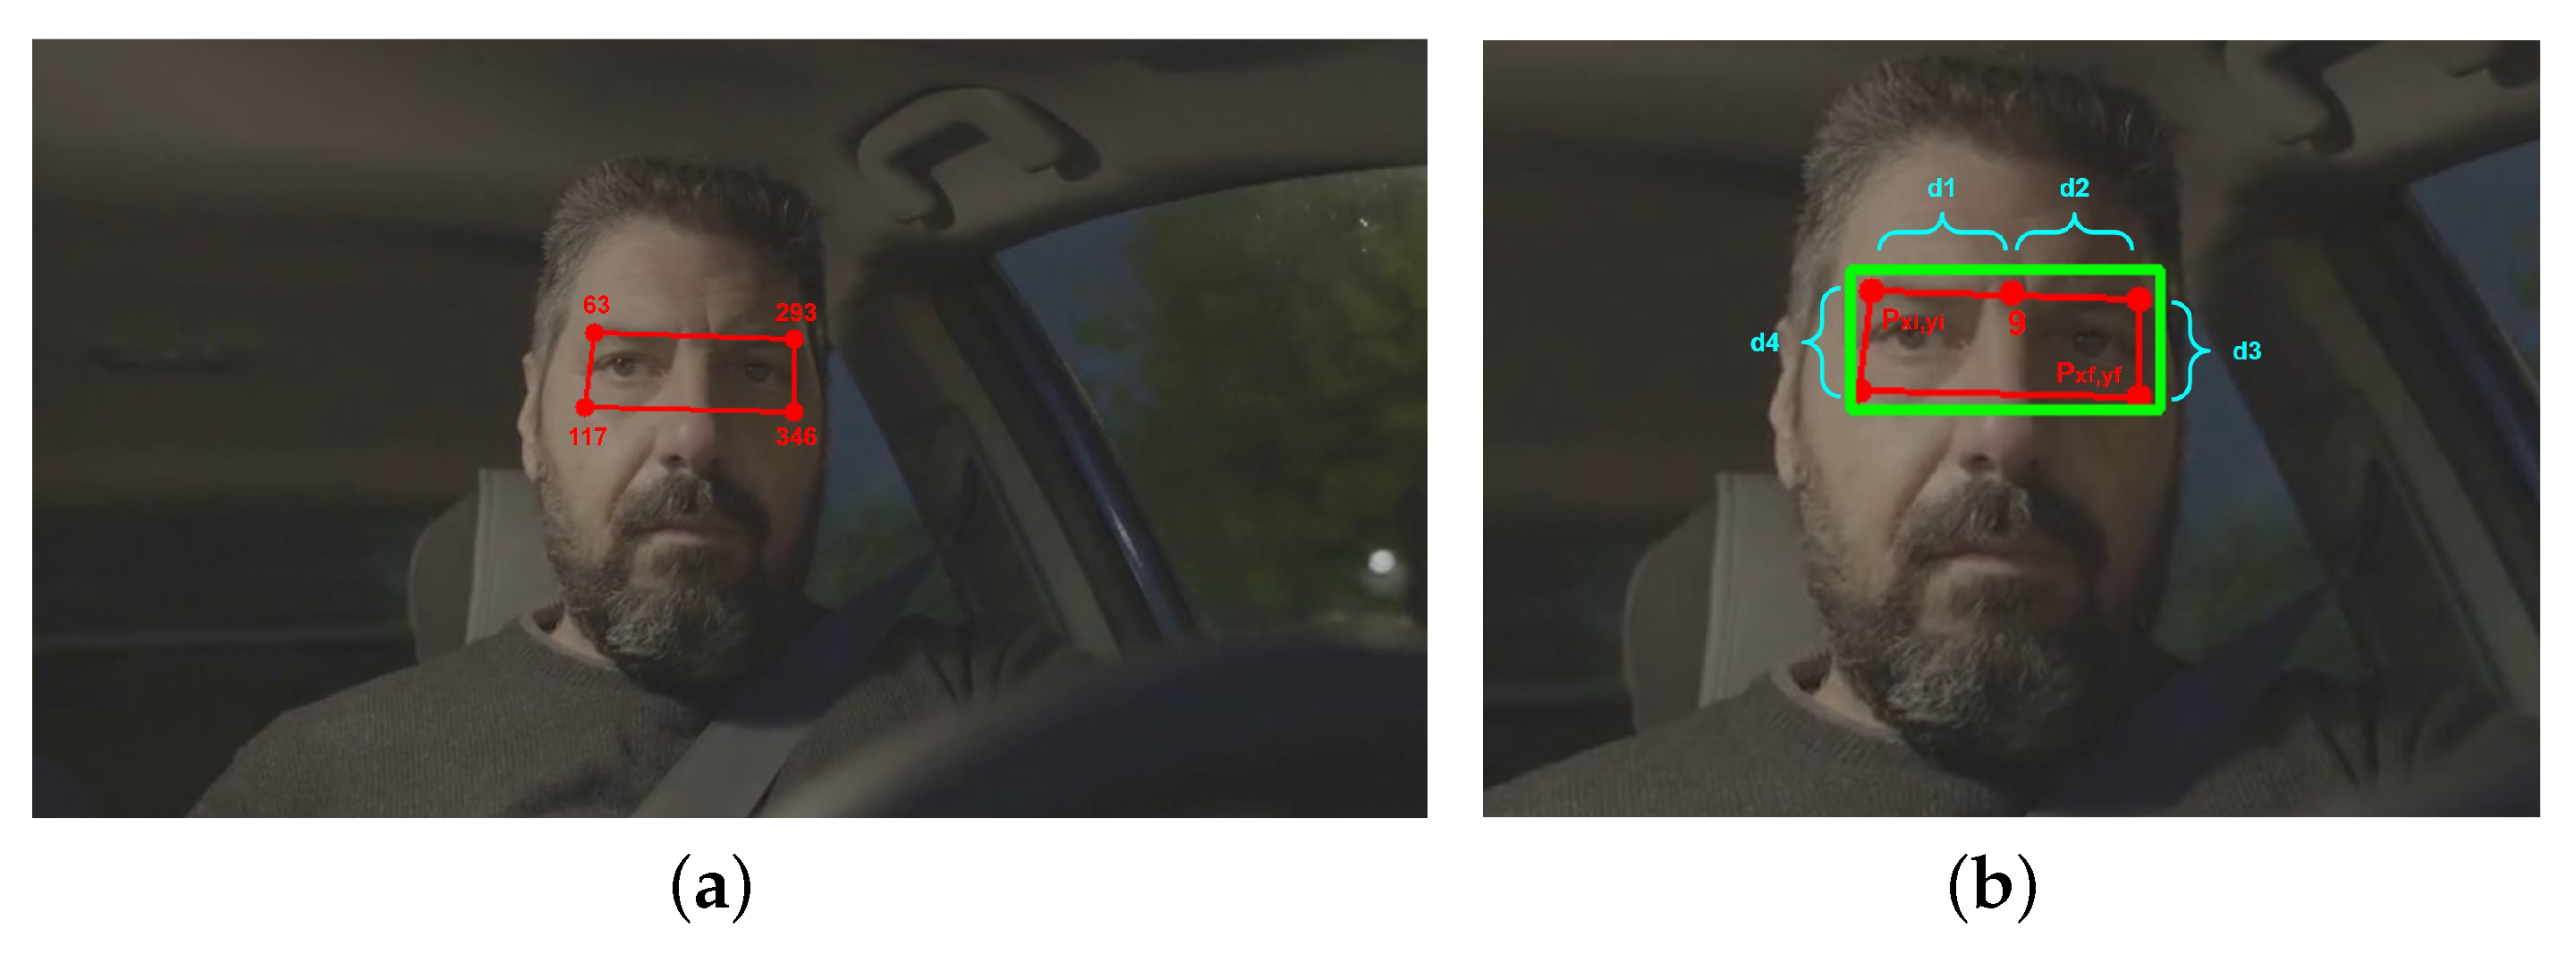
From the 468 points estimated in the previous step, only 4 points are needed to select the area of the region of interest (ROI). The points chosen within MediaPipe Face Mesh were: 63, 117, 293 and 346, where joining them to create the ROI forms an irregular rectangle as shown in
Figure 2a. From most of the existing ROI extraction algorithms [
28,
29,
30,
31],
Figure 2b shows the proposed method for ROI correction, where a point correction was performed. It was proposed to consider as initial point for the x and y components of point 63
, and as final point, the x and y components of point 346
. Then, we find the corresponding distances to each point, d1, d2, d3 and d4, with a point in the middle of both eyes, which is point 9. Then, we made a comparison of extreme points at different head movements stored in the variables
and
. The pseudocode used for ROI correction is shown in Algorithm 1.
| Algorithm 1 ROI Correction |
- Input:
Points: ▹ eye region points - Output:
-
▹ “x” and “y” components of the upper right extreme points -
-
▹ distances of the extreme points and superiors -
-
-
-
if then ▹ distance comparison in “x” components -
-
else -
-
end if -
if then ▹ distance comparison in “y” components -
-
else -
-
end if -
if then ▹ corrected ROI creation -
-
-
▹ corrected ROI -
end if
|
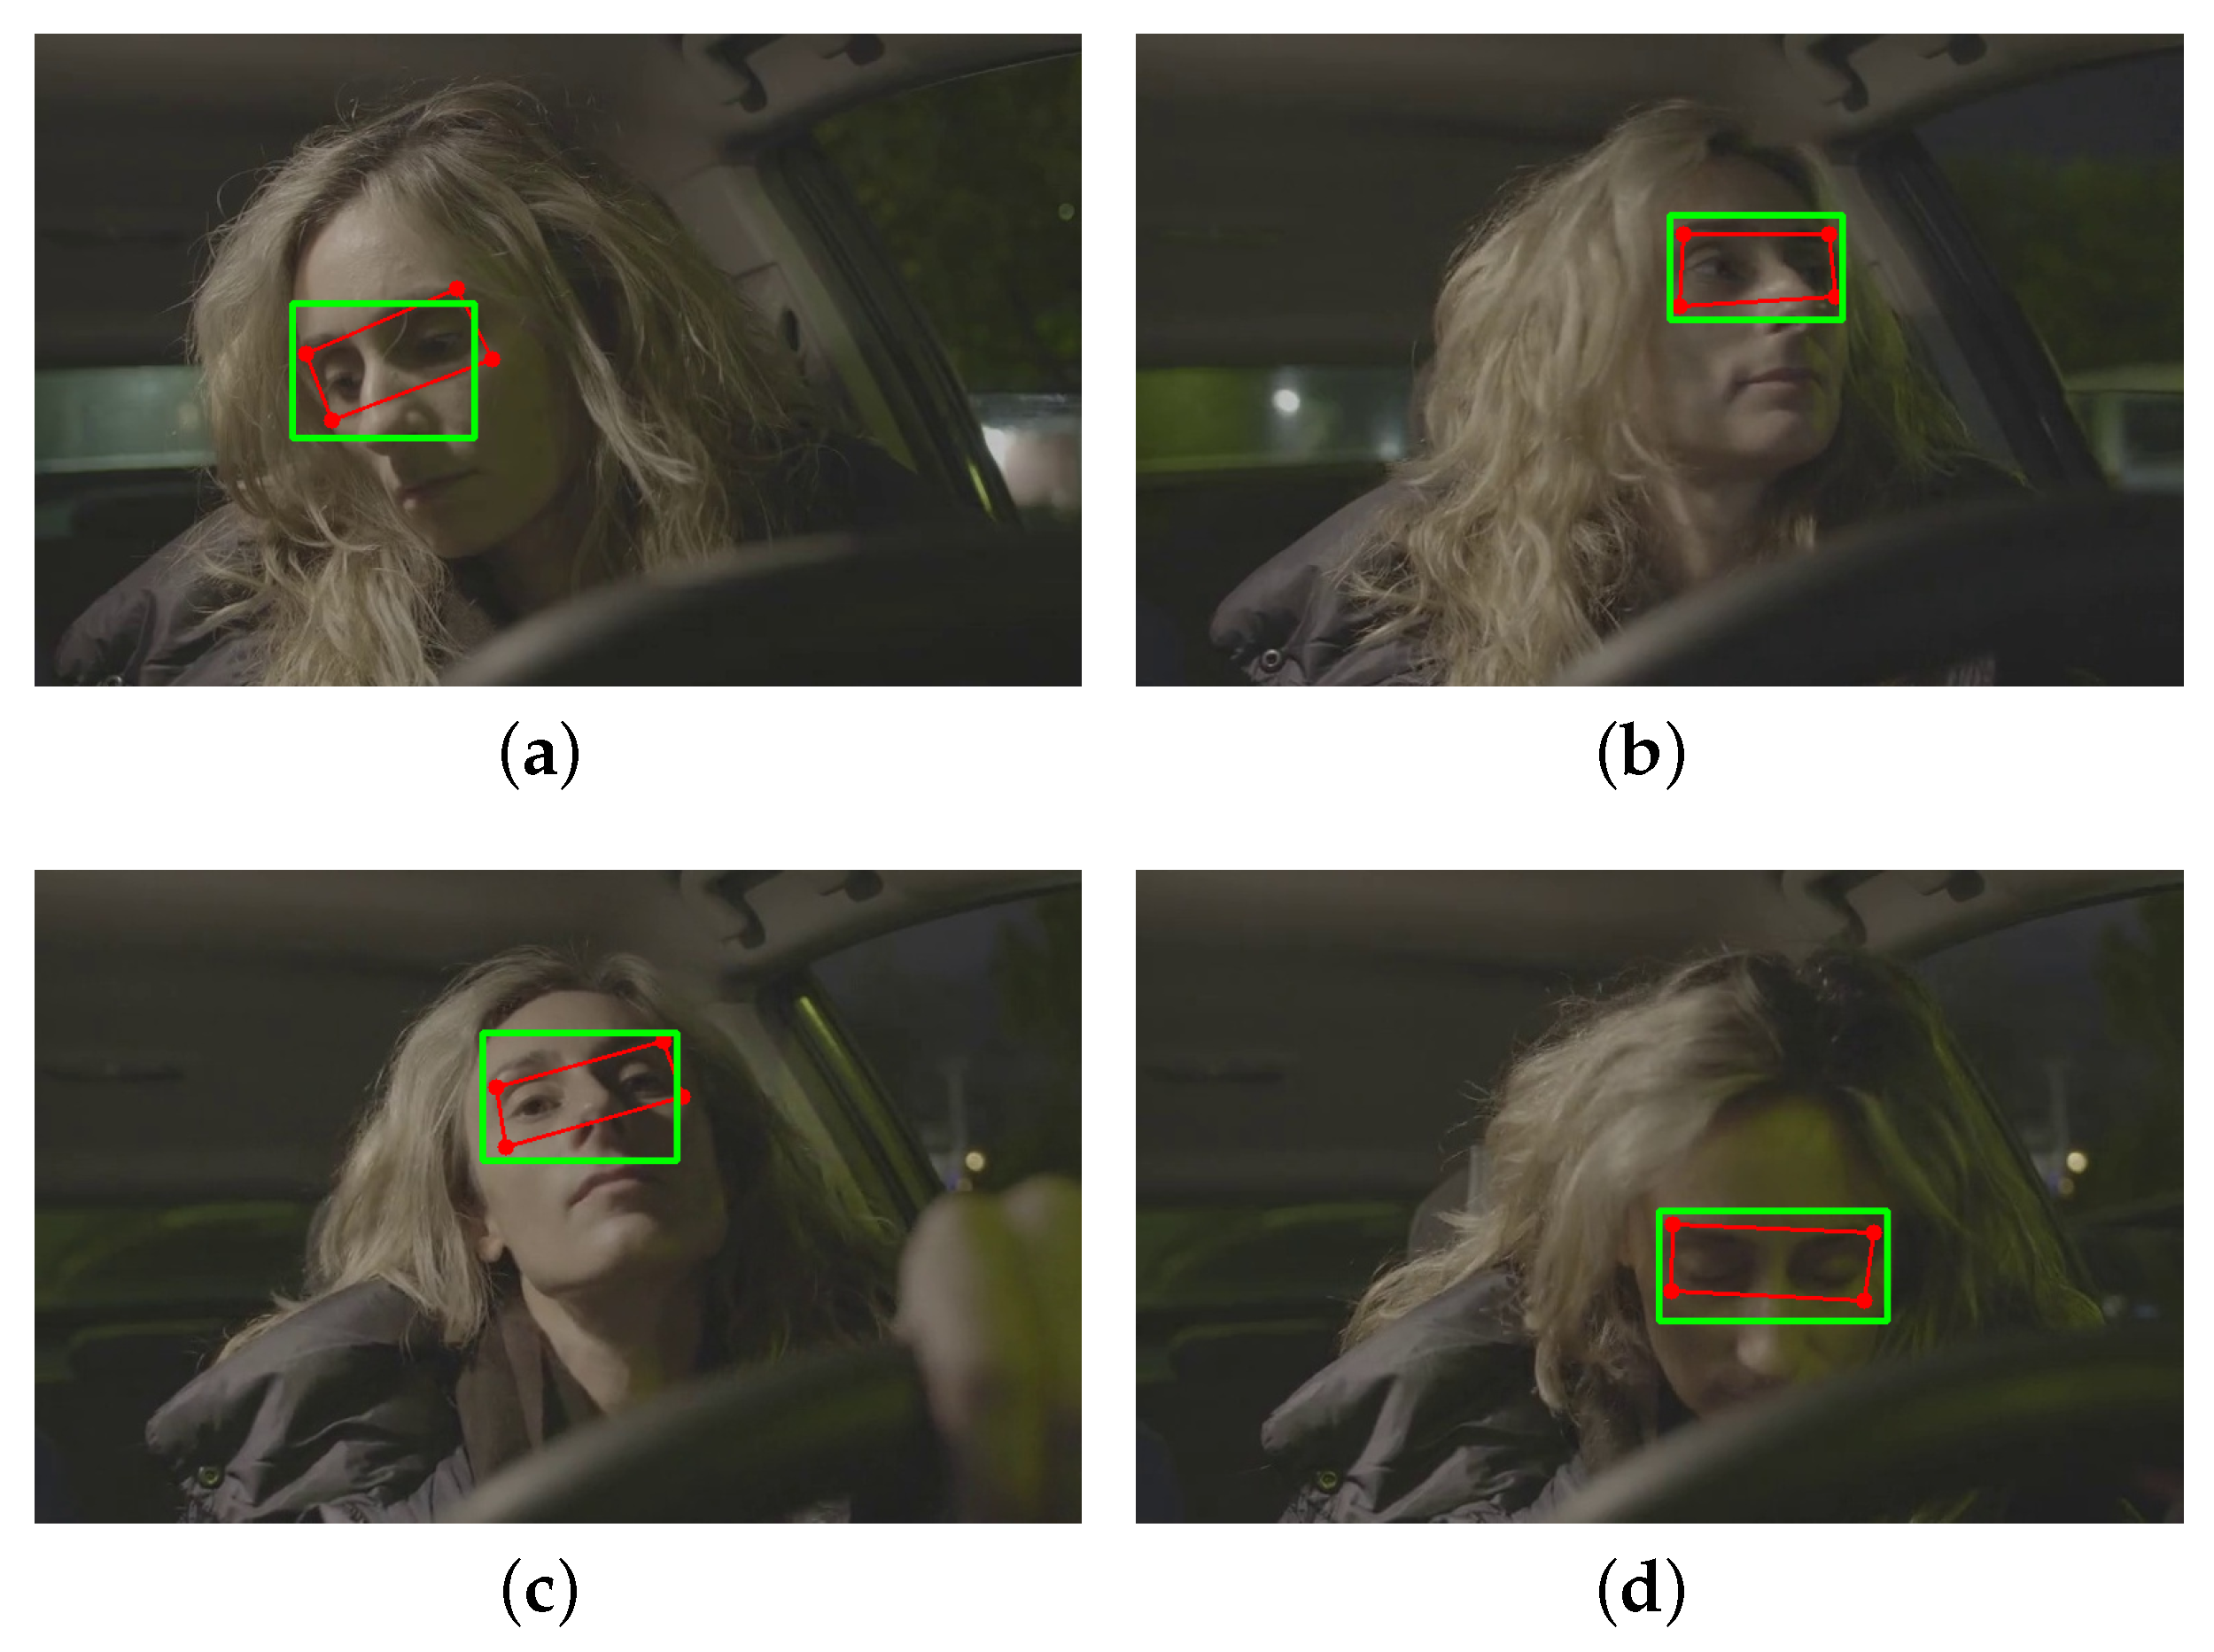
An example of application of the ROI correction method can be seen in
Figure 3, where the results are shown at 4 different positions of the driver’s head. The red outline represents the irregular or deformed ROI, while the green outline is the corrected ROI.
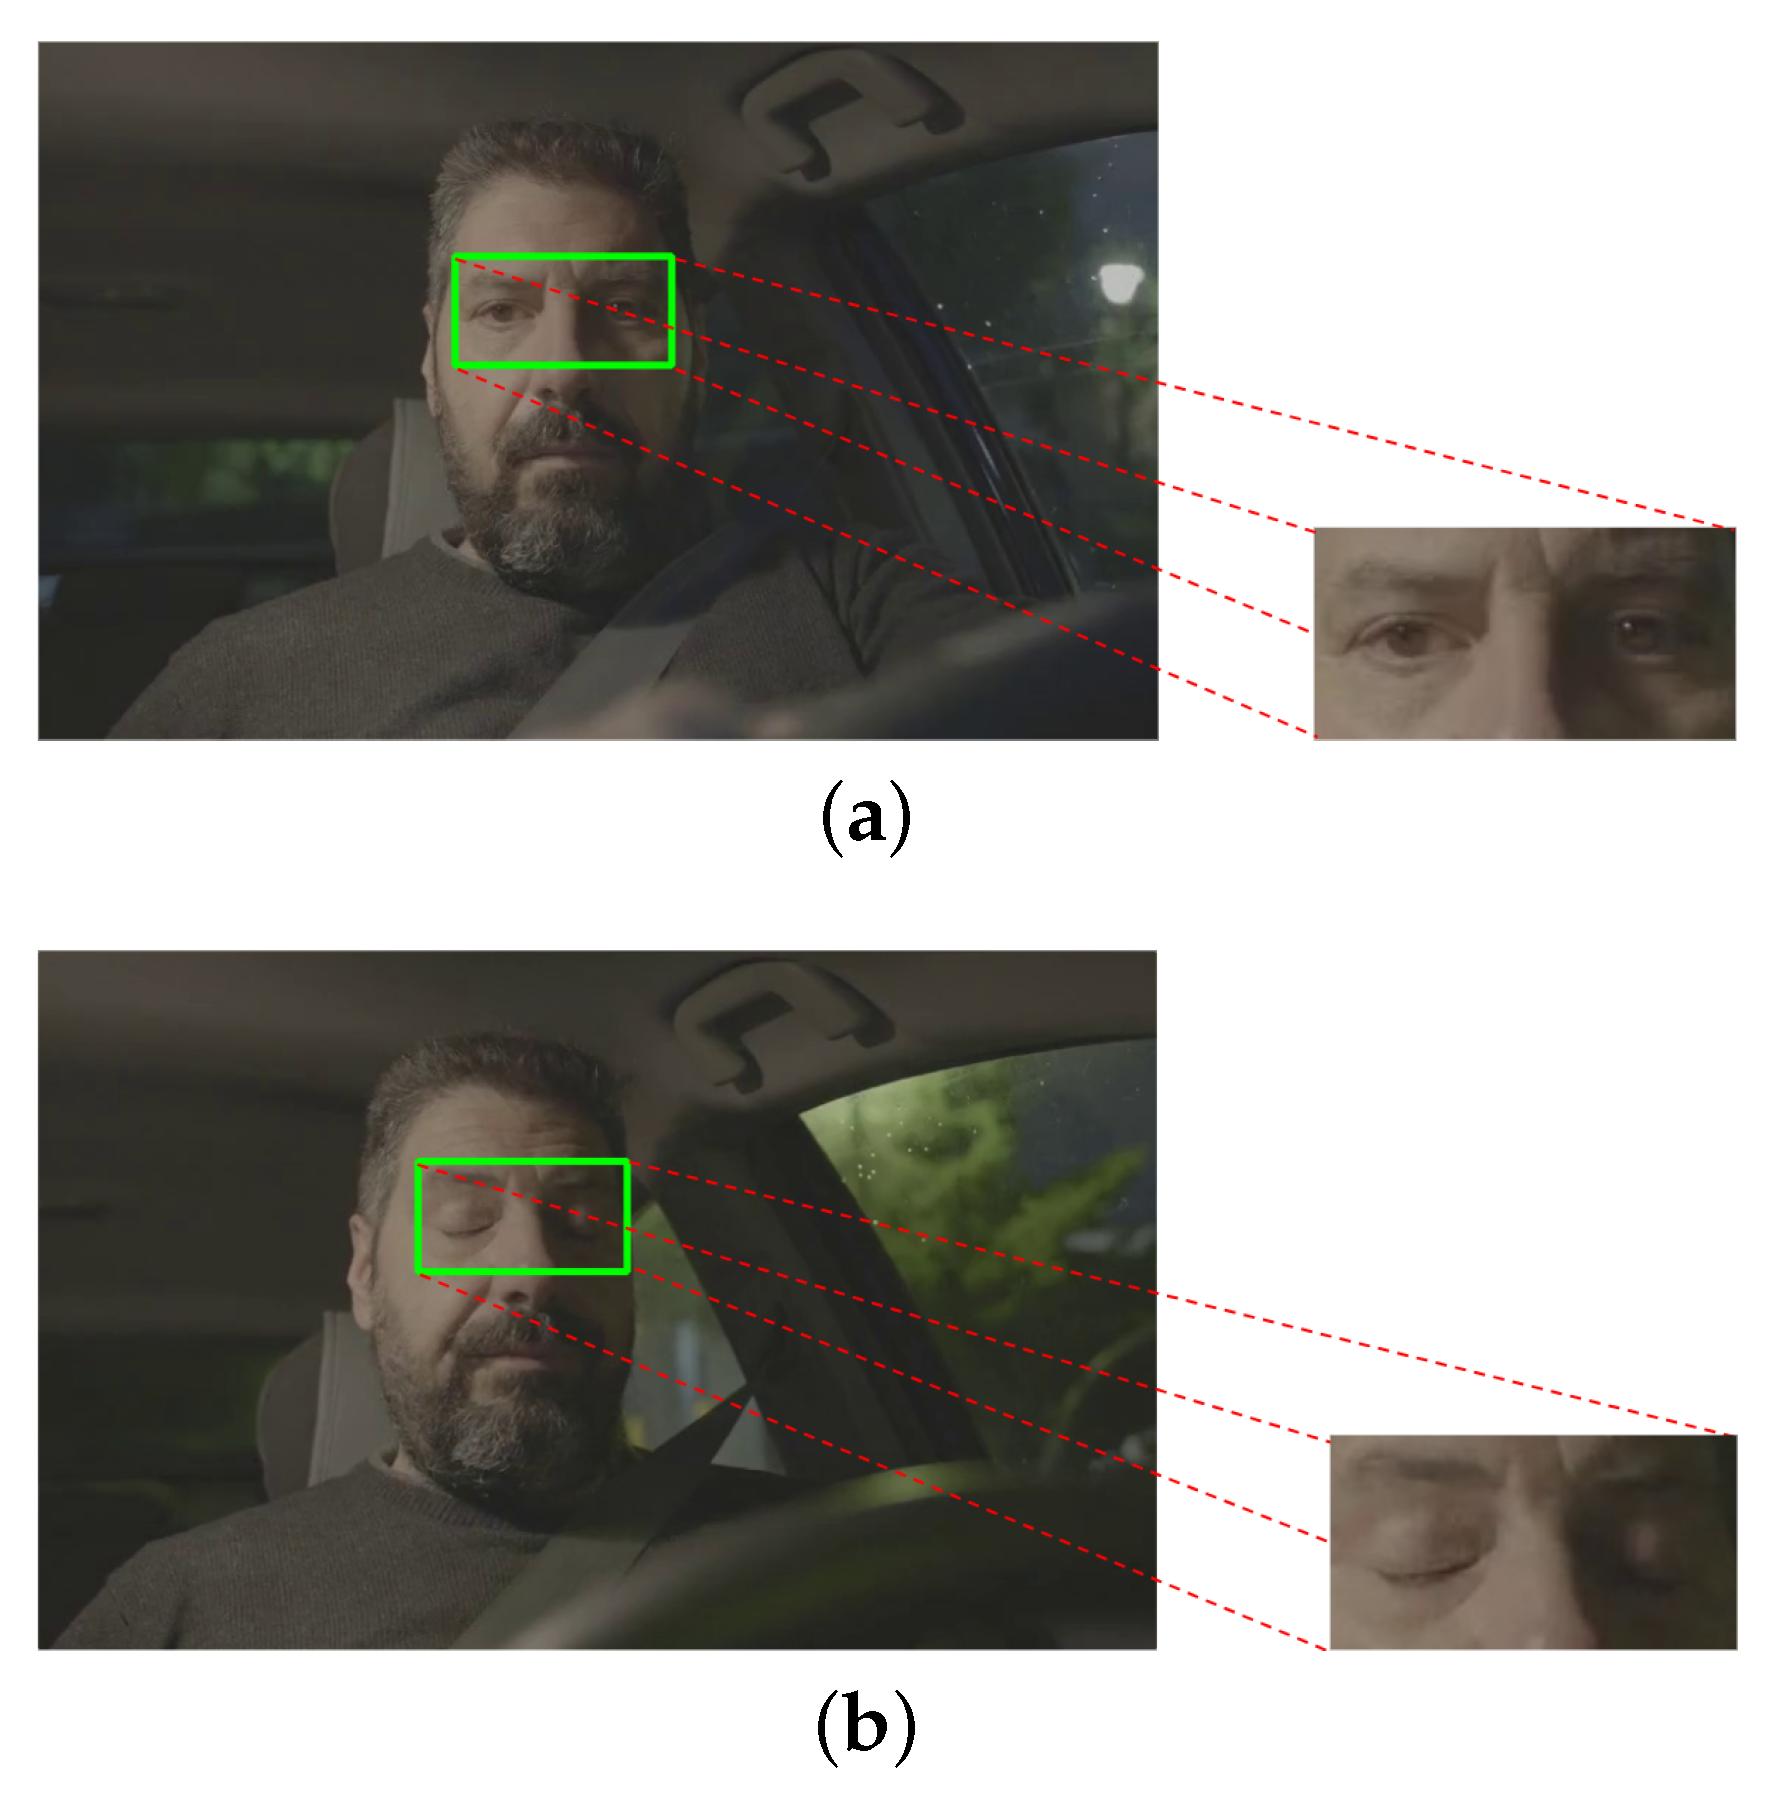
3.2.4. ROI Extraction
After making the ROI correction, the eye area that serves as the CNN input was extracted. This step is useful for real-time analysis since all the previous steps will be applied to the live video input. Depending on the drowsiness state of the driver, the ROI may characterize sleep or wakefulness, represented by eyes open and eyes closed, respectively (
Figure 4).
3.3. Dataset Creation
The database was created with the ROI images obtained in the previous steps, focusing only on the eye region. From NITYMED, 6 videos were chosen for the creation of the training, validation and test data, obtaining a total of 6800 images. The videos were chosen according to the size of the eyes of the people (4 males and 2 females), where these people have different characteristics from other people. The number of images extracted was due to the fact that some frames of the eyes were repeated, so only relevant frames were chosen.
Since this is a binary classification, 2 classes
and
are labeled. Of the total images, 4760 (75%) images were split for the train data, 1020 (15%) images for the validation data and 1020 (15%) images for the test data. This data distribution was selected to avoid overfitting due to the limited amount of data. The final distribution of the created data set is shown in
Table 1.
3.4. CNN Training Experiments
3.4.1. Dataset Processing
Before training the CNNs, image processing was performed. The extracted ROI had different pixel sizes with 3 layers of depth (m × n × 3); therefore, resizing to a size accepted by the CNNs was necessary. All images were adjusted to a size of 112 × 112 × 3 pixels, then normalized by changing each pixel value from 0–255 to 0–1. Then, to avoid overfitting, data augmentation was applied with the following parameters: rotation range 20%, horizontal flip and fill mode , resulting in the creation of 5 images from each image of the training set.
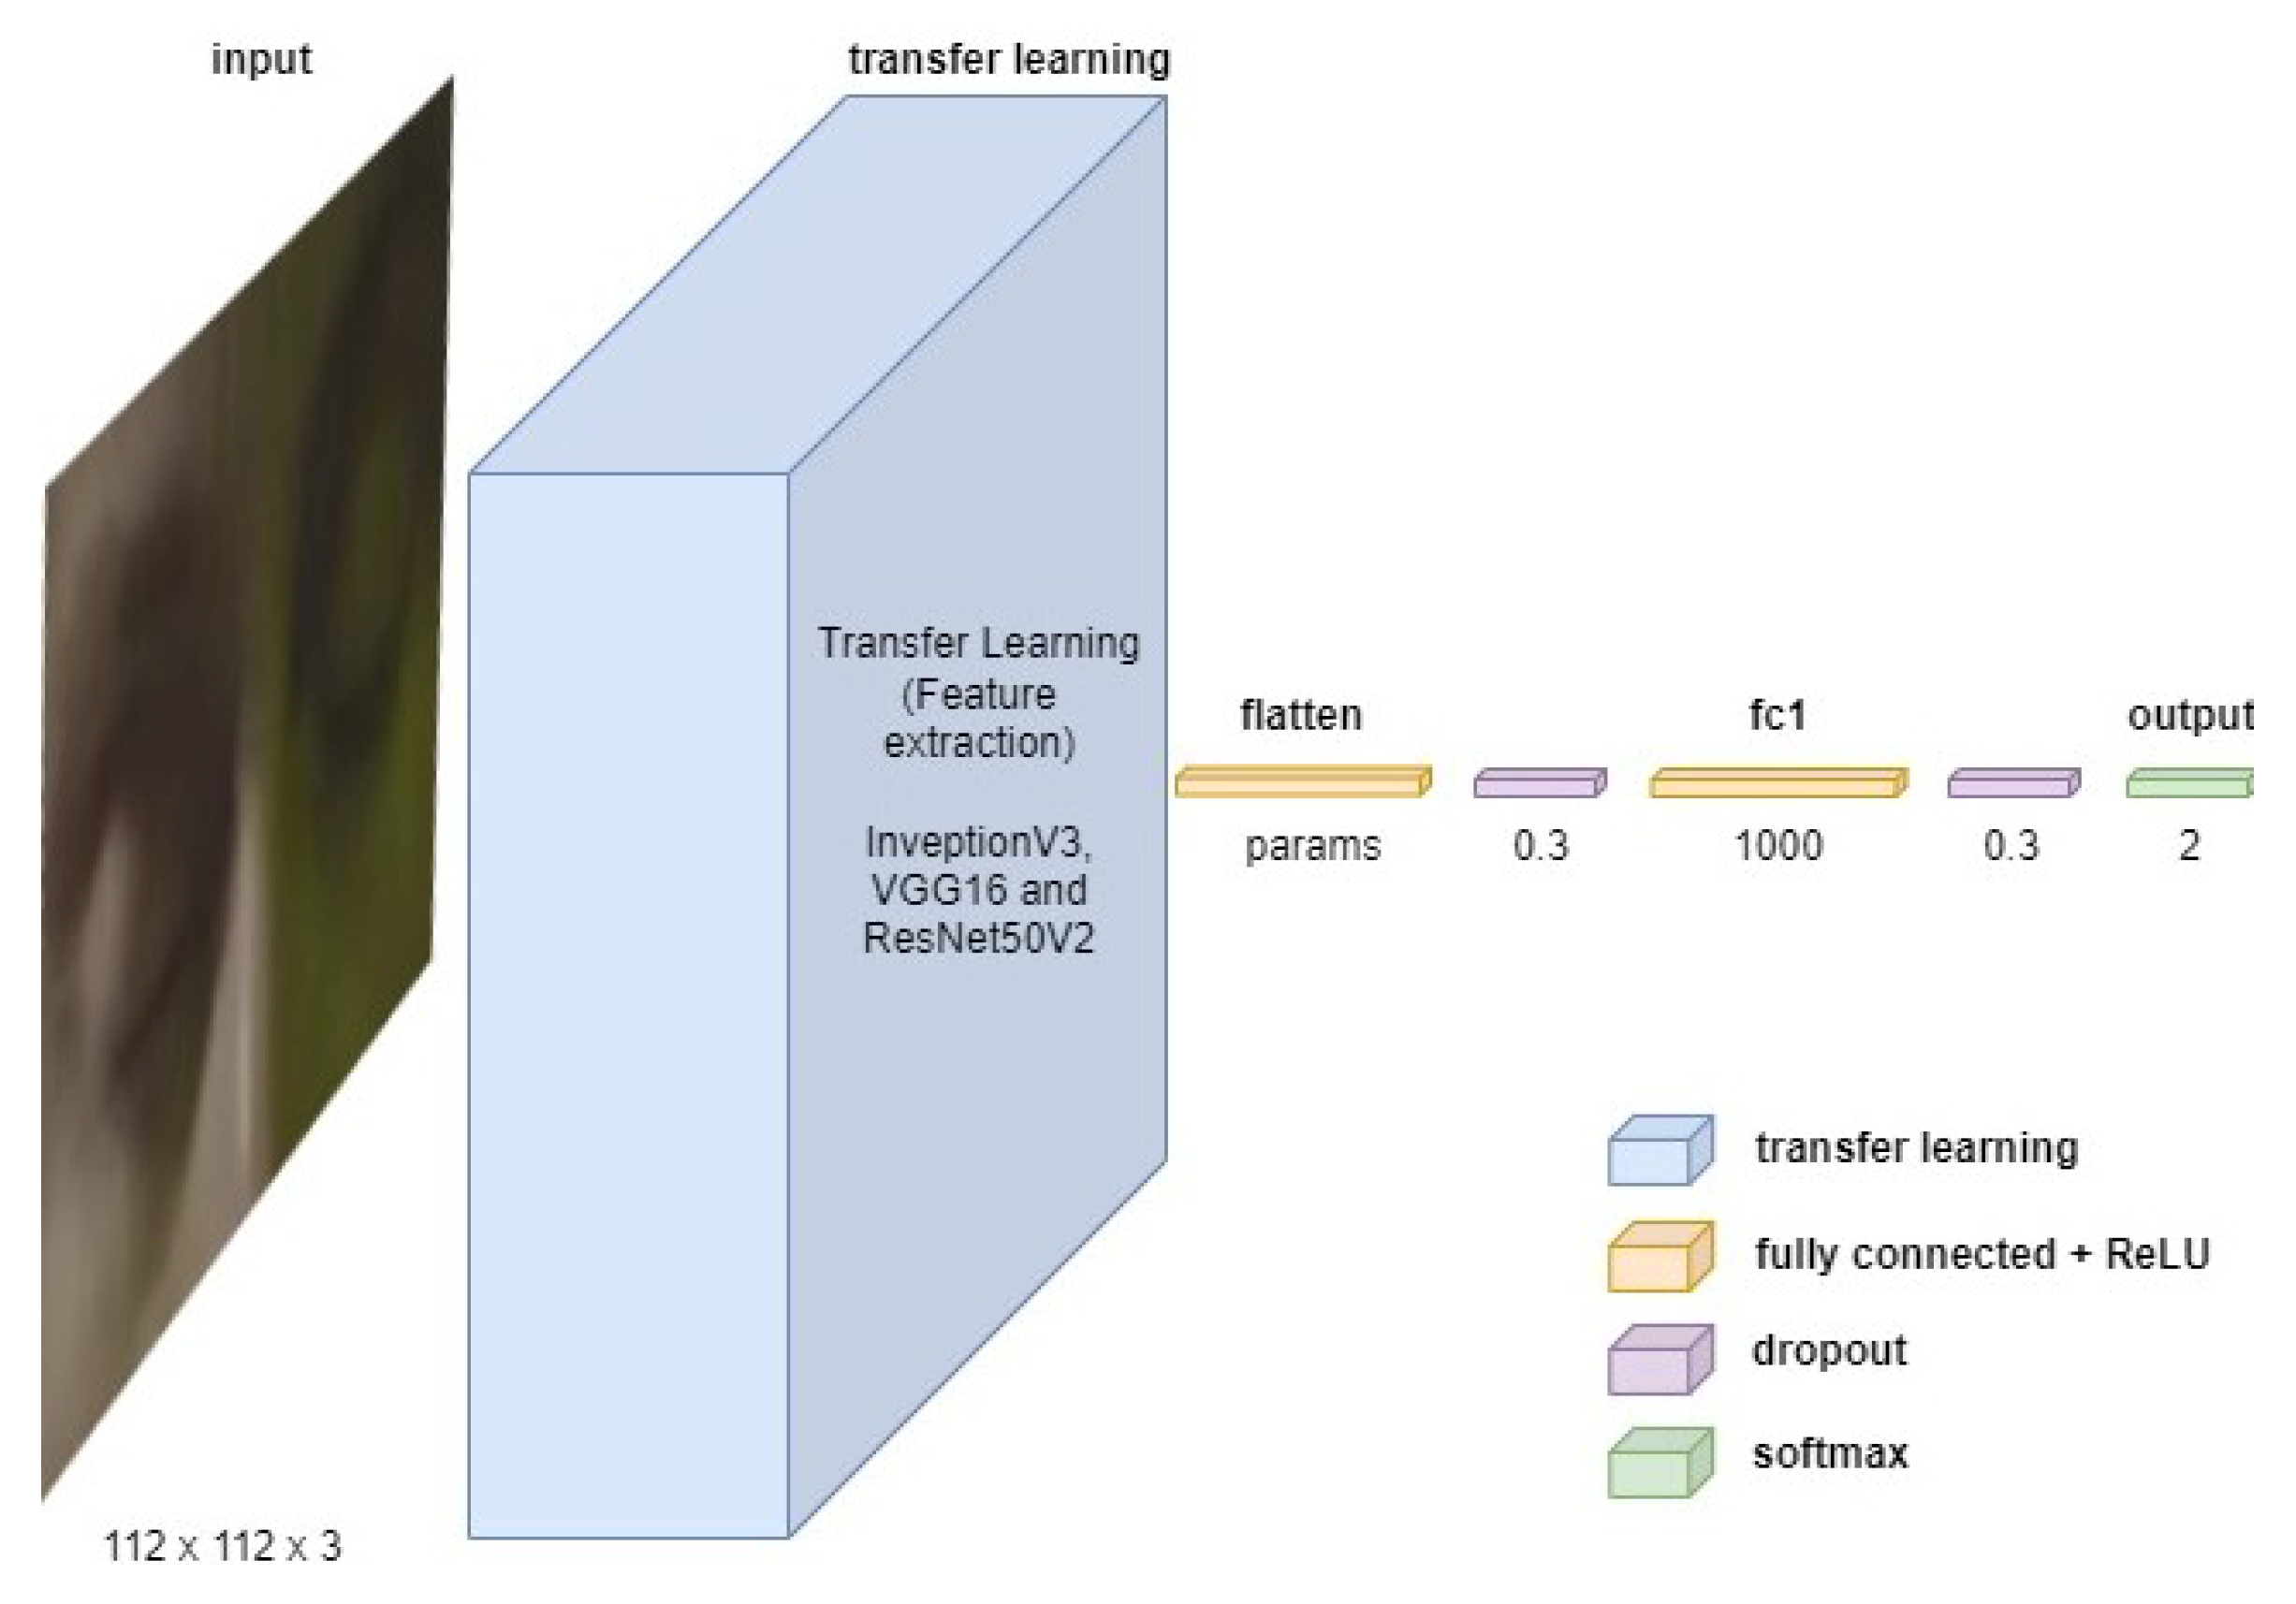
3.4.2. Model Architecture
Three CNN architectures were trained based on: InceptionV3, VGG16 and ResNet50V2. By means of transfer learning, the feature extraction weights of each CNN were obtained. Next, the binary classification architecture (not drowsy and drowsy) was designed by flattening the transfer learning output, followed by a 30% dropout with a dense hidden layer of 1000 neurons with ReLU activation and a 30% dropout with a dense layer of 2 outputs with SoftMax activation. The classification process was the same for all 3 CNNs. The proposed architecture is shown in
Figure 5.
The parameters used in the training are shown in
Table 2.
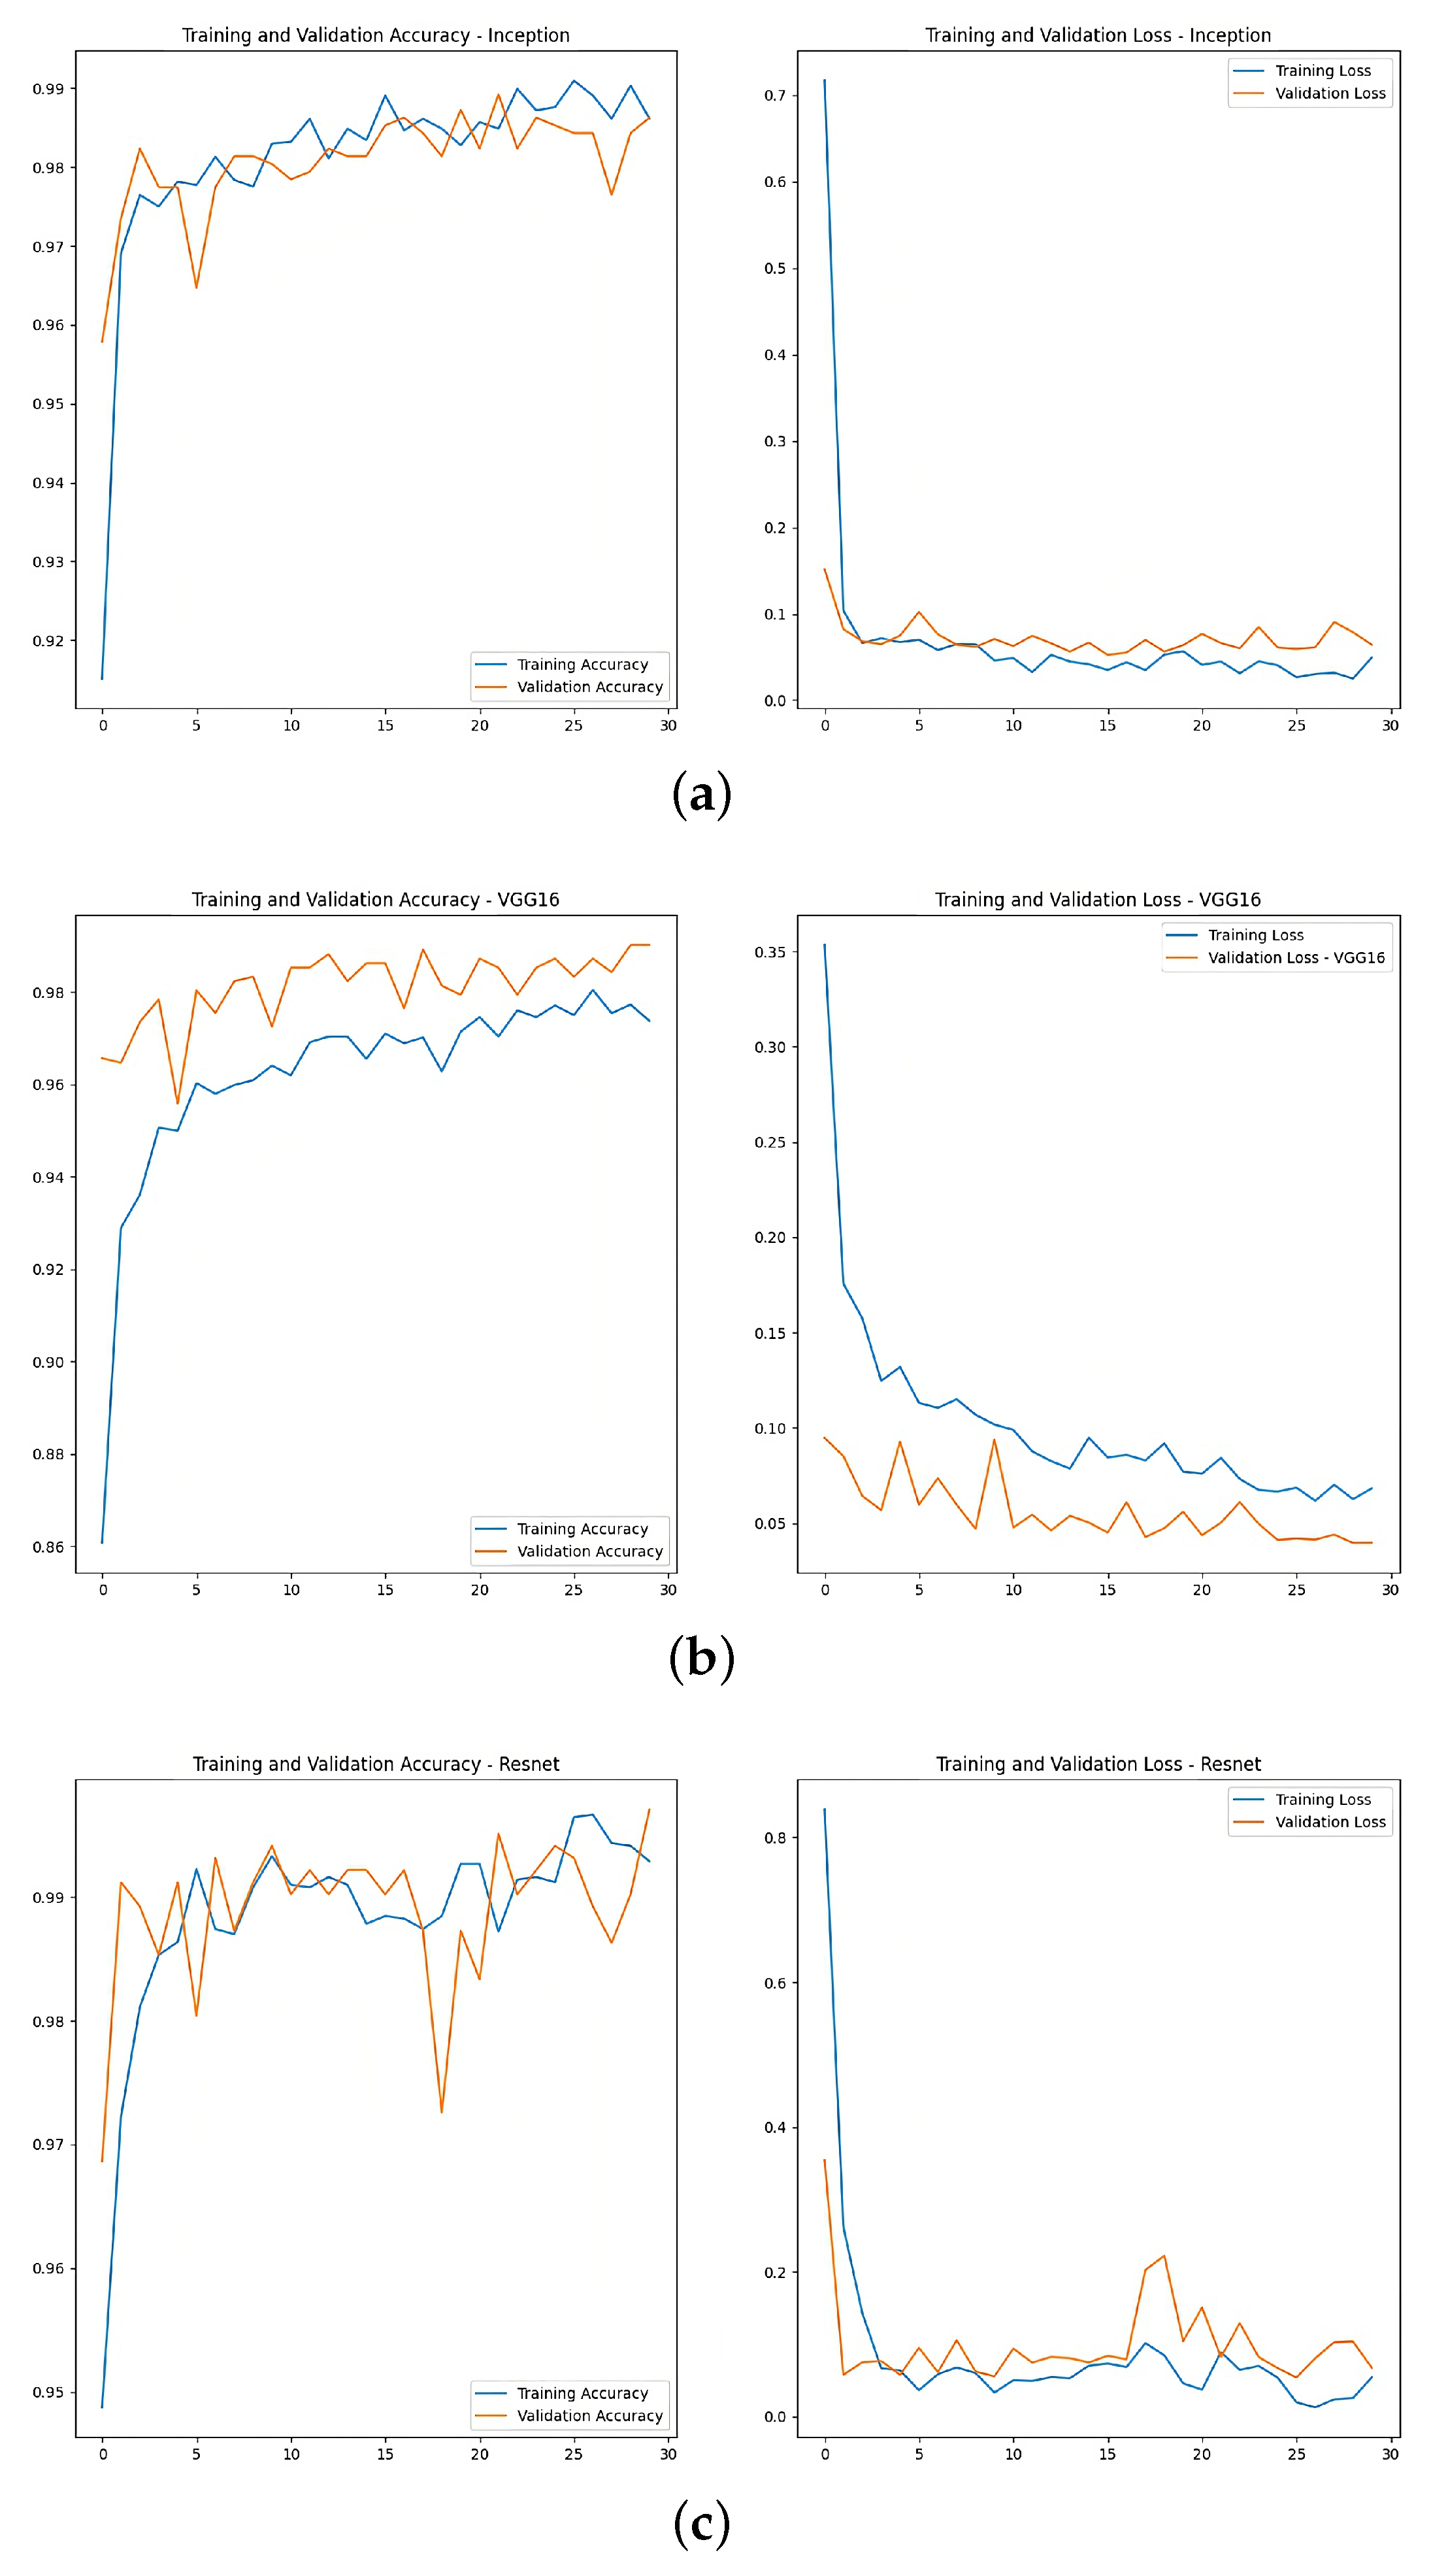
An example (arbitrarily chosen) of the resulting training plots for each architecture is shown in
Figure 6.
3.5. CNN Test and Evaluation Metrics
3.5.1. CNN Test
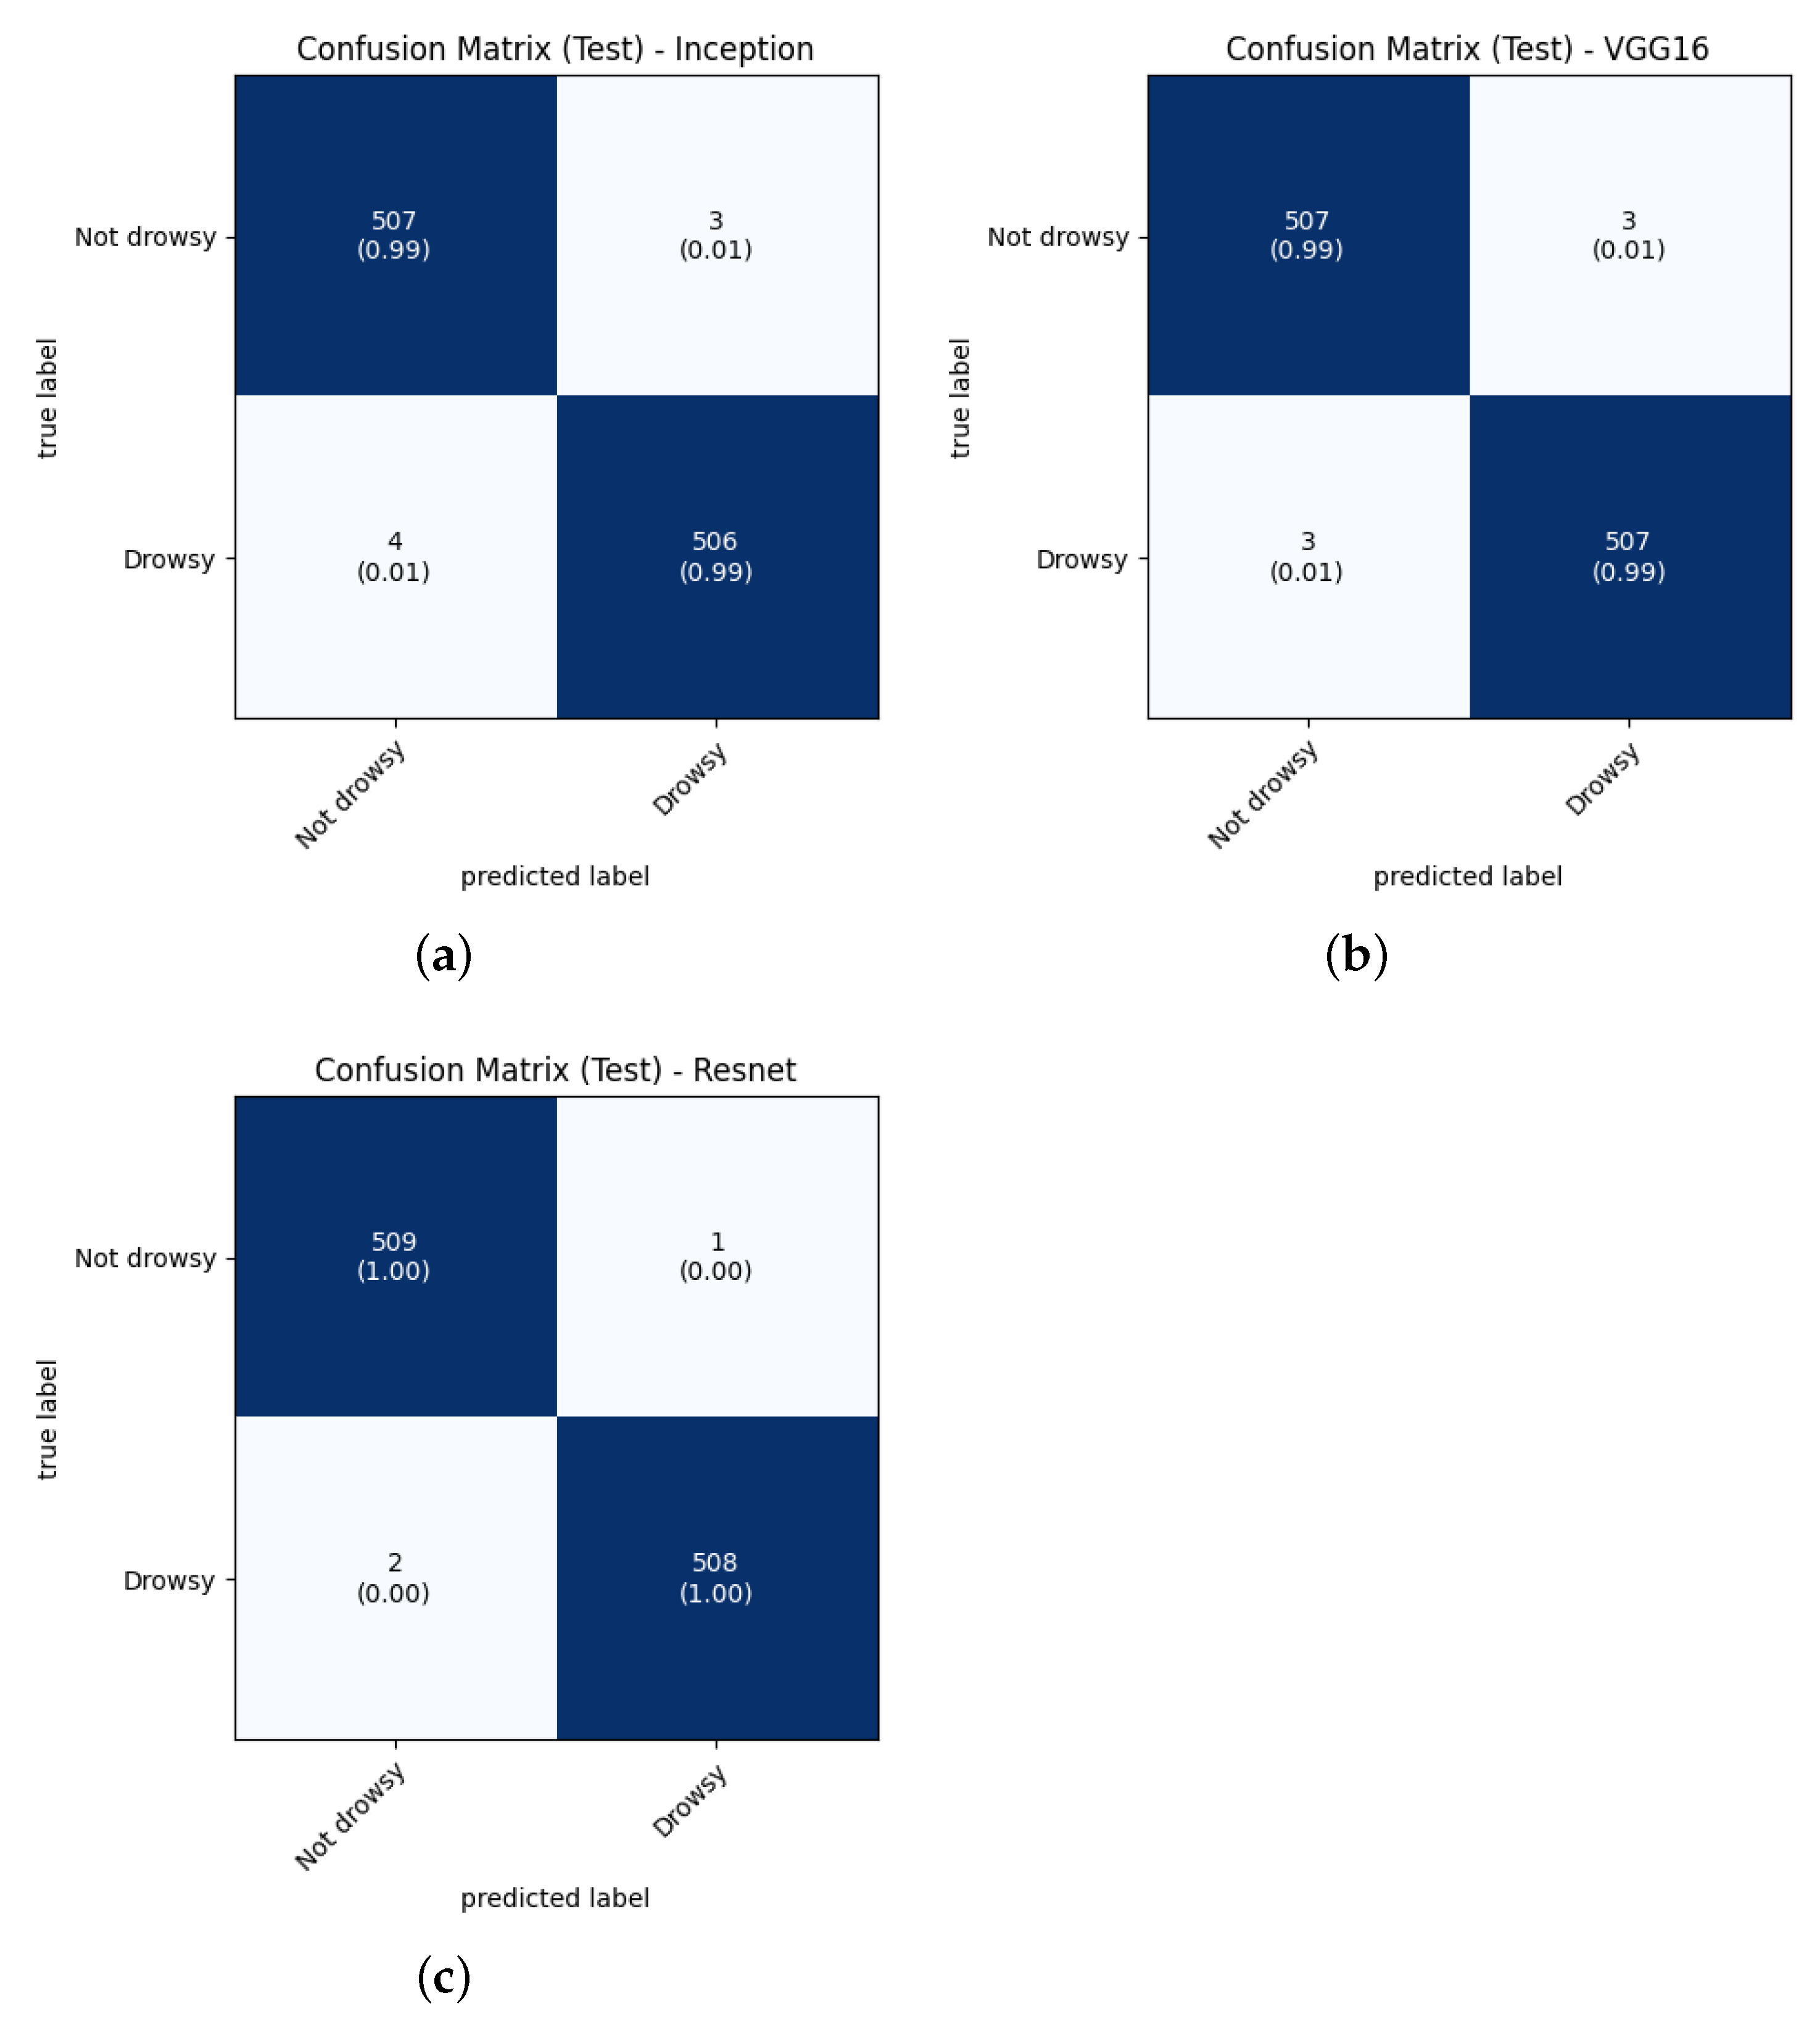
After training the CNNs, it was necessary to test them with the Test data. Where the processing of the images of the set (without data augmentation) was also performed. A batch size of 1 was used to analyze each image, testing 10 times with each trained network. An example of the confusion matrices for each CNN Test is shown in
Figure 7.
The confusion matrix is a tool that allows us to see the performance of the models. In this particular case, it is required to decrease the false negatives for the Drowsy class where the true value is “Drowsy” and the model predicted is “Not drowsy”. This error can cause problems that would cause accidents since the system would not alert the presence of drowsiness to the driver. From
Figure 7a, it is observed that 4 images were recognized as “Not drowsy” out of the 510 images that are of the class “Drowsy”,
Figure 7b shows that 3 images were recognized as “Not drowsy”.
Figure 7c shows that 2 images were recognized as “Not drowsy”, corresponding to CNNs based on InceptionV3, VGG16 and ResNet50V2.
3.5.2. Evaluation Metrics
By training the Train and Validation dataset, and testing the trained CNN models on the Test dataset, the confusion matrices were obtained. Based on [
32], from these confusion matrices the evaluation metrics used are: Precision (Equation (
2)), Recall (Equation (
3)), F1-score (Equation (
4)) and Accuracy (Equation (
5)), that define the system behavior.
where, TP as true positive, FP as false positive, TN as true negative and FN as false negative.
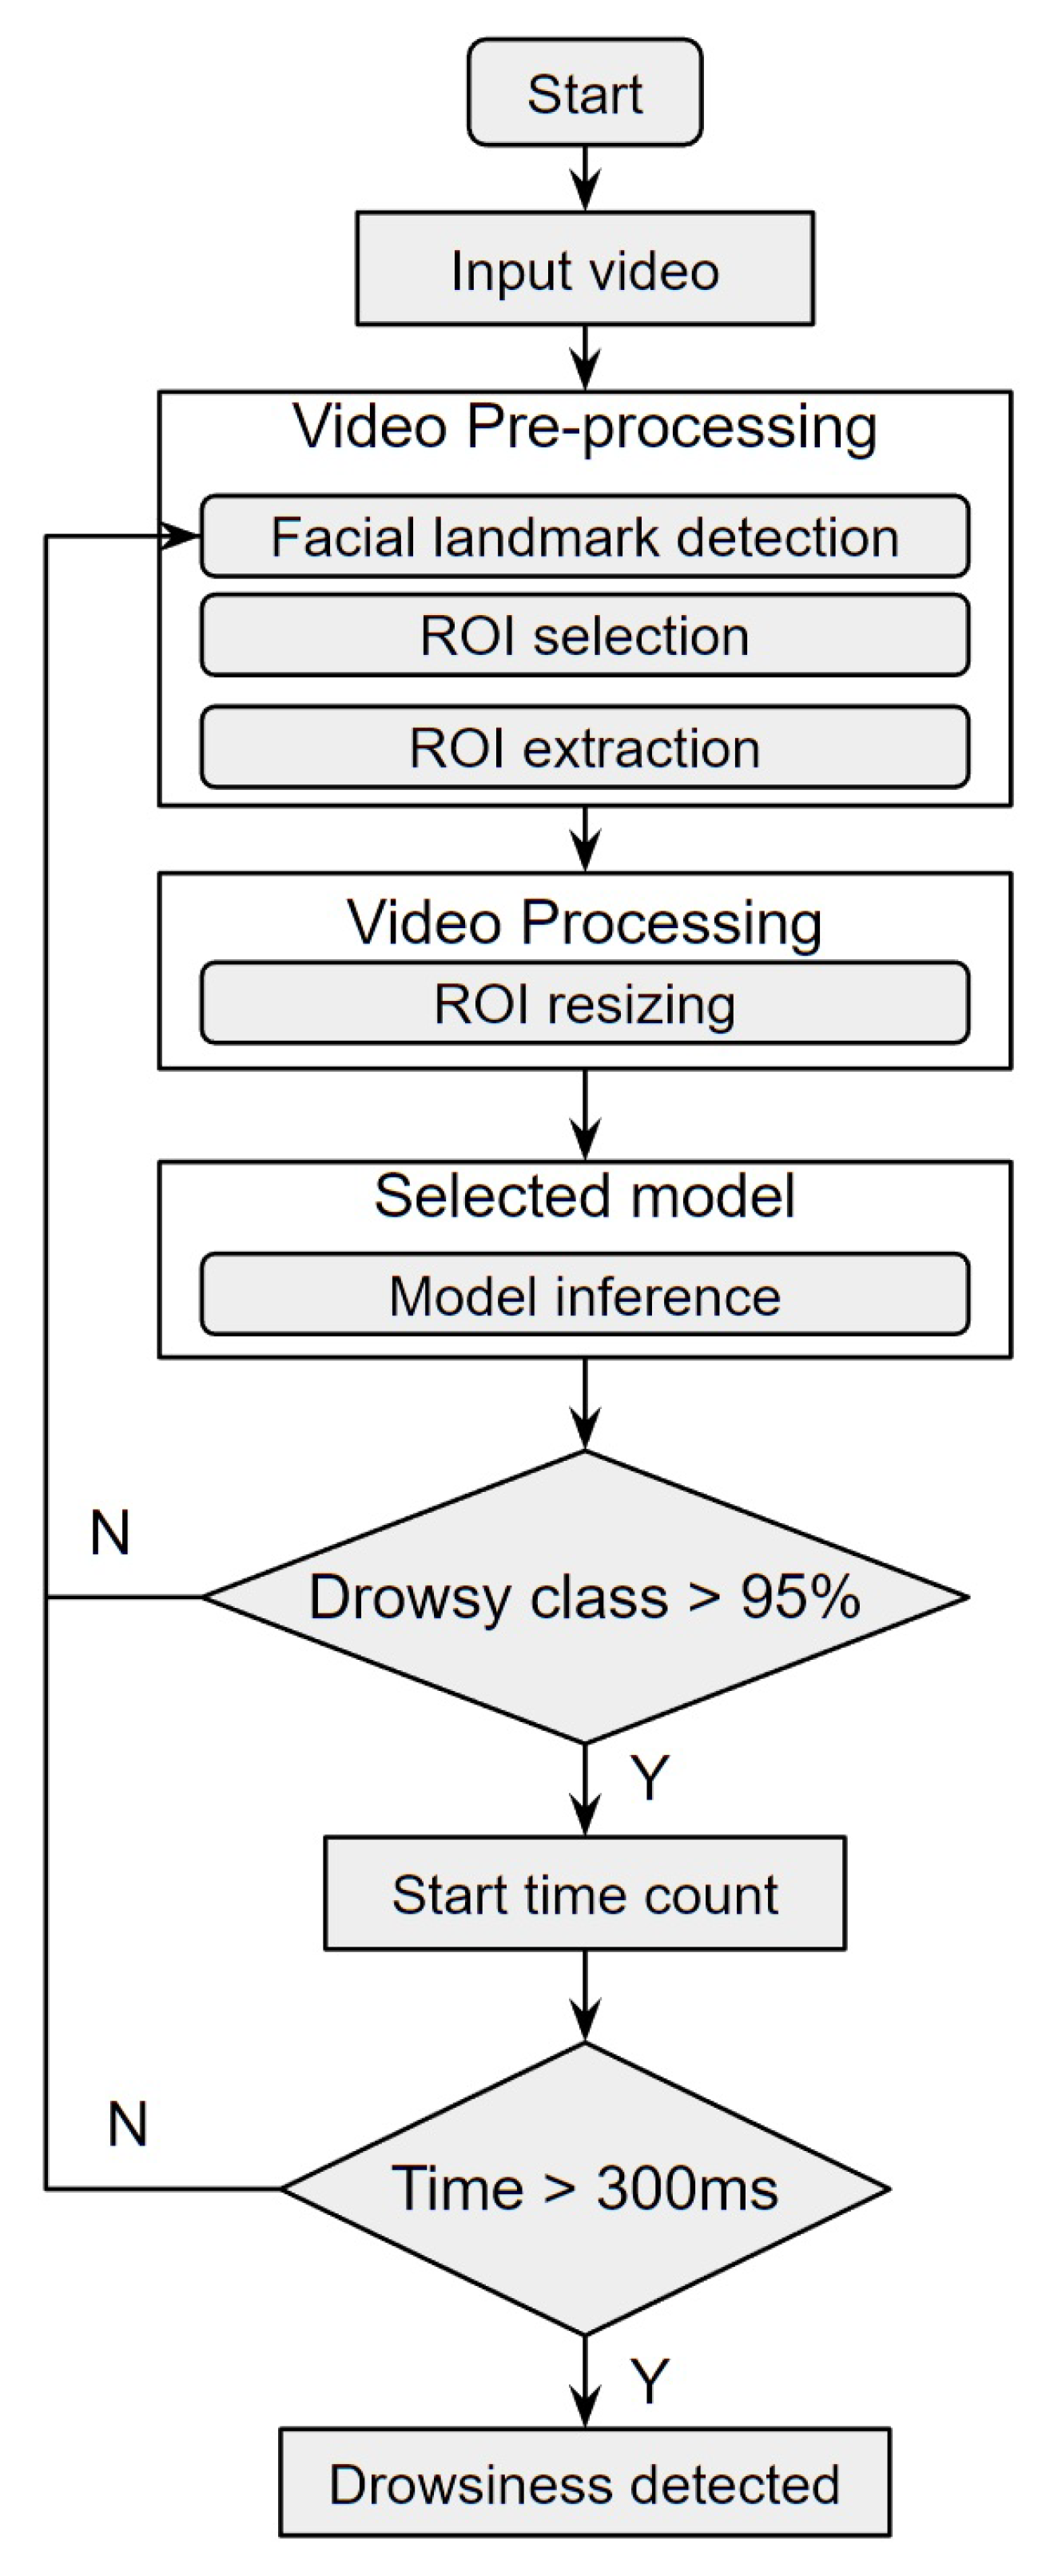
3.6. Driver Drowsiness Detection
With the models trained and tested, it is finally appropriate to try out the best approach (accuracy) in a real environment. To determine driver drowsiness, first the model estimates if the probability of the ROI extraction belonging to the Drowsy class is higher than 95%. If so, it is necessary to count the time that the eyes remain closed. If it is more than 300 ms, it is considered drowsiness and an alarm will be displayed to alert the driver. The flowchart of the driver drowsiness detection process in a real environment is show in
Figure 8.
5. Conclusions and Future Works
This study presents an approach for drowsiness detection, where an enhancement method is proposed in the area surrounding the eyes to perform region of interest (ROI) extraction. Likewise, three CNNs are used as a basis: InceptionV3, VGG16 and ResNet50V2. A modification in the architecture of the fully connected network used in the classification process is proposed.
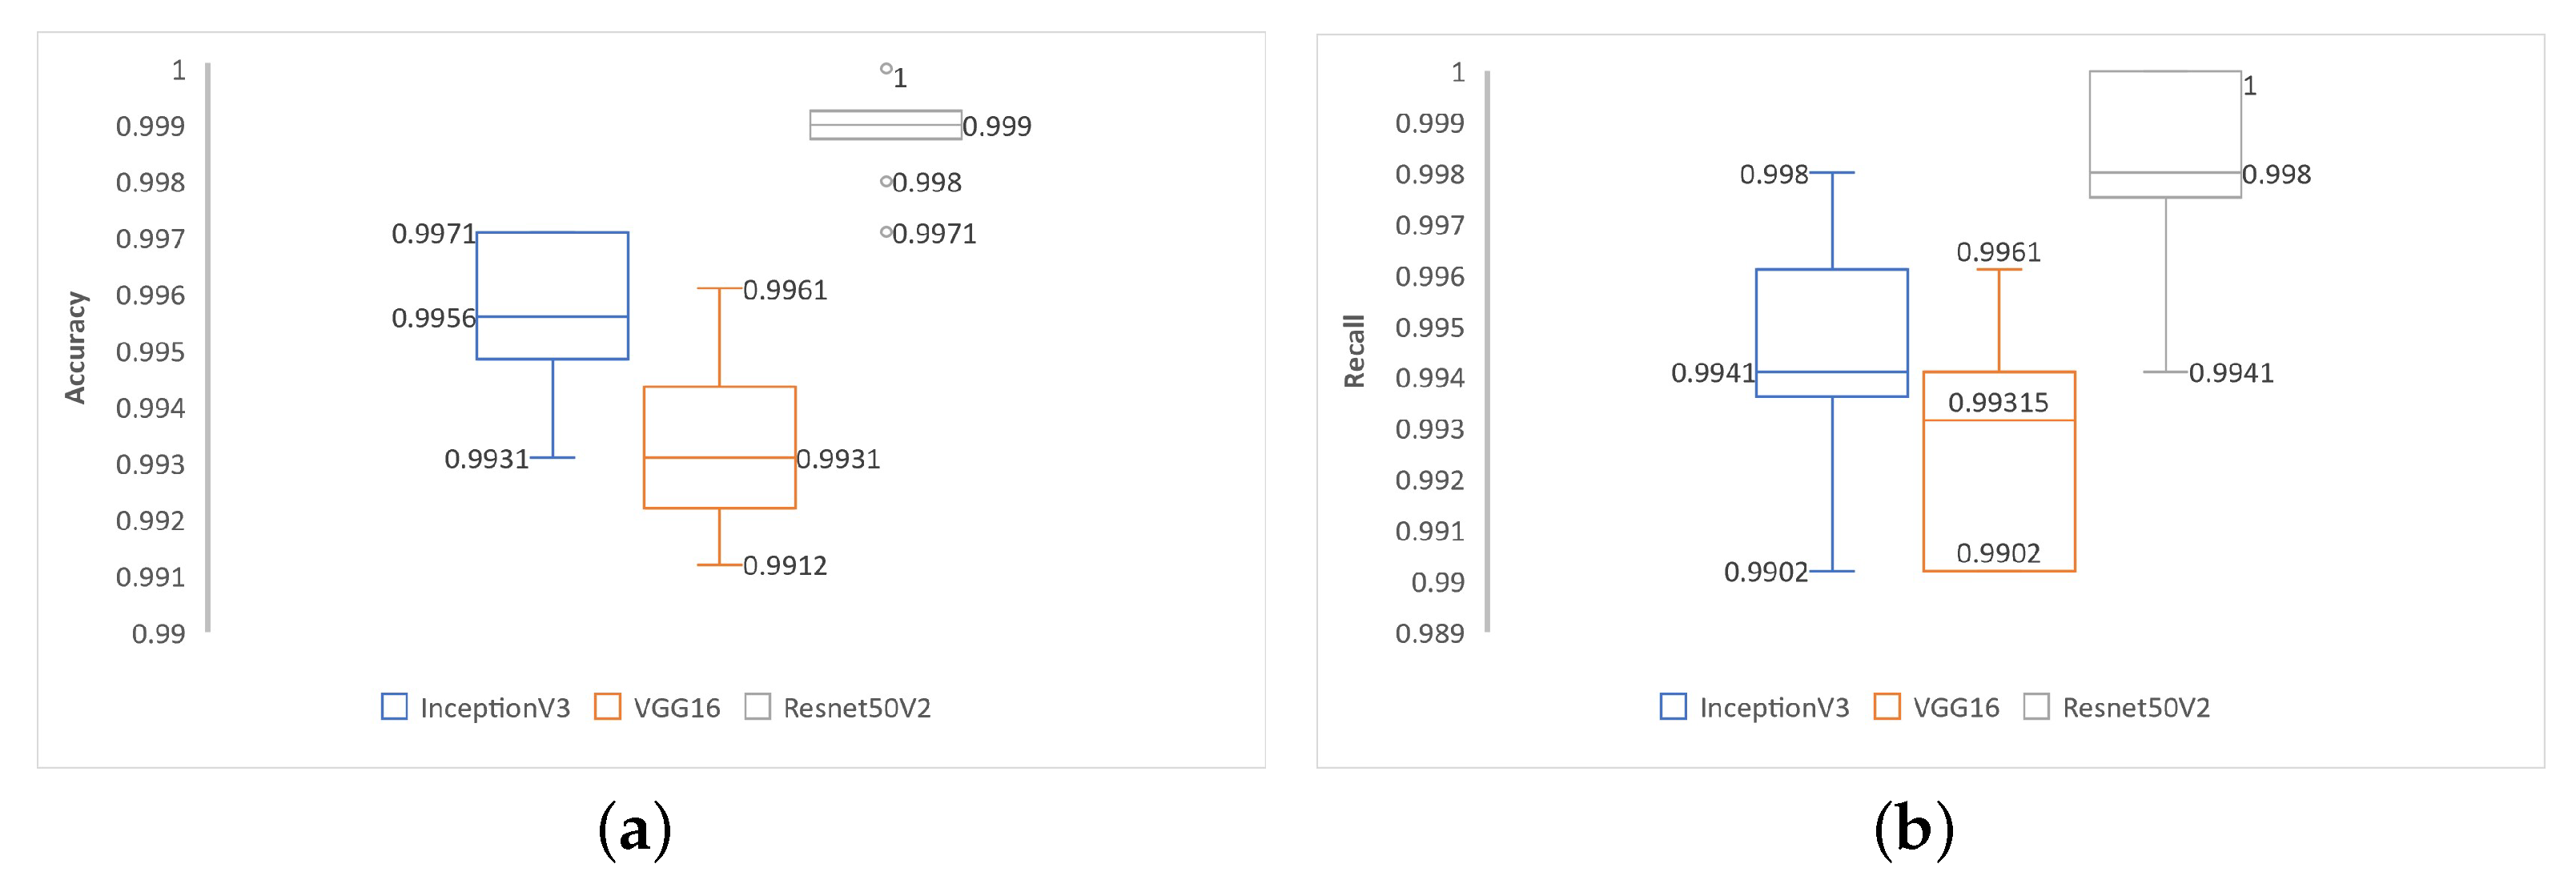
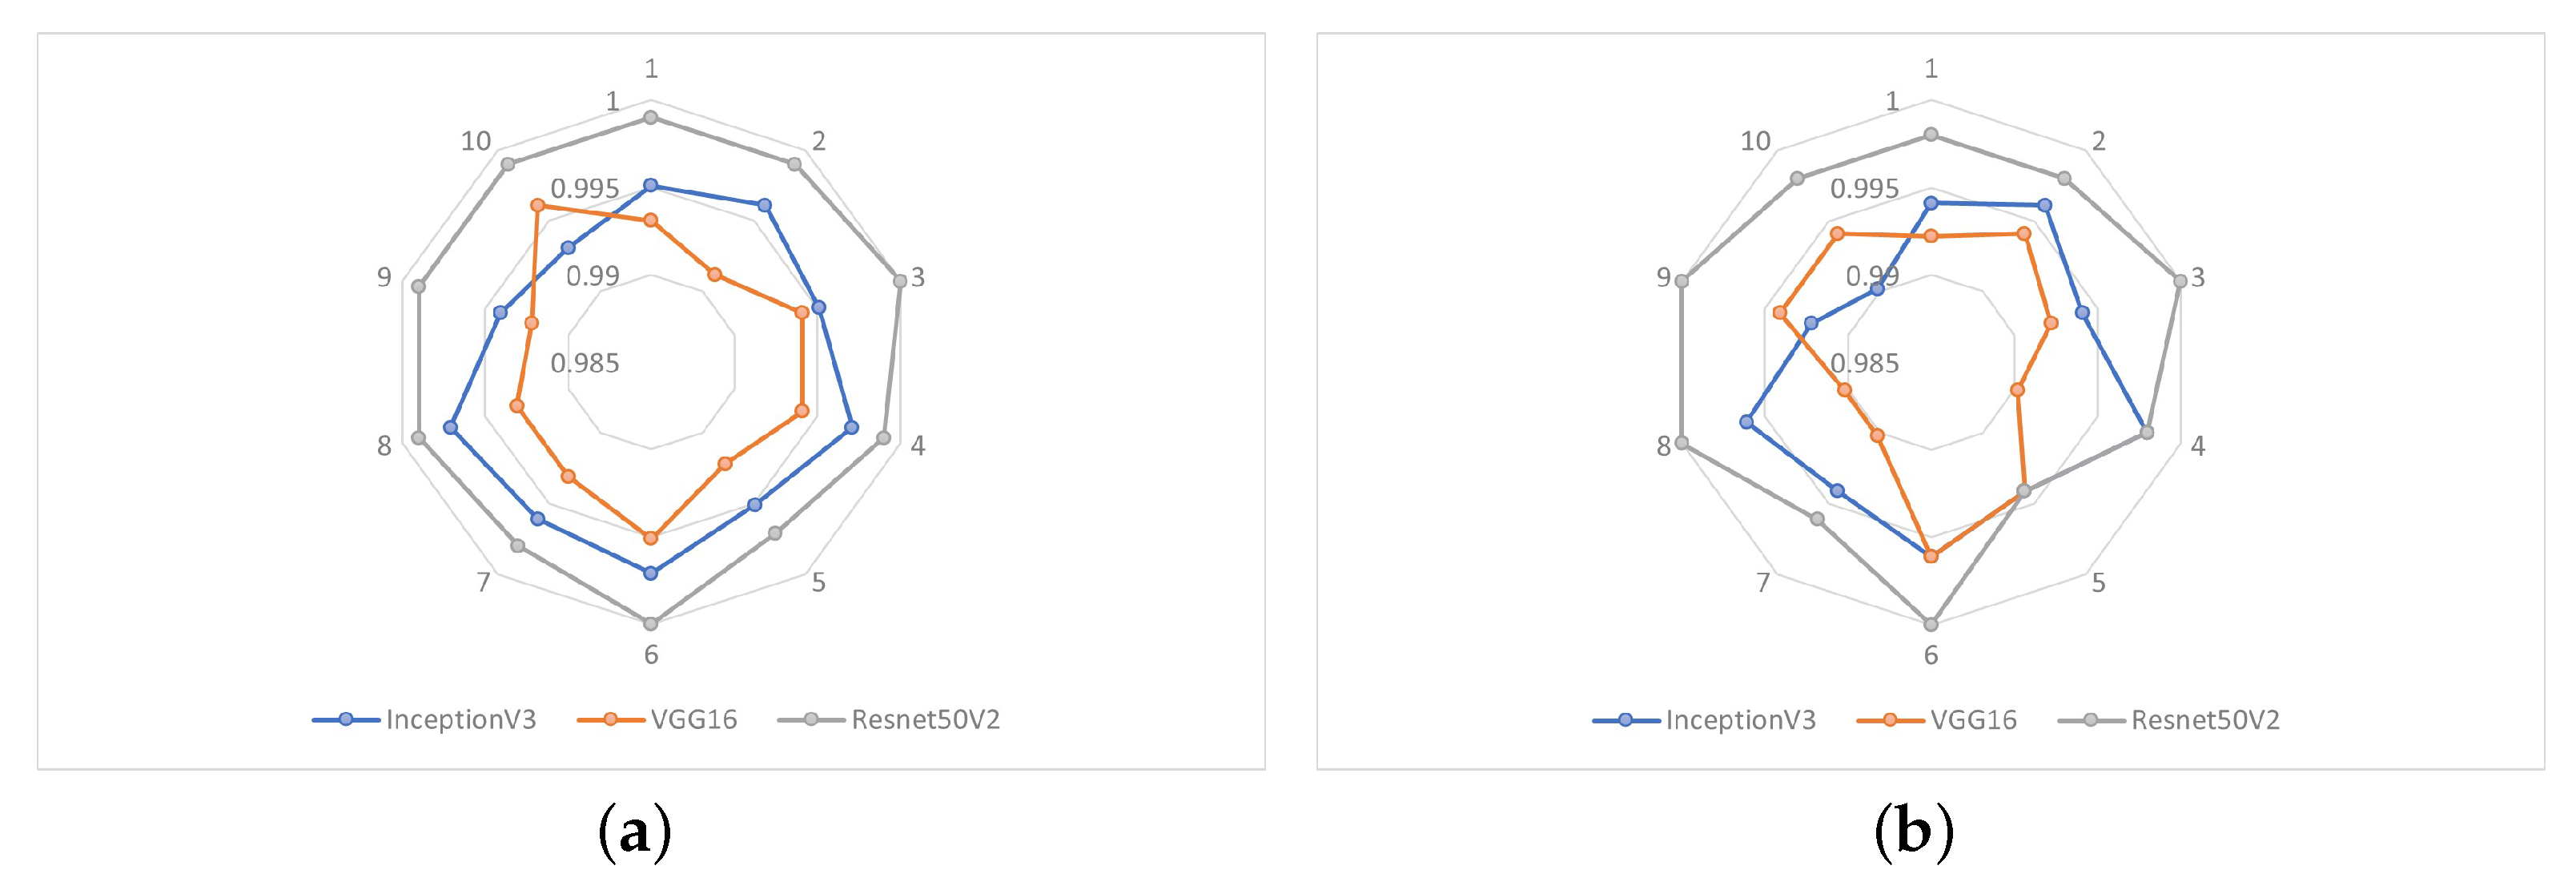
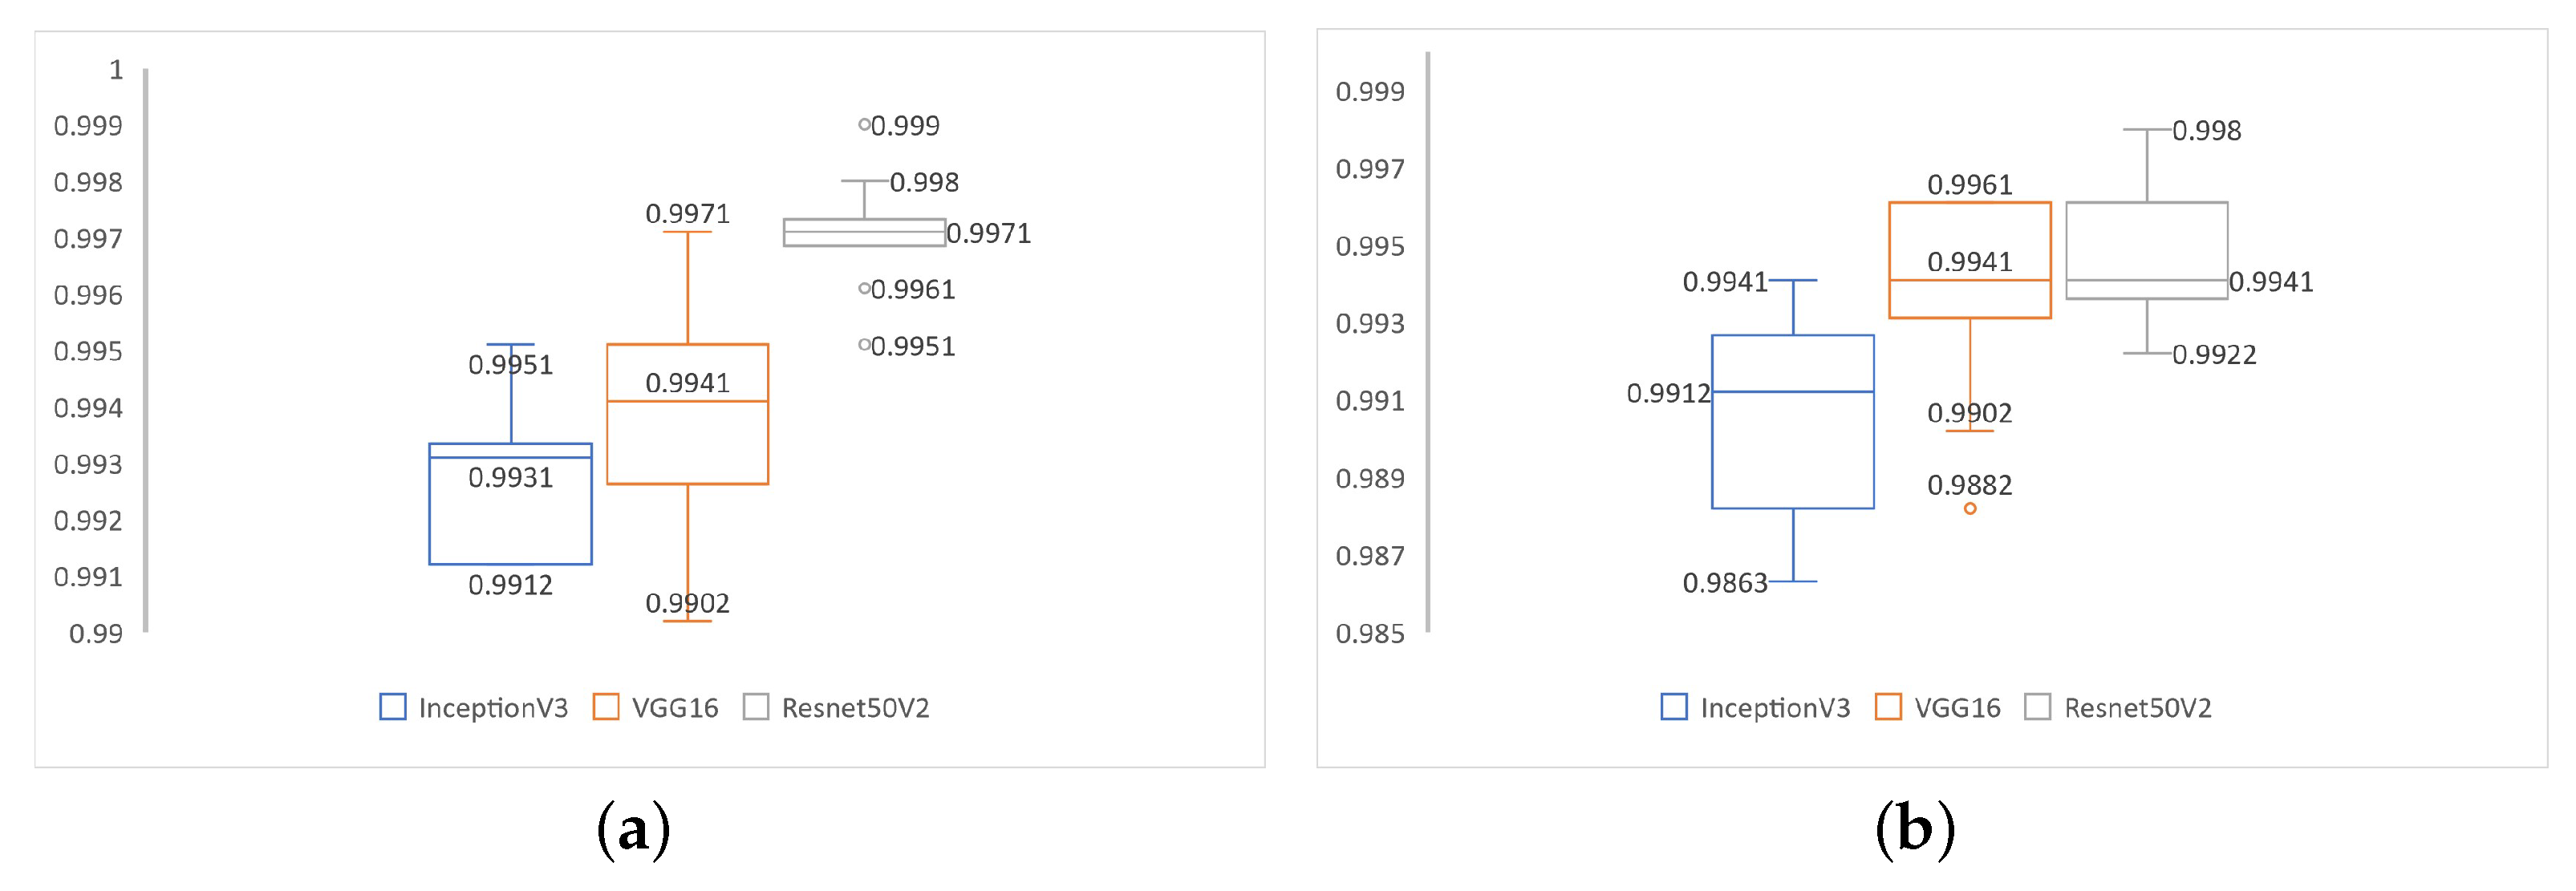
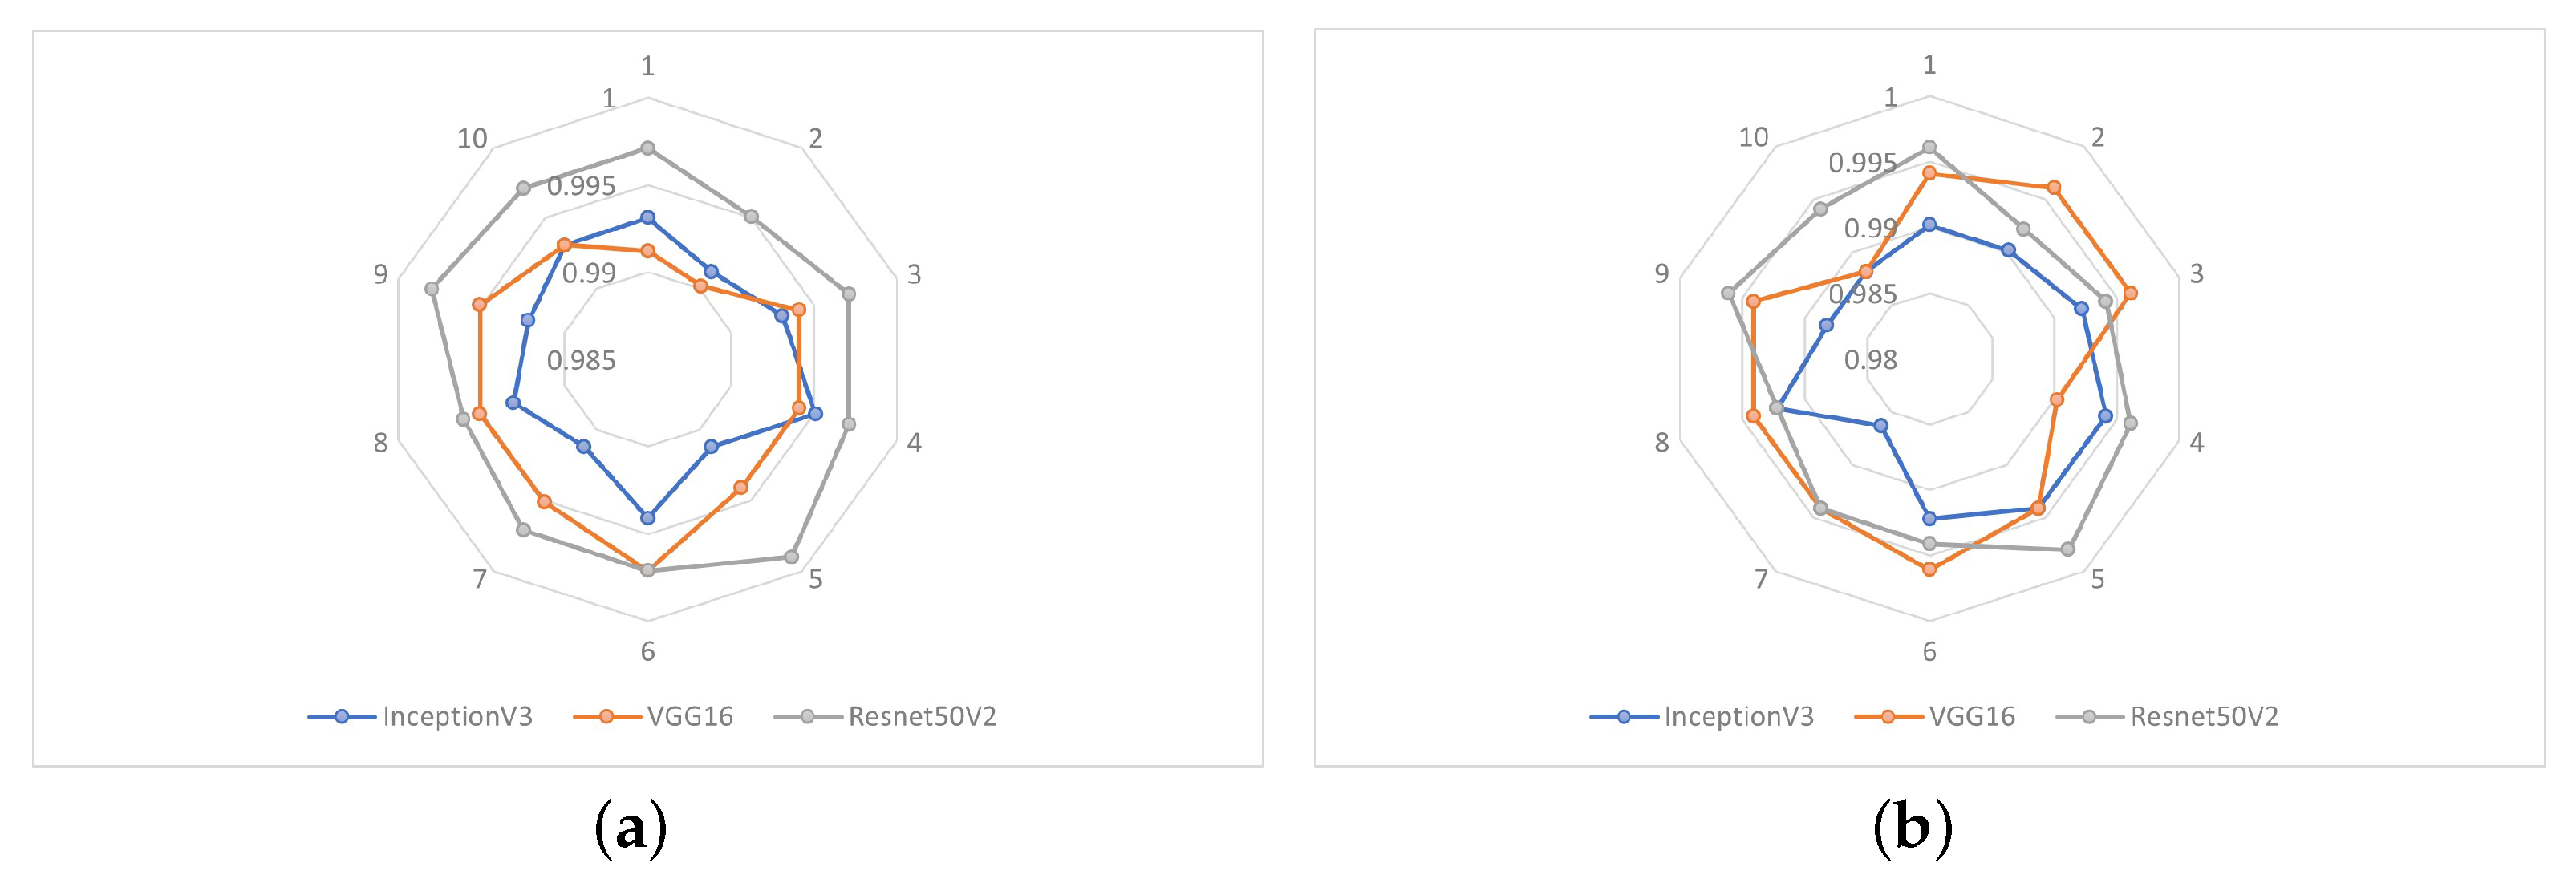
For the experiments, a database was created from NITYMED videos. The results were obtained from 10 experiments performed and showed an exceptionally high accuracy in drowsiness detection using the architectures based on the three CNNs mentioned above, with values of 99.31%, 99.41% and 99.71%, respectively. The response times used for drowsiness detection by each CNN were shown to be relatively equivalent, with the VGG16-based CNN showing a small advantage.
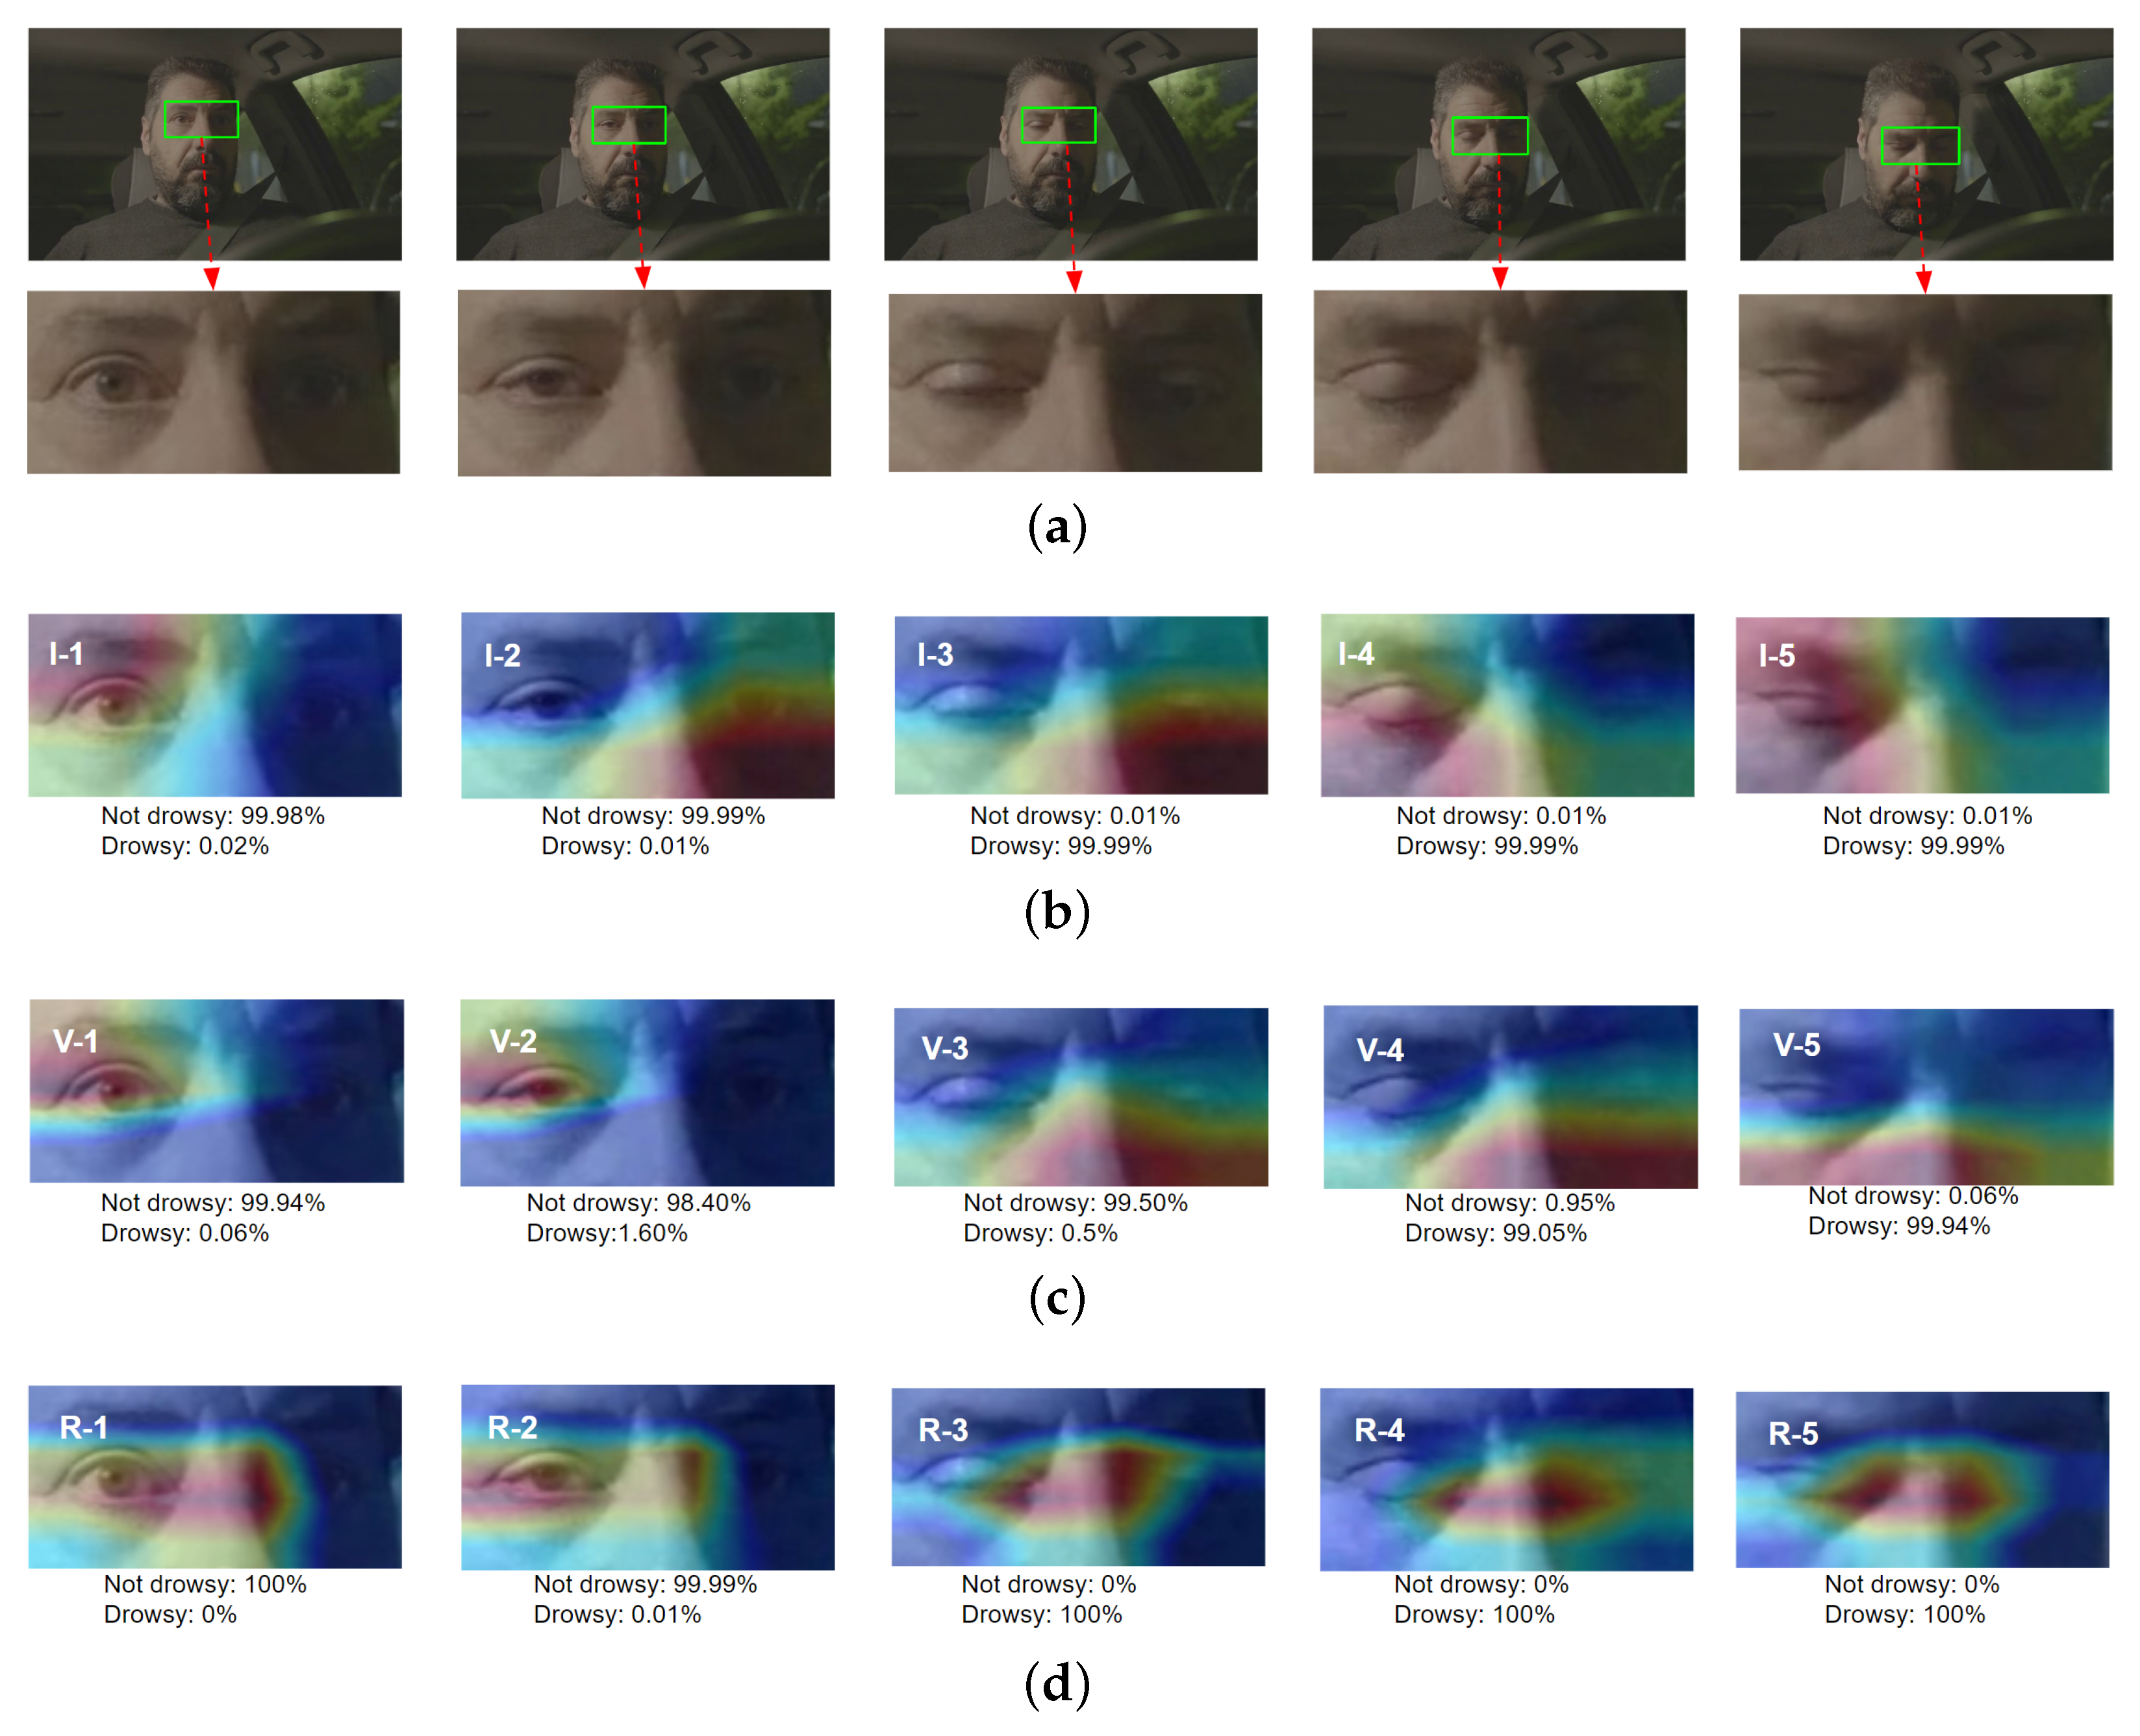
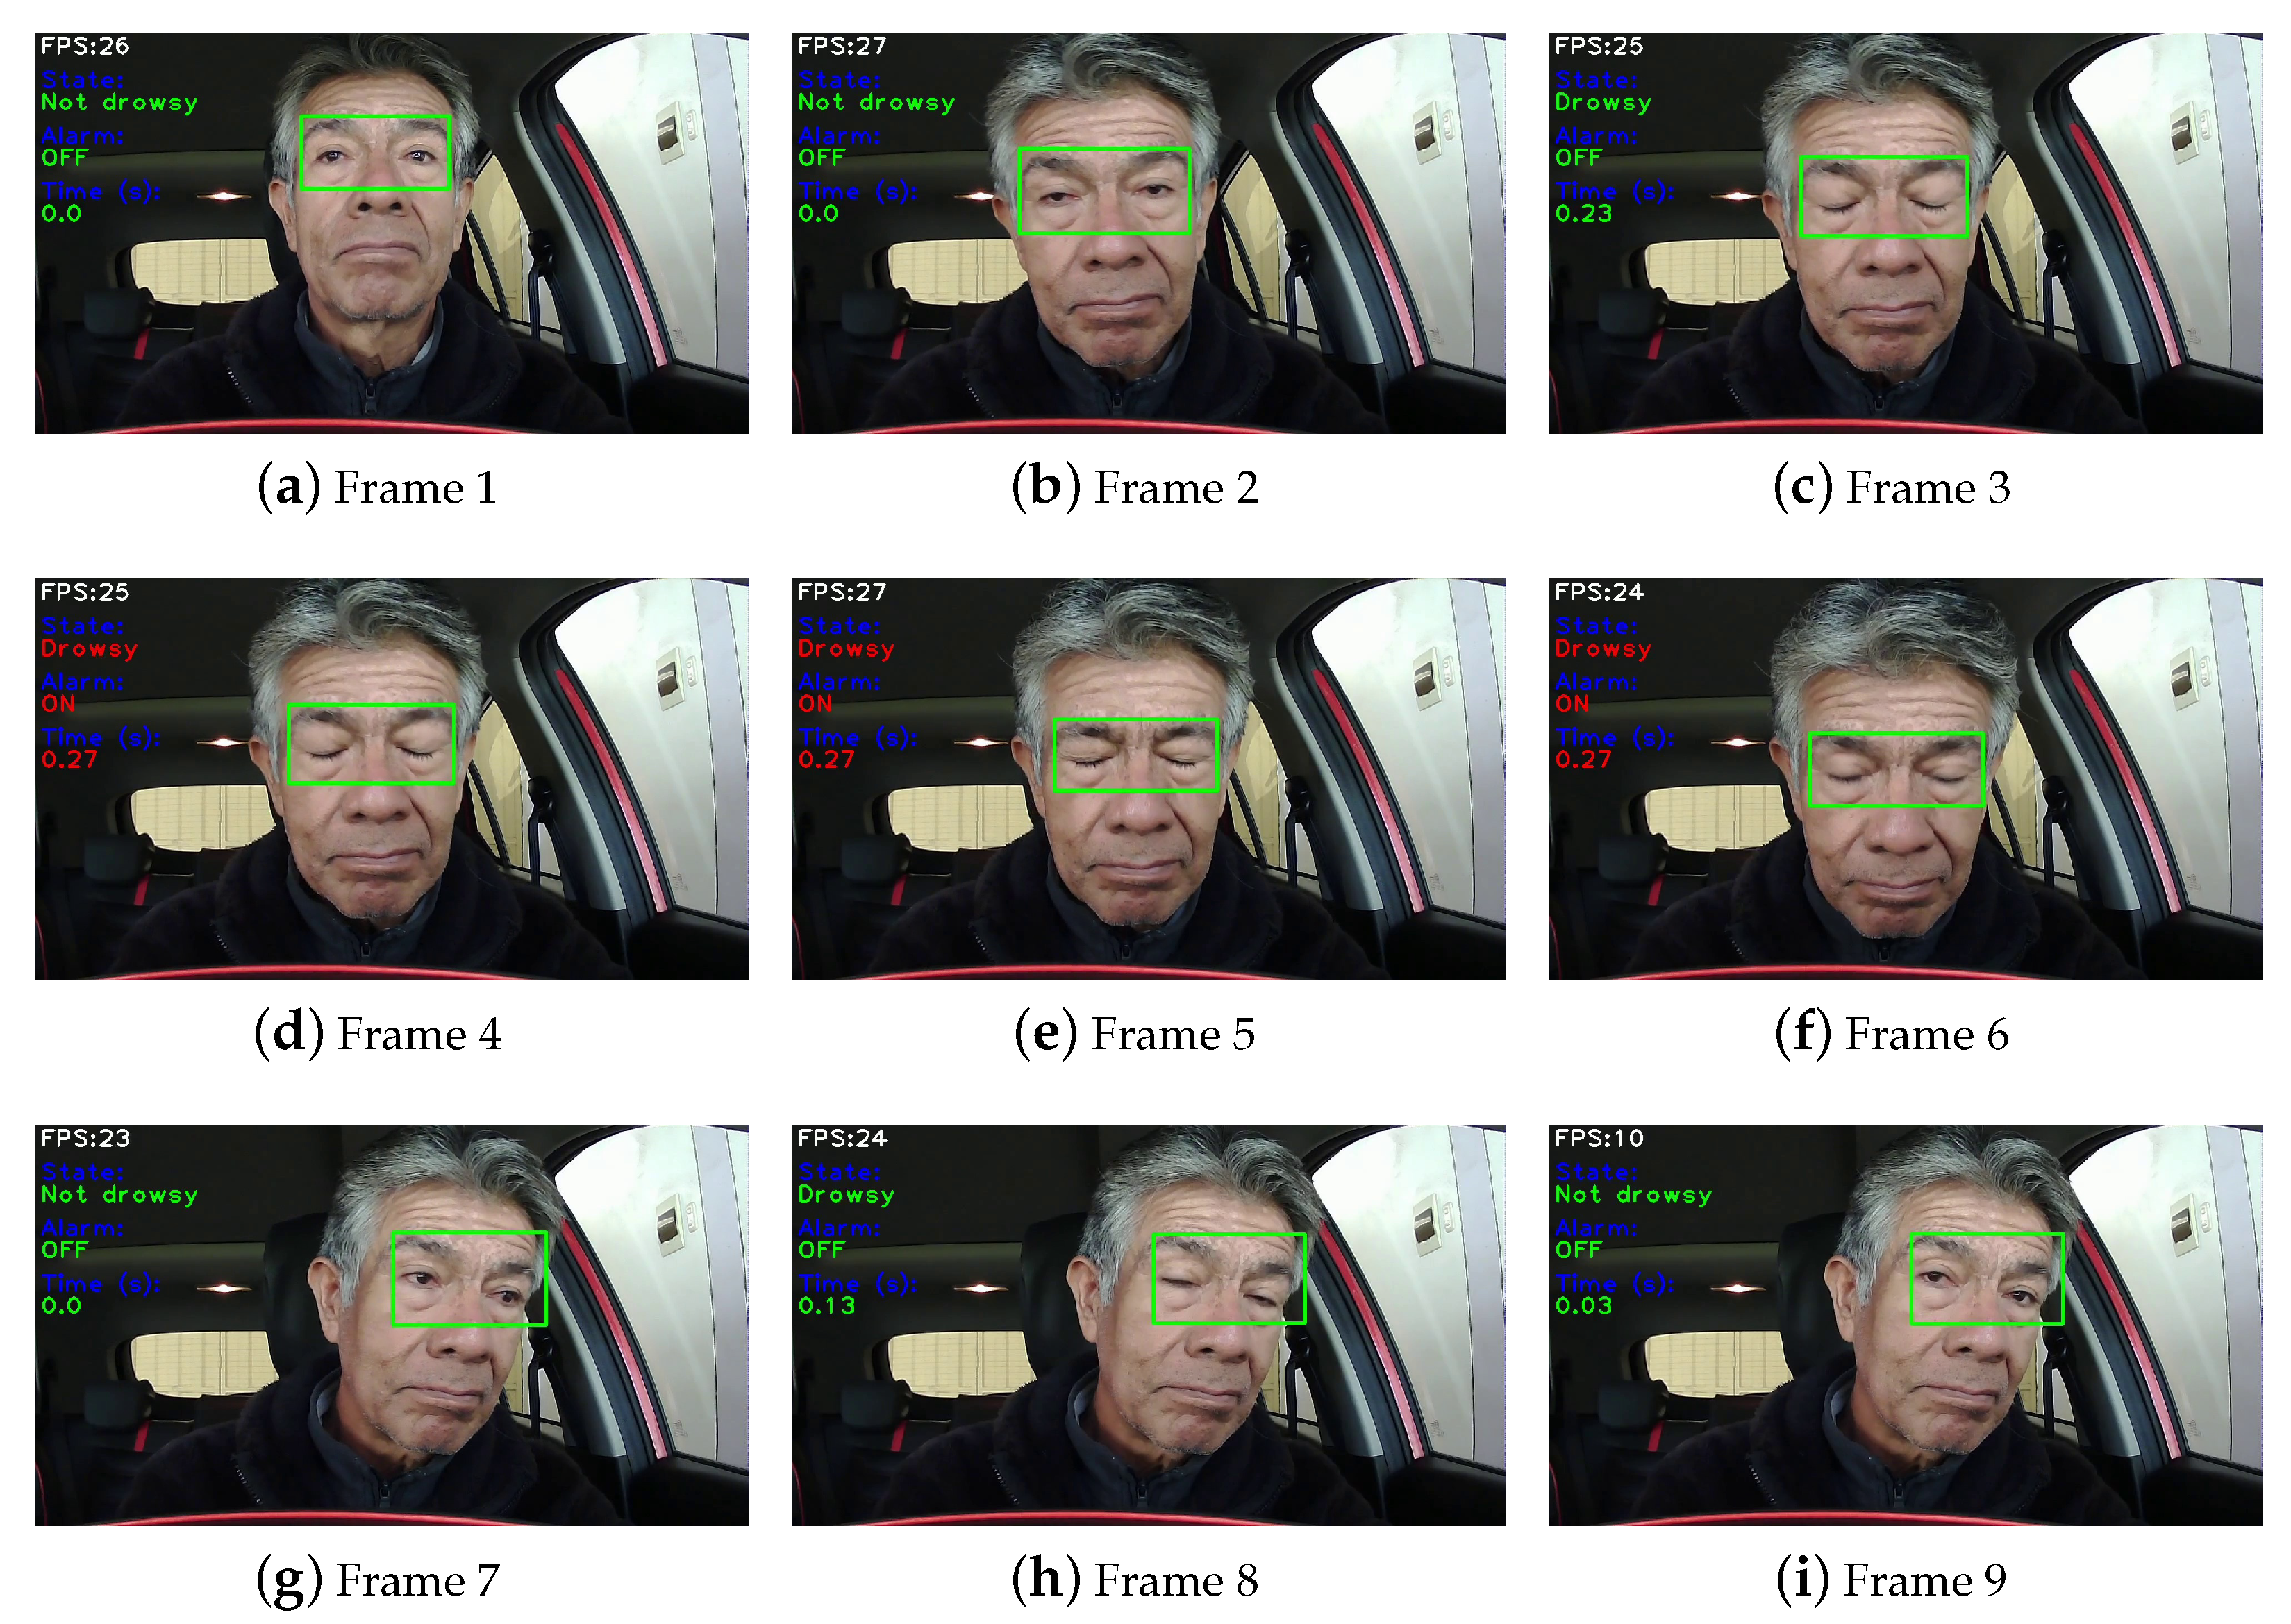
In addition, the Grad-CAM visual technique was used to analyze the behavior of each CNN, where the ResNet50V2-based CNN predominantly focuses on the eye region, achieving better performance in drowsiness detection. These results suggest that the proposed approach may be a good alternative for the implementation of the drowsiness detection system. Among the CNNs used, the ResNet50V2-based CNN presented the best performance, and considering the results of the examples in different scenarios (
Figure 13), this architecture also presents higher robustness. When comparing the execution time for detection of this CNN with the other two CNNs (
Table 5), it can be considered acceptable.
When the system based on this proposal is implemented, it can be considered a valuable tool for the prevention of automobile accidents caused by driver drowsiness.
As future work, we intend to make use of near-infrared (NIR) imaging to better focus on the eye region when there are illumination limitations. As a complement to this work, yawning detection can also be performed for preventive identification of drowsiness. Finally, the authors intend to implement this in an embedded system adapted to vehicular units.


 ,
, 


