
Determining Wind Energy Potential Using Geographic Information System Functions: A Case Study in Balıkesir, Turkey


Department of Geomatics Engineering, Osmaniye Korkut Ata University, Osmaniye 80000, Turkey
Appl. Sci. 2023, 13(16), 9183; https://0-doi-org.brum.beds.ac.uk/10.3390/app13169183
Submission received: 21 June 2023
/
Revised: 31 July 2023
/
Accepted: 3 August 2023
/
Published: 12 August 2023
(This article belongs to the Special Issue GIS Applications in Green Development)
Abstract
:With developing technology, energy consumption and requirements are steadily rising. Wind energy emerges as an indispensable energy source in the world, where energy requirements are increasing gradually due to important features such as being renewable, sustainable, easily accessible, and environmentally friendly. In recent years, wind energy investments in Turkey have increased significantly, in line with the rest of the world. In recent decades, a significant number of investors have performed investment studies in this area. In this study, the wind energy potential of the Balıkesir Province in Turkey was calculated using geographical information system (GIS) functions. A wind speed map was created by using wind speed data measured at a 10 m altitude at 32 meteorological stations. The wind speeds were extrapolated to 100 m considering the land cover data, and a wind speed map of the Balıkesir Province was created using GIS functions. An equation was produced to calculate the number of turbines that can be placed in a certain area depending on the national regulation, which is also the novelty of this study. By using this equation, the wind energy potential values of the Balıkesir Province and its districts were obtained according to varying wind speed ranges. The results obtained in this study were compared with the wind energy potential atlas of Turkey (REPA).
1. Introduction
Energy consumption is increasing due to the rapidly growing world population and technological developments. Natural energy resources play an important role both in meeting the needs of countries and in development efforts throughout history. Today, countries that are advanced in terms of their development are those that have managed to use their natural resources efficiently. People want to benefit from all resources on Earth and have their needs met, which is difficult due to the rapid increase in global population. Planning and project studies about determining, obtaining, storing, processing, and using natural resources to meet the needs of people have shown how important natural resources are for human life. Natural energy resources include renewable and non-renewable sources. The main sources of non-renewable energy are oil, natural gas, coal, and nuclear energy. Oil, natural gas, and coal are called fossil fuels. Biomass, geothermal, solar, wind, and hydroelectric energy sources are the leading sources of renewable energy. Due to the lack of continuity of non-renewable energy resources, it is not possible to meet the energy needs of the world forever. According to Marks-Bielska et al. [1], experts warn that non-renewable energy sources may run out by 2040 with the present energy consumption in the world. The air pollution caused by the greenhouse gases generated during the consumption of fossil fuels poses a threat to the climate balance of the Earth [2]. Renewable energy is a type of energy source that depends on the climatic conditions of a region, produces less greenhouse gas emissions than fossil energy sources, and is naturally replenished [3]. Renewable energy sources are more advantageous than fossil energy sources due to their unlimited amount, less harm to the environment, and safety [4].
Solar and wind energy are the best known and fastest-growing renewable energy sources that will help to ensure sustainable development in the world [5]. Wind energy is the most developed and commercially available energy type among the renewable energy sources in the world. The People’s Republic of China ranks first for the development of wind energy production in recent years. The United States, Germany, India, and Spain follow the People’s Republic of China [6,7,8,9]. The installed wind power capacities of countries and their places in the world rankings are given in Table 1 [8].
Considering the Republic of Turkey’s eleventh development plan covering the 2019–2023 period, the share of renewable energy sources in electricity production for 2023 is estimated to be 38.8% [10]. According to Turkey Electricity Investments in the June 2022 Summary Report prepared by the General Directorate of Energy Affairs, 54.05% of the total installed capacity of 101,518 MW, as of 30 June 2022, consists of renewable energy production facilities [11].
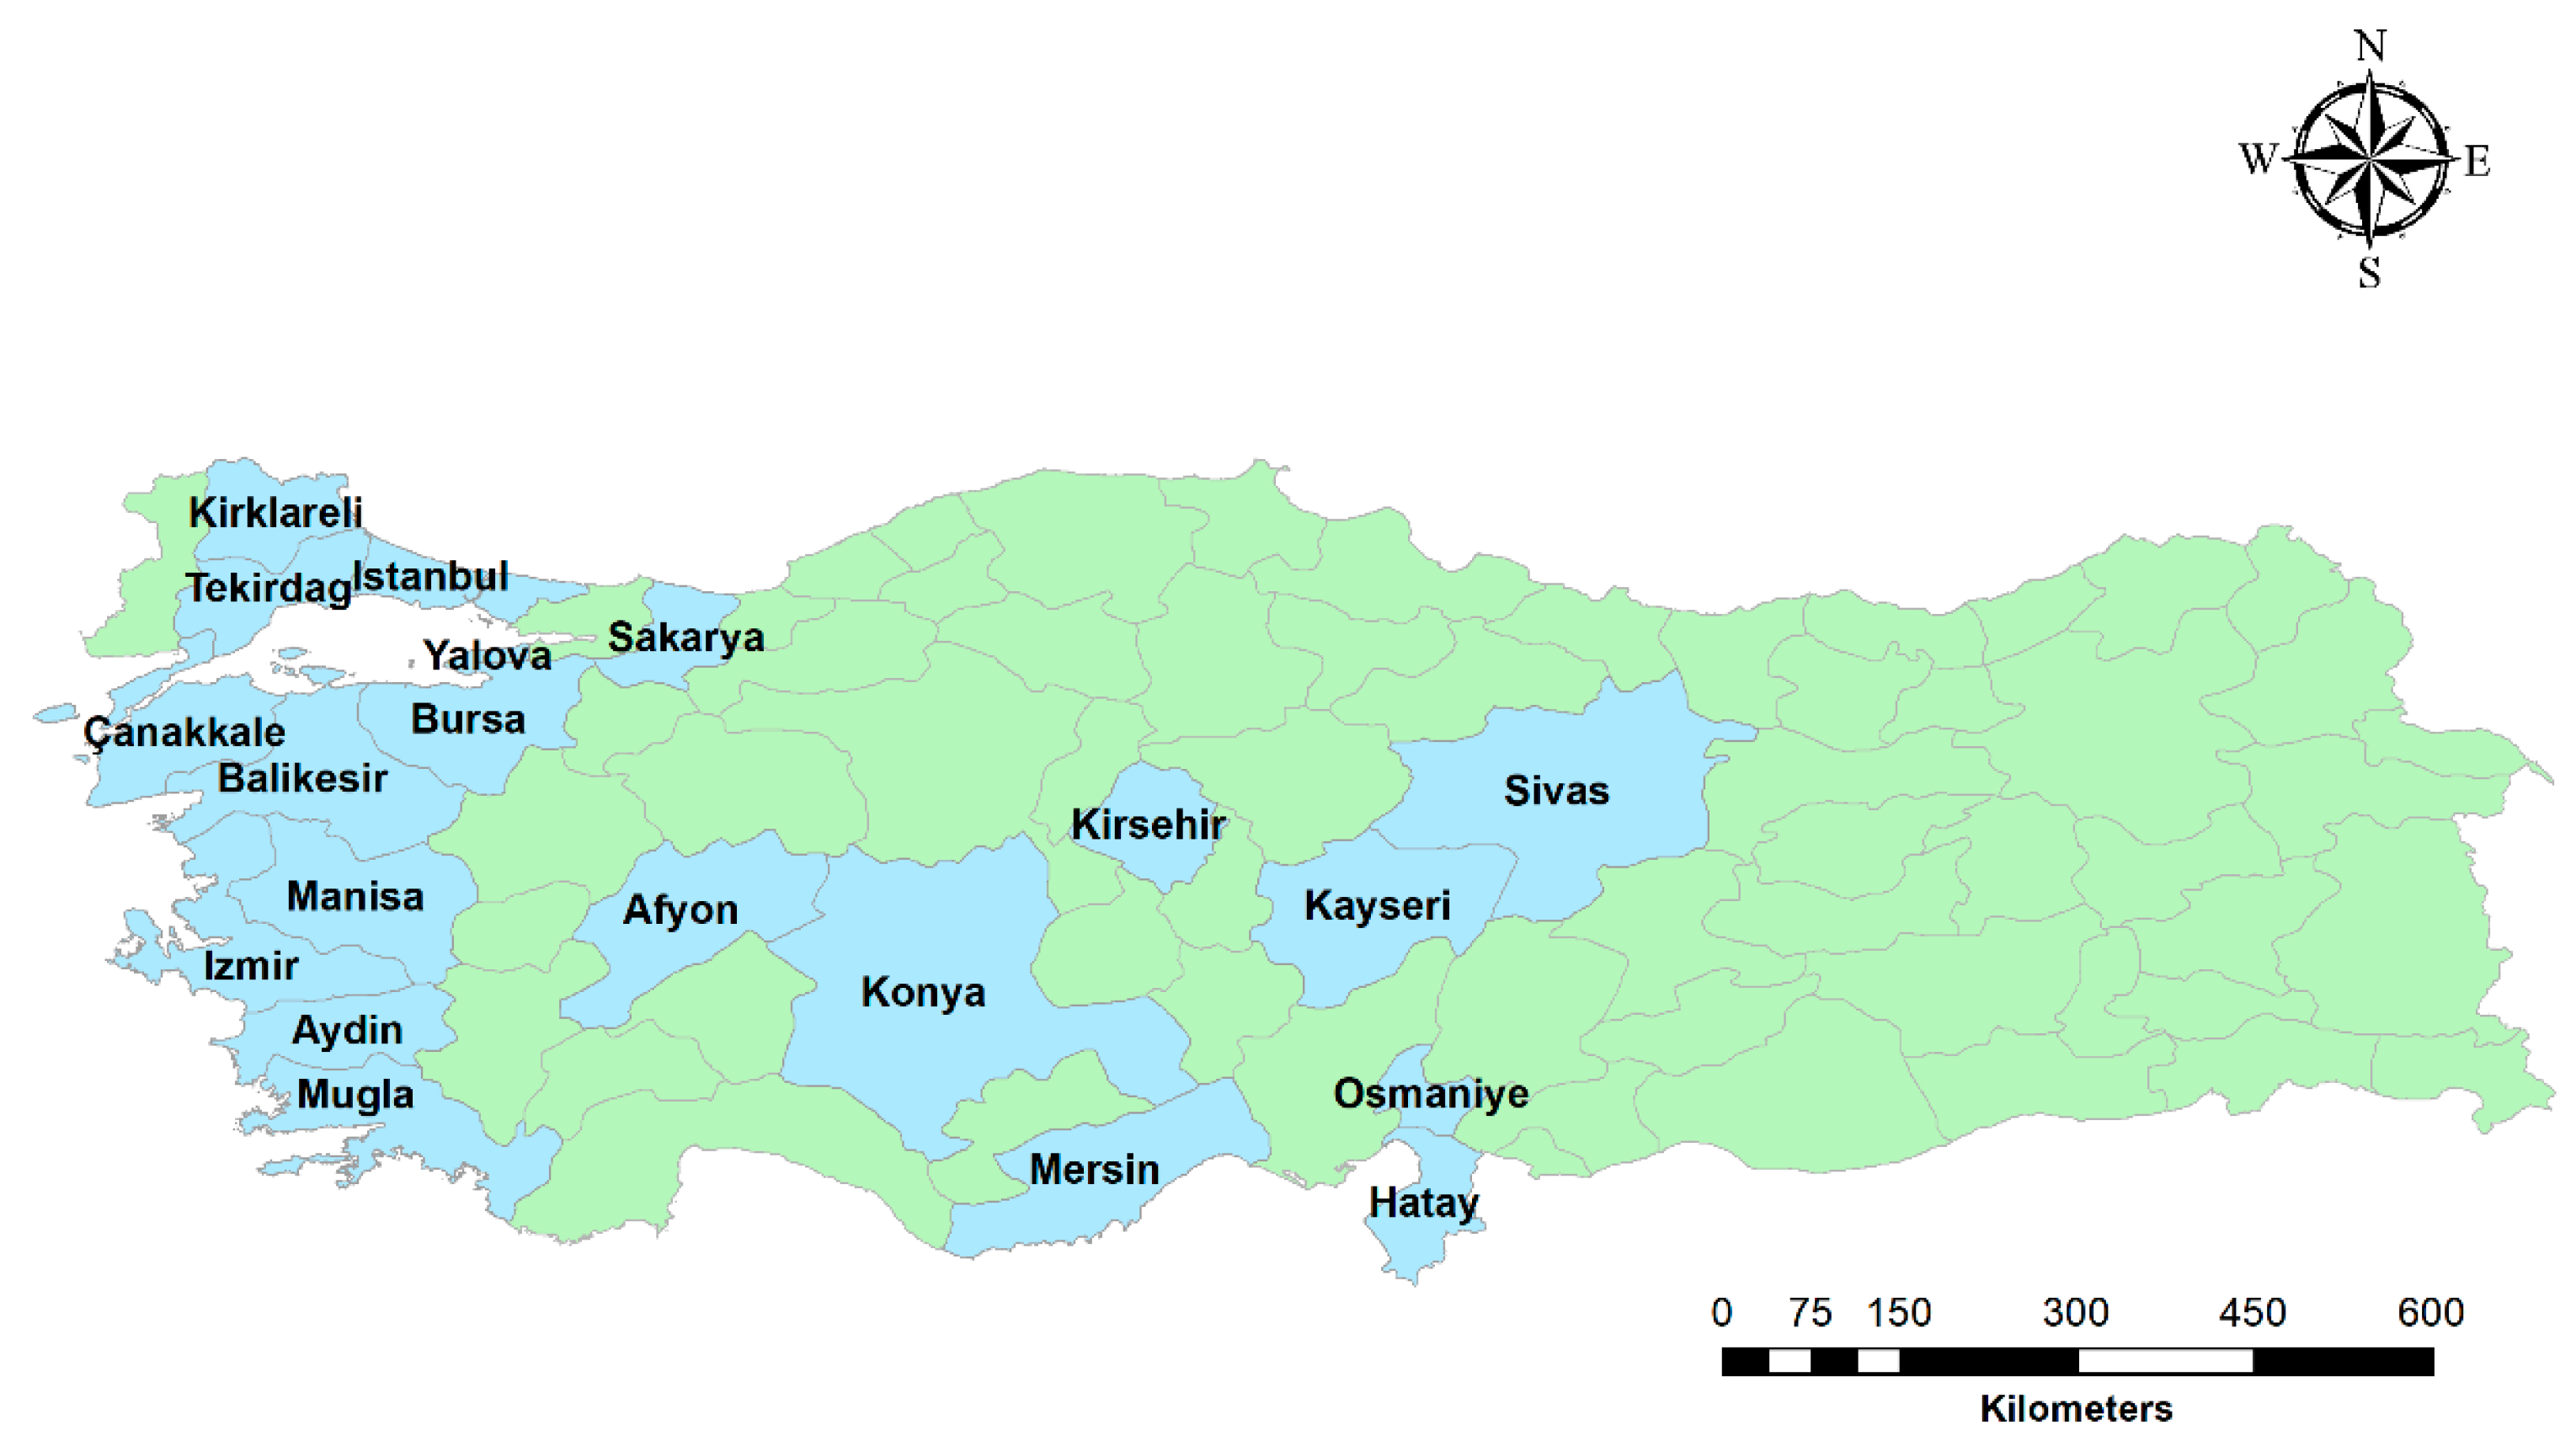
Wind energy production in Turkey first began in 1998 in Izmir [12]. After the initial setup, the development of wind energy production in Turkey has progressed in a way consistent with its general development in the world. However, the production of wind energy investments in Turkey has significantly increased in recent years. The total installed capacity, which was 1375.80 MW in 2010, reached 11,101.82 MW as of January 2022. The highest growth in terms of the installed capacity during this period was 1797 MW between 2020 and 2021. This increase elevated Turkey’s place in the world rankings significantly. The annual rate of increase, which was around 30% in the first years, decreased noticeably between 2016 and 2019, and declined by around 9% in 2019. After 2019, the annual rate of increase started to rise again and reached 19.31% at the end of 2021. In recent years, in order to increase the renewable energy production in Turkey, a number of incentives, such as tax exemptions, fixed price guarantees, and public land allocation, have been given by the government [13]. With the help of these incentives, wind energy investments, which are an important renewable energy source, have gained momentum. When cities are compared in terms of their total installed capacity, İzmir ranks first with 1886.70 MW, Balıkesir second with 1375.05 MW, Çanakkale third with 917.35 MW, and Manisa fourth with 727.55 MW. The total installed capacity of these four cities constitute 44.3% of Turkey’s installed capacity [14]. When the installed capacity increase of the provinces between January 2021 and January 2022 is examined, İstanbul takes the lead with an increase of 350.09 MW. Yalova, Çanakkale, Balıkesir, Kırklareli, Bursa, and Sakarya follow İstanbul [14,15]. The installed capacities, growth rates, and shares of the provinces in the country’s capacity as of January 2021 and January 2022 are shown in Table 2. In addition, the geographical distribution of the provinces within the top twenty in terms of their installed wind power capacity in Turkey is given in Figure 1.
Wind speed and wind power potential are among the most important factors taken into consideration when establishing wind power plants. Therefore, the availability of standardized wind speed data is crucial for potential determination studies. Having up-to-date and reliable data in line with standards will enable consistent modeling procedures and comparatively reduce the effort spent on modeling [16].
The lowest (cut-in) speed required for current wind turbines to start generating electricity is generally 3 m/s [17,18,19]. Although wind turbines can produce energy at low speeds, wind speeds must be above a certain value for economically sustainable production. There are different studies about this subject in the literature. The exclusion value of wind speed considered in these studies varies between 5 and 7 m/s [20,21,22,23,24,25,26,27].
When the literature about determining wind energy potential is examined, studies are generally carried out based on only one point [28,29,30,31,32,33,34,35,36,37,38]. It is not very meaningful to make evaluations for large areas such as districts and provinces by using only one point. For example, Bertrand et al. [34] determined the energy density of Ambam in Cameroon. Wang and Liu [35] studied the wind energy potential of the Maling Mountain in China at a height of 30 m. The wind speeds were not extrapolated to a certain height. Ongaki et al. [39] determined the wind power density of the Kisii Region in Kenya using wind speed data obtained from four stations at a height of 10 m. The wind speeds were extrapolated to different heights from 20 m to 70 m. The wind power density of the case study’s station was calculated in accordance with these wind speeds. Çakmakçı and Hüner [36] calculated the wind energy potential of the Kırklareli University Kayalı Campus at an altitude of 100 m. Paraschiv et al. [37] obtained the wind power density in the southeast of Romania near to Tulcea city. All used wind speeds obtained from only one station. Jung and Schindler [38] assessed the wind energy potential of Germany using several data points under climate change at the wind turbine scale. They produced a wind speed map by using a Wind Speed-Wind Shear model (WSWS). Although the wind speed map was created in the study, the wind potential evaluations were made on a point basis. Since the studies were carried out using a point-based approach, it is not meaningful to use this for the power potential calculation of large areas. Wind speed measured at multiple points spread over the studied area is required to consistently calculate the wind power potential over large areas.
With the help of geographic information system (GIS) functions, wind speed values at multiple points can be used as input data, and wind speed maps of a particular area can be created using interpolation methods. In this way, a basis is provided for studies in order to calculate the wind power potential in a specific area. Anwer and Deshmukh [40] created a wind speed map of the southern states of India based on 28 data points using the kriging interpolation method of GIS tools. The wind speed map was created in counters to illustrate the wind speed values. Since the produced map was black and white, it was not clearly understood which wind speed value the areas between the two counters had. Feng et al. [41] produced a wind speed map of mainland China using the inverse distance weighting (IDW) interpolation method. The wind energy potential of the study area was calculated for suitable areas for wind farm installation by excluding restricted areas, similar to this study. Zahedi et al. [42] adopted a multi-criteria decision support system to determine the suitable areas for wind turbine installation in the western region of Iran using GIS tools. They determined the wind potential of the suitable sites in the study area, similar to this study. There was no approach for determining the most appropriate spatial interpolation method in both three studies. The determination of the interpolation method is a significant step in wind speed map production. Each interpolation method has its own characteristics and gives different results.
The main purpose of the study was to determine the total wind energy potential in the Balıkesir Province by adopting an appropriate approach according to the legal regulations in Turkey. The wind speed map of the Balıkesir Province at a height of 100 m was produced considering the most appropriate spatial interpolation method. Subsequently, the wind power potential of the Balıkesir Province at a height of 100 m was calculated by excluding legally prohibited areas and those unsuitable for wind generation. The novelty in this study was the creation a wind turbine layout model in accordance with the national regulation, and the production of an equation that gives the number of turbines that can be installed in a certain area. In this way, an approach for assessing the wind energy potential for large areas in Turkey was put forward.
2. Study Area
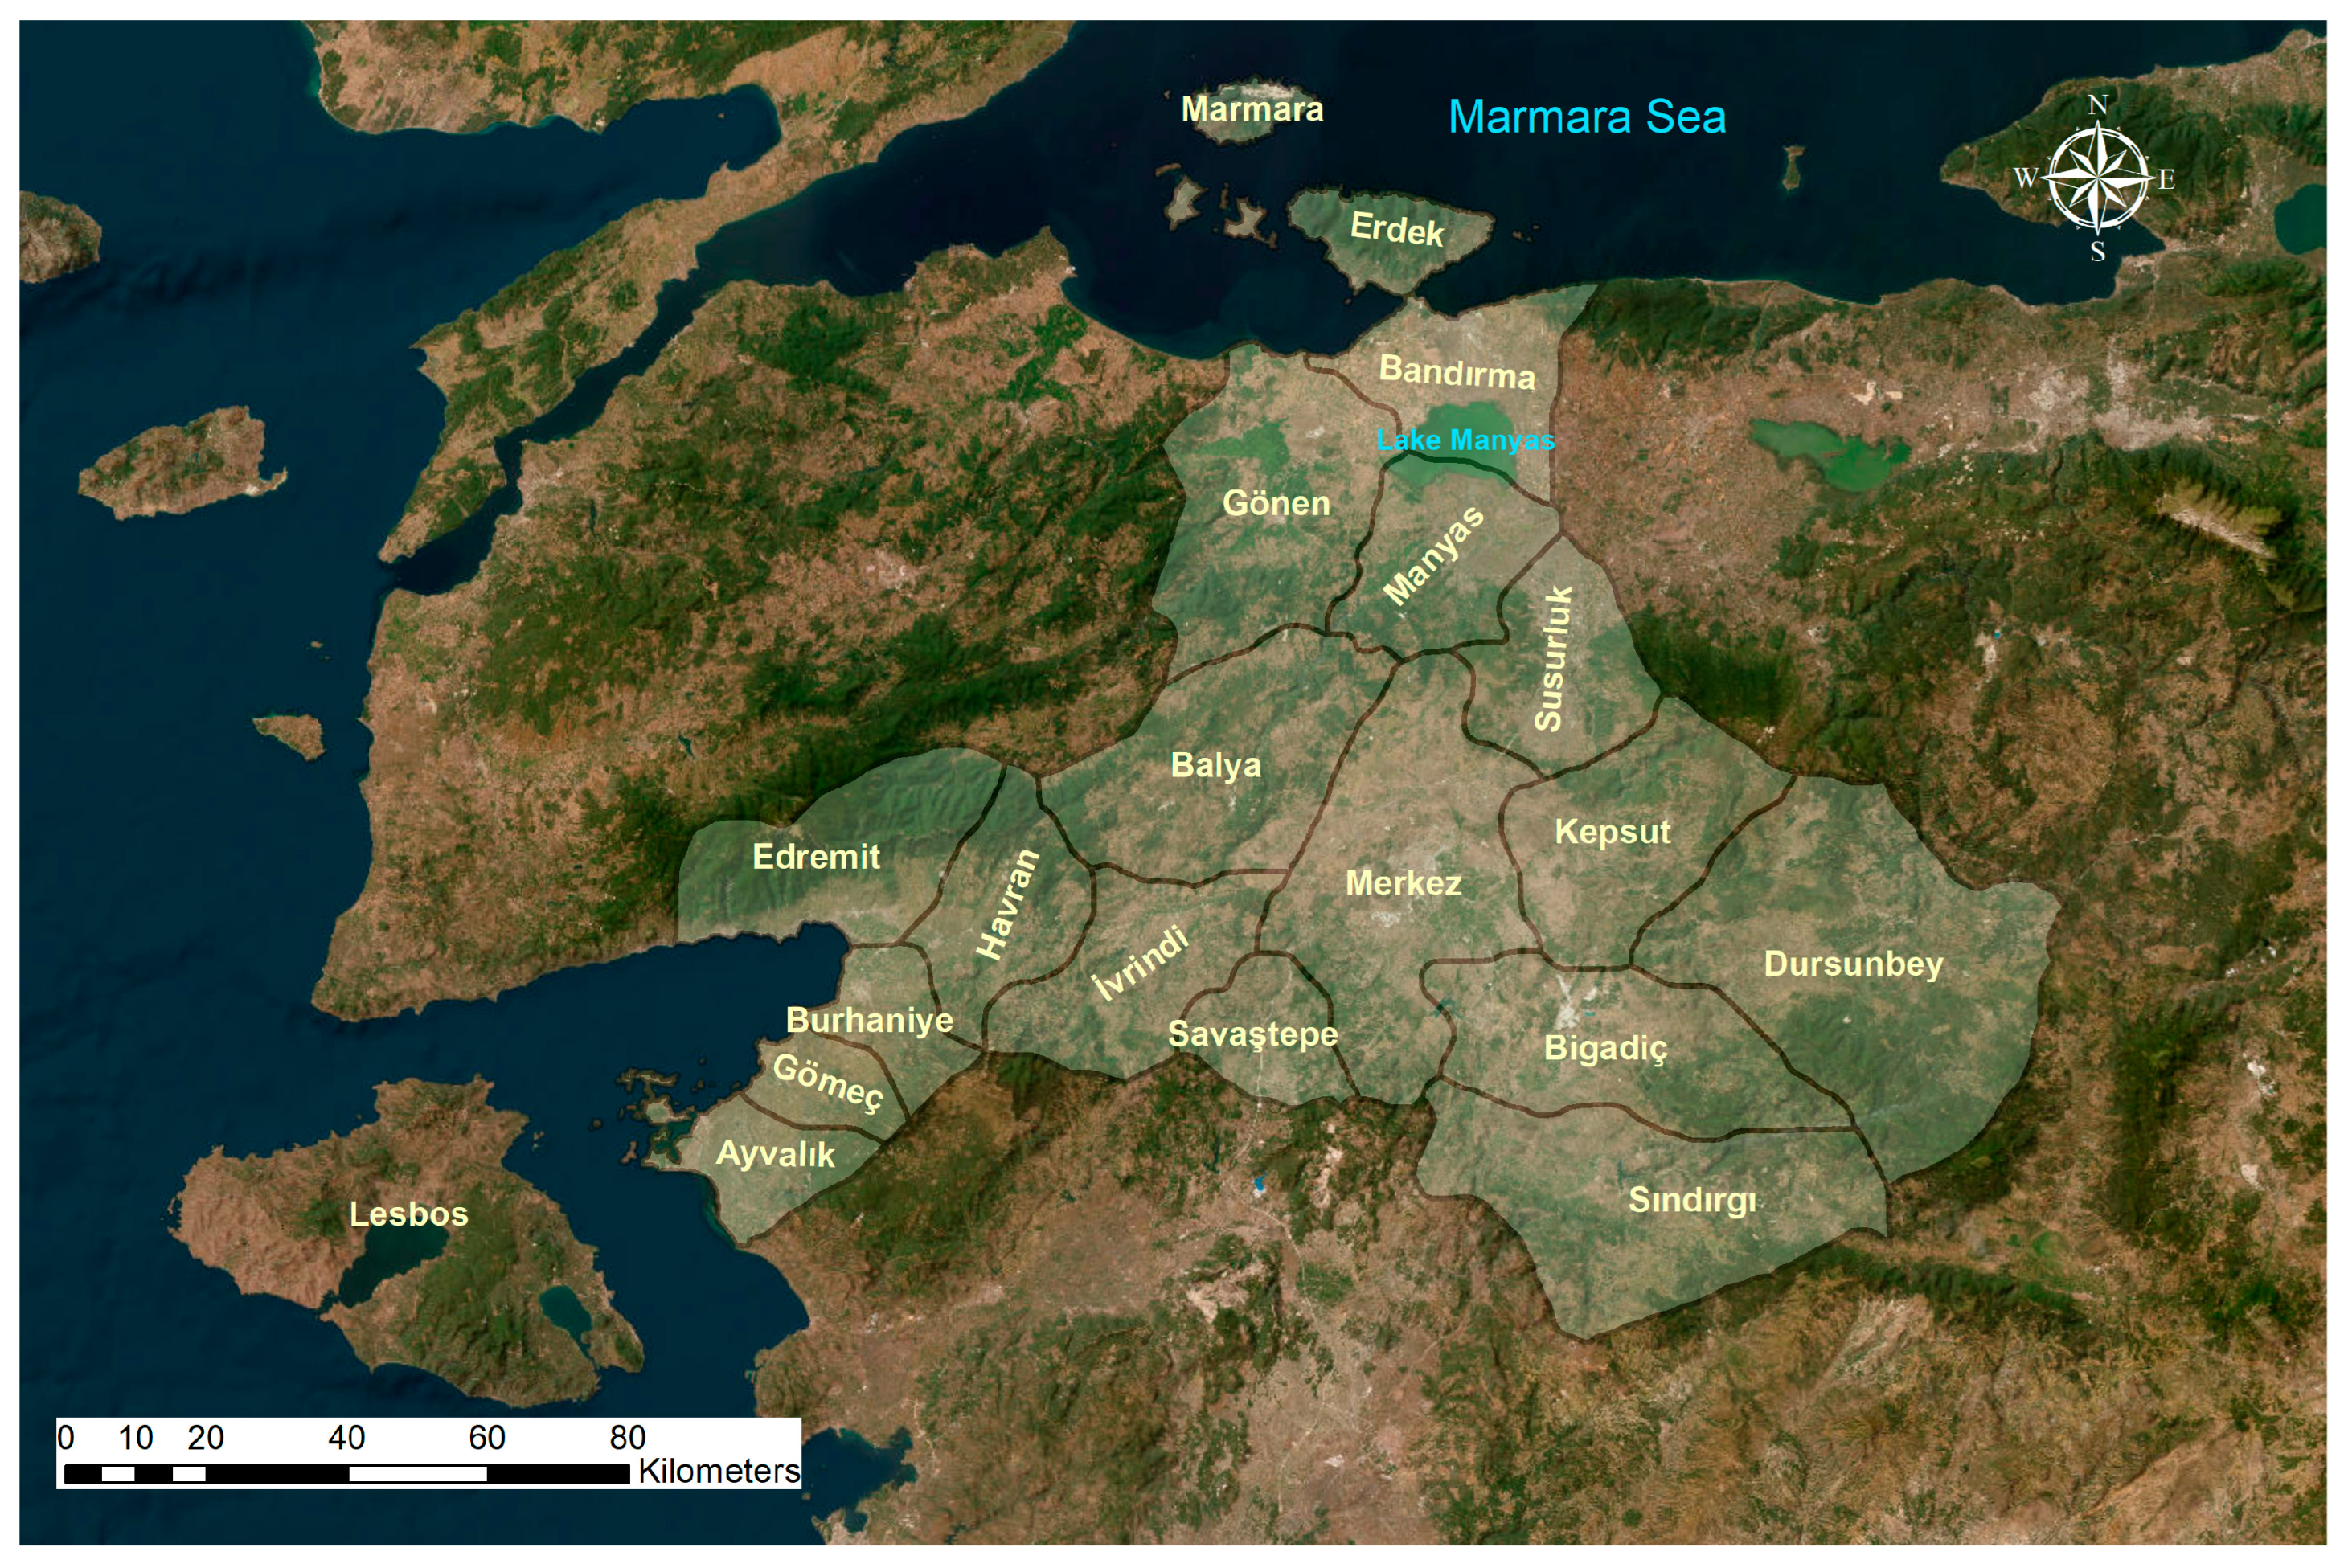
The Balikesir Province is located in the northwest of Turkey. Some of the lands of the Balıkesir Province are in the Marmara Region and some are in the Aegean Region. The province has a coast facing the Marmara Sea to the north and the Aegean Sea to the west. It also borders the Greek island of Lesbos, located in the Aegean Sea.
The Balıkesir Province has a significant role in wind energy production in terms of both its installed capacity and potential within Turkey. When the Balıkesir Province is considered in terms of its total installed power and power potential, it has great importance in terms of wind energy. The total wind energy potential at a height of 50 m in the Balıkesir Province is 13,827.36 MW, according to the wind energy potential atlas of Turkey (REPA) [43]. The total installed power amount was 1375.05 MW as of January 2022 [14]. It constitutes only 9.9% of the potential at a height of 50 m. Considering its installed capacity and new installations, it is seen that Balıkesir has developed in harmony with Turkey. The increase in turbine height due to developments in wind turbine technology provides an increase in wind energy potential. This means that the wind potential of the Balıkesir Province may be higher than that expressed in REPA. This supports the importance of determining the wind energy potential in the Balıkesir Province. Due to the current installed capacity, growth rate, and growth potential in Balıkesir, this province was determined as the case study area. The location of the Balıkesir Province in Turkey and a physical map are given in Figure 2.
3. Materials and Methods
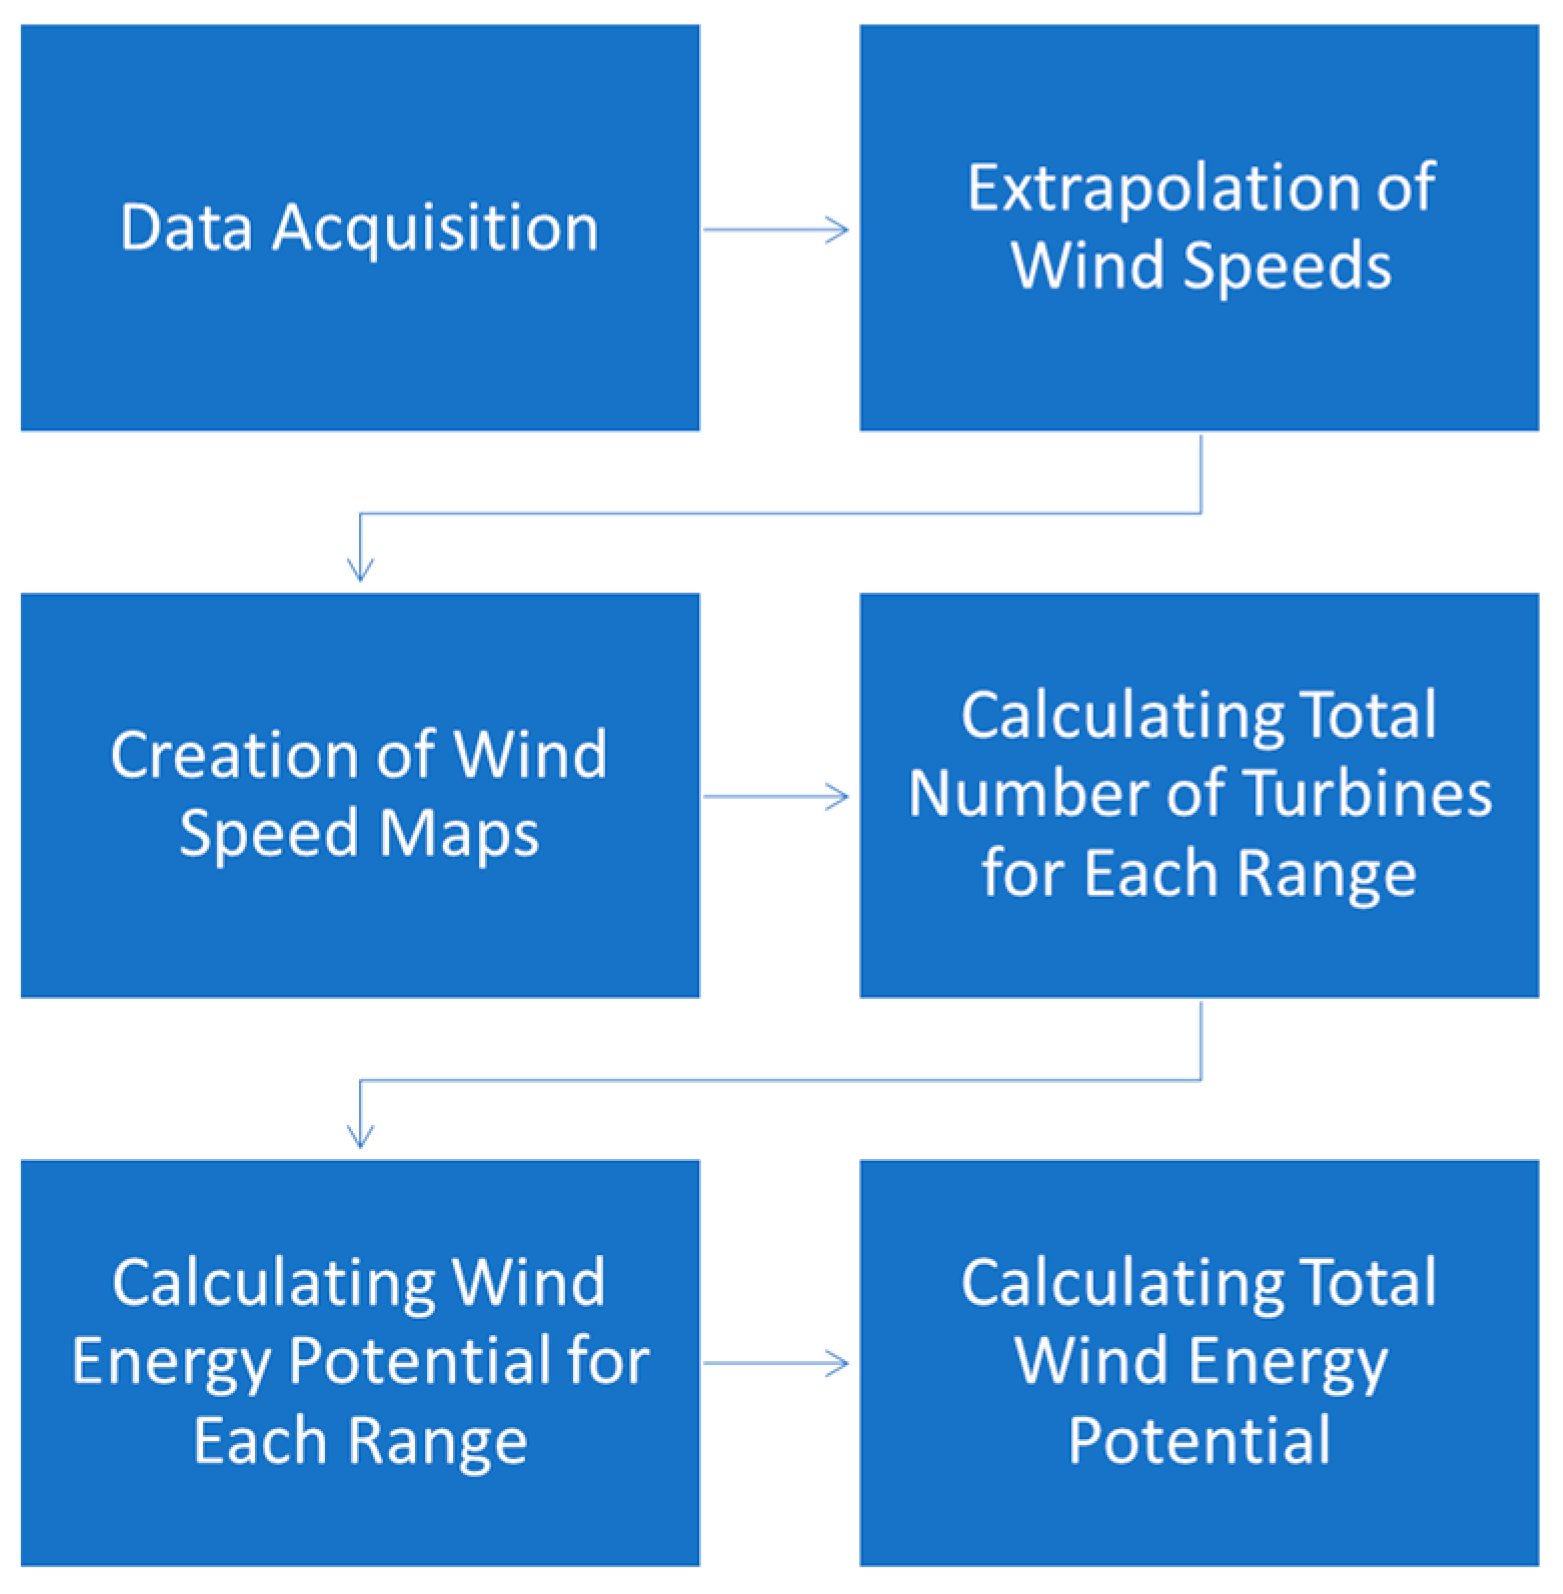
The first step of the study was acquisition of the wind speed data belonging to meteorological stations and land cover data, in order to extrapolate the wind speeds to 100 m. Land cover data were used to determine the friction coefficient according to the roughness of the surface at the station. After the data acquisition, the wind speeds were extrapolated to 100 m by using the Hellmann equation. Following the calculation of the wind speeds of all the stations at a height of 100 m, the wind speed map of the study area was created with five different spatial interpolation methods of GIS tools. Interpolation methods were examined in terms of their accuracy and the most appropriate method was determined. Wind speed maps of the districts were produced by using the extract by mask function of GIS tools. The wind speed maps were converted to point-based shapefile by using the raster to point function of GIS tools to make wind potential calculations using the wind speed values of cells. The wind speeds in the study area were divided into certain ranges to determine the wind energy potential in a related range.
In order to calculate the number of wind turbines that can be installed in a certain area, an equation was produced according to the legal regulation in Turkey. Then, the power generated by one turbine was calculated according to the mean wind speed of each wind speed range. Then, the wind energy potential was calculated for each wind speed range. Finally, the total wind energy potential in the study area was obtained. Database files (.dbf) of the point-based wind speed maps were used to calculate the wind potential values. Calculations were made by using the Microsoft excel program. Details of the methodology are given below. Figure 3 shows the methodological framework of the study. Descriptions and sources of the data are shown in Table 3.
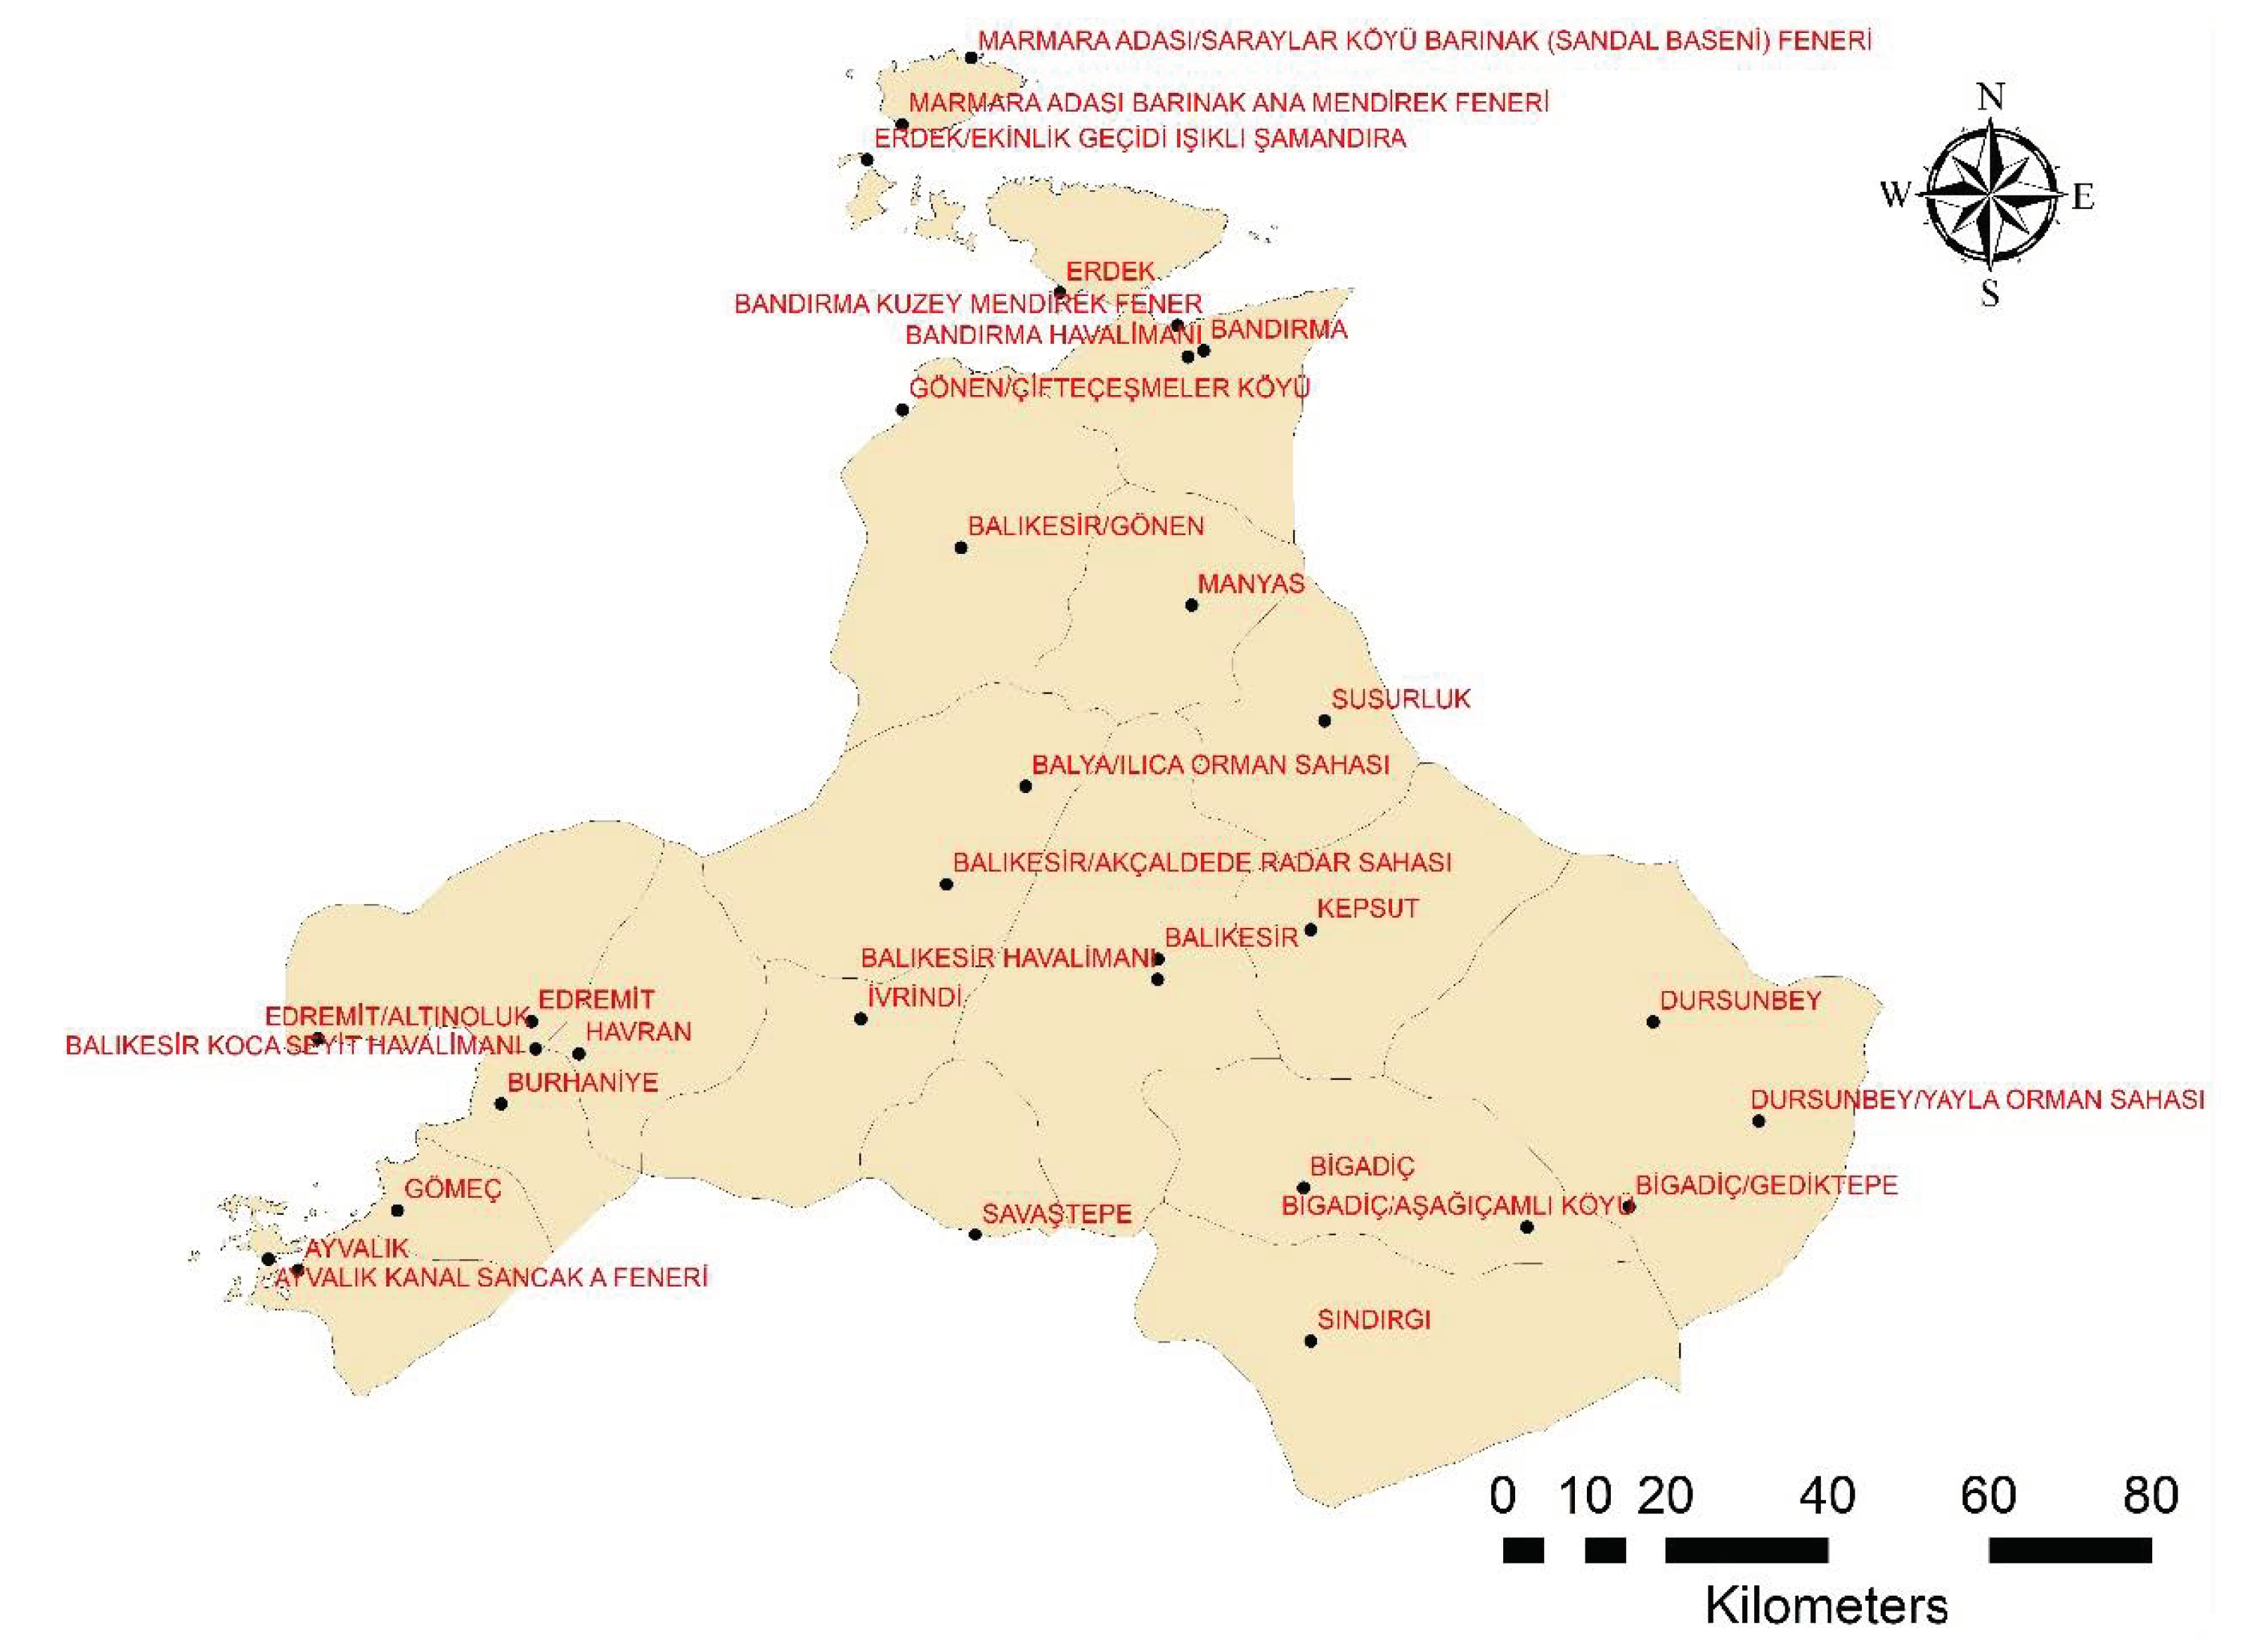
Within the scope of the study, 5.5 years of average daily wind speed data from 32 meteorology stations in the Balıkesir Province between 1 January 2014 and 30 June 2019 were obtained from the Turkish State Meteorological Service (TSMS). The geographical distribution of the TSMS stations used in the study is shown in Figure 4. The wind speed measurements at these TSMS stations are carried out on poles with a height of 10 m. Therefore, it is more meaningful to determine wind speeds according to a turbine hub height suitable for today’s technology, in order to produce supportive information about possible wind power plant locations.
In this regard, the Hellmann equation shown in Equation (1) was used to obtain the wind speeds at a 100 m height from the measured wind speed values at a 10 m height. In this approach, calculations are made depending on the surface roughness of the region where the TSMS stations are located and the height at which the speed is required [46].
In Equation (1), is the wind speed value for the TSMS station at a 10 m height, H is the height at which the wind speed is desired, α is the friction coefficient determined according to the roughness of the surface at the station where the wind is measured, and V is the wind speed value at the height desired. was taken as 10 m, at which the TSMS wind speeds were measured. Table 4 shows the land use characteristics and friction coefficients used in the study [47].
A CORINE land cover map was obtained from the Copernicus Services inventory to obtain the friction coefficients for the locations of the TSMS stations [44]. The land cover class for the locations of the stations was matched with the appropriate class among the roughness classes used in the wind speed calculations, and the speed values of that station at a height of 100 m were calculated with the help of Equation (1). The reason for choosing a height of 100 m here is that the height of the turbine hubs in currently installed wind power plants is close to this value. In this way, the total installed wind power capacity and the calculated wind power potential can be compared more meaningfully.
After calculating the wind speeds at a 100 m height, interpolation between 32 TSMS stations was carried out with the inverse distance weighting (IDW) method to create a wind speed map of the Balıkesir Province using the ArcMap software. The IDW interpolation method is based on the principle that the weights decrease as the area being interpolated gets further from the known sample points. ArcMap is a GIS software that has the capability to collect, store, analyze, and present geo-spatial, attribute, and metadata. According to Yildiz [48], the IDW method was determined as the most appropriate interpolation method compared to the kriging, natural neighbor, spline, and trend methods. The measured wind speed values of the TSMS stations were compared with the values obtained using the interpolation methods. Root mean square error (RMSE) values obtained from the comparison of the measured wind speed values and the values obtained using the interpolation method were calculated for each interpolation method. The RMSE value of the IDW method was calculated as 0.008 m/s, which was the minimum RMSE value between these five methods. When the RMSE values of the other interpolation methods were examined, the order from the lowest to highest RMSE values appeared as the natural neighbor, spline, kriging, and trend methods [48].
The wind speed map of the Balıkesir Province at a height of 100 m was produced with 200 × 200 m cells using the IDW method under the raster interpolation tool in the ArcMap software, which is a GIS software (Figure 5). In addition, the extract by mask function of GIS tools was performed to produce wind speed maps of the districts in the Balıkesir Province. All of the produced wind speed maps are in raster data format.
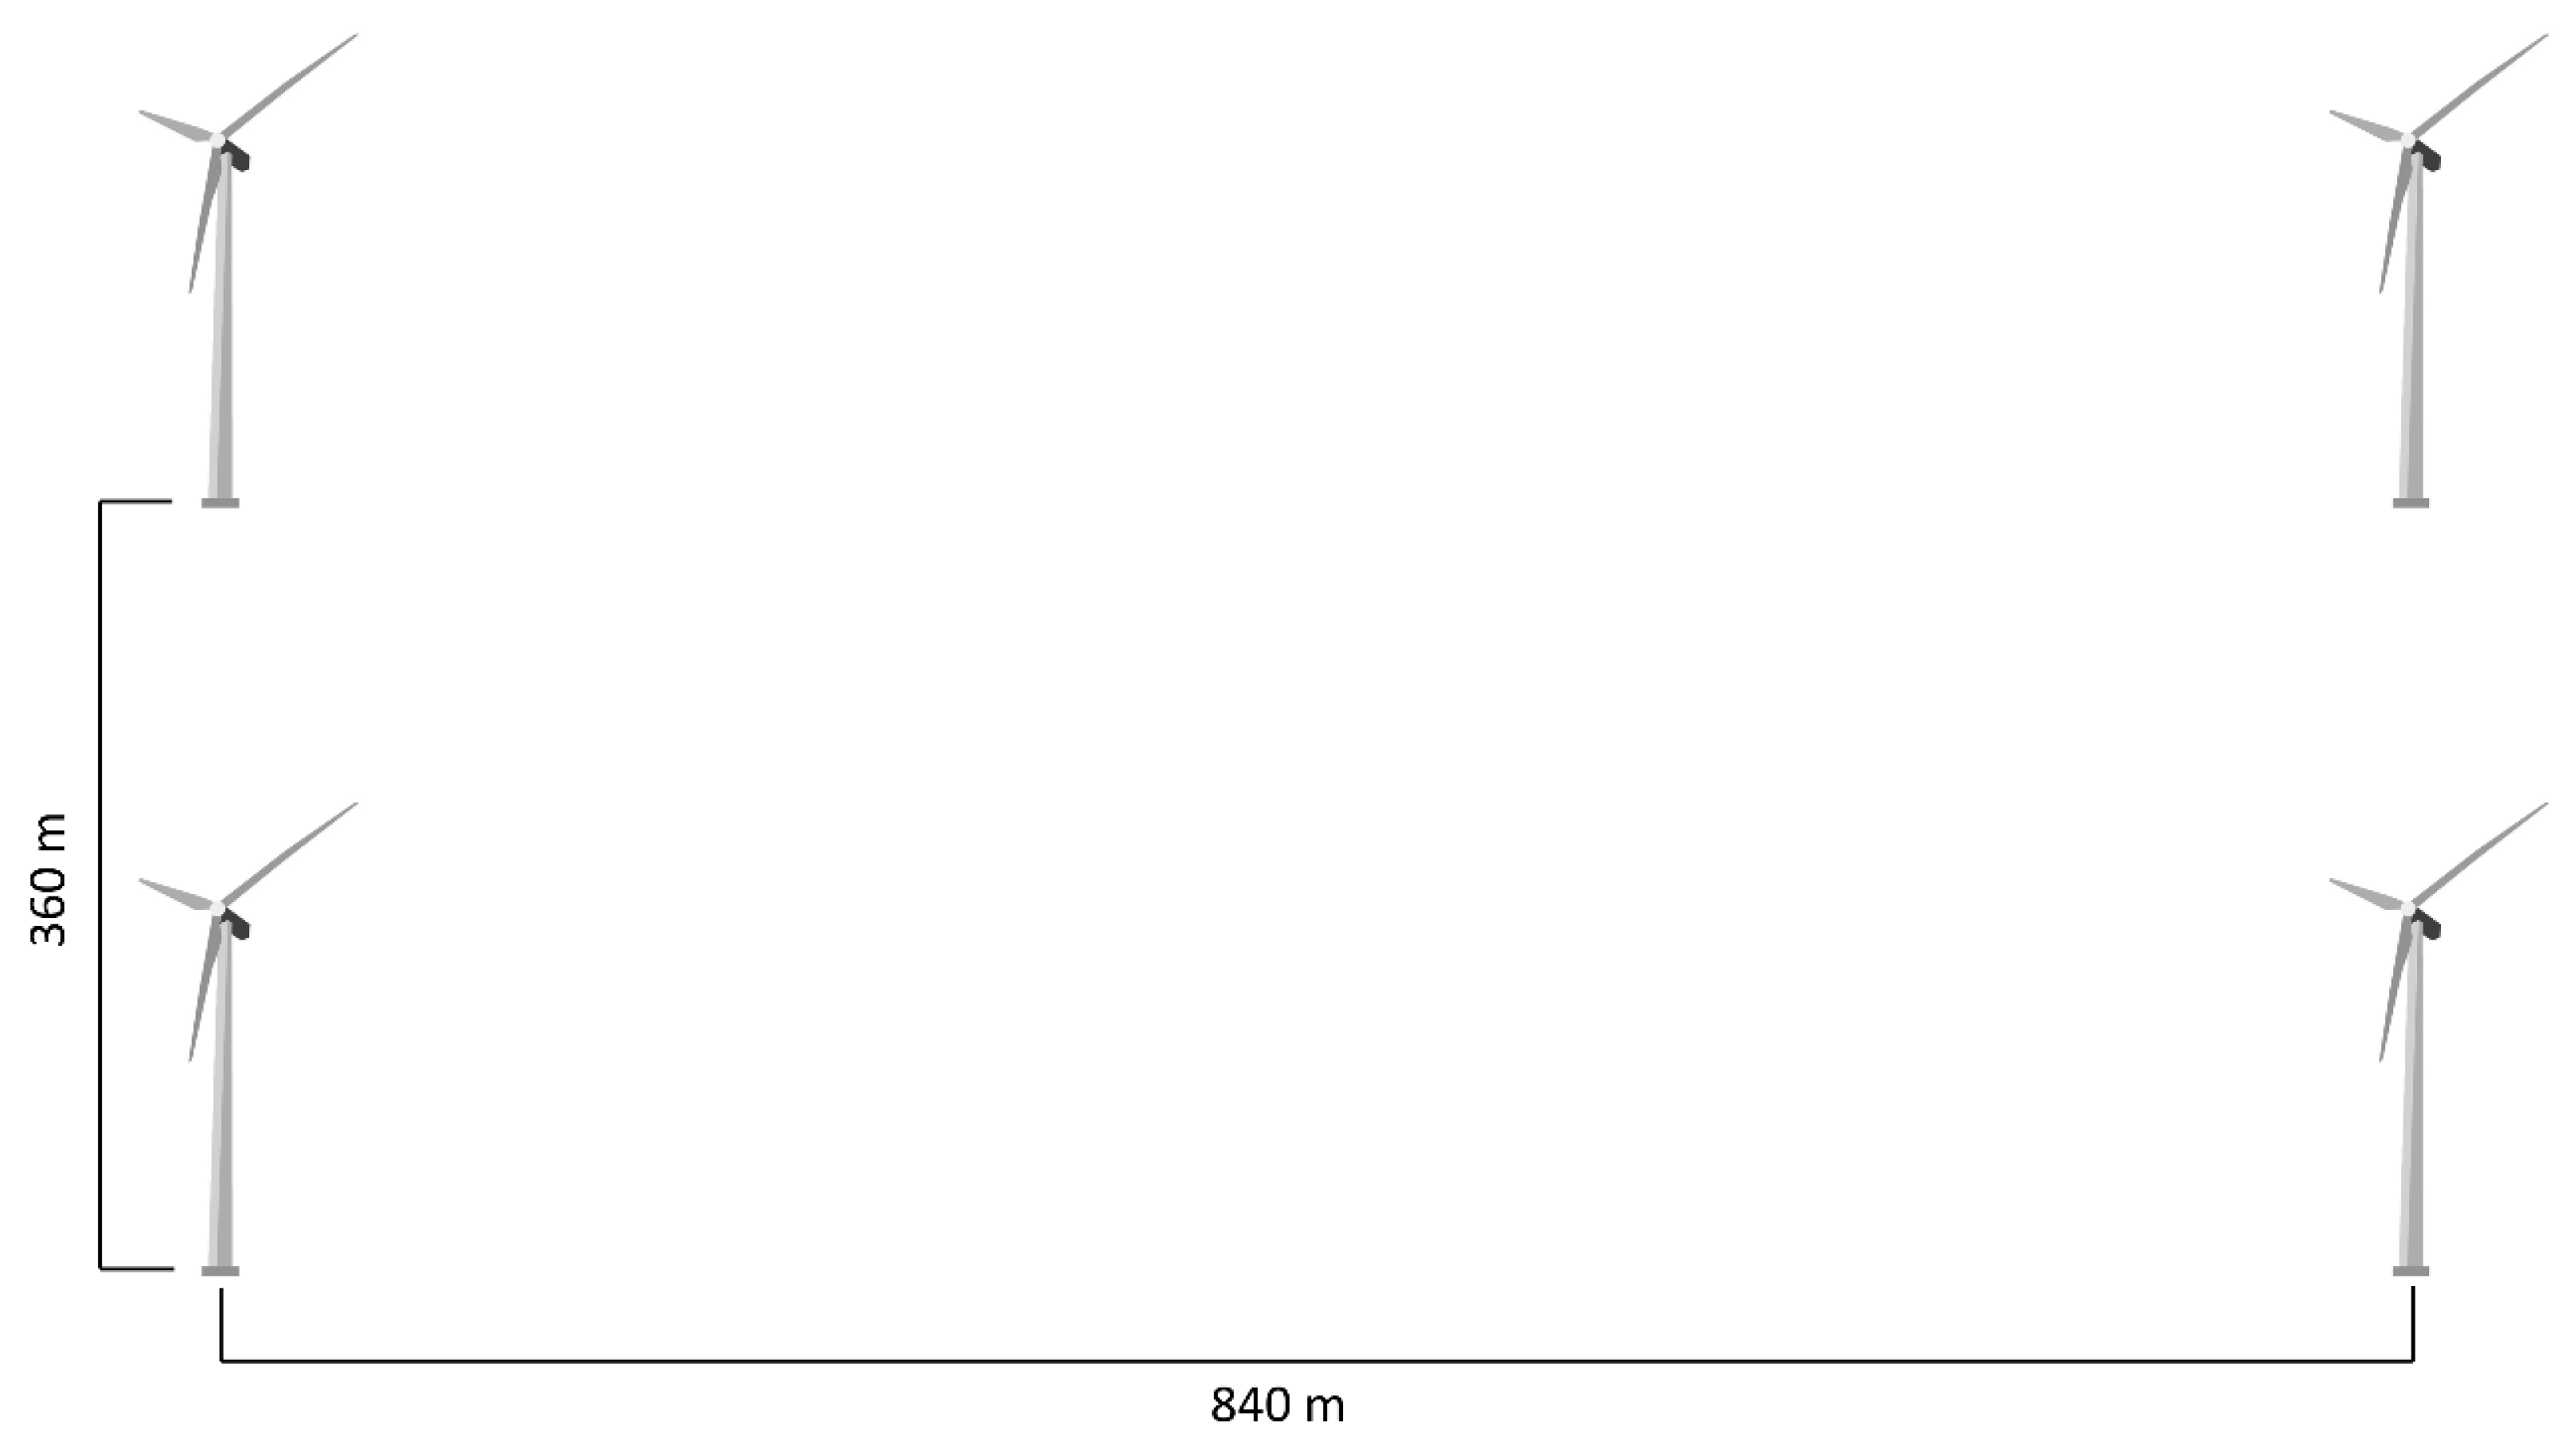
The number of wind turbines that can be installed in a certain area was determined to calculate the wind energy potential at a height of 100 m. In this process, an equation was produced that gives the number of turbines that can be installed in a certain area, taking into account two rows side by side and a layout plan along the route, depending on the rules of the Regulation on the Technical Evaluation of Wind Source Based Electricity Generation Applications in Turkey [49]. In this calculation, the turbine rotor diameter was taken as 120 m. The distance between the turbines was considered to be 840 m, which is seven times the rotor diameter along the route, and 360 m, which is three times the rotor diameter for the second row perpendicular to the route (Figure 6). Equation (2) refers to the number of turbines that can be placed in a certain area. In order to calculate the number of turbines, the amount of the total area where the wind turbines will be installed is needed. The total number of turbines that can be installed in a certain area is calculated by multiplying the total area with the constant value of 6.6138 produced according to the layout plan created in accordance with the national regulation and adding 2 to it.
In order to determine the wind energy potential in a certain area, it is necessary to calculate the power that each turbine can produce, as well as the number of turbines. Equation (3) was used for this calculation.
In Equation (3), P is the power (Watt) generated by the turbine, is the air density (equal to 1.225 kg/m3), is the mean wind speed for each range (m/s), is the power coefficient (equal to 0.40 in general), and is the area swept by the turbine blades (m2).
In order to obtain the wind speed value of each cell to be used in the wind potential calculation, a conversion operation was carried out on the wind speed maps using the raster to point tool of the ArcMap software.
In order to determine the area-based wind energy potential, the wind speed values should be divided into certain ranges. The total area of the cells in each range was calculated by multiplying the number of cells in the specified range with the area of each cell. The wind power potential for each range was calculated by multiplying the number of wind turbines that can be installed in the total area for each range and the power generated by each wind turbine.
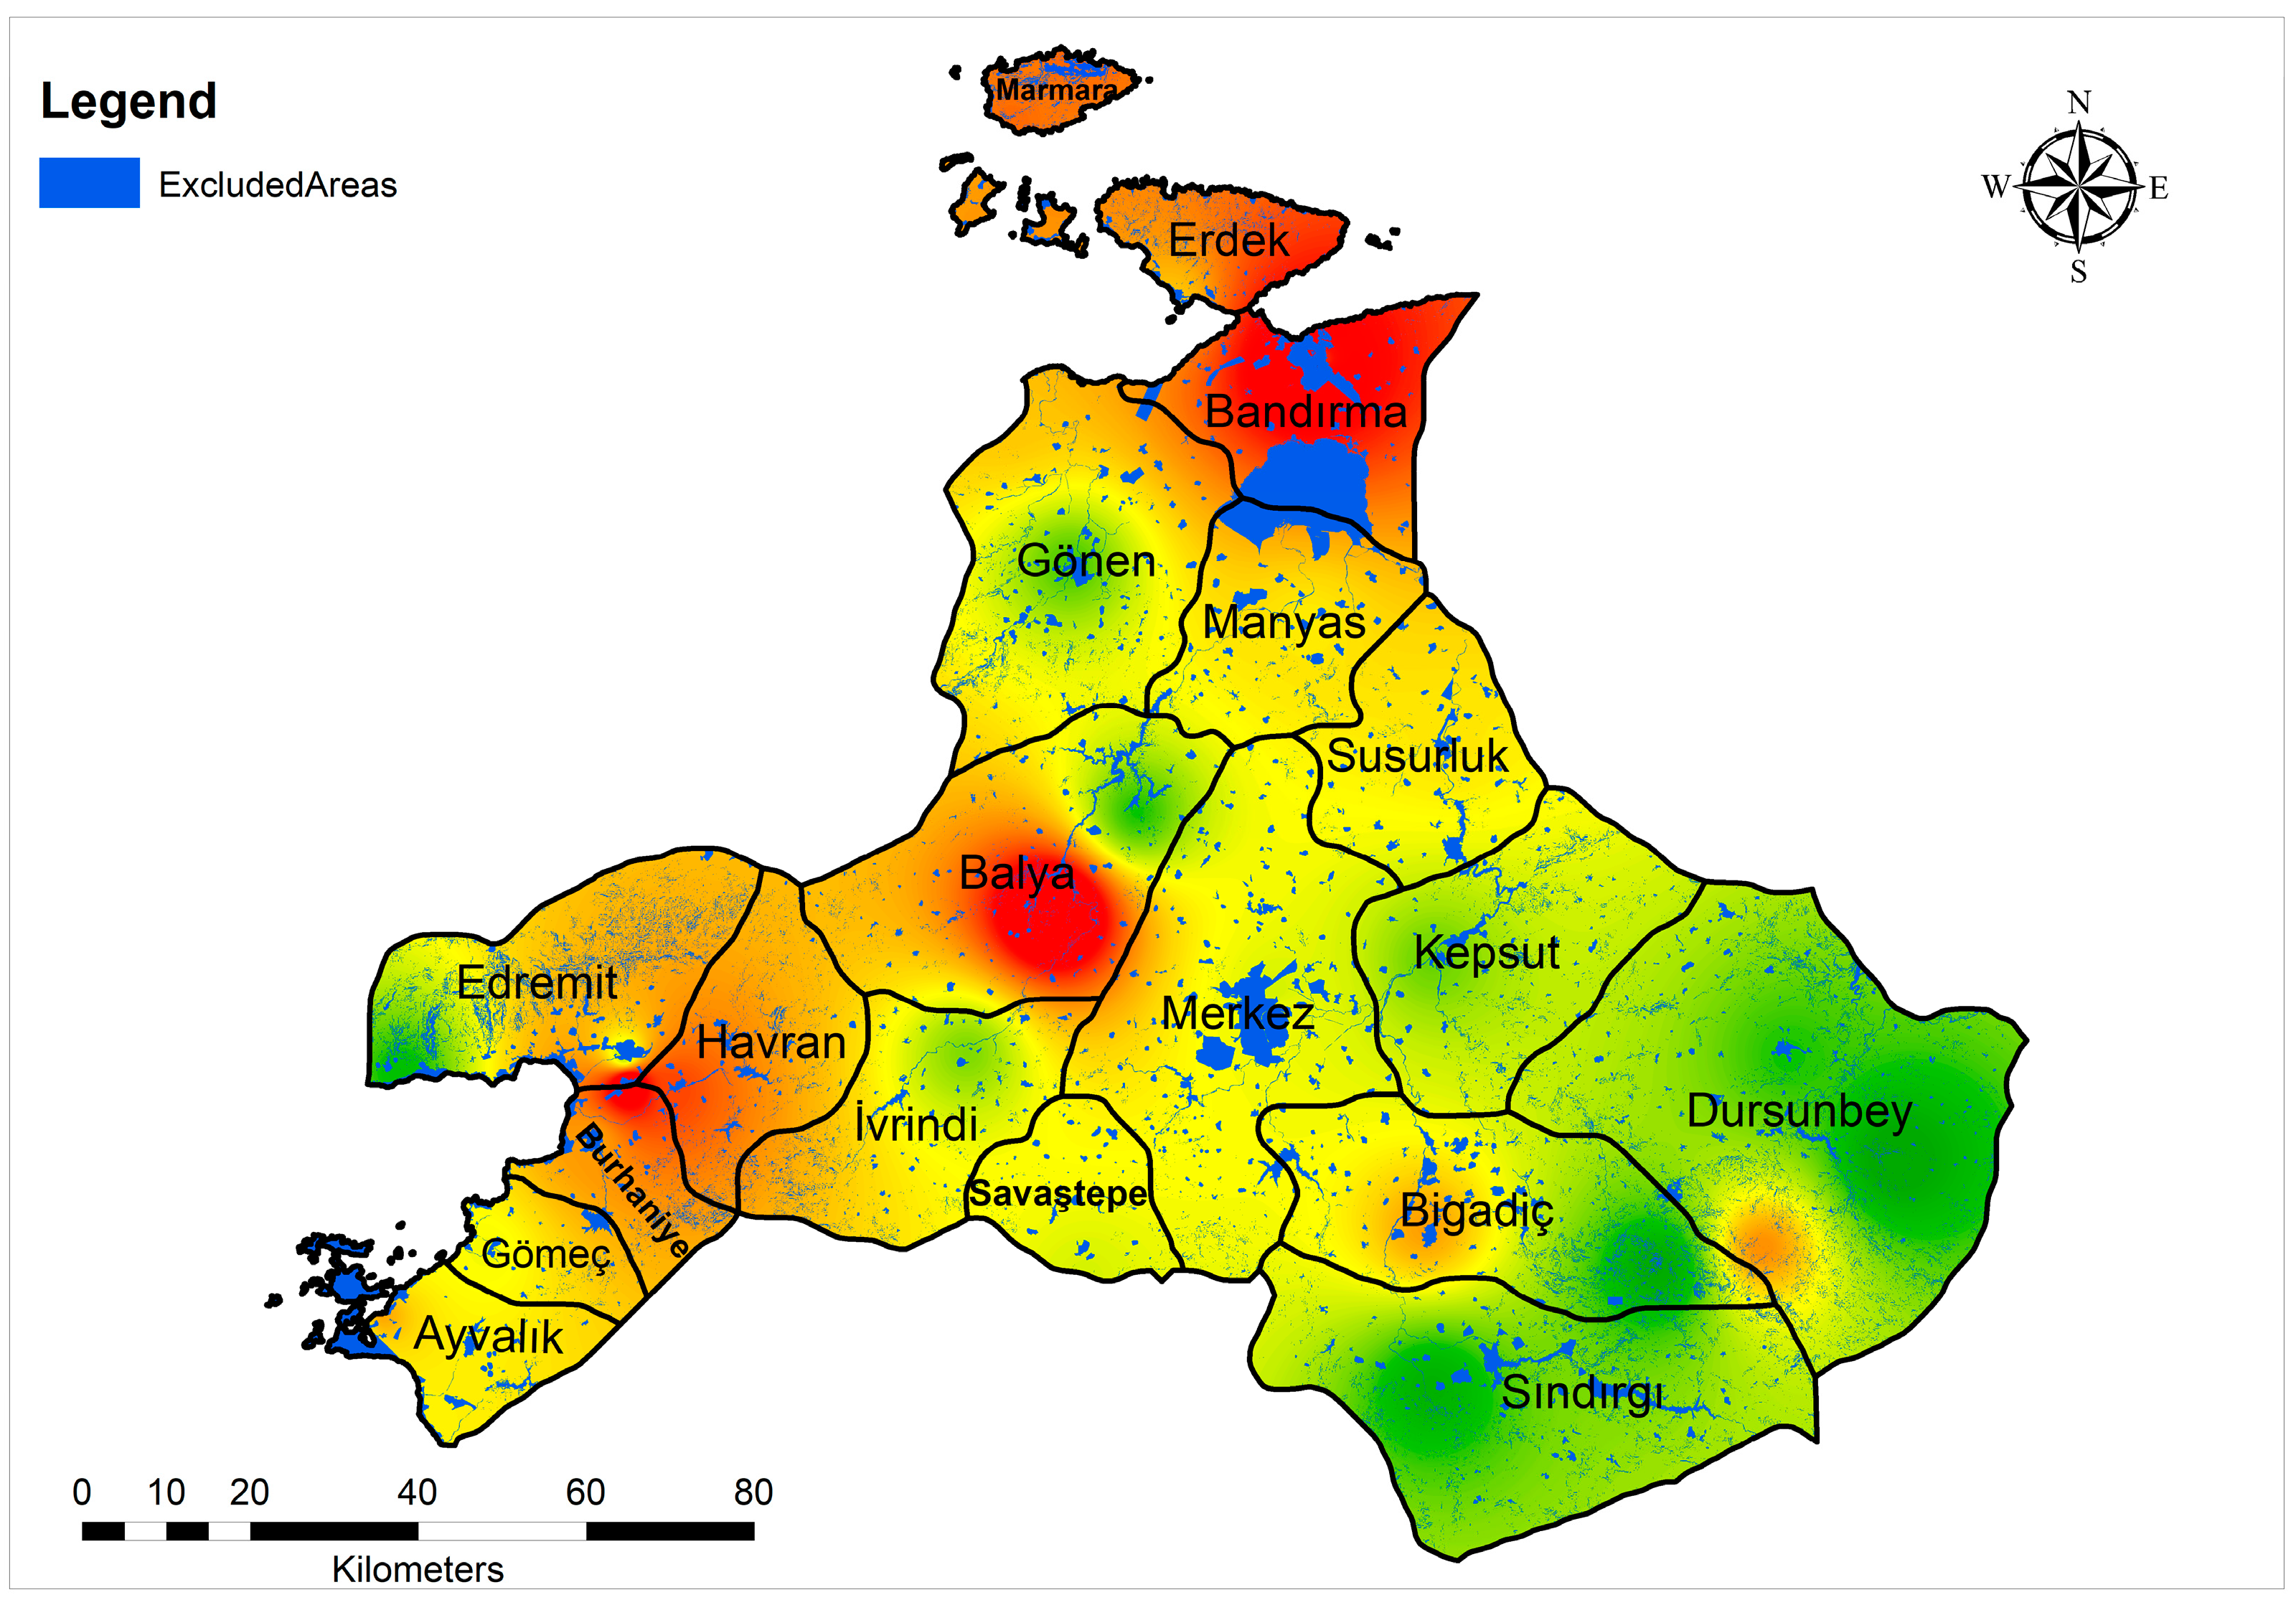
Spatial data obtained from the Republic of Turkey, Ministry of Environment and Urbanization, General Directorate of Spatial Planning were used to determine the exclusion areas. These areas are defined by the Republic of Turkey Energy Market Regulatory Authority (EPDK) as unsuitable areas for wind energy production in REPA due to legal and physical restrictions [43]. Residential areas, tourism areas, airports, areas of nature reserves, military areas, mining areas, organized industrial regions, logistics centers, small industrial areas, organized agriculture and livestock regions, work areas such as industry and storage areas, water surfaces, and areas where the slope is more than 30% were excluded from the study. A digital elevation model (ASTGTM v003) was obtained from the United States Geological Survey (USGS) Earth Explorer site in raster format [45]. A slope map was created from the digital elevation model by using the slope function of the ArcMap software. The excluded areas are shown in Figure 7. Since the reference ellipsoid of the TSMS station locations is the World Geodetic System 1984 (WGS 84), the WGS 84 ellipsoid was used as the reference ellipsoid in the study. Accordingly, all the geographical data obtained from institutions, such as landscaping plans, the digital elevation model, and administrative boundaries, were converted to the WGS 84 ellipsoid.
4. Results
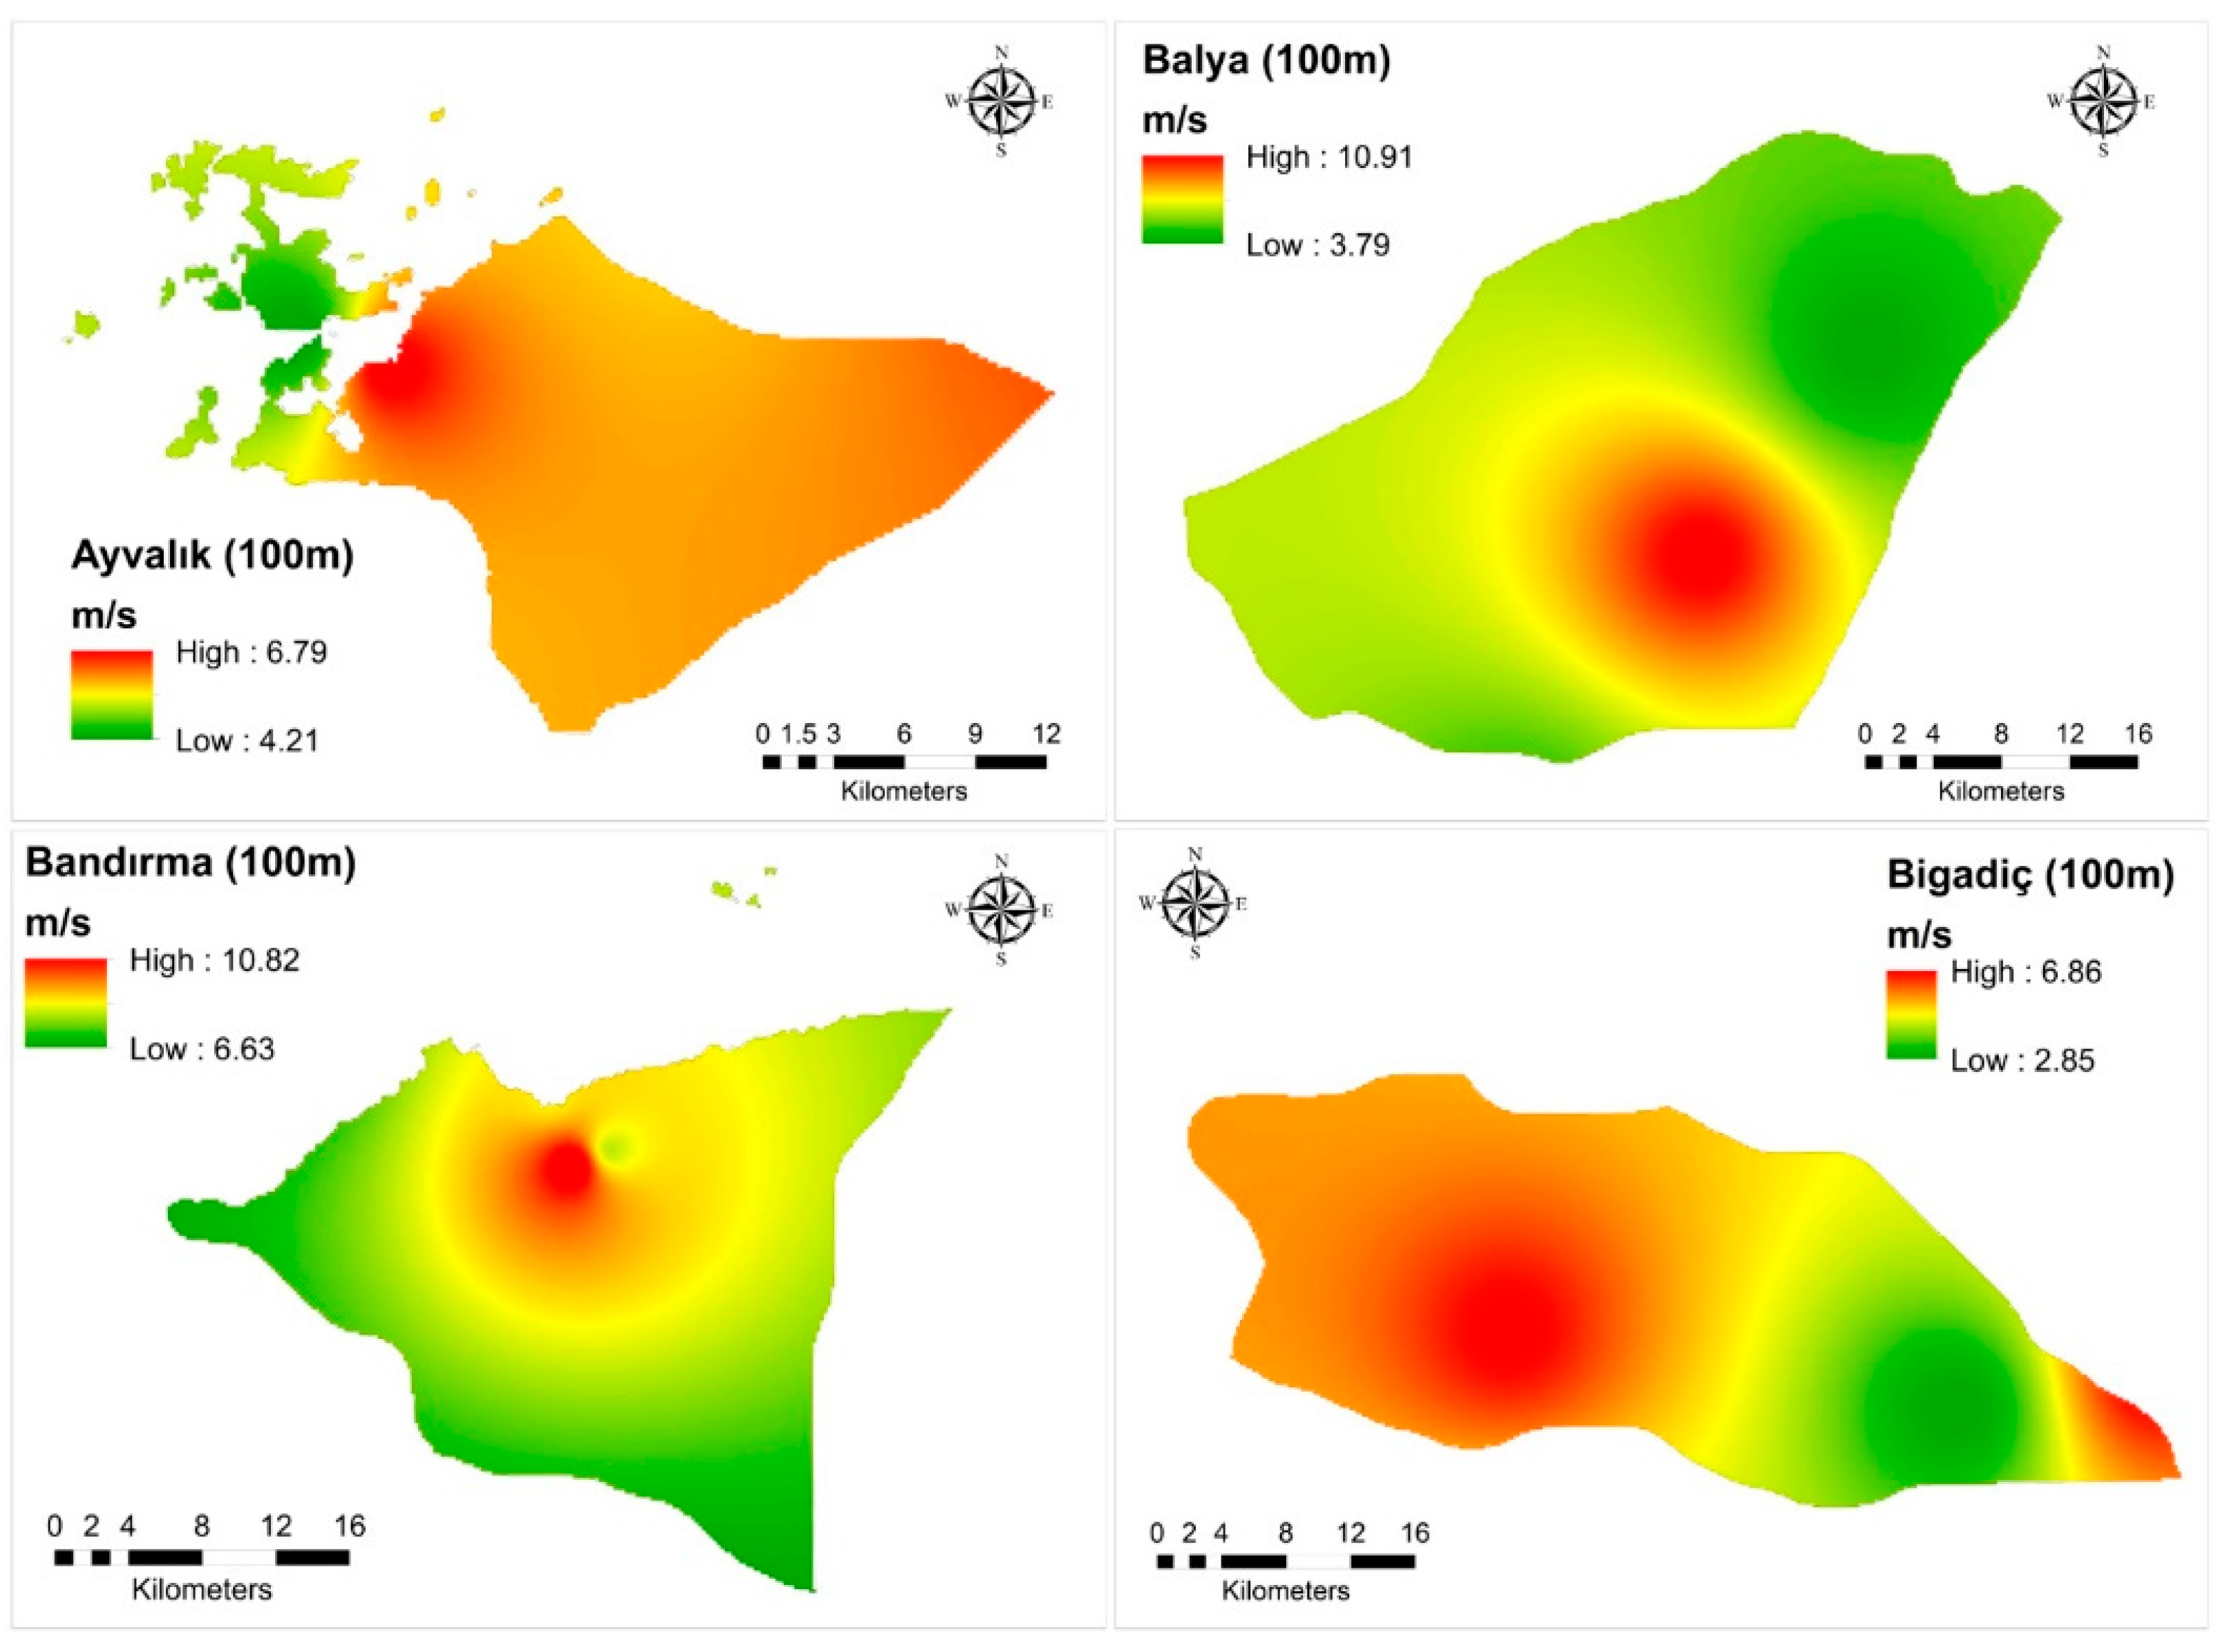
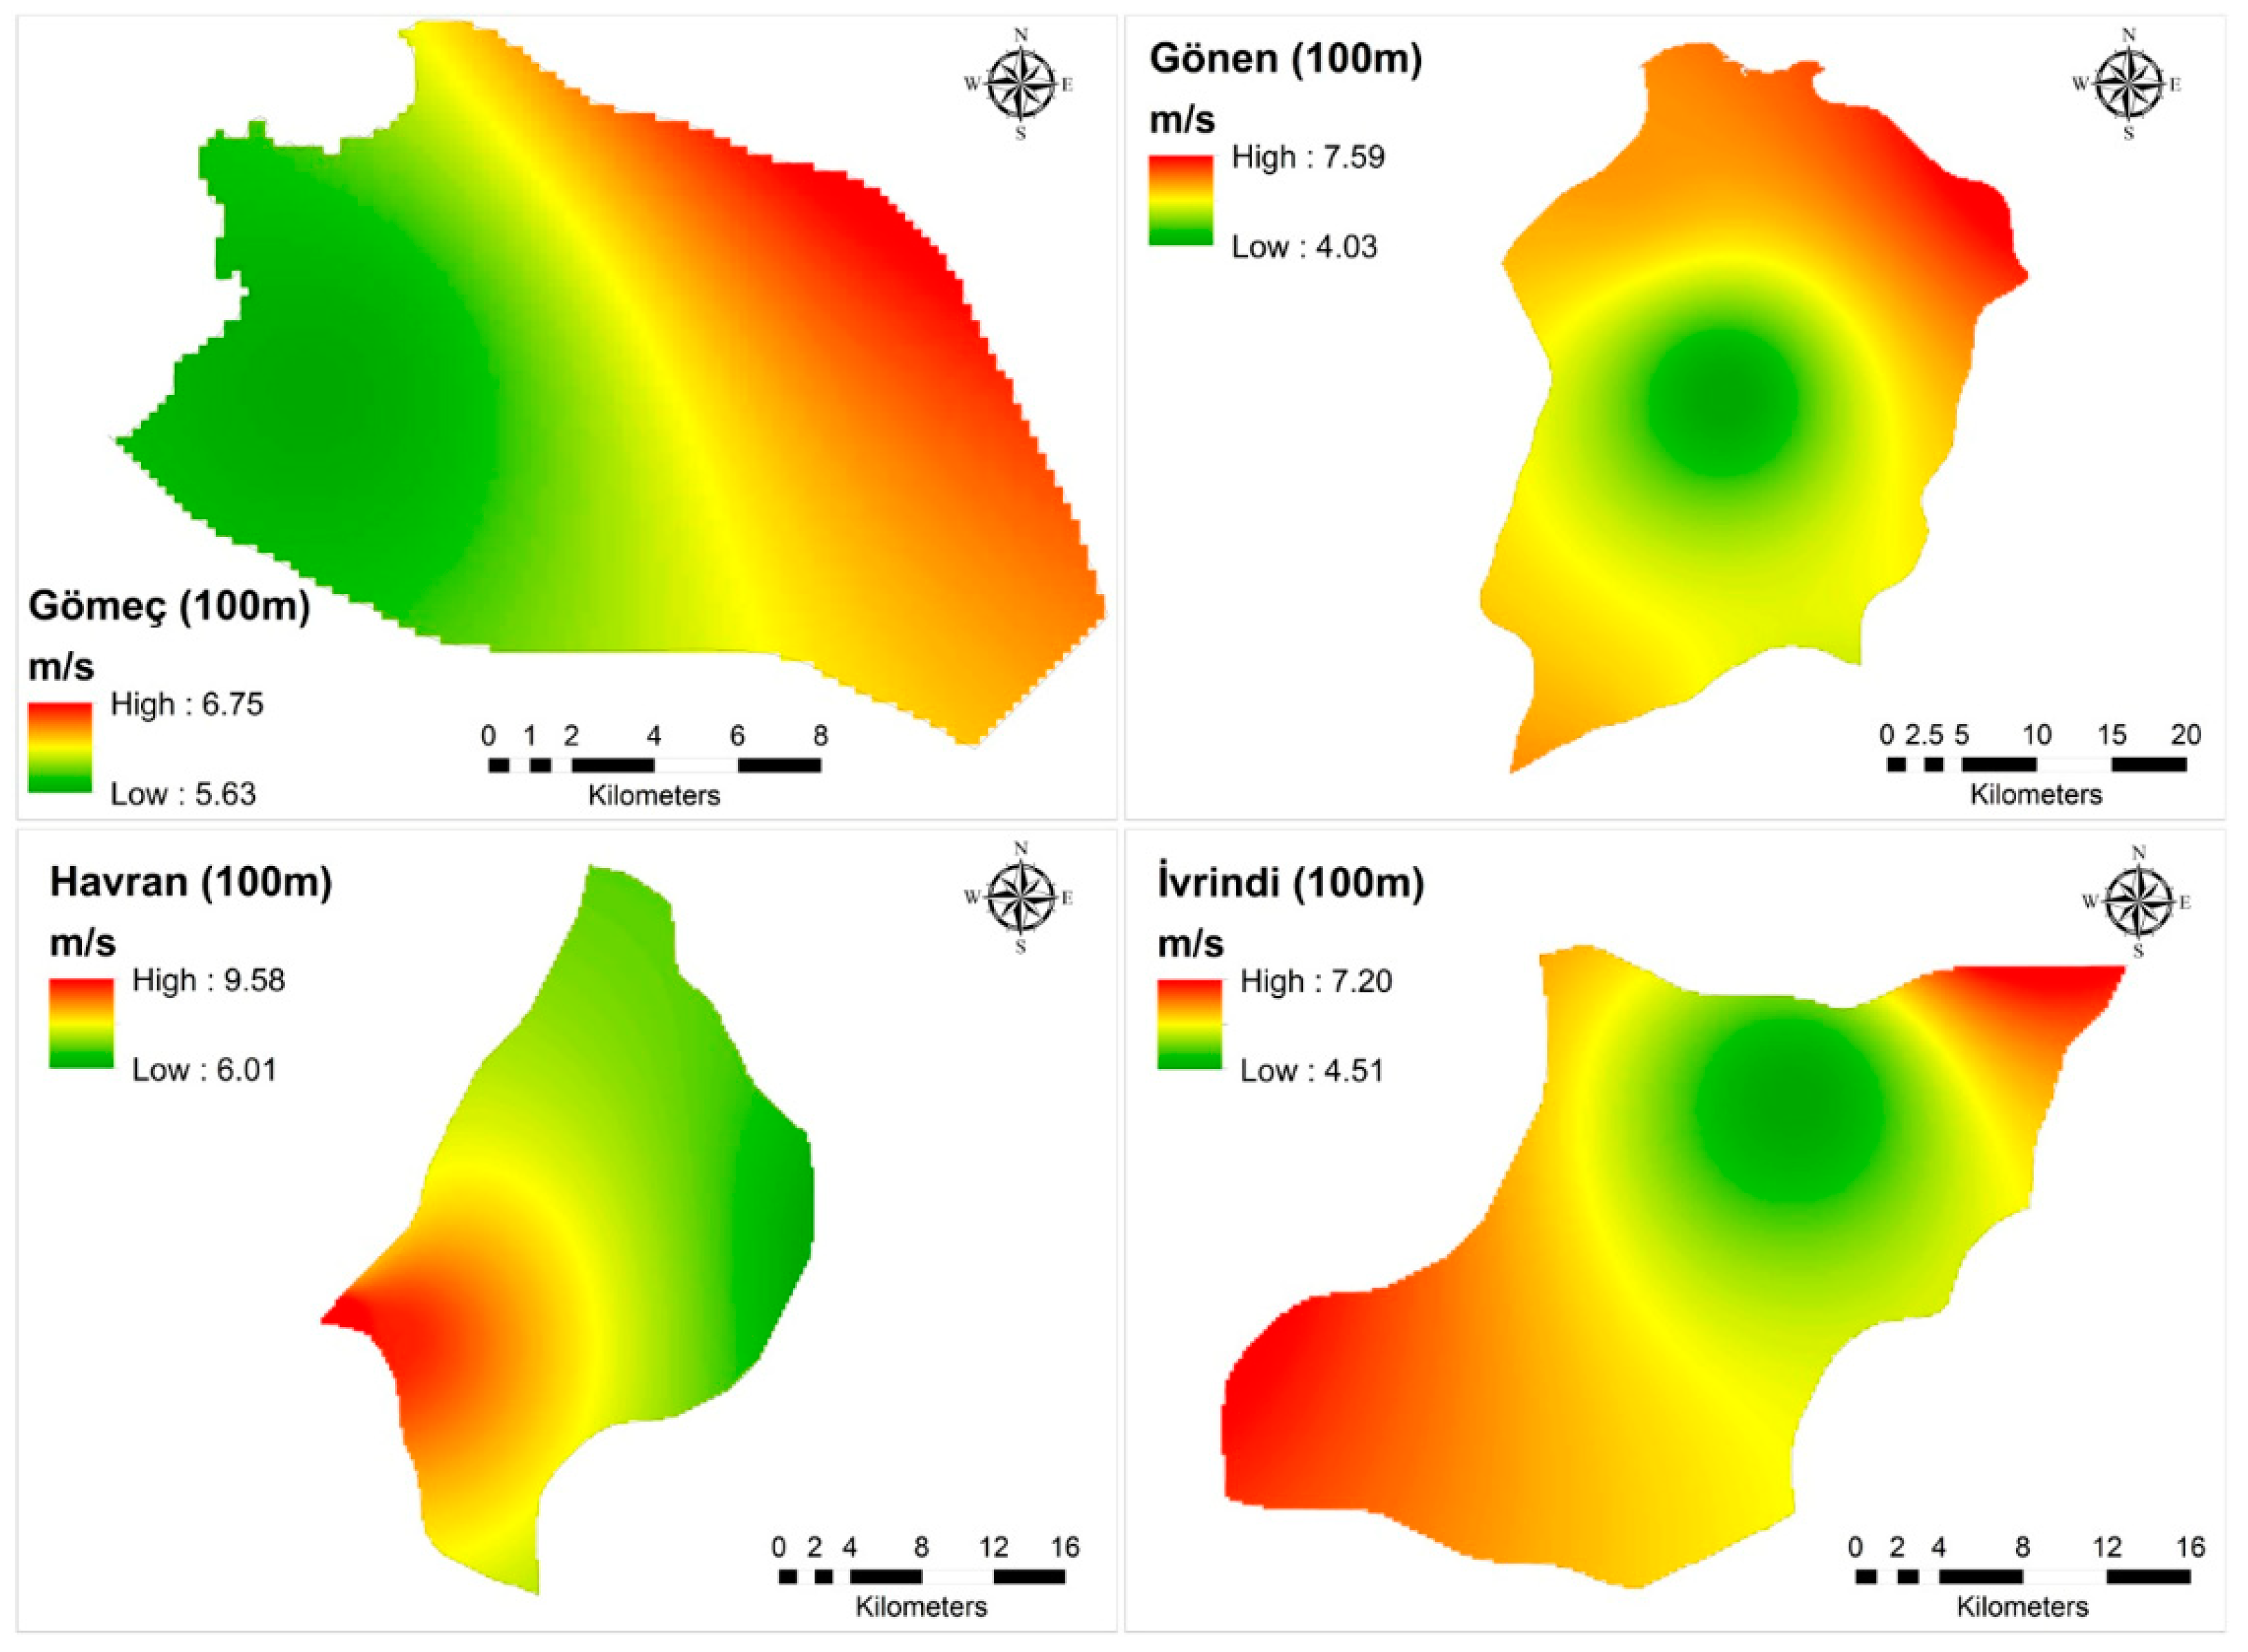
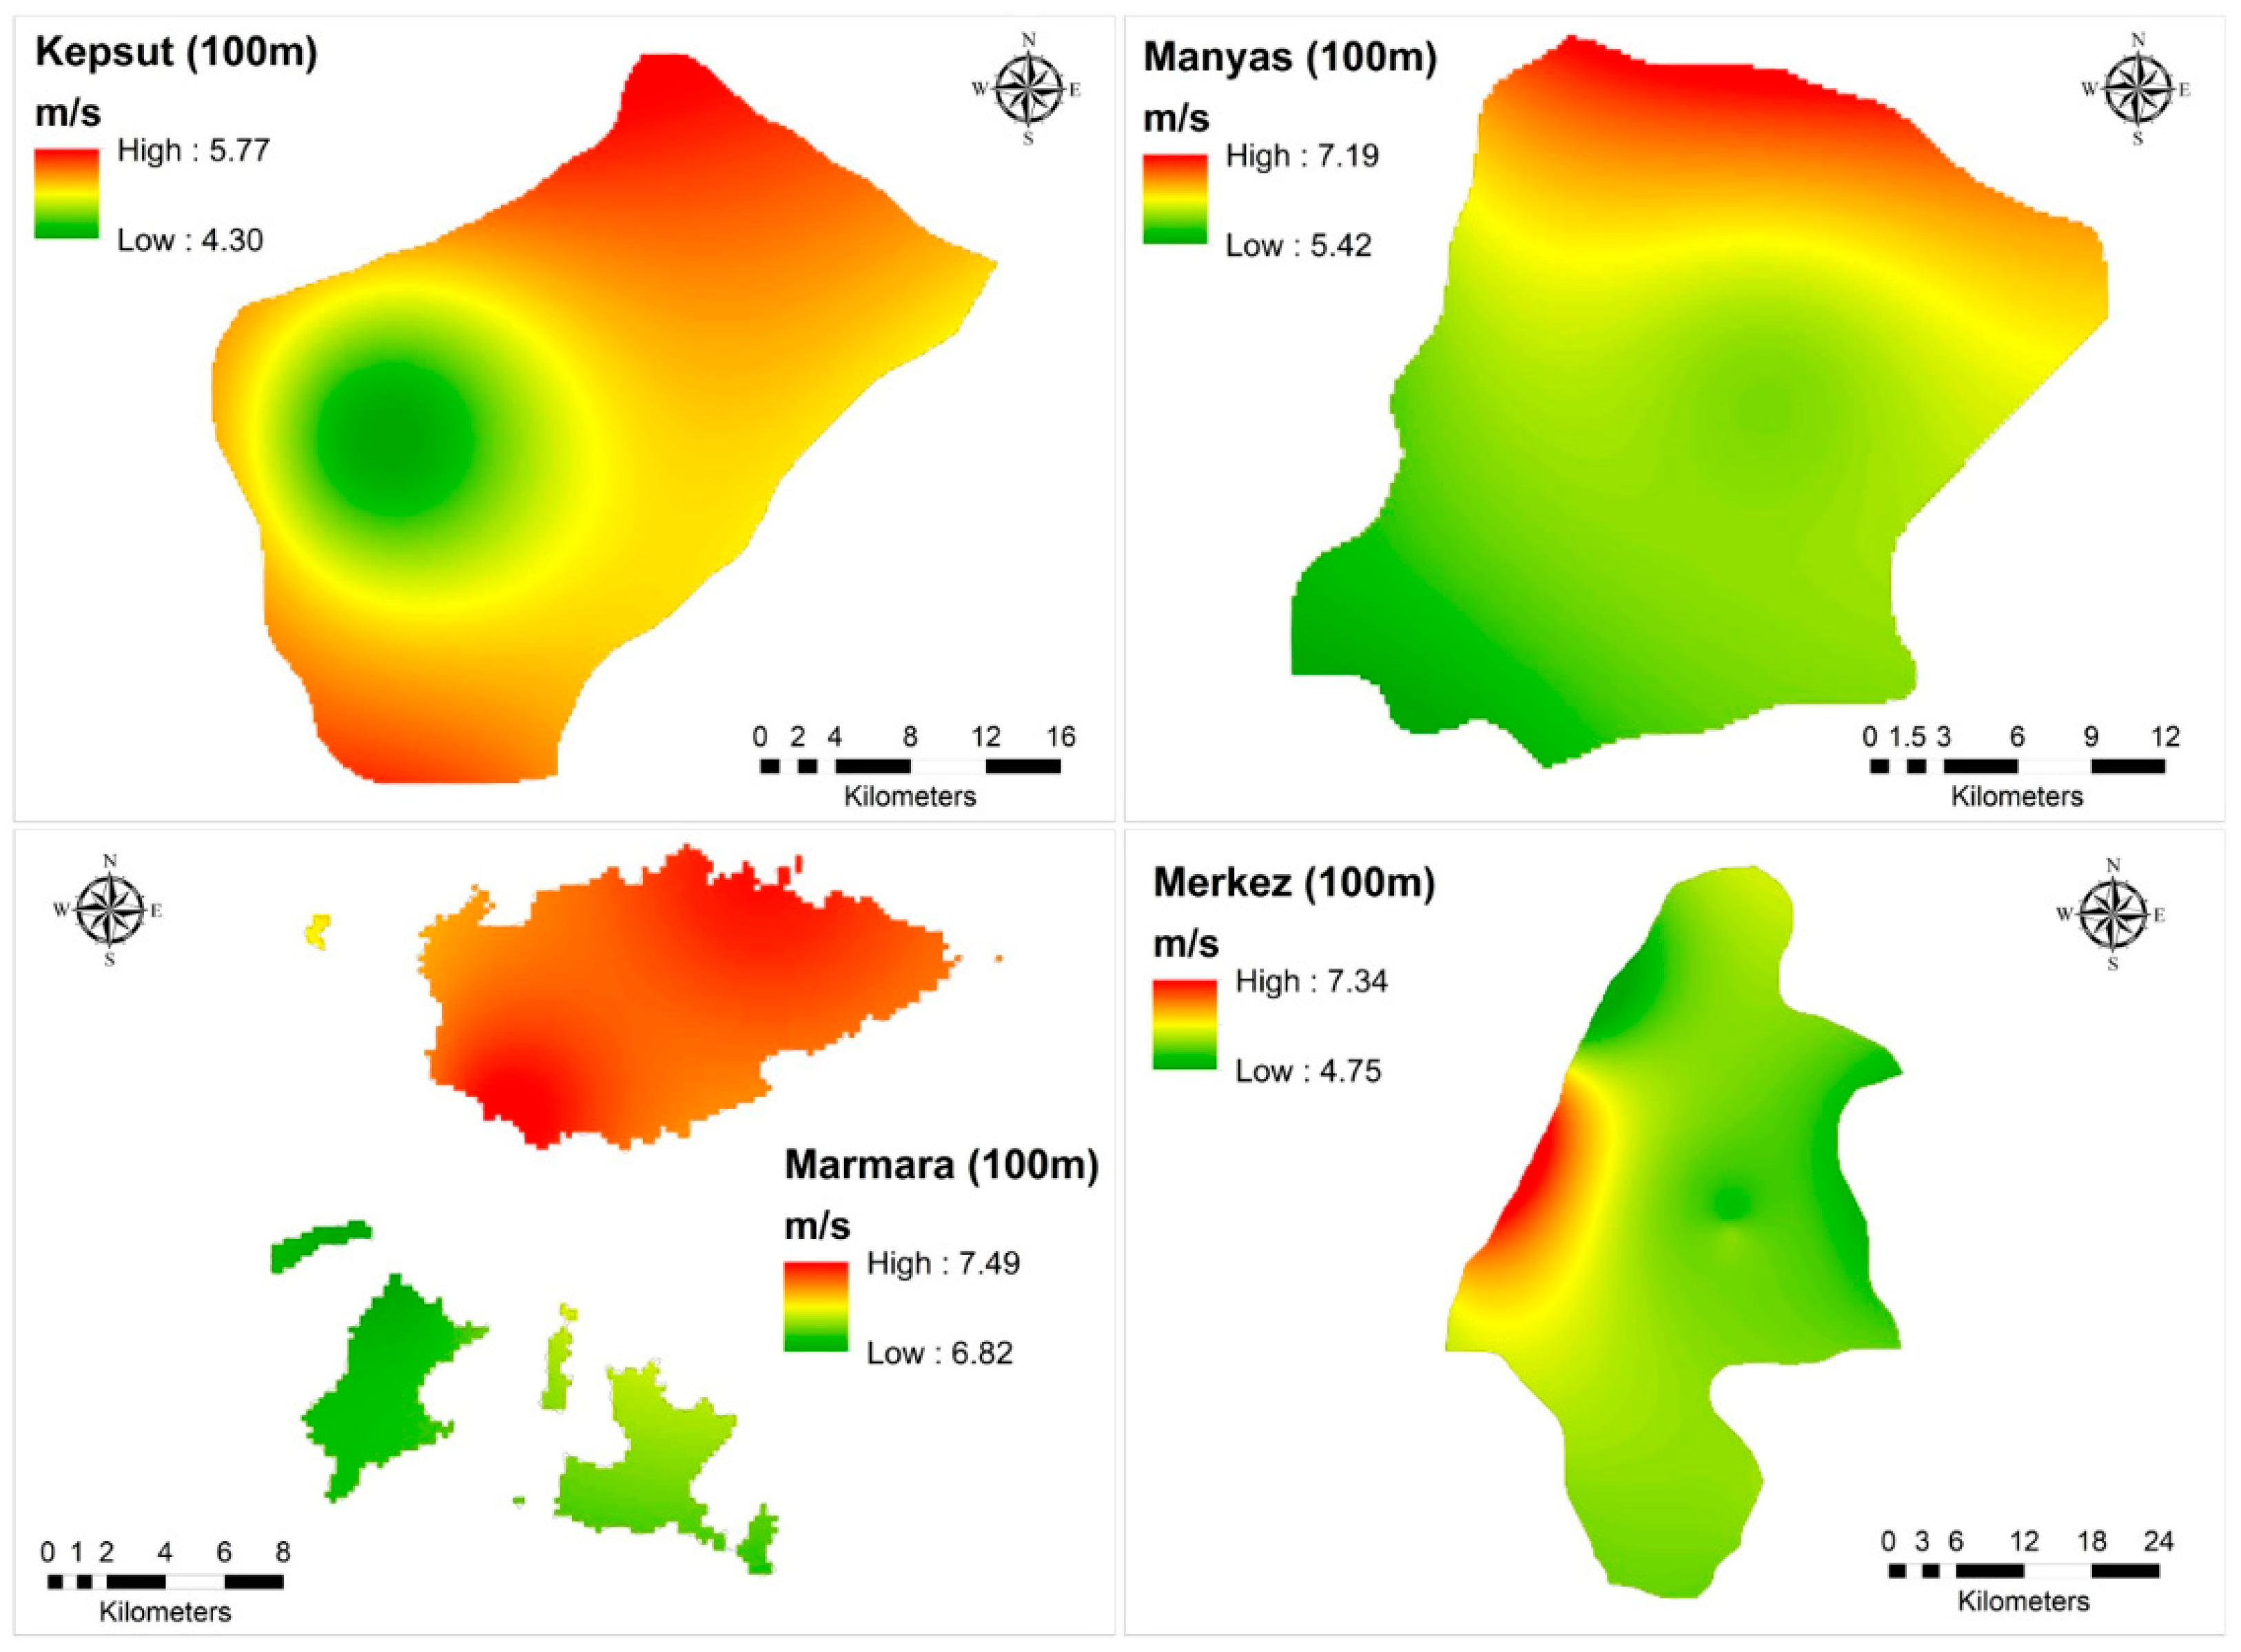
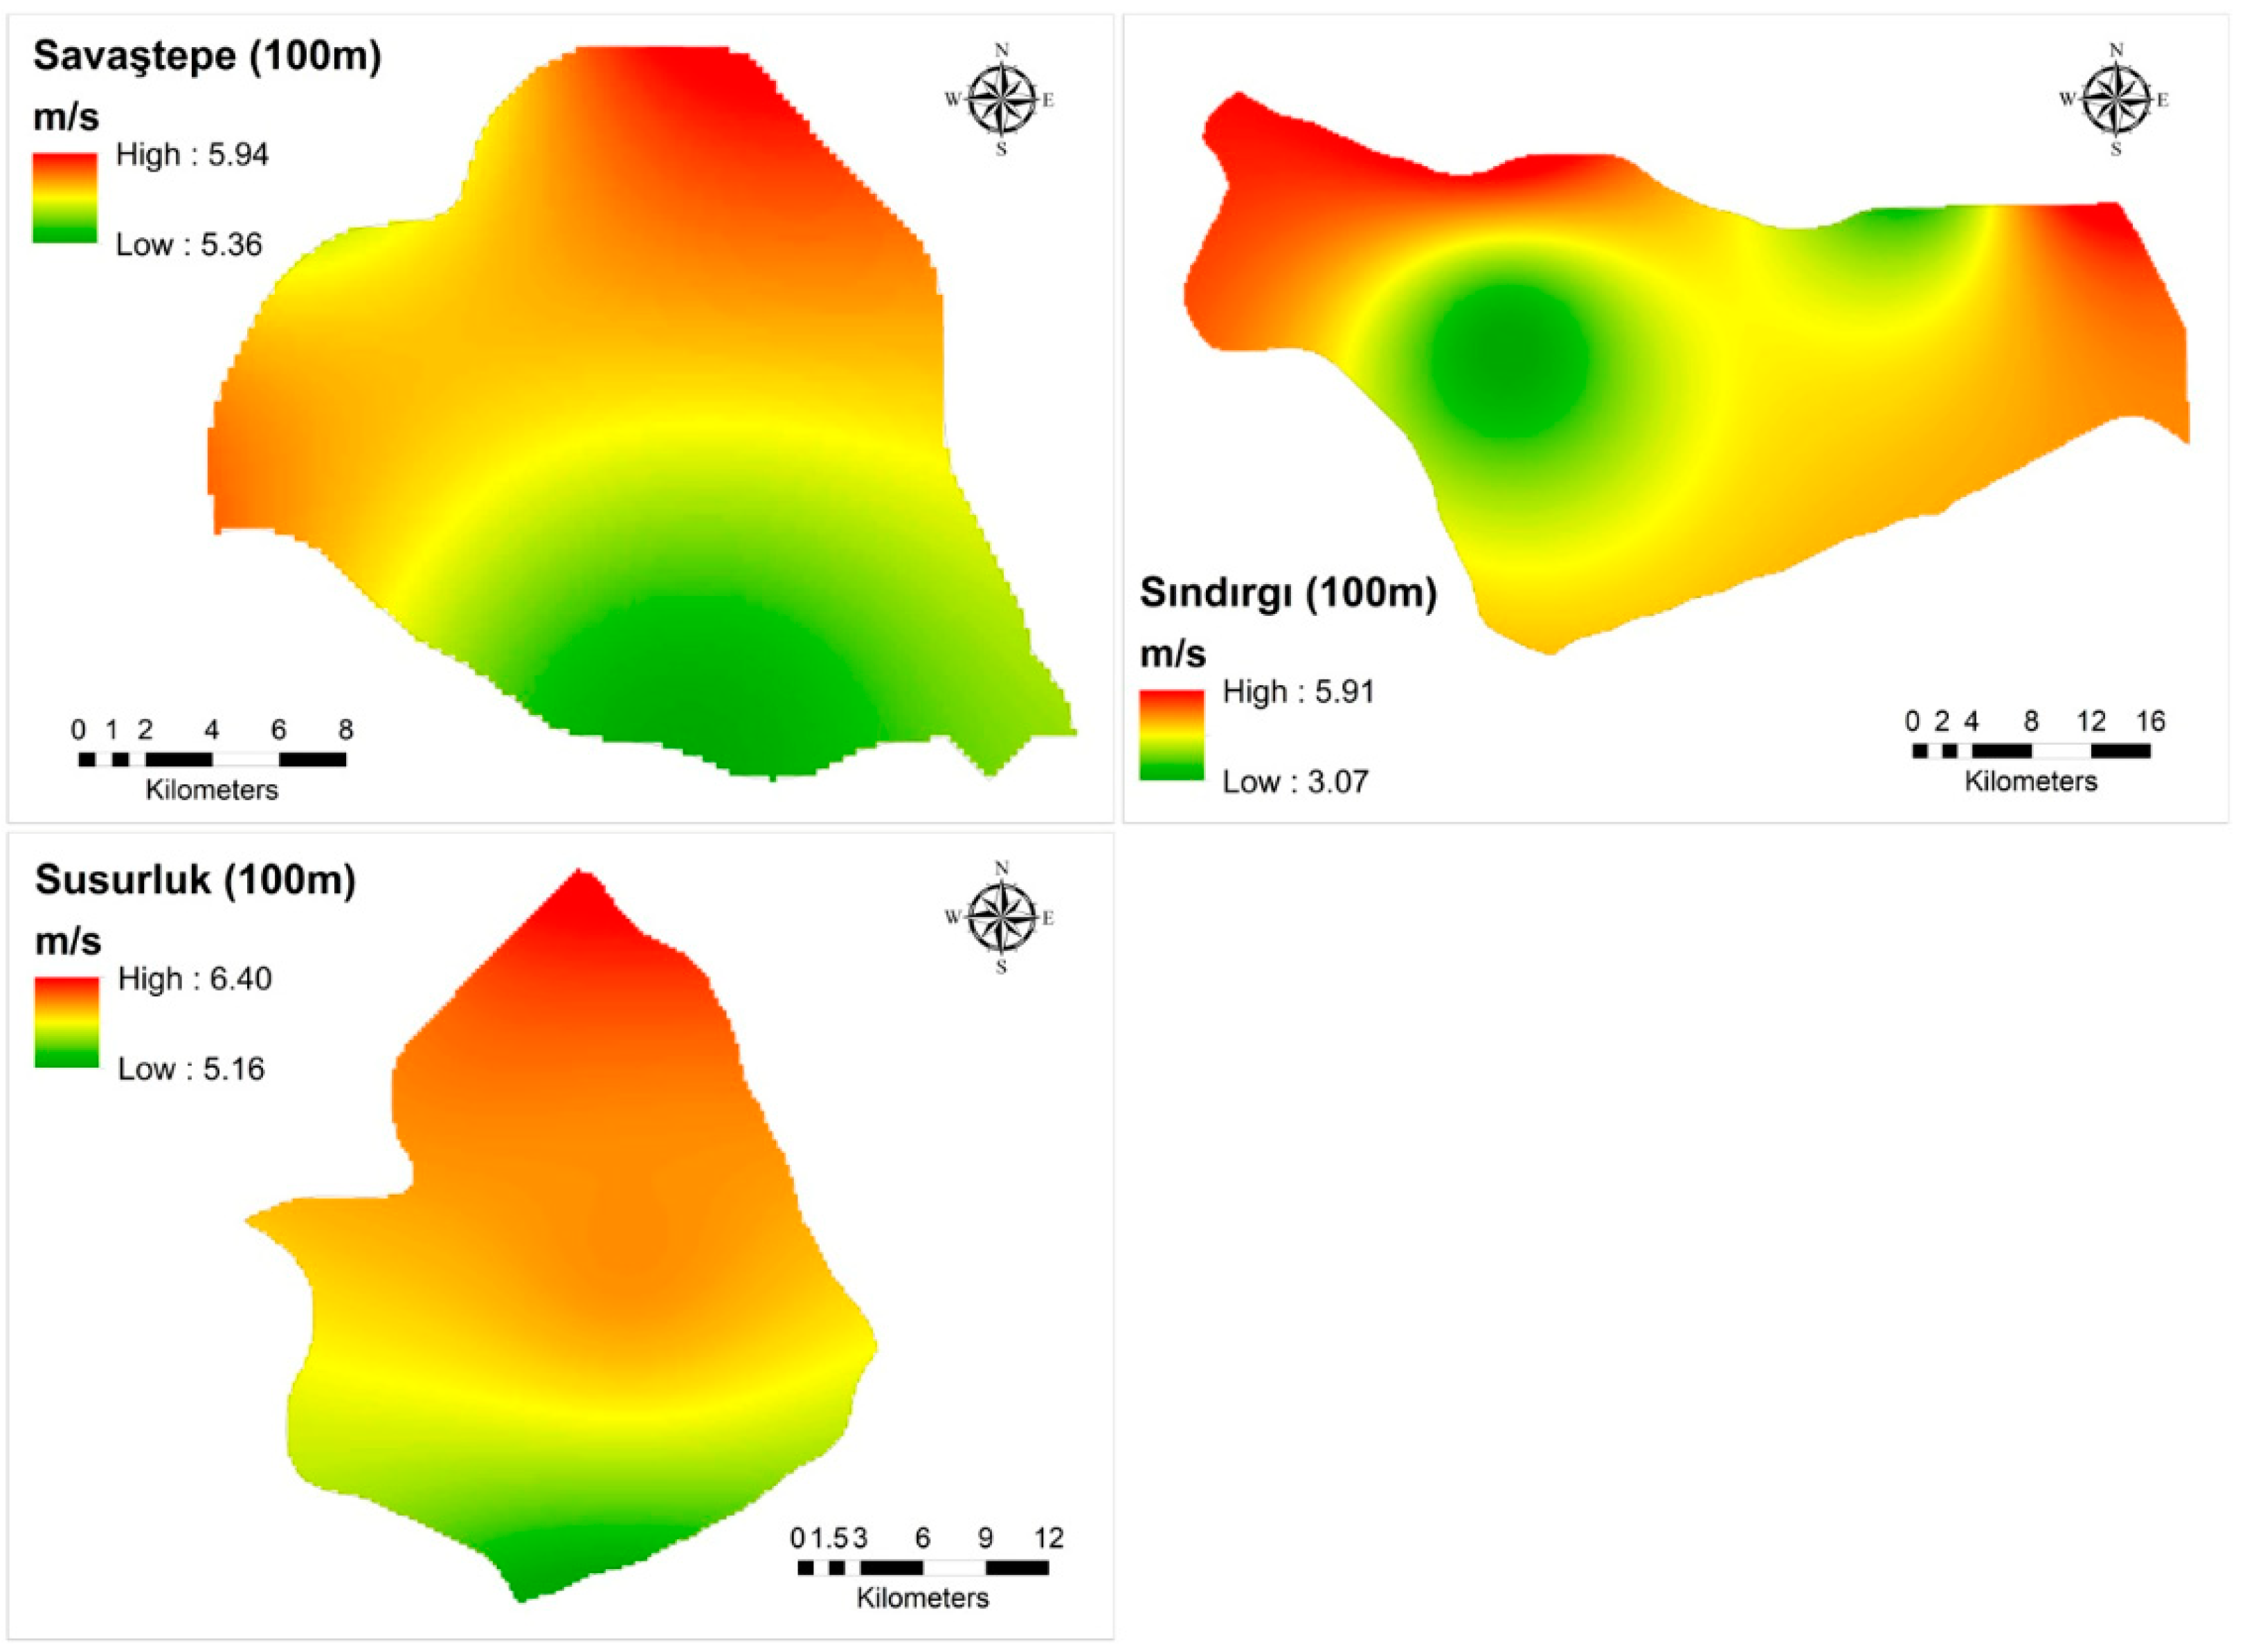
When the wind speed map at a height of 100 m produced for the Balıkesir Province (Figure 5) is examined, the speeds are distributed between 2.52 and 10.91 m/s. When the speed distributions are evaluated for the districts, the high-speed values in the Balya, Bandırma, Edremit, Burhaniye, Havran, and Erdek districts are greater than those in the other districts. In addition, the maximum, minimum, and average wind speeds, and standard deviations at a height of 100 m are shown according to district in Table 5. These wind speeds were derived from the wind speed maps in raster data format. Figure 8 illustrates the wind speed maps of the Ayvalık, Balya, Bandırma, and Bigadiç districts at a height of 100 m. The wind speed maps of the other districts are also given in Figure A1, Figure A2, Figure A3 and Figure A4 of Appendix A.
Wind speed varies depending on landforms. While the friction effect of wind increases in mountainous and rough terrains, its speed decreases. On smooth surfaces, such as the sea and oceans, the wind speed increases as the friction effect decreases.
When the wind speed map created is examined, it is seen that the wind speeds are generally higher on the coastline. The Ayvalık, Gömeç, Burhaniye, Edremit, Gönen, Bandırma, Erdek, and Marmara districts are located on the coastline. To the west of the Ayvalık and Gömeç districts, there is the island of Lesbos. Due to the roughness caused by Lesbos Island, the wind speeds in the Ayvalık and Gömeç districts are lower than those in other districts on the coastline. In addition, the wind speeds in the İvrindi and Savaştepe districts are lower than those in other districts for the same reason. However, due to the air corridor formed by the passage of the Bosphorus between the Çanakkale Province and Lesbos Island, the wind speeds are at high levels in the districts of Burhaniye, Edremit, Havran, and Balya, which are located in this direction. Since Sındırgı, Bigadiç, Dursunbey, and Kepsut are the furthest districts from the coastline, their wind speeds are lower than those of other districts.
When the maximum and average wind speeds and standard deviations are examined, it is seen that Bandırma is the most favorable district in terms of wind speed. There is the Marmara Sea to the north of Bandırma and Lake Manyas to the south. Therefore, the roughness that will prevent the wind flow in the district is low. For this reason, wind speeds are at high levels throughout the district.
Since wind speed is the main factor in the calculation of wind power potential, the distribution of wind power potential in the districts also differs due to the reasons stated above and is parallel to the wind speed distribution.
Moreover, the wind energy potentials of the districts were also calculated to compare between the districts and give efficient information to decision makers. Table 6 demonstrates the wind energy potential of each district, according to different wind speed threshold values. In a study conducted by the Turkish Atomic Energy Agency on alternative energy sources, the lowest wind speed that can be used for electricity generation was determined to be 6 m/s [50]. According to the International Electrotechnical Commission (IEC) standard, the minimum technical wind speed is expressed as 6 m/s by Zahedi et al. [42]. For these reasons, the minimum speed was determined to be 6 m/s in this study. Other threshold values were determined in order to compare the wind energy potentials of the districts.
The wind speed values were divided into certain ranges and the number of cells in the specified ranges and corresponding total areas were determined in order to more clearly understand the wind energy potential of the Balıkesir Province at a height of 100 m (Table 7). The wind energy potential values in Table 6 and Table 7 were derived from the calculation process carried out by using the database files of the point-based shapefile of the wind speed maps.
5. Discussion and Conclusions
With the approach proposed in this study, it is possible to calculate the wind energy potential for a certain area using multiple points, which is superior to the single point-based wind energy potential determination studies [28,29,30,31,32,33,34,35,36,37,38,39] mentioned in the introduction section. In these point-based studies, wind energy potential calculations can only be made for these points and areal results cannot be produced. With the spatial interpolation method, which is a GIS function, wind speeds for an entire area can be generated by interpolating the wind speeds belonging to multiple points in a certain area. In this way, the total wind energy potential can be calculated for a study area using wind speeds. The wind speed maps of the Balıkesir Province and its districts were produced using IDW, which is the most appropriate spatial interpolation method in this study. Area-based wind potentials of the study region were obtained for different ranges considering the wind turbine layout plan designed according to the national regulation.
Anwer and Deshmukh [40] used the kriging interpolation method to obtain a wind speed map of the southern states of India. The produced wind speed map was insufficient in terms of cartographic representation. Another missing point in the study is that no comparison was made between interpolation methods. Likewise, Feng et al. [41] also adopted the IDW interpolation method to generate a wind speed map of mainland China without comparing interpolation methods. The wind energy potential of the study area was determined by adopting the wind farm layout approach of Gustavson [51] using wind potential calculation algorithms. These calculations were made according to the specifications of a specific wind turbine. Turbine specifications were used to obtain the maximum power coefficient in the study. Zahedi et al. [42] used a GIS-based multi-criteria decision support system to determine the suitable areas for wind turbine installation in the western region of Iran. They used raw wind speed and roughness information via Wind atlas analysis and application program (WAsP) software and obtained a digital wind atlas. There was no information about interpolation methods and the process for creating the wind speed atlas in the study. A layout plan for the wind turbine installation was defined and the total wind energy potential was calculated for the study area. The number of wind turbines was given in the study, but no equations related to it were given. The total wind potential for a given wind turbine was determined.
In this study, raw wind speeds gathered from TSMS stations were extrapolated to 100 m considering the roughness of the terrain, and wind speed maps were created using the IDW, kriging, natural neighbor, spline, and trend interpolation methods. The most appropriate method was determined to be IDW with the minimum RMSE value of 0.008 m/s. In addition, a layout plan for wind turbine installation was designed considering the minimum distances required between two turbines in the Regulation on the Technical Evaluation of Wind Source Based Electricity Generation Applications, and an equation (Equation (2)) was produced that gives the number of wind turbines that can be installed in a certain area in accordance with this layout plan. Unlike other studies carried out, no existing turbine model was taken as a reference, so that the model did not become dependent on any brand. Wind energy investors can apply this model with the parameters of the turbine model they want.
Wind speeds and Equations (2) and (3) were used to calculate the wind energy potential for each wind speed range. Finally, the total wind energy potentials of the Balıkesir Province and its districts were obtained by summing the wind energy potentials of all the ranges.
When the threshold value for wind speed is taken as 6 m/s, the total wind power potential is calculated as 28,885.30 MW in the Balıkesir Province. It is calculated as 13,559.51 MW with a 7 m/s threshold value and 6830.69 MW with an 8 m/s threshold value.
The wind speed threshold value was taken as 6.8 m/s in the wind energy potential atlas of Turkey (REPA), and the total wind energy potential at a height of 50 m for the Balıkesir Province was determined to be 13,827.36 MW. In this study, the wind energy potential was calculated as 15,928.81 MW with a 6.8 m/s wind speed threshold. There are five different wind speed ranges in REPA. The wind energy potential for a given area is calculated by multiplying the total area value by five and is a general assumption. Although the total area value obtained in this study was lower than that in REPA, the calculated total wind power potential value was higher. This is because a realistic approach was used in this study to calculate the wind energy potential. The reason for the lower area values in this study is that areas were excluded from the study if they were legally prohibited or unsuitable areas. Another reason why the wind potential values were higher than those in REPA is that the height used in this study was greater than that used in REPA. The total area and wind potential values obtained in this study and REPA are represented in Table 8.
When the wind power potentials of the districts are examined according to the 6 m/s wind speed threshold value, the district with the highest potential is Balya. Bandırma, Havran, and Edremit follow Balya. If the threshold value is taken as 7 m/s, this order is Bandırma, Balya, Erdek, and Havran. When the threshold value is taken as 8 m/s, this order changes to Bandırma, Balya, Erdek, and Burhaniye. This change in the rankings is due to the wind speed distribution in the districts. When the wind power potential values in the districts are examined, it is obvious that Bandırma and Balya are much more efficient than the other districts.
The total installed power amount was 1375.05 MW as of January 2022. This value constitutes only 8.6% of the 15,928.81 MW wind energy potential value calculated as a result of this study. This shows that the Balıkesir Province is still quite suitable for wind energy investments. This study is expected to contribute to the evaluations of investors and decision makers working in the field of renewable energy.
The limitation of the method is that the wind energy potential value obtained within a certain area cannot be visualized. In order to visualize the results obtained, the energy potential of each cell must be calculated. The amount of error will increase when Equation (2), which calculates the number of wind turbines that can be installed in a certain area, is used for each cell in high-spatial-resolution studies. For example, the spatial resolution of this study is 200 m and the size of each cell is 200 × 200 m. According to the Regulation on the Technical Evaluation of Wind Source Based Electricity Generation Applications mentioned in Section 3, the distance between two turbines has to be at least 840 m, which is seven times the rotor diameter along the route, and 360 m, which is three times the rotor diameter for the second row perpendicular to the route. In this case, it is impossible to install more than one turbine in each cell. However, using Equation (2), the number of turbines that can be installed in each cell is calculated as 2.26. For this reason, in this study, the wind energy potential is calculated for each wind speed range by taking into account the total number of cells in the specified ranges, and these results cannot be visualized. On the other hand, in order to compare the obtained results with REPA, the same wind speed ranges were created with REPA and comparisons were made. In addition, studies will continue to calculate the wind energy potential that can be produced in each cell to visualize the results produced. The proposed methodology can be applied in all areas that consist of cells having an individual wind speed value.
The turbine rotor diameter used in the study was evaluated as 120 m and the hub height was evaluated as 100 m by considering the installed wind turbines in Turkey and up-to-date wind turbine technology. In order to not adopt a brand- and model-dependent approach, no turbine model of any brand was taken as a reference. The approach used in this study can be applied considering different hub heights and predetermined turbine specifications. Wood [52] mentioned problems that wind farm owners may encounter technically, such as a miscalculation of the power coefficient for the turbine, which may cause maintenance costs in the future. Therefore, more appropriate results can be obtained if the wind energy potential determination approach in this study is re-applied in projects to be realized in smaller areas according to the type of turbine determined, by taking into account meteorological conditions.
Funding
This research received no external funding.
Institutional Review Board Statement
Not applicable.
Informed Consent Statement
Not applicable.
Data Availability Statement
The results presented in this paper are available upon request. Corine Land Cover (CLC) 2018 data is public available and can be sourced at https://land.copernicus.eu/pan-european/corine-land-cover/clc2018?tab=download (accessed on 11 February 2023).
Conflicts of Interest
The author declares no conflict of interest.
Appendix A
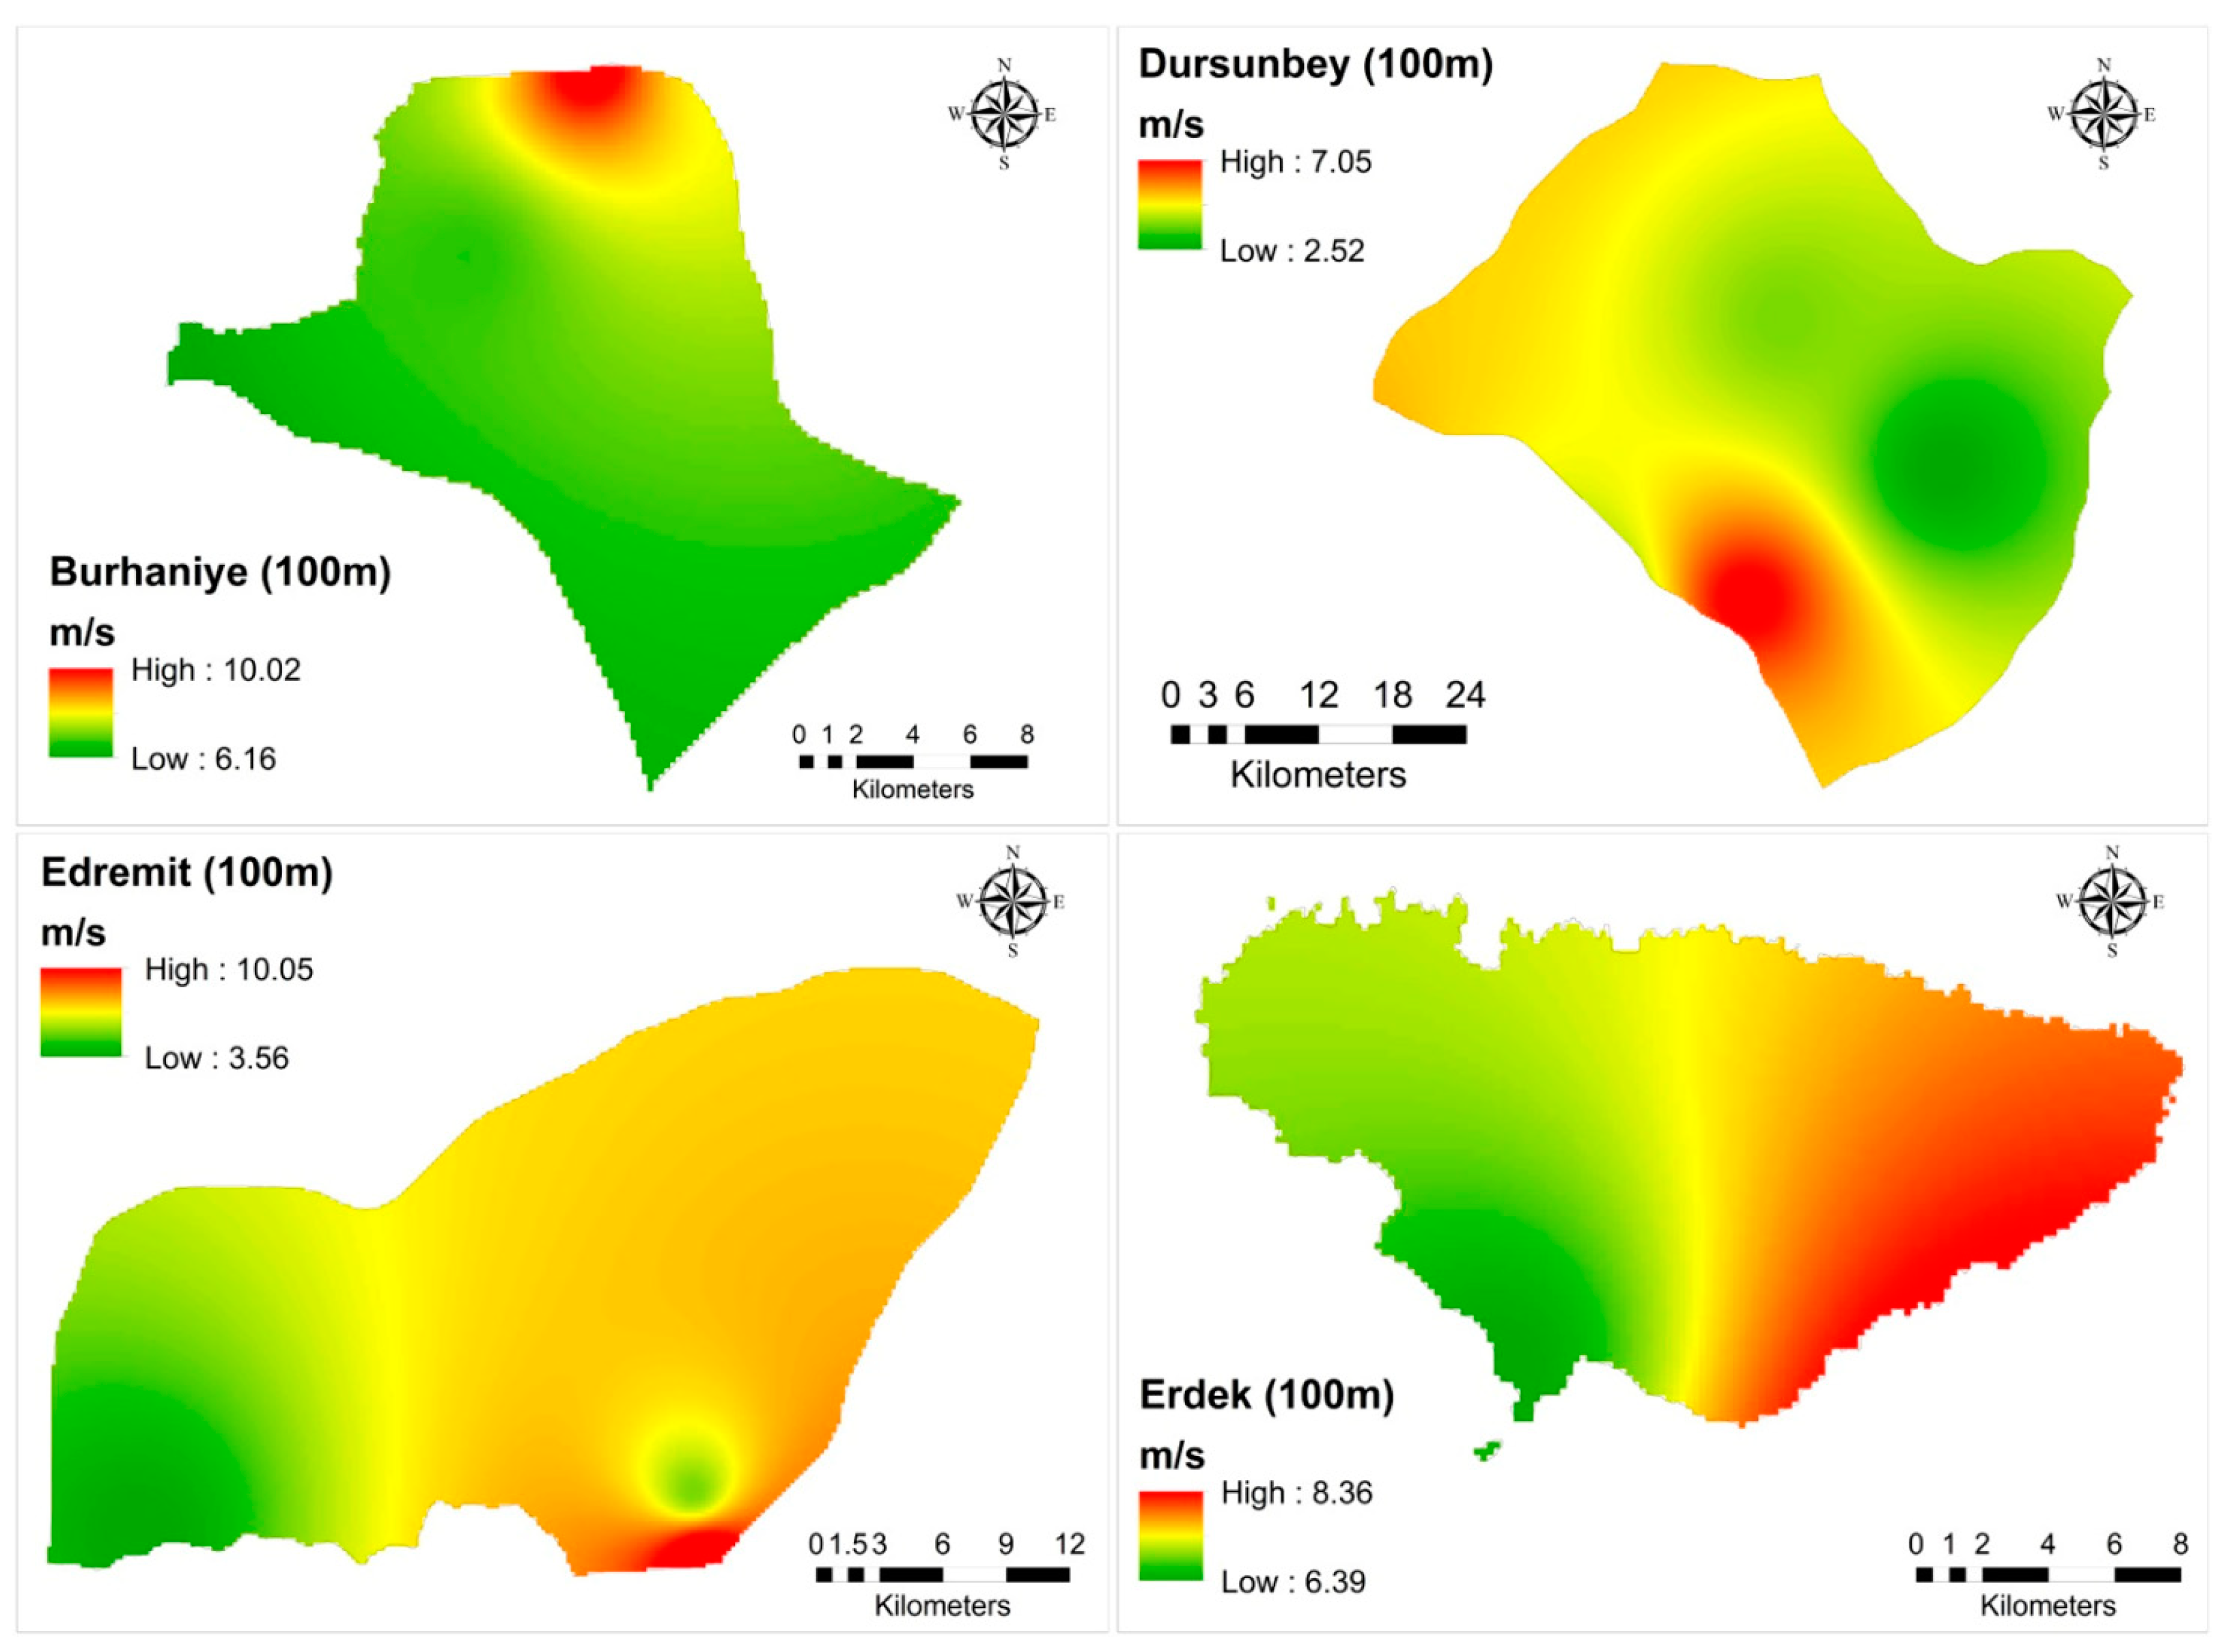
Figure A1.
Wind speed maps of Burhaniye, Dursunbey, Edremit, and Erdek districts at a height of 100 m.
Figure A1.
Wind speed maps of Burhaniye, Dursunbey, Edremit, and Erdek districts at a height of 100 m.

Figure A2.
Wind speed maps of Gömeç, Gönen, Havran, and Ivrindi districts at a height of 100 m.

Figure A3.
Wind speed maps of Kepsut, Manyas, Marmara, and Merkez (Altıeylül and Karesi) districts at a height of 100 m.
Figure A3.
Wind speed maps of Kepsut, Manyas, Marmara, and Merkez (Altıeylül and Karesi) districts at a height of 100 m.

Figure A4.
Wind speed maps of Savaştepe, Sındırgı, and Susurluk districts at a height of 100 m.

References
- Marks-Bielska, R.; Bielski, S.; Pik, K.; Kurowska, K. The Importance of Renewable Energy Sources in Poland’s Energy Mix. Energies 2020, 13, 4624. [Google Scholar] [CrossRef]
- Piwowar, A.; Dzikuć, M. Development of renewable energy sources in the context of threats resulting from low-altitude emissions in rural areas in poland: A review. Energies 2019, 12, 3558. [Google Scholar] [CrossRef] [Green Version]
- Erdin, C.; Ozkaya, G. Turkey’s 2023 energy strategies and investment opportunities for renewable energy sources: Site selection based on electre. Sustainability 2019, 11, 2136. [Google Scholar] [CrossRef] [Green Version]
- Shahzad, U. The need for renewable energy sources. Int. J. Inf. Technol. Electr. Eng. 2015, 4, 16–18. [Google Scholar]
- Dincer, F. The analysis on wind energy electricity generation status, potential and policies in the world. Renew. Sustain. Energy Rev. 2011, 15, 5135–5142. [Google Scholar] [CrossRef]
- Lee, J.; Zhao, F. GWEC Global Wind Report 2021; Global Wind Energy Council (GWEC): Brussels, Belgium, 2021. [Google Scholar]
- Lee, J.; Zhao, F. GWEC Global Wind Report 2022; Global Wind Energy Council (GWEC): Brussels, Belgium, 2022. [Google Scholar]
- Global Wind Power Statistics by 2021. Available online: https://library.wwindea.org/global-wind-power-statistics/ (accessed on 20 March 2023).
- Dawn, S.; Tiwari, P.K.; Goswami, A.K.; Singh, A.K.; Panda, R. Wind power: Existing status, achievements and government’s initiative towards renewable power dominating India. Energy Strategy Rev. 2019, 23, 178–199. [Google Scholar] [CrossRef]
- Presidency of the Republic of Turkey Presidency of Strategy and Budget: Republic of Turkey’s Eleventh Development Plan Covering the 2019–2023 Period. Available online: https://www.sbb.gov.tr/wp-content/uploads/2022/07/Eleventh_Development_Plan_2019-2023.pdf (accessed on 13 February 2023).
- General Directorate of Energy Affairs: Turkey Electricity Investments in June 2022 Summary Report. Available online: https://enerji.gov.tr//Media/Dizin/EIGM/tr/Raporlar/PRP/EY%C3%96RA/2022/Haziran/ElektrikYat%C4%B1r%C4%B1mlar%C4%B12022HaziranAy%C4%B1%C3%96zetRaporu.pdf (accessed on 13 February 2023).
- Gultekin, U. Development of wind energy investments in Turkey. J. Turk. Stud. 2019, 14, 2333–2348. [Google Scholar] [CrossRef]
- Akdoğan, İ.; Kovancılar, B. Evaluation of Eco-Friendly Renewable Energy Policies in The European Union and Turkey in Terms of Incentive Types. Yönetim ve Ekonomi Dergisi 2022, 29, 69–91. [Google Scholar] [CrossRef]
- Turkish Wind Energy Association. Turkish Wind Energy Statictic Report—January 2022. Available online: https://tureb.com.tr//yayinlar/turkiye-ruzgar-enerjisi-istatistik-raporlari/5 (accessed on 17 March 2023).
- Turkish Wind Energy Association. Turkish Wind Energy Statictic Report—January 2021. Available online: https://tureb.com.tr//yayin/turkiye-ruzgar-enerjisi-istatistik-raporu-ocak-2021/139 (accessed on 17 March 2023).
- Manfren, M.; Nastasi, B.; Groppi, D.; Astiaso Garcia, D. Open data and energy analytics—An analysis of essential information for energy system planning, design and operation. Energy 2020, 213, 118803. [Google Scholar] [CrossRef]
- GoldWind Gw175-8.0MW Smart PMDD Wind Turbine Technical Parameters. Available online: https://www.goldwind.com/en/windpower/product-gw6s/ (accessed on 13 March 2023).
- Vestas V172-7.2 MW™ Wind Turbine Technical Specifications. Available online: https://www.vestas.com/en/products/enventus-platform/V172-7-2-MW (accessed on 13 March 2023).
- Nordex N163/6.X Wind Turbine Technical Data. Available online: https://www.nordex-online.com/en/product/n163-6-x/ (accessed on 13 March 2023).
- Voivontas, D.; Assimacopoulos, D.; Mourelatos, A.; Coromınas, J. Evaluation of Renewable Energy Potential Using A GIS Decision Support System. Renew. Energy 1998, 13, 333–344. [Google Scholar] [CrossRef]
- Rodman, L.C.; Meentemeyer, R.K. A geographic analysis of wind turbine placement in Northern California. Energy Policy 2006, 34, 2137–2149. [Google Scholar] [CrossRef]
- Al-Yahyai, S.; Charabi, Y.; Gastli, A.; Al-Badi, A. Wind farm land suitability indexing using multi-criteria analysis. Renew. Energy 2012, 44, 80–87. [Google Scholar] [CrossRef]
- Gorsevski, P.V.; Cathcart, S.C.; Mirzaei, G.; Jamali, M.M.; Ye, X.; Gomezdelcampo, E. A group-based spatial decision support system for wind farm site selection in Northwest Ohio. Energy Policy 2013, 55, 374–385. [Google Scholar] [CrossRef]
- Höfer, T.; Sunak, Y.; Siddique, H.; Madlener, R. Wind farm siting using a spatial Analytic Hierarchy Process approach: A case study of the Städteregion Aachen. Appl. Energy 2016, 163, 222–243. [Google Scholar] [CrossRef]
- Noorollahi, Y.; Yousefi, H.; Mohammadi, M. Multi-criteria decision support system for wind farm site selection using GIS. Sustain. Energy Technol. Assess. 2016, 13, 38–50. [Google Scholar] [CrossRef]
- Villacreses, G.; Gaona, G.; Martínez-Gómez, J.; Jijón, D.J. Wind farms suitability location using geographical information system (GIS), based on multi-criteria decision making (MCDM) methods: The case of continental Ecuador. Renew. Energy 2017, 109, 275–286. [Google Scholar] [CrossRef]
- Baseer, M.A.; Rehman, S.; Meyer, J.P.; Alam, M.M. GIS-based site suitability analysis for wind farm development in Saudi Arabia. Energy 2017, 141, 1166–1176. [Google Scholar] [CrossRef] [Green Version]
- Kavak Akpinar, E.; Akpinar, S. Determination of the wind energy potential for Maden-Elazig, Turkey. Energy Convers. Manag. 2004, 45, 2901–2914. [Google Scholar] [CrossRef]
- Keyhani, A.; Ghasemi-Varnamkhasti, M.; Khanali, M.; Abbaszadeh, R. An assessment of wind energy potential as a power generation source in the capital of Iran, Tehran. Energy 2010, 35, 188–201. [Google Scholar] [CrossRef]
- Fyrippis, I.; Axaopoulos, P.J.; Panayiotou, G. Wind energy potential assessment in Naxos Island, Greece. Appl. Energy 2010, 87, 577–586. [Google Scholar] [CrossRef]
- Ohunakin, O.S.; Akinnawonu, O.O. Assessment of wind energy potential and the economics of wind power generation in Jos, Plateau State, Nigeria. Energy Sustain. Dev. 2012, 16, 78–83. [Google Scholar] [CrossRef]
- Wu, J.; Wang, J.; Chi, D. Wind energy potential assessment for the site of Inner Mongolia in China. Renew. Sustain. Energy Rev. 2013, 21, 215–228. [Google Scholar] [CrossRef]
- Elnaggar, M.; Edwan, E.; Ritter, M. Wind Energy Potential of Gaza Using Small Wind Turbines: A Feasibility Study. Energies 2017, 10, 1229. [Google Scholar] [CrossRef] [Green Version]
- Elie Bertrand, K.S.; Abraham, K.; Lucien, M. Sustainable Energy Through Wind Speed and Power Density Analysis in Ambam, South Region of Cameroon. Front. Energy Res. 2020, 8, 176. [Google Scholar] [CrossRef]
- Wang, Z.; Liu, W. Wind energy potential assessment based on wind speed, its direction and power data. Sci. Rep. 2021, 11, 16879. [Google Scholar] [CrossRef]
- Çakmakçı, B.A.; Hüner, E. Evaluation of wind energy potential: A case study. Energy Sources Part A Recovery Util. Environ. Eff. 2022, 44, 834–852. [Google Scholar] [CrossRef]
- Paraschiv, S.; Paraschiv, L.; Alexandru, S.; Anisoara-Gabriela, C. Assessment of onshore wind energy potential under temperate continental climate conditions. Energy Rep. 2022, 8, 251–258. [Google Scholar] [CrossRef]
- Jung, C.; Schindler, D. Introducing a new approach for wind energy potential assessment under climate change at the wind turbine scale. Energy Convers. Manag. 2020, 225, 113425. [Google Scholar] [CrossRef]
- Ongaki, L.; Maghanga, C.M.; Kerongo, J. Evaluation of the Technical Wind Energy Potential of Kisii Region Based on the Weibull and Rayleigh Distribution Models. J. Energy 2021, 2021, 6627509. [Google Scholar] [CrossRef]
- Anwar, K.; Deshmukh, S. Parametric study for the prediction of wind energy potential over the southern part of India using neural network and geographic information system approach. Proc. Inst. Mech. Eng. Part A J. Power Energy 2020, 234, 96–109. [Google Scholar] [CrossRef]
- Feng, J.; Feng, L.; Wang, J.; King, C.W. Evaluation of the onshore wind energy potential in mainland China—Based on GIS modeling and EROI analysis. Resour. Conserv. Recycl. 2020, 152, 104484. [Google Scholar] [CrossRef]
- Zahedi, R.; Ghorbani, M.; Daneshgar, S.; Gitifar, S.; Qezelbigloo, S. Potential measurement of Iran’s western regional wind energy using GIS. J. Clean. Prod. 2022, 330, 129883. [Google Scholar] [CrossRef]
- Wind Energy Potential Atlas of Balıkesir, Turkey. Available online: https://repa.enerji.gov.tr/REPA/BALIKESIR-REPA.pdf (accessed on 16 February 2023).
- Corine Land Cover (CLC). 2018. Available online: https://land.copernicus.eu/pan-european/corine-land-cover/clc2018?tab=download (accessed on 11 February 2023).
- The United States Geological Survey (USGS). ASTGTMv003 ASTER Global Digital Elevation Model. Available online: https://lpdaac.usgs.gov/products/astgtmv003/ (accessed on 11 February 2023).
- Tar, K. Some statistical characteristics of monthly average wind speed at various heights. Renew. Sustain. Energy Rev. 2008, 12, 1712–1724. [Google Scholar] [CrossRef]
- Masters, G.M. Renewable and Efficient Electric Power Systems; John Wiley and Sons: Hoboken, NJ, USA, 2004. [Google Scholar]
- Yildiz, S.S. A Comparison of Interpolation Methods in Creation of Wind Speed Maps: A Case Study of Balıkesir. Afyon Kocatepe Univ. J. Sci. Eng. 2021, 21, 130–137. [Google Scholar] [CrossRef]
- Republic of Turkey Ministry of Energy and Natural Resources: Regulation on the Technical Evaluation of Wind Source Based Electricity Generation Applications. Available online: https://www.resmigazete.gov.tr/eskiler/2015/10/20151020-2-1.pdf (accessed on 17 February 2023).
- Turkish Atomic Energy Agency. Alternatif Enerji Kaynakları. İstanbul: Çekmece Nükleer Araştırma ve Eğitim Merkezi. Available online: https://kurumsalarsiv.tenmak.gov.tr/bitstream/20.500.12878/1272/1/3308.pdf (accessed on 18 February 2023).
- Gustavson, M.R. Limits to wind power utilization. Science 1979, 204, 13–17. [Google Scholar] [CrossRef]
- Wood, D. Grand Challenges in Wind Energy Research. Front. Energy Res. 2020, 8, 624646. [Google Scholar] [CrossRef]
Figure 1.
Geographical distribution of the provinces within the top twenty in terms of installed wind power capacity in Turkey.
Figure 1.
Geographical distribution of the provinces within the top twenty in terms of installed wind power capacity in Turkey.

Figure 2.
The location of Balıkesir Province and its districts.

Figure 3.
Methodological framework of the study.

Figure 4.
The geographical distribution of TSMS stations.

Figure 5.
Wind speed map of Balıkesir Province at a height of 100 m.

Figure 6.
Sample siting plan of wind turbines.

Figure 7.
Excluded areas.

Figure 8.
Wind speed maps of Ayvalık, Balya, Bandırma, and Bigadiç districts at a height of 100 m.


Table 1.
Installed capacity and ranks of countries [8].
Table 1.
Installed capacity and ranks of countries [8].
| Rank | Country | Installed Capacity 2020 (MW) | New Installations 2021 (MW) | Growth Rates (%) | Installed Capacity 2021 (MW) | Share in the World (%) |
|---|---|---|---|---|---|---|
| 1 | P.R. China | 288,029 | 58,641 | 20.4 | 346,670 | 41.0 |
| 2 | United States | 122,328 | 12,518 | 10.2 | 134,846 | 15.9 |
| 3 | Germany | 62,208 | 1716 | 2.8 | 63,924 | 7.6 |
| 4 | India | 38,625 | 1732 | 4.5 | 40,357 | 4.8 |
| 5 | Spain | 27,446 | 750 | 2.7 | 28,196 | 3.3 |
| 6 | United Kingdom | 24,167 | 2645 | 10.9 | 26,812 | 3.2 |
| 7 | Brazil | 18,010 | 3827 | 21.2 | 21,837 | 2.6 |
| 8 | France | 17,949 | 1132 | 6.3 | 19,081 | 2.3 |
| 9 | Canada | 13,627 | 677 | 5.0 | 14,304 | 1.7 |
| 10 | Sweden | 9922 | 2175 | 21.9 | 12,097 | 1.4 |
| 11 | Italy | 10,850 | 258 | 2.4 | 11,108 | 1.3 |
| 12 | Turkey | 9305 | 1797 | 19.3 | 11,102 | 1.3 |
| 13 | Others | 99,992 | 12,964 | 13.0 | 112,956 | 13.4 |
| Rank | Province | Installed Capacity January 2022 (MW) | New Installations 2021 (MW) | Growth Rates (%) | Installed Capacity January 2021 (MW) | Share in the Country (%) |
|---|---|---|---|---|---|---|
| 1 | İzmir | 1886.70 | 88.55 | 4.9 | 1798.15 | 17.0 |
| 2 | Balıkesir | 1375.05 | 155.00 | 12.7 | 1220.05 | 12.4 |
| 3 | Çanakkale | 917.35 | 166.03 | 22.1 | 751.32 | 8.3 |
| 4 | Manisa | 727.55 | 10.80 | 1.5 | 716.75 | 6.6 |
| 5 | İstanbul | 684.39 | 350.09 | 104.7 | 334.30 | 6.2 |
| 6 | Kırklareli | 481.68 | 150.08 | 45.3 | 331.60 | 4.3 |
| 7 | Hatay | 437.85 | 23.20 | 5.6 | 414.65 | 3.9 |
| 8 | Afyon | 368.45 | 0.00 | 0.0 | 368.45 | 3.3 |
| 9 | Aydın | 365.60 | 72.00 | 24.5 | 293.60 | 3.3 |
| 10 | Konya | 337.80 | 24.00 | 7.6 | 313.80 | 3.0 |
| 11 | Yalova | 308.95 | 174.60 | 130.0 | 134.35 | 2.8 |
| 12 | Bursa | 286.00 | 143.40 | 100.6 | 142.60 | 2.6 |
| 13 | Kayseri | 274.35 | 0.00 | 0.0 | 274.35 | 2.5 |
| 14 | Osmaniye | 265.30 | 0.00 | 0.0 | 265.30 | 2.4 |
| 15 | Mersin | 253.55 | 0.00 | 0.0 | 253.55 | 2.3 |
| 16 | Muğla | 237.25 | 32.00 | 15.6 | 205.25 | 2.1 |
| 17 | Tekirdağ | 187.95 | 10.25 | 5.8 | 177.70 | 1.7 |
| 18 | Kırşehir | 168.00 | 0.00 | 0.0 | 168.00 | 1.5 |
| 19 | Sakarya | 162.70 | 135.10 | 489.5 | 27.60 | 1.5 |
| 20 | Sivas | 155.30 | 0.00 | 0.0 | 155.30 | 1.4 |
Table 3.
Data sources.
| Data | Content | Source |
|---|---|---|
| Wind speed | Wind speed at a height of 10 m | Turkish State Meteorological Service |
| Corine land cover | Land cover types | European Environment Agency (EEA) [44] |
| ASTGTM v003 | Digital elevation model | The United States Geological Survey (USGS) Earth Explorer [45] |
| Regional environmental plan | Residential areas, tourism areas, airports, areas of nature reserves, military areas, mining areas, organized industrial regions, logistics centers, small industrial areas, organized agriculture and livestock regions, work areas such as industry and storage areas, and water surfaces | General Directorate of Spatial Planning |
| GADM boundary map | Province and district boundaries | Global Administrative Areas |
Table 4.
Friction coefficient for different land use characteristics [47].
Table 4.
Friction coefficient for different land use characteristics [47].
| Land Use Characteristic | Friction Coefficient (α) |
|---|---|
| Smooth hard ground, calm water | 0.10 |
| Tall grass on level ground | 0.15 |
| High crops, hedges, and shrubs | 0.20 |
| Wooded countryside, many trees | 0.25 |
| Small town with trees and shrubs | 0.30 |
| Large city with tall buildings | 0.40 |
Table 5.
The maximum, minimum, average wind speeds, and standard deviations in the districts at a height of 100 m.
Table 5.
The maximum, minimum, average wind speeds, and standard deviations in the districts at a height of 100 m.
| Name of District | Wind Speed (m/s) | |||
|---|---|---|---|---|
| Max | Min | Mean | Std. Dev. | |
| Ayvalık | 6.79 | 4.21 | 6.00 | 0.37 |
| Balya | 10.91 | 3.79 | 6.73 | 1.44 |
| Bandırma | 10.82 | 6.63 | 8.17 | 0.67 |
| Bigadiç | 6.86 | 2.85 | 5.27 | 0.93 |
| Burhaniye | 10.02 | 6.16 | 7.12 | 0.55 |
| Dursunbey | 7.05 | 2.52 | 4.47 | 0.79 |
| Edremit | 10.05 | 3.56 | 6.16 | 0.88 |
| Erdek | 8.36 | 6.39 | 7.44 | 0.48 |
| Gömeç | 6.75 | 5.63 | 6.11 | 0.31 |
| Gönen | 7.59 | 4.03 | 5.80 | 0.68 |
| Havran | 9.58 | 6.01 | 6.91 | 0.43 |
| İvrindi | 7.20 | 4.51 | 5.86 | 0.59 |
| Kepsut | 5.77 | 4.30 | 5.13 | 0.29 |
| Manyas | 7.19 | 5.42 | 6.10 | 0.34 |
| Marmara | 7.49 | 6.82 | 7.27 | 0.19 |
| Merkez (Altıeylül-Karesi) | 7.34 | 4.75 | 5.71 | 0.31 |
| Savaştepe | 5.94 | 5.36 | 5.64 | 0.13 |
| Sındırgı | 5.91 | 3.07 | 4.53 | 0.55 |
| Susurluk | 6.40 | 5.16 | 5.89 | 0.21 |
Table 6.
The wind energy potential of districts.
| Name of District | Wind Energy Potential (MW) | ||
|---|---|---|---|
| >6 m/s | >7 m/s | >8 m/s | |
| Ayvalık | 548.49 | 0.00 | 0.00 |
| Balya | 5758.53 | 3780.93 | 2416.78 |
| Bandırma | 4957.45 | 4839.97 | 3668.77 |
| Bigadiç | 848.04 | 0.00 | 0.00 |
| Burhaniye | 1625.17 | 929.52 | 265.30 |
| Dursunbey | 334.24 | 23.90 | 0.00 |
| Edremit | 2031.30 | 236.08 | 83.45 |
| Erdek | 1639.09 | 1466.05 | 427.49 |
| Gömeç | 674.11 | 0.00 | 0.00 |
| Gönen | 2010.05 | 275.84 | 0.00 |
| Havran | 2986.36 | 1451.84 | 51.75 |
| İvrindi | 1294.61 | 56.03 | 0.00 |
| Kepsut | 0.00 | 0.00 | 0.00 |
| Manyas | 1679.05 | 0.00 | 0.00 |
| Marmara | 664.25 | 553.82 | 0.00 |
| Merkez (Altıeylül-Karesi) | 875.36 | 64.96 | 0.00 |
| Savaştepe | 0.00 | 0.00 | 0.00 |
| Sındırgı | 0.00 | 0.00 | 0.00 |
| Susurluk | 1101.49 | 0.00 | 0.00 |
Table 7.
The wind energy potential of Balıkesir Province for specified ranges.
| Wind Speed Range (m/s) | Number of Cells | Total Area (km2) | Wind Potential (P) (MW) |
|---|---|---|---|
| 2.5–4.5 | 42,794 | 1711.76 | 1345.22 |
| 4.5–6.0 | 157,450 | 6298.00 | 16,702.09 |
| 6.0–7.0 | 76,122 | 3044.88 | 15,325.79 |
| 7.0–7.5 | 14,768 | 590.72 | 4127.50 |
| 7.5–8.0 | 7616 | 304.64 | 2601.31 |
| 8.0–8.5 | 6645 | 265.80 | 2738.29 |
| 8.5–9.0 | 4067 | 162.68 | 2000.94 |
| 9.0–9.5 | 1483 | 59.32 | 823.39 |
| 9.5–10.0 | 784 | 31.36 | 537.81 |
| >10 | 853 | 34.12 | 730.26 |
Table 8.
Comparison of current study with REPA.
| Wind Speed Range (m/s) | Current Study | REPA | ||
|---|---|---|---|---|
| Total Area (km2) | Wind Potential (P) (MW) | Total Area (km2) | Wind Potential (P) (MW) | |
| 6.8–7.5 | 965.28 | 6468.10 | 1511.42 | 7557.12 |
| 7.5–8.1 | 364.64 | 3173.79 | 850.96 | 4254.80 |
| 8.1–8.6 | 252.88 | 2701.24 | 284.51 | 1422.56 |
| 8.6–9.5 | 174.92 | 2380.15 | 115.23 | 576.16 |
| >9.5 | 65.48 | 1205.53 | 3.34 | 16.72 |
| Total | 1823.20 | 15,928.81 | 2765.47 | 13,827.36 |
Disclaimer/Publisher’s Note: The statements, opinions and data contained in all publications are solely those of the individual author(s) and contributor(s) and not of MDPI and/or the editor(s). MDPI and/or the editor(s) disclaim responsibility for any injury to people or property resulting from any ideas, methods, instructions or products referred to in the content. |
© 2023 by the author. Licensee MDPI, Basel, Switzerland. This article is an open access article distributed under the terms and conditions of the Creative Commons Attribution (CC BY) license (https://creativecommons.org/licenses/by/4.0/).
Share and Cite
MDPI and ACS Style
Yildiz, S.S. Determining Wind Energy Potential Using Geographic Information System Functions: A Case Study in Balıkesir, Turkey. Appl. Sci. 2023, 13, 9183. https://0-doi-org.brum.beds.ac.uk/10.3390/app13169183
AMA Style
Yildiz SS. Determining Wind Energy Potential Using Geographic Information System Functions: A Case Study in Balıkesir, Turkey. Applied Sciences. 2023; 13(16):9183. https://0-doi-org.brum.beds.ac.uk/10.3390/app13169183
Chicago/Turabian StyleYildiz, Selim Serhan. 2023. "Determining Wind Energy Potential Using Geographic Information System Functions: A Case Study in Balıkesir, Turkey" Applied Sciences 13, no. 16: 9183. https://0-doi-org.brum.beds.ac.uk/10.3390/app13169183
Note that from the first issue of 2016, this journal uses article numbers instead of page numbers. See further details here.