1. Introduction
The evolutionary trajectory of supply chain systems has given rise to the realisation that it is no longer a mere chain but a complex network [
1]. Consequently, a novel term has been introduced to refer to conventional supply chains as demand networks [
2]. The contemporary supply chain eco-system has undergone significant transformations over time, and supply chain systems are now widely regarded as sophisticated network systems. This evolution can be attributed to several factors, including the growth of trade and the economy, technological disruptions, increased product specialisation, and changing customer landscapes [
3]. These changes have led to unprecedented transparency for all stakeholders, promoting excellence in the supply chain domain [
4].
The supply chain industry has been transforming significantly due to increasing transparency across supply chains and networks. Despite this progress, organisations still require a more structured and systematic flow of information within and across their supply chains to better understand and have situational awareness of their systems [
5]. Supply chain mapping is considered an ideal tool for visualising the network concerning different layers across and through the system [
6]. The supply chain mapping is developed for several reasons, including performance measurement [
7,
8], re-configurations to achieve continuous improvements [
9], integration with technological advances [
10,
11], and the ability to foresee supply chain risks and challenges posed by natural disasters, geopolitical instabilities, and pandemics [
12]. According to MacCarthy et al. [
6] supply chain mapping can be developed to clarify information at different levels, and
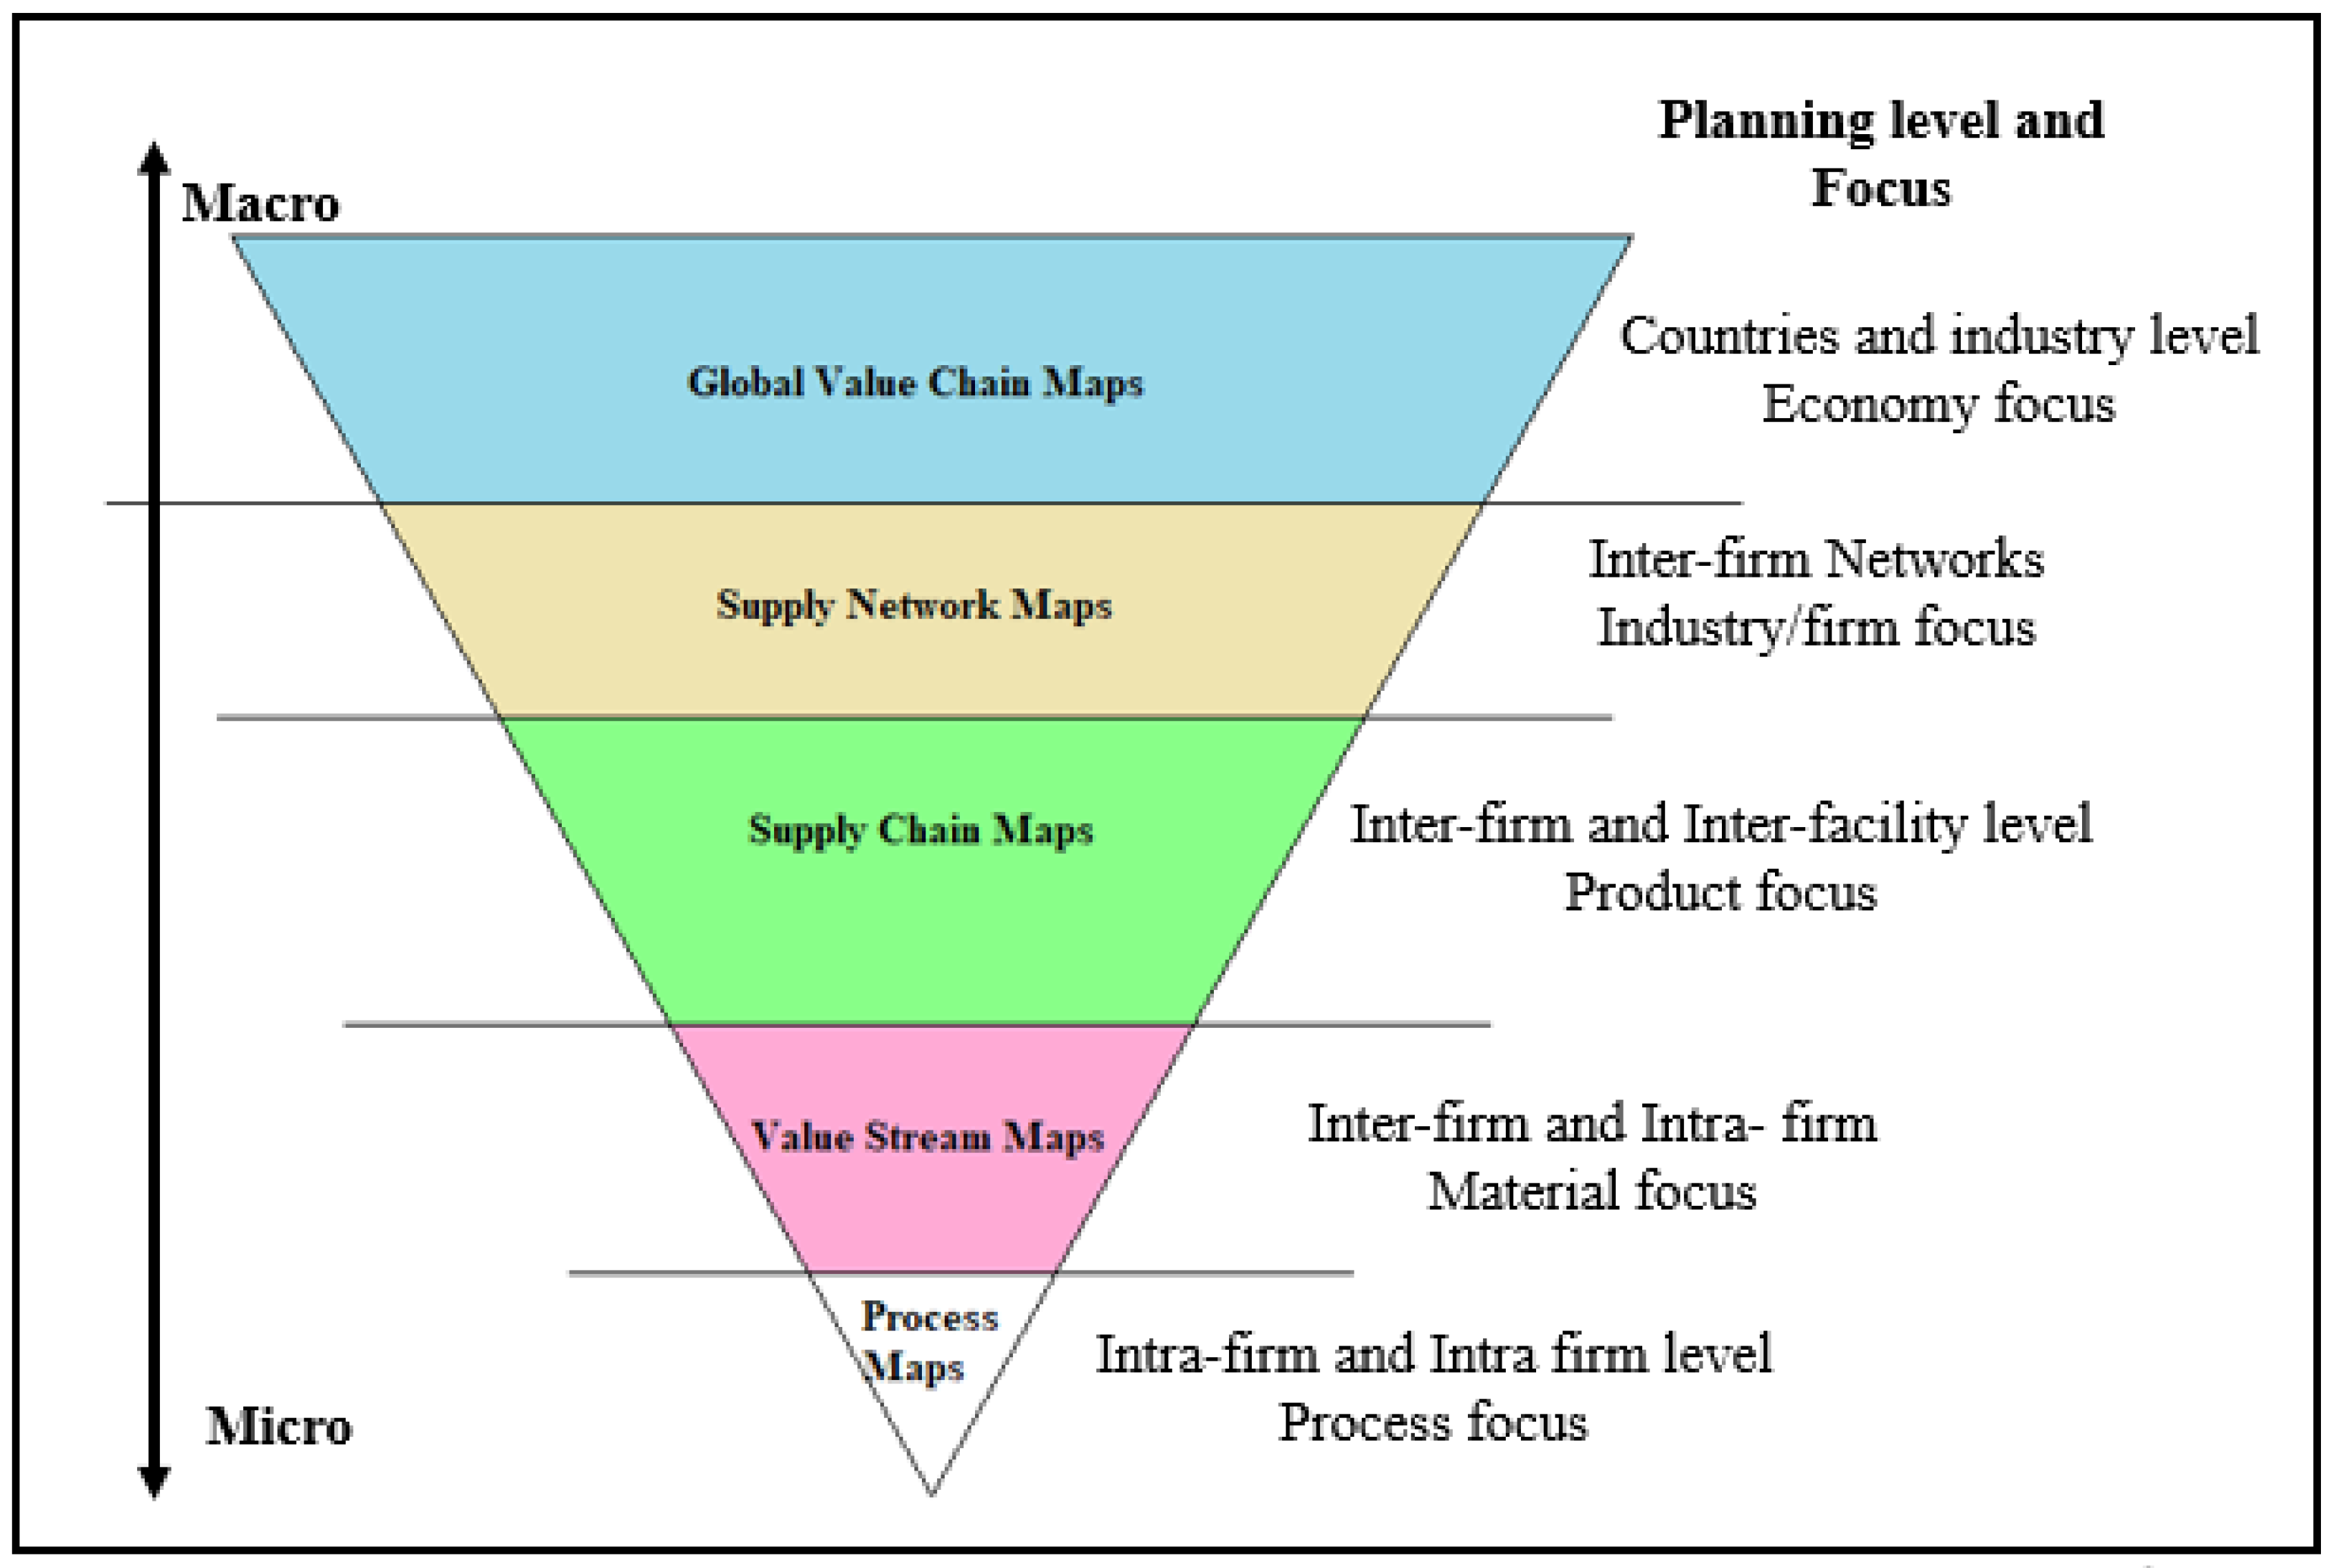
Figure 1 illustrates a classification of hierarchies of supply chain mappings according to the relevant domains and focus areas.
Global value chain maps serve as valuable tools for organisations to position themselves within the global structure and gain an understanding of the industries and markets in which they operate [
13]. These maps provide a macro-level perspective and offer a high-level understanding of supply chain systems. A supply network map encompasses the supply chains that make up an industry, including the roles of regulatory bodies and other facilitating institutions, to gain an overall understanding of the industry’s structure [
14]. Supply chain maps are subsets of supply network maps that provide greater visibility into each element, such as inbound and outbound logistics, making the organisation the focal point of observation [
15].
Moreover, supply chain maps are developed to illustrate the flow of products and services from the organisation’s perspective. Value stream maps (VSM) provide information on the material, and information flows throughout the different stages of production, culminating in the final delivery of the product to the customer. VSMs have become a popular tool under lean manufacturing systems to identify and manage non-value-adding activities in the production processes [
16,
17,
18]. Process maps are a conventional mapping tool used to understand the sequence of processes or tasks necessary to produce one unit of product or service [
19]. Industry practitioners use time and motion studies and process maps interchangeably.
Value stream mapping is a widely used tool in the manufacturing and service industry to visualise and analyse the flow of materials and information and to comprehend the underlying business processes from an organisation-centric perspective. VSM is particularly effective in promoting cross-functional communication and collaboration within an organisation while providing opportunities for continuous improvement. Additionally, VSM is recognised for facilitating lean manufacturing practices, which help identify and eliminate waste and non-value-adding activities. The resulting efficiency improvements can help organisations track and optimise lead time, ultimately enhancing their overall performance. VSM provides the basis for developing supply chain maps, whereas it gets fed by the process mapping systems.
The interconnection between process topological design and VSMs lies in their ability to provide crucial insights into the structure and flow of activities within a system, particularly within the context of supply chains. Process topological design encompasses the layout, configuration, and connectivity of components or nodes in a system, aiming to attain desired performance objectives. Concurrently, VSMs offer a comprehensive understanding of the material and information flows within a specific process or value stream, aiding in identifying waste, inefficiencies, and improvement opportunities.
Buffer allocation, an integral aspect of topology design, plays a significant role in managing and optimising the flow of materials and information. In manufacturing systems and logistics networks, buffer allocation decisions are often made within the broader context of topology design. This entails determining the appropriate number, size, and placement of buffers at strategic locations throughout the system, aiming to ensure a balanced flow of goods or materials, minimise bottlenecks, and optimise system performance [
20,
21,
22]. Poor buffer allocations in manufacturing and service settings can significantly affect operational performance. These consequences include reduced system throughput, as inadequate buffer allocations lead to congestion, bottlenecks, and delays in material transfers or service delivery. Longer lead times are another result, as insufficient buffer capacity increases waiting times and queuing delays at service stations [
23]. Poor buffer allocations can also lead to higher inventory levels, as buffers are not appropriately sized or located, resulting in increased holding costs and potential obsolescence. Moreover, resource utilisation becomes imbalanced, with some areas being utilised and others underutilised, leading to inefficiencies and wasted resources [
24]. Inefficient resource allocation is a consequence, with misalignment between resource capacity and demand patterns. Ultimately, better buffer allocations can result in customer satisfaction due to delays, disruptions, and unreliable performance. To mitigate these consequences, careful analysis and optimisation of buffer allocations, considering demand patterns, process variability, and resource capacities, are essential. Implementing a well-designed buffer allocation strategy can help minimise these negative consequences and improve overall operational performance [
25].
By integrating VSMs into the process topological design, the current state of the process is visually represented, enabling the identification of critical paths, information flows, material flows, and interdependencies between different stages or workstations. This understanding of the process flow and interdependencies is then utilised to design an optimised process topological configuration. Buffer allocation decisions align with the identified bottlenecks, aiming to strategically allocate buffers or storage capacities to manage and optimise the flow of materials and information throughout the system.
Consequently, process topological design and value stream maps are interconnected, providing essential insights into the structure and flow of activities within a system. Buffer allocation, an integral component of topology design, facilitates efficient material and information flow management by strategically placing buffers at appropriate locations to balance the system, minimise bottlenecks, and optimise overall system performance [
26].
This study aims to develop a process mapping approach that utilises finite queueing networks to analyse material logistics systems’ performance within manufacturing facilities. Specifically, the focus is on the intra-logistics process, which involves transporting raw materials to different feeding points based on demand, and the outbound logistics process, which encompasses preparing finished goods for shipment to diverse customers. This research uses finite queueing network models to estimate key performance metrics such as waiting time, resource utilisation, and throughput. Finite queueing networks have proven valuable tools for modelling operations in manufacturing setups and determining appropriate buffer sizes. These networks capture the flow of entities (such as materials or customers) through a series of interconnected queues, representing the various stages or service stations within the manufacturing process. By incorporating factors such as arrival rates, service times, and queue capacities, finite queueing networks enable researchers and practitioners to simulate and analyse real-life scenarios more accurately [
27,
28].
Compared to infinite systems, which assume an infinite capacity for queues, finite queueing networks provide a more realistic representation of operational constraints and resource limitations. Due to physical and cost constraints, manufacturing setups typically have finite capacities for machines, workstations, and buffers. Researchers can model scenarios closely resembling manufacturing environments by considering these finite capacities [
29].
By leveraging finite queueing networks, researchers can simulate different buffer allocation strategies, evaluate their impact on performance metrics such as throughput, waiting times, and resource utilisation, and ultimately determine the optimal buffer sizes for optimal operations. These models allow for experimentation and optimisation, enabling decision-makers to make informed choices regarding buffer allocations that balance operational efficiency, cost-effectiveness, and customer satisfaction [
30,
31].
This research seeks to make a scholarly contribution by delving into optimising buffer allocations in the material transfer process involving a homogeneous fleet of trucks. The study concentrates on two crucial material handling processes: Inter-facility transfer and outbound logistics. Notably, the significance of this study lies in its pioneering approach to buffer allocation problems within an organisational context, taking into account both ends of the logistics process. This research unfolds in two distinct phases, with the initial phase focusing on inter-facility material transfer and the second phase dedicated to outbound logistics. While prior studies have explored buffer allocation problems, they have predominantly concentrated on a singular logistics process. Consequently, this study takes a critical stride towards an integrated analysis of logistics processes within an organisational setup, specifically concerning buffer allocation problems.
The remaining sections of this study are organised as follows.
Section 2 extensively reviews the existing literature about process mapping applications, buffer allocation problems, and the methodologies employed in previous studies. This section provides a comprehensive examination of prior research to establish the foundation for the current study.
Section 3 explains the methodology adopted for the present investigation, outlining the key steps and procedures involved.
Section 4 offers a meticulous analysis of the numerical experiments conducted using the proposed approach. This section incorporates a case study to demonstrate the method’s effectiveness in practical scenarios.
Section 5 concludes the study by summarising the key findings and contributions.
3. Methodology
This section elucidates the methodology implemented in the present study, focusing on modelling inter-facility and outbound logistics processes as finite queueing networks. The GEM approximation technique is elaborated upon, enabling the estimation of network performance measures. Additionally, a mathematical model is formulated to optimise buffer allocation within the network, followed by an explanation of the solution approaches employed to address the optimisation problem.
3.1. Modelling the Material Transfer Processes Using a Finite Queueing Network
The study adopts a rigorous technical approach to modelling material transfer operations involving a homogeneous fleet of trucks. The trucks carrying raw materials from storage to feeding points are represented as network jobs. Each sub-process within the material transfer operations is depicted as a node in the network. The inter-facility material transfer process encompasses a restricted number of assigned trucks, while the outbound logistics process allows for an unrestricted number of customer trucks. Therefore, the study uses finite CQN and finite OQN for the abovementioned cases. Different raw materials or product types are represented through multi-class jobs.
The stochastic nature of the service time at each node captured within the queues is modelled as M/G/1 queues, assuming a generally distributed service time. The queue discipline follows a first-come, first-serve policy. All stations within the network consist of a single-server configuration, and the movement between stations is modelled with an infinite number of servers.
The presence of limited buffer capacity at each node gives rise to the potential occurrence of blocking. In this study, the blocking after service (BAS) strategy is employed, wherein a job remains in the current node even after completion of service if it cannot be transferred to the succeeding node due to insufficient available space. Consequently, exponential service time distributions are unsuitable for this analysis, as they assume memoryless service durations following a constant exponential distribution. Within an exponential setting, jobs serviced at a given node promptly depart to the next node, assuming adequate space is available.
3.2. Generalized Expansion Method (GEM)
The GEM has emerged as a powerful approach for solving finite queueing networks and has demonstrated several advantages compared to other methodologies. GEM offers accurate performance analysis by considering finite capacities, blocking phenomena, and service time distributions [
78]. It provides a robust framework for analysing complex systems with multiple interconnected queues, enabling researchers to derive analytical expressions for performance measures. Regarding implementation cost, GEM offers an advantageous position as it relies on existing mathematical techniques and equations without requiring extensive computational resources or specialised software [
79]. Additionally, GEM is relatively easy to use, providing researchers with clear analytical insights into system behaviour and facilitating sensitivity analysis. While other methodologies, such as simulation-based approaches, may offer more flexibility in capturing system complexities and stochastic behaviour, they often require significant computational resources and expertise in simulation software [
80]. Overall, GEM is a valuable methodology for accurate performance analysis of finite queueing networks, offering a cost-effective and user-friendly alternative to other methodologies.
The GEM, as proposed by Kerbache and Smith [
73], comprises three fundamental steps: network reconfiguration, parameter estimation, and feedback elimination (
Figure 3). This study employs GEM as an approximation technique to analyse the finite queueing network and the blocking phenomenon.
The first step, network reconfiguration, involves restructuring the original queueing network by introducing auxiliary nodes (holding nodes) and links to account for the blocking effects. This reconfiguration enables the representation of blocking occurrences within the network model. The second step, parameter estimation, aims to estimate the unknown parameters of the modified queueing network. This estimation step involves determining the routing probabilities, blocking probabilities, squared coefficient values, service times, and other relevant parameters crucial for accurately modelling the system behaviour.
The final step, feedback elimination, focuses on eliminating the feedback loops that may arise due to the reconfiguration. Feedback loops can lead to complexity in the analysis and may hinder the accurate estimation of performance measures. Removing these feedback loops can simplify and analyse the modified queueing network more efficiently. The following mathematical notations were employed to derive equations for the performance measures of the finite queueing network using GEM.
Notations and Definitions
Number of nodes
Input rate node i (i = 1,2,… M)
Number of product classes t (t = 1,2,… T)
Buffer capacity at node i excluding those in service
Buffer capacity at node i including those in service
The probability of jobs leaving the system from node j (j = 1,2,…, M)
Cost of a buffer space in node j
Mean number of jobs (queue length) at queue s in node j
Arrival rate to holding node h
Mean service rate at holding node h
Blocking probability that node j is at capacity
Feedback blocking probability
Mean throughput of the system
Output rate at node j
Utilisation rate at node j
Squared Coefficient of variation of the service time
Server busy time as a proportion of arrival and service rate
Server busy time as a proportion of arrival and service rate at node h
Maximum budget allocated for buffer space allocation
Mean waiting time at queue s
Network population (for CQN)
An M/G/1 queue is a queueing system where customer arrivals follow a Poisson process (M), service times have a general distribution (G), and there is a single server (1) serving customers one at a time.
Based on the two-moment approximation technique, a closed-form approach can be used to calculate the blocking probability using the following equation [
73,
81].
According to Zhang et al. [
82], the output rate of node
j can be calculated using the following for an OQN system.
According to Kerbache and Smith [
26], the total throughput of node
j in a multi-class finite CQN with total population of
N.
According to Kerbache and Smith and Kerbachea and Smith [
72,
73] the utilisation rate at node
j in OQN and CQN can be calculated using the following equations, respectively.
3.3. Formulation of Optimisation Problem
Buffer allocation in queueing networks offers the potential to optimise multiple objectives by considering various performance measures such as throughput, waiting time, resource utilisation, and system stability. However, achieving a harmonious equilibrium among these objectives poses challenges due to their inherent trade-offs.
The complexity of the buffer allocation problem arises from the need to determine the optimal allocation of finite buffer resources across different nodes within the network. The task involves striking a delicate balance in buffer sizes to maximise overall system performance while simultaneously addressing multiple objectives. For instance, increasing buffer sizes can alleviate congestion and enhance throughput, but it may also lead to prolonged waiting times. Conversely, reducing buffer sizes may enhance responsiveness but elevate blocking probabilities and diminish overall throughput.
In order to address the buffer allocation problem in a finite queueing network, an optimisation framework is formulated with a carefully designed objective function and constraints [
83].
Equation (6) presents the system throughput as a function of arrival rates and buffer sizes in the OQN context. Similarly, Equation (7) demonstrates the throughput as a function of network population and buffer sizes in CQN. In this study, we will maintain constant arrival rates for OQN and network population for CQN to determine the optimal buffer allocation for each node, aiming to maximise throughput. However, we will conduct various scenarios in both cases, considering different arrival rates, network populations, and compositions to assess their impacts on the system’s overall throughput. It is important to note that the objective function in both cases is subject to constraints. For instance, Equation (8) establishes an upper bound on the total number of buffers allocated due to budget limitations. Additionally, in a steady state, the average queue length should not exceed the buffer sizes of a given node (Equation (9)), and the number of buffers allocated must always be a positive integer with a minimum value of one (Equation (10)).
The optimisation problem of buffer allocation, known for its NP-Hard nature, poses a significant challenge in finding an optimal solution in a reasonable computation time [
26,
84]. Over the years, various solution approaches have been developed to tackle this intricate problem. Traditional methods, such as mathematical modelling and optimisation algorithms, have been widely employed to derive optimal buffer allocation strategies. However, due to the complexity and combinatorial nature of the problem, these approaches often require more computation and may only sometimes yield optimal solutions. As a result, simulation optimisation approaches have gained prominence in recent years. By combining the power of simulation and optimisation techniques, these approaches provide robust solutions with high accuracy, making them increasingly popular for addressing the buffer allocation optimisation problem.
The buffer allocation problem in this study was optimised using the built-in optimisation engine of AnyLogic software. The authors utilised a personal computer with 8GB of RAM and a core i3 7th Gen processor to execute the simulation experiments. The maximum iteration count was set to 5000 runs to ensure convergence towards optimal results.
Figure 4 comprehensively illustrates the sequential steps in this study’s AnyLogic optimisation solution approach.
The OptQuest optimisation engine in AnyLogic simulation software solves larger combinatorial problems by efficiently navigating search trees and identifying fruitful directions towards optimal solutions. It utilises advanced techniques such as genetic algorithms, simulated annealing, and tabu search to explore the solution space and prune unproductive paths [
85].
4. Case Study—Numerical Experiments
To demonstrate buffer allocation problems, this section presents a case study that utilizes numerical experiments to investigate and evaluate the proposed methodology in inter-facility material transfer operations and outbound logistics processes. These experiments aim to validate the effectiveness and efficiency of the methodology in optimising the buffer allocation problem within the intra-organisational material flows and the corresponding outbound logistics activities. We conducted the case study using a manufacturing facility with multiple workstations as the testbed. Applying the analytical method based on GEM, we formulated a finite queueing network model that considered various parameters, such as arrival rates, service times, and buffer capacities. By solving the GEM equations, we obtained analytical expressions for performance measures. Simultaneously, we developed a simulation model to replicate the dynamics of the facility and conducted multiple numerical experiments to collect data on system performance metrics. The results from the analytical method and simulation were compared to assess the effectiveness of the proposed methodology in optimising buffer allocation. This empirical illustration demonstrates the practical application of the proposed methodology. It showcases its efficacy in addressing the buffer allocation problem in the context of intra-organisational material flows and outbound logistics processes.
4.1. Inter-Facility Material Transfer Process
SM is a specialised steel manufacturing firm that produces steel rebars for the domestic market. To manufacture steel billets, which serve as the primary inputs for producing steel rebars, SM employs an electric arc furnace (EAF) system. The billet production process involves utilising various materials, including scrap materials, hot briquette iron (HBI), and specific additives such as carbon, chromium, and deoxidisers such as aluminium or silicon. Daily, SM acquires scrap materials from the domestic market, which are stored in different forms and purities in the SM storage yard. These forms include heavy metal scrap and shredded scrap. Additionally, SM incorporates HBI and direct reduced iron (DRI) as raw materials in the billet production process. The selection of billet grades is determined by evaluating the quality and percentage of the scrap materials. To simplify our discussions in subsequent sections, we will utilise the notations A, B, and C to represent heavy metal scrap, shredded scrap, and HBI/DRI materials.
In the context of SM, the production of steel billets takes place on a daily basis, using materials A, B, and C. These materials are transported each day by a fleet of homogeneous trucks to the facility situated within the billet plant.
Figure 5 illustrates the inter-facility material transfer operations undertaken to meet the demand requirements of the billet plant.
Figure 6 presents the layout of the storage area and the billet plant, visually representing their spatial arrangement.
As depicted in
Figure 6, except for the loading and unloading service stations, all other stations are shared among the three types of material trucks. Truck servicing follows a first-come, first-served basis. The node details and average service time for each service station are presented in
Table 1, denoted in minutes. Additionally,
Table 2 provides the weight of a full truckload of each material.
Each service station within the system is managed by a single server, implying that each station has the capacity to serve only one truck at any given time.
In order to evaluate and optimise inter-facility material transfer operations, this study conducted performance measurements and buffer allocation optimisation exercises. The experiments were designed based on scenarios identified in
Table 3. Additionally, various parameters were considered, including the cost of buffer space (C
i) and the maximum allotted budget for buffer space allocation (β), with values of EUR 200 and EUR 5000, respectively. All experiments were conducted to simulate a 24 h time-period operation.
4.1.1. Development of the DES Model for Inter-Facility Material Transfer Operations
The DES model for the inter-facility material transfer operations was developed based on the abovementioned details, as illustrated in
Figure 7. Anylogic University edition (version 8.8.1) simulation software was employed. The model represents all service stations (nodes) as finite queue capacity service blocks. The decision variables, namely the buffer sizes for each node, were introduced as parameters in the optimisation configuration. The objective function was formulated to calculate the total throughput of the system. The trucks carrying three different types of materials were incorporated into the system through three sources. Each service block is coupled with a single resource pool to ensure the single-server phenomenon. Furthermore, the model accounted for the blocking phenomenon known as blocking after service (BAS), which occurs when a truck will not leave the station even after servicing if there is no space in the next node.
4.1.2. Optimal Buffer Allocation
Table 4 presents the optimal buffer allocations obtained for each scenario investigated in the study. The allocations differ across scenarios, indicating the significance of tailoring buffer allocation strategies to specific operational conditions.
A uniform truck allocation was employed for all material types in the initial three scenarios. Furthermore, an analysis of the results reveals that an increase in the number of trucks allocated to each material type and the total number of trucks corresponded to an increase in throughput, quantified as the total tons of materials transferred. However, it is worth noting that this increase in throughput was accompanied by a potential decrease in the average throughput per truck. In scenarios 4 and 5, different truck allocations were implemented for each material type while maintaining a constant total of 15 trucks. Consequently, distinct optimal buffer allocations were obtained for these scenarios, resulting in disparate throughput values. These findings underscore the influence of the number and allocation of trucks on buffer optimisation and subsequent material transfer efficiency in inter-facility operations.
Furthermore, in scenario 4, we observed a near-uniform allocation of buffers across the service stations, except for a single station. This finding underscores the significance of conducting a comprehensive analysis to determine each case’s optimal buffer allocation strategy.
Additionally, noteworthy observations can be drawn from scenarios 1 and 2. Despite an increase in the total number of trucks employed (from 9 to 12), the total number of buffers utilised decreased from 22 to 21. This suggests that an increase in truck quantity does not necessarily correlate with a proportional increase in buffer requirements. Similarly, in scenario 4, where the total number of buffers used was 18, an equivalent number of trucks in scenario 5 necessitated 25 buffers to achieve the optimal throughput. This discrepancy highlights the varying impact of truck allocations and compositions on buffer requirements, considering that certain service stations are exclusively utilised by trucks carrying a single product type. In contrast, others are shared among multiple product types.
The decision to set the maximum iterations to 5000 was carefully considered to strike a balance between ensuring convergence towards optimal results and computational efficiency. The figures presented in
Appendix A (
Figure A1,
Figure A2,
Figure A3 and
Figure A4) demonstrate that convergence typically occurs well before reaching the maximum of 5000 iterations, indicating the efficiency of the proposed method in achieving optimal solutions in most experimental examples. However, to account for potential problem size and complexity variations, we adopted a conservative approach by setting a maximum of 5000 iterations. For larger-scale problems, the convergence might occur more slowly than in the experimented examples, making the maximum iteration limit crucial in capturing longer convergence trends. This choice ensures the robustness of our approach, enabling effective handling of a broader range of problem sizes and complexities.
These findings accentuate the importance of considering the interplay between truck allocations, the composition of product types, and their corresponding buffer allocations when optimising material transfer operations. A holistic approach is essential to comprehensively assess and determine each unique scenario’s most effective and efficient buffer allocation strategy.
4.1.3. Utilisation Rates Comparison
Efficient utilisation of servers is paramount to optimising system performance and ensuring smooth operations in closed queueing networks. The utilisation rate, representing the ratio of time a server is busy to the total time, is a crucial performance indicator for evaluating server allocation strategies.
Table 5 presents the comparison of server utilisation rates obtained through the GEM-based analytical method and simulation model. The results demonstrate the accuracy and reliability of the GEM-based analytical method in estimating server utilisation rates, with average differences between the analytical method and simulation models ranging from 1% to 6% in scenario one and from 1% to 7% in scenario 5, except for nodes 6 and 7, where the utilisation rates are close to 1. However, it should be noted that when utilisation rates approach 1, the GEM-based method may exhibit slightly higher deviations from the simulation results. These findings highlight the effectiveness of the GEM-based method in calculating server utilisation rates in finite closed queueing networks while acknowledging the need for caution when utilisation rates are close to 1.
Analysing the scenarios provides valuable insights into the system dynamics and potential bottlenecks. Scenario 1 demonstrates a relatively stable system, exhibiting lower utilisation rates than scenario 5. In scenario 5, several nodes approach or reach utilisation rates near 1.0, indicative of bottleneck situations where system performance stagnates. Notably, scenario 5 (18 trucks) exhibits different truck quantities and compositions compared to scenario 1 (9 trucks), which has the fewest number of trucks.
Additionally, consistent observations reveal that the last three nodes consistently exhibit low utilisation rates. This suggests the need for process redesign to balance the workload across both streams rather than exert excessive pressure on certain segments. Potential solutions include:
Subdividing specific processes into two sub-processes,
merging idle stations to consolidate workloads, or
employing additional servers to alleviate the burden on busy servers.
These interventions can contribute to better resource utilisation, reduced congestion, and improved overall system efficiency. Further analysis and targeted optimisation strategies should be considered to address these observed bottlenecks and enhance the performance of the queueing network.
4.1.4. Sensitivity Analysis
Sensitivity analysis is a valuable tool used in decision-making processes to evaluate the influence of various factors on the outcomes of a system or model. Sensitivity analysis provides insights into the robustness and stability of decision-making frameworks by systematically varying these factors and observing the resulting changes in the outputs. In this section, we employ sensitivity analysis techniques to investigate the impact of critical factors on our decision-making model. Through this analysis, we aim to identify the most influential factors, understand their effects on decision outcomes, and enhance the reliability and effectiveness of our decision-making processes.
In this sensitivity analysis section, we examine the variations in utilisation rates, throughput, and buffer allocations resulting from introducing an additional server to node 6 in scenarios 1 and 3. We aim to assess the impact on the system’s performance by introducing this additional server. The results of this analysis are presented in
Table 6, which provides insights into the changes observed in utilisation rates, throughput, and buffer allocations under these specific conditions. Through this examination, we gain a deeper understanding of how the system responds to introducing an extra server and its implications for overall system performance in scenarios 1 and 3.
Table 6 unveils intriguing insights regarding the factors influenced by the introduction of an additional server in node 6. In scenario 1, the results demonstrate a slight increase in throughput, reaching 3126 tons, representing a modest improvement of approximately 0.8% compared to the original case. Conversely, scenario 3 exhibits a more substantial boost in throughput, surging to 4199 tons with the inclusion of a dual server in node 6, signifying a significant increase of approximately 14% from the baseline. Furthermore, both scenarios showcase a reduction in the total number of servers utilised and a decrease in the utilisation rate of node 6. These findings emphasise the interconnected nature of design factors within the system, whereby modifications in certain factors influence other performance metrics to varied extents. Consequently, this analysis provides valuable insights for informed decision making when designing system topologies, enabling practitioners to consider the interplay of factors and their implications on system performance.
4.1.5. Comparison of Analytical and Simulation Methodologies
Analytical and simulation methodologies offer unique advantages when comparing methodologies for studying buffer allocations and system performance. Analytical methodologies provide fast and cost-effective analysis, with mathematical equations and formulas enabling quick calculations of system performance measures. They offer closed-form solutions and accessible interpretation, making them suitable for straightforward systems and providing valuable insights. In contrast, simulation methodologies excel at modelling complex and dynamic systems, capturing real-world complexities and uncertainties more accurately. Although more time consuming and resource intensive, simulation models allow for detailed process flows, interactions, and random variations, providing flexibility and realism. The choice between methodologies depends on research goals, system complexity, available resources, and the trade-off between accuracy, time, and cost. Researchers often employ both methods to gain comprehensive insights into buffer allocations and system performance. This integrated approach ensures a balance between efficiency, accuracy, and the ability to capture the intricacies of the studied systems.
4.2. Out-Bound Logistics Process
SM organisation serves two customer types: Standard customers and spot customers. Standard customers, often large manufacturing companies, have long-term contracts, such as contracts of affreightment with SM, ensuring a stable flow of predictable orders. SM can efficiently plan and allocate resources for these known orders, benefiting from established trust and coordination. In contrast, spot customers have short-term or one-time orders, often with short notice and varying requirements. SM must promptly respond to these demands, adapting quickly to their unpredictability. Despite their shorter engagement, spot customers contribute to SM’s growth and resource optimisation.
The outbound logistics process for customer trucks carrying steel rebars within the manufacturing company’s premises begins with the gate entry process. This involves recording the entry of trucks and initiating necessary security and safety checks. For spot order trucks, an additional process of creditworthiness evaluation is conducted between the gate entry and the order processing process. This evaluation verifies the customer’s ability to pay back by assessing their financial stability and credit history.
Figure 8 shows the flowchart of the whole outbound logistics process for both standard and spot customers.
After the gate entry and creditworthiness evaluation, the subsequent processes are initiated. Process 2, order processing, involves receiving and verifying the customer’s order for steel rebars, confirming pricing and payment details, and generating an order confirmation. The order processing process for standard and spot customers differs in terms of time requirements. The order processing process takes an average amount of time for standard customers whose orders are previously known to the company. Since the company has established relationships with standard customers and has their order details on record, the process can be streamlined and expedited. However, when it comes to spot customers who place orders on short notice or for one-time purchases, the order processing process tends to take longer. The company must allocate additional time for spot customers, as their orders require thorough verification and may require additional documentation and checks. The extended processing time for spot customers is necessary to ensure these special orders’ accuracy, compliance, and proper handling.
In process 3, steel rebar preparation, the requested steel rebars are retrieved from the inventory or production area within the manufacturing company and checked for compliance with the required specifications. This process includes packaging and labelling and focuses on securely packaging the steel rebars for transport. This may involve bundling the rebars, placing them on pallets, and labelling the packages with relevant information. In process 4, documentation and compliance, the necessary shipping documents, invoices, and paperwork are prepared, ensuring compliance with internal procedures and legal requirements. Process 5, loading and staging, entails loading the packaged steel rebars onto the customer trucks within the manufacturing company’s premises. This process includes utilising appropriate equipment, such as forklifts or cranes, to ensure the safe and efficient loading of the rebars onto the trucks. Process 6 involves inspecting the loaded trucks to verify that the steel rebars are adequately secured and that the trucks are in suitable transportation conditions. Any identified concerns or issues are addressed during this truck inspection process.
The truck dispatch process is the final step in outbound logistics, closely coupled with the delivery confirmation. The truck dispatch process comes into play once the trucks carrying steel rebars are loaded and ready to depart from the manufacturing company’s premises.
Table 7 shows the average service time of sub-processes of outbound logistics operations.
4.2.1. DES Model for SM’s Outbound Logistics Operation
A DES model, as illustrated in
Figure 9, has been constructed to emulate the outbound logistics process of SM. This simulation model incorporates a finite OQN framework within the Anylogic software platform. Subsequently, optimisation configurations are inputted into the model to ascertain the optimal buffer sizes for each service station.
The simulation-optimisation experiments conducted in this study involve using various customer arrival rates to represent distinct scenarios. The identified customer arrival rates and the ratio between standard and spot customers are presented in
Table 8. The objective of the optimisation study is to maximise the throughput, which corresponds to the number of successfully fulfilled customer orders. A constraint is imposed with the budget limit for buffer spaces, with each space costing EUR 100. The total budget allocated for buffer spaces is EUR 8000. The optimisation experiment is executed over 12 h, with a maximum of 1000 iteration runs. These experimental settings align with the methodology employed in the previous section.
4.2.2. Optimal Buffer Allocation for Outbound Logistics Process
Table 9 presents the optimal buffer allocations obtained across the previously identified scenarios. Several noteworthy observations can be drawn from the results presented below. In scenarios 1 and 2, where the arrival rate of trucks remains the same but the customer composition differs, different buffer allocations are observed while maintaining the same throughput. On the other hand, scenario 3 exhibits an optimal uniform buffer allocation. In the final scenario, a higher throughput and lower order processing time are achieved; however, this is accompanied by significantly greater utilisation of buffer spaces. As a result, it is crucial for logistics practitioners in the SM domain to consider various factors such as arrival rate, customer order composition, order processing time, and buffer costs in order to manage their operations effectively.
4.2.3. Cycle Time Comparison with Analytical and Simulation Method
Table 10 presents the estimated cycle time (sojourn time) for various scenarios using the analytical method and simulation model. The difference between the results is calculated using Equation (12), ranging between approximately ±4% and ±8%. The table demonstrates that the analytical method, employing the GEM approximation, offers reliable and robust solutions for analysing finite OQNs. The accuracy and effectiveness of the analytical method make it a valuable tool for studying and evaluating system performance in real-world applications.
4.3. Managerial Insights
The analysis of buffer allocation in a steel manufacturing company’s inter-facility material transfer operation and outbound logistics process reveals several key managerial insights. Firstly, the number and allocation of trucks significantly impact buffer optimisation and material transfer efficiency. By increasing the number of trucks allocated to each material type and the total number of trucks, the overall throughput in total tons of materials transferred can be increased. However, a potential decrease in the average throughput per truck may accompany this increase. Therefore, managers must carefully balance the number of trucks allocated to different material types to achieve optimal performance.
Different optimal buffer allocations were obtained when different truck allocations were implemented for each material type while maintaining a constant total number of trucks, leading to varying throughput values. This finding highlights the importance of considering the quantity and composition of trucks when determining buffer requirements. Furthermore, the analysis reveals that an increase in the total number of trucks does not necessarily result in a proportional increase in buffer requirements. Different scenarios with equivalent numbers of trucks may require significantly different buffer allocations, depending on the truck composition and the specific service stations involved. Thus, managers should consider the specific characteristics of each scenario and carefully analyse the interplay between truck allocations, customer order compositions, and buffer requirements to optimise material transfer operations.
The analysis also emphasises the significance of resource utilisation rates in identifying potential bottlenecks and improving system performance. By evaluating the utilisation rates of servers at various nodes or service stations, managers can pinpoint areas with high levels of occupancy that may hinder system efficiency. In particular, the analysis identifies nodes where utilisation rates approach or reach 1.0, indicating potential bottlenecks. These bottlenecks signal the need for reallocation or additional resources to ensure optimal system performance. Strategies such as process subdivision, workload consolidation, or adding servers can help balance the workload and enhance resource utilisation, reducing congestion and improving overall system efficiency.
Sensitivity analysis further enhances decision making by assessing the impact of critical factors on system outcomes. The analysis demonstrates the influence on throughput, buffer allocations, and utilisation rates by introducing an additional server in specific scenarios. The results indicate that including an extra server can improve throughput and decrease server utilisation, thereby enhancing overall system performance. These findings highlight the system’s interconnected nature of design factors and provide valuable insights for informed decision making when designing system topologies.
Overall, the managerial insights derived from the analysis underscore the importance of considering factors such as truck allocations, customer order compositions, buffer requirements, and resource utilisation rates in optimising inter-facility material transfer operations and outbound logistics processes. By carefully evaluating and balancing these factors, managers can effectively manage their operations, improve system performance, and enhance overall efficiency in the steel manufacturing company’s supply chain.
5. Conclusions
This paper has presented a framework for optimising buffer allocation in inter-facility material transfer and outbound logistics processes. The study has demonstrated the significance of strategic buffer placement and sizing in improving supply chain efficiency and performance. By utilising finite queueing networks and the generalised expansion method (GEM), the framework allows for the modelling, analysis, and optimisation of buffer allocations in manufacturing systems.
Resource utilisation rates are crucial in identifying bottlenecks and improving system efficiency. Evaluating server utilisation at different nodes allows managers to allocate resources effectively by employing process subdivision or workload consolidation strategies.
This study’s significance lies in its pioneering approach to buffer allocation problems, considering both ends of logistics processes. While previous studies focused on single logistics processes, this research integrates inter-facility transfer and outbound logistics, paving the way for a holistic examination of buffer allocation in complex setups. Future research can explore integrated analyses encompassing inbound, intra, and outbound logistics to understand buffer allocation across the entire logistics network comprehensively.
The study has specific limitations that require acknowledgement. Firstly, it concentrates on a single-server environment, overlooking the intricacies of multi-server setups. Secondly, assuming homogeneous jobs or customers may only partially represent real-world situations where variations exist. Thirdly, the study adopts a first-come, first-serve queue discipline, neglecting potential priority-based service considerations. Lastly, the assumption of uniform buffer costs at all stations disregards the possibility of varying costs at different locations. These limitations indicate potential areas for future research to enhance the applicability of buffer allocation models.
In conclusion, this study provides valuable insights into the buffer allocation process for manufacturing companies to optimise inter-facility material transfer and outbound logistics. The proposed framework offers opportunities for improving operational efficiency and overall performance in manufacturing supply chains.


