Article

A Numerical Study on the Influence of Transverse Grooves on the Aerodynamic Performance of Micro Air Vehicles Airfoils

1
Research Institute of Aero-Engine, Beihang University, Beijing 102206, China
2
College of Aeronatutics and Aerospace, Airforce Engineering University, Xi’an 710038, China
3
School of Mechanical Engineering, Xi’an Jiaotong University, Xi’an 710049, China
4
Aeronautical Engineering Institute, Civil Aviation University of China, Tianjin 300300, China
*
Author to whom correspondence should be addressed.
Submission received: 2 October 2023 / Revised: 2 November 2023 / Accepted: 14 November 2023 / Published: 15 November 2023
(This article belongs to the Topic Fluid Mechanics)

Abstract

:
Micro Air Vehicles (MAVs) airfoils usually operate at low Reynolds number conditions, where viscous drag will consume a large amount of propulsion power. Due to the small dimensions, many drag reduction methods have failed, resulting in limited current research. To develop an effective method of reducing viscous drag, transverse grooves were placed on the surface of MAVs airfoils in this study, and a numerical investigation was implemented to uncover the corresponding flow control law as well as the mechanism. Research has shown that transverse grooves have an impact on the drag and lift of airfoils. For drag, properly sized transverse grooves have the effect of reducing drag, but under high adverse pressure gradients or when the continuous arrangement of grooves is excessive, the optimal drag reduction effect achieved by the grooves is weakened, and even the drag increases due to the significant increase in pressure difference. In severe cases, it may also cause strong flow separation, which is not conducive to MAV flight. For lift, the boundary vortex in the groove has the ability to reduce the static pressure near the groove. However, high adverse pressure gradients or too many grooves will thicken the boundary layer and increase the blockage effect, resulting in a large static pressure on the grooved side of the airfoil (with an increase in drag). From the perspective of circulation, the static pressure changes on the suction and pressure surfaces have opposite effects on lift. Considering the comprehensive aerodynamic performance of the airfoil, we designed a high lift-to-drag ratio airfoil with grooves, which increased the lift-to-drag ratio by 33.747% compared to the smooth airfoil. Based on the conclusions, we proposed preliminary design criteria for grooved airfoils, providing guidance for subsequent research and applications.

1. Introduction

By virtue of smaller size and lower speed (<15 cm, 10–20 m/s [1]), Micro Air Vehicles (MAVs) are more portable, more covert, and quieter. Consequently, they have extensive applications in both military and civilian contexts [2,3]. In comparison to rotary-wing and flapping-wing configurations, fixed-wing MAVs, characterized by their higher lift–drag ratios, offer the greatest endurance [4] for a given mass. However, fixed-wing MAVs often operate within low Reynolds number flow regimes, where flow is predominantly governed by viscous drag, leading to a substantial depletion of propulsion energy.
To mitigate drag and enhance airfoil performance, researchers have undertaken extensive investigations from both active and passive control perspectives. These techniques include plasma actuation [5,6,7], drag-reducing riblets [8,9,10], flexible wings [11,12,13], and airfoil optimization [14,15,16]. Although having been proven effective in controlling the flow of airfoils, most of these techniques are still not perfect in reducing the viscous drag of small-scale airfoils owing to complicated structures, extra energy cost, or shortage of drag reduction ability. At present, the mainstream research direction in improving the aerodynamic performance of MAVs is focused on airfoil shape, such as directly modifying individual geometric parameters of the airfoil or changing the profile through machine learning and other means. For example, O’meara et al. [17] modified the chord length of the airfoil to suppress the generation of separation bubbles at low Reynolds numbers. Mueller et al. [18] systematically studied the influence of leading-edge geometry on the flight performance of micro air vehicles through wind tunnel tests and made optimizations. Hosseini et al. [19] used machine learning to obtain the optimal configuration of two airfoils placed in series in the incoming flow, and Gad-el-Hak et al. [20] directly optimized the geometric shape of the airfoil using genetic algorithms. However, these methods can only target specific airfoils and have a long research period. In contrast, the modeling method [21,22] can quickly be designed for different working conditions. Then, to develop modeling flow control techniques characterized by a simple structure, low cost, and strong ability of drag reduction seems essential to improve the aerodynamic performance of MAVs airfoils.
Characterized by a simple structure and low manufacturing cost, transverse grooves have been proven efficient in reducing the drag near a solid surface. Transverse grooves represent surface structures that are recessed into the wall and extend perpendicularly to the mainstream flow. Their shapes mimic the occurring dunes found in low-entropy forms in the natural world, typically adopting a V-shape [23]. NASA has proposed the “Micro-Air Bearings” theory (MABS) to elucidate the drag reduction mechanism of this approach [24], such as in Figure 1. In this theory, the stable boundary vortices generated in the grooves act analogously to bearings, rotating and replacing the friction between fluid and the wall with that of the fluid and vortex to reduce viscous drag. Moreover, NASA [24] also pointed out that low-speed flow near the wall will stagnate on the windward side of the groove head and separate on the leeward side (Figure 1, right), resulting in pressure drag. Finally, the drag reduction effect of the transverse groove depends on the difference between the reduced viscous drag and the increased pressure drag.
Subsequently, a quantity of experiments and numerical simulation studies conducted by scholars reaffirmed this theory [25,26,27]. Following these developments, transverse grooves have been widely used in the field of engineering. For instance, Wang et al. [28] designed grooves on Mixed Flow Fans, achieving a reduction of approximately 38% in turbulent energy near the leading edge and a simultaneous reduction in noise. Liu et al. [29] introduced transverse grooves within petroleum pipelines, effectively reducing velocity gradients near the wall and obtaining a drag reduction benefit of 3.21% in a water tunnel. Furthermore, Lufthansa Group [30] applied grooved thin films to a Boeing 777 aircraft, resulting in a reduction of approximately 1% in drag, which means annual fuel savings of approximately 370 tons per aircraft per year. In addition, in 2022, Li et al. [31] combined their work with previous research results to derive a mathematical relationship between the size of transverse grooves and their drag reduction rate. This drag reduction model reduced the design cycle of transverse grooves greatly.
Based on the previous findings, it can be concluded that the transverse grooves may be effective in reducing the viscous drag of MAVs airfoils. Since the flow structures of low-Reynolds number MAVs airfoils are quite different from that of traditional large-Reynolds number flow conditions, it is believed that the influence of transverse grooves on the MAVs airfoils must be different from that on traditional airfoils. However, there is a paucity of relevant research regarding the application of transverse grooves on the airfoils of MAVs. To help establish a transverse groove-based viscous drag reduction technique, this paper applies transverse grooves to MAVs airfoils, and the impact of groove placement strategies on low-Reynolds number airfoil aerodynamic performance as well as the underlying physical mechanisms were numerically investigated. Section 2 introduces how to arrange grooves at different positions on the NACA2412 low-speed airfoil based on the drag-reduction model, as well as the numerical simulation methods used. Section 3 and Section 4 respectively outlines research on the position and range of groove arrangement, and provides potential physical mechanisms behind the changes in aerodynamic parameters through the analysis of velocity and vorticity fields. Finally, a grooved airfoil with optimal aerodynamic performance, characterized by the highest lift–drag ratio, was designed. Based on the above conclusions, we propose preliminary design criteria for grooved MAV airfoils (Section 4). Section 5 summarizes the entire article.

2. Simulation Setup

2.1. Geometric Model Selection

In order to approximate the authentic operating conditions of low-altitude flight for MAVs, numerical simulations employed air as the flowing material, with an environmental temperature of 298.15 K and an atmospheric pressure of 1 atm. For fixed-wing MAVs, the selections of airfoils often lean towards well-established low-speed airfoils. Therefore, the NACA2412 airfoil (chord length, c = 100 mm) was chosen. This particularly non-symmetric airfoil exhibits superior aerodynamic performance even during low-speed flight [32]. The typical Reynolds number for MAVs is on the order of 10 5 [11]. Considering that the chord length was 100 mm, finally, the incoming velocity was set as 15 m/s, and the Reynolds number for the airfoil was approximately 1.03 × 10 5 , which conformed to the operational conditions of MAVs. The primary objective of this study was to employ transverse grooves to reduce viscous drag, and as such, the grooves were placed in regions of the airfoil surface where pressure drag was slight. To investigate the influence of adverse pressure gradients (APG) on flow, Clauser [33] defined the Clauser parameter β to quantify the magnitude of adverse pressure gradients, as depicted in Equation (1).
β = δ * τ w d P d x
In Equation (1), δ * represents the displacement thickness of the boundary layer, τ w denotes the local shear stress, and d P / d x represents the pressure gradient along the streamwise direction (positive for adverse pressure gradients and negative for favorable pressure gradients). This parameter was employed in our study to assess the extent of adverse pressure gradients. Figure 2 illustrates the distribution of β on the suction and pressure surfaces of the NACA2412 airfoil under the aforementioned flight conditions. Due to the tendency for airfoil flow separation at low angles of attack (AOA) under low Reynolds numbers [11], the angle of attack of the airfoil in Figure 2 is merely 2 degrees.
It can be observed that near the airfoil leading and trailing edges, both the suction and pressure surfaces exhibit high values of β, indicating the presence of large pressure drag in these regions (β > 2 [34]). To minimize interference and facilitate research, the chord length of the airfoil was evenly divided into four segments, spanning from 20% to 80% of the chord length, and sequentially designated as the “Front(F),” “Middle(M),” “Rear(R),” and “Tail(T)” sections. Grooves would be positioned on the corresponding suction and pressure surfaces in these designated locations, as depicted in Figure 3. The adverse pressure gradient in these areas was not significant.
For the transverse V-shaped symmetrical grooves, the most critical geometric parameters are aspect ratio (W/H) and depth (H) (shown in Figure 1). When the aspect ratio of the groove is approximately 2, the boundary vortex structure within the groove is most stable, which is conducive to drag reduction [35]. The selection of groove depth was guided by the Transverse Groove Drag Reduction Model [31], which builds upon the stability of boundary vortices, deriving quantitative relationships among the local Reynolds number, groove dimensions, and drag reduction rate from the vortex dynamics. It allows to directly obtain the groove depth corresponding to the highest drag reduction rate based on the local Reynolds number. The derivation process did not fully consider the impact of strong turbulence, and the model only has high accuracy at low Reynolds numbers ( 1.09 × 10 4 5.44 × 10 5 ), which is suitable for the working condition in our research. Due to the fact that the kinematic condition for boundary vortex stability, i.e., the induced velocity equals the migration velocity, is still valid, and the research operating conditions are within the scope of the literature, in subsequent research, all grooves maintained the aspect ratio of 2, and the grooves’ initial depths were collectively determined by the local Reynolds number and the Transverse Groove Drag Reduction Model. Furthermore, taking into account the research findings on the influence of adverse pressure gradients on the reduction of drag [36,37,38], a slight adjustment was made to the initial depths of the grooves based on the Clauser parameter β. Specifically, we conducted flow simulations on inclined plates and extended the relationship between slip velocity, dimensionless velocity, depth of grooves, and β. Finally, the new slip velocity was reintroduced into the drag reduction equation, and the optimal drag reduction size of the groove under the adverse pressure gradient was obtained. This adjustment ultimately yielded the groove depths utilized in the study.

2.2. Solving Methods for Flow Simulations

The principle of fluid dynamics necessitates adherence to three fundamental conservation laws: the law of mass conservation, the law of momentum conservation (expressed through the Navier–Stokes equations), and the law of energy conservation. Their respective mathematical expressions are denoted by Equations (2)–(4):
ρ t + x i ρ u i = S m
t ρ u i + x j ρ u i u j = p x i + τ i j x j + ρ g i + F i
ρ T t + div ρ u T = div k C p grad T + S T
In the provided equation, ρ represents fluid density, t denotes time, x i represents the length in the i-direction, u i corresponds to the velocity components in the i-direction, and S m stands for a user-defined source term. The variable p signifies the static pressure of the fluid element, τ i j denotes the stress tensor on the element’s surface, g i and F i respectively represent the gravitational force and external volumetric forces in the i-direction, C p is the specific heat capacity, T represents the static temperature, k is the fluid heat transfer coefficient, and S T accounts for internal heat generation within the fluid and viscous dissipation. These conservation equations, along with various other fluid dynamic equations, collectively form a set of nonlinear partial differential equations using numerical methods to approximate analytical solutions.
When simulating the flow near the grooves, DeGroot et al. [39] conducted a comparative analysis between the numerical methods of Reynolds Averaged Navier–Stokes (RANS) and Direct Numerical Simulation (DNS). The findings revealed that the RANS method not only was cost-effective but also met the required accuracy. Furthermore, the work by Wokoeck et al. [40] demonstrated that, in comparison with experimental results, the RANS method also could effectively simulate the realistic flow around airfoils. Consequently, in this study, the RANS approach was employed for flow simulation computations. Within the RANS, the velocity is decomposed into time-averaged velocity and instantaneous velocity, introducing Reynolds stress terms in the equations. It is necessary to employ turbulence models to close the system of equations. Shome et al. [41] compared the experimental results and evaluated the accuracy of the k-omega SST model in predicting parameters such as airfoil pressure, lift, and drag coefficient at low Reynolds numbers, believing that it is suitable for MAVs. Combining their research and considering the sensitivity of the k-omega SST model to flow separation and the capability to accurately capture near-wall flow characteristics [42], it was selected for the numerical simulation.
The transport equations of the model are as follows, where P k and P ω are the generating terms, and k and ω are turbulent kinetic energy and dissipation coefficient, respectively.
k t + u j k x j = 1 ρ P k β k ω + 1 ρ x j μ + μ t σ k k x j
ω t + u j ω x j = 1 ρ P ω β ω 2 + 1 ρ x j μ + μ t σ ω ω x j
Subsequently, the accuracy of the numerical simulation method was validated in the following sections.

2.3. Computational Domain and Boundary Conditions

For an airfoil, a sufficiently large C-shaped computational domain can effectively mitigate the adverse impact of boundary conditions on the flow [43]. Therefore, the computational domain was established as depicted in Figure 4, with the airfoil positioned at the center of the domain. The shortest distance from the airfoil trailing edge to each boundary of the computational domain was 15 times the chord length, fully satisfying the computational requirements [44]. The size of the fixed wing MAV is relatively small, and we consider that its airfoil has little variation in spanwise direction. Therefore, a two-dimensional grid was used, and the calculation was also two-dimensional.
In Figure 4, the inlet velocity was set at 15 m/s, the outlet pressure was maintained at 0 Pa (gauge pressure), and the airfoil surfaces were treated as no-slip wall boundaries. Structured quadrilateral grids were generated using the commercial software ICEM 18.2, with a first-layer grid height of 0.001 mm (the y + value less than 1), aiming to fulfill the computational requirements of the k-omega SST model while accurately capturing geometric variations in the normal direction of grooves. Additionally, uniform grid refinement was implemented in the streamwise direction of the grooves to ensure the accuracy of the flow simulation near the grooves. Ultimately, the mesh achieved a minimum angle of 43.3 degrees and a Jacobian Ratio minimum value of 0.876, indicating that the mesh exhibits favorable orthogonality and possesses overall high quality. This meticulously crafted mesh was employed for pressure-based implicit computations using the RANS method within the commercial software Fluent 18.2. Due to the selected cruising state for the calculation conditions and stable flow, we adopted a steady state calculation.

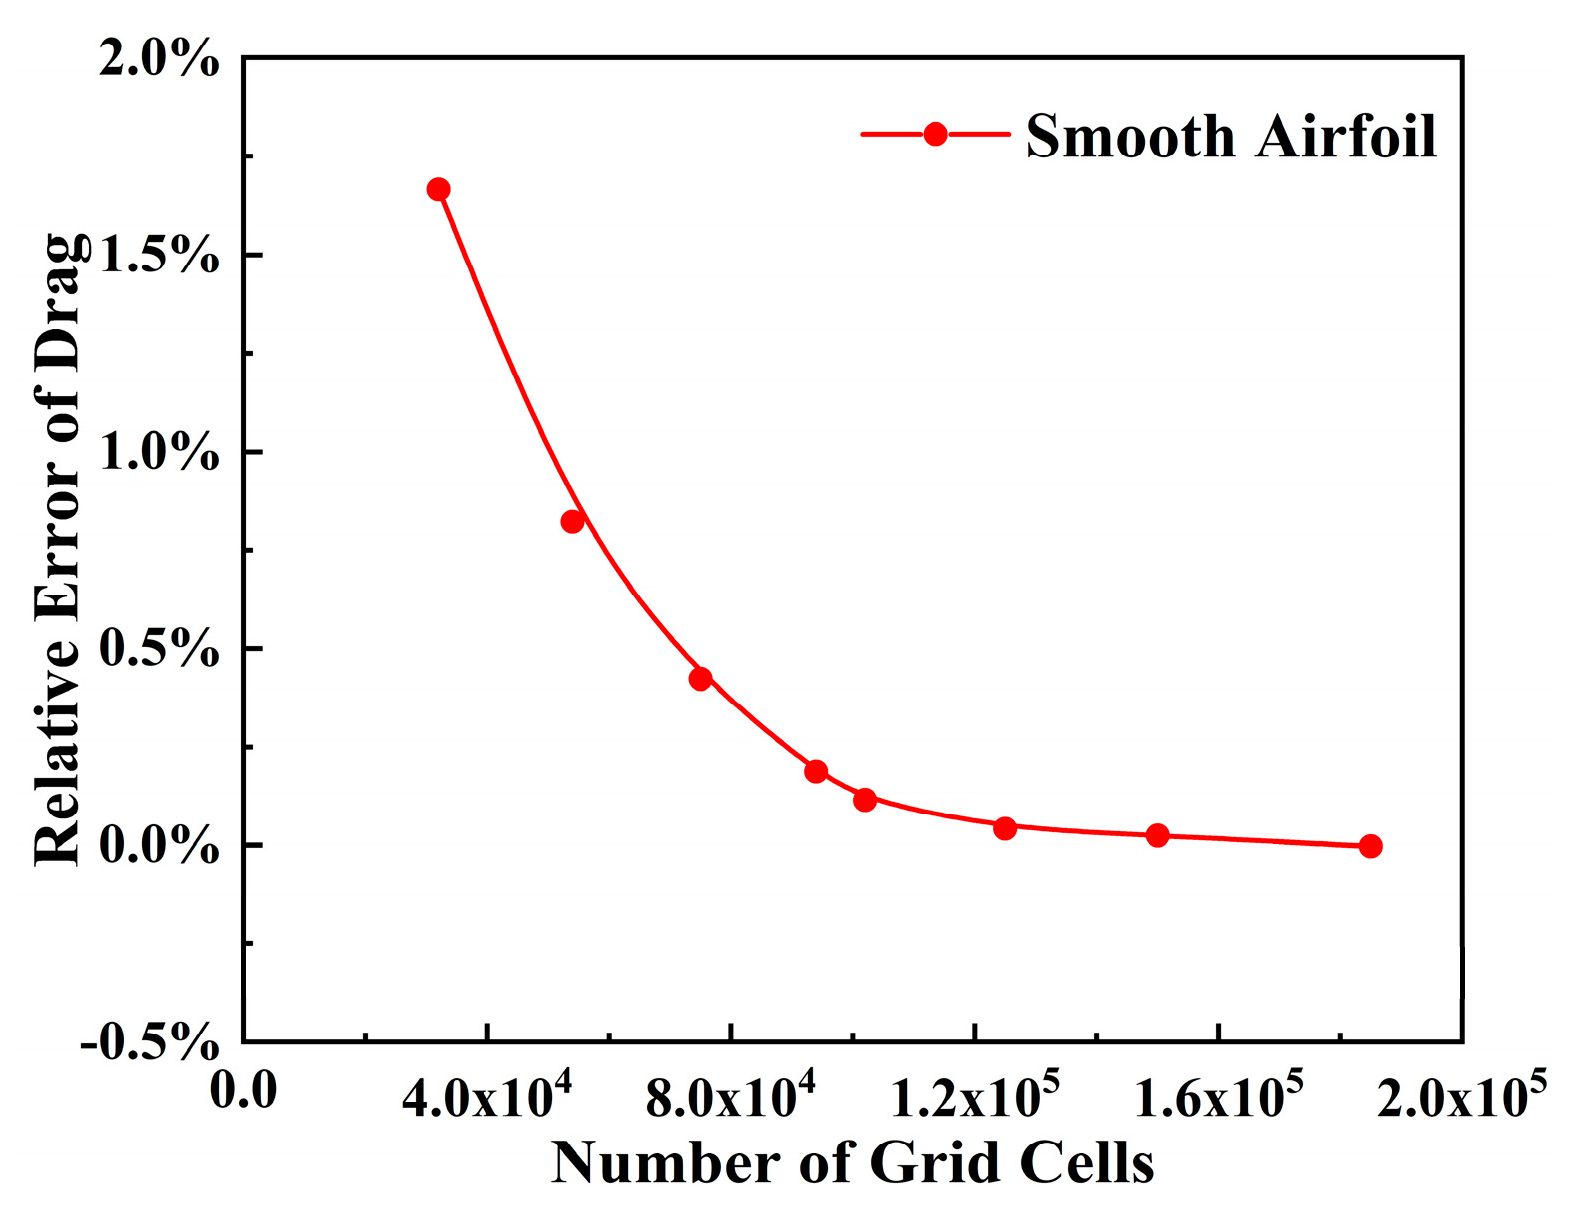
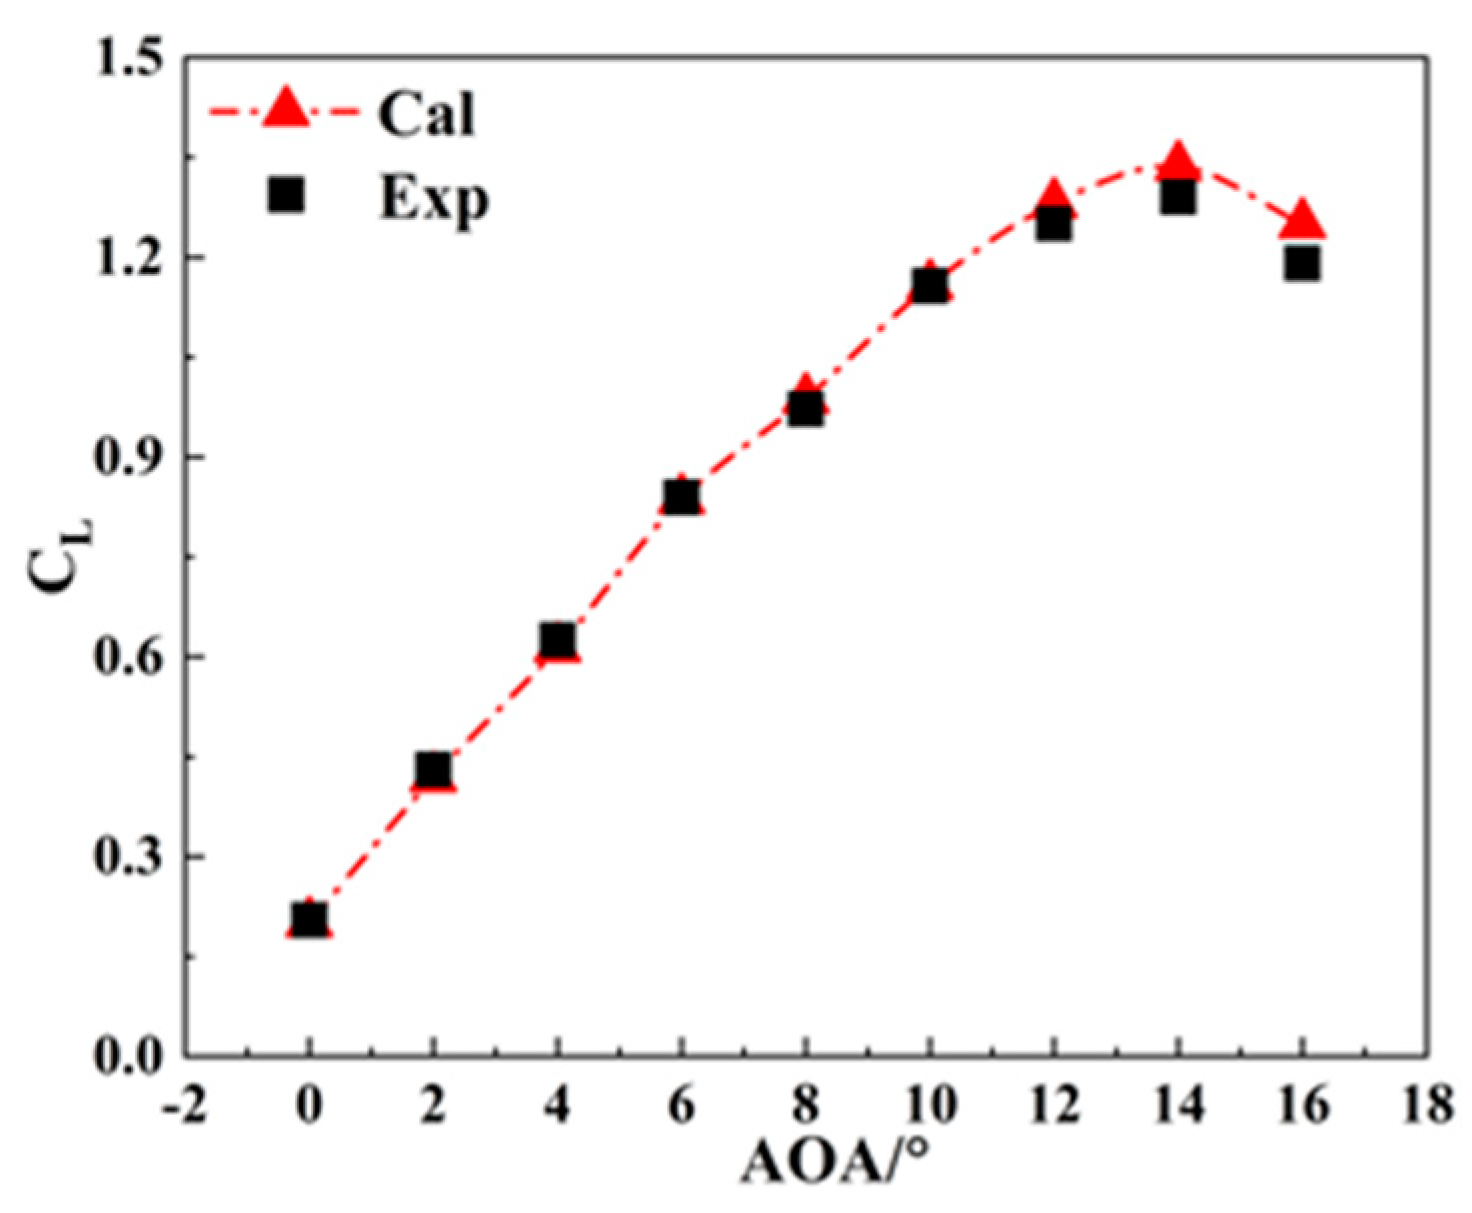
2.4. Validation of Grid Independence and Computational Accuracy

In order to enhance computational efficiency while ensuring accuracy, grid independence validation was conducted. Figure 5 presents the relative variation in total drag of the airfoil under different levels of grid refinement. It can be observed that when the number of grid cells exceeds 100,000, the relative change in drag remains below 0.5%. Consequently, the grid with approximately 100,000 total nodes was ultimately chosen for the subsequent accuracy validation of simulation, with grid cell counts ranging from 800,000 to 1.2 million in cases where the airfoil featured grooves.
Figure 6 illustrates the lift coefficients of the airfoil at various angles of attack using the numerical methods mentioned above and compares them with the experimental results of the NACA2412 airfoil at low Reynolds numbers [45].
It can be observed that within the range of 0 to 16 degrees of angle of attack, the computational results exhibit a notable agreement with the experimental data. Particularly noteworthy is the fact that the deviation in lift coefficient for cases with small angles of attack does not exceed 1%. This confirms that the numerical computation and grid partitioning methods employed in this study can exactly reflect the aerodynamic performance of the airfoil. Therefore, the simulation methods were adopted for subsequent research.

3. Effect of Grooves Position on Aerodynamic Performance of Airfoil

In order to improve the flight performance of MVAs, it is imperative to increase the battery capacity while concurrently reducing the energy consumption per unit time of propulsion. The former is intricately linked to the lift coefficient of the airfoil, whereas the latter is contingent upon the drag coefficient of the airfoil. The expressions for the lift coefficient and drag coefficient are delineated in Equations (7) and (8), as follows:
C L = L 1 2 ρ V 2 c
C D = D 1 2 ρ V 2 c
In the equations, “L” represents lift, “D” denotes drag, and “c” stands for the characteristic length of the airfoil. The comprehensive impact of both lift and drag on aerodynamic performance is expressed through the airfoil lift–drag ratio (CL/CD). To contrapuntally distribute grooves over a wide range, it is significant to investigate the influence of groove placement. Consequently, we positioned grooves on both the suction and pressure surfaces corresponding to the front, middle, rear, and tail sections, as illustrated in Figure 3, to systematically explore their aerodynamic performance. The depths of the grooves are determined collectively by the local Clauser parameter (β), the local Reynolds number, and the drag reduction model (Li et al.) [31]. When the span is within 5 mm, we assume that the local Reynolds number and β remain relatively constant, and the groove depth (H) in this segment remains consistent. The specific groove depths for each segment are illustrated in Figure 7. The number of grooves is the range divided by the width (rounded off).
We placed these transverse grooves on various segments of the airfoil suction and pressure surfaces, as depicted in Figure 3. The aerodynamic performance parameters of the airfoil are presented in Figure 8. In this figure, the blue dashed line represents the data corresponding to the smooth airfoil without grooves for reference.
From Figure 8a, it is evident that in most cases, the airfoil with grooves experiences a significant reduction in drag coefficient. Moreover, regardless of whether the grooves are placed on the suction or pressure surface, those positioned closer to the leading edges result in a lower drag coefficient for the airfoil. Therefore, in subsequent designs, it is advisable to place grooves close to the front portion of the airfoil. In comparison to the suction surface, grooves on the pressure surface exhibit relatively similar drag reduction capabilities across different positions, with variations occurring primarily in the rear section. In terms of drag reduction effectiveness, placing grooves on the front section of the suction surface yields the smallest drag coefficient and the highest drag reduction rate. Additionally, when grooves are positioned in the middle section of the suction surface, the drag coefficient of the airfoil is still lower than that corresponding to the pressure surface. However, when grooves are positioned in the rear section of the suction surface, their drag reduction capabilities notably diminish compared to the grooves in the same location on the suction surface. And when grooves are placed in the tail section of the suction surface, the drag reduction effect rapidly deteriorates, so much so that the drag coefficient even surpasses that of the smooth airfoil, which is detrimental to flight. This observation indicates that after placing grooves in positions characterized by significant adverse pressure gradients (as illustrated in Figure 2), the benefits of grooves in reducing viscous drag can no longer offset the increase in pressure-induced drag, leading to a rapid increase in overall drag. Consequently, this region was avoided when subsequently arranging the grooves.
From the perspective of lift coefficient (Figure 8b), when grooves are placed on the pressure surface, the change in the airfoil lift coefficient is little, with variations not exceeding 1% in magnitude compared to the smooth airfoil. However, when grooves are positioned on the pressure surface, there is a more pronounced alteration in the lift coefficient. When grooves are located on the front section of the suction surface, there is a substantial increase in the airfoil lift coefficient. In contrast, when grooves are situated in the middle section, although the lift coefficient remains higher than that of the smooth airfoil, the increment is less than half of that observed in the front section. Furthermore, when grooves are placed in the rear or tail section of the suction surface, the aerodynamic performance of the airfoil deteriorates rapidly, causing the lift coefficient to drop below that of the smooth airfoil.
Due to the relatively stable lift coefficient and drag coefficient, as depicted in Figure 8c, there is little variation in the lift–drag ratio when grooves are placed at different locations on the pressure surface. These results exhibit higher lift–drag ratios greater that of the smooth airfoil, and indicate that the aerodynamic performance of the airfoil can experience a modest improvement when appropriately sized grooves are placed on any segment of the pressure surface. For grooves on the suction surface, owing to the smaller drag coefficient and larger lift coefficient, the airfoil lift–drag ratio can be significantly enhanced when grooves are positioned in the front and middle segments. The effects of placing grooves on the rear and tail segments of the suction surface, conversely, lead to a rapid deterioration in the airfoil aerodynamic performance, especially in the tail section. On the whole, the variations in the drag coefficient largely align with the trends observed in groove-induced drag reduction under adverse pressure gradients [37,38], where groove drag reduction rate becomes greater under mild adverse pressure gradients (Figure 2, Front and Middle sections of the suction surface), but deteriorates as the adverse pressure gradient approaches a strong magnitude (β = 2) (Figure 2, Rear and Tail sections of the suction surface). Due to the absence of significant pressure gradients on the pressure surface, the drag reduction effects observed in various segments are similar. In order to investigate the reasons behind the impact of grooves at different locations on the suction surface on the lift coefficient, Figure 9 compares the pressure distributions near the suction surface.
The pressure contours in Figure 9b–f show that the grooves on the suction surface have almost no effect on the pressure distribution near the pressure surface. As illustrated in Figure 9a, when grooves are positioned in the front or middle section of the airfoil, the pressure distribution on the suction surface closely resembles that of the smooth airfoil, with pressure values reduced only in the vicinity of the grooves and their downstream regions. This is evident in Figure 9c,d as an expansion of the deep blue region (pressure below −80 Pa) compared to the smooth airfoil (Figure 9b). The source of this pressure drop is the stable rotating vortex in the groove. The high-energy vortex in the groove injects momentum into the low-energy fluid near it, causing an increase in radial velocity and pressure drop [46,47]. So, this phenomenon only occurs in the grooves and their downstream vicinity. The pressure drop on the suction surface implies an increase in lift, resulting in an increase in the lift coefficient. Conversely, when grooves are placed in the rear or tail section of the suction surface, as indicated by the green and purple dashed lines in Figure 9a, the overall pressure on the suction surface increases. This is because arranging grooves in areas with high adverse pressure gradients such as the rear or tail section can quickly thicken the boundary layer near the rear of the suction surface (as shown in the enlarged image of Figure 9e,f, where the blue low-speed area near the airfoil increases), which strengthens the blockage effect and increases the overall pressure on the suction surface. In Figure 9e,f, this is manifested as a reduction in the blue regions representing low pressure to varying degrees, signifying a decrease in lift and a substantial drop in the lift coefficient.

4. Effect of Grooves Range on Aerodynamic Performance of Airfoil

Purposefully arranging appropriately sized grooves on the front or middle section of the suction surface, as well as on the front, middle, rear, or tail section of the pressure surface, can enhance the aerodynamic performance of the airfoil. However, the mere simultaneous placement of these grooves on the same airfoil does not guarantee the attainment of maximum aerodynamic benefits at low Reynolds numbers. It remains uncertain whether grooves situated on the rear section contribute to the aerodynamic performance of the airfoil due to the interactions among the grooves when the range of groove placement on the suction surface is extensive. To address these issues and ultimately design an airfoil with the highest lift–drag ratio, an investigation into the impact of widely placed grooves on the airfoil surface is imperative.
Because of the severe deterioration of airfoil aerodynamics resulting from the tail section grooves on the suction surface, we restricted the large-range grooves to the front-middle and front-middle-rear sections of the suction surface. Grooves on the pressure surface can be continuously positioned in the front-middle, front-middle-rear, and front-middle-rear-tail sections. After arranging these grooves, the aerodynamic parameters of the airfoil were as depicted in Figure 10.
Comparing with Figure 8, in most cases, the lift–drag ratios of the airfoils were dramatically improved with the large-range of grooves (Figure 10c). For instance, when grooves are placed in the front-middle section of the suction surface, the drag coefficient decreased to 0.016 and the lift coefficient increased to 0.381, resulting in an increased lift–drag ratio of the airfoil to 23.635 (smooth airfoil: 20.733). From both a drag reduction and lift enhancement perspective, this project is markedly superior to the sole placement of grooves in one segment of the suction surface. Analyzing the trends of the black dots in Figure 10c, it can be observed that when large-range grooves are positioned on the pressure surface, airfoil with grooves placed in the front-middle section and front-middle-rear-tail section exhibit higher lift coefficients compared to only one section. The lift coefficient increases from around 21.5 to 22. However, for the grooves in the front-middle-rear section on the pressure surface, although their lift–drag ratios show improvement compared to the smooth airfoil, they remain lower than the grooves placed solely in the front section of the pressure surface. This phenomenon is attributed to the unexpected fact that as the number of grooves increases on the airfoil, the drag coefficient actually rises (in the front-middle-rear-tail section project, the increase in lift-to-drag ratio is mainly owed to an increase in the lift coefficient).
To understand why a large number of grooves can weaken the overall drag reduction effect, an exploration of the underlying reasons is imperative. Moreover, it is noteworthy that Figure 10 lacks data for the scenario where grooves are placed in the front-middle-rear section on the suction surface. This omission is due to the emergence of strong non-steady-state phenomena during calculations. As depicted in Figure 11, the overall drag coefficient is elevated and exhibits continuous fluctuations, rendering the calculation results challenging to analyze comprehensively.
In order to investigate the reasons for the increase in drag coefficient and why the above non-steady-state phenomena occured, we analyzed the velocity and vorticity contours of the flow.
Comparing Figure 12a–c, it becomes evident that when grooves are extensively placed on the suction surface, certain separation structures manifest near the grooves that are unlikely to appear at high Reynolds numbers and low angles of attack. For instance, when grooves are arranged on the front-middle section (Figure 12b) or front-middle-rear section (Figure 12c) of the suction surface, wavy, low-speed regions (depicted in blue) appear in proximity to the grooves. In the enlarged local images, it is evident that there are obvious shedding vortices near the grooves. In the case of the front-middle section, this tendency is less conspicuous; however, when grooves are positioned in the front-middle-rear section, this separation phenomenon extensively occurs near the rear portion of the suction surface. Moreover, the wake region exhibits heightened instability, characterized by the expansion of the blue low-speed region at the trailing edge and the rapid curvature of streamlines. When grooves are exclusively placed in the front section of the suction surface (Figure 12a), almost no such phenomenon is observed. This elucidates why, when grooves are arranged on the front-middle-rear section of the suction surface, the drag coefficient exhibits significant fluctuations with iteration steps. Furthermore, a comparison between Figure 12d,e reveals that when grooves are positioned on the front-middle section of the pressure surface, the blue low-speed region near the rear part of the pressure surface enlarges. This implies an increase in boundary layer thickness near the rear, resulting in elevated drag, aligning with the trends observed in the black dots of Figure 8a. This phenomenon also increases the static pressure on the pressure surface, resulting in an increase in the overall lift coefficient of the airfoil, as shown in Figure 10b. In contrast, when grooves are placed on the front-middle-rear-tail section of the pressure surface, not only does the boundary layer near the tail thicken, but the wake also exhibits mild instability, with minor deviations observed in streamlines near the trailing edge.
From Figure 13, the vorticity near the grooves increases to varying degrees, indicated by the proliferation of regions with strong vorticity (depicted in red). When grooves are only placed in the front section of the suction surface, the change in vorticity distribution is slight. However, when grooves are positioned in the front-middle section of the suction surface, mild fluctuations in vorticity distribution are observed in the vicinity of the airfoil midsection (Figure 13c), but the duration is not long, indicating the onset of weaker flow separation. When grooves are arranged in the front-middle-rear section of the suction surface, a series of detached, bubble-like structures form near the rear part of the suction surface (Figure 13c). This demonstrates the evolution and rupture of separation bubbles, causing highly unstable flow. In Figure 13e,f, when grooves are extensively placed on the pressure surface, the vorticity intensity on the pressure surface increases, particularly near the trailing edge. This signifies an augmented turbulence level. Because the diffusion rate of turbulent vortices greatly exceeds that of viscous vortex diffusion, the boundary layer thickness increases, leading to an elevation in the drag coefficient.
To mitigate the impact of increased turbulence levels, the possibility of discontinuously placing grooves on the airfoil surface was explored. Figure 14 provides a comparative analysis of the variation in aerodynamic parameters of airfoils when grooves are positioned in the front-middle-rear-tail section, front-middle-tail section, and middle-rear section of the suction surface, and the middle-rear section of the pressure surface.
It can be observed that when grooves are absent on the rear section or front-tail section of the pressure surface, the drag coefficient is lower than that of the grooves placed in the front-middle-rear-tail section of the pressure surface. When grooves are positioned on the middle-rear section of the suction surface, the airfoil drag coefficient is lower than that of the smooth airfoil but remains higher than the grooves placed in the front-middle section of the suction surface. From the perspective of lift coefficient, the intermittent placement of grooves leads to an overall reduction in the lift coefficient. However, due to a more significant reduction in drag coefficient, grooves in the front-middle-tail section of the pressure surface yield the highest lift–drag ratio.
From the velocity contours near the airfoil in Figure 15, it can be observed that when grooves are intermittently placed on the front-middle-tail section of the pressure surface, the overall velocity distribution of the airfoil is similar to that of a smooth airfoil without grooves. Due to the reduced interaction between grooves, the wake becomes significantly more stable (as evidenced by the reduced streamline deflection in Figure 15c). In the locally enlarged image of Figure 15f, the distribution of vortices near the pressure surface is more uniform than when the grooves are continuously placed in the front-middle-rear-tail section of the pressure surface (Figure 15e), resulting in a thinner boundary layer and greater stability in the wake region. Consequently, there is a substantial reduction in the drag coefficient. But at the same time, the thinner boundary layer highlights the ability of the grooves themselves to reduce static pressure, resulting in a decrease in static pressure on the pressure surface and a decrease in lift coefficient. From the perspective of comprehensive aerodynamic performance, arranging grooves in the front-middle-tail section of the pressure surface will still increase the lift–drag ratio.
Based on the analysis above, it is evident that by introducing grooves in the front-middle section of the suction surface and the front-middle-tail section of the pressure surface, one can achieve their respective maximum lift–drag ratios. Therefore, the ultimate choice was made to simultaneously incorporate appropriately sized grooves in both the front-middle section of the suction surface and the front-middle-tail section of the pressure surface and then compare their aerodynamic performance with airfoils that have grooves solely on the suction or pressure surface.
As depicted in Figure 16, when grooves are simultaneously incorporated in both the front-middle section of the suction surface and the front-middle-tail section of the pressure surface of the airfoil, there is a substantial reduction in the overall drag coefficient of the airfoil. Furthermore, the lift coefficient is extremely higher compared to airfoils with grooves on only one surface. The combination of lower drag coefficient and higher lift coefficient results in a remarkable enhancement of the lift–drag ratio, increasing from 20.733 for the smooth airfoil to 27.730. This represents an approximately 33.75% improvement in aerodynamic performance, which can greatly improve the endurance of MAVs.
Based on the above conclusions, we summarize the preliminary design criteria for grooved MAV airfoil: the grooves should be arranged as far as possible in the low adverse pressure gradient region of the airfoil surface (β < 0.5), such as near the leading edge. This is because under high adverse pressure gradient, the effect of grooves on drag reduction and lift increase becomes weak, and it is also easy to cause separation, resulting in flight instability. On the other hand, with low pressure gradient, too large a range of grooves can quickly increase the thickness of the boundary layer, offsetting the aerodynamic benefits brought by the grooves. Adopting a discontinuous arrangement at the rear of the airfoil can reduce this effect, further improving the lift-to-drag ratio of the airfoil. These theories have certain guiding significance for the design of grooved airfoils, but the quantification of parameters requires further research in our follow-up work.

5. Conclusions

This study focused on the low-speed NACA2412 airfoil as the research subject, employing numerical simulation techniques to investigate the feasibility of implementing transverse grooves as a drag-reduction structure on the airfoil of the MAV. Additionally, it conducted an analysis of the physical mechanisms underlying the influence of various groove placement schemes at low Reynolds numbers on the lift–drag ratio of the airfoil. Based on the rules, we have designed a grooved airfoil with a high lift–drag ratio and proposed preliminary design criteria for grooved MAV airfoils that have a certain guiding significance for subsequent research. The specific research findings are as follows:
(1)
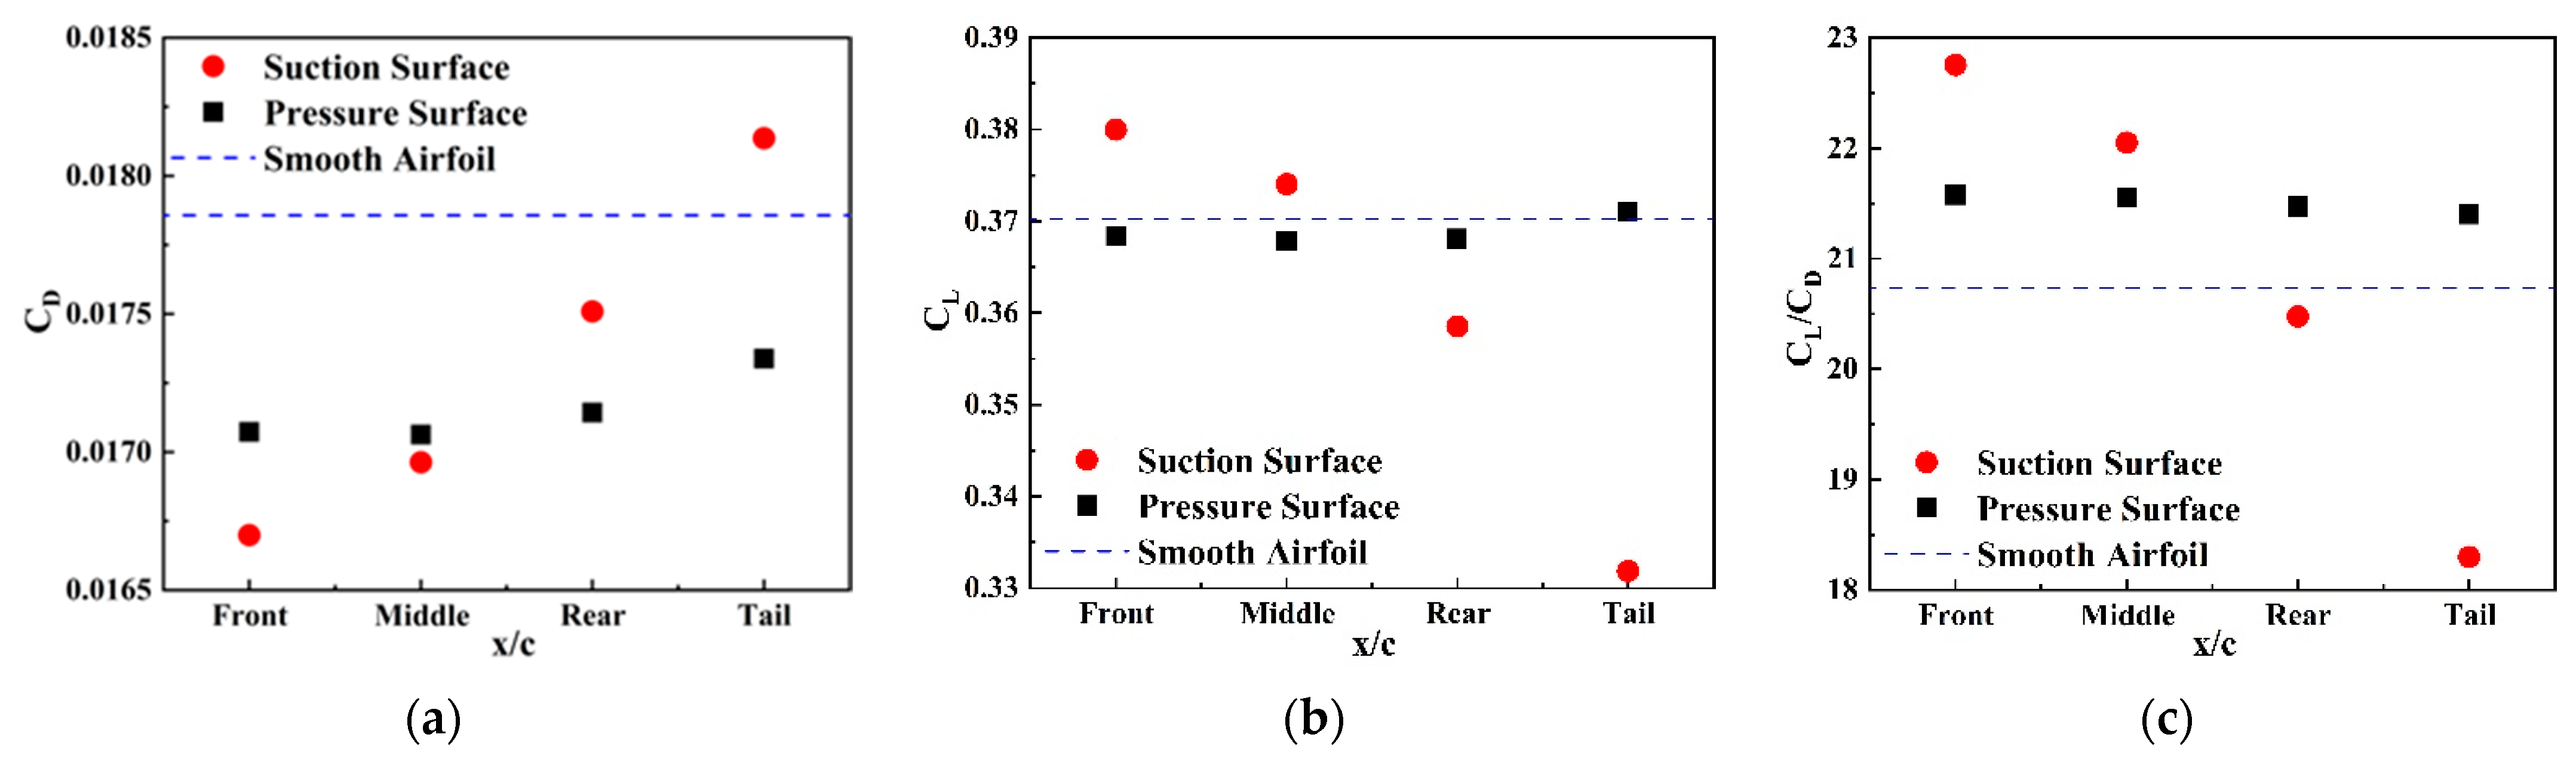
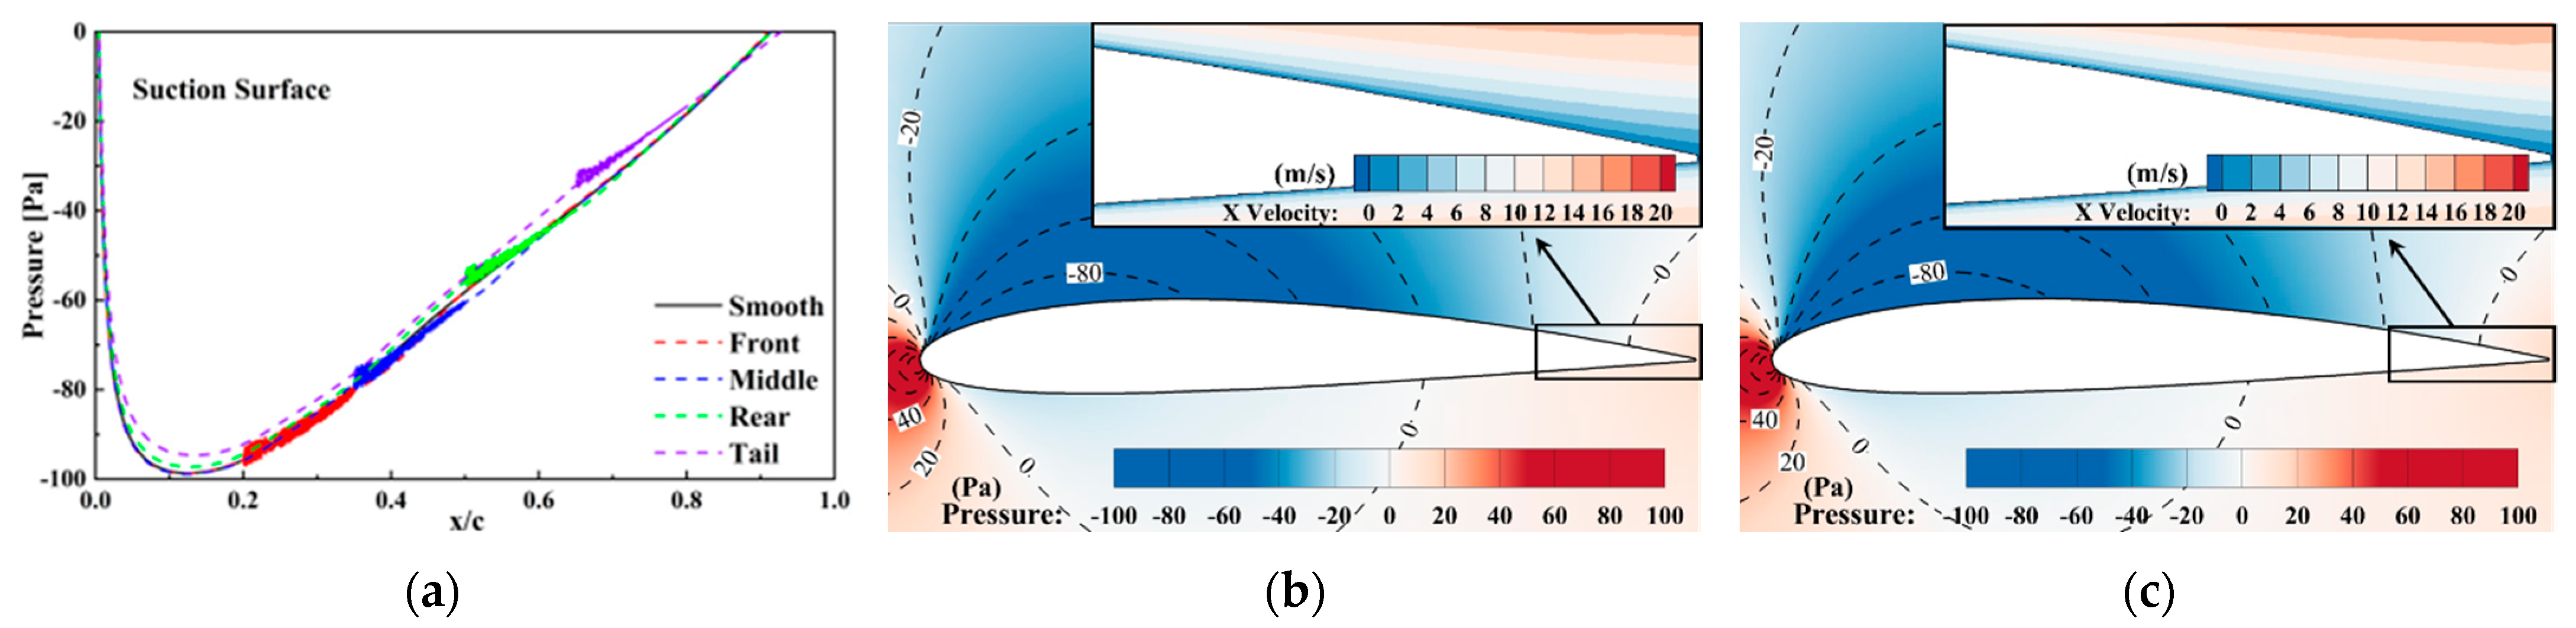
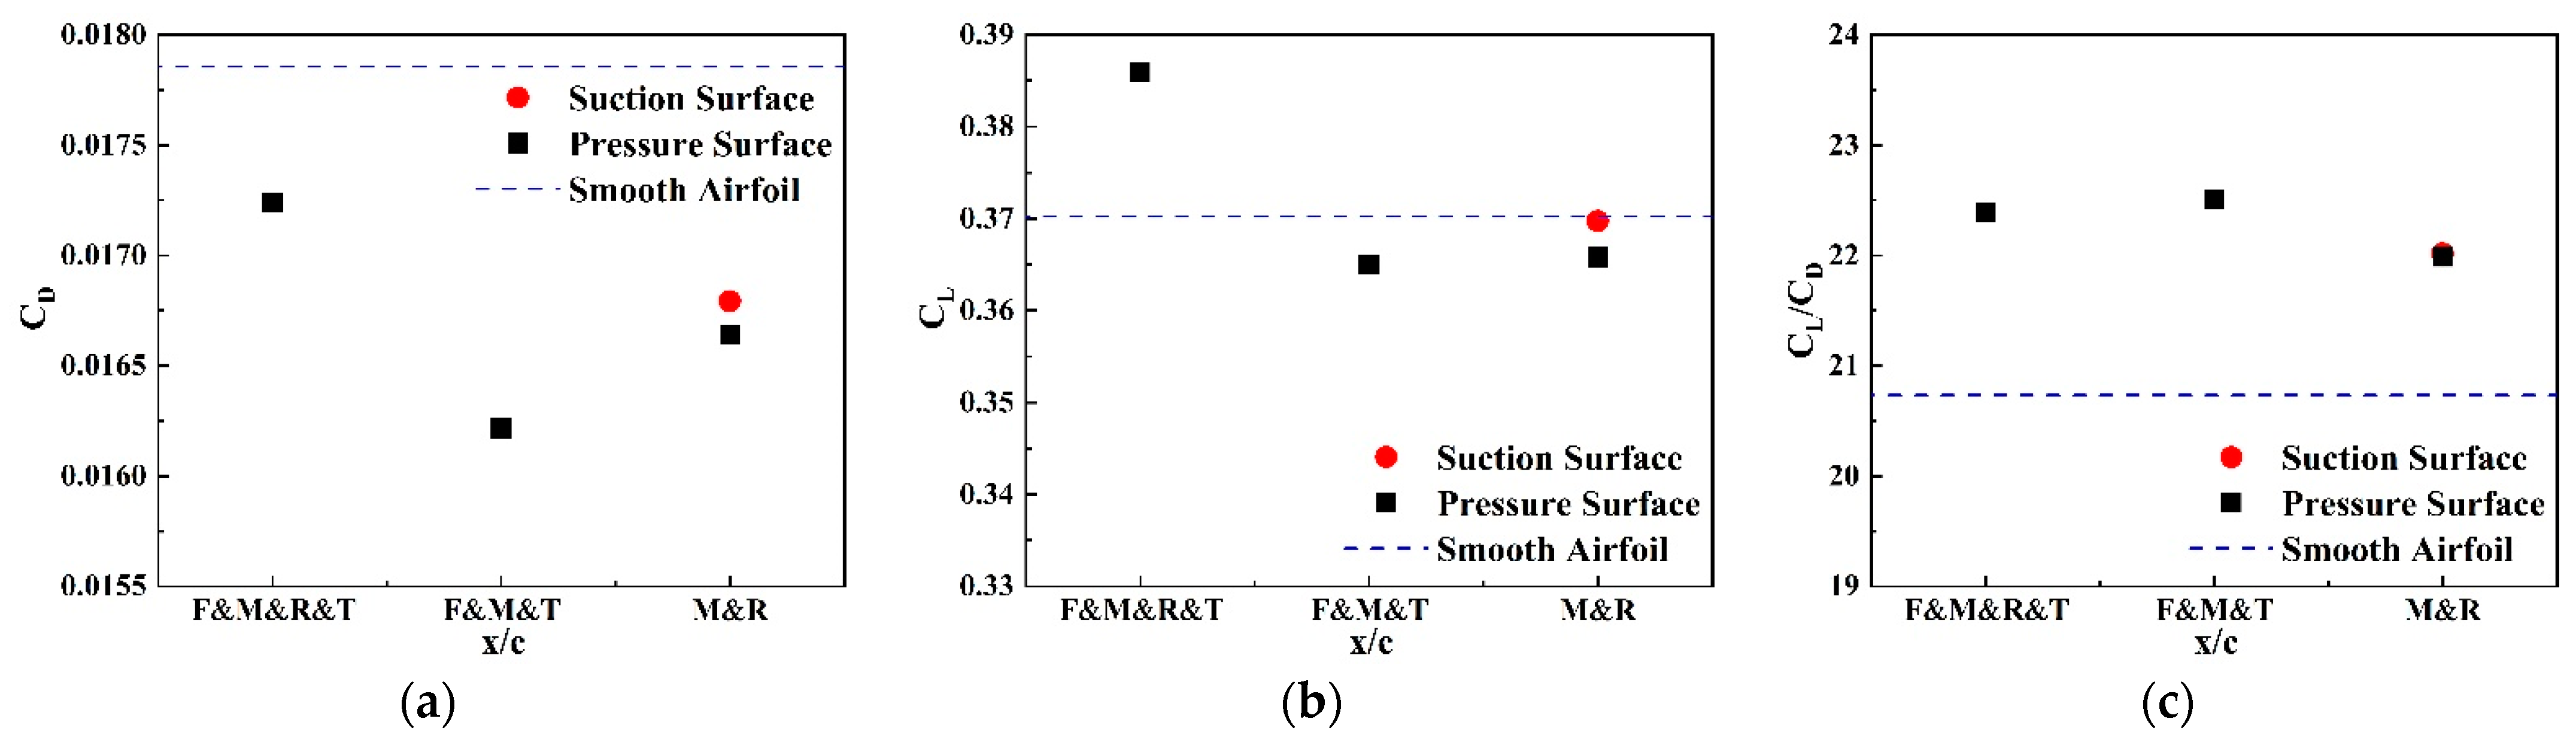
The grooves near the leading edge of the airfoil exhibit lower drag, with the lowest drag coefficient decreasing from 0.0179 to 0.0167 compared to the smooth airfoil. As the groove position moves backwards, the unfavorable pressure gradient will reduce the drag-reduction effect of the grooves. The grooves on the pressure surface have a slight impact on the lift coefficient of the airfoil, whereas the grooves on the suction surface cause a significant change in the lift coefficient. At the front, the ability of the grooves themselves to reduce static pressure will reduce the static pressure on the suction surface and increase lift. As the groove position moves back, the thickening of the boundary layer causes an increase in static pressure on the suction surface, resulting in a decrease in the lift coefficient from 0.380 to 0.332 (smooth airfoil: 0.370). Therefore, the relationship between the lift–drag ratio and groove position is similar to the lift coefficient.
(2)
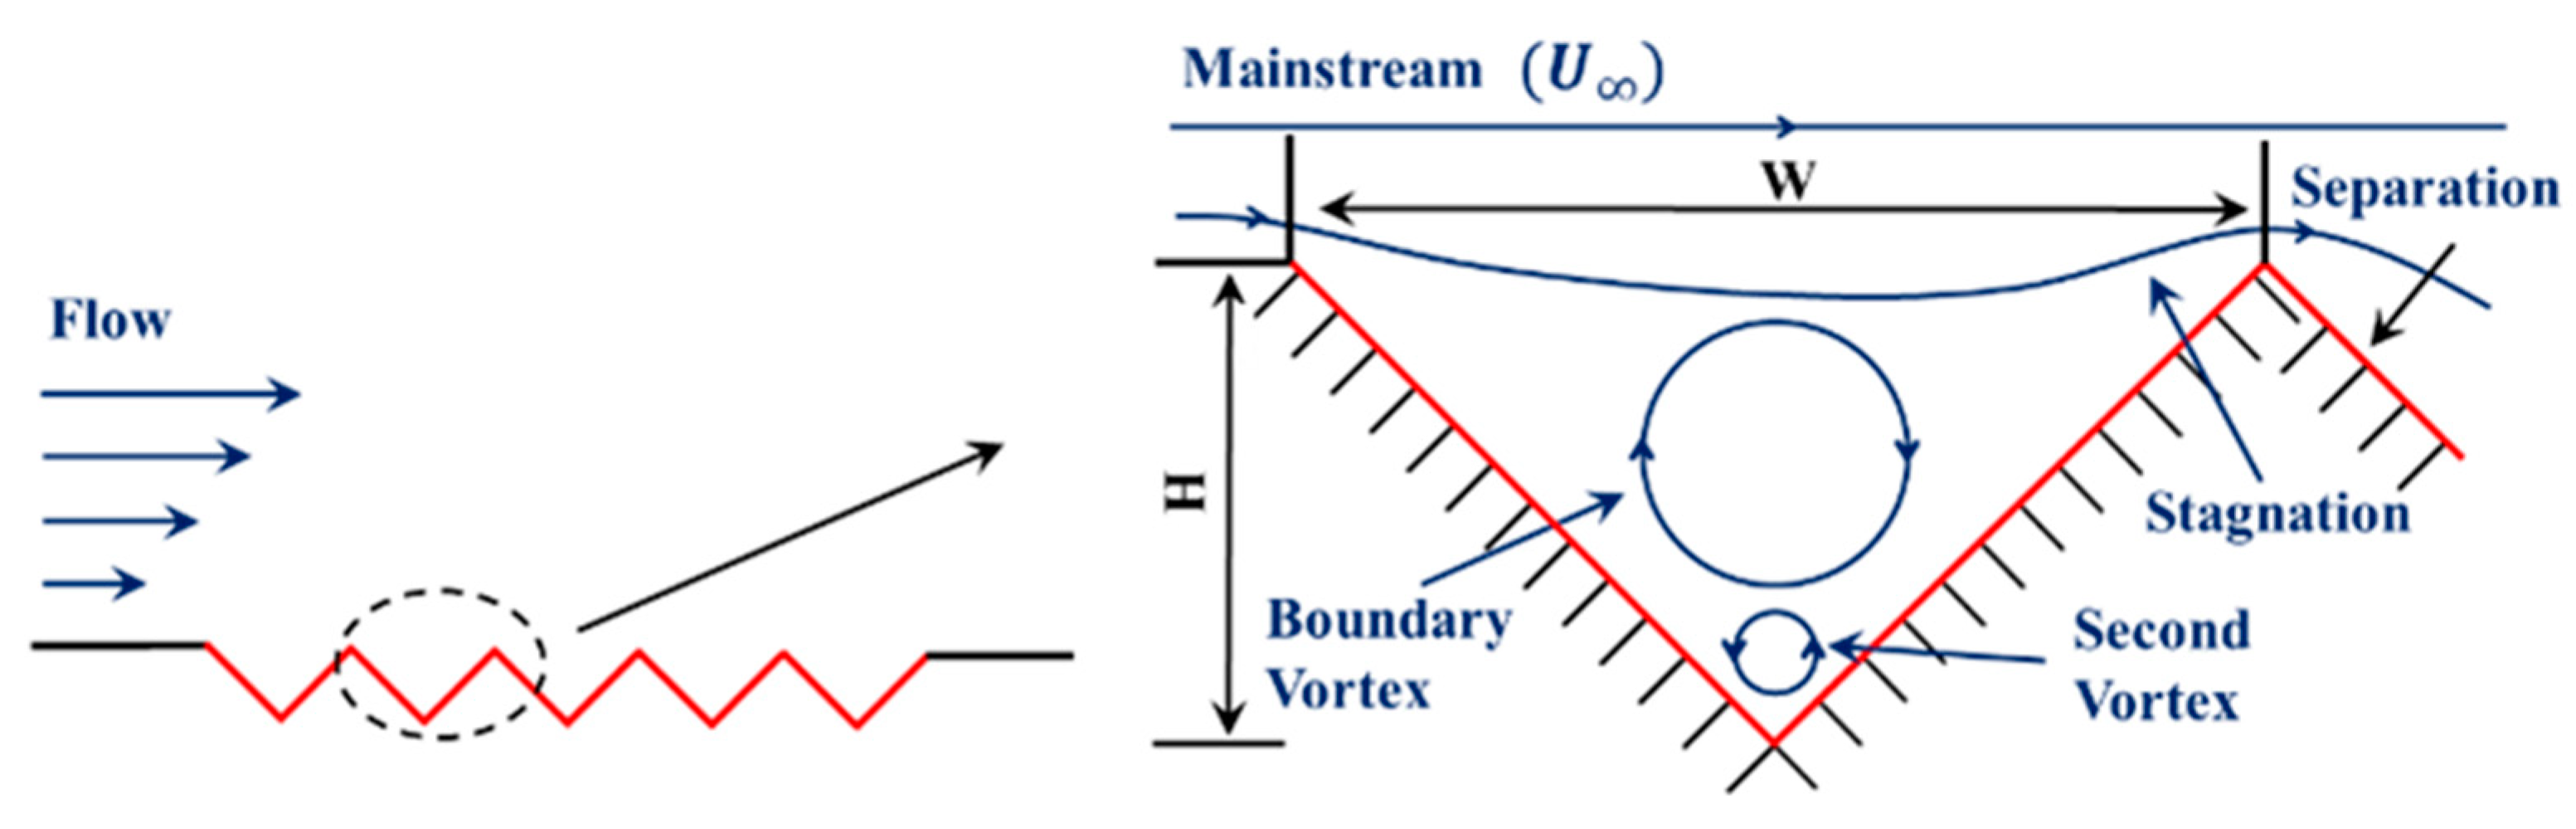
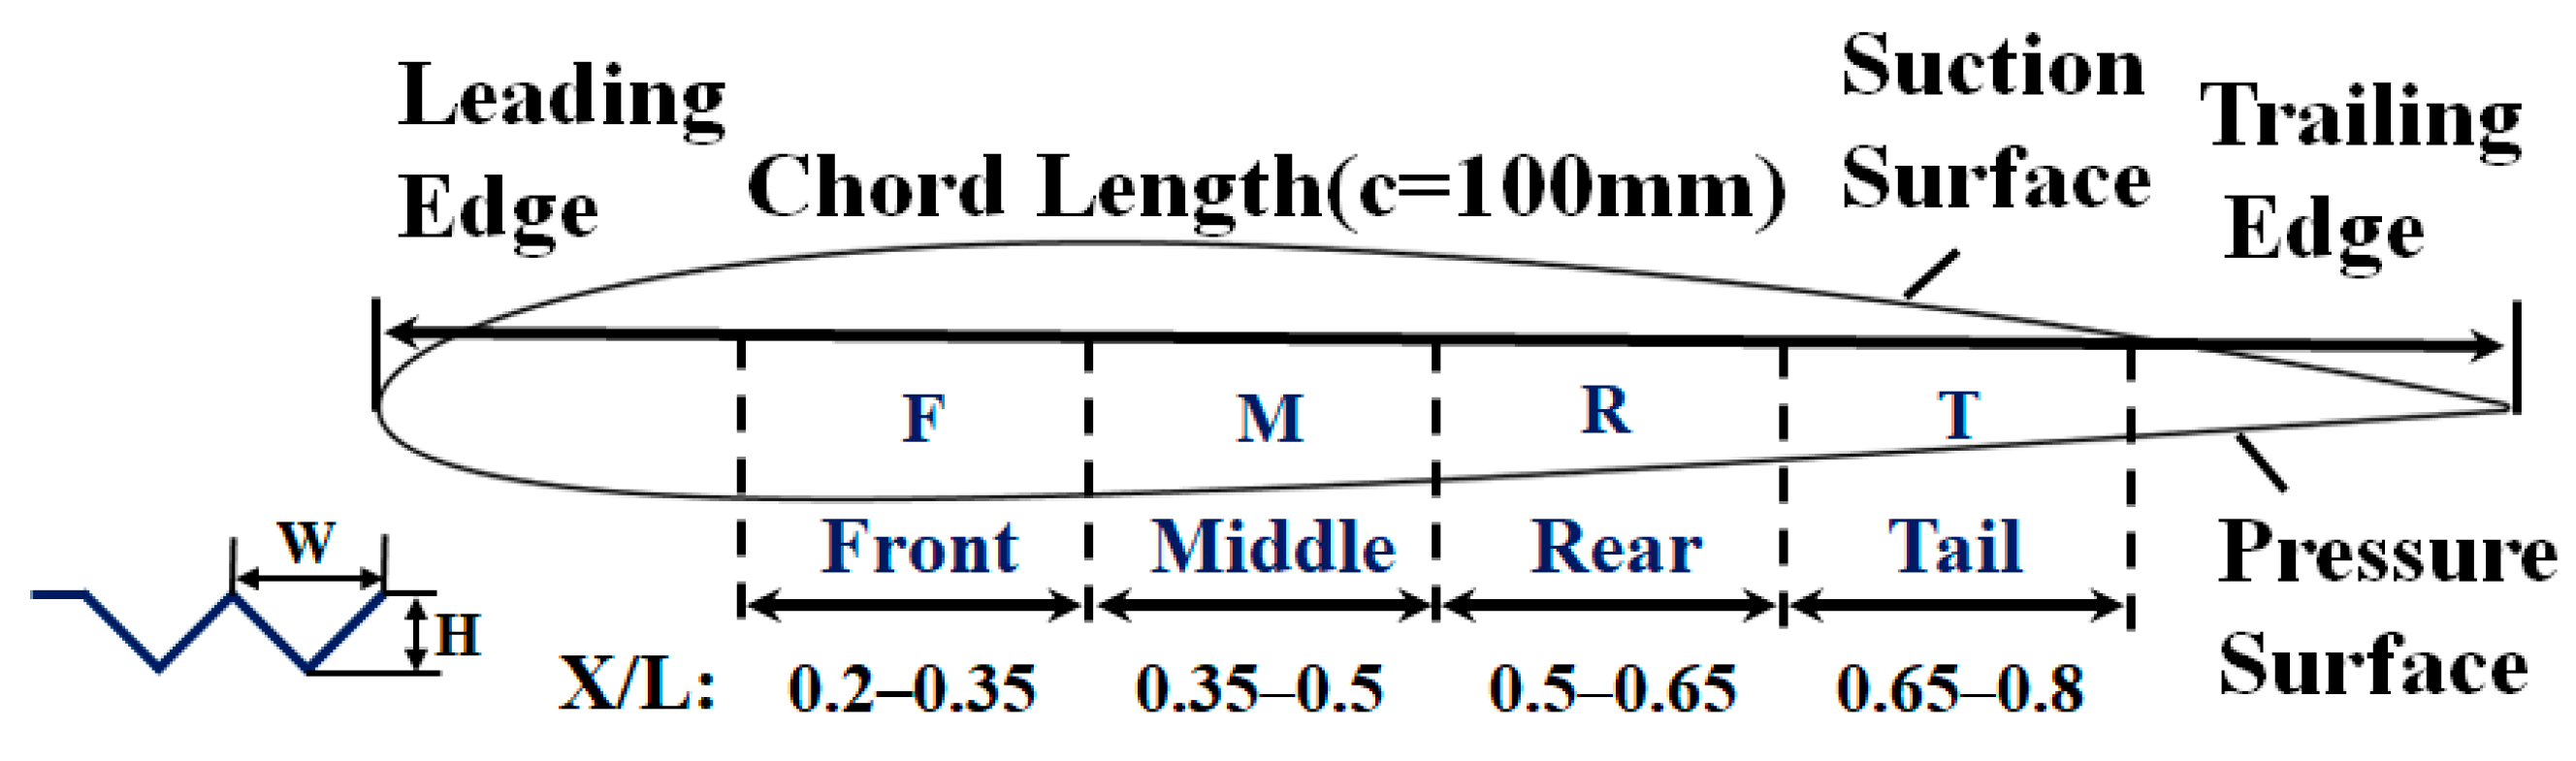
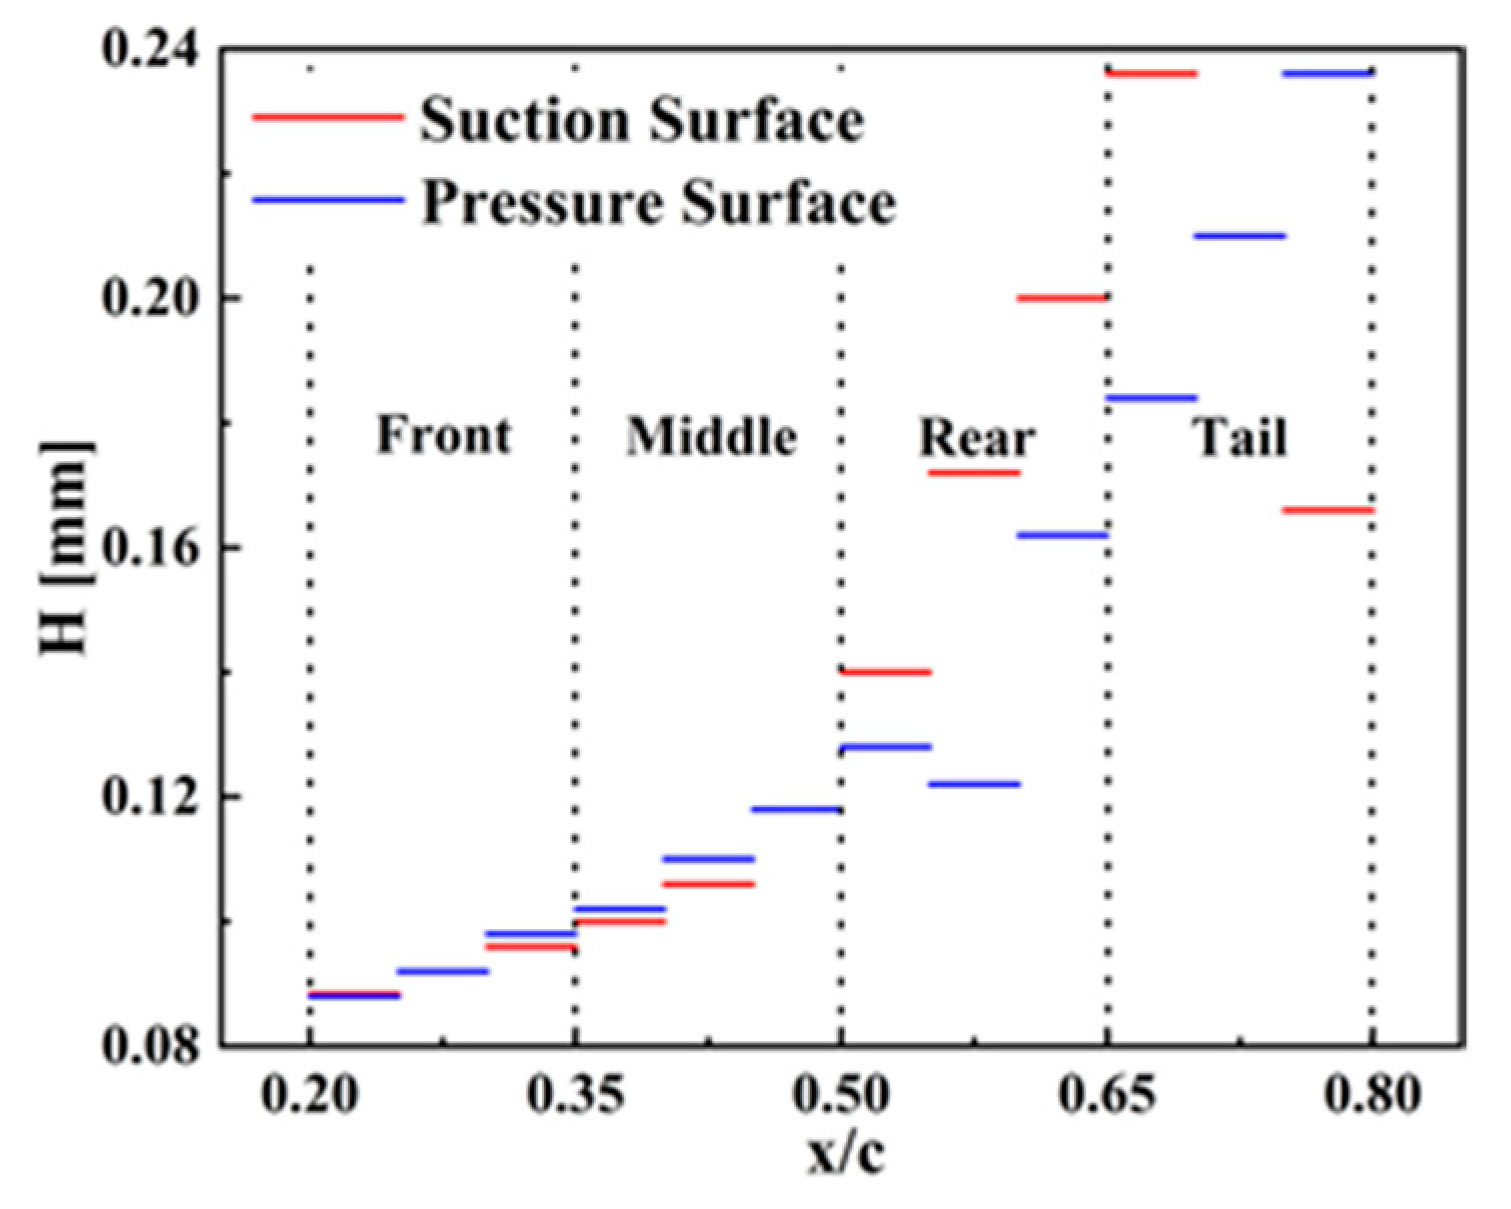
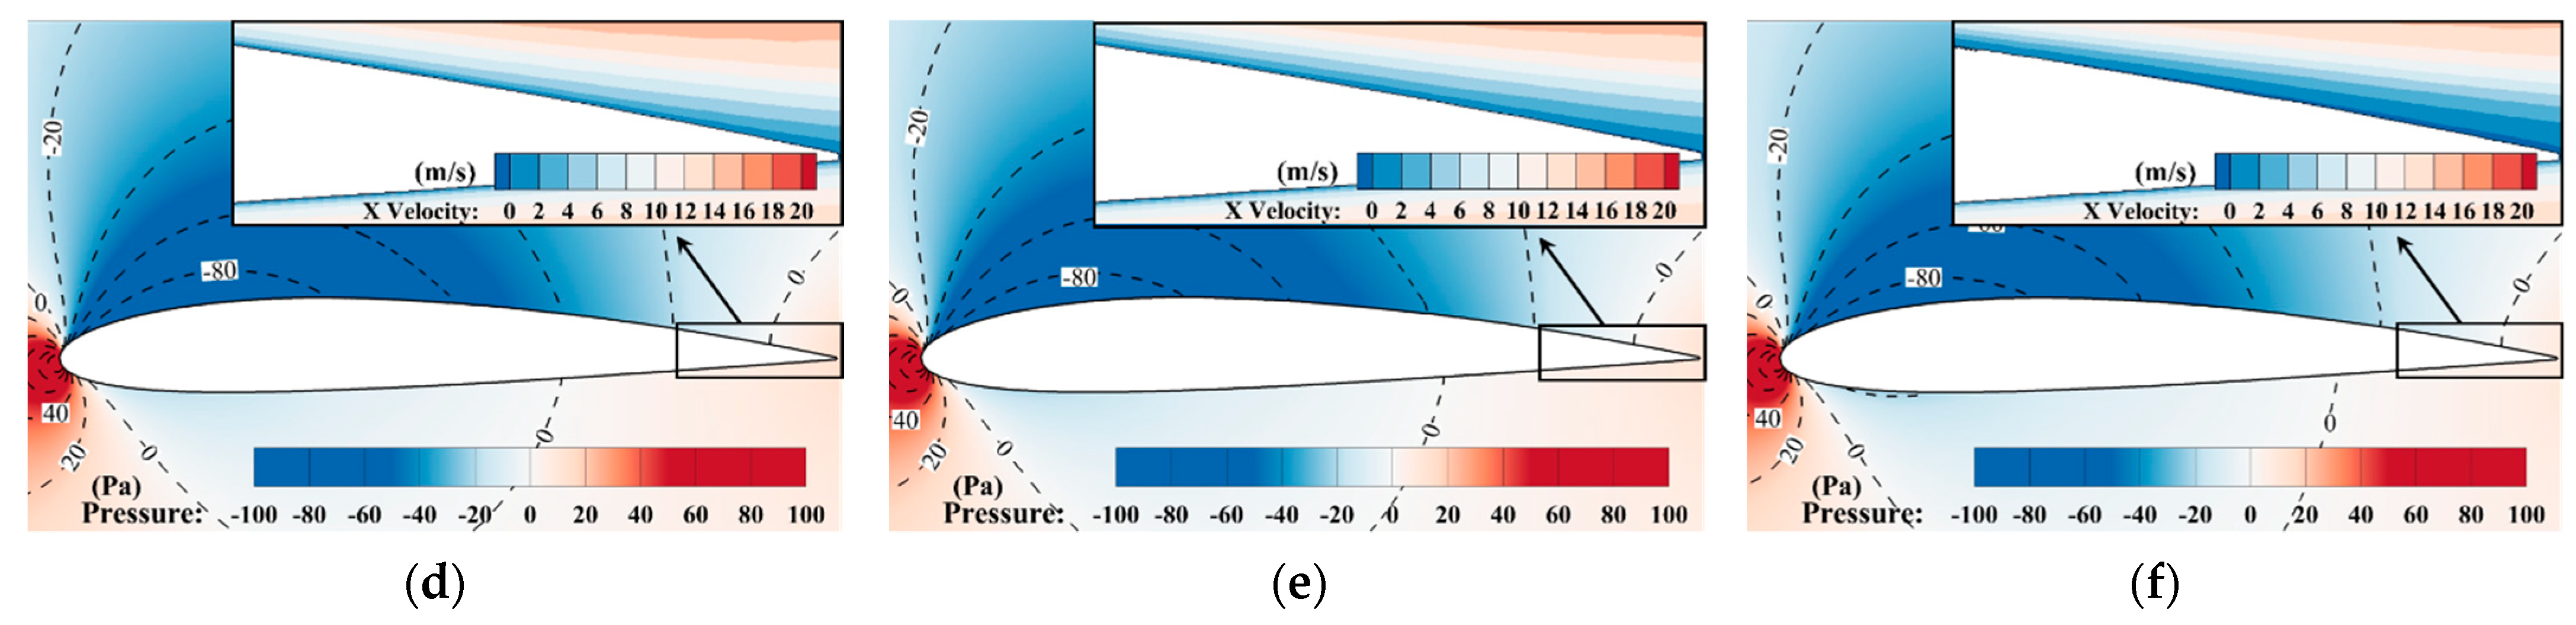
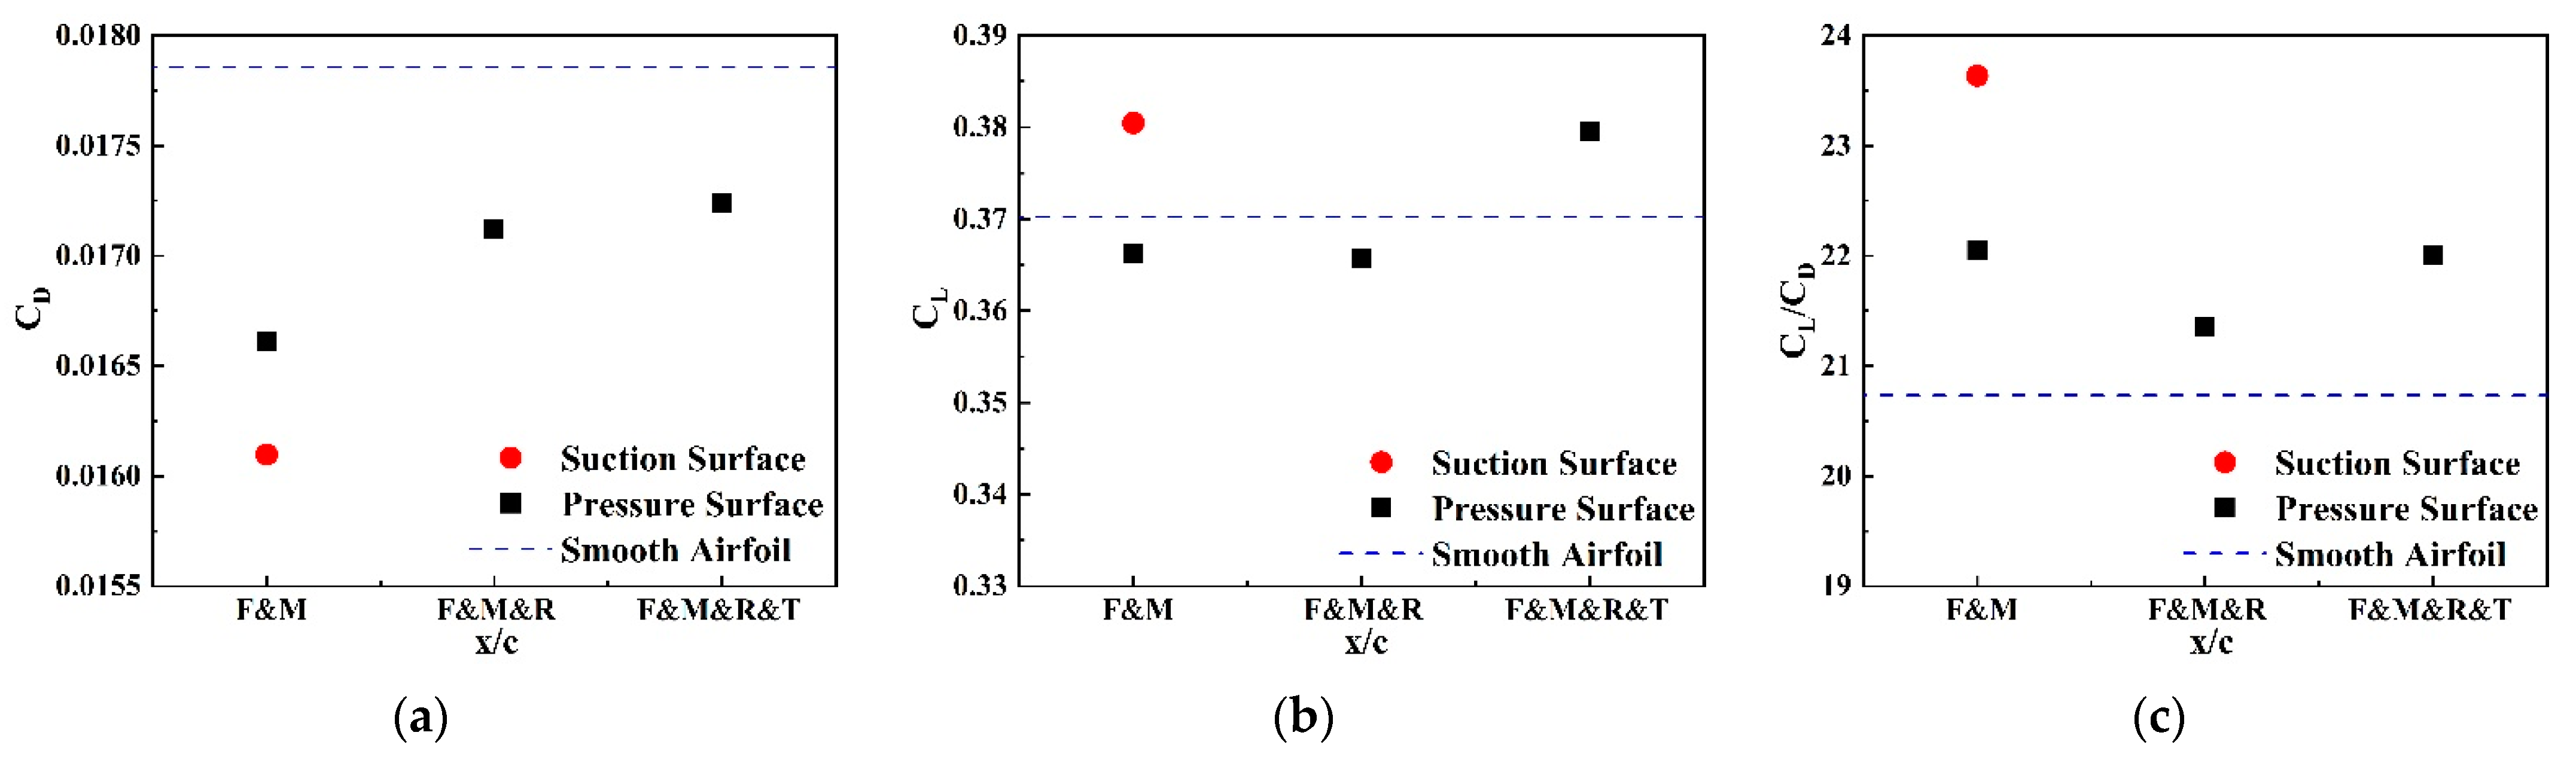
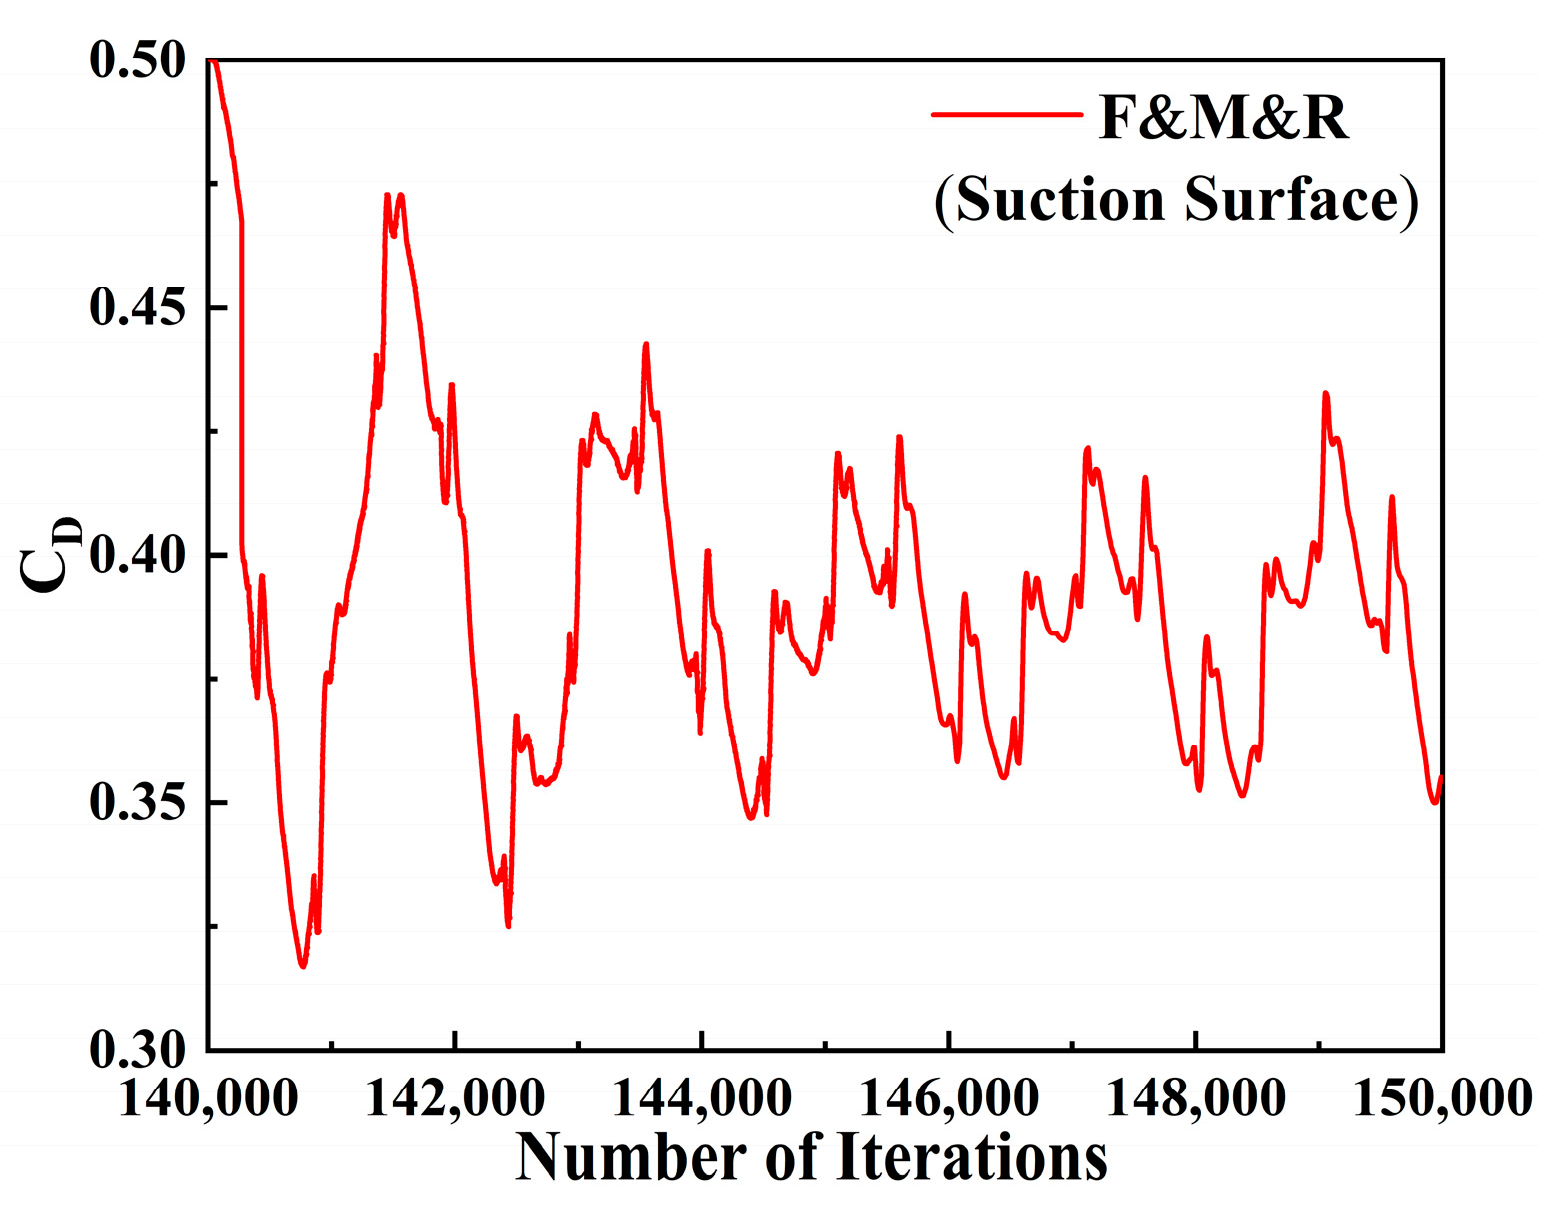
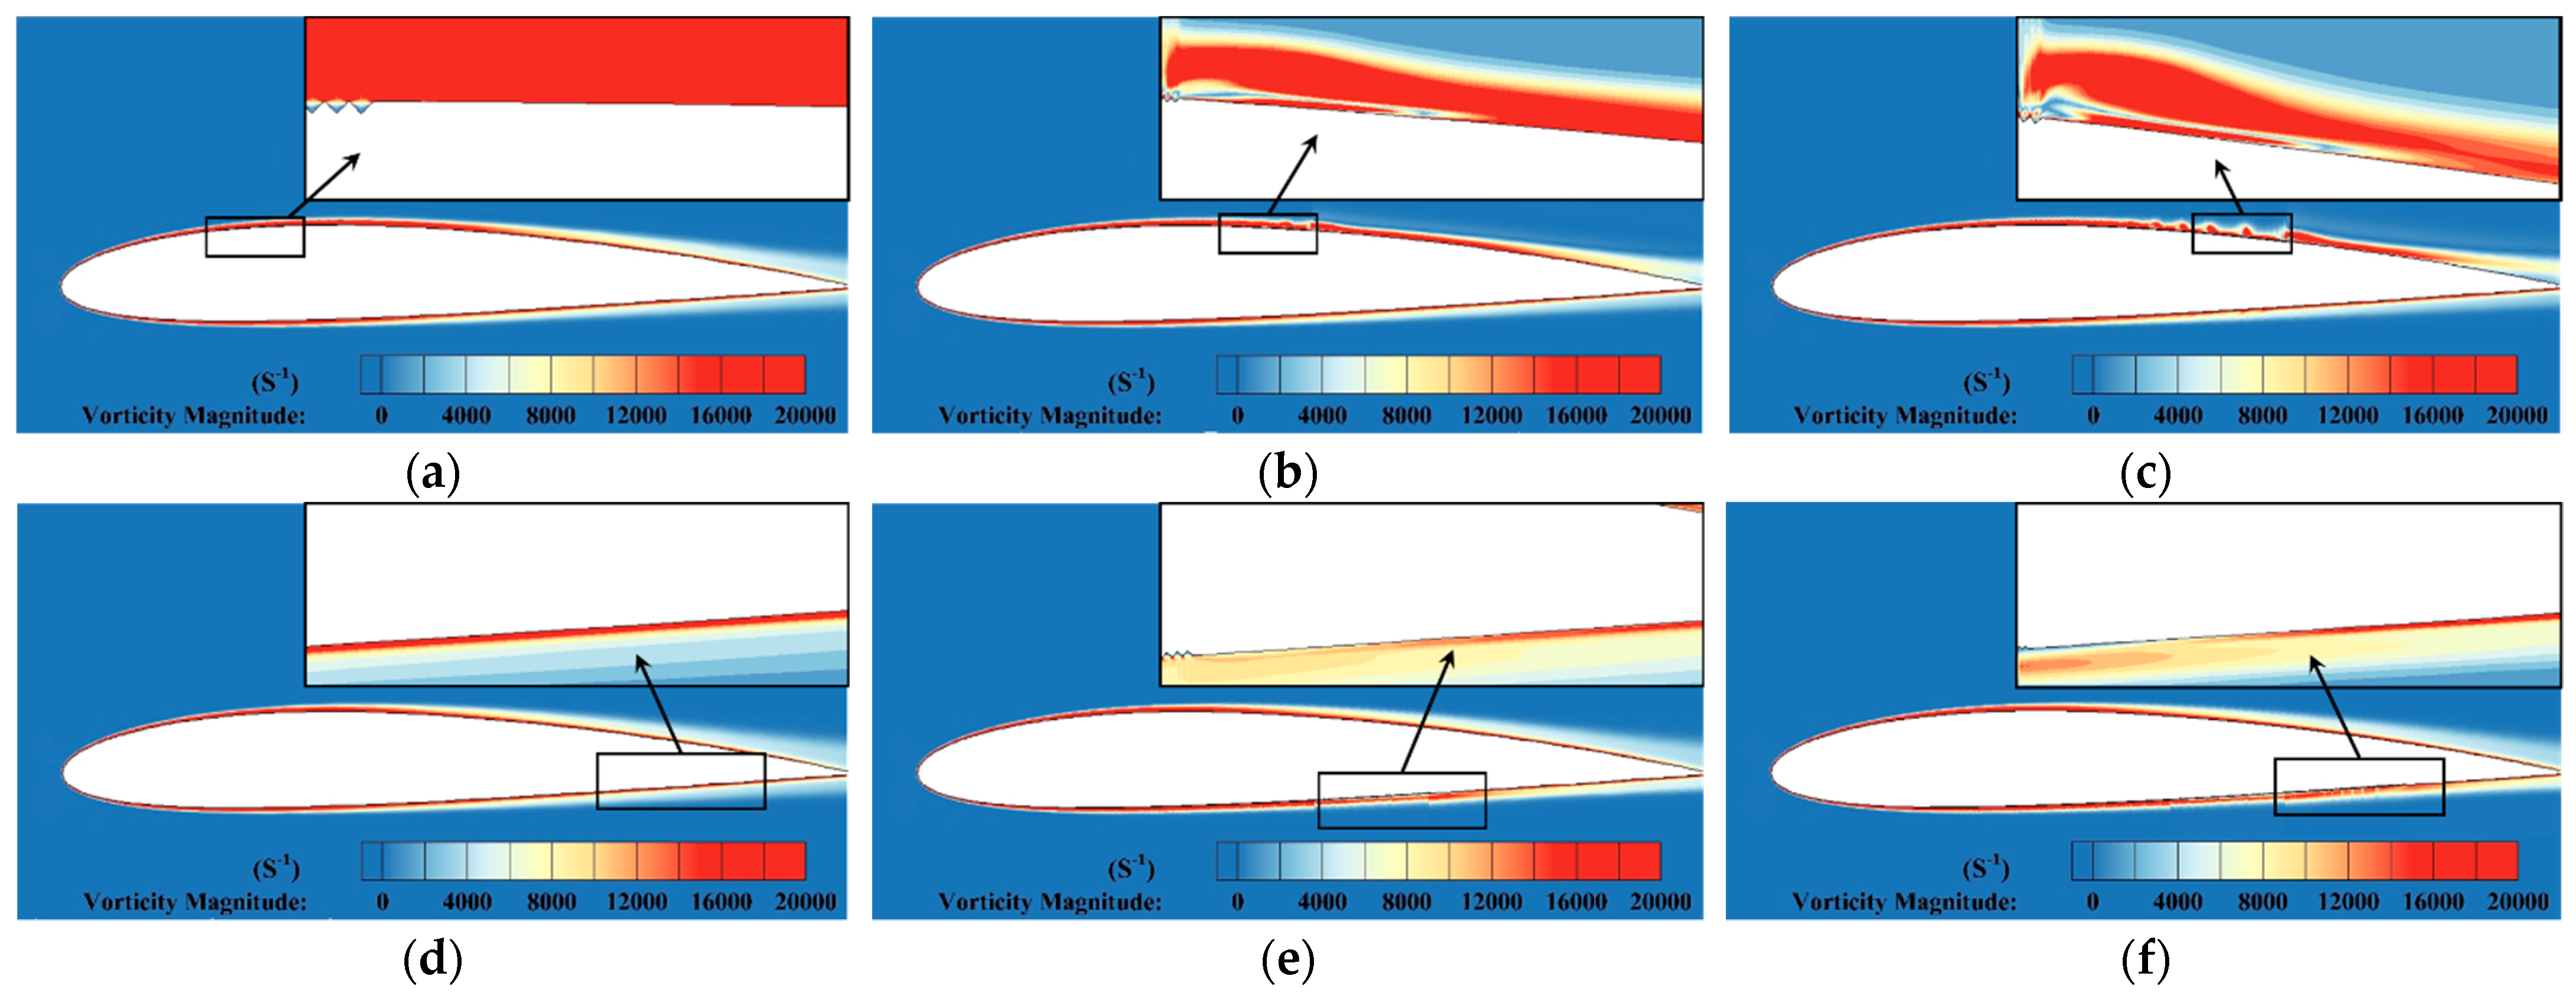
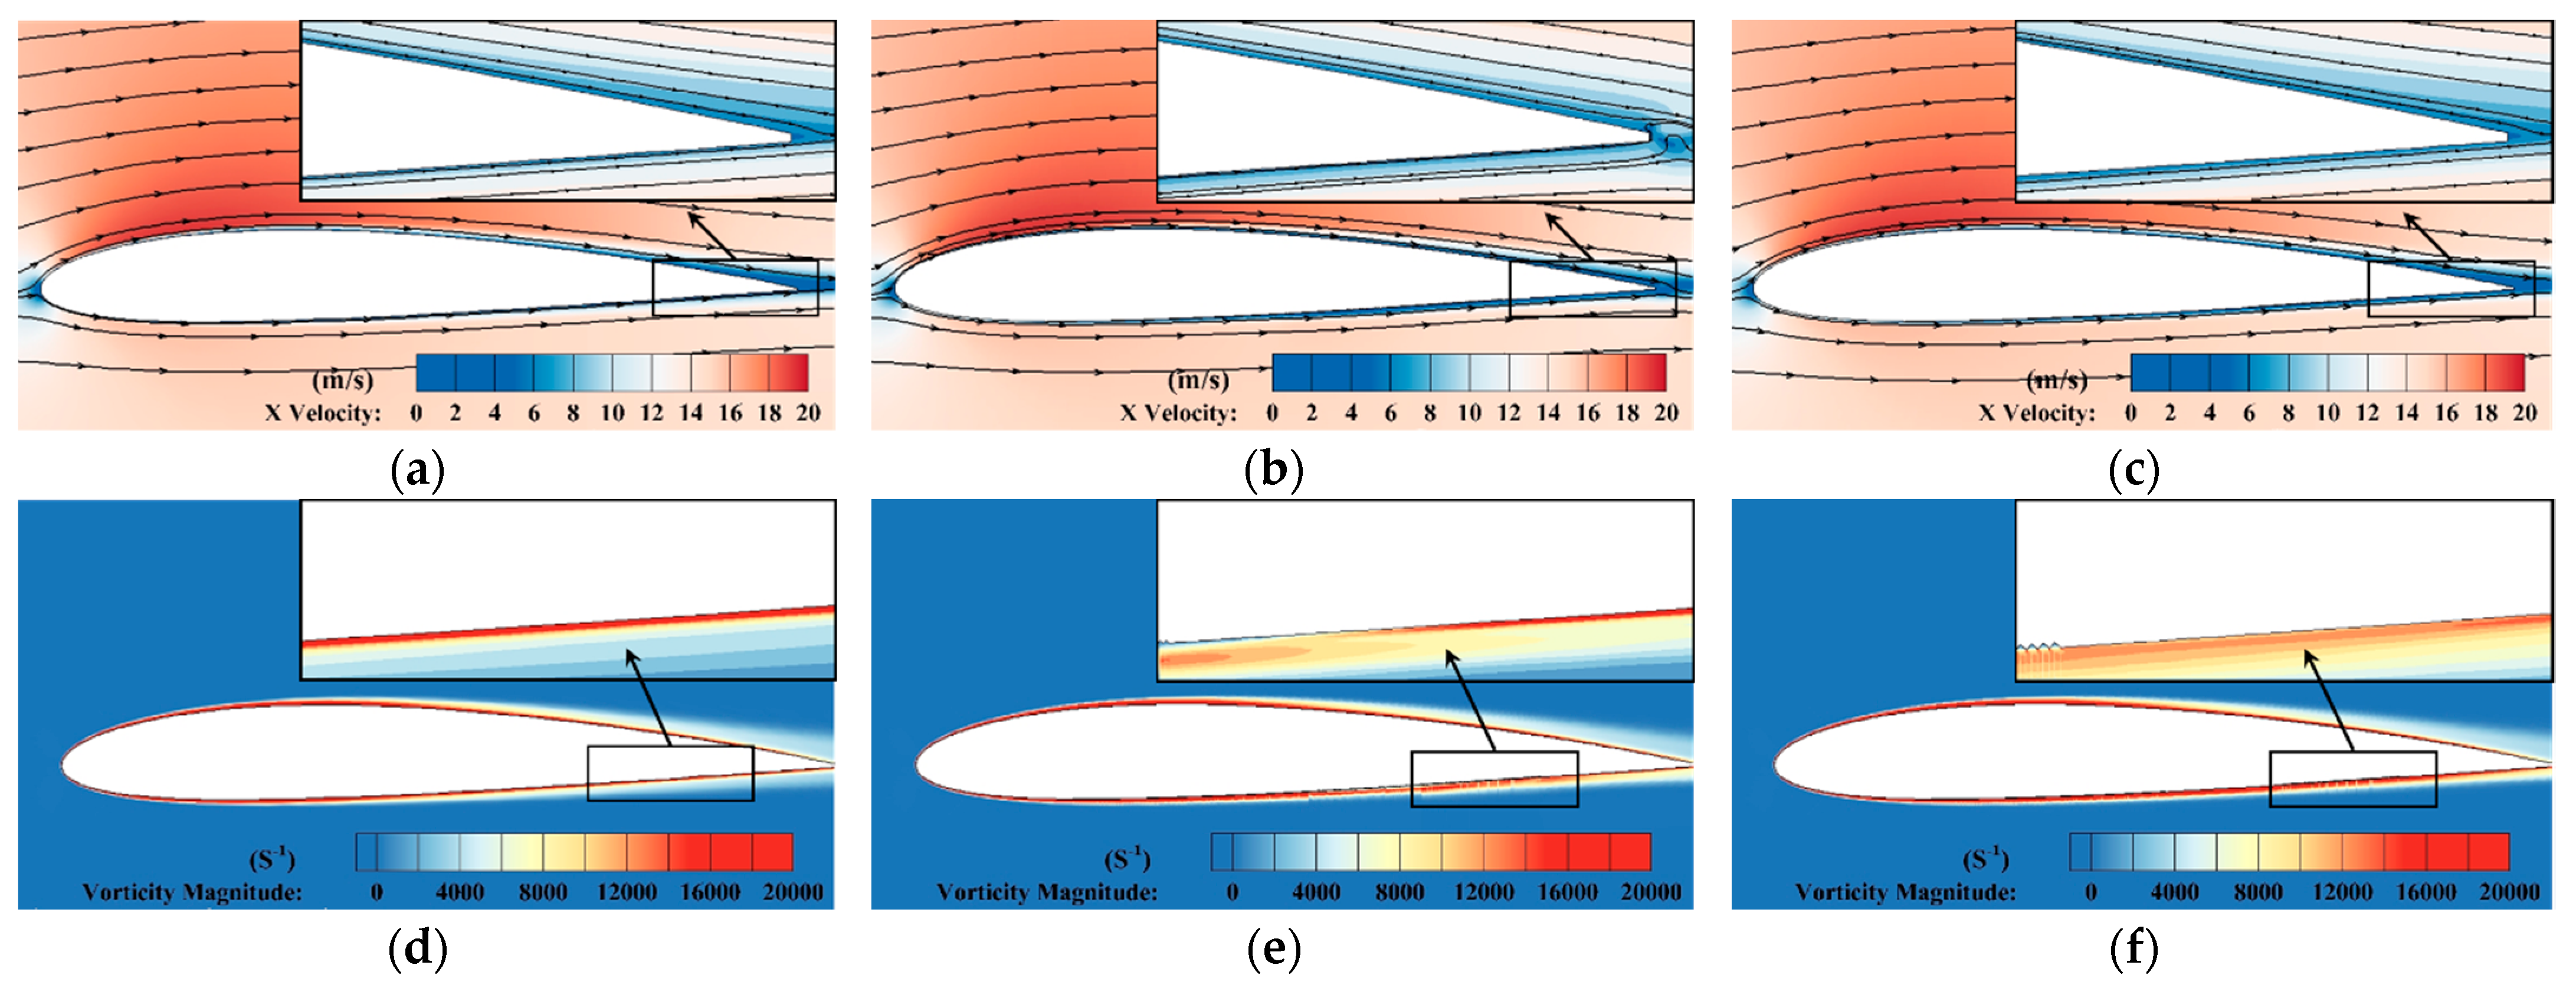
When grooves are widely deployed on the suction surface of the airfoil, grooves positioned in the front-middle section yield the best aerodynamic performance (low β). In contrast, excessive grooves on the suction surface can cause airflow separation, and the degree of separation is positively correlated with the range and the local adverse pressure gradient. When significant separation occurs, it results in a series of separated bubbles causing disorder flow, which will be detrimental to the flight of MAV. On the pressure surface, widespread grooves will thicken the boundary layer, ultimately leading to increased drag and lift. Intermittently placing groove on the airfoil can reduce mutual interference between grooves, reducing this impact.
(3)
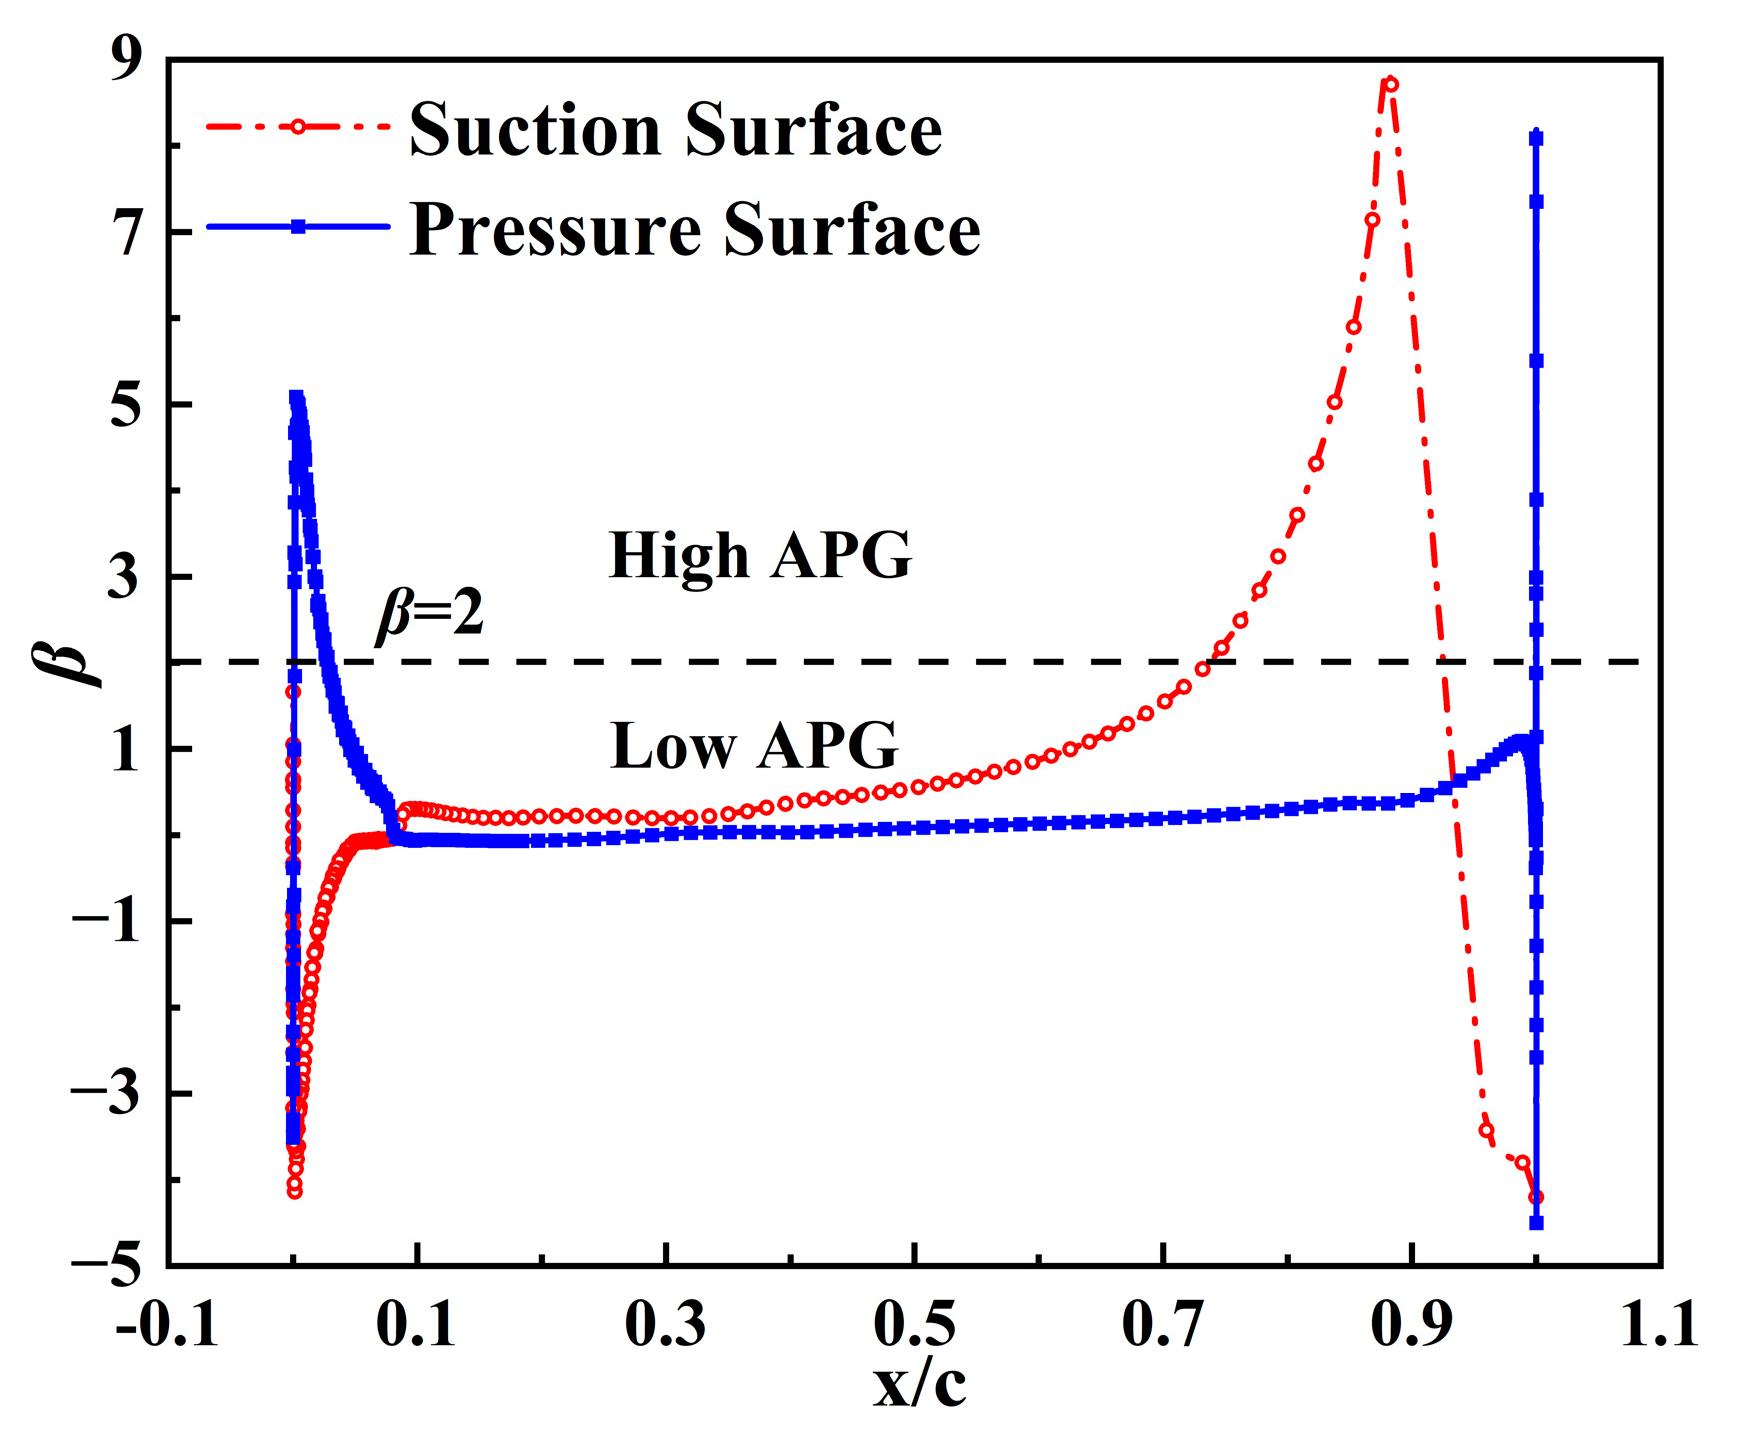
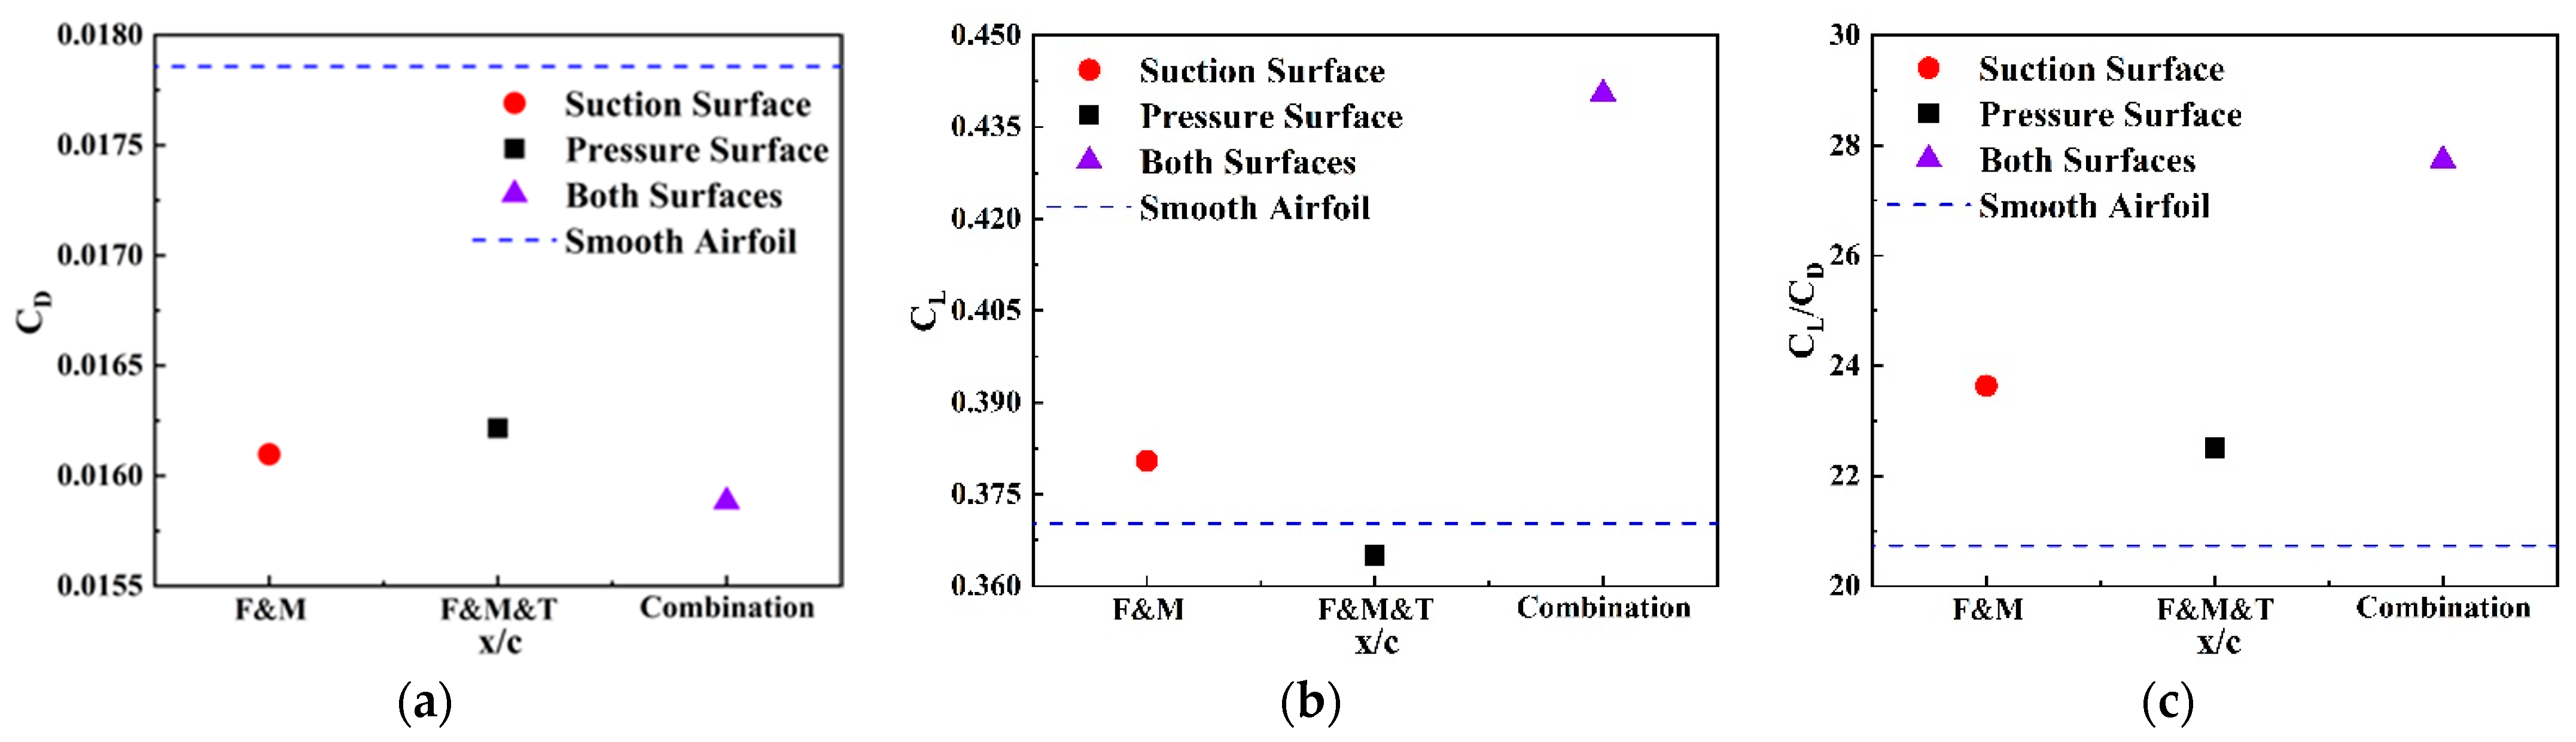
Simultaneously introducing grooves in both the front-middle section of the suction surface and the front-middle-tail section of the pressure surface of the airfoil has yielded the optimal aerodynamic performance, a 33.747% increase in lift-to-drag ratio. This result confirms the effectiveness of the application of transverse grooves on MAVs, and we have also given preliminary design criteria: do not arrange grooves in high adverse pressure gradient areas (β > 0.5), and under low adverse pressure gradients, discontinuous arrangements of large-scale grooves should be adopted at the rear of the airfoil.

Author Contributions

Conceptualization, Z.L., Y.Z., H.Z. and L.H.; Data curation, Y.Z.; Formal analysis, Z.L., Y.Z. and H.Z.; Funding acquisition, Z.L., P.Z.; Investigation, Y.Z.; Methodology, Y.Z. and H.Z.; Project administration, Z.L.; Software, Y.Z.; Supervision, Z.L., P.Z. and H.Z.; Validation, Y.Z.; Writing—original draft, Y.Z.; Writing—review & editing, H.Z., P.Z., L.H., E.S., Y.L. and L.Z. All authors have read and agreed to the published version of the manuscript.

Funding

This research was funded by the National Natural Science Foundation of China (No. 52176032), National Science and Technology Major Project (2017-‖-0005-0016), Natural Science Foundation of Tianjin Municipal Science and Technology Commission (Youth Program No. 22JCQNJC00050).

Institutional Review Board Statement

Not applicable.

Informed Consent Statement

Not applicable.

Data Availability Statement

Data are contained within the article.

Conflicts of Interest

The authors declare no conflict of interest.

References

  1. Davis, W.R. Micro UAV. In Proceedings of the Presentation to 23rd AUVSI Symposium, Orlando, FL, USA, 15–19 July 1996. [Google Scholar]
  2. Hassija, V.; Saxena, V.; Chamola, V. Scheduling drone charging for multi-drone network based on consensus time-stamp and game theory. Comput. Commun. 2020, 149, 51–61. [Google Scholar]
  3. Serokhvostov, S.V. Ways and technologies required for MAV miniaturization. In Proceedings of the European Micro Air Vehicle Conference (EMAV’08), Braunschweig, Germany, 8–10 July 2008. [Google Scholar]
  4. Keennon, M.; Grasmeyer, J. Development of two MAVs and vision of the future of MAV design. In Proceedings of the AIAA International Air and Space Symposium and Exposition: The Next 100 Years, Dayton, OH, USA, 14–17 July 2003; p. 2901. [Google Scholar]
  5. Goeksel, B.; Greenblatt, D.; Rechenberg, I.; Nayeri, C.; Paschereit, C. Steady and unsteady plasma wall jets for separation and circulation control. In Proceedings of the 3rd AIAA Flow Control Conference, San Francisco, CA, USA, 5–8 June 2006; p. 3686. [Google Scholar]
  6. Göksel, B.; Greenblatt, D.; Rechenberg, I.; Kastantin, Y.; Nayeri, C.N.; Paschereit, C.O. Pulsed plasma actuators for active flow control at MAV Reynolds numbers. In Proceedings of the Active Flow Control: Papers Contributed to the Conference “Active Flow Control 2006”, Berlin, Germany, 27–29 September 2006; Springer: Berlin/Heidelberg, Germany, 2007; pp. 42–55. [Google Scholar]
  7. Rizzetta, D.P.; Visbal, M.R. Numerical investigation of plasma-based control for low-Reynolds-number airfoil flows. AIAA J. 2011, 49, 411–425. [Google Scholar]
  8. Radmanesh, M.; Samani, I.; Amiriyoon, A.; Tavakoli, M.R. The effects of rectangular riblets on rectangular micro air vehicles for drag reduction. Proc. Inst. Mech. Eng. Part G J. Aerosp. Eng. 2017, 231, 364–373. [Google Scholar] [CrossRef]
  9. Viswanath, P.R. Aircraft viscous drag reduction using riblets. Prog. Aerosp. Sci. 2002, 38, 571–600. [Google Scholar]
  10. Nafar-Sefiddashti, M.; Nili-Ahmadabadi, M.; Saeedi-Rizi, B.; Pourhoseini, J. Visualization of flow over a thick airfoil with circular cross-sectional riblets at low Reynolds numbers. J. Vis. 2019, 22, 877–888. [Google Scholar]
  11. DeLuca, A.M.; Reeder, M.F.; Freeman, J.A.; Ol, M.V. Flexible-and rigid-wing micro air vehicle: Lift and drag comparison. J. Aircr. 2006, 43, 572–575. [Google Scholar] [CrossRef]
  12. Hu, H.; Tamai, M.; Murphy, J.T. Flexible-membrane airfoils at low Reynolds numbers. J. Aircr. 2008, 45, 1767–1778. [Google Scholar]
  13. Ifju, P.; Jenkins, D.; Ettinger, S.; Lian, Y.; Shyy, W.; Waszak, M. Flexible-wing-based micro air vehicles. In Proceedings of the 40th AIAA Aerospace Sciences Meeting & Exhibit, Reno, NV, USA, 14–17 January 2002; p. 705. [Google Scholar]
  14. Tuncer, I.H.; Kaya, M. Optimization of flapping airfoils for maximum thrust and propulsive efficiency. AIAA J. 2005, 43, 2329–2336. [Google Scholar] [CrossRef]
  15. Desert, T.; Moschetta, J.M.; Bezard, H. Aerodynamic design of a Martian micro air vehicle. In Proceedings of the 7th European Conference for Aeronautics and Aerospace Sciences, Milan, Italy, 3–6 July 2017. [Google Scholar]
  16. Bellman, M.; Straccia, J.; Morgan, B.; Maschmeyer, K.; Agarwal, R. Improving genetic algorithm efficiency with an artificial neural network for optimization of low Reynolds number airfoils. In Proceedings of the 47th AIAA Aerospace Sciences Meeting Including the New Horizons Forum and Aerospace Exposition, Orlando, FL, USA, 5–8 January 2009; p. 1096. [Google Scholar]
  17. O'meara, M.M.; Mueller, T.J. Laminar separation bubble characteristics on an airfoil at low Reynolds numbers. AIAA J. 1987, 25, 1033–1041. [Google Scholar]
  18. Mueller, T.J.; Torres, G.E. Aerodynamics of Low-Aspect Ratio Wings at Low Reynolds Numbers with Applications to Micro Air Vehicle Design and Optimization; University of Notre Dame: Notre Dame, IN, USA, 2001. [Google Scholar]
  19. Hosseini, N.; Tadjfar, M.; Abba, A. Configuration optimization of two tandem airfoils at low Reynolds numbers. Appl. Math. Model. 2022, 102, 828–846. [Google Scholar] [CrossRef]
  20. Gad-el-Hak, M. Micro-air-vehicles: Can they be controlled better? J. Aircr. 2001, 38, 419–429. [Google Scholar] [CrossRef]
  21. Xia, Q.; Wang, Z.; Ren, Y.; Sun, B.; Yang, D.; Feng, Q. A reliability design method for a lithium-ion battery pack considering the thermal disequilibrium in electric vehicles. J. Power Sources 2018, 386, 10–20. [Google Scholar] [CrossRef]
  22. Malozyomov, B.V.; Martyushev, N.V.; Sorokova, S.N.; Efremenkov, E.A.; Qi, M. Mathematical Modeling of Mechanical Forces and Power Balance in Electromechanical Energy Converter. Mathematics 2023, 11, 2394. [Google Scholar] [CrossRef]
  23. Guan, C.; Hasi, E.; Zhang, P.; Tao, B.; Liu, D.; Zhou, Y. Parabolic dune development modes according to shape at the southern fringes of the Hobq Desert, Inner Mongolia, China. Geomorphology 2017, 295, 645–655. [Google Scholar] [CrossRef]
  24. Bushnell, D. Turbulent drag reduction for external flows. In Proceedings of the 21st Aerospace Sciences Meeting, Reno, Nevada, 10–13 January 1983; p. 227. [Google Scholar]
  25. Ahmadi-Baloutaki, M.; Carriveau, R.; Ting DS, K. Effect of free-stream turbulence on flow characteristics over a transversely-grooved surface. Exp. Therm. Fluid Sci. 2013, 51, 56–70. [Google Scholar] [CrossRef]
  26. Wang, B.; Wang, J.; Zhou, G.; Chen, D. Drag reduction by microvortexes in transverse microgrooves. Adv. Mech. Eng. 2014, 6, 734012. [Google Scholar] [CrossRef]
  27. Walsh, M.J. Drag characteristics of V-groove and transverse curvature riblets. In Proceedings of the Symposium on Viscous Flow Drag Reduction, Dallas, TX, USA, 24–25 September 1980. [Google Scholar]
  28. Wang, J.; Nakata, T.; Liu, H. Development of mixed flow fans with bio-inspired grooves. Biomimetics 2019, 4, 72. [Google Scholar] [CrossRef]
  29. Liu, W.; Ni, H.; Wang, P.; Zhou, Y. An investigation on the drag reduction performance of bioinspired pipeline surfaces with transverse microgrooves. Beilstein J. Nanotechnol. 2020, 11, 24–40. [Google Scholar] [CrossRef]
  30. Dvorchak, M.J.; Clouser, M.L.; Harbourne, A.D. AEROSPACE UV CURED Coatings; Yesterday, Today & Tomorrow. In Proceedings of the RadTech 2020 UV & EB Technical Conference Proceedings, Orlando, FL, USA, 8–11 March 2020. [Google Scholar]
  31. Li, Z.; He, L.; Zheng, Y. Quasi-Analytical Solution of Optimum and Maximum Depth of Transverse V-Groove for Drag Reduction at Different Reynolds Numbers. Symmetry 2022, 14, 342. [Google Scholar] [CrossRef]
  32. Prabhakar, A.; Ohri, A. CFD analysis on MAV NACA 2412 wing in high lift take-off configuration for enhanced lift generation. J. Aeronaut Aerosp. Eng. 2013, 2, 2. [Google Scholar] [CrossRef]
  33. Clauser, F.H. Turbulent boundary layers in adverse pressure gradients. J. Aeronaut. Sci. 1954, 21, 91–108. [Google Scholar] [CrossRef]
  34. Monty, J.P.; Harun, Z.; Marusic, I. A parametric study of adverse pressure gradient turbulent boundary layers. Int. J. Heat Fluid Flow 2011, 32, 575–585. [Google Scholar] [CrossRef]
  35. Li, Z.; He, L.; Zuo, Y.; Meng, B. Analytic Solution of Optimal Aspect Ratio of Bionic Transverse V-Groove for Drag Reduction Based on Vorticity Kinetics. Aerospace 2022, 9, 749. [Google Scholar] [CrossRef]
  36. Jones, E.M. An Experimental Study of Flow Separation over a Flat Plate with 2D Transverse Grooves; The University of Alabama: Tuscaloosa, AL, USA, 2013. [Google Scholar]
  37. Truong, T.V.; Pulvin, P. Influence of wall riblets on diffuser flow. Appl. Sci. Res. 1989, 46, 217–227. [Google Scholar] [CrossRef]
  38. Nieuwstadt, F.T.; Wolthers, W.; Leijdens, H.; Krishna Prasad, K.; Schwarz-van Manen, A. The reduction of skin friction by riblets under the influence of an adverse pressure gradient. Exp. Fluids 1993, 15, 17–26. [Google Scholar] [CrossRef]
  39. De Groot, C.T.; Wang, C.; Floryan, J.M. Drag reduction due to streamwise grooves in turbulent channel flow. J. Fluids Eng. 2016, 138, 121201. [Google Scholar] [CrossRef]
  40. Wokoeck, R.; Krimmelbein, N.; Ortmanns, J.; Ciobaca, V.; Radespiel, R.; Krumbein, A. RANS simulation and experiments on the stall behaviour of an airfoil with laminar separation bubbles. In Proceedings of the 44th AIAA Aerospace Sciences Meeting and Exhibit, Sacramento, CA, USA, 9–12 July 2006; p. 244. [Google Scholar]
  41. Shome, B.; Radle, M. Assessment of Transitional Model for Prediction of Aerodynamic Performance of Airfoils at Low Reynolds Number Flow Regime; SAE Technical Paper; SAE International: Warrendale, PA, USA, 2013. [Google Scholar]
  42. Menter, F.R. Two-equation eddy-viscosity turbulence models for engineering applications. AIAA J. 1994, 32, 1598–1605. [Google Scholar] [CrossRef]
  43. Wang, J.; Zhang, C.; Wu, Z.; Wharton, J.; Ren, L. Numerical study on reduction of aerodynamic noise around an airfoil with biomimetic structures. J. Sound Vib. 2017, 394, 46–58. [Google Scholar] [CrossRef]
  44. Mathey, F. Aerodynamic noise simulation of the flow past an airfoil trailing-edge using a hybrid zonal RANS-LES. Comput. Fluids 2008, 37, 836–843. [Google Scholar] [CrossRef]
  45. Matsson, J.E.; Voth, J.A.; McCain, C.A.; McGraw, C. Aerodynamic performance of the NACA 2412 airfoil at Low Reynolds Number. In Proceedings of the 2016 ASEE Annual Conference & Exposition, New Orleans, LA, USA, 26–29 June 2016. [Google Scholar]
  46. Sunu, P.W.; Wardana, I.N.; Sonief, A.A.; Hamidi, N. The effect of wall groove numbers on pressure drop in pipe flows. Int. J. Fluid Mech. Res. 2015, 42, 119–130. [Google Scholar] [CrossRef]
  47. Li, Z.; Zuo, Y.; Lu, H.; He, L.; Meng, B. Numerical study on the influence of top and valley shape of the transverse groove on the drag reduction rate. J. Theor. Appl. Mech. 2023, 61, 741–754. [Google Scholar] [CrossRef]
Figure 1. Transverse grooves and MABS theory.
Applsci 13 12371 g001
Figure 2. Distribution of β on the NACA2412 airfoil surface.
Applsci 13 12371 g002
Figure 3. Surface position division of NACA2412 airfoil.
Applsci 13 12371 g003
Figure 4. Schematic representation of the computational domain grid and boundary conditions.
Applsci 13 12371 g004
Figure 5. Validation of grid independence.
Applsci 13 12371 g005
Figure 6. Validation of computational accuracy.
Applsci 13 12371 g006
Figure 7. Depth of grooves at different positions on the airfoil surface.
Applsci 13 12371 g007
Figure 8. Effect of grooves at different positions on aerodynamic parameters of airfoils: (a) CD; (b) CL; and (c) CL/CD.
Applsci 13 12371 g008
Figure 9. Pressure distribution of airfoils (suction surface grooves): (a) Pressure on suction surfaces; (b) smooth airfoil; (c) front section; (d) middle section; (e) rear section; and (f) tail section.
Applsci 13 12371 g009aApplsci 13 12371 g009b
Figure 10. Effect of grooves at different ranges (continuous) on aerodynamic parameters of airfoils: (a) CD; (b) CL; and (c) CL/CD.
Applsci 13 12371 g010
Figure 11. Drag coefficient changes with the number of iterations.
Applsci 13 12371 g011
Figure 12. Velocity contours of airfoils with grooves arranged in different ranges (suction surface grooves: (a,b), pressure surface grooves: (df): (a) front section; (b) front-middle section; (c) front-middle-rear section; (d) smooth airfoil; (e) front-middle-rear section; and (f) front-middle-rear-tail section.
Applsci 13 12371 g012
Figure 13. Vorticity contours of airfoils with grooves arranged in different ranges (suction surface grooves: (a,b), pressure surface grooves: (df): (a) front section; (b) front-middle section; (c) front-middle-rear section; (d) smooth airfoil; (e) front-middle-rear section; and (f) front-middle-rear-tail section.
Applsci 13 12371 g013
Figure 14. Effect of grooves at different ranges (discontinuous) on aerodynamic parameters of airfoils: (a) CD; (b) CL; and (c) CL/CD.
Applsci 13 12371 g014
Figure 15. Velocity (upper) and vorticity (lower) contours of airfoils with grooves arranged on the pressure surface: (a,d) smooth airfoil; (b,e) front-middle-rear-tail section; and (c,f) front-middle-tail section.
Applsci 13 12371 g015
Figure 16. Aerodynamic performance of single or double-grooved airfoils: (a) CD; (b) CL; and (c) CL/CD.
Applsci 13 12371 g016
Disclaimer/Publisher’s Note: The statements, opinions and data contained in all publications are solely those of the individual author(s) and contributor(s) and not of MDPI and/or the editor(s). MDPI and/or the editor(s) disclaim responsibility for any injury to people or property resulting from any ideas, methods, instructions or products referred to in the content.

