Article

From Data to Insights: A Bibliometric Assessment of Agent-Based Modeling Applications in Transportation

1
Department of Economic Informatics and Cybernetics, Bucharest University of Economic Studies, 010552 Bucharest, Romania
2
Department of Accounting and Audit, Bucharest University of Economic Studies, 010552 Bucharest, Romania
*
Author to whom correspondence should be addressed.
Submission received: 30 September 2023 / Revised: 21 November 2023 / Accepted: 23 November 2023 / Published: 27 November 2023
(This article belongs to the Special Issue Applications of Agent-Based Modeling in Transportation)

Abstract

:
This paper presents a bibliometric analysis within the research domain dedicated to the utilization of agent-based modeling (ABM) in the field of transportation. By employing specific keywords related to both agent-based modeling and transportation, we have identified and extracted 1016 scholarly papers from the ISI Web of Science database, spanning the period from 2002 to 2023. Through the application of bibliometric methods, we have systematically examined key contributors, affiliations of academic institutions, influential publications, and renowned journals within this domain. Our analysis reveals a consistent and robust growth in scholarly interest pertaining to agent-based modeling in the field of transportation throughout the considered period. Notably, within approximately four decades of ABM’s application in transportation, a distinct upward trajectory began in 2008, culminating in the year 2021. The entire considered period witnessed a remarkable surge in paper production, characterized by an annual growth rate of 21.67%. Furthermore, employing an n-gram analysis, we have delineated and discussed the principal areas within transportation that have progressively benefited from the advancements in agent-based modeling. Prominently, the domains of air transport and road transport have exhibited substantial development over time, while the implications of climate change have emerged as a persistent concern throughout the entire study period.

1. Introduction

The global economy is undergoing continuous adaptation to a rapidly changing environment in recent years. Since the beginning of the 21st century, the transportation sector has evolved from being less prominent to becoming one of the most crucial drivers of economic development. Presently, the primary focus is on cost reduction and enhancing mobility, especially in response to unexpected events. Simultaneously, investments in transportation have shifted toward innovative modes such as bicycles, electric cars, electric trucks, geospatial technology, and car sharing [1].
Agent-based modeling (ABM) has emerged as a powerful method for observing the emergence of systems and the interactions among the event’s key actors [2]. Over time, ABM has been successfully applied to various research fields as it offers the possibility to model the subject under investigation in terms of agents and their interactions [3]. Noteworthy among these realms of applicability, though not exhaustive, are economics [4], dividend policy [5], sustainable resources management [6], organizational studies [7], manufacturing [8], marketing [9], electricity markets [10], social research [11], human infectious disease epidemiology [12], mobility behavior [13], land use [14], constructions [15], education [16], archeology [17], environmental management [18], evacuation [19,20], and social networks [21].
In terms of modeling, various issues have been posed in the scientific literature regarding the description, design, computational features, simulation, validation, or evaluation of agent-based models (ABMs) [22,23,24,25]. Numerous scholars have endeavored to ascertain optimal approaches for constructing and elucidating ABMs [26,27]. Concurrently, certain researchers have put forth a range of protocols aimed at enhancing the comprehensibility and accessibility of ABM documentation [28]. Among these, the Overview, Design concepts, and Details (ODD) protocol has gained widespread acceptance for its capacity to facilitate model depiction and replication, while maintaining a judicious balance of technical detail [28]. Comprising seven distinct components organized into three principal categories, the ODD protocol has found utility across diverse research domains, adapting over time through iterative refinement to enhance clarity, reproducibility, and structural veracity [28]. In contemporary contexts, an extension of the ODD protocol, known as ODD + D, has been developed to specifically address the incorporation of human decision-making processes within ABM descriptions [29]. Moreover, select works within the field have focused their efforts on formulating protocols for a sensitivity analysis of ABMs [30]. Having these protocols has also contributed to the increasement in the research that uses ABM in various fields in recent years.
The utility of ABMs in the field of transportation lies in their capability to effectively model various aspects [31]. ABMs excel in capturing individual behaviors within complex environments marked by spatial interactions. With ABMs, it is possible to define behavioral rules for micro-level agents that, through simulation, can demonstrate intricate and emergent patterns at the macro level. For instance, the study of ABMs enables the observation of traffic congestion patterns’ formation, an outcome unattainable through traditional modeling approaches [31].
As the utilization of ABMs in the field of transportation science has witnessed significant growth over time, this paper endeavors to provide an extensive overview of the applications employing this approach. It does so through a bibliometric analysis aimed at identifying prominent authors, institutions, publications, and journals closely associated with this subject [32,33,34,35]. The analysis encompasses the extraction and examination of significant keywords, trends, and research directions. Additionally, the study sheds light on the geographic regions where the ABM approach to transportation holds substantial influence. To reinforce the analysis, we conducted a comprehensive review of the most highly cited papers within this domain.
The remaining sections of this paper are organized as follows: In the next section, we outline the steps taken to select relevant papers from the scientific literature, emphasizing the keywords used in the selection process and providing insight into the excluded elements. Section 3 is dedicated to the analysis of the extracted dataset. Firstly, we provide an overview of the selected papers, covering general aspects related to the keywords, average citations per year, number of authors, and the sources of the published papers. Secondly, we delve deeper into various elements, including an analysis of paper sources, authorship details, a collaboration map, a review of the top three most cited papers, a word analysis, and an examination of the connections between authors, their respective countries, affiliations, and the journals in which they have published their work. The paper concludes with limitations, and final remarks.

2. Materials and Methods

With the purpose of extracting the papers that have used ABM as a modeling technique for the research conducted in the transportation field, the Web of Science platform (WoS platform) [36] was employed. Although different databases can be used for a bibliometric analysis, such as Scopus and Google Scholar, or multiple databases can be used at once for such an analysis [34], in this paper, the bibliometric material has been retrieved only from the WoS platform. The choice for this platform has been founded on two main reasons, as pointed out by Bakir et al. [37]: the large coverage of disciplines and indexed journals that are considered the most credible by the scientific community [38,39] and the fact that even though WoS is less inclusive than its counterpart databases, it represents the most commonly used database in the scientific literature [40].
According to Marin-Rodriguez et al. [41], two main steps are needed for conducting a bibliometric analysis: the identification of the dataset and the analysis of the extracted dataset. As a result, the steps presented in Figure 1 have been considered. The information provided in Figure 1 is adapted for the particular case of the research conducted in this study and is described in the following.
The dataset extraction has been made through considering a series of keywords related to the transport domain and agent-based modelling.
The choice for these keywords has been based on studying various bibliometric papers that focus on various transport and transportation aspects. For example, Ruiz-Perez et al. [42] for a paper dealing with equity in transportation have used “transport*” for extracting the papers related to the transportation domain. The same keyword has been used by Bao et al. [43] for a paper dealing with the development of the socially sustainable transport research. As for the remainder of the specific words related to the transportation domain, we have considered the papers written in the field that discuss bibliometrics in the general transportation systems or particular transportation systems, such as road, rail, sea, or air. For example, Badassa et al. [44] used “rail*”, “road*”, “highway*”, and “expressway*” for extracting the papers related to the transport infrastructure. Meyer [45] uses combinations of keywords containing “road”, “freight”, “truck”, “vehicle”, and “ship”. Kadam et al. [46] used specific railway transportation keywords when conducting their database extraction, such as “railway”, “rail”, “train”, “metro”, and “monorail”. Yuniaristanto et al. [47] used specific keywords related to electric motorcycles, such as “motorcycle”, “scooter”, “powered two-wheeler”, “e-motorcycle”, and “e-scooter”. Vizuete-Luciano et al. [48] in a study related to the taxi and urban mobility used keywords such as “urban mobility”, “taxi”, “ride-sourcing”, “ride-pooling”, “ride-splitting”, and “ride-sharing”. Ali et al. [49] used “airline”, “air carrier”, “aviation”, and “air passenger carrier”, while Bakir et al. [37] used “airport” and “airports” in their bibliometric studies in the area of air transportation. As for the remainder of the used keywords, we have considered the topic discoveries made by Sun and Yin [50]. The authors have provided in their paper 50 topics related to the themes and trends used in transportation research. For each identified theme, the authors have provided a list of related keywords from which we have enhanced the keywords search list, retaining the relevant keywords related to the transportation domain [50]. As a result, the keywords mentioned in Table 1 have been used for searching the papers related to the transportation domain, while for the keywords associated with the ABM domain, the following keywords have been considered: “agent-based modelling”, “agent-agent-based model-based modelling”, “agent-based model”, and “agent-based models”.
A series of steps have been considered for the papers’ extraction. First, the transportation keywords in titles have been taken into account, which resulted in the extraction of 1,402,613 papers—see Table 1.
The second query, in Step 2, elaborated on the ABM domain, including the following keywords: “agent-based modelling”, “agent-agent-based model-based modelling”, “agent-based model”, and “agent-based models”. The query returned 5136 papers.
In our endeavor to restrict our analysis to papers related specifically to the domains of transportation and ABM, we employed a logical ‘AND’ operator between the initial two queries during Step 3. This refined search yielded a total of 233 relevant papers.
Subsequently, we replicated the same search queries in Steps 4, 5, and 6, this time focusing on the abstracts. This broader search encompassed 3,742,548 papers within the transportation domain and 11,174 within the ABM domain, with an overlap of 1341 papers.
Furthermore, recognizing the significance of keywords in our analysis of the selected papers, we applied similar filters during Steps 7, 8, and 9. Our keyword searches retrieved 781,716 papers related to the transportation domain and 8868 associated with ABMs, with an intersection of 507 papers common to both domains.
We retained all papers that were common across our previous queries involving title, abstract, and keywords filtering. In Step 10, this comprehensive approach yielded a total of 1654 papers.
Subsequently, language became an exclusion criterion in Step 11, with a focus on English-language papers, resulting in a slight reduction to 1645 papers.
In the final exclusionary step, Step 12, we filtered based on document type, retaining only articles. This led to a final count of 1127 papers.
The date of paper extraction was 20 November 2023.
As for the second step of our analysis, pertaining to the bibliometric analysis, a series of indicators have been discussed in accordance to other papers, which have used the same analysis approach [37,51,52,53,54].
The bibliometric analysis is organized into five parts. The first part, ‘Dataset Overview’, provides a comprehensive presentation of key information concerning documents, timestamps, and the number of authors. The second part focuses on ‘Sources’, offering detailed insights into the most relevant sources, the annual growth rate, and the application of a Bradford’s Law graph. The third part delves into ‘Authors’ as its main theme, providing a thorough overview, including the number of papers authored by individuals or groups, a collaboration map, a collaboration network, and identification of significant affiliations. In the fourth part, the spotlight is on the detailed examination of the three most significant papers on ABM in transportation. This analysis seeks to discern the papers’ objectives, methodologies employed by the authors, and the resulting conclusions. The use of Word Clouds, a specialized graph type, aids in visualizing the prominence of specific terms, with text size reflecting their frequency. Thematic maps further elucidate the principal domains discussed in the scrutinized papers. The fifth and final part of the bibliometric analysis employs a mixed analysis, providing an observation of the distribution of affiliations, authors, and countries.
In the following, the formulas for some of the indicators discussed in the next section are provided for better describing the information included in these indicators. The formulas are presented in accordance with the information provided in [55]:
  • Number of sources is calculated based on the sum metric:
S o u r c e s = N u m b e r   o f   S o u r c e s
  • Number of documents is calculated using a similar metric:
D o c u m e n t s = N u m b e r   o f   D o c u m e n t s
  • Number of references is determined with the following function:
R e f e r e n c e s = N u m b e r   o f   R e f e r e n c e s
  • Average number of citations per document is an important metric that shows how important the paper is for other authors:
A v e r a g e   n u m b e r   o f   c i t a t i o n s   p e r   d o c u m e n t = N u n b e r   o f   C i t a t i o n s N u m b e r   o f   P a p e r s
  • Average number of citations per document per year is calculated using the next metric:
A v e r a g e   n u m b e r   o f   c i t a t i o n s   p e r   d o c u m e n t   p e r   y e a r = 1 N u m b e r   o f   y e a r s N u n b e r   o f   C i t a t i o n s N u m b e r   o f   P a p e r s
  • Mean total citations per article:
M e a n T C p e r A r t = N u m b e r   o f   C i t a t i o n s N u m b e r   o f   a r t i c l e s
  • Number of keywords plus is determined with the following function:
K e y w o r d s   p l u s = N u m b e r   o f   K e y w o r d s   P l u s
  • Number of authors’ keywords is determined with the following function:
A u t h o r s   K e y w o r d s = N u m b e r   o f   A u t h o r s   K e y w o r d s
  • Number of authors is determined with the following function:
A u t h o r s = N u m b e r   o f   A u t h o r s   u n i q u e   a p p e a r a n c e s
  • Number of authors’ appearances:
A u t h o r   a p p e a r a n c e s = N u m b e r   o f   A u t h o r s   m u l t i p l e   a p p e a r a n c e s
  • Number of single-authored documents has the following formula:
A u t h o r s   o f   s i n g l e a u t h o r e d   d o c u m e n t s = N u m b e r   o f   S i n g l e   A u t h o r e d   D o c u m e n t s
  • Number of multi-authored documents has the following formula:
A u t h o r s   o f   m u l t i a u t h o r e d   d o c u m e n t s = N u m b e r   o f   M u l t i   A u t h o r e d   D o c u m e n t s
  • Single-authored documents contain only papers with 1 author, and the number is calculated based on the next metric:
S i n g l e A u t h o r e d   d o c u m e n t s = S i n g l e a u t h o r e d   d o c u m e n t s
  • Documents per author is calculated as
D o c u m e n t s   p e r   a u t h o r = D o c u m e n t s A u t h o r s
  • Authors per document is the opposite formula of the previous one:
A u t h o r s   p e r   d o c u m e n t = A u t h o r s D o c u m e n t s
  • Co-authors per document is an important metric:
C o a u t h o r s   p e r   d o c u m e n t = C o a u t h o r s D o c u m e n t s
  • Collaboration index is determined based on the following formula:
C o l l a b o r a t i o n   i n d e x = A u t h o r s   o f   M u l t i A u t h o r e d   A r t i c l e s M u l t i A u t h o r e d   A r t i c l e s
  • Bradford’s Law sorts the journals based on the number of articles into three different groups, equally divided into each group and the proportion of a journal in a group will be proportional with  1 : n : n 2  [56,57]:
J o u r n a l   P r o p o r t i o n = 1 : n : n 2
To facilitate the analysis of this dataset, we employed the Biblioshiny library in the R programming environment, which encompasses a suite of bibliometric tools. This analysis allowed us to extract the most pertinent and relevant information from the dataset. The choice for using Bibliometrix (Naples, Italy) is in line with other studies from the field, which have used the same software for a bibliometric analysis across various research fields [51,52,53,58,59,60]. Besides being open access, the R-based Bibliometrix package stands out due to its advanced visualization techniques [37,49].

3. Dataset Analysis

The dataset contains information about the most relevant papers that studied transportation and ABM domains and the focus is on the number of sources, citations, and authors, and the impact of the research.

3.1. Dataset Overview

The description of the dataset is provided in Table 2, Table 3, Table 4 and Table 5 by presenting several relevant statistics.
The timespan is between 2002 and 2023, from 519 published sources—see Table 2. Within our dataset of 1127 documents, the majority have been published in recent years, resulting in notably low average years from publication of 4.96. This trend underscores the contemporary scholarly focus on the transportation domain and ABMs. Moreover, the average number of citations per document stands at 21.41, reflecting the increasing interest of the scientific community in these subjects. Notably, there is a substantial average of 2.906 citations per year per document, emphasizing the ongoing relevance of the research.
However, it is important to note that the dataset comprises a substantial 45,200 references, with an average of 40.11 references per document. This underscores the depth and breadth of the literature informing the research within the transportation and ABM domains.
The annual scientific production serves as a pivotal indicator, offering insights into the progression of research within the analyzed domain. Notably, this indicator reveals a noteworthy evolution over the examined timeframe (Figure 2).
At the outset of our analysis, there is a discernibly scant number of papers. In 2002 and 2003, for instance, only two relevant articles are observed, and there is a dearth of such articles until 2008 (Figure 2).
However, from 2008 onwards, a distinct upward trajectory emerges, culminating in 2021, where we observe a zenith with a total of 138 articles. This remarkable increase demonstrates an annual growth rate of 21.67%, attesting to the growing scholarly interest and productivity within the domain (Figure 2).
The average article citations per year serves as an informative metric, highlighting a discernible positive trend spanning from 2002 to 2023 (Figure 3).
The zenith in this metric was observed in 2008, with an average of 31.57 citations per article (Figure 3). However, it is noteworthy to acknowledge that this year represented an exception. Subsequent to this peak, in the following year, the average declined to 3.68 citations per article, which aligns closely with the overall average spanning the entire period.
This fluctuation underscores the variable citation patterns within the domain, with 2008 presenting an anomaly amidst the broader trajectory (Figure 3). In the year 2008, the document identified as the most globally cited (authored by Gonzalez et al. [61]—as presented in Table 6) was published, accumulating a notable 5.5-fold citation advantage over the second-ranked document (3749 citations compared to 664 citations). In order to assess the impact of each article, the information provided in Figure 3 uses a specific metric named MeanTCperArt (mean total citations per article). As revealed in Figure 3, a substantial disparity between 2008 and subsequent years is observed, largely attributed to the influential paper authored by Gonzalez et al. [61].
The number of keywords plus, which are automatically generated from the titles of the articles, is 2275, with an average of 2.01 keywords per document—see Table 3. The authors’ keywords are 3379, with an average of 2.99 per document.
With regard to authors, our analysis has identified a total of 3394 unique authors, contributing to a cumulative count of 4295 appearances, as presented in Table 4. Notably, the occurrence of single-authored documents within the dataset is relatively limited, encompassing only 54 out of the 1127 analyzed documents. This paucity of single-authored documents can be attributed to the inherent complexity of the examined domain, particularly when endeavors involve the fusion of transportation and ABMs.
This supposition finds support in the number of authors affiliated with multi-authored documents, which totals 3340, a figure in close proximity to the total unique author count. It underscores the collaborative nature of research within this domain, where scholars frequently collaborate to navigate its intricate terrain.
Table 5 provides insights into author collaboration patterns. Among the documented statistics, there are 56 single-authored documents, a number closely aligned with the count of authors contributing to single-authored documents, which stands at 54. This implies that single authors, on average, have published approximately 1.03 documents each.
Examining the metric of documents per author, we observe a value of 0.332. This figure can be attributed to the comparatively larger number of authors in relation to the total published articles, resulting in a modest average authorship contribution per document, with each author, on average, contributing to less than one article.
For documents involving two or more authors, the metric co-authors per document registers at 3.81, while the collaboration index is calculated at 3.12. These values align with expectations for domains as intricate as transportation and ABMs, which typically necessitate the collective expertise of multiple specialists, thus reflecting a normative level of collaboration.

3.2. Sources

The identification of the most influential sources is a critical indicator, offering insights into the prevailing publication trends within specific journals. Foremost among these is ‘Sustainability’, a prominent international journal renowned for its extensive coverage, with a substantial tally of 33 published articles (as illustrated in Figure 4).
Notably, there are three other journals that closely rival “Sustainability” in terms of relevance. These include “Transportation Research Record”, “Jass—The Journal of Artificial Societies and Social Simulation”, and “Ecological Modelling”—each of them with 24 papers.
Furthermore, several other journals have emerged as significant contributors to the literature, such as “Transportation Research Record” and “computers Environment and Urban Systems”—with, respectively, 23 and 22 papers each.
For a comprehensive listing of the top 20 most influential sources, please refer to Figure 4.
The importance of journals is further underscored through Bradford’s Law, which demarcates distinct zones for the most frequently cited articles, distinguishing them from less cited ones based on the number of citations received.
Figure 5 illustrates Bradford’s Law applied to source clustering, featuring journals with more than 20 papers. This analysis underscores the extensive dissemination of research in the transportation and ABM domain across a multitude of journals, indicative of its diverse and far-reaching scholarly presence.
At the forefront of this distribution, we find “Sustainability” to be the most prominent journal, boasting the highest number of articles. The remaining journals included in this analysis are detailed in Figure 5.
The H-Index, a commonly employed indicator to assess the significance of a journal, measures the number of publications within a journal that have garnered citations equal to or exceeding the H-value.
Figure 6 presents data pertaining to 18 journals, each possessing an H-Index surpassing the threshold of 6. Notably, “Transportation Research Part C—Emerging Technologies” secures the highest H-Index in this context, with a score of 16. “Transportation Research Part A—Policy and Practice” follows closely behind with an H-Index of 13. The lowest H-Index value among the top 18 is attributed to the “Energies”, “Energy policy”, “ISPRS International Journal of Geo-Information”, “Sustainable Cities and Society”, and “Transportation Research Part D—Transport and Environment” journals, which stand at an H-Index of 6. Additionally, “Applied Sciences” registers an H-Index of 1, indicating a relatively lower citation impact within this dataset, but with prospectives to increase in the future as the domain continues to develop and the journal supports the development of this field through a series of special issues dedicated to ABM in transportation.
Another pivotal indicator is the growth trajectory of journals, as exemplified in Figure 7, which focuses on the five most prominent journals in the dataset. It is noteworthy that until 2007, none of these journals had published any articles.
For instance, the foremost journal, “Sustainability”, saw its inaugural publication in 2013, followed by a hiatus until 2018. Subsequently, from 2019 onwards, there was a remarkable surge in articles, with over 33 publications recorded by 2023.
Similarly, the remainder of the journals listed in Figure 7 exhibited a parallel growth pattern, closely trailing “Sustainability” and demonstrating analogous evolutions throughout the study period.

3.3. Authors

Figure 8 illustrates the most prolific authors within the domains of transportation and ABMs, showcasing those with a substantial body of work, comprising more than six published articles. This selection was made with the intent of identifying authors who have made particularly significant contributions, necessitating a threshold of at least five published articles.
Notably, authors Cotfas L.A. and Delcea C. emerge as the most prolific, each boasting a total of 19 publications. Following closely, author Milne R.J. has contributed significantly with 15 articles. Subsequently, a cohort of authors, including Ignacollo M., Inturri G., Le Pira M., Pluchino A., Sharpnskykh A., Zhuge C.X., Shao C.F., Li X., Manley E., Salari M., Varga L., Wang Y., and Zhang L., and each feature prominently with a substantial body of work, contributing between 7 and 11 articles.
Considering the works of the above-mentioned authors, it can be observed that they mainly feature applications of ABM in the area of airplane boarding.
Figure 9 provides an insightful depiction of the publication distribution for the 16 most influential authors within the dataset. Notably, the initial phases of the analyzed period witnessed limited publication activity among these authors, with only a few articles in the early years.
However, a discernible shift occurs in subsequent years, particularly after 2017, marked by a substantial surge in their publication output. This pattern underscores a concentrated and impactful contribution to the scientific literature within the later stages of the study period, emphasizing the evolving prominence of these authors in the field of transportation and ABMs.
Figure 10 offers an overview of the most prominent affiliations within the dataset, featuring universities with more than 13 articles. We chose the threshold of 13 articles, as there were numerous universities with 12 publications, and this criterion allowed us to highlight the most influential institutions in the transportation and ABM domains.
Taking the lead is Delft University of Technology, with an impressive total of 43 published articles, cementing its position as the foremost institution in these domains. Following closely in second place is the Bucharest University of Economic Studies, with a notable 28 articles. The Beijing Jiaotong University secures third place, having contributed significantly with 25 papers. Further investigating the reasons behind the position of the above-mentioned universities regarding the topmost prolific universities from the point of view of number of publications in the area of agent-based modeling in transportation, we have observed that both Delft University of Technology and Bucharest University of Economic Studies provide agent-based-related courses. In the case of Delft University of Technology, the university offers a course called “Agent-based Modeling of Complex Adaptive Systems”, while in the case of Bucharest University of Economic Studies, the courses offered refer to “Fundamentals of Economic Cybernetics” and “Economic Cybernetics”.
The United States, with 285 published articles, emerges as the predominant leader among the countries represented in the dataset, contributing to nearly 25.28% of the total corpus. Notably, the United States stands out with the highest number of Multiple-Country Publications (MCPs) at 51 papers, denoting collaborations between authors from different countries, as well as the highest count of Single-Country Publications (SCPs) at 234 articles, reflecting collaborations within the same country. For a comprehensive breakdown of these statistics, please refer to Figure 11.
Within the top 10 contributing countries, China ranks second with 128 published articles, comprising 44 MCPs and 84 SCPs. The United Kingdom follows closely with 81 published articles, encompassing 26 MCPs and 55 SCPs. Germany and the Netherlands are next, with 62 and 56 published papers, respectively. Germany reports 38 SCPs and 24 MCPs, while the Netherlands has 15 MCPs and 41 SCPs. Canada is also noteworthy with 45 published papers, featuring 16 MCPs and 29 SCPs. Australia contributes 44 published papers, inclusive of 15 MCPs and 29 SCPs. Italy, with 34 published articles, records 13 MCPs and 21 SCPs, while France follows with 27 published papers, equally divided between 11 MCPs and 16 SCPs. Korea rounds out the top 10, contributing 23 published articles, comprising 8 MCPs and 15 SCPs (Figure 11).
Figure 12 provides a visual representation of the scientific production across various countries. The map employs a color spectrum, ranging from grey to various shades of blue, with the depth of color corresponding to the volume of published articles.
As anticipated, the United States of America leads the chart with the highest number of published articles, totaling 772. China secures the second position with 343 articles, followed by the United Kingdom in third place with 230 papers. Germany and the Netherlands occupy the fourth and fifth positions with 143 and 120 articles, respectively.
Figure 13 offers insights into the distribution of citations across various countries. Notably, the United States of America emerges as the most prominently cited country, with a total of 11,743 citations. The average number of citations per article from the United States stands at 41.2, constituting a substantial share of 48.88% of the total citations worldwide.
China secures the second position with 1762 citations, featuring an average article citation count of 13.76. This accounts for 7.33% of the total citations worldwide. The Netherlands ranks third with 1043 citations and an average article citation rate of 18.62, representing 4.34% of the total citations globally.
Figure 14 presents a country collaboration map, illuminating the extent of collaborative efforts among nations in producing high-quality scientific papers. Among the most prolific collaborative partnerships, the United States and China stand out with 21 joint papers, as do the United States and the United Kingdom, also with 21 collaborative articles.
Additionally, noteworthy collaborations include the United States and China, with 22 collaborations, the United States and Canada, contributing a total of 20 papers together, the United States and the United Kingdom, with 18 collaborations, and the United States and Romania, which have co-authored 15 articles (Figure 14).
Figure 15 presents the authors’ collaboration networks in which the isolated nodes have been removed. Also, the minimum number of edges has been set to two. As a result, seven clusters emerge with a total number of 23 authors.
Cluster 1, represented in red in Figure 15, is made by Cotfas L.A., Delcea C., Milne R.J., Salari M., Craciun L., and Molanescu A.G. and features papers written on ABM in airplane boarding [62,63,64,65,66].
Cluster 2, presented in blue in Figure 15, is made by Ignaccolo M., Inturri G., Le Pira M., Pluchino A., and Giuffrida N., focusing on topics related to stakeholders’ involvement in freight transport policies [67,68,69,70,71].
Cluster 3, colored in green in Figure 15, is composed by Sharpanskykh A., Curran R., and Janssen S. The authors have focused on ABM for studying the compliance with safety regulations in airline ground services [72,73,74,75].
Zhuge C.X., Dong C.J., and Shao C.F. (cluster 4, in violet) use ABM for locating public facilities for conventional and electric vehicles [76,77].
From clusters 5 to 7, each of them are made by two authors (Figure 15).
Martinez L.M. and Shen Y. (cluster 5, in brown) propose a model for simulating the potential impacts of high-speed rail on land cover in the Lisbon Metropolitan Area [78,79] and in Aveiro, Portugal [80].
Perez L. and Dragicevic S. (cluster 6, in grey) develop an ABM to integrate geographic information systems (GISs) in order to simulate the spread of a communicable disease in Metro Vancouver [81].
Stevenson M. and Thompson J. (cluster 7, in aqua) focus on vulnerable road users’ safety using ABM [82,83] and explore the effect of driver payment methods on driver fatigue, crash risk, and the response of enforcement agencies to major heavy-vehicle crashes [84].

3.4. Analysis of Literature

In this section, we have selected the top three most cited papers and we have analyzed them both from the point of view of the information accompanying the papers and from the point of view of their content.

3.4.1. Top Three Most Cited Papers—Overview

The top three most cited documents worldwide are presented in detail in Table 6, having information about the article, number of authors, region, total citations (TCs), total citations per year (TCY), and normalized TC (NTC), which explains the number of citations for each author who cites the document.
Table 6. Top three most globally cited documents.
No.Paper (First Author, Year, Journal, Reference)Number of AuthorsRegionTotal Citations (TCs)Total Citations per Year (TCY)Normalized TC (NTC)
1Gonzalez, M., 2008, Nature, [61]3USA3785235.567.99
2Fagnant, D.J., 2014, Transportation Research Part C: Emerging Technologies, [85]2USA68368.3016.43
3Bagstad, K.J., 2013, Ecosystem Services, [86]4USA, Spain34931.729.47
The paper authored by Gonzalez et al. [61] stands out as the most frequently cited, amassing a substantial citation count of 3785, in contrast to the second most cited paper, authored by Fagnant and Kockelman [85], which has garnered 683 citations, as indicated in Table 6. Moreover, the TCY indicator associated with the paper authored by Gonzalez et al. [61] exhibits a notably higher value when compared to the other top three selected papers, registering at 235.56.
The remaining papers featured in the list of the top three most cited papers each exhibit a substantial citation count, surpassing 340 citations. Furthermore, the top three selected papers achieve a TCY exceeding 30 and an NTC exceeding 9.
Notably, all the papers listed in the top three most cited papers have arisen from collaborative efforts among multiple authors.
The predominant geographical affiliation of the authors of the top three most cited papers is the United States (USA), followed by Spain (Table 6). This result was expected given the position of the USA in the top 20 countries with the most citations list provided in Figure 13.

3.4.2. Top Three Most Cited Papers—Review

Below, a concise overview of the papers featured in the top three most cited papers is presented, accompanied by summaries of their respective contributions.
Gonzalez et al. [61] conducted an analysis of human mobility patterns using a dataset comprising 100,000 individuals’ tracked mobile phones over a 6-month period. The primary objective of the study was to gain a comprehensive understanding of human mobility patterns, irrespective of the modes of transportation employed by the studied population. Drawing from the analyzed data, the authors noted that, despite the diverse travel histories of the individuals in the study, discernible yet replicable travel patterns emerged. The authors elucidated the significance of diffusion models, which estimate human trajectories based on specified constraints and priorities, yielding robust insights into mobility patterns. Unexpectedly, employing Levi flights and random walk models resulted in human trajectories appearing to be random and challenging to predict. However, the analysis using diffusion models revealed spatial and temporal regularities. Various simulations were conducted across diverse locations and timelines. The investigation incorporated the analysis of mobile phone towers, recorded tracks, and service area limitations, providing insights into human trajectories primarily characterized by short distances, with infrequent occurrences of longer distances (exceeding hundreds of kilometers). The frequency of returning to a location was found to be contingent on travel distances and the temporal availability of each individual. In conclusion, the study highlights the consistent and reproducible nature of human behavior, even under the impact of epidemics or emergencies. These findings bear significant relevance in the domains of traffic forecasting, the determination of variables for agent-based models, emergency response planning, a human mobility analysis, and urban planning considerations [61]. Further considering the citations for the paper authored by Gonzalez et al. [61], it can be observed that 23.79% of the citing papers have been published in journals indexed in the computers science information systems category of WoS (counting for 900 papers). The remainder of the citing references have been indexed in either computer science (computer science theory methods, computer science artificial intelligence, computer science interdisciplinary applications, computer science hardware architecture, computer science software engineering) or transportation-specific categories (transportation science technology, transportation, or urban and environmental sciences), counting for 53.89% of the citing papers. As for the evolution of the citations, it has been observed that the trend has been ascending in the 2008–2015 period. Between 2015 and 2021, the trend has been constant, a number of citations per year between 327 and 351 being recorded. In 2022, the number of citations was slightly smaller, reaching 275 citations.
Fagnant and Kockelman [85] introduced an agent-based model designed for the optimization of shared autonomous vehicle (SAV) operations. The central concept underlying this model involves the generation of trips within a grid-based urban environment, accounting for predefined origins, destinations, and departure times. Additionally, the model incorporates elements to replicate realistic travel patterns. To validate the effectiveness of the model, a case study is presented, focusing on a mid-sized city. According to the authors, preliminary findings suggest that each SAV has the potential to replace approximately eleven conventional vehicles while introducing a modest increase of approximately 10% in travel distance compared to non-shared autonomous vehicle journeys of a similar nature [85]. This, in turn, results in overall positive emission impacts when accounting for fleet-efficiency improvements and emission profiles both during production and in-use phases [85]. Furthermore, one of the authors of the study (Kockelman K.M.) has collaborated with two other researchers (Chen D.T. and Hanna J.P.) on another work regarding the implications of vehicle and charging infrastructure, which holds fourth place based on the number of citations, gathering 220 citations, with a TCY of 22.00 and an NTC of 5.13. In this paper, Chen et al. [1] commence their study by building upon a finding that underscores the sensitivity of fleet size to factors such as battery recharge time and vehicle range. The authors proceed to explore the implications of decisions related to both vehicles and charging infrastructure. The researchers specifically analyze travel patterns within the context of Austin, Texas, and employ an agent-based modeling approach to simulate the operations of a shared autonomous vehicle fleet. The results of their investigation reveal a significant dependence of fleet size on the adequacy of charging infrastructure and vehicle range [1]. Notably, from a financial perspective, the analysis suggests that despite necessitating the largest fleet and the most charging stations, the base 80-mile-range shared autonomous electric vehicle (SAEV) fleet equipped with Level II charging stations emerges as the most cost-effective option on a per-mile basis among all the electric vehicle (EV) scenarios considered [1]. In terms of citations, it has been observed that 582 of the 683 citing papers (representing 85.21%) have been published in areas related to transportation science technology and transportation in the WoS platform, highlighting once more the contribution of the paper authored by Fagnant and Kockelman [85] to the transportation field.
Bagstad et al. [86] place particular emphasis on the significance of spatial connectivity between ecosystems and their beneficiaries within their research. In light of this focus, the authors introduced a class of agent-based models called Service Path Attribution Networks (SPANs) tailored to address a spectrum of ecosystem services, which correlates the source, sink, and locations. SPANs use different classes of agents: sink agents, who reduce the available quantity by carrier agents; carrier agents, which move between locations following specific routes; and user agents, which use the products from carrier agents, and if they are satisfied, can access more products from the carrier, or it has the possibility to buy from competitors. Furthermore, the SPAN Algorithm takes into account the individual traveler’s historical experiences and preferences, alongside considerations of distance, travel infrastructure, and available transportation modes [86]. The iterative process is repeated multiple times until the optimum is determined through simulations, utilizing various ecosystem services and activities such as carbon storage, subsistence fisheries, riverine food regulation, and recreation. Once the optimum is identified, the SPAN model aspires to integrate into the Artificial Intelligence for Ecosystem Service (ARIES) modeling platform. ARIES supports diverse ecosystems across different regions, each characterized by unique particularities. Several approaches can be employed to identify the best model: modifying the existing SPAN model and ARIES to suit the problem, utilizing an already established SPAN model and adapting its code, or employing a system capable of calculating ecosystem system flows, such as InVEST Hydrology, even though it lacks a comprehensive overview of flow results. The authors intend to enhance these proposed models by exploring the integration of choice models and transportation network models into their analytical framework [86]. Considering the papers citing the work of Bagstad et al. [86], a steady interest for the work in the 2014–2021 period has been observed, in which the paper has received between 24 and 48 citations per year, with a visible increased interest in 2022, when the paper received a higher number of citations (58 citations).
Table 7 summarizes the main information related to the top three globally most cited papers.

3.4.3. Words Analysis

Words hold significant importance in a bibliometric analysis, as they provide insights into the practical applications of papers and the focal points of research. Within our dataset represented by keywords plus, the term ‘simulation’ emerged as the most frequently occurring word, with 148 instances. It was closely followed by “model” with 129 occurrences, “behavior” with 94 occurrences, “systems” with 61 appearances, “dynamics” with 60 occurrences, “impact” with 59 appearances, “optimization” with 55 occurrences, “framework” with 45 occurrences, “management” with 43 appearances, and “time” with 43 appearances.
Notably, the top 10 most frequent words identified in Table 8 are indicative of their integral role within the transportation and ABM domains, underscoring their prevalence and relevance in the field.
Table 9 provides a comprehensive overview of the ten most frequently occurring keywords authored by researchers. These keywords reflect the specific focus of their studies within the transportation domain and ABM.
Notably, the top three keywords—“agent-based model” (214 occurrences), “agent-based modeling” (208 occurrences), and “agent-based modelling” (119 occurrences)—underscore the prominence of ABMs in the research. Additionally, the term “simulation” (59 occurrences) plays a significant role in these studies.
Furthermore, “electric vehicles” (46 occurrences), “agent-based simulation” (41 occurrences), “agent-based models” (28 occurrences), “multi-agent systems” (18 occurrences), “COVID-19” (17 occurrences), and “airplane boarding” (15 occurrences) round out the list, each indicative of their relevance and alignment with the transportation domain and ABM. These keywords offer valuable insights into the key areas of interest and expertise within scholarly discourse.
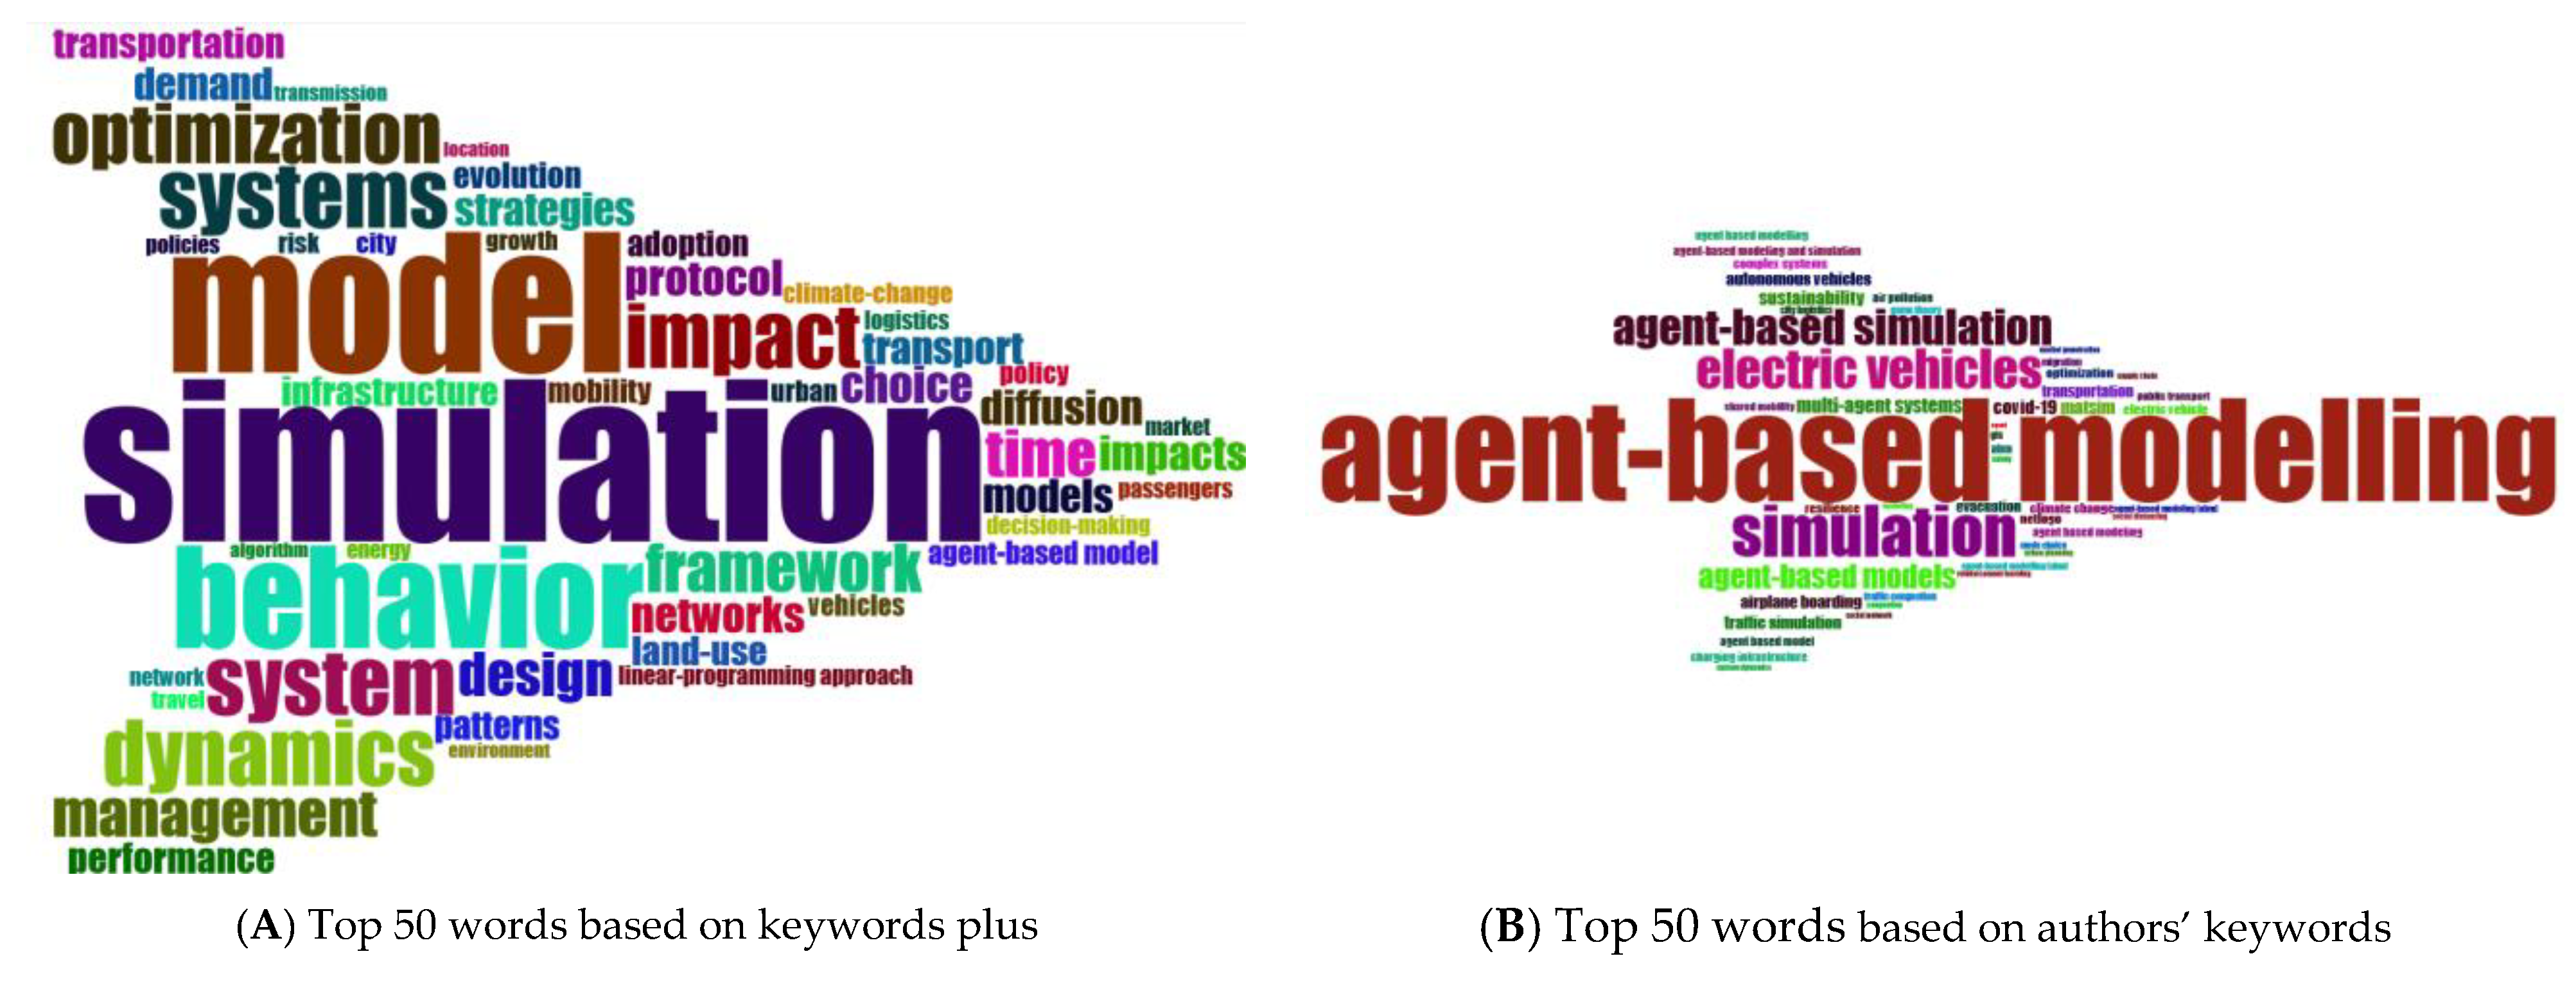
Figure 16 provides a comprehensive visualization of the top 50 most frequently used words derived from both keywords plus and authors’ keywords. The visualization is segmented into two clusters: Cluster A, which emphasizes keywords plus, and Cluster B, which centers on authors’ keywords.
In Cluster A, focusing on keywords plus, we observe a Word Cloud wherein the most representative words include “simulation”, “model”, “behavior”, “system”, “dynamics”, “impact”, “optimization”, “framework”, and “management”. These terms encapsulate the predominant themes and concepts associated with the research in this domain.
Cluster B, on the other hand, concentrates on authors’ keywords. This Word Cloud features the most frequently occurring terms within this category, such as “agent-based modelling”, “simulation”, “electric vehicles”, “COVID-19”, “agent-based models”, “airplane boarding”, “optimization”, “traffic simulation”, “agent-based simulation”, “climate change”, and “agent-based modeling”.
Considering the two Word Clouds presented in Figure 16, it can be observed that the authors’ keywords are focusing more on the modeling and analysis techniques used in their papers (e.g., “agent-based modelling”, “agent-based models”, “agent-based modeling”, “agent-based simulation”) and the field of the transportation area in which they have been used (e.g., “electric vehicles”, “airplane boarding”, “traffic simulation”), while with the keywords plus, which are automatically generated by the WoS platform, the focus is more on generic words related to the analysis conducted in the paper, rather than on the various fields in the transportation field. Regarding the length of the keywords, it can be observed that the authors’ keywords are composed from several words (in general bigrams), while the keywords plus are composed of a single word (unigrams).
Table 10 presents a valuable analysis of the ten most frequently occurring word pairs, or bigrams, within the abstracts and titles of the analyzed papers. This analysis sheds light on the predominant word combinations that are commonly used in the corpus of research.
In the abstracts, the most prevalent bigram is “agent-based model” with a substantial 565 occurrences. It is followed by “agent-based modeling” with 224 appearances, “electric vehicles” with 137 instances, “agent-based models” with 136 mentions, “agent based modeling” with 121 instances, “simulation results” with 90 occurrences, “agent based” with 87 appearances, and “simulation model” with 79 mentions, while “model abm” and “agent_based simulation” complete the list with 78 and 74 occurrences, respectively.
Similarly, in the titles of the papers, notable bigrams include “agent-based model” with 153 occurrences, “agent based modeling” with 105 mentions, “agent-based modelling” with 67 appearances, and “agent-based simulation” with 30 occurrences. Other significant bigrams include “electric vehicle” and “electric vehicles” (43 and 31 occurrences each, respectively), “agent based” (28 occurrences), “agent-based approach” (24 occurrences), and “modeling approach” and “agent-based models” (23 and 22 occurrences each, respectively).
Table 11 presents top 10 most frequent trigrams found in abstracts and titles. Similar with bigrams, most of the trigrams are related to the agent-based modelling domain or transportation domain. In abstracts, the top 10 trigrams are “agentbased model abm”, which has 65 occurrences, “agent based model” with 39 appearances, “agent_based modelling abm” with 32 appearances, “agent_based modeling abm”, which has 31 occurrences, “agent_based simulation model” with 31 occurrences, “electric vehicles evs”, which has 24 occurrences, “agent_based models abms” with 21 appearances, “agent based modeling” with 18 occurrences, and “agent_based modeling approach” and “agent_based modeling framework” with 16 appearances for each one.
In titles, the top 10 most popular trigrams are “agent_based modeling approach”, which has 19 appearances, “electric vehicle charging” with 15 occurrences, “agent_based modelling approach”, which has 11 occurrences, “agent based model” and “agent_based modelling framework” with 8 occurrences for each one, “agent_based simulation approach” with 7 appearances, and “agent based modelling”, “agent_based simulation model”, “electric vehicle adoption”, and “vehicle charging infrastructure” with 6 appearances for each one.
Furthermore, as most of the identified n-grams are related to the ABM field, we have further proceeded to eliminating some of the ABM-specific bigrams from abstracts, as well as eliminating bigrams related to the model or some other methods used in the paper. Some examples of the removed bigrams are “agent_based model”, “agent_based modelling”, “agent_based models”, “agent_based modelling”, “simulation results”, “model abm”, “agent based”, “simulation model”, “agent_based simulation”, “proposed model”, “based model”, “modeling framework”, “mode choice”, “modeling abm”, “modelling abm”, “empirical data”, “simulation models”, “modeling approach”, “system dynamics”, “experimental results”, “model results”, “modelling approach”, and “models abms”. As a consequence of this curation, the bigrams related to the transportation field have been identified as presented in Table 12.
From Table 12, it can be observed that a series of bigrams are related to road transport (e.g., “electric vehicles”, “road network”, “traffic congestion”, “traffic flow”, “electric vehicle”, “charging stations”), while others refer to air transport (e.g., “boarding methods”). Nevertheless, a series of bigrams are related to public transport in general, such as “public transport”, “travel demand”, “transportation system”, “travel time”, and “transportation systems”. Few bigrams discuss the effects of transportation over climate (e.g., “climate change”, “air pollution”) or on public health (e.g., “social distancing”).
Given the evolution of the annual scientific production provided in Figure 2, three distinct temporal periods emerge: 2002–2012, 2013–2017, and 2018–2023.
These distinct periods are characterized by significant deviations in annual publication trends. To attain a more comprehensive insight into the longitudinal thematic evolution within the domains of economics and education, a rigorous analysis was undertaken spanning these delineated time frames. The distribution of the themes has been divided into four main categories: Basic Themes, Motor Themes, Niche Themes, and Emerging or Declining Themes – which will be discussed in the following for each of the three considered situations (please consider Figure 17,Figure 18 and Figure 19).
Figure 17 unveils a discernible pattern during the initial period (2002–2012). Within this timeframe, the predominant thematic emphasis in abstract discussions centered on the exploration of ABM as a means to address issues in freight transportation. Additionally, in the realm of themes identified for this period as basic themes, a noteworthy portion of research endeavors were directed toward the fields of “transportation system/systems” and “travel demand” (Figure 17). As for the motor themes category, one can identify the “freight transportation” theme. Also, as a niche theme, it can be observed that for this period of time, “climate change” emerges, even though the importance given to this aspect seems to be limited as depicted in Figure 17 where the bubble associated with this item is relatively small, accounting for only two contributions.
As for the pattern observed for the 2013–2017 period, from the bigram analysis in abstracts, it can be observed that the focus shifted to “electric vehicles”, identified as a motor theme (Figure 18). Also, the shift of the “climate change” theme from the niche themes section to the motor themes section can be observed. Meanwhile, it can be noticed that for the mentioned period, the bigrams related to “road network”, “travel time”, and “transportation system” are listed as basic themes for the ABM in transportation, while “supply chain” gained more and more interest from the research community, accounting this time for 40 elements. In terms of “freight transport”, a decline in this theme can be observed, being placed at the borderline between the nice and emerging/declining themes, suggesting a decline in the interest for this theme in the selected research papers. Also, regarding the issues discussed in the scientific papers in connection with the freight transportation theme, a shift has been observed from the 2002–2012 period, in which the focus was on policy measures, a policy analysis, and a modal shift in freight transportation, to the 2013–2017 period, in which the focus was on urban freight transportation, transport planning, and the potential benefits of using urban freight. Furthermore, in the niche themes, we can observe the bigrams related to “transportation systems” and looking at the included papers, it can be observed that these refer to the air transportation and commercial aviation, so one can highlight the increasement in the interest in the area of air transport.
Moreover, during the period spanning 2018–2023, an observable transition is noted in the thematic content of papers associated with the “electric vehicles” bigram. These papers have shifted towards fundamental themes (marked as “basic themes” in Figure 19), while those linked to the “road network” bigram faced an increase in interest from the research community moving toward the “motor themes” section in the context of ABM in transportation. Moreover, “climate change” has emerged as a “basic theme”. Considering the entire 2002–2023 period, it can be observed how the “climate change” theme has emerged from a niche theme to a motor theme, and later on as a basic theme within the transportation research area when ABM is used. The inclusion of “climate change” as a fundamental theme is not unexpected when considering other scholarly works employing a bibliometric analysis within the transportation domain. For instance, in the examination of equity in transportation by Ruiz-Perez et al. [42], the theme of “air pollution” (which in our case is included in “climate change”) is notably identified for the period spanning 2014 to 2020. The authors attribute the prevalence of this theme to a heightened concern regarding the environmental and public health impacts of transportation systems [42]. Notably, papers associated with the “supply chain” bigram are the sole exceptions, as they have continued to be classified among the basic themes for this period. As for the “road network”, an increasement in the interest of the research community in this area can be observed, which made the theme shift from the basic themes in the 2013–2017 period toward the motor themes in the 2018–2023 period. Among the elements studied within the road network papers in the 2018–2023 period, one can identify public transport, autonomous vehicles, traffic congestion, travel demand, and travel time (Figure 19).
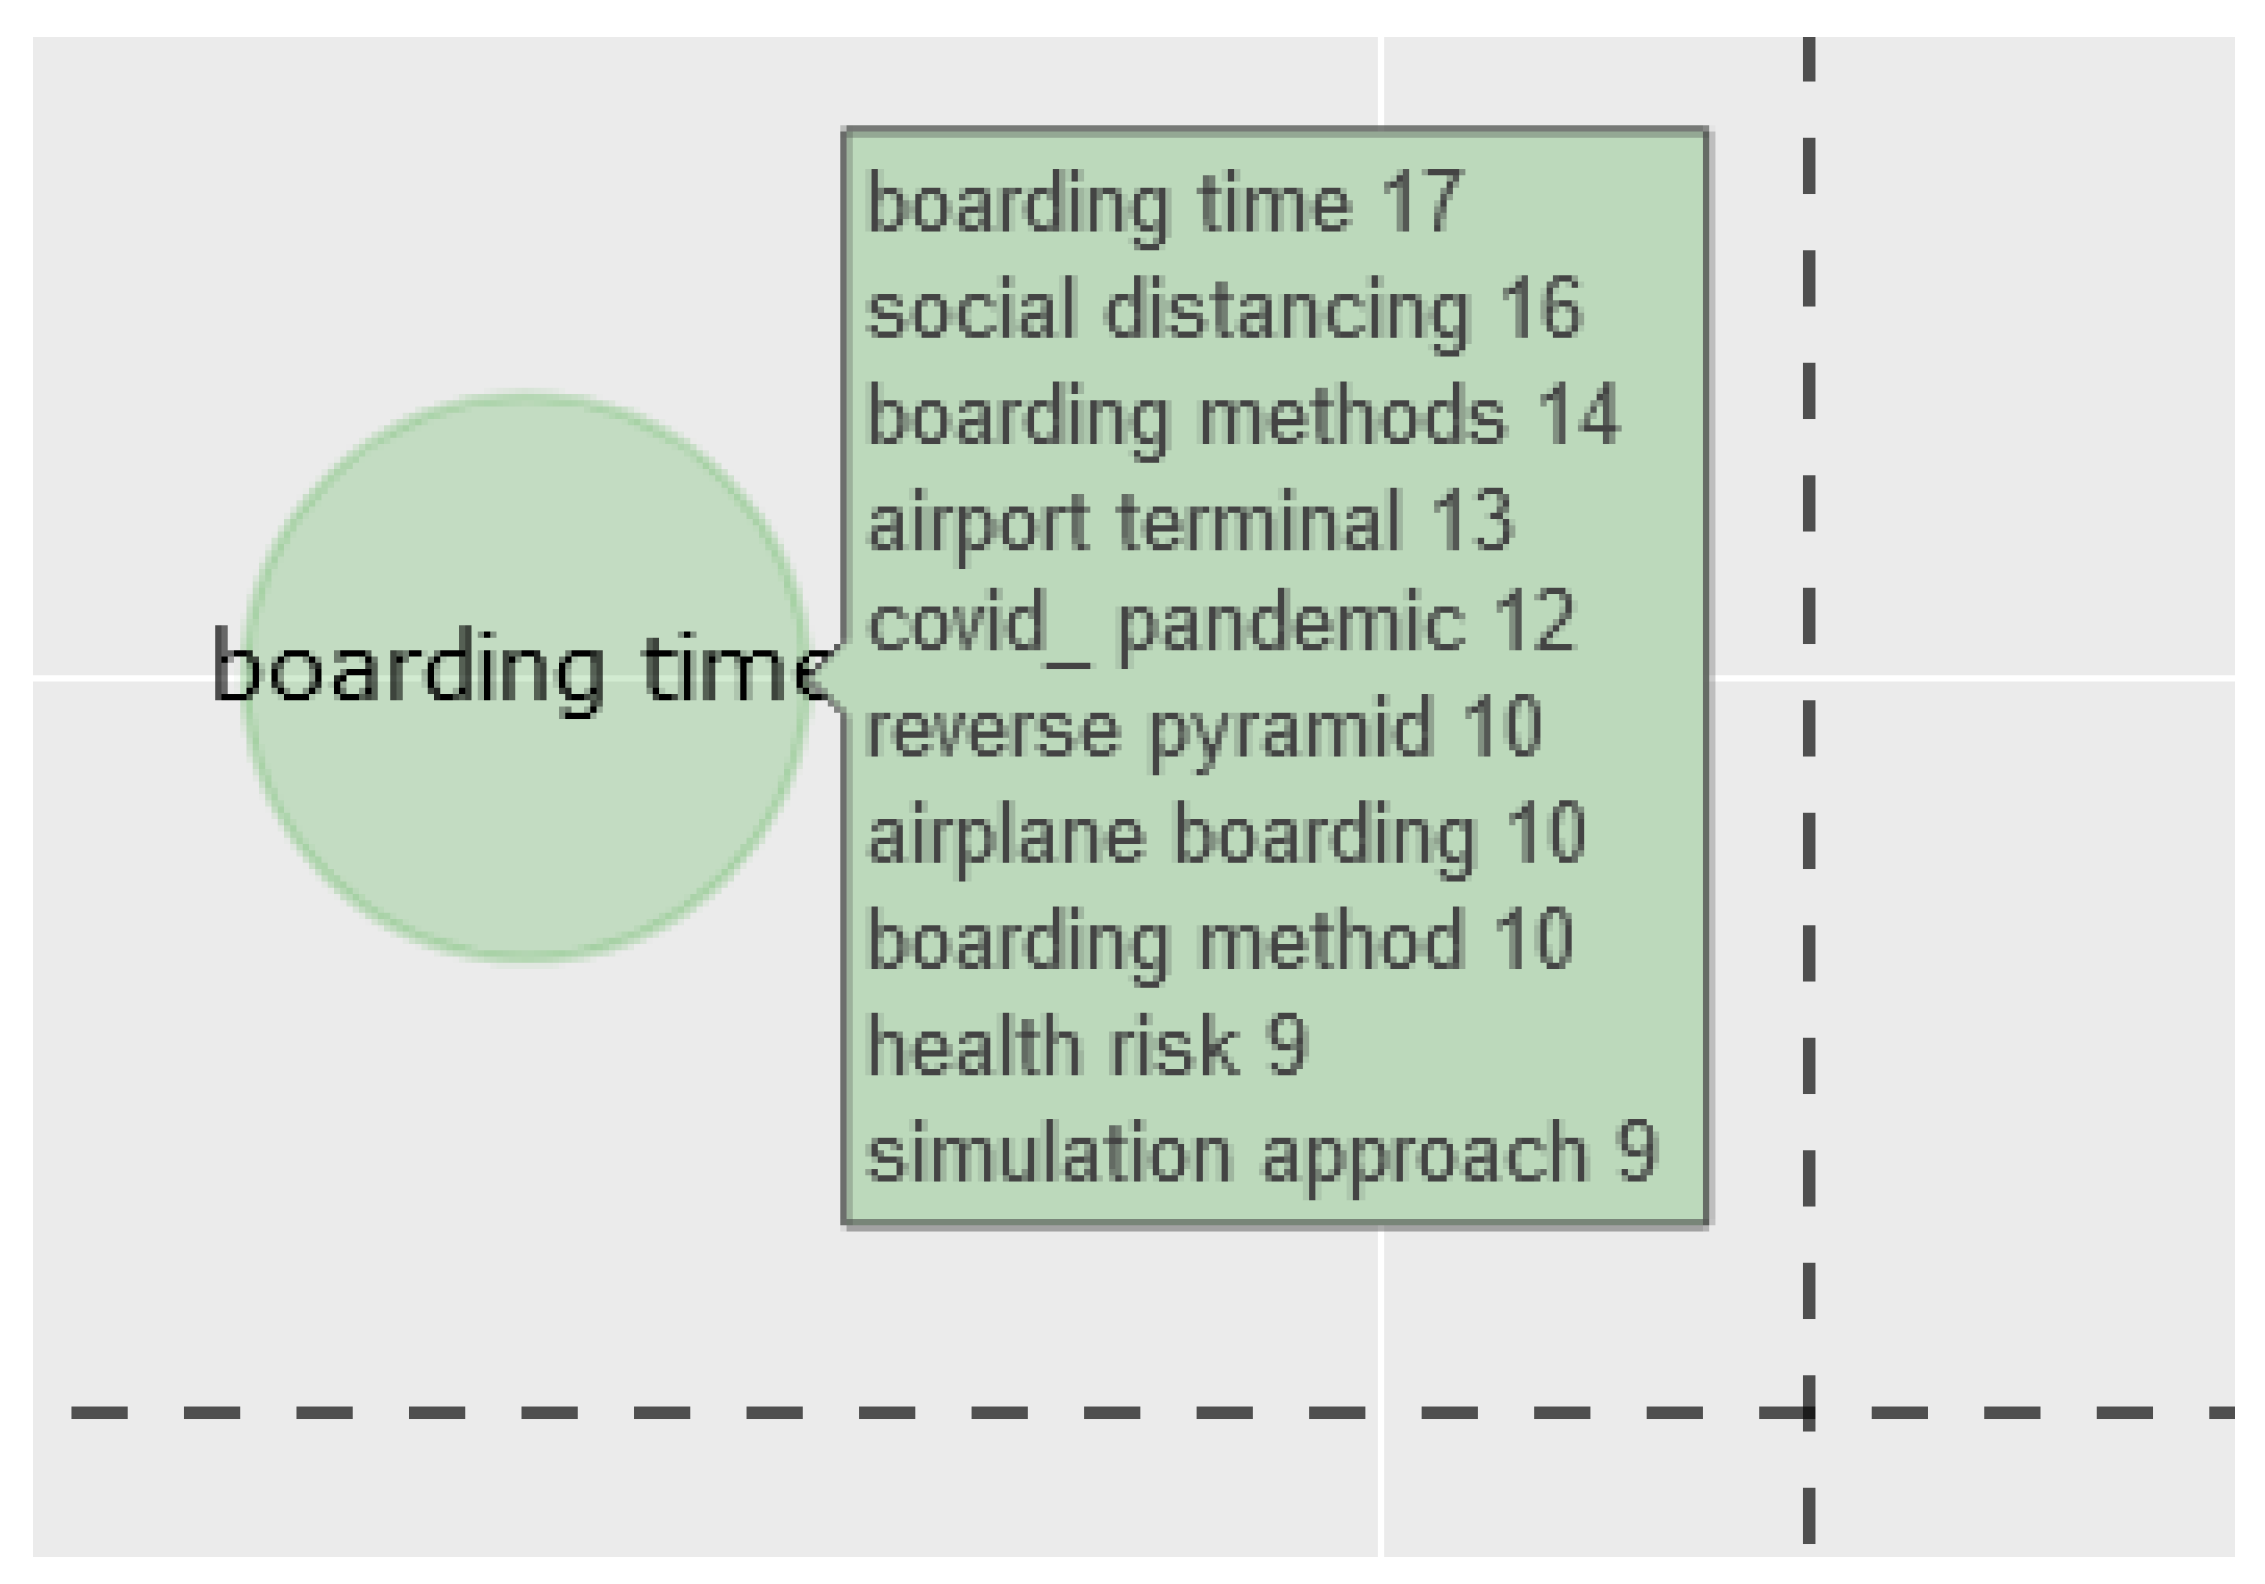
Also, “boarding time” occurs as a niche theme in 2018–2023. By further investigating the issues related to the “boarding time” bubble in Figure 20, it has been observed that the following bigrams are associated with it: “boarding time”, “social distancing”, “boarding methods”, “airport terminal”, “COVID_ pandemic”, “reverse pyramid”, “airplane boarding”, “health risk”, “boarding method”, “health risks”, and “simulation approach”. Referring to the papers in which these bigrams can be identified, it has been observed that they refer to the methods used to reduce the health risks and boarding time during the occurrence of the COVID-19 pandemic by either investigating the classical airplane boarding methods or with proposed alternative methods for passengers’ boarding for reducing the infection rate.
Figure 21 presents the evolutionary framework of the three identified periods. By observing the flows in Figure 21, it can be observed that discernible patterns emerge, characterized by the convergence and divergence of topics into discrete thematic domains. It is noteworthy that in the initial period, the topic associated with the “climate change” bigram exhibited merging with the “transport system” topic bigram, and some of the topics associated with decision makers and freight transportation merged into the “electric vehicles” topic bigram identified for the second period. Furthermore, the “electric vehicles” topic bigram identified in the second period merged into the “electric vehicles” topic bigram identified in the third period.
Moreover, a substantial portion of topics within the 2013–2017 timeframe underwent a process of amalgamation into a wide range of thematic domains in the subsequent 2018–2023 period as depicted in Figure 21, highlighting the dynamicity of the ABM in the transportation field. Overall, it can be observed that most of the bigrams provided for the 2018–2023 period feature elements related to road transportation and climate change.
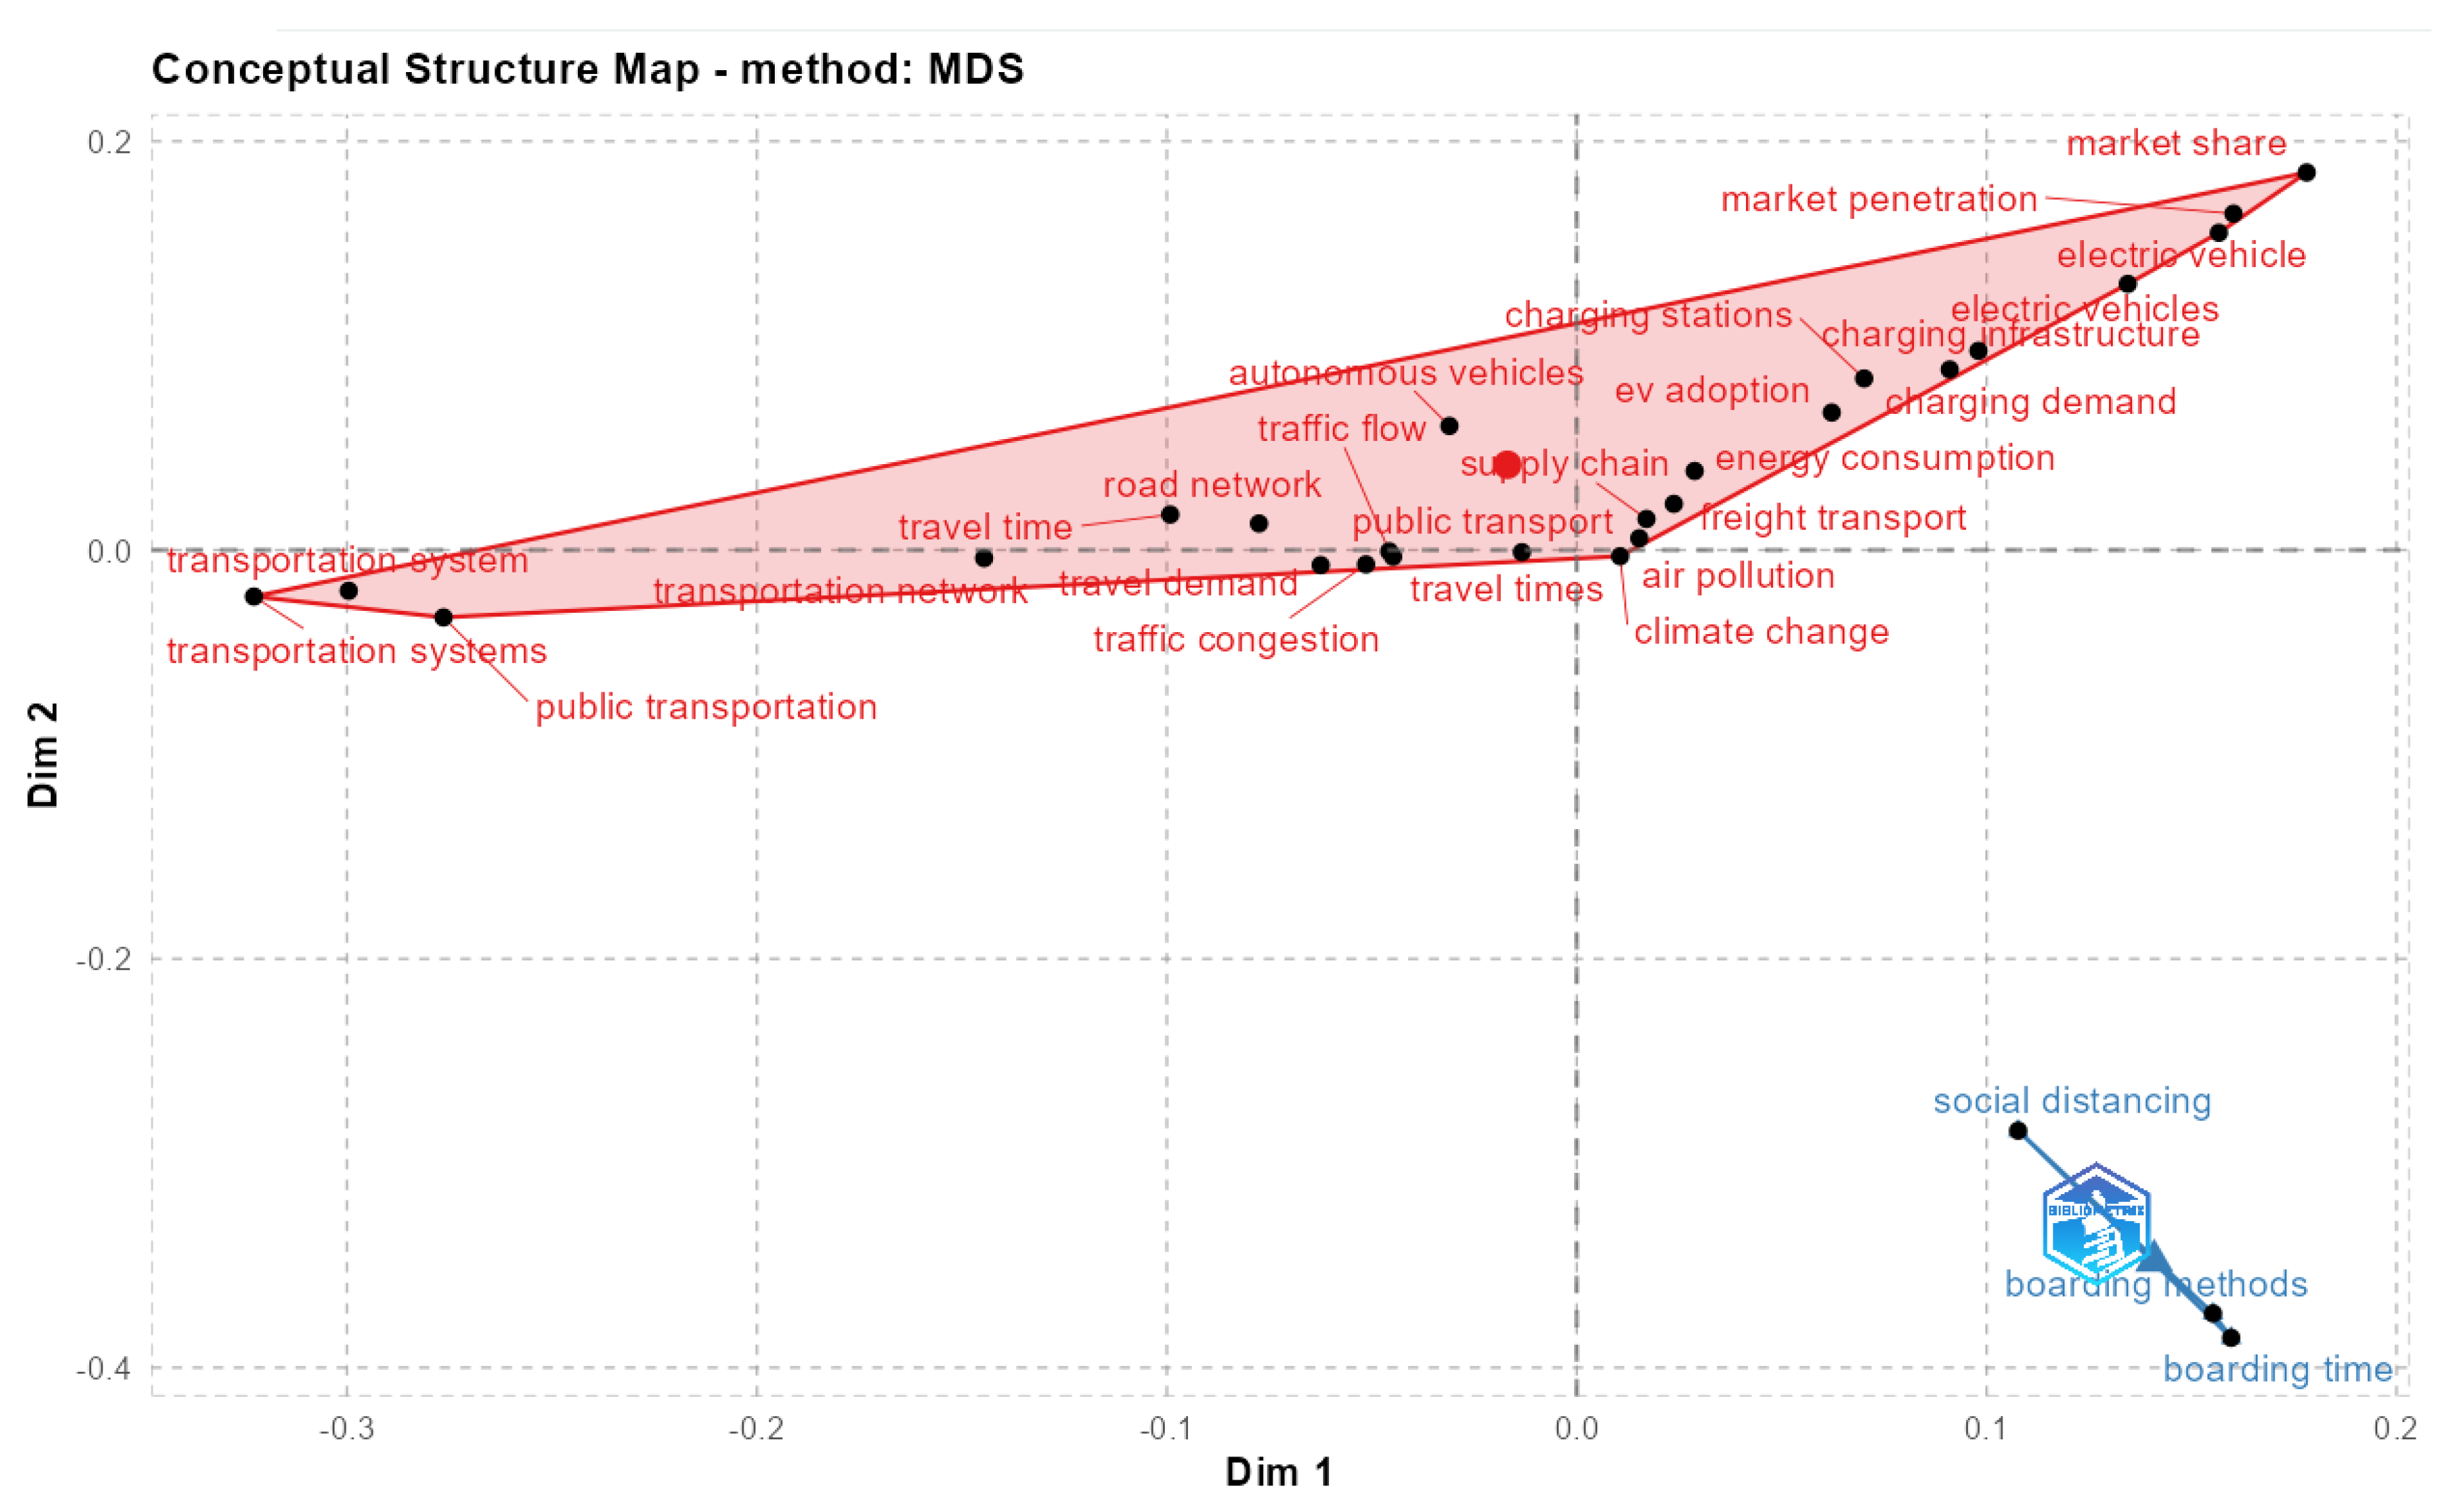
A comprehensive methodology was employed, adopting a factorial approach that leveraged multidimensional scaling (MDS). This approach was predicated on the utilization of bigrams extracted from the abstracts of all papers, following the exclusion of the most prevalent bigrams associated with ABM. The objective was to effectively streamline the intricate dimensions of research, resulting in the formation of discernible clusters, as visually depicted in Figure 22.
The cluster delineated in red within Figure 22 encompasses prominent bigrams related to three dimensions: the public transportation system in general (“public transportation”, “transportation system”, “transportation systems”), climate change issues (“climate change”, “air pollution”, “traffic congestion”, “travel times”, “travel demand”, “energy consumption”), and road transportation (“electric vehicle”, “ev adoption”, “charging stations”, “charging infrastructure”).
Conversely, the blue-colored cluster comprises bigrams associated with air transport (“boarding methods”, “boarding time”, “social distancing”), and it refers to the papers written in the COVID-19 pandemic period, which featured the development of better boarding strategies for airplane boarding in order to consider the social distance and to minimize the infection rate.
Based on the factorial map in Figure 22, the use of the ABM in modeling and solving transportation-related issues can be further highlighted in various areas of the transportation area, such as the motor theme of the road network, the niche theme of boarding time in air transport, or the basic themes of supply chain, electric vehicles, and climate change.

3.5. Mixed Analysis

Given the increasing significance of the transportation and ABM domains in recent years, it becomes imperative to explore the intricate relationships among authors, journals, countries, and universities when analyzing scholarly publications. These multifaceted relationships are portrayed through three-fold plots, and two such plots are featured in Figure 23 and Figure 24.
The triadic representations offer insights into the collaborative dynamics among authors hailing from different countries and their affiliations with specific journals. In Figure 16, the preeminent country in terms of collaborations emerges as Italy, reflecting its active engagement in international research endeavors. Notably, prolific authors such as Cotfas L.A. and Delcea C. are at the forefront of collaborative efforts, contributing significantly to the scholarship. The journal “Sustainability” stands out as the primary platform for publishing these collaborative articles, underscoring its central role in facilitating cross-border research collaborations (Figure 23).
Similarly, a triadic representation has been crafted for affiliations, authors, and keywords, providing valuable insights into the collaborative dynamics within the academic landscape. Figure 24 encapsulates these relationships.
Prominently featured in this graph is The Bucharest University of Economic Studies, an institution with notable contributions to the fields of ABM and airplane boarding. Two authors, Cotfas L.A. and Delcea C., from the mentioned university, have emerged as key figures within the ABM use in transportation.
Figure 24 serves as a visual representation of the collaborative interplay between affiliations, authors, and keywords, shedding light on the specialized areas of expertise and research focus within The Bucharest University of Economic Studies.

4. Limitations

While this analysis strives to identify the most pertinent papers within the realms of transportation and ABM, it is crucial to acknowledge certain inherent limitations that temper the scope of this study.
Firstly, our analysis exclusively focuses on articles published in journals indexed by ISI Web of Science. Consequently, it does not encompass valuable insights that may be gleaned from scientific conference proceedings or research papers available in other databases, such as Scopus. This limitation may inadvertently omit significant contributions from these alternative sources.
Secondly, language constraints restricted our examination to papers published exclusively in English. Consequently, papers in other languages, though potentially valuable, were excluded from our analysis.
Furthermore, the scope of our analysis was delineated by a predefined set of keywords associated with ABM and the transportation domain, as detailed in Table 1.
This predetermined set of keywords may have inadvertently excluded pertinent papers that employ alternative terminology or encompass related subfields.
Lastly, while we employed the Biblioshiny library within the R programming language to facilitate our analysis, we acknowledge that other software applications may offer distinct perspectives and insights, and therefore, our findings are delimited by the specific tools employed. The choice for the use of Biblioshiny resides on the fact that it encompasses a comprehensive set of methods and techniques suitable for various bibliometric analyses, offering robust visualization tools and informative metrics and being easy to use, with a very friendly user interface and comparable with CiteSpace, which provides an overly complicated interface [87]. Notably, Biblioshiny surpasses alternatives like VOSviewer and SciMAT by allowing the simultaneous analysis of multiple sources [88]. Additionally, it provides a diverse range of graphs crucial for the bibliometric analysis [88], such as the H-index graphs or the map depicting authors’ production over the analyzed period—an essential element explaining the evolution of the domain and identifying key authors [89]. Also, Bibliometrix offers a series of metrics, including total sources, publications, and authors, that are directly extracted from the database [89]. Biblioshiny further distinguishes itself by offering customization options for graphs through filters, such as the number of authors to be presented, various limits, and the number of clusters [88]. This level of customization is not available in VOSviewer or SciMAT. Additionally, Biblioshiny provides unique features like tree maps, three-field plots, Word Clouds, and world maps—tools that significantly enhance the capability to conduct thorough Bibliometrix analyses [90]. Contrarily, VOSviewer has been found as lacking in stemming or lemmatization in keyword co-occurrence analyses and lacking functions for temporal analyses [87]. Leveraging the R programming language, Biblioshiny benefits from one of the largest global communities, facilitating ease of access to information and support [90]. This popularity positions Biblioshiny among the most widely used tools for a bibliometric analysis along with VoSviewer, Harzing’s Pulblish or Perish, and CiteSpace [87]), making it the choice for the bibliometric analysis used in this paper.

5. Conclusions

Since 2002, the fields of transportation and ABM have undergone a remarkable transformation, transitioning from relatively individual domains lacking clear correlations to becoming invaluable and influential scientific realms. This evolution has elucidated the dynamics of transportation and underscored the instrumental role played by ABM theory in anticipating future challenges. Our research endeavor aimed to identify the most salient authors, journals, and articles spanning the years from 2002 to 2023, all of which were sourced from the prestigious ISI Web of Science database (WoS platform).
Leveraging the bibliometric tools available within the Biblioshiny library, we facilitated a comprehensive analysis of the publications within this temporal spectrum. This analysis encompassed discerning the trajectory of papers published during the study period, identifying key countries and prolific authors, gauging the impact of individual papers, and scrutinizing citation frequencies across papers, journals, countries, and authors. Notably, we conducted an in-depth examination of the top three most impactful papers as measured by citations during the research period. Moreover, we scrutinized bigrams and trigrams—combinations of two and three words, respectively—to elucidate recurring lexical patterns in the papers. This multifaceted analysis facilitated an enhanced understanding of the evolution of these domains, the diverse methodologies employed by authors to expound upon ABM theory, and its practical implementation, thereby underscoring its growing significance within the field of transportation.
A rich array of graphical representations were harnessed to convey key findings, including the pivotal role of journal publications, prominent keywords, and abstract content. These representations encompassed collaboration maps, Word Clouds, thematic maps, and collaboration networks, which collectively illuminated the scholarly landscape.
We posit that future research endeavors may benefit from extending the analysis to encompass additional databases, such as Scopus or other pertinent public repositories within the transportation and ABM domains. Furthermore, we aim for future investigations to consider the inclusion of conference proceedings, in addition to journal publications, to attain a more comprehensive understanding of the evolving landscape.
In conclusion, we believe that the field of ABM and transportation remains an intriguing and evolving research domain. Its sustained relevance and expanding sphere of applicability are poised to continually captivate researchers worldwide in the foreseeable future.

Author Contributions

Conceptualization, A.D., C.D., N.C. and C.I.; Data curation, A.D.; Formal analysis, A.D., C.D. and C.I.; Funding acquisition, C.I.; Investigation, A.D., C.D., N.C. and C.I.; Methodology, A.D. and C.D.; Resources, N.C.; Software, A.D. and C.D.; Supervision, C.D.; Validation, A.D., C.D. and N.C.; Visualization, A.D., C.D., N.C. and C.I.; Writing—original draft, A.D. and C.D.; Writing—review and editing, N.C. and C.I. All authors have read and agreed to the published version of the manuscript.

Funding

The work is supported by a grant from the Romanian Ministry of Research and Innovation, project CNFIS-FDI-2023-0499. This paper was co-financed by the Bucharest University of Economic Studies during the Ph.D. program.

Institutional Review Board Statement

Not applicable.

Informed Consent Statement

Not applicable.

Data Availability Statement

Data is contained within the article.

Conflicts of Interest

The authors declare no conflict of interest.

References

  1. Chen, T.D.; Kockelman, K.M.; Hanna, J.P. Operations of a Shared, Autonomous, Electric Vehicle Fleet: Implications of Vehicle & Charging Infrastructure Decisions. Transp. Res. Part A Policy Pract. 2016, 94, 243–254. [Google Scholar] [CrossRef]
  2. Crooks, A.; Castle, C.; Batty, M. Key Challenges in Agent-Based Modelling for Geo-Spatial Simulation. Comput. Environ. Urban Syst. 2008, 32, 417–430. [Google Scholar] [CrossRef]
  3. Wilensky, U.; Rand, W. An Introduction to Agent-Based Modeling: Modeling Natural, Social, and Engineered Complex Systems with NetLogo; The MIT Press: Cambridge, MA, USA, 2015; ISBN 978-0-262-73189-8. [Google Scholar]
  4. Hamill, L.; Gilbert, N. Agent-Based Modelling in Economics, 1st ed.; Wiley: Chichester, UK; Hoboken, NJ, USA, 2016; ISBN 978-1-118-45607-1. [Google Scholar]
  5. Dragotă, V.; Delcea, C. How Long Does It Last to Systematically Make Bad Decisions? An Agent-Based Application for Dividend Policy. J. Risk Financ. Manag. 2019, 12, 167. [Google Scholar] [CrossRef]
  6. Doran, J. Agent-Based Modelling of Ecosystems for Sustainable Resource Management. In Multi-Agent Systems and Applications; Luck, M., Mařík, V., Štěpánková, O., Trappl, R., Eds.; Lecture Notes in Computer Science; Springer: Berlin/Heidelberg, Germany, 2001; Volume 2086, pp. 383–403. ISBN 978-3-540-42312-6. [Google Scholar]
  7. Miller, K.D. Agent-Based Modeling and Organization Studies: A Critical Realist Perspective. Organ. Stud. 2015, 36, 175–196. [Google Scholar] [CrossRef]
  8. Mukherjee, S.; Singh, S. Agent-Based Modelling Techniques in Manufacturing Operations Overview: A Literature Review. In Proceedings of the 2021 IEEE Region 10 Symposium (TENSYMP), Jeju, Republic of Korea, 23–25 August 2021; IEEE: Jeju, Republic of Korea, 2021; pp. 1–6. [Google Scholar]
  9. Rand, W.; Rust, R.T. Agent-Based Modeling in Marketing: Guidelines for Rigor. Int. J. Res. Mark. 2011, 28, 181–193. [Google Scholar] [CrossRef]
  10. Zhou, Z.; (Victor) Chan, W.K.; Chow, J.H. Agent-Based Simulation of Electricity Markets: A Survey of Tools. Artif. Intell. Rev. 2007, 28, 305–342. [Google Scholar] [CrossRef]
  11. Bruch, E.; Atwell, J. Agent-Based Models in Empirical Social Research. Sociol. Methods Res. 2015, 44, 186–221. [Google Scholar] [CrossRef] [PubMed]
  12. Hunter, E.; Namee, B.M.; Kelleher, J.D. A Taxonomy for Agent-Based Models in Human Infectious Disease Epidemiology. J. Artif. Soc. Soc. Simul. 2017, 20, 2. [Google Scholar] [CrossRef]
  13. El-Amine, S.; Galland, S.; Yasar, A.-U.-H.; Koukam, A. Towards Agent Based Modeling for Mobility Behavior Shift. Procedia Comput. Sci. 2017, 109, 949–954. [Google Scholar] [CrossRef]
  14. Wu, G.; Zhong, B.; Si, H.; Wei, B.; Wu, Q.; Song, C. Agent-Based Modeling in Land Use and Land Cover Change Studies. In Proceedings of the Geoinformatics 2007: Remotely Sensed Data and Information, Nanjing, China, 25–27 May 2007; Ju, W., Zhao, S., Eds.; p. 675232. [Google Scholar]
  15. Raoufi, M.; Fayek, A.R. Integrating Fuzzy Logic and Agent-Based Modeling for Assessing Construction Crew Behavior. In Proceedings of the 2015 Annual Conference of the North American Fuzzy Information Processing Society (NAFIPS) Held Jointly with 2015 5th World Conference on Soft Computing (WConSC), Redmond, WA, USA, 17–19 August 2015; IEEE: Redmond, WA, USA, 2015; pp. 1–6. [Google Scholar]
  16. Friesen, M.R.; Laskowski, M.; Demianyk, B.; McLeod, R.D. Work in Progress —Developing Educational Opportunities in Agent-Based Modeling. In Proceedings of the 2010 IEEE Frontiers in Education Conference (FIE), Arlington, VA, USA, 27–30 October 2010; IEEE: Arlington, VA, USA, 2010; pp. T2F-1–T2F-3. [Google Scholar]
  17. Lake, M.W. Trends in Archaeological Simulation. J. Archaeol. Method Theory 2014, 21, 258–287. [Google Scholar] [CrossRef]
  18. Page, C.L.; Bazile, D.; Becu, N.; Bommel, P.; Bousquet, F.; Etienne, M.; Mathevet, R.; Souchère, V.; Trébuil, G.; Weber, J. Agent-Based Modelling and Simulation Applied to Environmental Management. In Simulating Social Complexity; Edmonds, B., Meyer, R., Eds.; Understanding Complex Systems; Springer Berlin Heidelberg: Berlin/Heidelberg, Germany, 2013; pp. 499–540. ISBN 978-3-540-93812-5. [Google Scholar]
  19. Delcea, C.; Cotfas, L.; Craciun, L.; Molanescu, A.G. Establishing the Proper Seating Arrangement in Elevated Lecture Halls for a Faster Evacuation Process. IEEE Access 2019, 7, 48500–48513. [Google Scholar] [CrossRef]
  20. Ionescu, Ș.; Nica, I.; Chiriță, N. Cybernetics Approach Using Agent-Based Modeling in the Process of Evacuating Educational Institutions in Case of Disasters. Sustainability 2021, 13, 10277. [Google Scholar] [CrossRef]
  21. Chen, Z. An Agent-Based Model for Information Diffusion over Online Social Networks. Pap. Appl. Geogr. 2019, 5, 77–97. [Google Scholar] [CrossRef]
  22. Bernaschi, M.; Castiglione, F. COMPUTATIONAL FEATURES OF AGENT-BASED MODELS. Int. J. Comput. Methods 2005, 2, 33–48. [Google Scholar] [CrossRef]
  23. Macal, C.; North, M. Introductory Tutorial: Agent-Based Modeling and Simulation. In Proceedings of the Winter Simulation Conference 2014, Savanah, GA, USA, 7–10 December 2014; IEEE: Savanah, GA, USA, 2014; pp. 6–20. [Google Scholar]
  24. Joo, J.; Kim, N.; Wysk, R.A.; Rothrock, L.; Son, Y.-J.; Oh, Y.; Lee, S. Agent-Based Simulation of Affordance-Based Human Behaviors in Emergency Evacuation. Simul. Model. Pract. Theory 2013, 32, 99–115. [Google Scholar] [CrossRef]
  25. Poulos, A.; Tocornal, F.; de la Llera, J.C.; Mitrani-Reiser, J. Validation of an Agent-Based Building Evacuation Model with a School Drill. Transp. Res. Part C Emerg. Technol. 2018, 97, 82–95. [Google Scholar] [CrossRef]
  26. North, M.J. Hammer or Tongs: How Best to Build Agent-Based Models? In Advances in Practical Applications of Agents, Multi-Agent Systems, and Complexity: The PAAMS Collection; Demazeau, Y., An, B., Bajo, J., Fernández-Caballero, A., Eds.; Lecture Notes in Computer Science; Springer International Publishing: Cham, Switzerland, 2018; Volume 10978, pp. 3–11. ISBN 978-3-319-94579-8. [Google Scholar]
  27. Salgado, M.; Gilbert, N. Agent Based Modelling. In Handbook of Quantitative Methods for Educational Research; Brill: Leiden, The Netherlands, 2013; pp. 247–265. ISBN 978-94-6209-404-8. [Google Scholar]
  28. Grimm, V.; Railsback, S.F.; Vincenot, C.E.; Berger, U.; Gallagher, C.; DeAngelis, D.L.; Edmonds, B.; Ge, J.; Giske, J.; Groeneveld, J.; et al. The ODD Protocol for Describing Agent-Based and Other Simulation Models: A Second Update to Improve Clarity, Replication, and Structural Realism. JASSS 2020, 23, 7. [Google Scholar] [CrossRef]
  29. Müller, B.; Bohn, F.; Dreßler, G.; Groeneveld, J.; Klassert, C.; Martin, R.; Schlüter, M.; Schulze, J.; Weise, H.; Schwarz, N. Describing Human Decisions in Agent-Based Models − ODD + D, an Extension of the ODD Protocol. Environ. Model. Softw. 2013, 48, 37–48. [Google Scholar] [CrossRef]
  30. Borgonovo, E.; Pangallo, M.; Rivkin, J.; Rizzo, L.; Siggelkow, N. Sensitivity Analysis of Agent-Based Models: A New Protocol. Comput. Math. Organ. Theory 2022, 28, 52–94. [Google Scholar] [CrossRef]
  31. Delcea, C.; Chirita, N. Exploring the Applications of Agent-Based Modeling in Transportation. Appl. Sci. 2023, 13, 9815. [Google Scholar] [CrossRef]
  32. Zang, X.; Zhu, Y.; Zhong, Y.; Chu, T. CiteSpace-Based Bibliometric Review of Pickup and Delivery Problem from 1995 to 2021. Appl. Sci. 2022, 12, 4607. [Google Scholar] [CrossRef]
  33. Videras Rodríguez, M.; Melgar, S.G.; Cordero, A.S.; Márquez, J.M.A. A Critical Review of Unmanned Aerial Vehicles (UAVs) Use in Architecture and Urbanism: Scientometric and Bibliometric Analysis. Appl. Sci. 2021, 11, 9966. [Google Scholar] [CrossRef]
  34. Gao, C.; Wang, J.; Dong, S.; Liu, Z.; Cui, Z.; Ma, N.; Zhao, X. Application of Digital Twins and Building Information Modeling in the Digitization of Transportation: A Bibliometric Review. Appl. Sci. 2022, 12, 11203. [Google Scholar] [CrossRef]
  35. Necula, S.-C.; Păvăloaia, V.-D. AI-Driven Recommendations: A Systematic Review of the State of the Art in E-Commerce. Appl. Sci. 2023, 13, 5531. [Google Scholar] [CrossRef]
  36. WoS Web of Science. Available online: Webofknowledge.com (accessed on 9 September 2023).
  37. Bakır, M.; Özdemir, E.; Akan, Ş.; Atalık, Ö. A Bibliometric Analysis of Airport Service Quality. J. Air Transp. Manag. 2022, 104, 102273. [Google Scholar] [CrossRef]
  38. Cobo, M.J.; Martínez, M.A.; Gutiérrez-Salcedo, M.; Fujita, H.; Herrera-Viedma, E. 25 Years at Knowledge-Based Systems: A Bibliometric Analysis. Knowl.-Based Syst. 2015, 80, 3–13. [Google Scholar] [CrossRef]
  39. Modak, N.M.; Merigó, J.M.; Weber, R.; Manzor, F.; Ortúzar, J.D.D. Fifty Years of Transportation Research Journals: A Bibliometric Overview. Transp. Res. Part A Policy Pract. 2019, 120, 188–223. [Google Scholar] [CrossRef]
  40. Mulet-Forteza, C.; Martorell-Cunill, O.; Merigó, J.M.; Genovart-Balaguer, J.; Mauleon-Mendez, E. Twenty Five Years of the Journal of Travel & Tourism Marketing: A Bibliometric Ranking. J. Travel Tour. Mark. 2018, 35, 1201–1221. [Google Scholar] [CrossRef]
  41. Marín-Rodríguez, N.J.; González-Ruiz, J.D.; Valencia-Arias, A. Incorporating Green Bonds into Portfolio Investments: Recent Trends and Further Research. Sustainability 2023, 15, 14897. [Google Scholar] [CrossRef]
  42. Ruiz-Pérez, M.; Seguí-Pons, J.M.; Salleras-Mestre, X. Bibliometric Analysis of Equity in Transportation. Heliyon 2023, 9, e19089. [Google Scholar] [CrossRef]
  43. Bao, L.; Kusadokoro, M.; Chitose, A.; Chen, C. Development of Socially Sustainable Transport Research: A Bibliometric and Visualization Analysis. Travel Behav. Soc. 2023, 30, 60–73. [Google Scholar] [CrossRef]
  44. Badassa, B.B.; Sun, B.; Qiao, L. Sustainable Transport Infrastructure and Economic Returns: A Bibliometric and Visualization Analysis. Sustainability 2020, 12, 2033. [Google Scholar] [CrossRef]
  45. Meyer, T. Decarbonizing Road Freight Transportation—A Bibliometric and Network Analysis. Transp. Res. Part D Transp. Environ. 2020, 89, 102619. [Google Scholar] [CrossRef]
  46. Kadam, S.; Bandyopadhyay, P.K.; Patil, Y. Mapping the Field through Bibliometric Analysis of Passenger Centric Railway Transportation. Int. J. Autom. Logist. 2016, 2, 349–368. [Google Scholar] [CrossRef]
  47. Yuniaristanto; Sutopo, W.; Hisjam, M.; Wicaksono, H. Electric Motorcycle Adoption Research: A Bibliometric Analysis. In Proceedings of the 6th Asia Pacific Conference on Manufacturing Systems and 4th International Manufacturing Engineering Conference; Rosyidi, C.N., Laksono, P.W., Jauhari, W.A., Hisjam, M., Eds.; Lecture Notes in Mechanical Engineering; Springer Nature: Singapore, 2023; pp. 131–138. ISBN 978-981-9912-44-5. [Google Scholar]
  48. Vizuete-Luciano, E.; Guillén-Pujadas, M.; Alaminos, D.; Merigó-Lindahl, J.M. Taxi and Urban Mobility Studies: A Bibliometric Analysis. Transp. Policy 2023, 133, 144–155. [Google Scholar] [CrossRef]
  49. Yakath Ali, N.S.; Yu, C.; See, K.F. Four Decades of Airline Productivity and Efficiency Studies: A Review and Bibliometric Analysis. J. Air Transp. Manag. 2021, 96, 102099. [Google Scholar] [CrossRef]
  50. Sun, L.; Yin, Y. Discovering Themes and Trends in Transportation Research Using Topic Modeling. Transp. Res. Part C Emerg. Technol. 2017, 77, 49–66. [Google Scholar] [CrossRef]
  51. Delcea, C.; Cotfas, L.-A. State of the Art in Grey Systems Research in Economics and Social Sciences. In Advancements of Grey Systems Theory in Economics and Social Sciences; Series on Grey System; Springer Nature: Singapore, 2023; pp. 1–44. ISBN 978-981-19993-1-4. [Google Scholar]
  52. Zardari, S.; Alam, S.; Al Salem, H.A.; Al Reshan, M.S.; Shaikh, A.; Malik, A.F.K.; Masood Ur Rehman, M.; Mouratidis, H. A Comprehensive Bibliometric Assessment on Software Testing (2016–2021). Electronics 2022, 11, 1984. [Google Scholar] [CrossRef]
  53. Marín-Rodríguez, N.J.; González-Ruiz, J.D.; Botero Botero, S. Dynamic Co-Movements among Oil Prices and Financial Assets: A Scientometric Analysis. Sustainability 2022, 14, 12796. [Google Scholar] [CrossRef]
  54. Cibu, B.; Delcea, C.; Domenteanu, A.; Dumitrescu, G. Mapping the Evolution of Cybernetics: A Bibliometric Perspective. Computers 2023, 12, 237. [Google Scholar] [CrossRef]
  55. FAQ. Available online: https://www.bibliometrix.org/home/index.php/faq (accessed on 20 November 2023).
  56. Wardikar, V. Application of Bradford’s Law of Scattering to the Literature of Library & Information Science: A Study of Doctoral Theses Citations Submitted to the Universities of Maharashtra, India. Libr. Philos. Pract. (E-J.) 2013, 1054. [Google Scholar]
  57. RDRR website Bradford: Bradford’s Law in Bibliometrix: Comprehensive Science Mapping Analysis. Available online: https://rdrr.io/cran/bibliometrix/man/bradford.html (accessed on 21 November 2023).
  58. Gorski, A.-T.; Ranf, E.-D.; Badea, D.; Halmaghi, E.-E.; Gorski, H. Education for Sustainability—Some Bibliometric Insights. Sustainability 2023, 15, 14916. [Google Scholar] [CrossRef]
  59. Delcea, C.; Javed, S.A.; Florescu, M.-S.; Ioanas, C.; Cotfas, L.-A. 35 Years of Grey System Theory in Economics and Education. Kybernetes 2023. [Google Scholar] [CrossRef]
  60. Madsen, D.Ø.; Berg, T.; Di Nardo, M. Bibliometric Trends in Industry 5.0 Research: An Updated Overview. ASI 2023, 6, 63. [Google Scholar] [CrossRef]
  61. González, M.C.; Hidalgo, C.A.; Barabási, A.-L. Understanding Individual Human Mobility Patterns. Nature 2008, 453, 779–782. [Google Scholar] [CrossRef] [PubMed]
  62. Milne, R.J.; Delcea, C.; Cotfas, L.-A.; Salari, M. New Methods for Two-Door Airplane Boarding Using Apron Buses. J. Air Transp. Manag. 2019, 80, 101705. [Google Scholar] [CrossRef]
  63. Milne, R.J.; Cotfas, L.-A.; Delcea, C.; Salari, M.; Craciun, L.; Molanescu, A.G. Airplane Boarding Method for Passenger Groups When Using Apron Buses. IEEE Access 2020, 8, 18019–18035. [Google Scholar] [CrossRef]
  64. Milne, R.J.; Delcea, C.; Cotfas, L.-A.; Craciun, L.; Molanescu, A.G. Health Risks of Airplane Boarding Methods with Apron Buses When Some Passengers Disregard Safe Social Distancing. PLoS ONE 2022, 17, e0271544. [Google Scholar] [CrossRef]
  65. Delcea, C.; Milne, R.J.; Cotfas, L.-A.; Craciun, L.; Molanescu, A.G. Methods for Accelerating the Airplane Boarding Process in the Presence of Apron Buses. IEEE Access 2019, 7, 134372–134387. [Google Scholar] [CrossRef]
  66. Milne, R.J.; Delcea, C.; Cotfas, L.-A. Airplane Boarding Methods That Reduce Risk from COVID-19. Saf. Sci. 2021, 134, 105061. [Google Scholar] [CrossRef] [PubMed]
  67. Le Pira, M. Transport Planning with Stakeholders: An Agent-Based Modelling Approach. Int. J. Transp. Econ. 2018, 15–32. [Google Scholar] [CrossRef]
  68. Le Pira, M.; Inturri, G.; Ignaccolo, M.; Pluchino, A. Dealing with the Complexity of Stakeholder Interaction in Participatory Transport Planning. In Advanced Concepts, Methodologies and Technologies for Transportation and Logistics; Żak, J., Hadas, Y., Rossi, R., Eds.; Springer International Publishing: Cham, Switzerland, 2018; pp. 54–72. [Google Scholar]
  69. Le Pira, M.; Inturri, G.; Ignaccolo, M.; Pluchino, A.; Rapisarda, A. Finding Shared Decisions in Stakeholder Networks: An Agent-Based Approach. Phys. A Stat. Mech. Its Appl. 2017, 466, 277–287. [Google Scholar] [CrossRef]
  70. Le Pira, M.; Marcucci, E.; Gatta, V.; Ignaccolo, M.; Inturri, G.; Pluchino, A. Towards a Decision-Support Procedure to Foster Stakeholder Involvement and Acceptability of Urban Freight Transport Policies. Eur. Transp. Res. Rev. 2017, 9, 54. [Google Scholar] [CrossRef]
  71. Le Pira, M.; Marcucci, E.; Gatta, V.; Inturri, G.; Ignaccolo, M.; Pluchino, A. Integrating Discrete Choice Models and Agent-Based Models for Ex-Ante Evaluation of Stakeholder Policy Acceptability in Urban Freight Transport. Res. Transp. Econ. 2017, 64, 13–25. [Google Scholar] [CrossRef]
  72. Janssen, S.; Matias, D.; Sharpanskykh, A. An Agent-Based Empirical Game Theory Approach for Airport Security Patrols. Aerospace 2020, 7, 8. [Google Scholar] [CrossRef]
  73. Janssen, S.; Sharpanskykh, A.; Curran, R. AbSRiM: An Agent-Based Security Risk Management Approach for Airport Operations. Risk Anal. 2019, 39, 1582–1596. [Google Scholar] [CrossRef] [PubMed]
  74. Janssen, S.; Sharpanskykh, A.; Curran, R.; Langendoen, K. Using Causal Discovery to Analyze Emergence in Agent-Based Models. Simul. Model. Pract. Theory 2019, 96, 101940. [Google Scholar] [CrossRef]
  75. Sharpanskykh, A.; Haest, R. An Agent-Based Model to Study Compliance with Safety Regulations at an Airline Ground Service Organization. Appl Intell 2016, 45, 881–903. [Google Scholar] [CrossRef]
  76. Zhuge, C.; Wei, B.; Dong, C.; Shao, C.; Shan, Y. Exploring the Future Electric Vehicle Market and Its Impacts with an Agent-Based Spatial Integrated Framework: A Case Study of Beijing, China. J. Clean. Prod. 2019, 221, 710–737. [Google Scholar] [CrossRef]
  77. Zhuge, C.; Shao, C. Agent-Based Modelling of Locating Public Transport Facilities for Conventional and Electric Vehicles. Netw. Spat. Econ. 2018, 18, 875–908. [Google Scholar] [CrossRef]
  78. Shen, Y.; Chen, G.; de Abreu e Silva, J.; Martínez, L.M. Simulated Effects of the Location of High-Speed Rail Stations on Land Development: Case Study of the Lisbon Metropolitan Area, Portugal. Transp. Res. Rec. 2016, 2564, 127–137. [Google Scholar] [CrossRef]
  79. Shen, Y.; Chen, G.; Martínez, L.M.; Silva, J.d.A. e Bi-Level Cellular Agent-Based Model: Simulation of Potential Impacts of High-Speed Rail on Land Cover Change in the Lisbon Metropolitan Area, Portugal. J. Transp. Land Use 2015, 8, 151–180. [Google Scholar] [CrossRef]
  80. Shen, Y.; Martínez, L.M.; de Abreu e Silva, J. Cellular Agent-Based Approach Incorporating Spatial Discrete Choice Methods: Simulation of Future Land Use Impacts of High-Speed Rail on Aveiro, Portugal. Transp. Res. Rec. 2014, 2430, 105–115. [Google Scholar] [CrossRef]
  81. Perez, L.; Dragicevic, S. An Agent-Based Approach for Modeling Dynamics of Contagious Disease Spread. Int. J. Health Geogr. 2009, 8, 50. [Google Scholar] [CrossRef] [PubMed]
  82. Thompson, J.; Savino, G.; Stevenson, M. A Model of Behavioural Adaptation as a Contributor to the Safety-in-Numbers Effect for Cyclists. Transp. Res. Part A Policy Pract. 2016, 85, 65–75. [Google Scholar] [CrossRef]
  83. Thompson, J.; Savino, G.; Stevenson, M. Reconsidering the Safety in Numbers Effect for Vulnerable Road Users: An Application of Agent-Based Modeling. Traffic Inj. Prev. 2015, 16, 147–153. [Google Scholar] [CrossRef] [PubMed]
  84. Thompson, J.; Newnam, S.; Stevenson, M. A Model for Exploring the Relationship between Payment Structures, Fatigue, Crash Risk, and Regulatory Response in a Heavy-Vehicle Transport System. Transp. Res. Part A Policy Pract. 2015, 82, 204–215. [Google Scholar] [CrossRef]
  85. Fagnant, D.J.; Kockelman, K.M. The Travel and Environmental Implications of Shared Autonomous Vehicles, Using Agent-Based Model Scenarios. Transp. Res. Part C Emerg. Technol. 2014, 40, 1–13. [Google Scholar] [CrossRef]
  86. Bagstad, K.J.; Johnson, G.W.; Voigt, B.; Villa, F. Spatial Dynamics of Ecosystem Service Flows: A Comprehensive Approach to Quantifying Actual Services. Ecosyst. Serv. 2013, 4, 117–125. [Google Scholar] [CrossRef]
  87. View of Software Tools for Conducting Bibliometric Analysis in Science: An up-to-Date Review. Available online: https://revista.profesionaldelainformacion.com/index.php/EPI/article/view/epi.2020.ene.03/47883 (accessed on 20 November 2023).
  88. Arruda, H.; Silva, E.R.; Lessa, M.; Domício Proença, J.; Bartholo, R. VOSviewer and Bibliometrix. J. Med. Libr. Assoc. JMLA 2022, 110, 392. [Google Scholar] [CrossRef] [PubMed]
  89. Bibliometrix—A Powerful and Popular New Bibliometric Tool Used in the Domain of Business and Management. Available online: https://library.smu.edu.sg/topics-insights/bibliometrix (accessed on 20 November 2023).
  90. Tay, A. Bibliometric Reviews in Business, Management & Accounting and the Tools Used. Available online: https://library.smu.edu.sg/topics-insights/bibliometric-reviews-business-management-accounting-and-tools-used (accessed on 21 November 2023).
Figure 1. Bibliometric analysis steps.
Applsci 13 12693 g001
Figure 2. Annual scientific production evolution.
Applsci 13 12693 g002
Figure 3. Annual average article citations per year evolution.
Applsci 13 12693 g003
Figure 4. Top 20 most relevant journals.
Applsci 13 12693 g004
Figure 5. Bradford’s Law on source clustering.
Applsci 13 12693 g005
Figure 6. Journals’ impact based on H-index.
Applsci 13 12693 g006
Figure 7. Journals’ growth (cumulative) based on the number of papers.
Applsci 13 12693 g007
Figure 8. Top 16 authors based on number of documents.
Applsci 13 12693 g008
Figure 9. Top 16 authors’ production over time.
Applsci 13 12693 g009
Figure 10. Top 17 most relevant affiliations.
Applsci 13 12693 g010
Figure 11. Top 20 most relevant corresponding authors’ country.
Applsci 13 12693 g011
Figure 12. Scientific production based on country.
Applsci 13 12693 g012
Figure 13. Top 20 countries with the most citations.
Applsci 13 12693 g013
Figure 14. Country collaboration map.
Applsci 13 12693 g014
Figure 15. Top 50 authors’ collaboration network.
Applsci 13 12693 g015
Figure 16. Top 50 words based on keywords plus (A) and authors’ keywords (B).
Applsci 13 12693 g016
Figure 17. Thematic map for 2002–2012 period (four types of themes are considered: Basic Themes, Motor Themes, Niche Themes, and Emerging or Declining Themes).
Applsci 13 12693 g017
Figure 18. Thematic map for 2013–2017 period (four types of themes are considered: Basic Themes, Motor Themes, Niche Themes, and Emerging or Declining Themes).
Applsci 13 12693 g018
Figure 19. Thematic map for 2018–2023 period (four types of themes are considered: Basic Themes, Motor Themes, Niche Themes, and Emerging or Declining Themes).
Applsci 13 12693 g019
Figure 20. “Social distancing” bubble composition.
Applsci 13 12693 g020
Figure 21. Thematic evolution.
Applsci 13 12693 g021
Figure 22. Bigrams’ (in abstracts) factorial map.
Applsci 13 12693 g022
Figure 23. Three-field plot: countries (left), authors (middle), journals (right).
Applsci 13 12693 g023
Figure 24. Three-field plot: affiliations (left), authors (middle), keywords (right).
Applsci 13 12693 g024
Table 1. Data selection steps.
Exploration StepsQuestions on Web of ScienceDescriptionQueryQuery NumberCount
1TitleContains one of the transport-specific keywords((((((((((((((((((((((((((((((((((((((((((((((((((TI = (“transportation”)) OR TI = (“transport”)) OR TI = (“road”)) OR TI = (“pipeline”)) OR TI = (“train”)) OR TI = (“metro”)) OR TI = (“subway”)) OR TI = (“sea”)) OR TI = (“air”)) OR TI = (“maritime”)) OR TI = (“rail”)) OR TI = (“cable”)) OR TI = (“airplane”)) OR TI = (“flight”)) OR TI = (“airport”)) OR TI = (“harbor”)) OR TI = (“bus”)) OR TI = (“transports”)) OR TI = (“roads”)) OR TI = (“pipelines”)) OR TI = (“trains”)) OR TI = (“subways”)) OR TI = (“maritimes”)) OR TI = (“rails”)) OR TI = (“cables”)) OR TI = (“airplanes”)) OR TI = (“flights”)) OR TI = (“airports”)) OR TI = (“harbors”)) OR TI = (“buses”)) OR TI = (“harbour”)) OR TI = (“harbours”)) OR TI = (“highway”)) OR TI = (“highways”)) OR TI = (“expressway”)) OR TI = (“freight”)) OR TI = (“truck”)) OR TI = (“trucks”)) OR TI = (“vehicle”)) OR TI = (“vehicles”)) OR TI = (“monorail”)) OR TI = (“monorails”)) OR TI = (“motorcycle”)) OR TI = (“motorcycles”)) OR TI = (“scooter”)) OR TI = (“scooters”)) OR TI = (“taxi”)) OR TI = (“ride-sourcing”)) OR TI = (“ride-pooling”)) OR TI = (“ride-splitting”)) OR TI = (“ride-sharing”)#11,402,613
Contains one of the agent-based-modeling-specific keywords(((TI = (“agent-based modeling”)) OR TI = (“agent-based modelling”)) OR TI = (“agent-based model”)) OR TI = (“agent-based models”)#25136
Contains #1 and #2#2 AND #1#3233
2AbstractContains one of the transport-specific keywords((((((((((((((((((((((((((((((((((((((((((((((((((AB = (“transportation”)) OR AB = (“transport”)) OR AB = (“road”)) OR AB = (“pipeline”)) OR AB = (“train”)) OR AB = (“metro”)) OR AB = (“subway”)) OR AB = (“sea”)) OR AB = (“air”)) OR AB = (“maritime”)) OR AB = (“rail”)) OR AB = (“cable”)) OR AB = (“airplane”)) OR AB = (“flight”)) OR AB = (“airport”)) OR AB = (“harbor”)) OR AB = (“bus”)) OR AB = (“transports”)) OR AB = (“roads”)) OR AB = (“pipelines”)) OR AB = (“trains”)) OR AB = (“subways”)) OR AB = (“maritimes”)) OR AB = (“rails”)) OR AB = (“cables”)) OR AB = (“airplanes”)) OR AB = (“flights”)) OR AB = (“airports”)) OR AB = (“harbors”)) OR AB = (“buses”)) OR AB = (“harbour”)) OR AB = (“harbours”)) OR AB = (“highway”)) OR AB = (“highways”)) OR AB = (“expressway”)) OR AB = (“freight”)) OR AB = (“truck”)) OR AB = (“trucks”)) OR AB = (“vehicle”)) OR AB = (“vehicles”)) OR AB = (“monorail”)) OR AB = (“monorails”)) OR AB = (“motorcycle”)) OR AB = (“motorcycles”)) OR AB = (“scooter”)) OR AB = (“scooters”)) OR AB = (“taxi”)) OR AB = (“ride-sourcing”)) OR AB = (“ride-pooling”)) OR AB = (“ride-splitting”)) OR AB = (“ride-sharing”)#43,742,548
Contains one of the agent-based-modeling-specific keywords(((AB = (“agent-based modeling”)) OR AB = (“agent-based modelling”)) OR AB = (“agent-based model”)) OR AB = (“agent-based models”)#511,174
Contains #4 and #5#4 AND #5#61341
3KeywordsContains one of the transport-specific keywords((((((((((((((((((((((((((((((((((((((((((((((((((AK = (“transportation”)) OR AK = (“transport”)) OR AK = (“road”)) OR AK = (“pipeline”)) OR AK = (“train”)) OR AK = (“metro”)) OR AK = (“subway”)) OR AK = (“sea”)) OR AK = (“air”)) OR AK = (“maritime”)) OR AK = (“rail”)) OR AK = (“cable”)) OR AK = (“airplane”)) OR AK = (“flight”)) OR AK = (“airport”)) OR AK = (“harbor”)) OR AK = (“bus”)) OR AK = (“transports”)) OR AK = (“roads”)) OR AK = (“pipelines”)) OR AK = (“trains”)) OR AK = (“subways”)) OR AK = (“maritimes”)) OR AK = (“rails”)) OR AK = (“cables”)) OR AK = (“airplanes”)) OR AK = (“flights”)) OR AK = (“airports”)) OR AK = (“harbors”)) OR AK = (“buses”)) OR AK = (“harbour”)) OR AK = (“harbours”)) OR AK = (“highway”)) OR AK = (“highways”)) OR AK = (“expressway”)) OR AK = (“freight”)) OR AK = (“truck”)) OR AK = (“trucks”)) OR AK = (“vehicle”)) OR AK = (“vehicles”)) OR AK = (“monorail”)) OR AK = (“monorails”)) OR AK = (“motorcycle”)) OR AK = (“motorcycles”)) OR AK = (“scooter”)) OR AK = (“scooters”)) OR AK = (“taxi”)) OR AK = (“ride-sourcing”)) OR AK = (“ride-pooling”)) OR AK = (“ride-splitting”)) OR AK = (“ride-sharing”)#7781,716
Contains one of the agent-based-modeling-specific keywords(((AK = (“agent-based modeling”)) OR AK = (“agent-based modelling”)) OR AK = (“agent-based model”)) OR AK = (“agent-based models”)#88868
Contains #7 and #8#7 AND #8#9507
4Title/Abstract/KeywordsContains one of the specific agent-based modeling in transportation keywords#3 OR #6 OR #9 #101654
5Language Limit to English(#10) AND LA = (English)#111645
6Document TypeLimit to Article(#11) AND DT = (Article)#121127
Table 2. Main information about data.
IndicatorValue
Timespan2002:2023
Sources 519
Documents1127
Average years from publication4.96
Average citations per document21.41
Average citations per year per document2.906
References45,200
Table 3. Document contents.
IndicatorValue
Keywords plus 2275
Authors’ keywords 3379
Table 4. Authors.
Table 4. Authors.
IndicatorValue
Authors3394
Author appearances4295
Authors of single-authored documents54
Authors of multi-authored documents3340
Table 5. Authors’ collaboration.
IndicatorValue
Single-authored documents56
Documents per author0.332
Authors per document3.01
Co-authors per document3.81
Collaboration index3.12
Table 7. Brief summary of the content of top three most globally cited documents.
No.Paper (First Author, Year, Journal, Reference)TitleTransportation AreaDataPurpose
1Gonzalez, M., 2008, Nature, [61]Understanding individual human mobility patternsAll100,000 persons tracked for a 6-month periodTo better understand the human mobility patterns that can be included in various analyses, including agent-based models.
2Fagnant, D.J., 2014, Transportation Research Part C: Emerging Technologies, [85]The travel and environment implications of shared autonomous vehicles, using agent-based model scenariosRoadSynthetic data that can be associated with a mid-sized city (e.g., Austin, Texas)To propose an agent-based model designed for the optimization of shared autonomous vehicle (SAV) operations.
3Bagstad, K.J., 2013, Ecosystem Services, [86]Spatial dynamics of ecosystem service flows: A comprehensive approach to quantifying actual servicesAllSynthetic dataTo model the spatial connectivity between ecosystems and their beneficiaries.
Table 8. Top 10 most frequent words in keywords plus.
WordsOccurrences
simulation148
model129
behavior94
systems61
dynamics60
impact59
optimization55
framework45
management43
time43
Table 9. Top 10 most frequent words in authors’ keywords.
WordsOccurrences
agent-based model214
agent-based modeling208
agent-based modelling119
simulation59
electric vehicles46
agent-based simulation41
agent-based models28
multi-agent systems18
COVID-1917
airplane boarding15
Table 10. Top 10 most frequent bigrams in abstracts and titles.
Bigrams in AbstractsOccurrencesBigrams in TitlesOccurrences
agent_based model565agent_based model153
agent_based modeling224agent_based modeling105
electric vehicles137agent_based modelling67
agent_based models136agent_based simulation30
agent_based modelling121electric vehicle43
simulation results90electric vehicles31
agent based87agent based28
simulation model79agent_based approach24
model abm78modeling approach23
agent_based simulation74agent_based models22
Table 11. Top 10 most frequent trigrams in abstracts and titles.
Trigrams in AbstractsOccurrencesTrigrams in TitlesOccurrences
agent_based model abm65agent_based modeling approach19
agent based model39electric vehicle charging15
agent_based modelling abm32agent_based modelling approach11
agent_based modeling abm31agent based model8
agent_based simulation model31agent_based modeling framework8
electric vehicles evs24agent_based simulation approach7
agent_based models abms21agent based modelling6
agent based modeling18agent_based simulation model6
agent_based modeling approach16electric vehicle adoption6
agent_based modeling framework16vehicle charging infrastructure6
Table 12. Top 20 most frequent bigrams related to transportation in abstracts.
Bigrams in AbstractsOccurrencesBigrams in AbstractsOccurrences
electric vehicles137social distancing45
road network72traffic flow42
travel time64travel demand41
electric vehicle63charging stations38
climate change62energy consumption38
public transport62traffic congestion37
transportation system57charging demand34
supply chain55transportation systems34
charging infrastructure52boarding methods33
air pollution46autonomous vehicles32
Disclaimer/Publisher’s Note: The statements, opinions and data contained in all publications are solely those of the individual author(s) and contributor(s) and not of MDPI and/or the editor(s). MDPI and/or the editor(s) disclaim responsibility for any injury to people or property resulting from any ideas, methods, instructions or products referred to in the content.

