1. Introduction
Incoherent digital holography has a rich history which has developed in two directions, namely non-scanning digital holography developed by Rosen, Kim, Tahara, etc., and scanning digital holography developed by Poon and team [
1]. In IDH, light from an object point is interfered with light from the same object point but with a different modulation to create a self-interference hologram. Unlike regular holography or holography with coherent light sources, the self-interference hologram contains only the 3D location information of the object but not the phase information. Coded aperture imaging (CAI) is another imaging technique which was originally developed to extend imaging technologies to non-visible regions of the electromagnetic spectrum where manufacturing of lenses and materials engineering were challenging [
2,
3]. In CAI, light from an object is modulated by a coded mask, and the scattered beam is recorded by an image sensor. From this scattered pattern and another recording called the point spread function (PSF) using the same mask but with a point object, the object information is reconstructed. While IDH’s recording and reconstruction principles were adapted from conventional holography, CAI laid the foundations for modern-day computational imaging. In 2016 and 2017, two techniques called coded aperture correlation holography (COACH) with and without two beam interference were developed which connected CAI with IDH [
4,
5]. CAI techniques usually employ special mask patterns to encode spatial and spectral information in the intensity distribution [
2,
3,
6,
7,
8,
9]. The intensity distribution is then processed in the computer with the point spread functions (PSF) recorded using a pinhole or the transfer function of the coded mask to reconstruct the information from different spatio-spectral channels [
8,
9]. In CAI methods, the entire spatio-spectral information is captured in one or a few camera shots, unlike scanning holography methods where the interference pattern is scanned pixel by pixel [
10].
This research work began when we attempted to apply the CAI method to the Fourier transform infrared microspectroscopy (FTIRm) system of the Australian Synchrotron [
11,
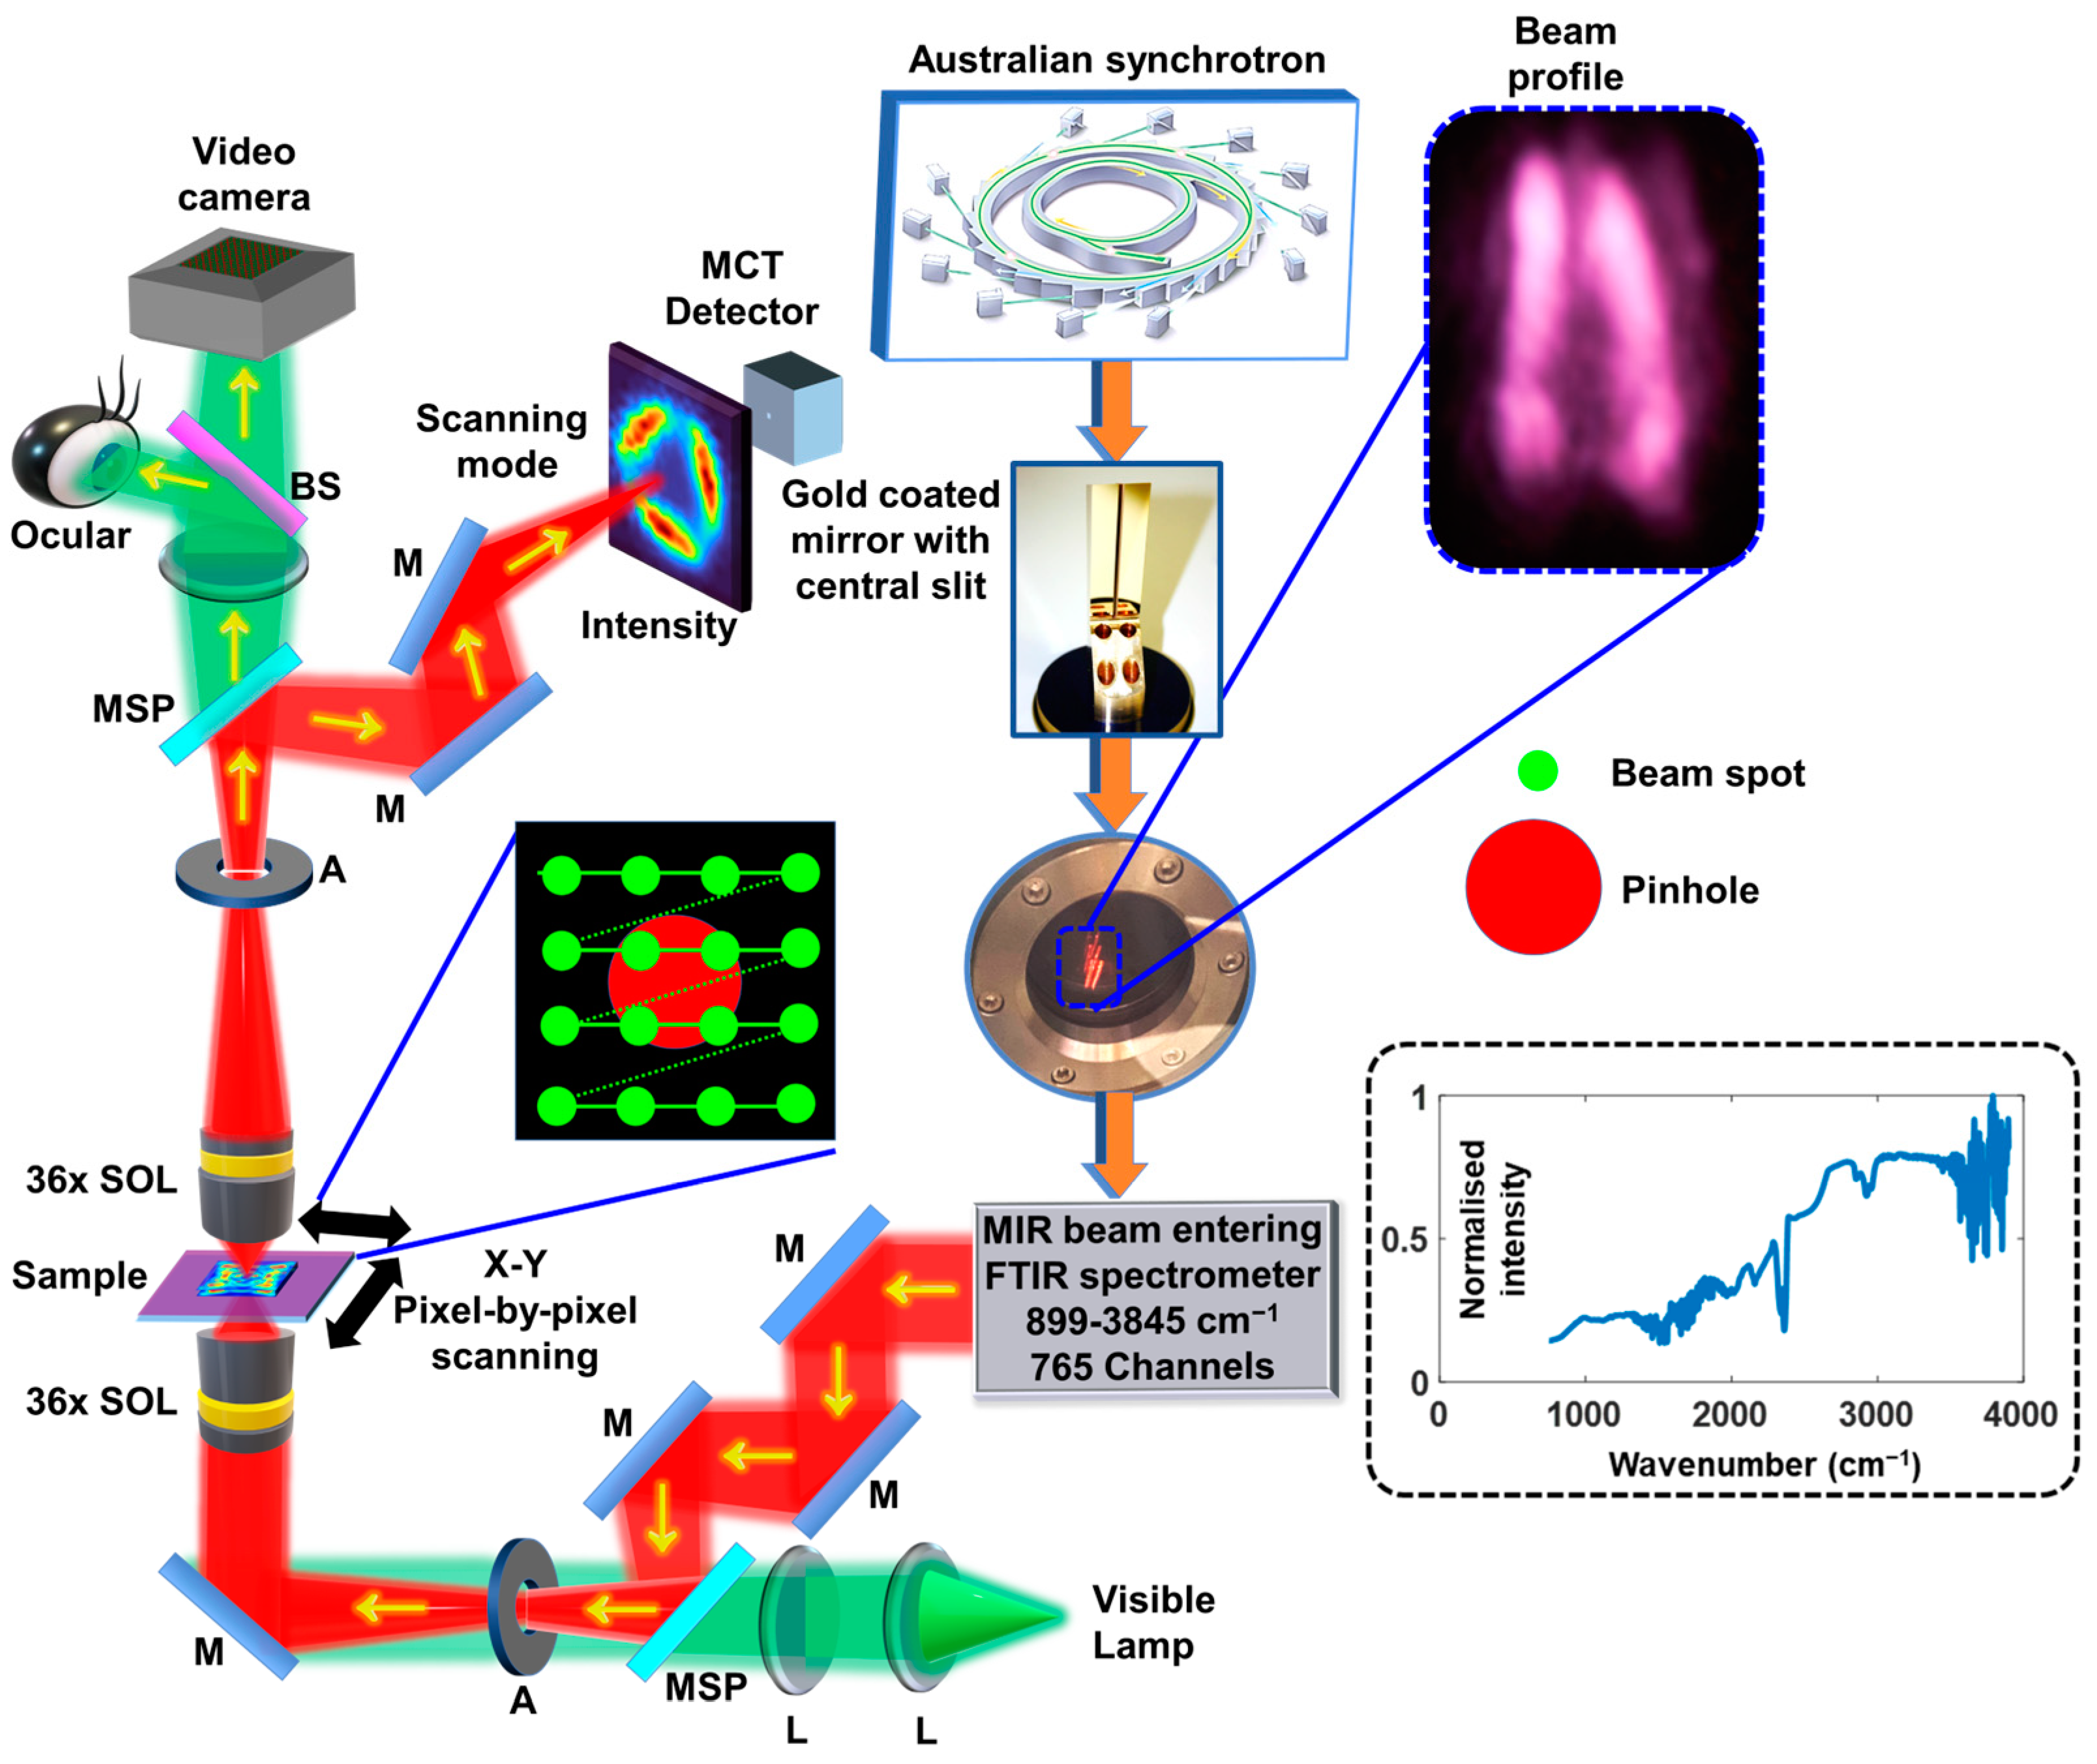
12]. The FTIRm system receives the high-brilliance IR beam from the synchrotron with a peculiar intensity distribution consisting of two parallel lines due to the gold coated extraction mirror with a central slit used for rejecting X-ray beams, as shown in
Figure 1. Consequently, the optical configuration and imaging requirements are required to be stringent in order to achieve high-quality imaging. The FTIRm system consists of two detectors, namely the single pixel mercury cadmium telluride (MCT) detector and the focal point array (FPA) (64 × 64) pixels detector, both cooled by liquid nitrogen. One of the stringent requirements of the FTIRm system includes the use of a matching 36× Schwarzschild IR reflecting objective and condenser (NA = 0.5). During our first attempt to apply the non-scanning CAI method, the above 36× Schwarzschild objective lens (SOL) was replaced by a 15× Cassegrain objective lens (COL) to increase the beam diameter in the sample plane, and the single pixel MCT detector was replaced by a focal point array (FPA) detector. However, due to the peculiar beam profile, the experiment could not be extended beyond a pinhole. Therefore, in that case, a semi-synthetic analysis was only carried out using synthetic objects and recorded and averaged using point spread functions (PSFs) [
12]. The outcome of the experiment revealed the possibility of achieving 3D imaging based on the following facts and observations. To achieve 3D imaging using CAI, a sharp autocorrelation and a low cross-correlation along depth (SALCAD) are needed. This SALCAD property is easily achieved using a scattering mask, which is one of the reasons why it has been widely used for 3D imaging [
13]. Based on the observations made in [
12], even deterministic intensity distributions may exhibit SALCAD properties.
Thereafter, the CAI method was repeated in the replica off-line FTIRm system of the Australian Synchrotron, which is not connected to the synchrotron beam but uses a Globar source [
14]. The light from a Globar source is uniform and so it supported the application of the CAI method significantly better than the synchrotron beam. The FPA detector was used for recording the intensity distribution and the COL was used as the coded aperture. A new computational reconstruction algorithm called the Lucy–Richardson–Rosen algorithm (LRRA), integrating the Lucy–Richardson algorithm (LRA) [
15,
16] with non-linear reconstruction (NLR) [
17], was developed for reconstructing three-dimensional (3D) information from the recorded intensity distributions of objects and the PSF library. The preliminary results were promising. However, the recorded intensity distributions were low resolution due to the limited number of pixels of the FPA. Moreover, the intensity is not as high as the beam from the synchrotron. Since most of the measurements at the Australian Synchrotron involve the use of the synchrotron beam, it is crucial to extend this idea to the online FTIRm system. In a recent study with the LRRA, it was found that it is possible to use a wide range of optical beams with peculiar intensity and phase distributions [
18]. In another recent study, the high resilience of the LRRA to detector noises was verified [
19]. In this manuscript, we report for the first time computational imaging using the IR synchrotron beam at the Australian Synchrotron using the LRRA. The method is unique because coded aperture holography has been implemented by a scanning approach for the first time. We call this technique coded aperture scanning holography (CASH). CASH can be implemented for deblurring, removing aberrations and 3D imaging and is suitable for extreme imaging scenarios such as low-resolution detectors and imaging through highly scattering media, and can improve almost all facets of imaging except time resolution. This manuscript consists of five sections. The methodology is described in the next section, experimental results are presented in the third section and the final two sections present the discussion and conclusions from the study.
2. Materials and Methods
In this study, we have developed a modified CASH approach for extending the CAI method to the online FTIRm system of the Australian Synchrotron with a 36× SOL as the coded aperture. In this method, the 36× SOL of the FTIRm system was retained, unlike in [
12], and a scanning approach has been introduced with the single pixel MCT detector. The schematic of the FTIRm system is shown in
Figure 1. The IR beam is extracted along with X-rays from the synchrotron, and the X-rays are removed by a gold coated mirror with a central slit as shown in
Figure 1. This unique extraction results in a fork-shaped beam, as shown in the same figure. This FTIRm system consists of 765 channels ranging from 899 to 3845 cm
−1. The intensity of the IR synchrotron beam is >10
5 times that of a Globar source. The FTIRm system consists of a visible lamp that generates white light which is aligned collinearly with the IR beam to achieve optical alignment, as the IR beam is invisible to the human eye. Both visible and IR beams were collected and focused on the sample plane using a 36× SOL. The light from the sample plane is collected by another 36× SOL and reimaged using a high-resolution visible camera and an IR sensor. The IR sensor can be either a single pixel MCT detector or a 64 × 64 FPA detector. In this study, a single pixel MCT detector has been used. In the FTIRm system, in principle, two microscopes (visible and MIR microscopes) are integrated. Since the MIR beam is not visible to the human eye, visible light is used as a guiding beam for sample mounting and the calibration procedure. Microscopy with visible light is well established with sophisticated refractive lenses. Refractive lenses are indicated by the letter L in
Figure 1, and work based on the principles of refraction. However, microscopy with an IR beam is complicated, because manufacturing lenses on calcium fluoride and barium fluoride substrates is challenging, and so for microscopy with IR to work, reflective optics are used. The mirrors indicated by the letter M in
Figure 1 are all concave mirrors. The MSP has been used to switch between visible and IR imaging modes for sample alignment and calibration. The visible microscope works based on both refractive as well as reflective optics, whereas the IR microscope works based on only reflective optics. The aperture stops indicated by the letter ‘A’ are used to reduce aberrations at the expense of light throughput.
In the conventional direct imaging mode, there is point-to-point mapping, i.e., every object point creates an image point. Since the synchrotron beam is spatially incoherent, there is only intensity addition between neighbouring points, unlike complex addition as in coherent light sources. The image formation can be expressed as , where O is the object information, IO is the recorded image, IPSF is the diffraction limited spot, and ‘⊗’ is a 2D convolutional operator. As it is seen, the object information O is sampled by the diffraction limited spot. If the NA is large, then the spot size is small and a better sample is obtained. If the NA is small, then the spot size is large resulting in a poor sample and blurred image. When there is an axial aberration due to the object distance not meeting the imaging condition 1/u + 1/v = 1/f, a blurred image of the object is obtained even with a large NA, where u, v, and f are the object, image distances, and focal length, respectively. This condition prevails in all planes which do not satisfy the imaging condition. Therefore, in order to image such planes, it is necessary to repeat the imaging process after achieving the imaging condition for those planes. Therefore, in direct imaging mode, the imaging process is time consuming, resulting in a total of M2N camera shots, where M is the number of pixels along the x and y directions and N is the number of planes. If the FPA is used, then it requires only N camera shots. With coded aperture holography, only a single shot is needed. However, the fork-shaped beam profile precludes the application of non-scanning methods. In this study, in order to extend CAI to FTIRm with the synchrotron beam, CAI is implemented as CASH, where the number of measurements needed is M2, which is the same as scanning-based 2D imaging but can obtain 3D information.
In indirect imaging mode, as demonstrated in [
1,
2,
3,
4,
5,
6,
7,
8,
9], the imaging process is different from direct imaging mode, consisting of two steps in general. In the first step, the intensity pattern is recorded as
. When the imaging condition is satisfied, then
IO creates an image of the object as governed by the NA of the system. However, at other planes
does not form the image of the object but a blurred intensity distribution. Therefore, in the second step, the image
IR is reconstructed or recovered from
IO. This process is also called deconvolution or deblurring. This is achieved by processing
with
, where
, which can be rewritten as
, where ‘
’ is a 2D correlation operator. Depending upon the nature of the autocorrelation function, i.e.,
, the object information
O is sampled. With scattering masks, it is possible to obtain sharp autocorrelation functions. In [
14], it was shown that even with deterministic masks such as COL, it is possible to obtain a sharp autocorrelation function. In this study, it is also possible to obtain sharp autocorrelation functions if the synchrotron beam has a uniform intensity distribution.
The blurring with the SOL is not symmetrical and the recording of PSFs at different axial planes was complicated due to the peculiar intensity distribution of the beam. In all the previous studies, the fundamental building block of the object is either ~λ/NA or the diameter of the pinhole. It is not possible to achieve resolution better than the size of the pinhole. In this study, to enable 3D imaging, the lateral resolution is set at the size of the pinhole while it is possible to image below that limit with a smaller spot size obtained by the SOL. A larger pinhole creates larger features in the PSF and vice versa, which are transferred to the resolving power through the autocorrelation function
which samples the object function. Therefore, in the proposed system, the pinhole is scanned by the highly focused IR beam from the 36× objective lens, and the PSF is formed by the summation of the intensity distributions obtained during scanning, given as
, where
ID is the intensity distribution obtained for a point (
x,
y) in the sample plane. Consequently, the PSF itself is recorded as a 2D object in a spatially incoherent imaging system by summation of light from different points. This procedure allows recording of the 3D PSFs even with the peculiar intensity distribution and complicated optical configuration. This approach results in decreasing the lateral resolution, as the pinhole is larger than the focal spot size obtained from the SOL. After recording the 3D PSF, the scanning procedure was repeated for a single plane or multiplane object. The 3D image of the object can be reconstructed by processing the PSF library catalogued against the axial location with the object intensity distributions. Unlike optical scanning holography methods [
10], where it is necessary to reconstruct at all planes, the use of the SOL as a coded aperture enables direct imaging and holography to co-exist. At the image plane, the CASH technique performs perfectly as a direct imaging system. When defocused, the system behaves as a CAI method and a reconstruction method is required.
The intensity distribution recorded for the object
O can be expressed as
, where
IPSF is the intensity distribution obtained by temporally summing the intensity distributions during pixel-by-pixel scanning. There are two main mechanisms to extract
O from
IO using
IPSF: direct cross-correlation [
4] and an iterative maximum likelihood approach such as the LRA and LRRA [
14,
15,
16]. In our recent study [
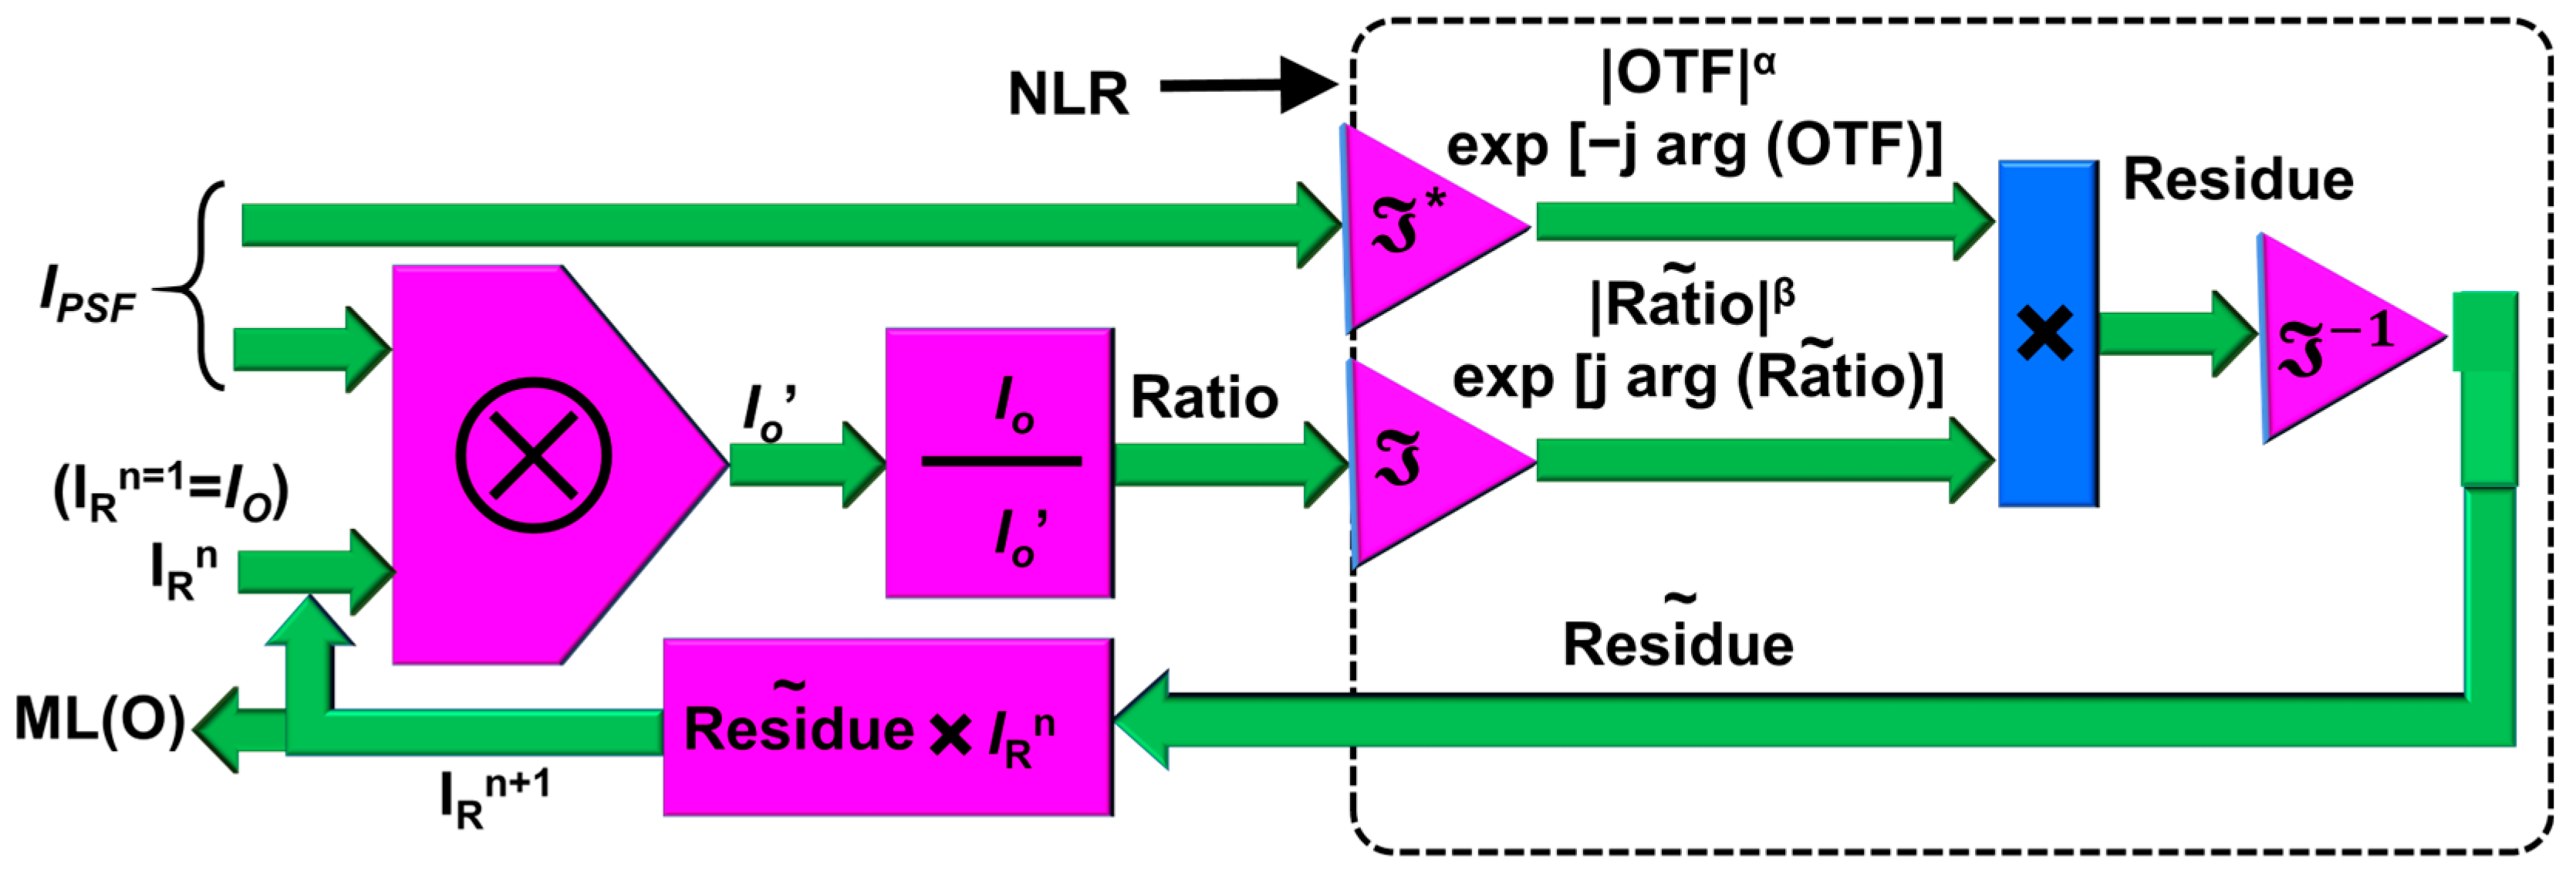
14], it was found that the LRRA performed better than the LRA, whose schematic is shown in
Figure 2. The (
n+1)
th reconstructed image is given as
, where ‘
’ refers to NLR which is defined for the two functions A and B as
, where
is the Fourier transform of X. The α and β are tuned between −1 and 1. The number of iterations was increased from 1 until a minimum entropy was obtained. The algorithm begins with an initial guess, which is the recorded object intensity
IO and convolves it with the
IPSF. The ratio between
IO and the resulting distribution
IO’ is correlated with the
IPSF using NLR and the residue is then inverse Fourier transformed and multiplied to the first guessed solution I
Rn (=
IO when
n = 1) to generate the next solution I
R(n+1). This process is iterated with the new solution until the maximum likelihood solution is obtained. However, unlike the LRA, the LRRA has a rapid convergence and better estimation of the solution.
3. Results
The simplified optical configuration of the FTIRm system is shown in
Figure 1. The spectral range of the MIR beam from the synchrotron is 899–3845 cm
−1 with 765 channels. The MIR beam from the synchrotron is extracted using a special mirror, with a gold coating and a central slit to reject X-rays, and enters the FTIRm system. The size of the beam at the entrance port of the FTIR spectrometer is 12 mm × 12 mm [
20]. A visible light source is collinearly aligned with the MIR beam and used as a reference for preliminary studies and alignment of the MIR beam. Extensive information on the calibration of the FTIRm system and the resolution limits are presented in [
20,
21]. For the 36× SOL, the spatial resolution is ~8 μm at 1600 cm
−1 and varies with the wavelength. After the matching 36× SOL, a pinhole was used to define the spot size measured at the sample plane. Consequently, in this computational imaging method, the wavelength dependent spatial resolution limit is changed to the wavelength independent spatial resolution limit.
For each recorded image, the condenser and objective were aligned in free space or an equivalent blank substrate before the pinhole (25 µm pinhole, Thorlabs Inc.) or sample was placed onto the sample stage. Each point spectra were taken with a 4 cm
−1 resolution and averaged over four scans per point. The pinhole discussed throughout the manuscript is the one that is mounted on the sample stage. During scanning, the stage moved the sample such that the static IR beam was aligned over each measurement point. For the
IPSFs, a 40 × 40 grid with 5 µm grid spacing was selected totalling a 200 × 200 µm scan area. A 5.6 µm beam spot was used to ensure a slight overlap between scans. A 40 × 40, 15 µm grid and 16.7 µm beam size were used for the silk fibre in
Figure 3. The above spot sizes are the built-in scanning options of the Bruker system and do not match with the actual spot sizes. The FTIRm system uses the OPUS software (Version 8.0) for recording and processing information. The data structure of OPUS is the spectral information for every pixel. This data structure is converted into spectral-wise images using a MATLAB linking code. The images are then averaged over the entire spectrum to obtain noise free images. This process is conducted for both the
IPSF and
IO.
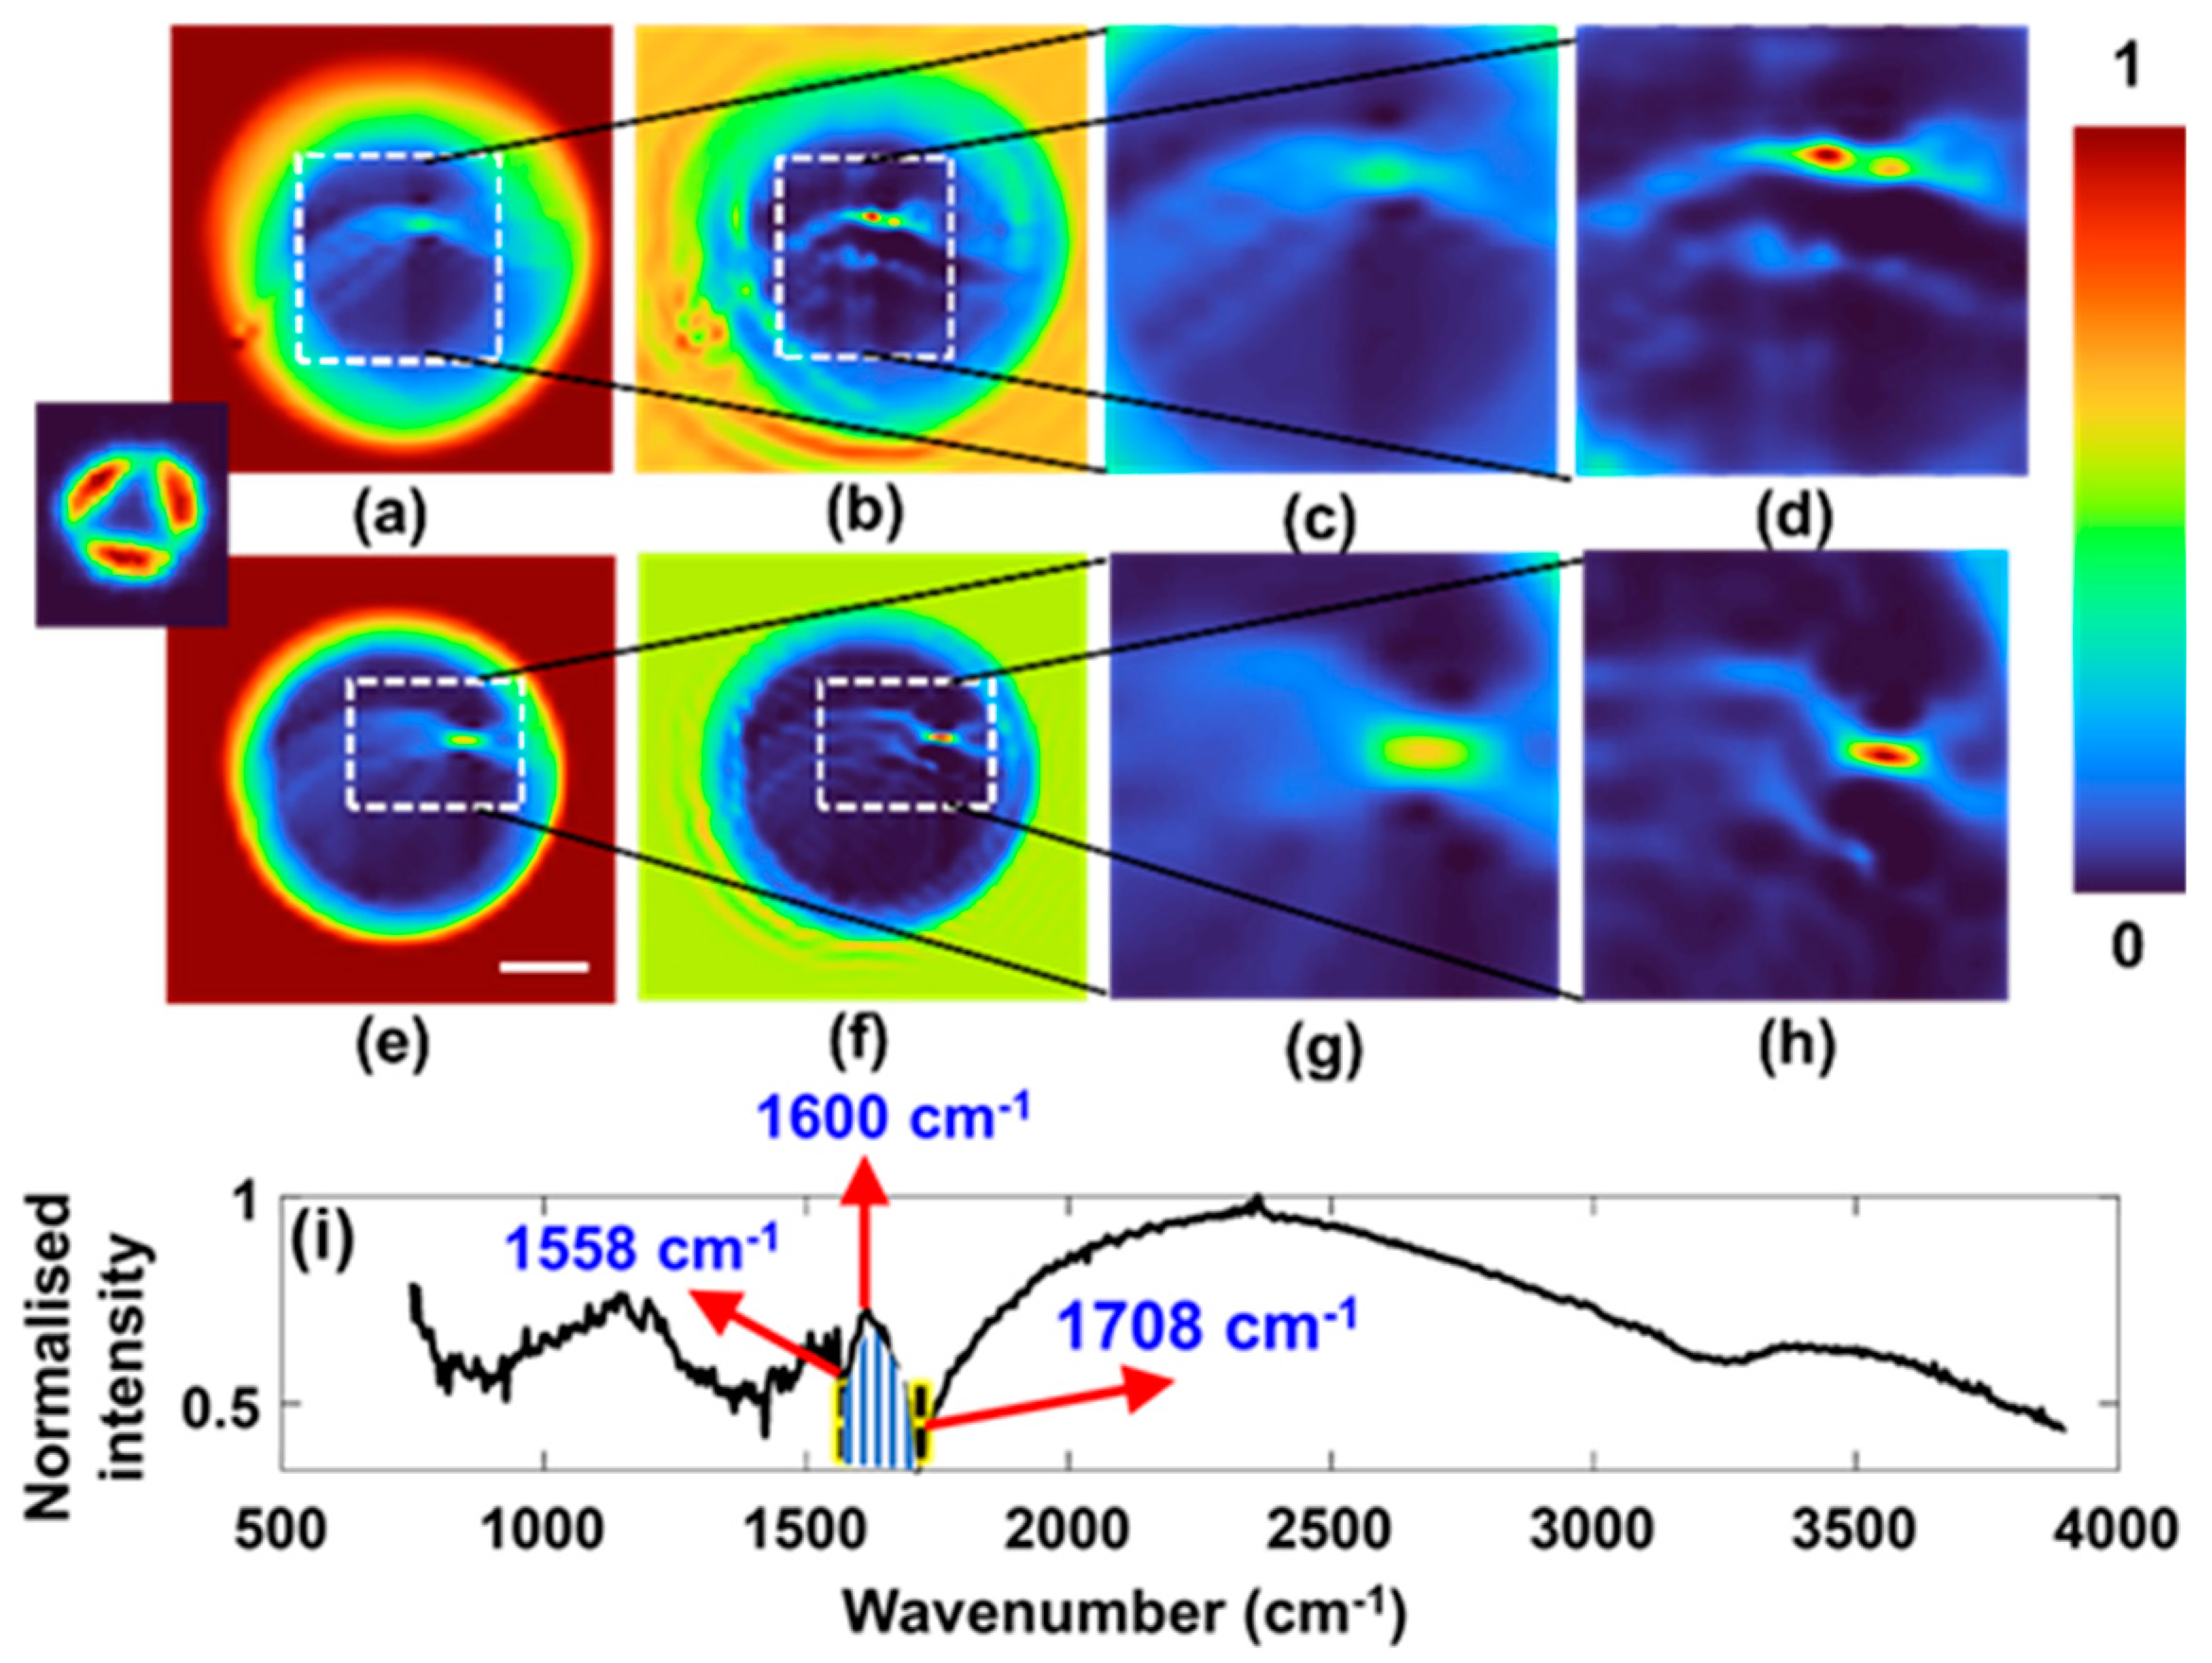
A silk fibre is mounted on the sample plane held by a pinhole with a size of 400 µm. As the silk fibre is in 3D space, the focus changes with the depth as shown in
Figure 3a (Δz = 100 μm) and
Figure 3e (Δz = 200 μm). When the plane of interest is changed along
z, a different region in (
x,
y) appears sharp and intense. The
IPSF has a unique donut shaped intensity distribution with three lobes arising from the support structure consisting of three spokes in the SOL, as shown in the inset in
Figure 1. A similar structure with four spokes in a Cassegrain objective lens has been investigated in [
14]. Using the
IPSF similar to the one shown as an inset in
Figure 3, the images
Figure 3a,e were reconstructed as shown in
Figure 3b,f, respectively, with
α = 0.5,
β = 1 and eight iterations. As seen from the figure, the out of focus features are in focus after reconstruction. A single fibre strand can be clearly seen in both cases. The magnified versions of
Figure 3a,b,e,f are shown in
Figure 3c,d,g,h, respectively. The normalised absorbance spectrum was obtained, which is plotted as shown in
Figure 3i which shows a distinct absorbance peak at 1600 cm
−1. By choosing an
IPSF recorded at a different distance, different parts of the images at different depths can be reconstructed. The high-intensity regions seen in the reconstructed images correspond to the axial plane of the pinhole when the
IPSF was recorded. When an
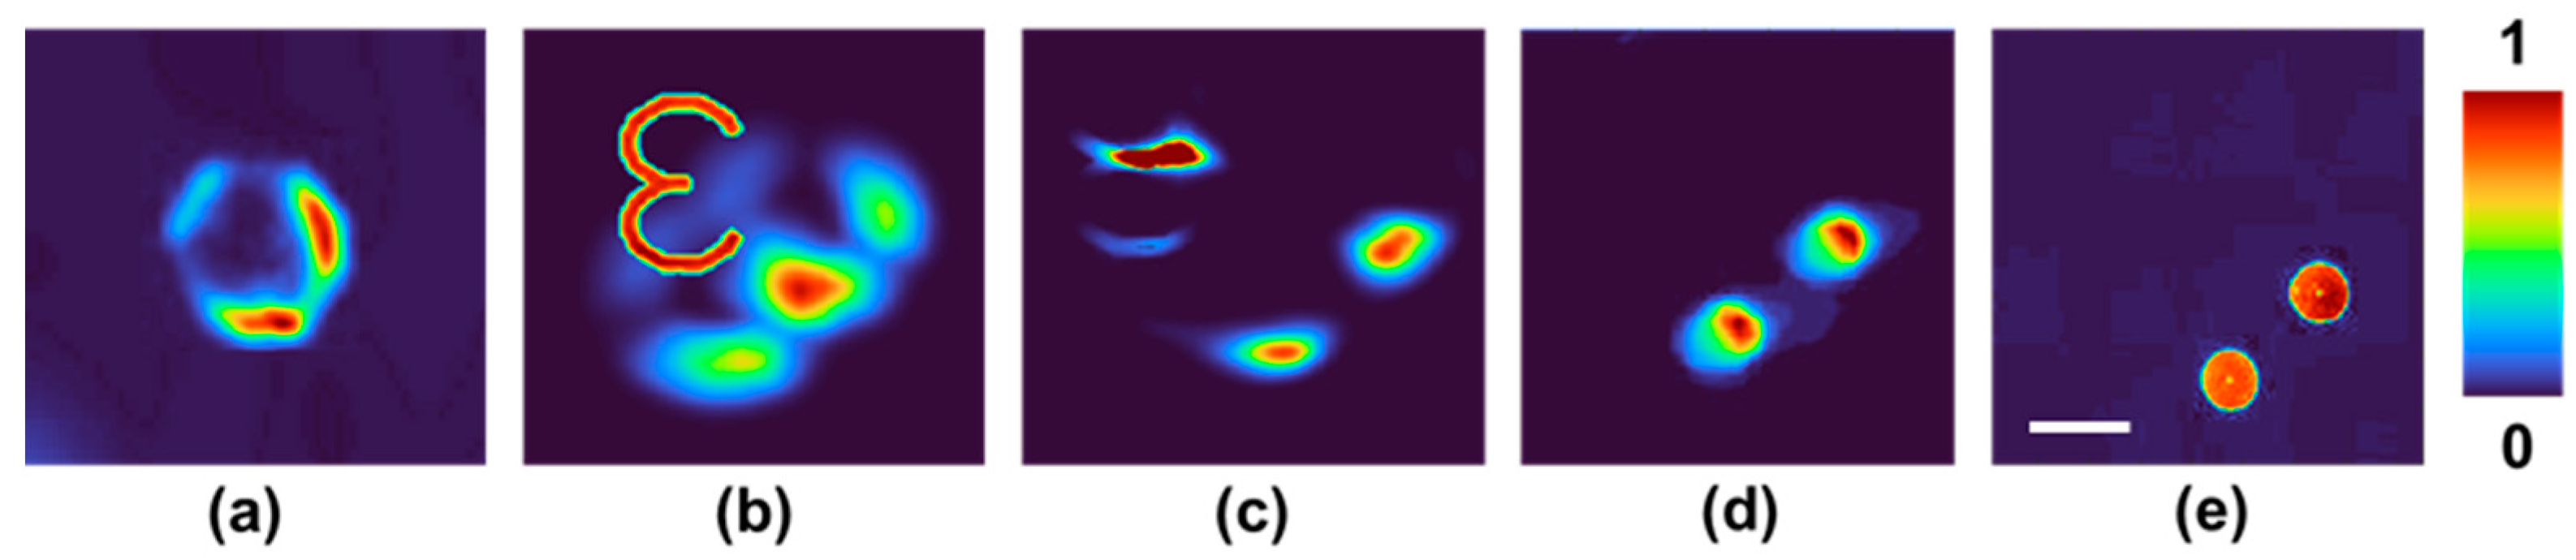
IPSF of another axial plane was used for reconstruction, it increased the intensity of the region that corresponded to that plane. To further evaluate the method, a two-plane object was constructed using two pinholes in one plane and the digit ‘3′ from the USAF resolution target separated by a distance of 300 µm. This was achieved by summing the corresponding intensity distributions from the two planes. Since the synchrotron beam is spatially incoherent, there is only intensity addition between light from two points and not a complex addition as in spatially coherent light sources. In this case, there was a slight misalignment, which is indicated by the intensity difference in one of the three lobes of the
IPSF. The images of the
IPSF recorded intensity distribution and the reconstructed images are shown in
Figure 4a–c, respectively. It can be seen that the reconstructed image shows the two pinholes and distorts the digit ‘3′ which was focused. The distortion also follows the nature of the
IPSF bringing more reconstructed intensity to the middle. The above digital refocusing shows the possibility of 3D imaging in the IR synchrotron beam. The reconstruction conditions of the LRRA are quite similar to the previous case, with
α = 0.4,
β = 1 and seven iterations.
In
Figure 4b, it is seen that the digit ‘3′ is well focused, but the two pinholes were blurred indicating that the two objects are in different planes. When
Figure 4b is reconstructed using the
IPSF shown in
Figure 4a using the LRRA, as the
IPSF corresponds to the plane of the two pinholes, the information of the two pinholes is deblurred, while the other object digit ‘3′ is blurred. The blurring and deblurring behaviours depend upon the nature of the
IPSF. The
IPSF of the SOL is quite different from the commonly seen blurring with a lens. Consequently, unusual distributions such as the ‘hot spots’ seen in
Figure 4c are obtained during blurring. Considering the fundamental concepts of image formation and image reconstruction, the above behaviour can be clearly understood. The physical meaning of the convolution operation which yields the object information
IO is that every object point in
O is replaced by the
IPSF and in the overlapped regions there is an addition. This can be seen in
Figure 4b, as there are two points, each point is replaced by
Figure 4a and the overlapped region has a higher intensity, indicating an addition. The image reconstruction or deblurring from the
IO and the
IPSF is achieved by pattern recognition, where the
IPSF is scanned over the
IO and a peak is generated whenever there is a pattern matching. Consequently, when
Figure 4a is scanned over
Figure 4b, two peaks are generated for the two pinholes as there is perfect pattern matching in those locations. Further, there is some similarity between the structure of the digit ‘3′ and
Figure 4a which gives rise to hot spots. The above results are therefore not an anomaly but the natural blurring and deblurring behaviour corresponding to a peculiar
IPSF such as the one obtained for the SOL. The direct imaging results of the two pinholes using a single pixel MCT detector with the IR channel and with the high-resolution camera with the visible channel are shown in
Figure 4d,e, respectively.
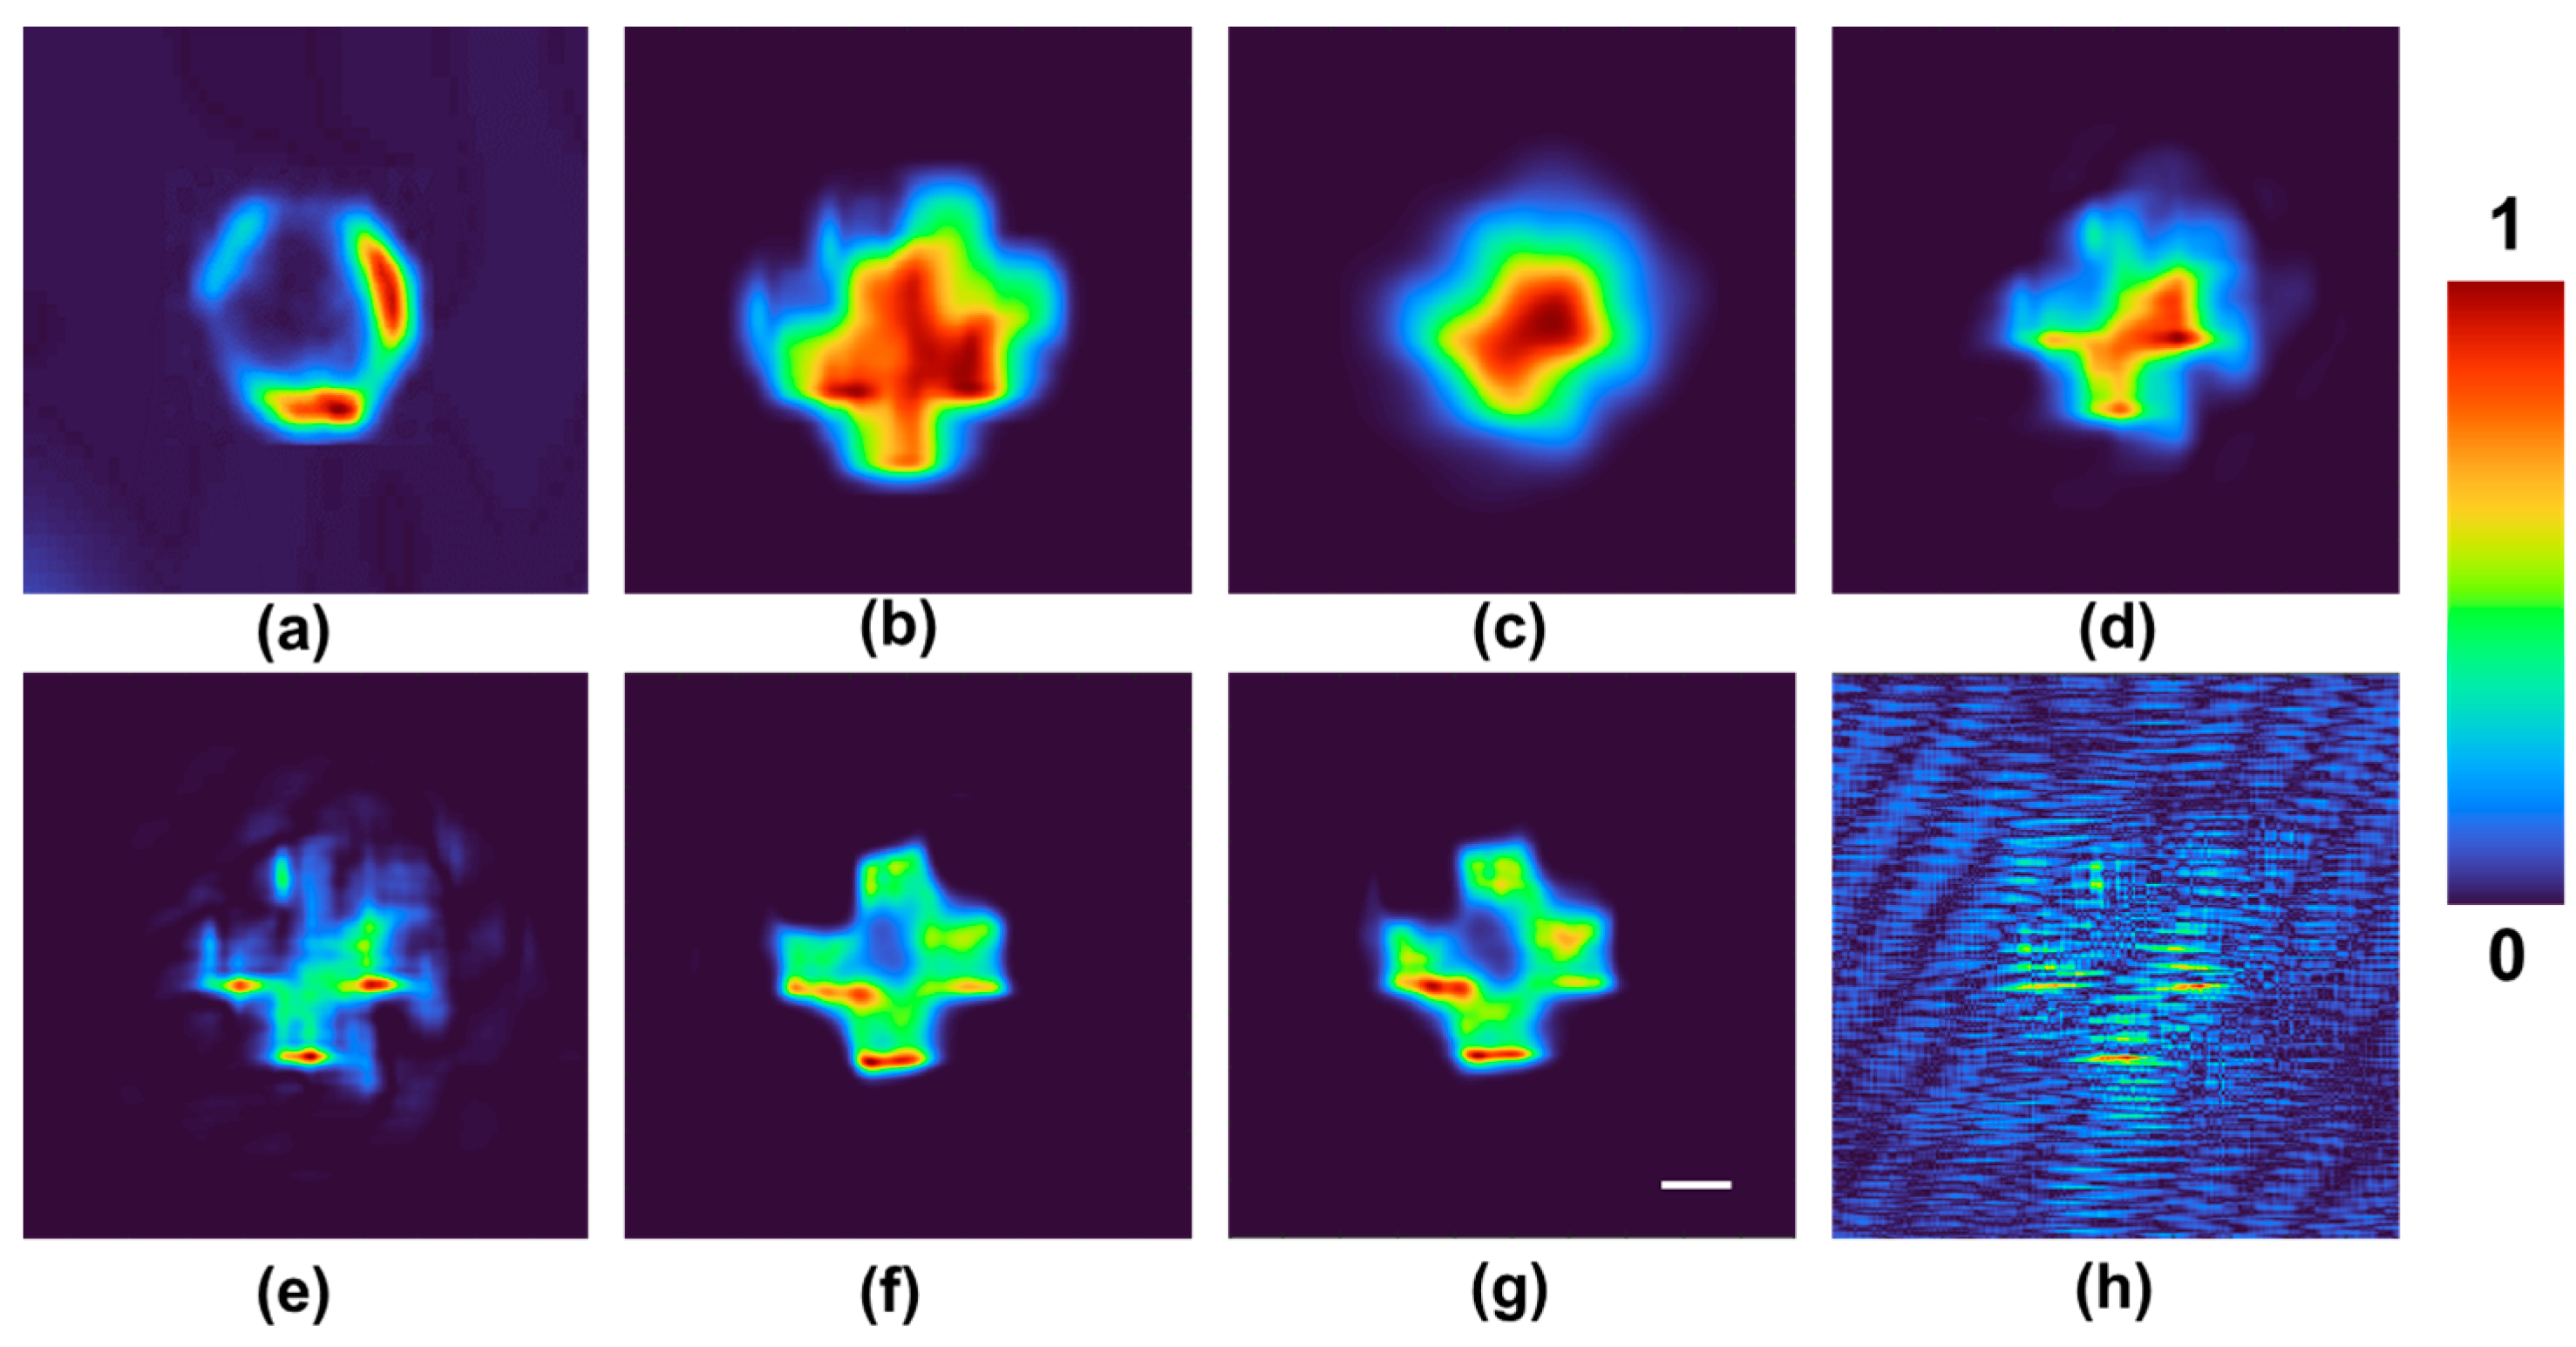
A cross shaped object with a width of 50 µm manufactured using femtosecond ablation on a barium fluoride substrate with 1 mm thickness coated with a 100 nm chromium layer was used as a test object. The IR images recorded with spatial aberrations with the cross shaped object had the maximum aberrations and noises in CASH. The images of the PSF, and the object intensity distributions and reconstruction results using a matched filter, phase-only filter, NLR, LRA, Weiner filter and the LRRA are shown in
Figure 5a–h, respectively. The conditions for reconstruction for matched filter, phase-only filter and NLR in
are (
α = 1,
β = 1), (
α = 0,
β = 1) and (
α = 0,
β = 0.7), respectively. The condition for reconstruction for the LRA is
n = 100, for the LRRA it is (
α = 0.4,
β = 1 and
n = 10), and for the Weiner filter the ratio of noise variance to signal variance (σ = 1000). As can be seen from
Figure 5, the performance of the LRRA is better than the other methods. The LRA, too, has a higher resilience to detector noises and aberrations, but the number of iterations is 10 times than that of the LRRA. Moreover, it has been well investigated in [
14,
19] that the performance of the LRA for complicated objects is not as good as for simple objects, such as the cross shaped object as in this case. The Weiner filter has the poorest performance of all, with significant background noise.
5. Summary and Conclusions
The online FTIRm system of the Australian Synchrotron uses an IR beam with a peculiar intensity distribution in the shape of two lines, which results in a complicated optical configuration. As it is known, the development of a detector in the wavelength region of MIR is challenging, unlike in the visible region where megapixels of information can be detected with high-resolution sensors. The online FTIRm system at the Australian Synchrotron is equipped with two image sensors: single pixel and FPA detectors made of mercury cadmium telluride, both cooled by liquid nitrogen. As the FPA has only 64 × 64 pixels, a single shot recording with that detector results in a low-resolution image. Therefore, the single pixel detector is used for pixel-by-pixel scanning of the sample followed by a computational stitching procedure to record a 2D image of the object with a better resolution.
Even though in most of the measurements with FTIRm a thin slice of the sample is used, with a strong (36×) objective, an axial aberration or thickness variation of a few micrometres can significantly affect the imaging results. The running cost of the Australian Synchrotron is quite high, with most of the user projects awarded with limited beamtime hours ranging from 48 h to 96 h and valued at ~AUD 100 K. Therefore, it is crucial to avoid aberrations during measurements and to utilize the beamtime efficiently. The focusing elements used in FTIRm are not regular refractive lenses but reflective Schwarzschild objectives, which have a unique spatial aberration in the form of a donut with three distinct intensity lobes. When there is an axial aberration, the images are highly distorted. Consequently, existing deblurring methods are not suitable for deblurring the images.
In this study, a recently developed computational reconstruction method called the LRRA has been applied to realise CASH. Both standard samples, such as USAF objects and pinholes, and biochemical samples such as silk were studied. The LRRA method was able to reconstruct not only 2D but also 3D information from the object. One of the challenges with the LRRA is that it is not possible to know the values of
α,
β and
n beforehand, and they can only be predicted by an expert user from the outcomes of NLR and the LRA. However, in the future, we plan to address this problem. We believe that the proposed and demonstrated method is a significant step forward for the FTIRm system of the Australian Synchrotron. The impact of the study is high, as the developed technique will enable rapid imaging, aberration correction, and 3D imaging, benefiting the users of the Australian Synchrotron. The proposed method is not limited only to applications in the FTIRm system of the Australian Synchrotron but can be applied to other advanced imaging systems with complicated optical configurations. Recently, single shot phase imaging has been demonstrated at the Australian Synchrotron [
22]. Scanning holography is a milestone in the history of holography [
10]. We believe that the CASH developed in this study and the recent phase imaging demonstration will lead to further developments and wider applications of FTIRm. The computational reconstruction methods used in CAI are based on pattern recognition using some types of correlation of maximum likelihood estimation. In this study, a maximum likelihood estimation method called the LRRA has been used. One of the challenges in applying pattern recognition-based algorithms for the reconstruction of images modulated by deterministic optical fields is that they give rise to artefacts in the form of hotspots when the PSF’s shape in a plane matches with the object’s shape. However, this is a rare event and can happen with any CAI method when there is a match between a PSF and an object. Further studies are needed to develop advanced computational methods which can avoid such artefacts during reconstruction.


 ,
, 


