
Legendre Multiwavelet Transform and Its Application in Bearing Fault Detection


School of Artificial Intelligence, Chongqing University of Technology, Chongqing 400054, China
*
Author to whom correspondence should be addressed.
†
These authors contributed equally to this work.
Appl. Sci. 2024, 14(1), 219; https://0-doi-org.brum.beds.ac.uk/10.3390/app14010219
Submission received: 19 November 2023
/
Revised: 18 December 2023
/
Accepted: 19 December 2023
/
Published: 26 December 2023
(This article belongs to the Collection Bearing Fault Detection and Diagnosis)
Abstract
:Bearing failures often result from compound faults, where the characteristics of these compound faults span across multiple domains. To tackle the challenge of extracting features from compound faults, this paper proposes a novel fault detection method based on the Legendre multiwavelet transform (LMWT) combined with envelope spectrum analysis. Additionally, to address the issue of identifying suitable wavelet decomposition coefficients, this paper introduces the concept of relative energy ratio. This ratio assists in identifying the most sensitive wavelet coefficients associated with fault frequency bands. To assess the performance of the proposed method, the results obtained from the LMWT method are compared with those derived from the empirical wavelet transform (EWT) method using different datasets. Experimental findings demonstrate that the proposed method exhibits more effective frequency spectrum segmentation and superior detection performance across various experimental conditions.
1. Introduction
In industrial environments, rotating machinery has special importance due to its wide applications. Rolling bearings constitute one of the most widely used yet vulnerable components in rotating machinery, and their health deteriorates gradually over time. Bearing faults can lead to sudden system failure, resulting in incalculable economic losses and posing personal safety hazards [1,2]. Moreover, owing to the complexity of equipment and the interrelation of its structure, compound faults often occur simultaneously, coupling the features of individual faults to form what are known as compound faults [3,4]. To mitigate the issues arising from bearing faults such as equipment downtime and maintenance costs and to enhance equipment operating efficiency and safety, fault detection holds paramount importance. Developing a method with a simple model design, robust noise resistance (especially under strong noise interference), and high fault recognition accuracy bears engineering significance [5,6].
Time-frequency analysis methods are widely employed in processing bearing signals due to their ability to provide signal analysis across both time and frequency domains. This effectively enhances the accuracy and reliability of fault diagnosis [7,8,9,10,11,12,13,14,15]. A common approach to fault diagnosis involves extracting fault features using time-frequency analysis methods, followed by the utilization of various classifiers. For instance, Attoui et al. [7] combined wavelet packet decomposition with maximum impact frequency band-based feature extraction technology to propose a new time-frequency method for bearing fault diagnosis. Jiang et al. [8] addressed the non-stationary and non-Gaussian issues in bearing signals by combining empirical wavelet transform with fuzzy correlation classification for fault diagnosis. Glovacz et al. [9] proposed an approach that combines multiple classifiers, including the nearest mean classifier, nearest neighbor classifier, and Gaussian mixture model, to analyze and diagnose rolling bearing faults. Zhao et al. [10] addressed the complexities associated with weak and noise-prone compound fault features in rolling bearings. Their method involved utilizing adaptive local iterative filtering decomposition and the Teager–Kaiser energy operator to effectively extract diverse frequency components from vibration signals related to bearing faults, thereby enhancing the diagnosis of rolling bearing issues. Despite their ability to extract various frequency components from bearing fault vibration signals, time-frequency analysis methods often encounter challenges in adaptively extracting signal features across different environmental and operational conditions.
Lately, researchers have increasingly adopted a trend of combining wavelet analysis and deep neural networks for fault diagnosis [16,17,18,19,20,21,22]. Shao et al. [16] proposed a bearing fault diagnosis method that combines the advantages of dual-tree complex wavelet packets and deep belief networks. Xu et al. [17] combined fast empirical wavelet transform (FEWT) with negative entropy spectrum decomposition (NSD) to construct an information graph. FEWT cyclically extracted vibration signals, obtaining envelope spectra for each component to diagnose compound bearing faults. Liang et al. [18] applied conventional convolutional neural networks to perform multi-label classification on vibration signals that underwent wavelet analysis transformation. Their approach aimed at enabling compound fault diagnosis specifically for gearboxes. Experimental findings suggest that amalgamating traditional time-frequency analysis methods with deep learning can yield enhanced diagnostic accuracy and stability.
Traditional wavelet analysis is simple and easy to implement, and it can analyze signals locally and extract features of different frequencies [22,23,24,25,26]. However, the frequency resolution and time resolution of wavelet analysis are mutually contradictory, and it is sensitive to noise and interference, making it vulnerable to the influence of signal noise and nonlinear interference [23]. Compared with traditional wavelet analysis, multiwavelet analysis has better adaptability and resolution, which can effectively capture the nonlinear and non-stationary characteristics of rolling bearings, and thus more accurately identify and locate bearing faults, improving the efficiency and accuracy of bearing fault diagnosis. Hong et al. [24] developed a method for compound bearing fault diagnosis by utilizing customized balanced multiwavelets to extract fault information from signals and incorporating adaptive maximum correlation kurtosis deconvolution. Yuan et al. [25] established an intelligent indicator-driven approach to construct suitable multiwavelet basis functions for accurate inner-product matching, resulting in a multiwavelet feature extraction method for mechanical fault diagnosis. Multiwavelets, as a promising basis function, have important signal processing properties such as orthogonality, symmetry, compact support, and high-order vanishing moments [27]. However, the existence of orthogonality and the scarcity of wavelet basis functions of specific expressions will lead to the omission of some useful information when constructing multi-wavelet decomposition signals.
Legendre multiwavelets offer numerous advantages, including rich regularities, compact support, orthogonality, and vanishing moments [28,29]. These properties not only enable the identification of essential features across various fault categories in rolling bearings but also significantly reduce the complexity involved in extracting optimal features [30]. Based on this idea, we propose a new fault detection method for the bearing, LMWT, which can effectively extract the characteristic information of the fault signal and achieve rapid and accurate diagnosis of rolling bearing faults. The method for fault detection involves specific steps: initially, the vibration signal undergoes decomposition into various signal components using Legendre multiwavelets. Subsequently, relative energy ratios are computed for these components, and the most responsive component within the fault frequency band is identified. Experimental findings indicate that, when compared to the EWT method, the proposed approach demonstrates superior diagnostic accuracy in addressing rolling bearing fault diagnosis. Notably, its simpler model structure and reduced training parameters in contrast to deep learning models render it significantly valuable in the realm of fault detection.
The upcoming sections of this paper follow this outline. Section 2 provides an in-depth exploration of the implementation of Legendre multiwavelets decomposition. Moving forward, Section 3 introduces three distinct experimental settings, accompanied by their respective experimental results and analyses. Finally, Section 4 encapsulates the conclusions derived from this study.
2. Legendre Multiwavelet Transform
2.1. Legendre Multiwavelet
Legendre multiwavelet is constructed by Legendre polynomials witch can described as
where and p represent the number of adopted Legendre polynomials, respectively. The Legendre scale basis function is described by [31] as the following:
In general, a subspace comprising piecewise polynomials is defined as
the arrangement of which constitutes a linear space. Here, the variables denote the resolution level, while represents the translation parameter. The corresponding interval is defined as . It is apparent that the set establishes an orthonormal basis for the subspace . Subsequently, the construction of the subspace is also achieved utilizing through dilation and translation.
which forms an orthonormal basis in the subspace .
If the analysis of vibration signals related to various bearing faults is confined exclusively within the subspace , it efficiently captures the low-frequency components at resolution level n. However, numerous characteristic features of bearing faults prominently manifest within the high-frequency components. Therefore, it becomes imperative to define the orthogonal complement of the subspace within , termed as the multiwavelet subspace . This necessity arises from the equation as
Alpert et al. [31] developed the multiwavelet subspace to facilitate the efficient computation of integral and differential operators. The implications of this construction can be elucidated through the two scale relations expressed as
where is the multiwavelet basis. In this paper, the coefficient matrices mentioned above, and , are utilized for convolving the raw bearing data. This convolution process is convenient and facilitates the comprehensive extraction of various characteristics associated with faults present in the bearing.
Specifically, diverse regularities are better suited for adaptively discerning complex fault characteristics and offering alternative methods for extracting features. These methods require less expertise compared to traditional wavelet transform techniques.
2.2. Envelope Spectrum
For non-stationary vibration signals, it is necessary to obtain the envelope of the signal and extract the envelope frequency. Envelope detection can be achieved using the Hilbert transform. The Hilbert transform is a special type of Fourier transform that can convert signals with non-zero real parts into pure imaginary signals. The formula for the Hilbert transform is as follows:
where is the input signal, denotes the Cauchy principal value, and is the Hilbert transform of . The Hilbert transform can be applied to the raw signal to obtain the corresponding analytic signal, which contains both the raw signal and its Hilbert transform. The envelope of the signal can then be obtained from the absolute value of the analytic signal.
2.3. The Proposed Method
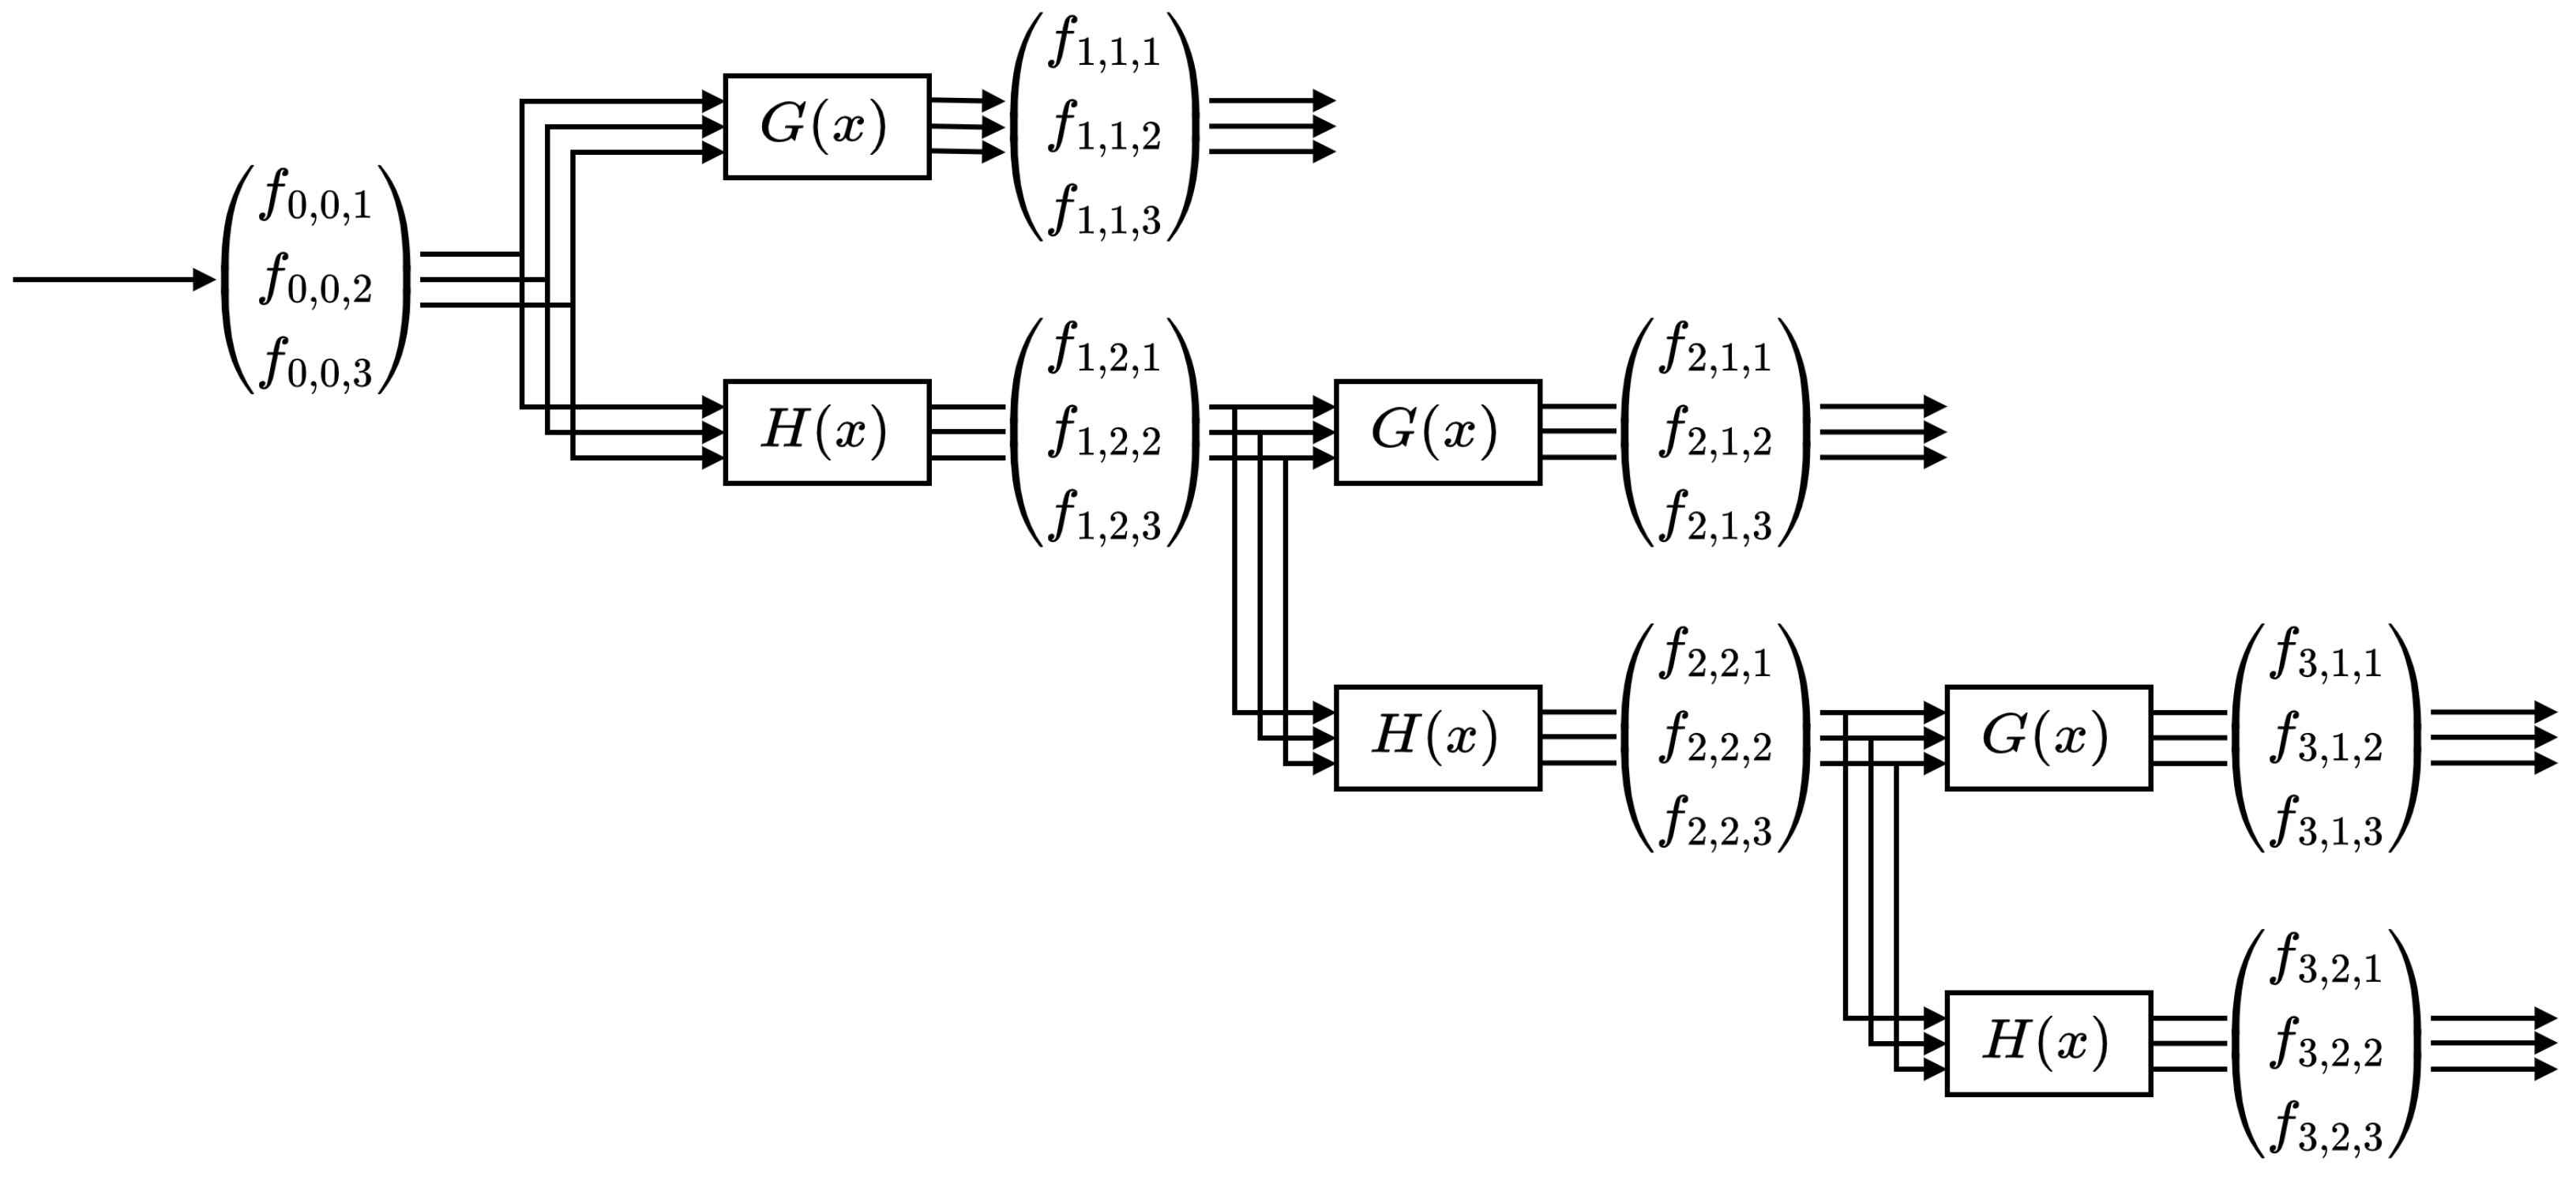
There is a rare number of wavelet functions that have rich regularities and orthogonality at the same time, which may lead to the loss of useful information for fault detection frequencies after multiwavelet decomposition. To overcome this drawback, this paper employs Legendre multiwavelets for decomposing the signals related to bearing faults. Figure 1 illustrates the signal decomposition process using three wavelets in the Legendre multiwavelet transform. In this figure, we first replicate the original signal into three copies (assuming a total of three Legendre multiwavelets), each utilized for the decomposition of the Legendre multiwavelets. After each level of decomposition, we obtain two components: the low-frequency and high-frequency signals. We retain the high-frequency part and use the low-frequency signal for the next level of decomposition, continuing this process until we reach the specified number of levels. In order to obtain enough fault frequency features from the wavelet decomposition coefficients, there is no post-processing in the traditional wavelet transform. Additionally, to accurately locate signal components sensitive to fault frequencies, the relative energy ratio [32] is introduced, with the specific formula as follows:
where represents the characteristic frequency, A is the amplitude of the multiwavelet coefficients’s envelope spectrum, is the frequency interval, and refers to the range of the frequency band.
3. Validation Experiment
In this study, the LMWT method proposed in this paper is used to test vibration signals under three conditions. These conditions include vibration signals under a simulated high noise interference environment, single fault signals in the Case Western Reserve University (CWRU) bearing dataset, and compound fault signals in the Paderborn University bearing dataset. In these experiments, the proposed method is used to process the vibration signals and compare them with the EWT method regarding their performance in fault detection, specifically comparing the LMWT method with the EWT method under different signal conditions to evaluate the practicality and effectiveness of the proposed method in bearing fault detection.
3.1. Case 1: Simulated Signal
In this section, the simulated signal is used to evaluate the performance and robustness of the LMWT method in high-noise environments. Using the following mathematical models [15] to generate the simulated signal, and process and analyze these signals to evaluate the effectiveness of the LMWT method.
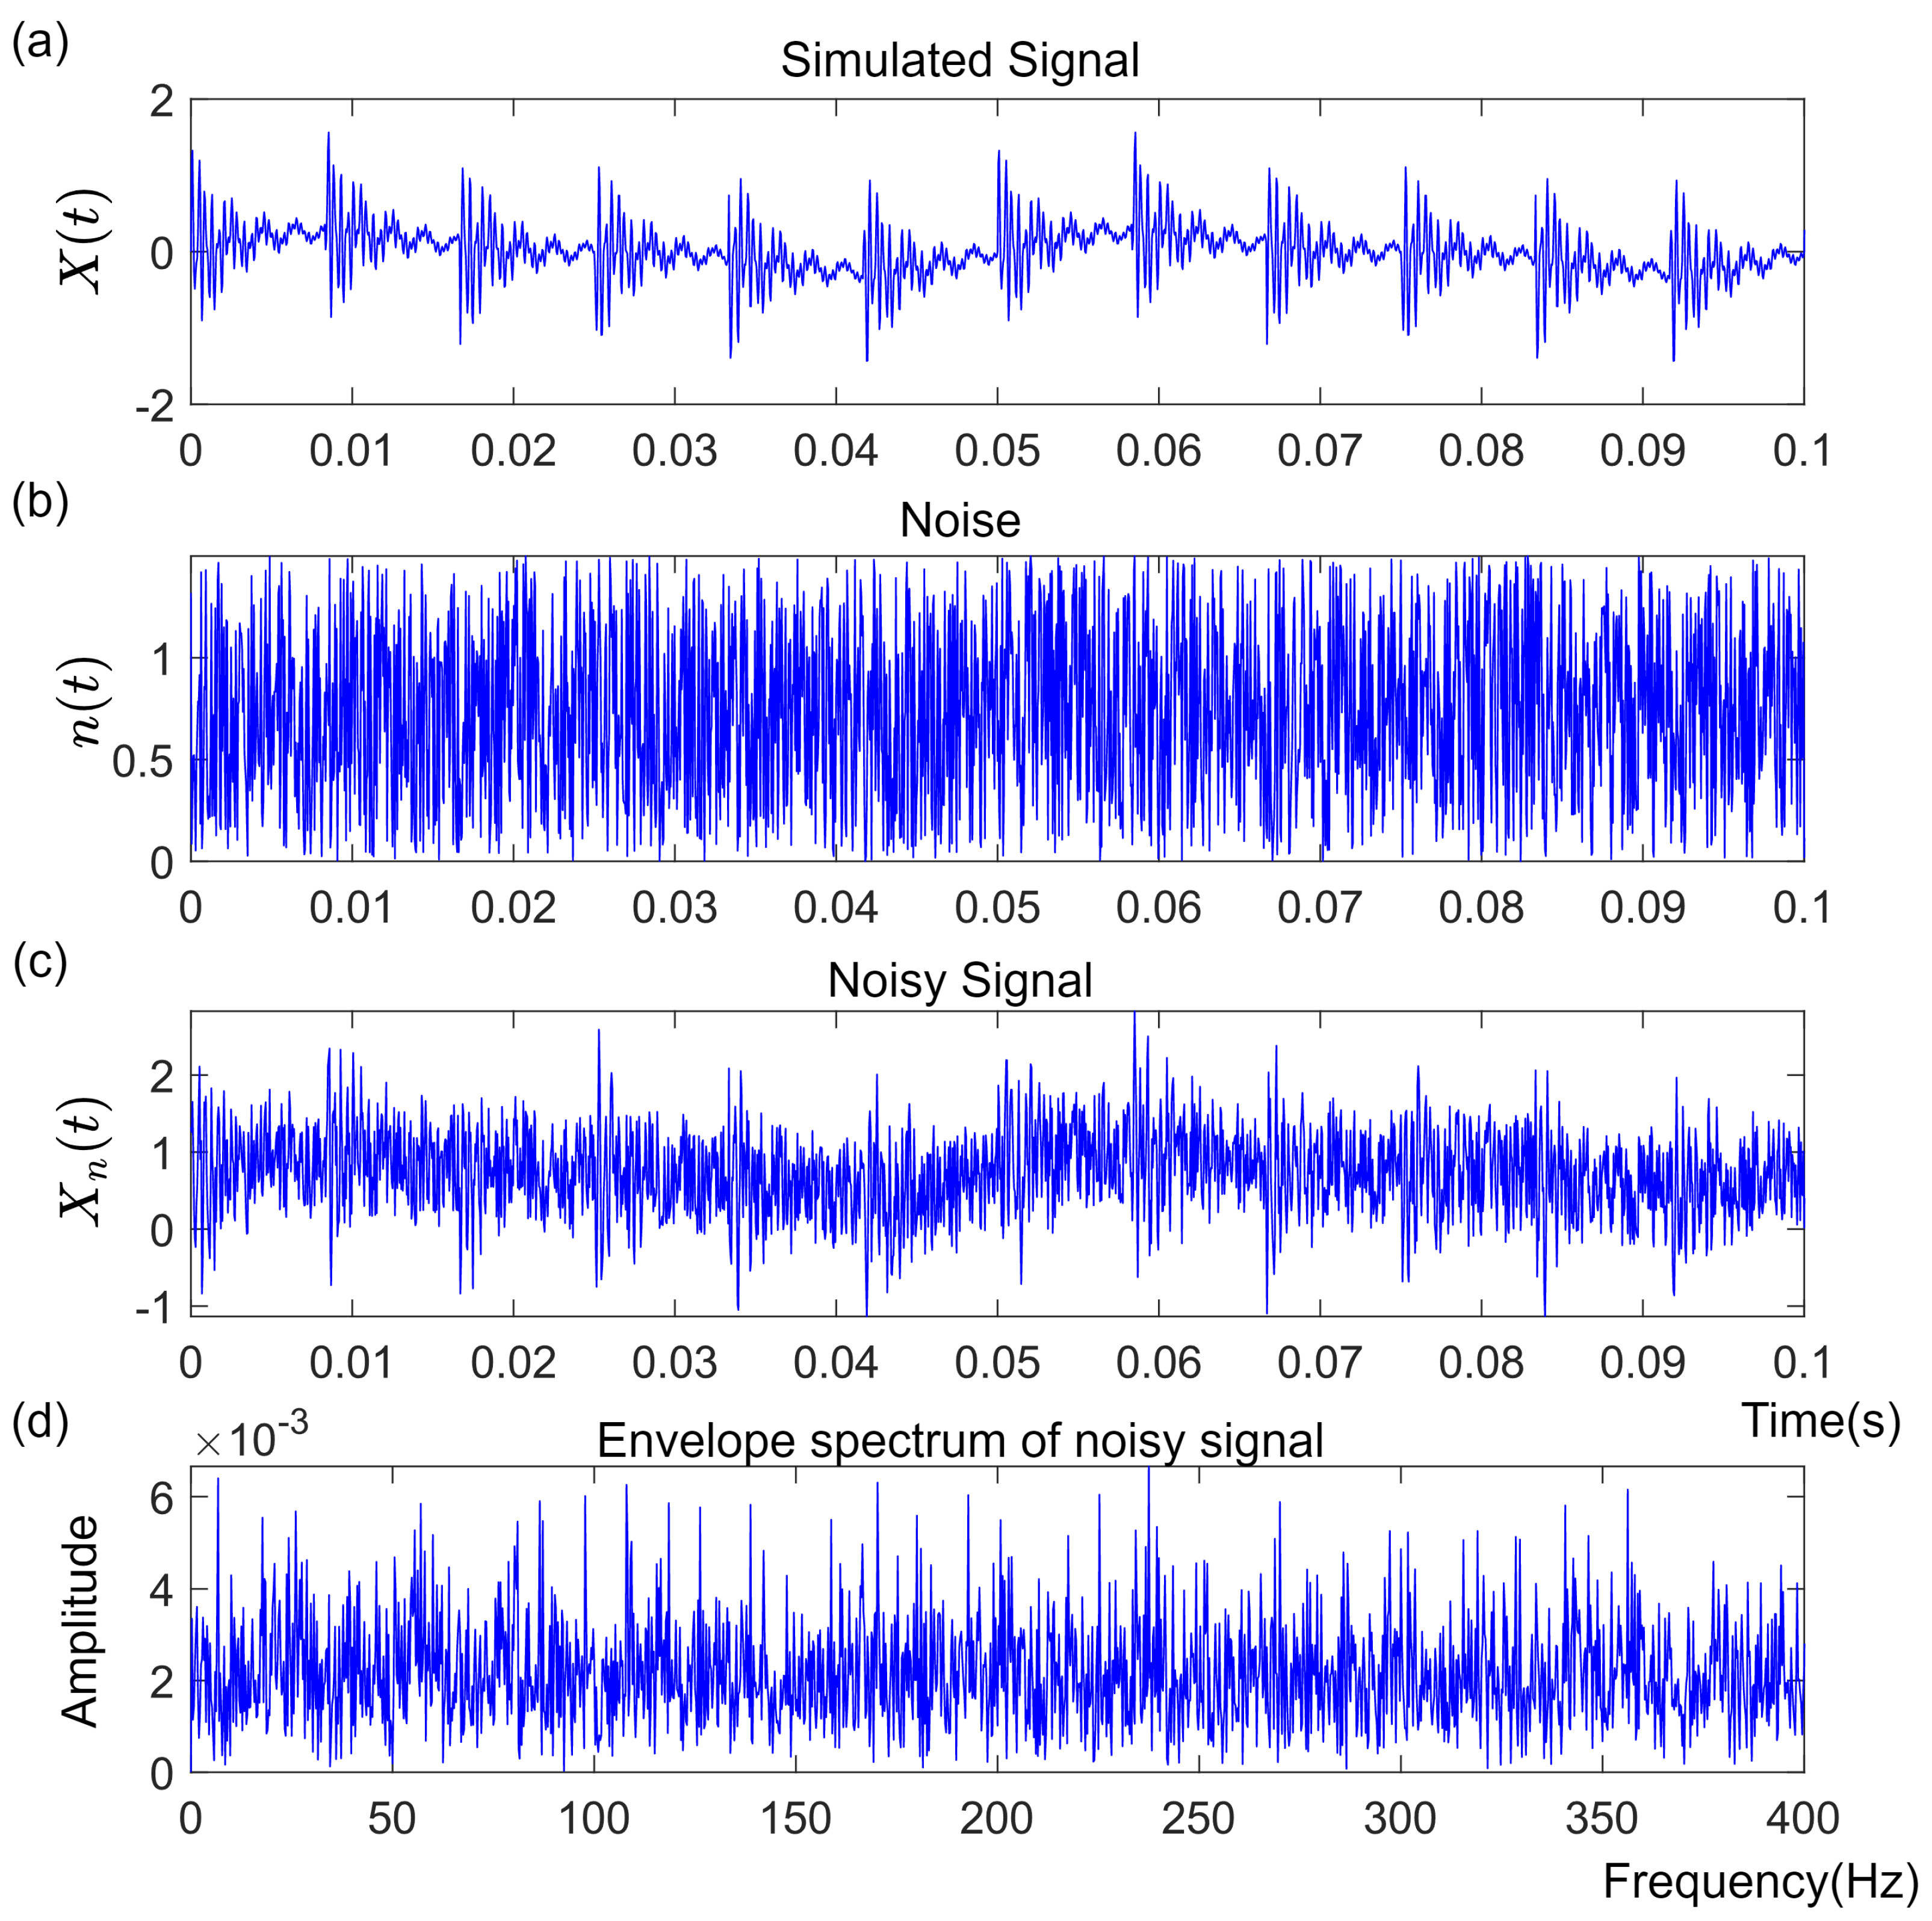
where denotes the original signal, represents the noise signal generated by a Gaussian distribution, and stands for the resulting noisy signal. The resonant frequencies, denoted by , are set to 500, 2500, and 4000, while the corresponding parameters are set to 100, 500, and 300, respectively. Additionally, represents the rotation frequency set at 20, with denoting the first harmonic of the rotation frequency. In this simulation, the sampling frequency is set to 20,480 Hz, with a simulated time duration of 4 s, resulting in 81,920 sample points. Furthermore, is set to 120, representing the characteristic frequency of the fault. To provide a comprehensive illustration of the relevant signals, we plot the simulated signal containing fault pulses, the noise, the simulated signal with added noise, and the signal envelope spectrum obtained after processing through the LMWT method. These plots are displayed separately in Figure 2 to enhance clarity.
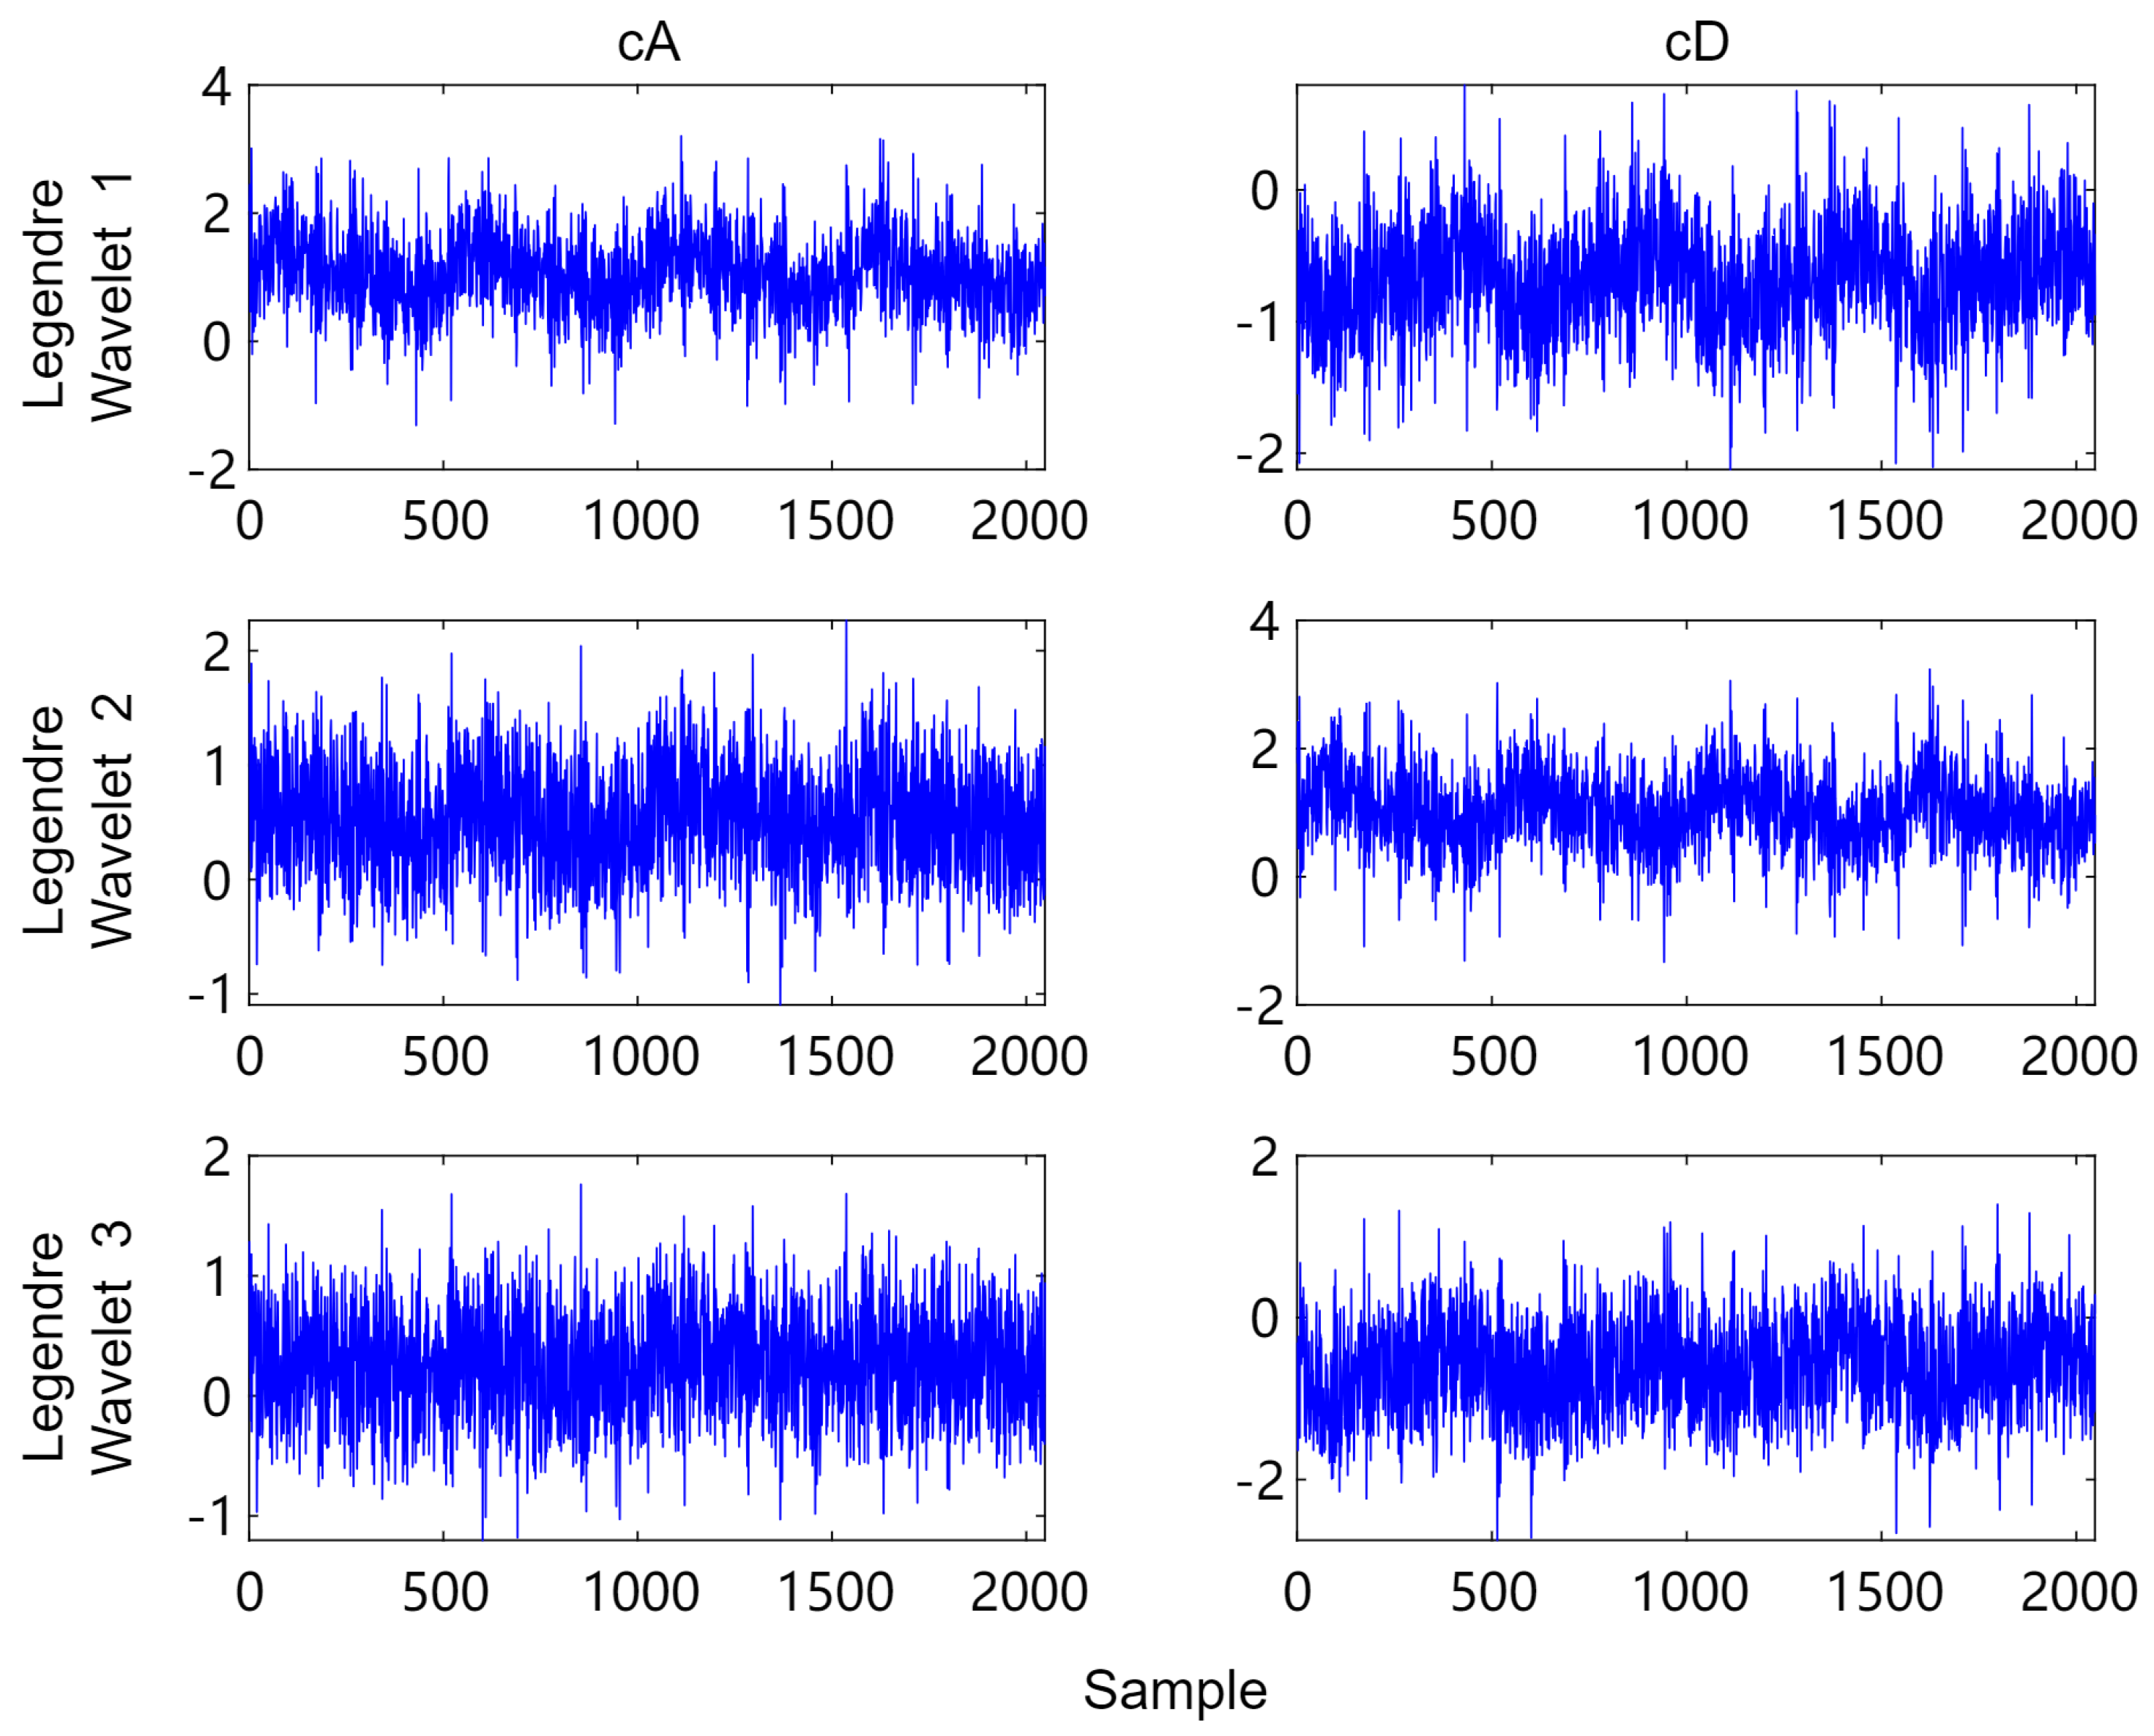
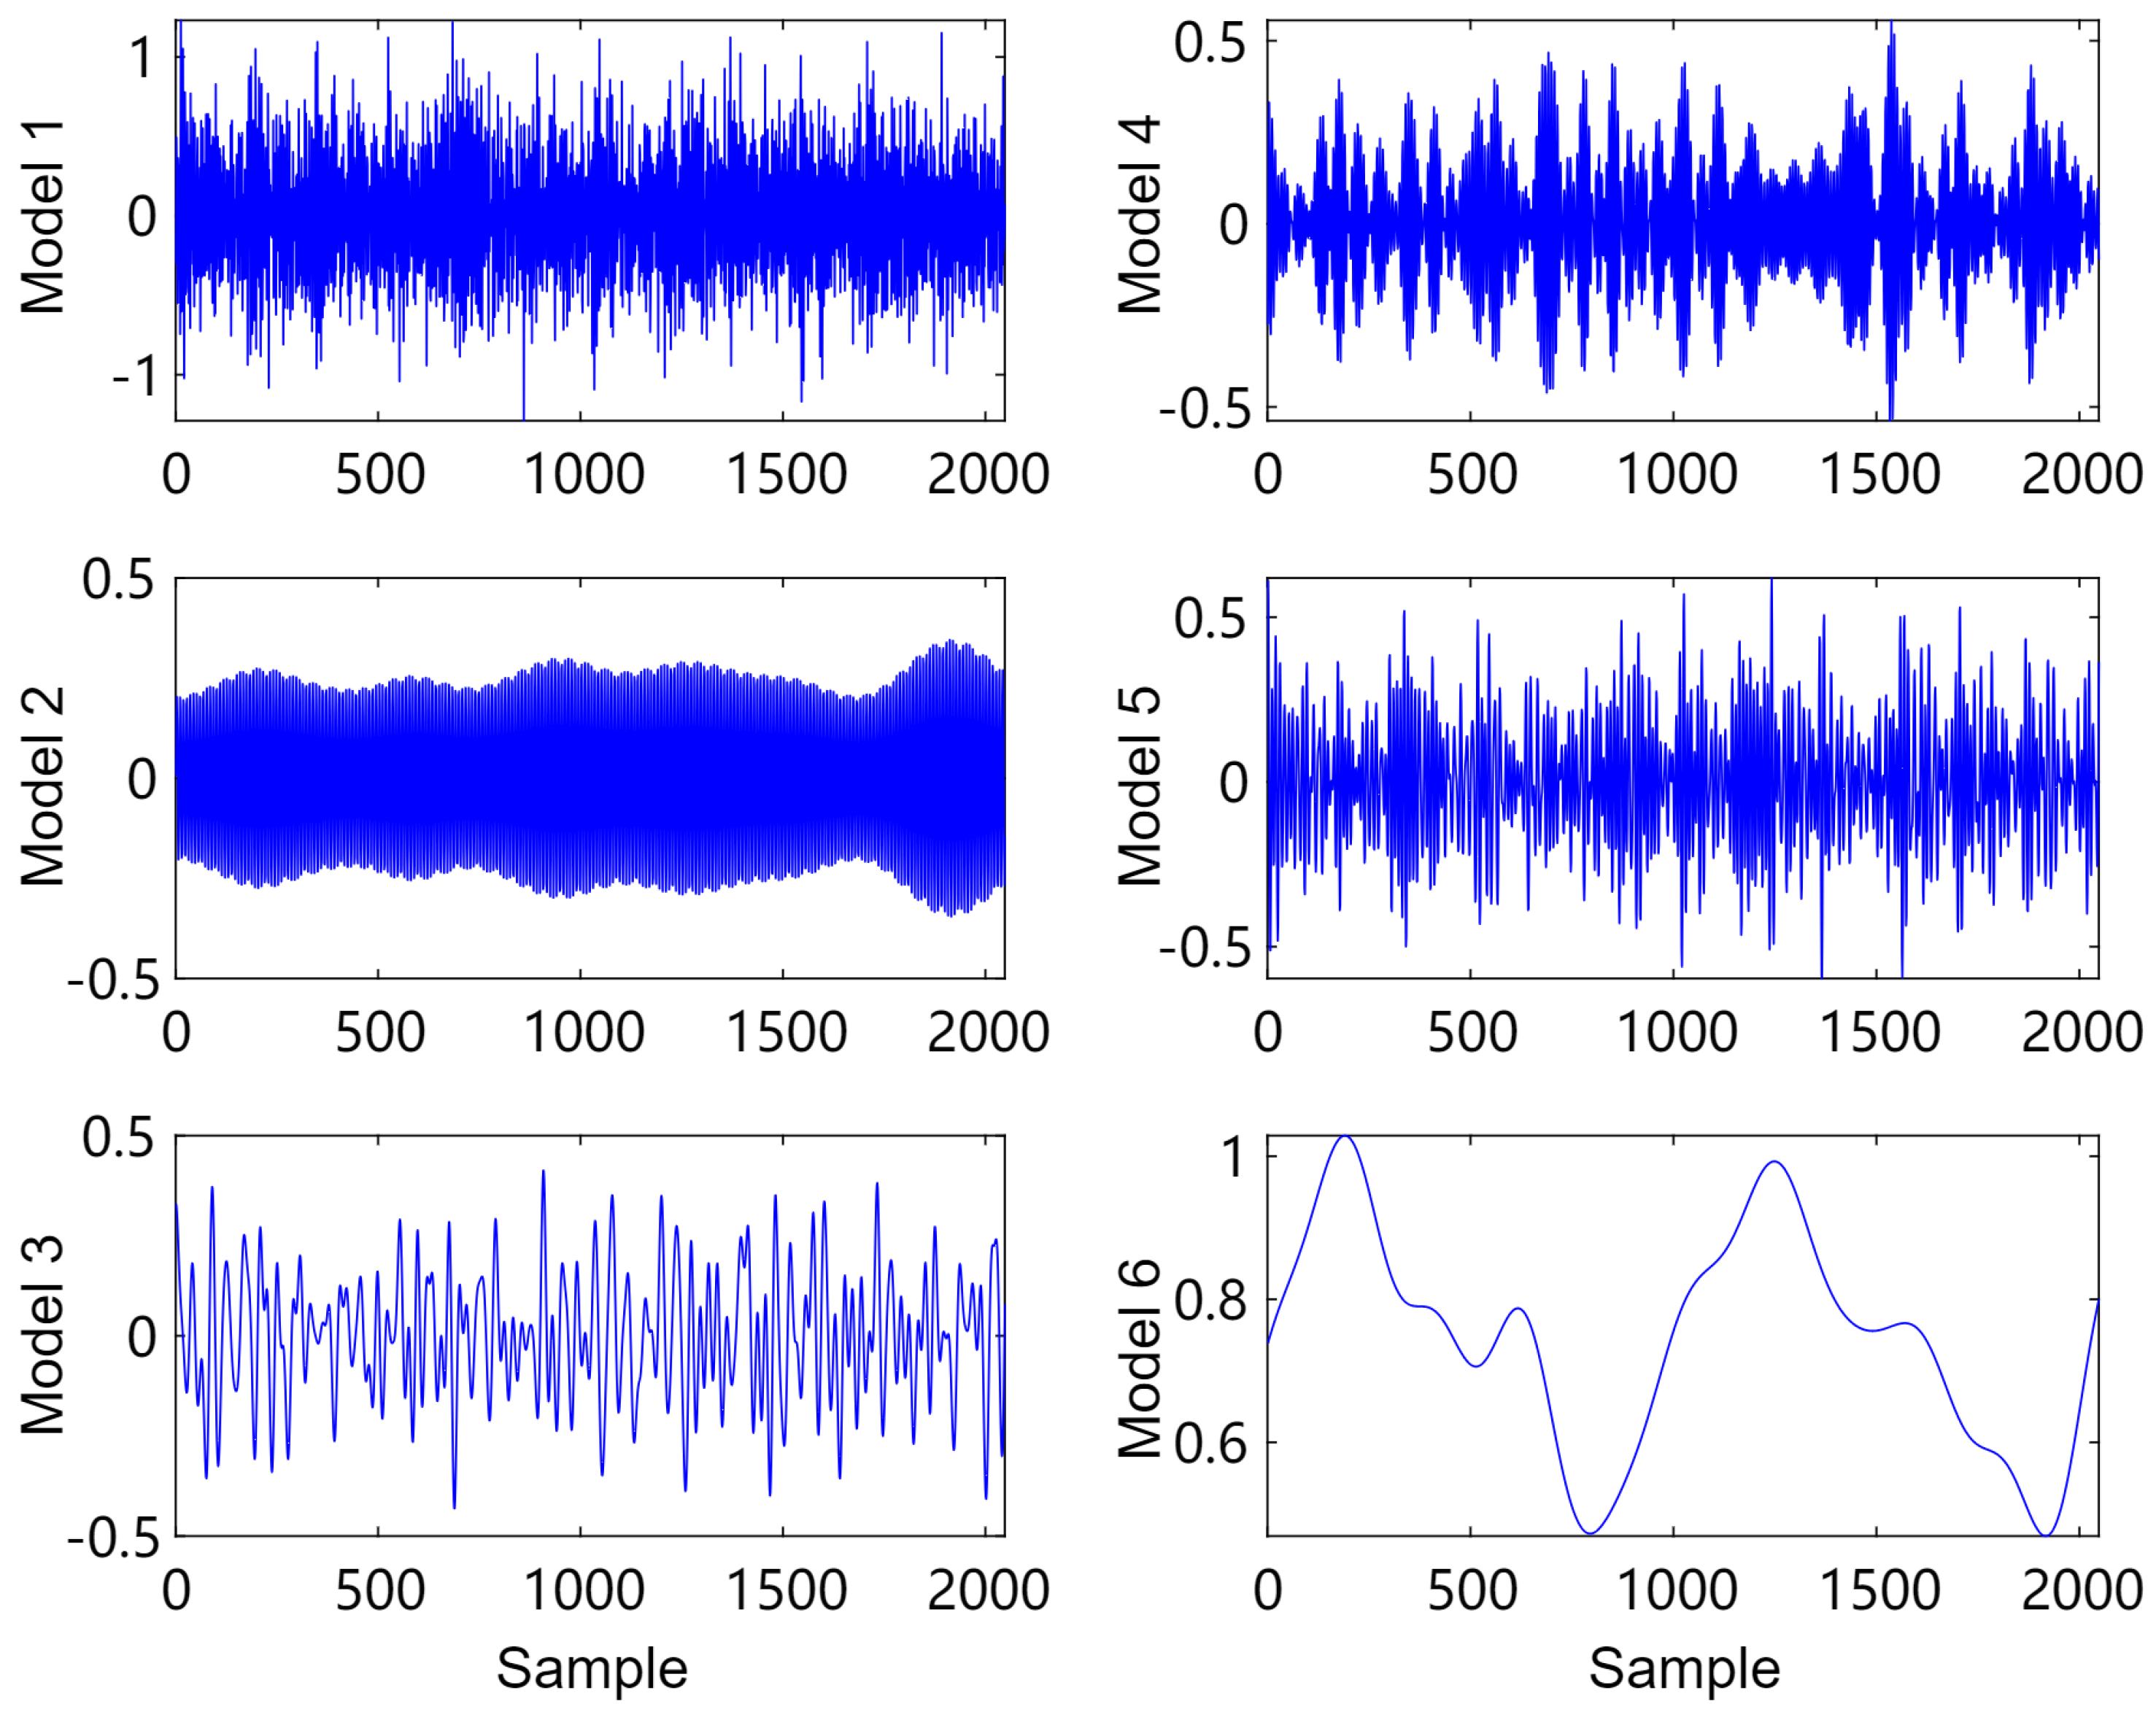
Typically, a signal with noise can affect its frequency domain characteristics and structure, which in turn affects subsequent signal analysis and processing. Based on sampling theory [33], needing enough sampling points can effectively represent the feature of the signal, but more sampling points lead to high computational cost. Consequently, the 4000 sample points of the noisy signal are applied to LMWT. To better understand the characteristics and structure of signal with noise, the proposed method in this paper and the traditional classic method EWT are applied to the noisy signal. The signal is decomposed into multiple scales and frequency signal components. The signal components obtained by applying a one decomposition level of the signal using the LMWT method are shown in Figure 3, and the empirical modes obtained using EWT applied to the simulated noise described above are shown in Figure 4.
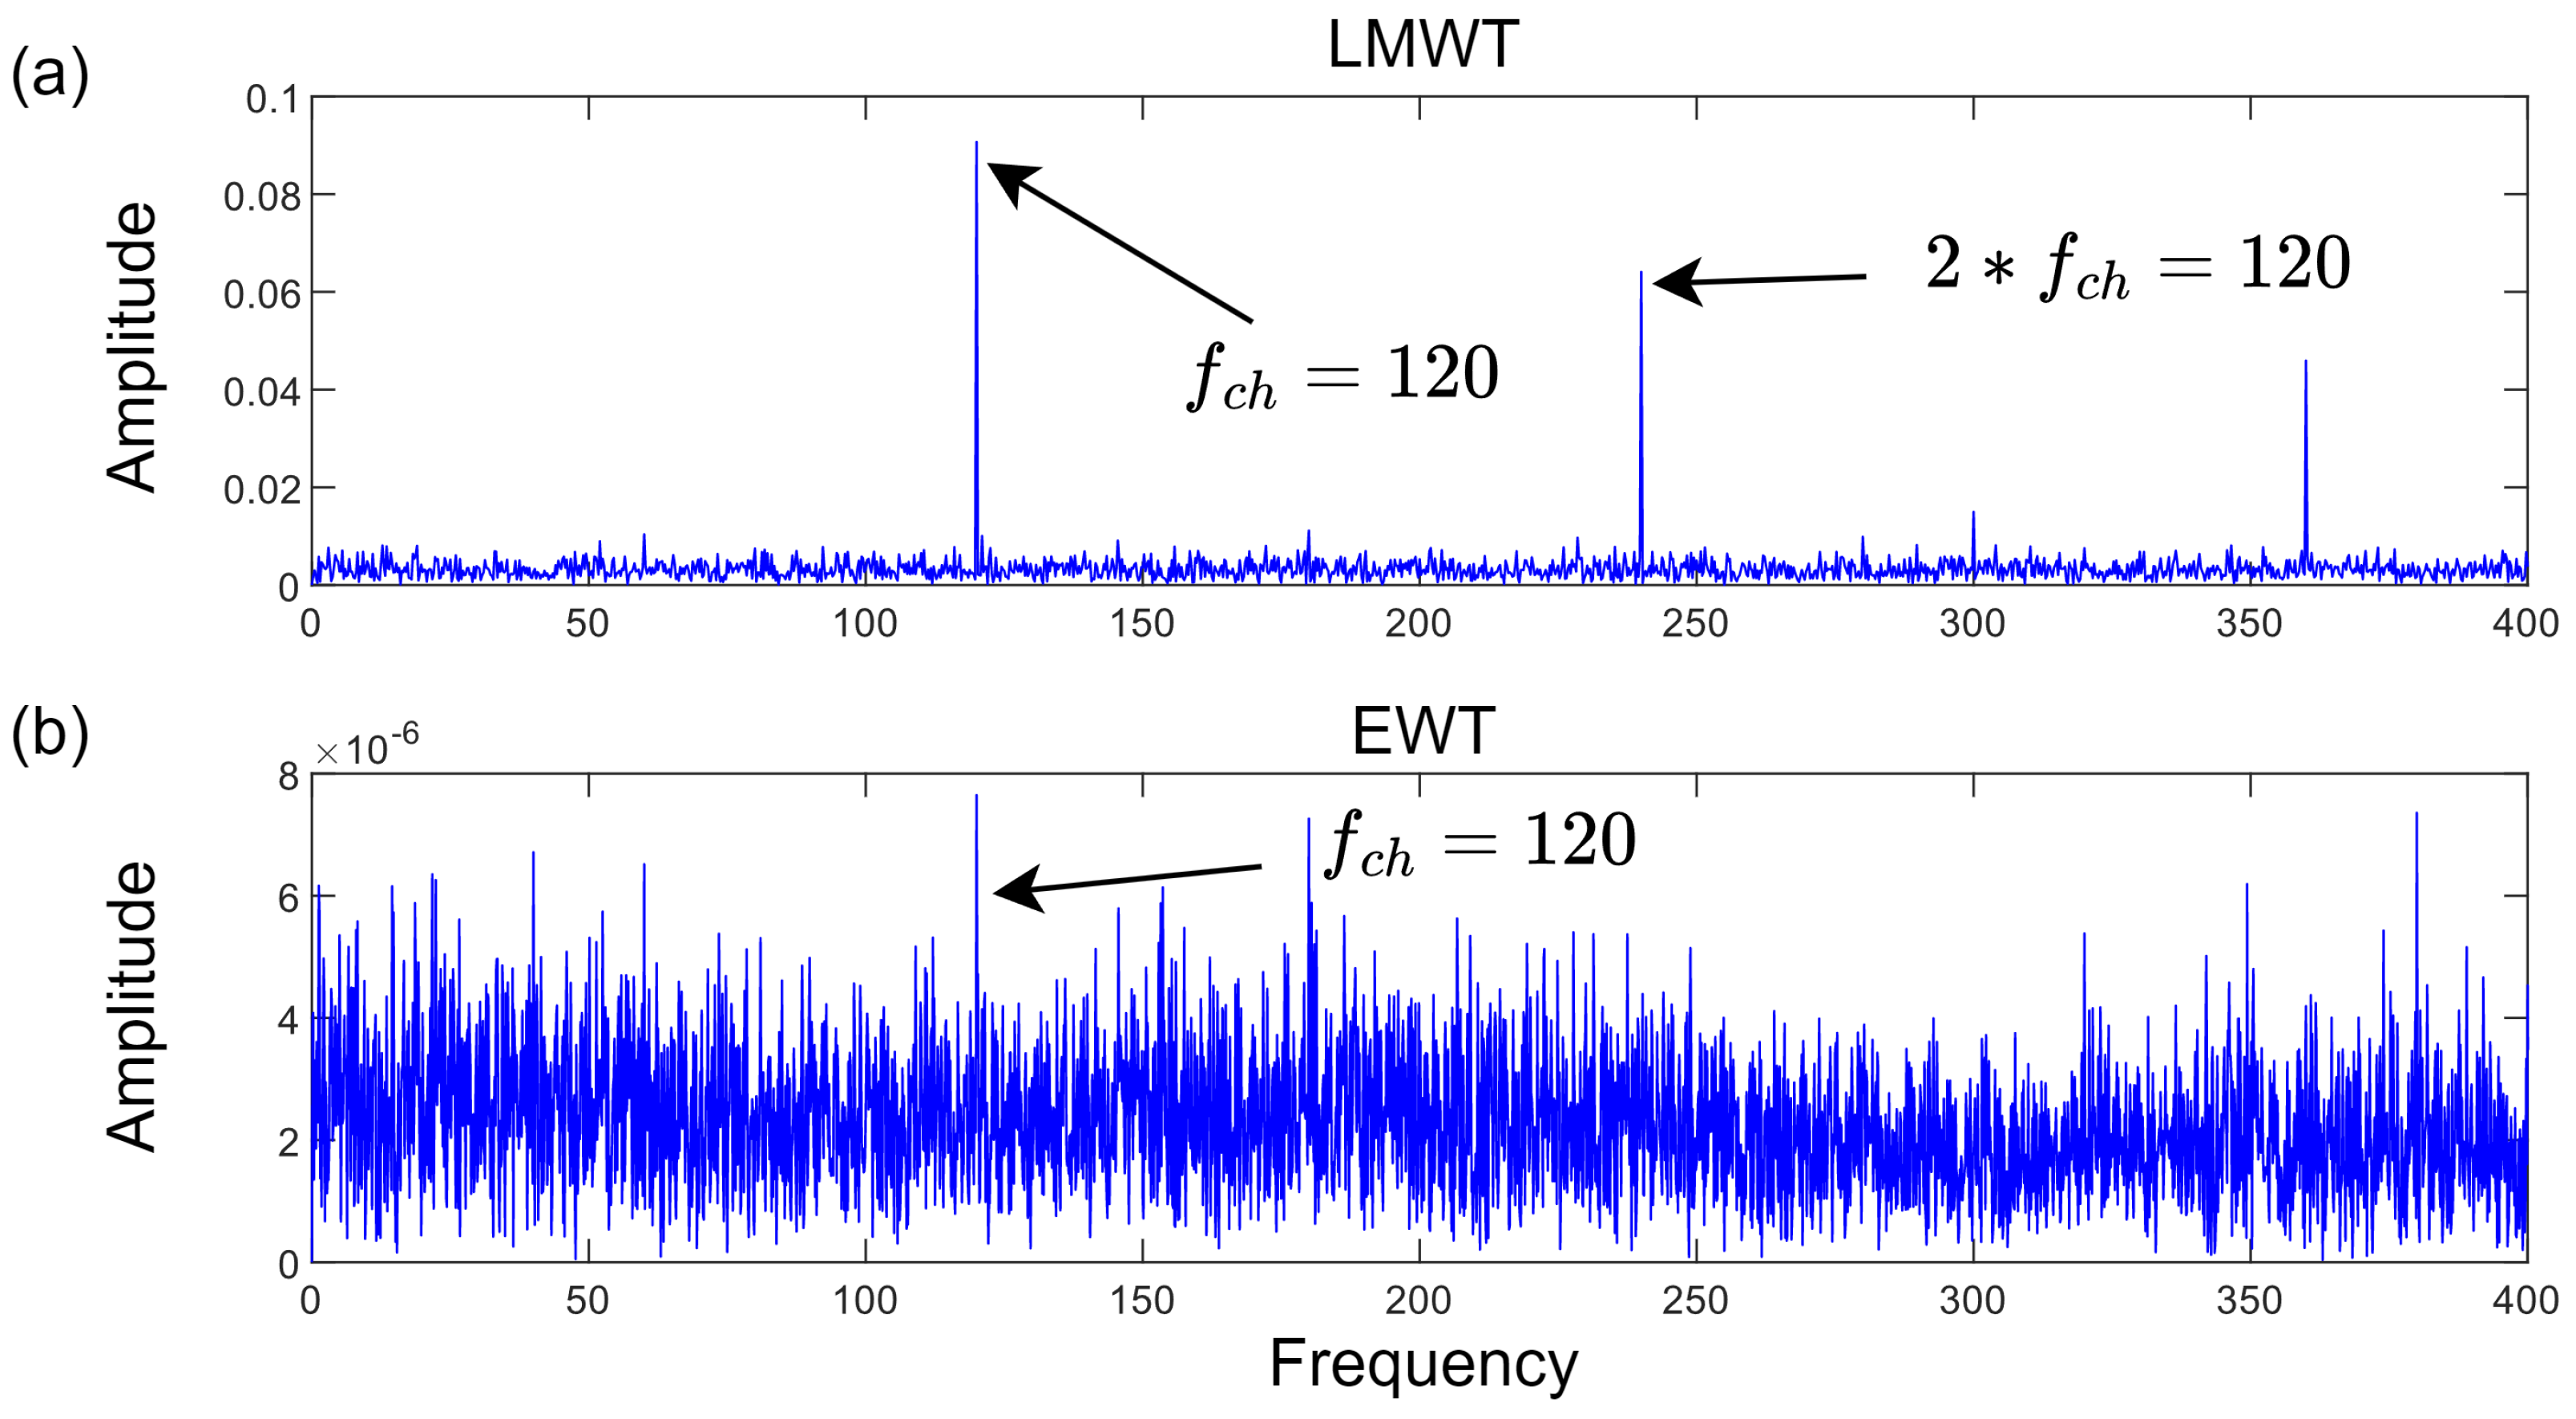
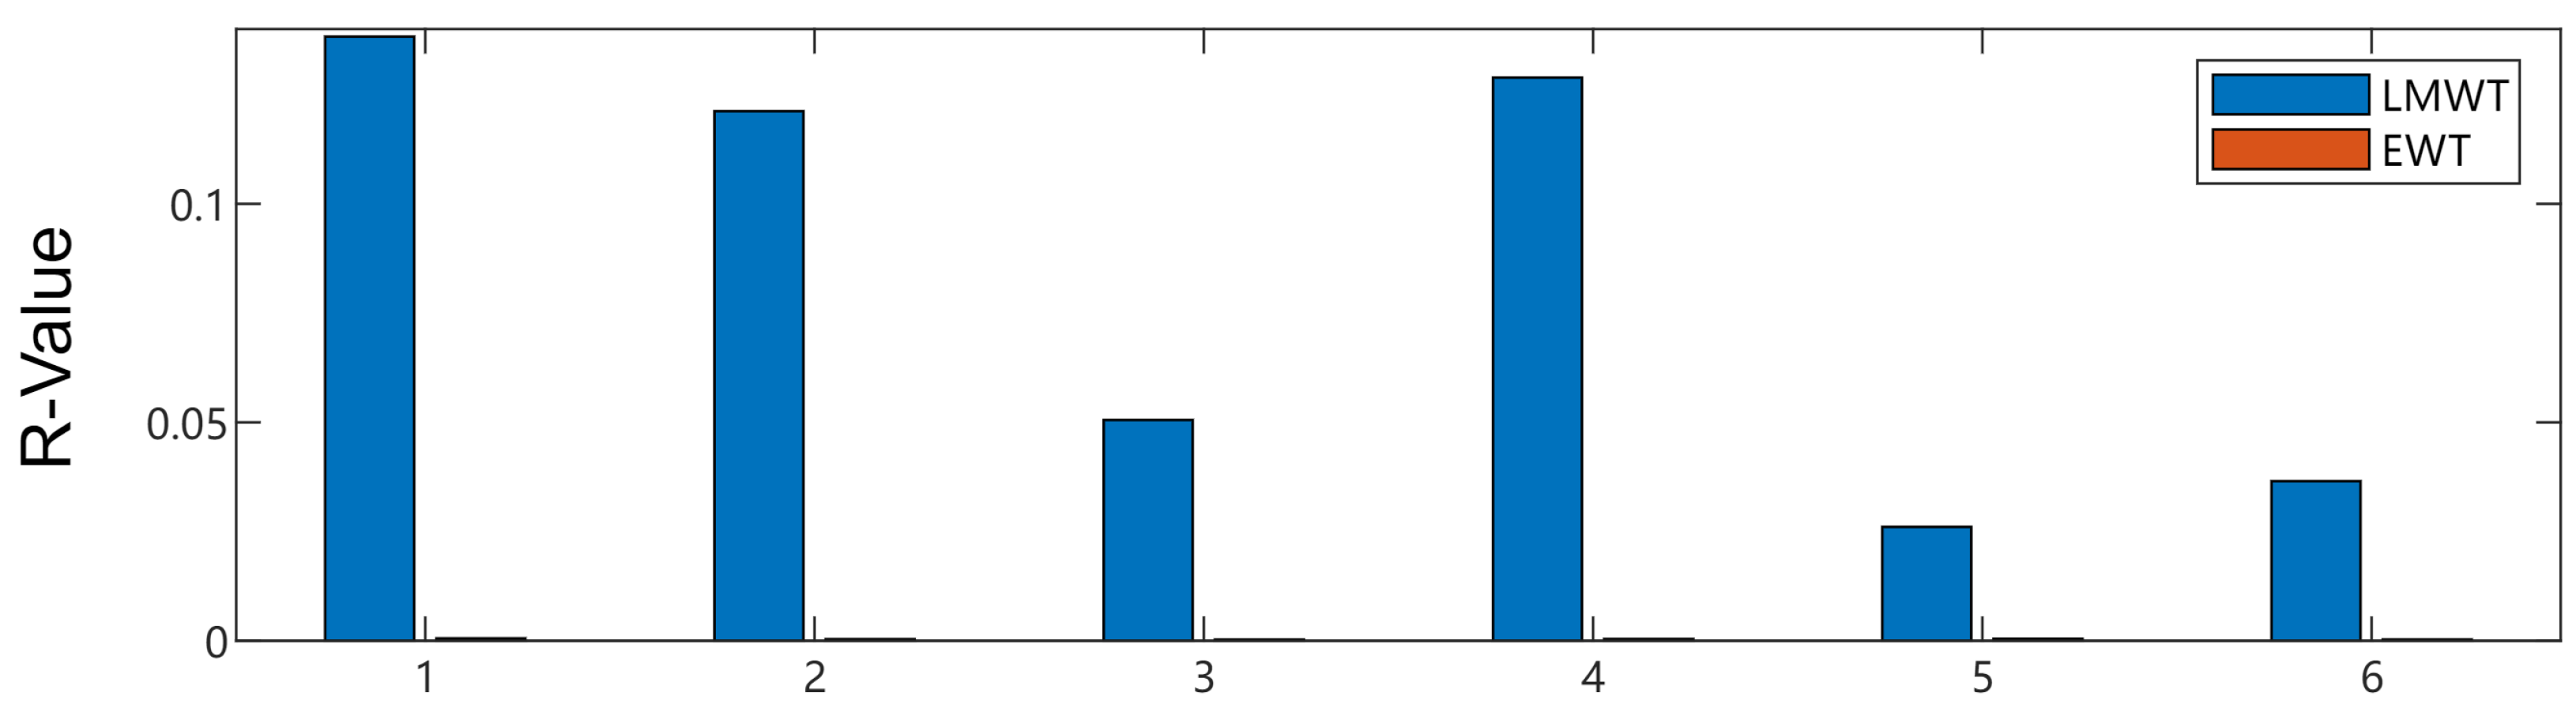
According to the relative energy ratio, the signal component that is most sensitive to the fault characteristic is selected from the results processed by the LMWT and EWT methods. The envelope spectrum of the selected signal component is shown in Figure 5. It can be observed that although the fault characteristic frequency exists in the envelope spectrum of the most sensitive component obtained by EWT, the corresponding harmonics of the fault frequency cannot be observed. However, within the envelope spectrum of the most sensitive component acquired through LMWT, distinct fault characteristic frequency and its harmonics prominently emerge, serving as clear indicators of bearing damage. As shown in Figure 6, by calculating the relative energy ratio of all signal components, it can be observed that the relative energy ratio of the components obtained by using EWT decomposition is significantly smaller than that obtained by using LMWT, indicating that signal components obtained by the LMWT method can more accurately detect bearing faults than those obtained by EWT.
3.2. Case 2: Single Fault Signal
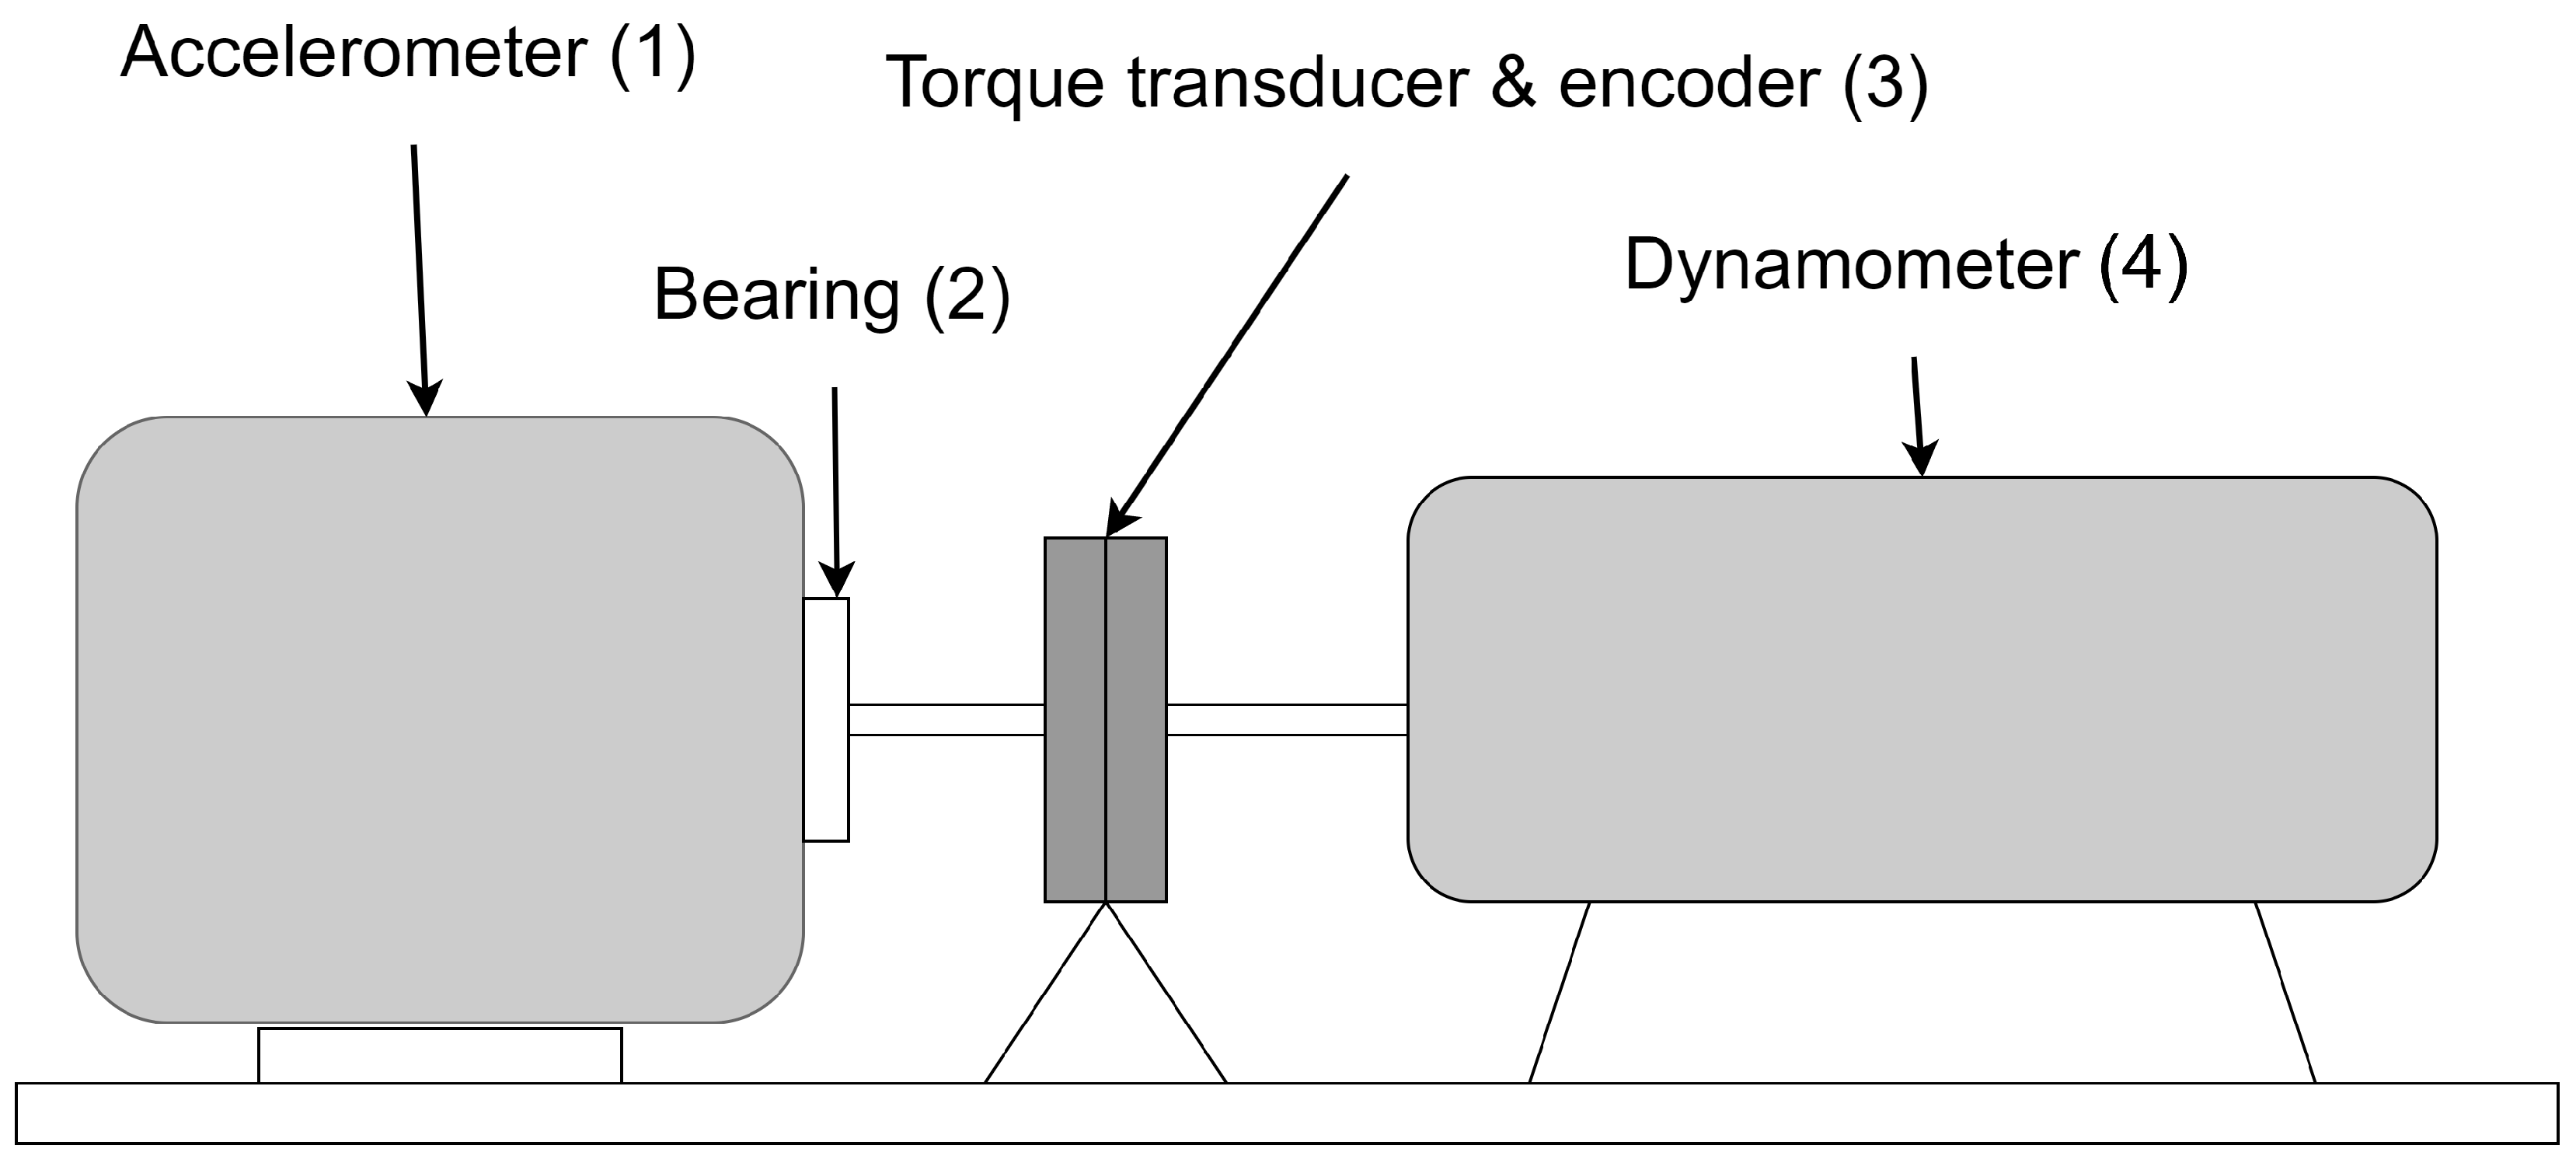
In this subsection, this paper evaluates the ability of the proposed method to identify different faults of bearings by using single-fault bearing vibration signals obtained from the CRWU Bearing Data Center [34]. The experimental setup schematic is shown in Figure 7. This experimental setup comprises a bearing and accelerometer(located on the left side of the figure), a torque transducer/dencoder (connected in the middle of the figure), and a dynamometer (positioned on the right side of the figure). Additionally, the experimental setup is driven by a 1.5 kW (2 horsepower) electric motor (not depicted in the figure). The vibration signal used in this work is from a 6205-2RS JEM SKF bearing, and the geometric parameters of the bearing are shown in Table 1. In this study, the vibration signal used corresponds to faults in the rolling elements, inner race, and outer race. In each case, the vertical acceleration on the drive end bearing housing was measured, and sampling rate of 12 kHz was used for these cases.
According to the physical characteristics shown in Table 1, the characteristic frequencies related to outer race fault can be calculated using the following formula:
To calculate the fault frequency associated with the inner race fault, the following formula can be used:
To calculate the fault frequency associated with the rolling element fault, the following formula can be used:
where is the number of rolling elements, D is the pitch diameter of the bearing in mm, d is the diameter of the rolling element in mm, and is the bearing’s rotating frequency in Hz. Table 2 presents the fault frequencies of different faults for the bearing 6205-2RS JEM SKF at 1730 rpm in the CRWU bearing dataset.
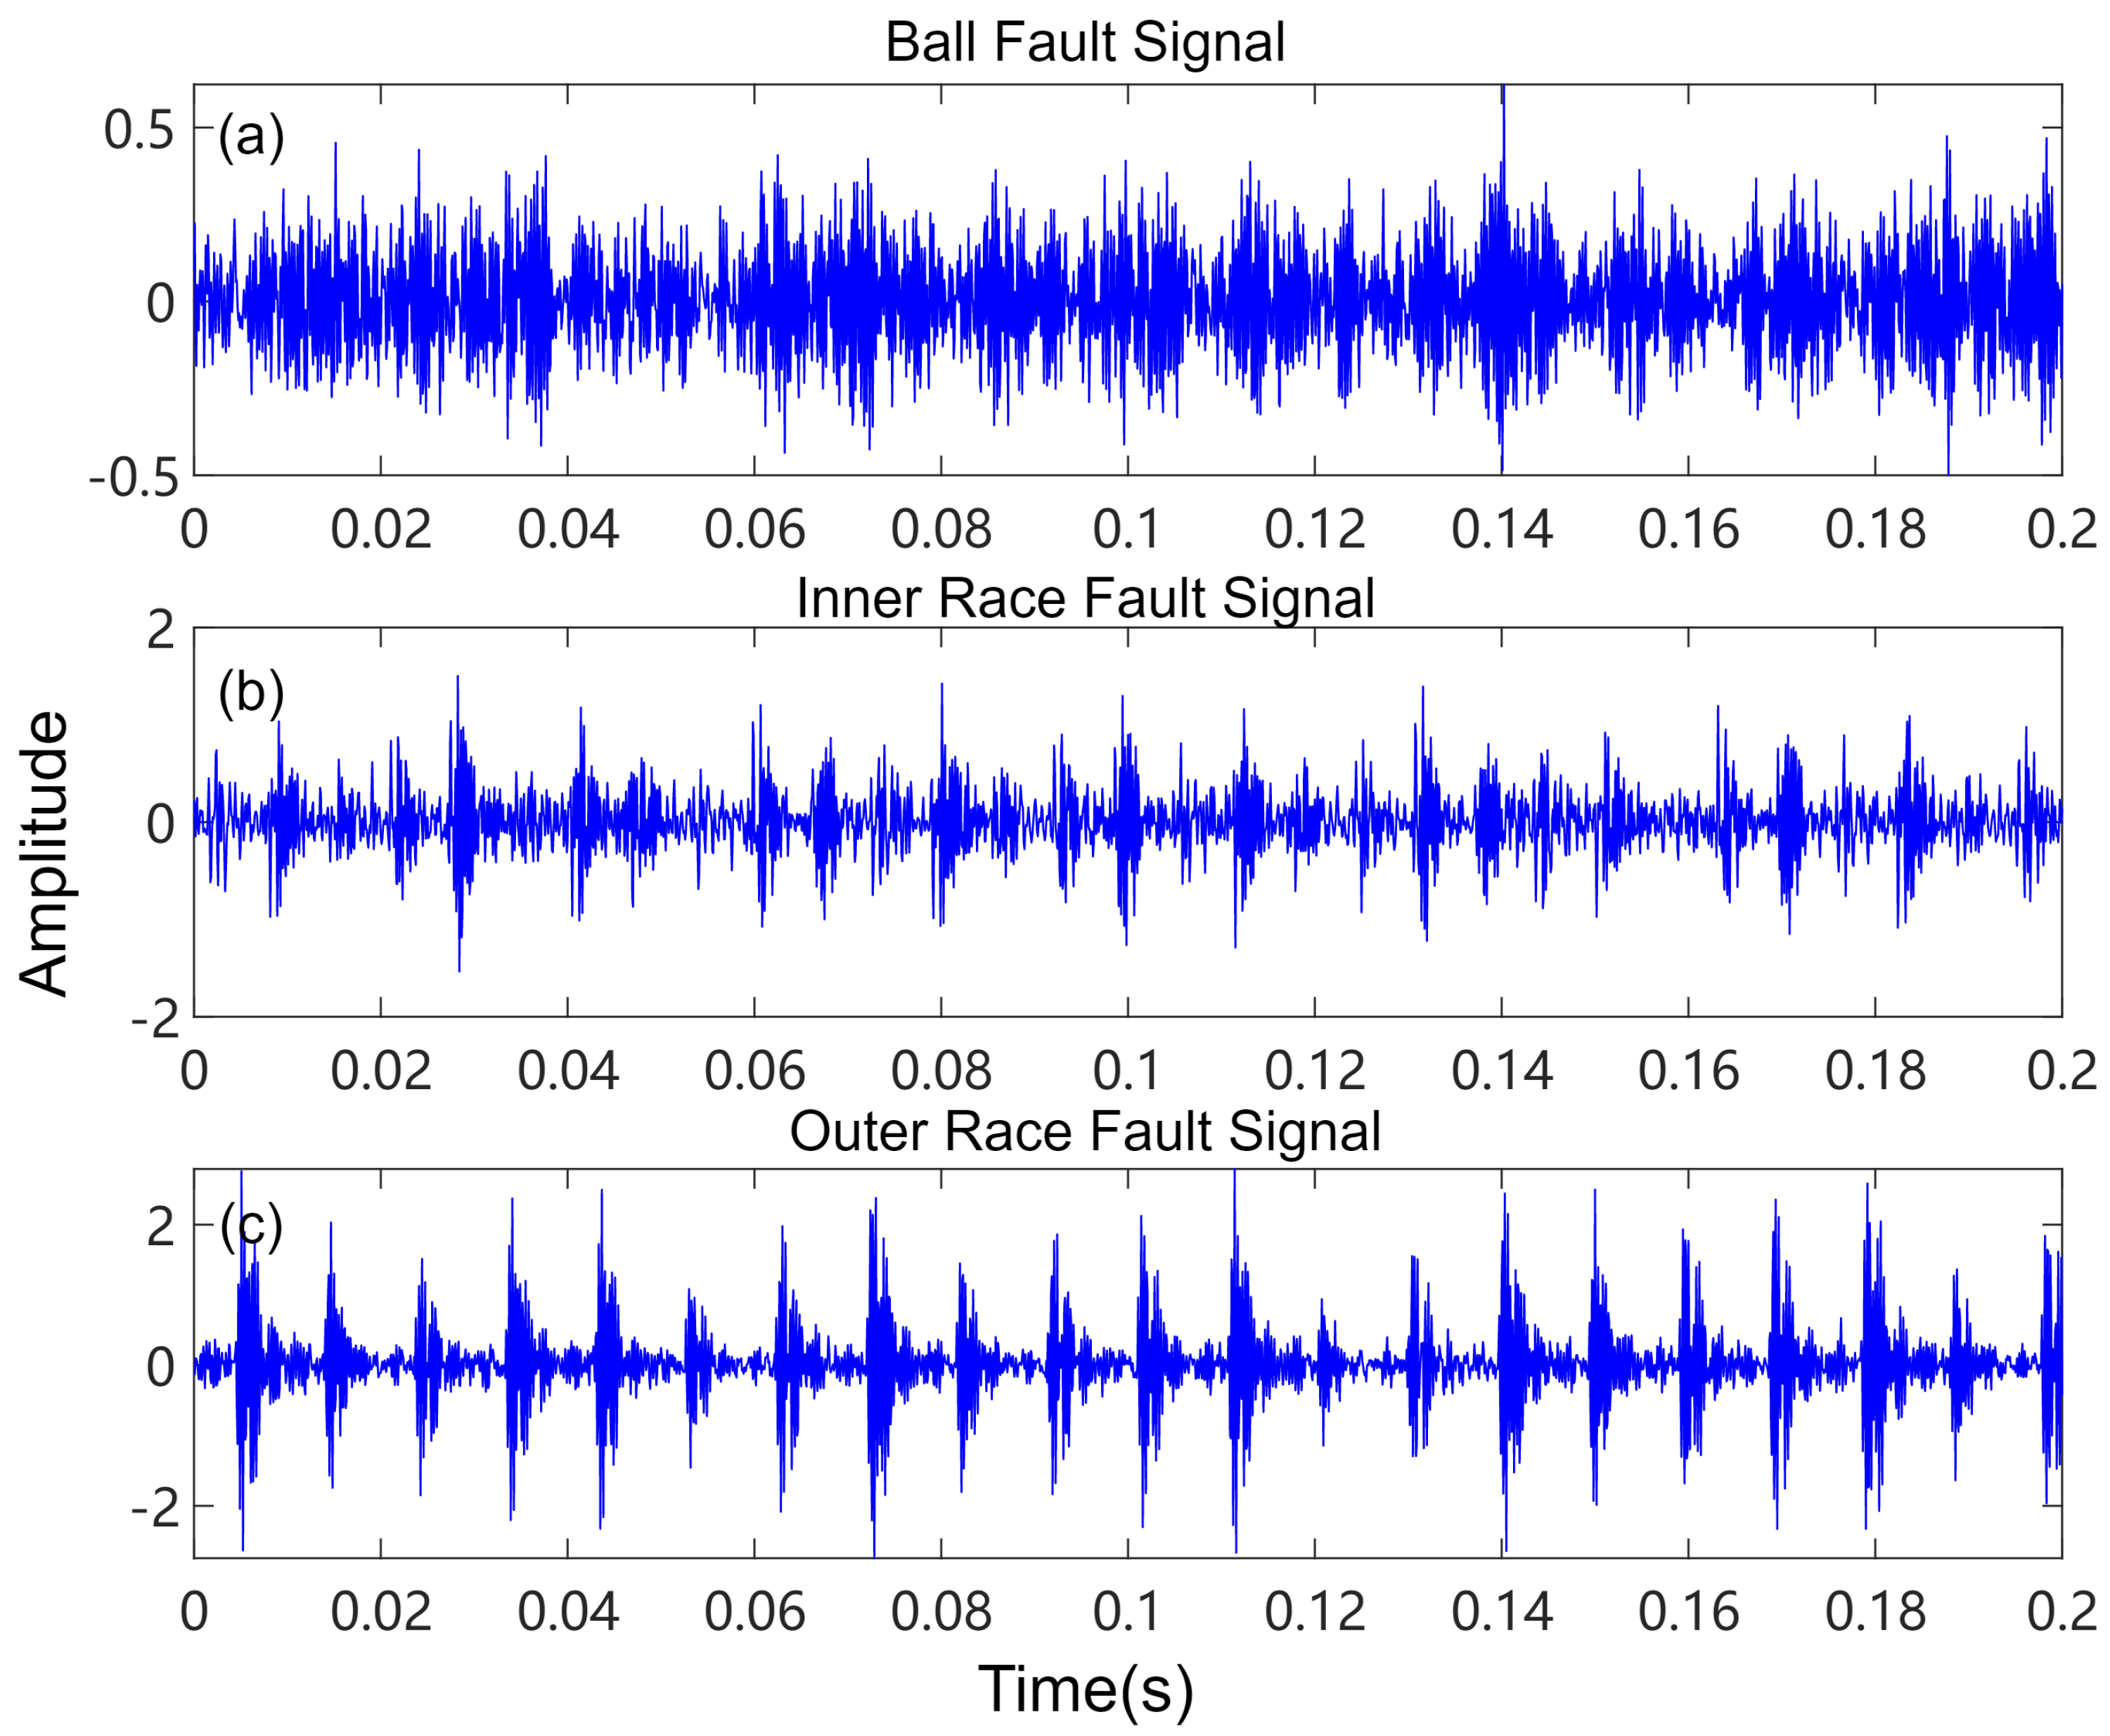
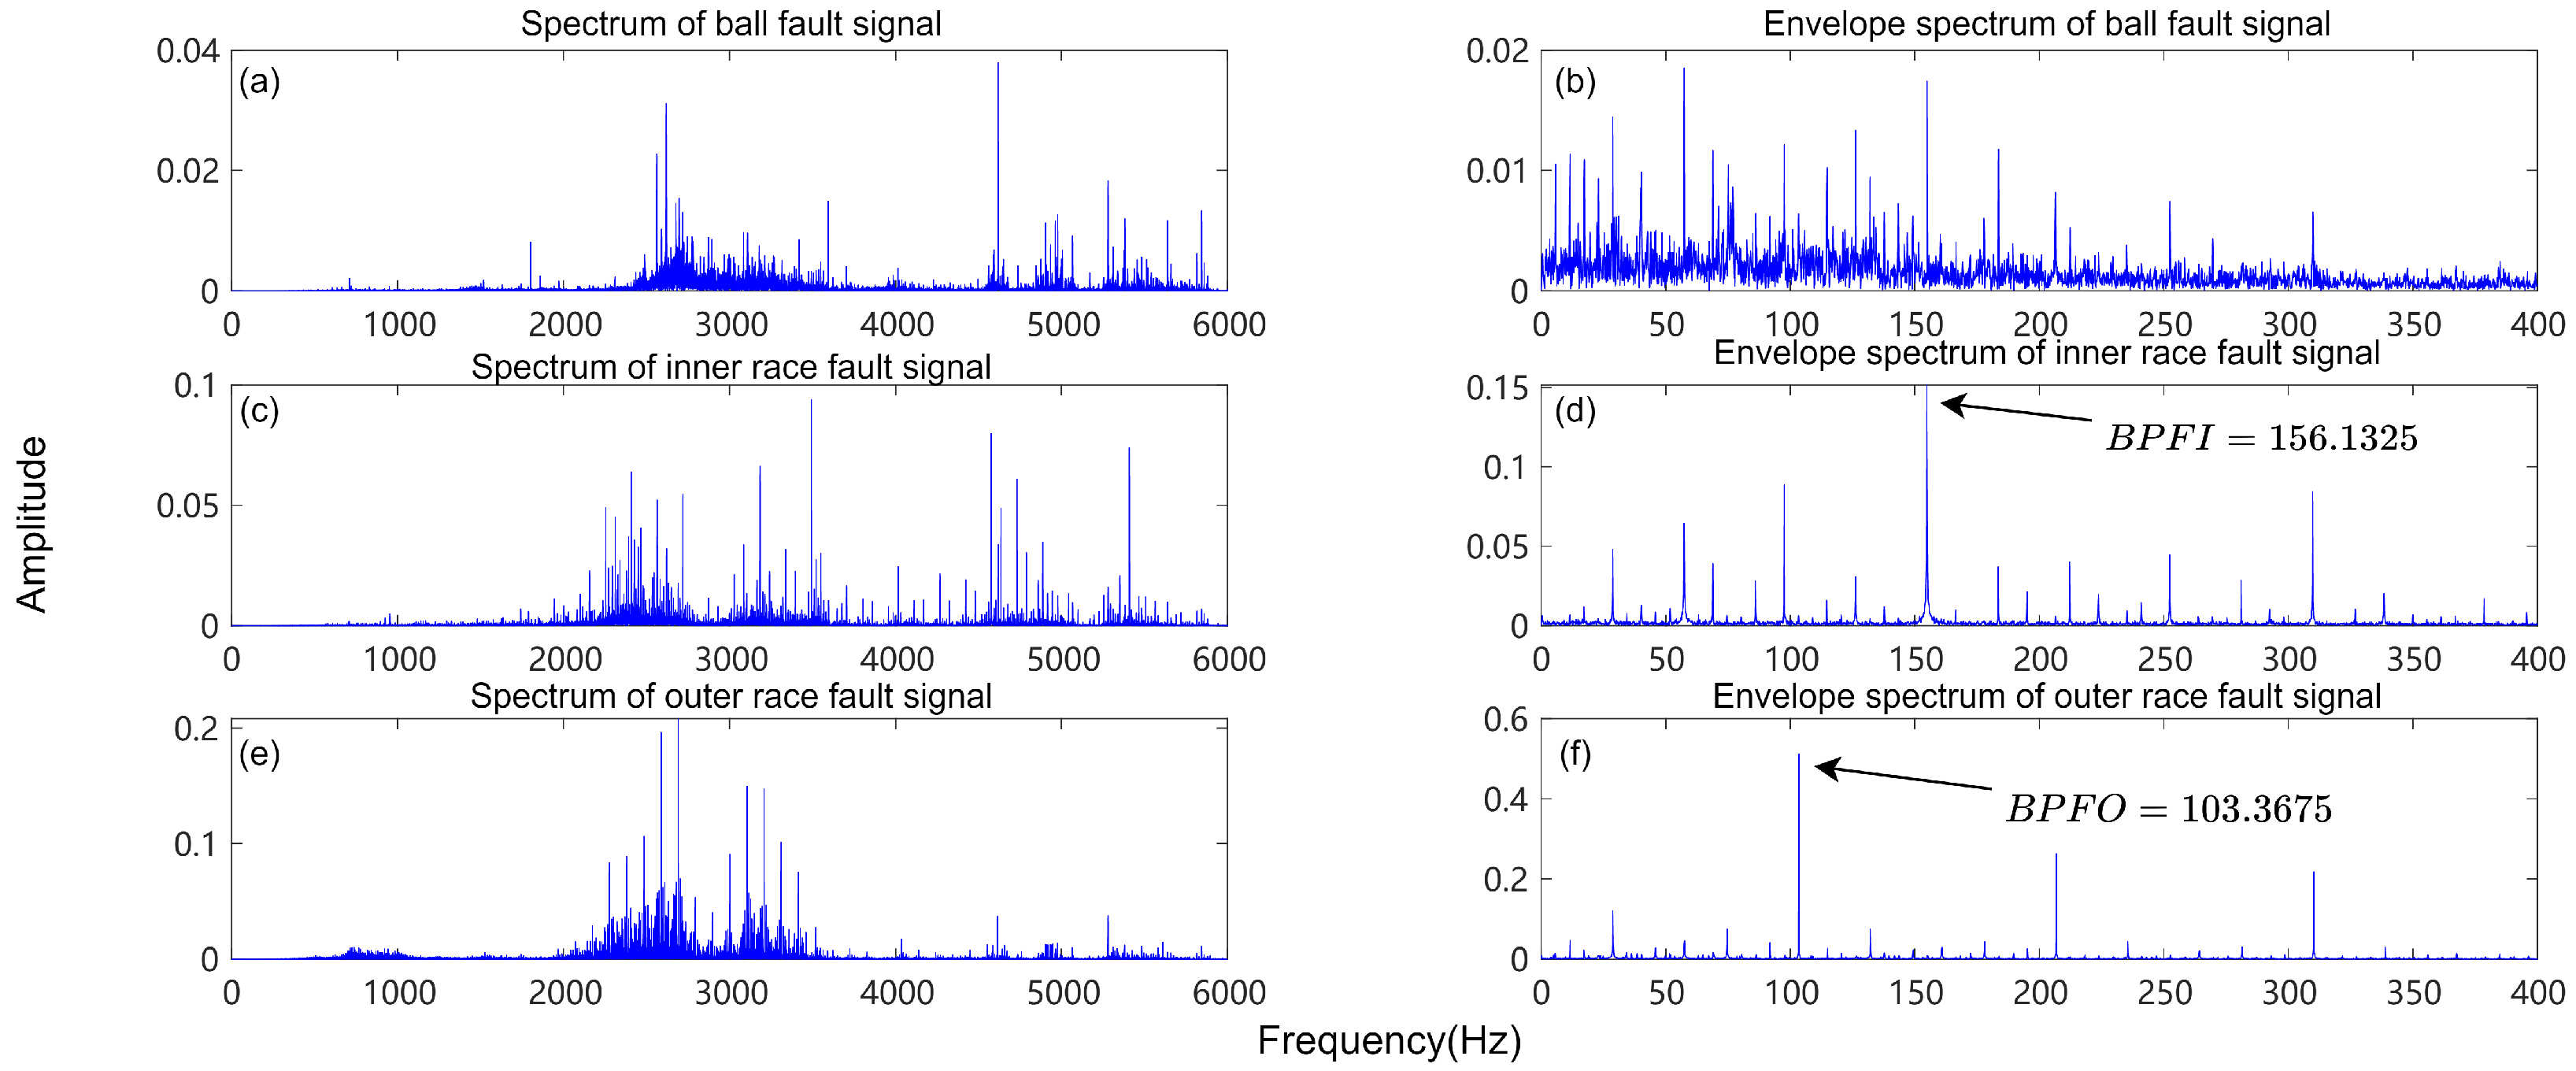
Figure 8 shows the vibration signals corresponding to three types of faults, i.e., the rolling element fault Figure 8a, the inner race fault Figure 8b, and the outer race fault Figure 8c, at a speed of 1730 RPM. Figure 9 shows the corresponding spectra and direct envelope spectra of these signals. In the envelope spectrum of the rolling element fault, it is difficult to find frequency information corresponding to the fault frequency band. Compared with the rolling element fault, the fault frequency bands of the inner race and outer race are more easily found in the envelope spectra, and the corresponding peak frequencies are 156.1325 Hz and 103.3675 Hz, respectively. This indicates that for inner race and outer race faults, the characteristic frequencies are more obvious in the low-frequency region and are easier to extract and analyze. For rolling element faults, the characteristic frequencies are not easily extracted and analyzed accurately due to the influence of background noise.
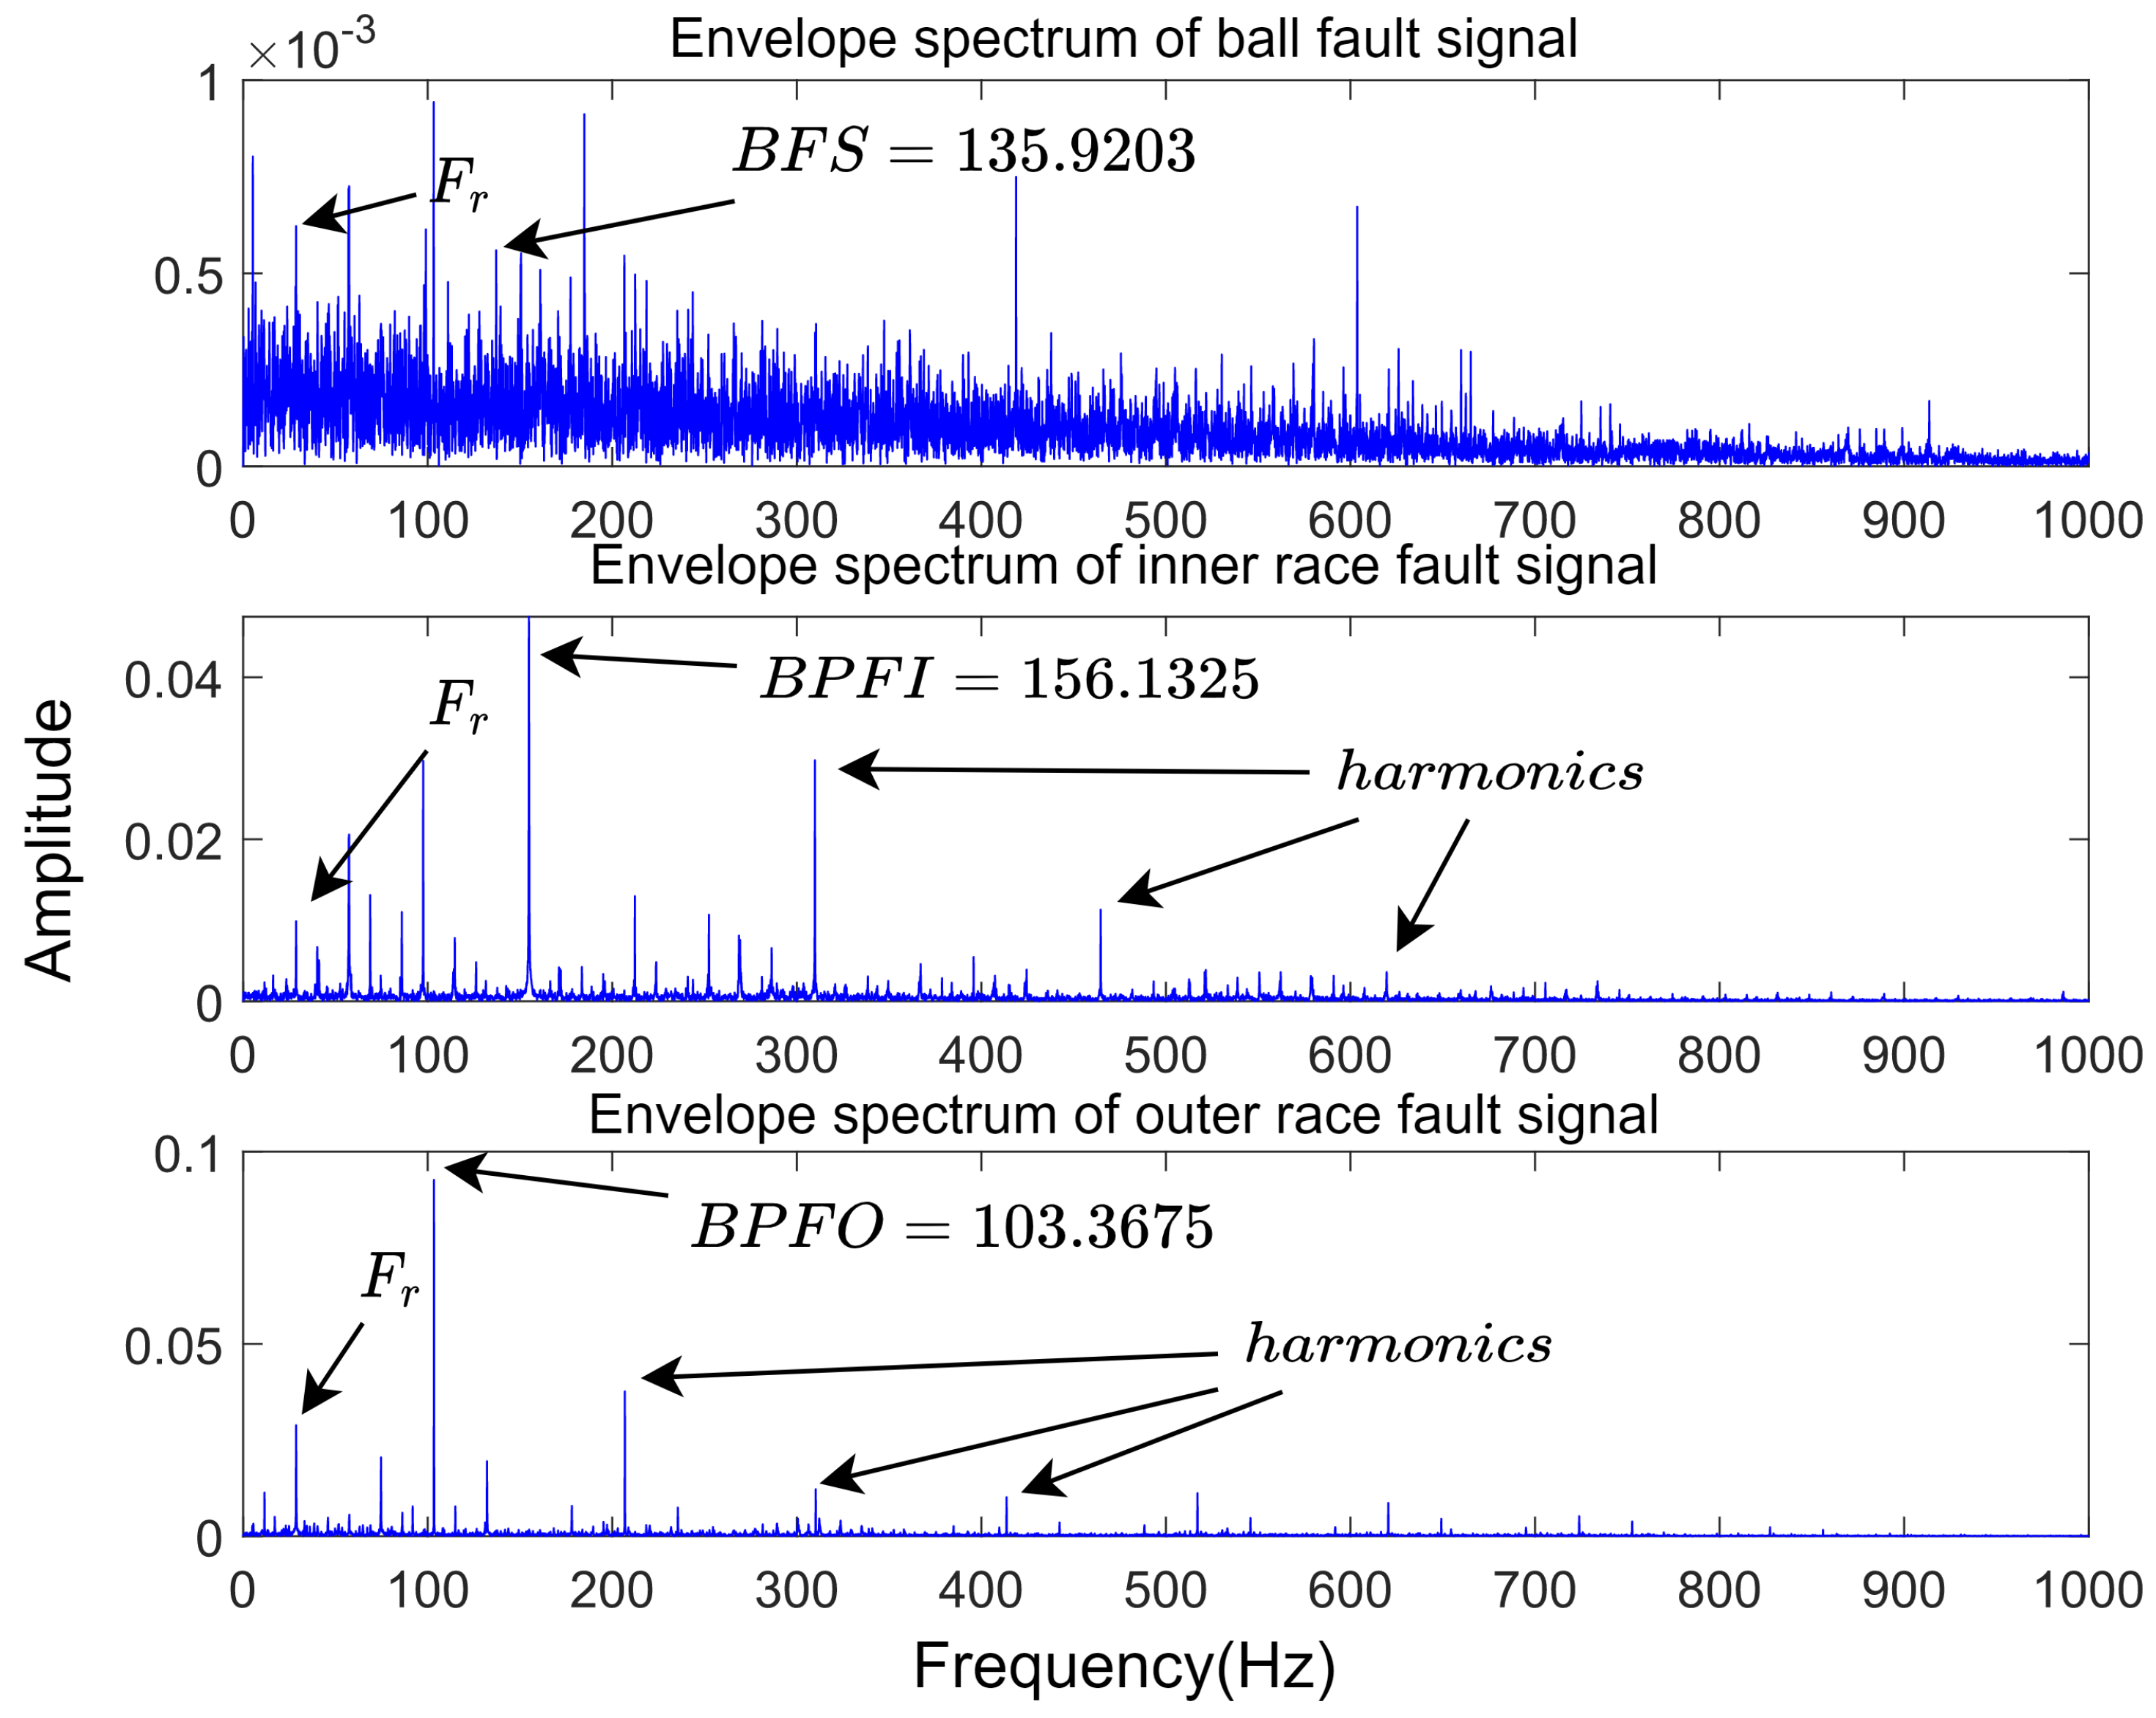
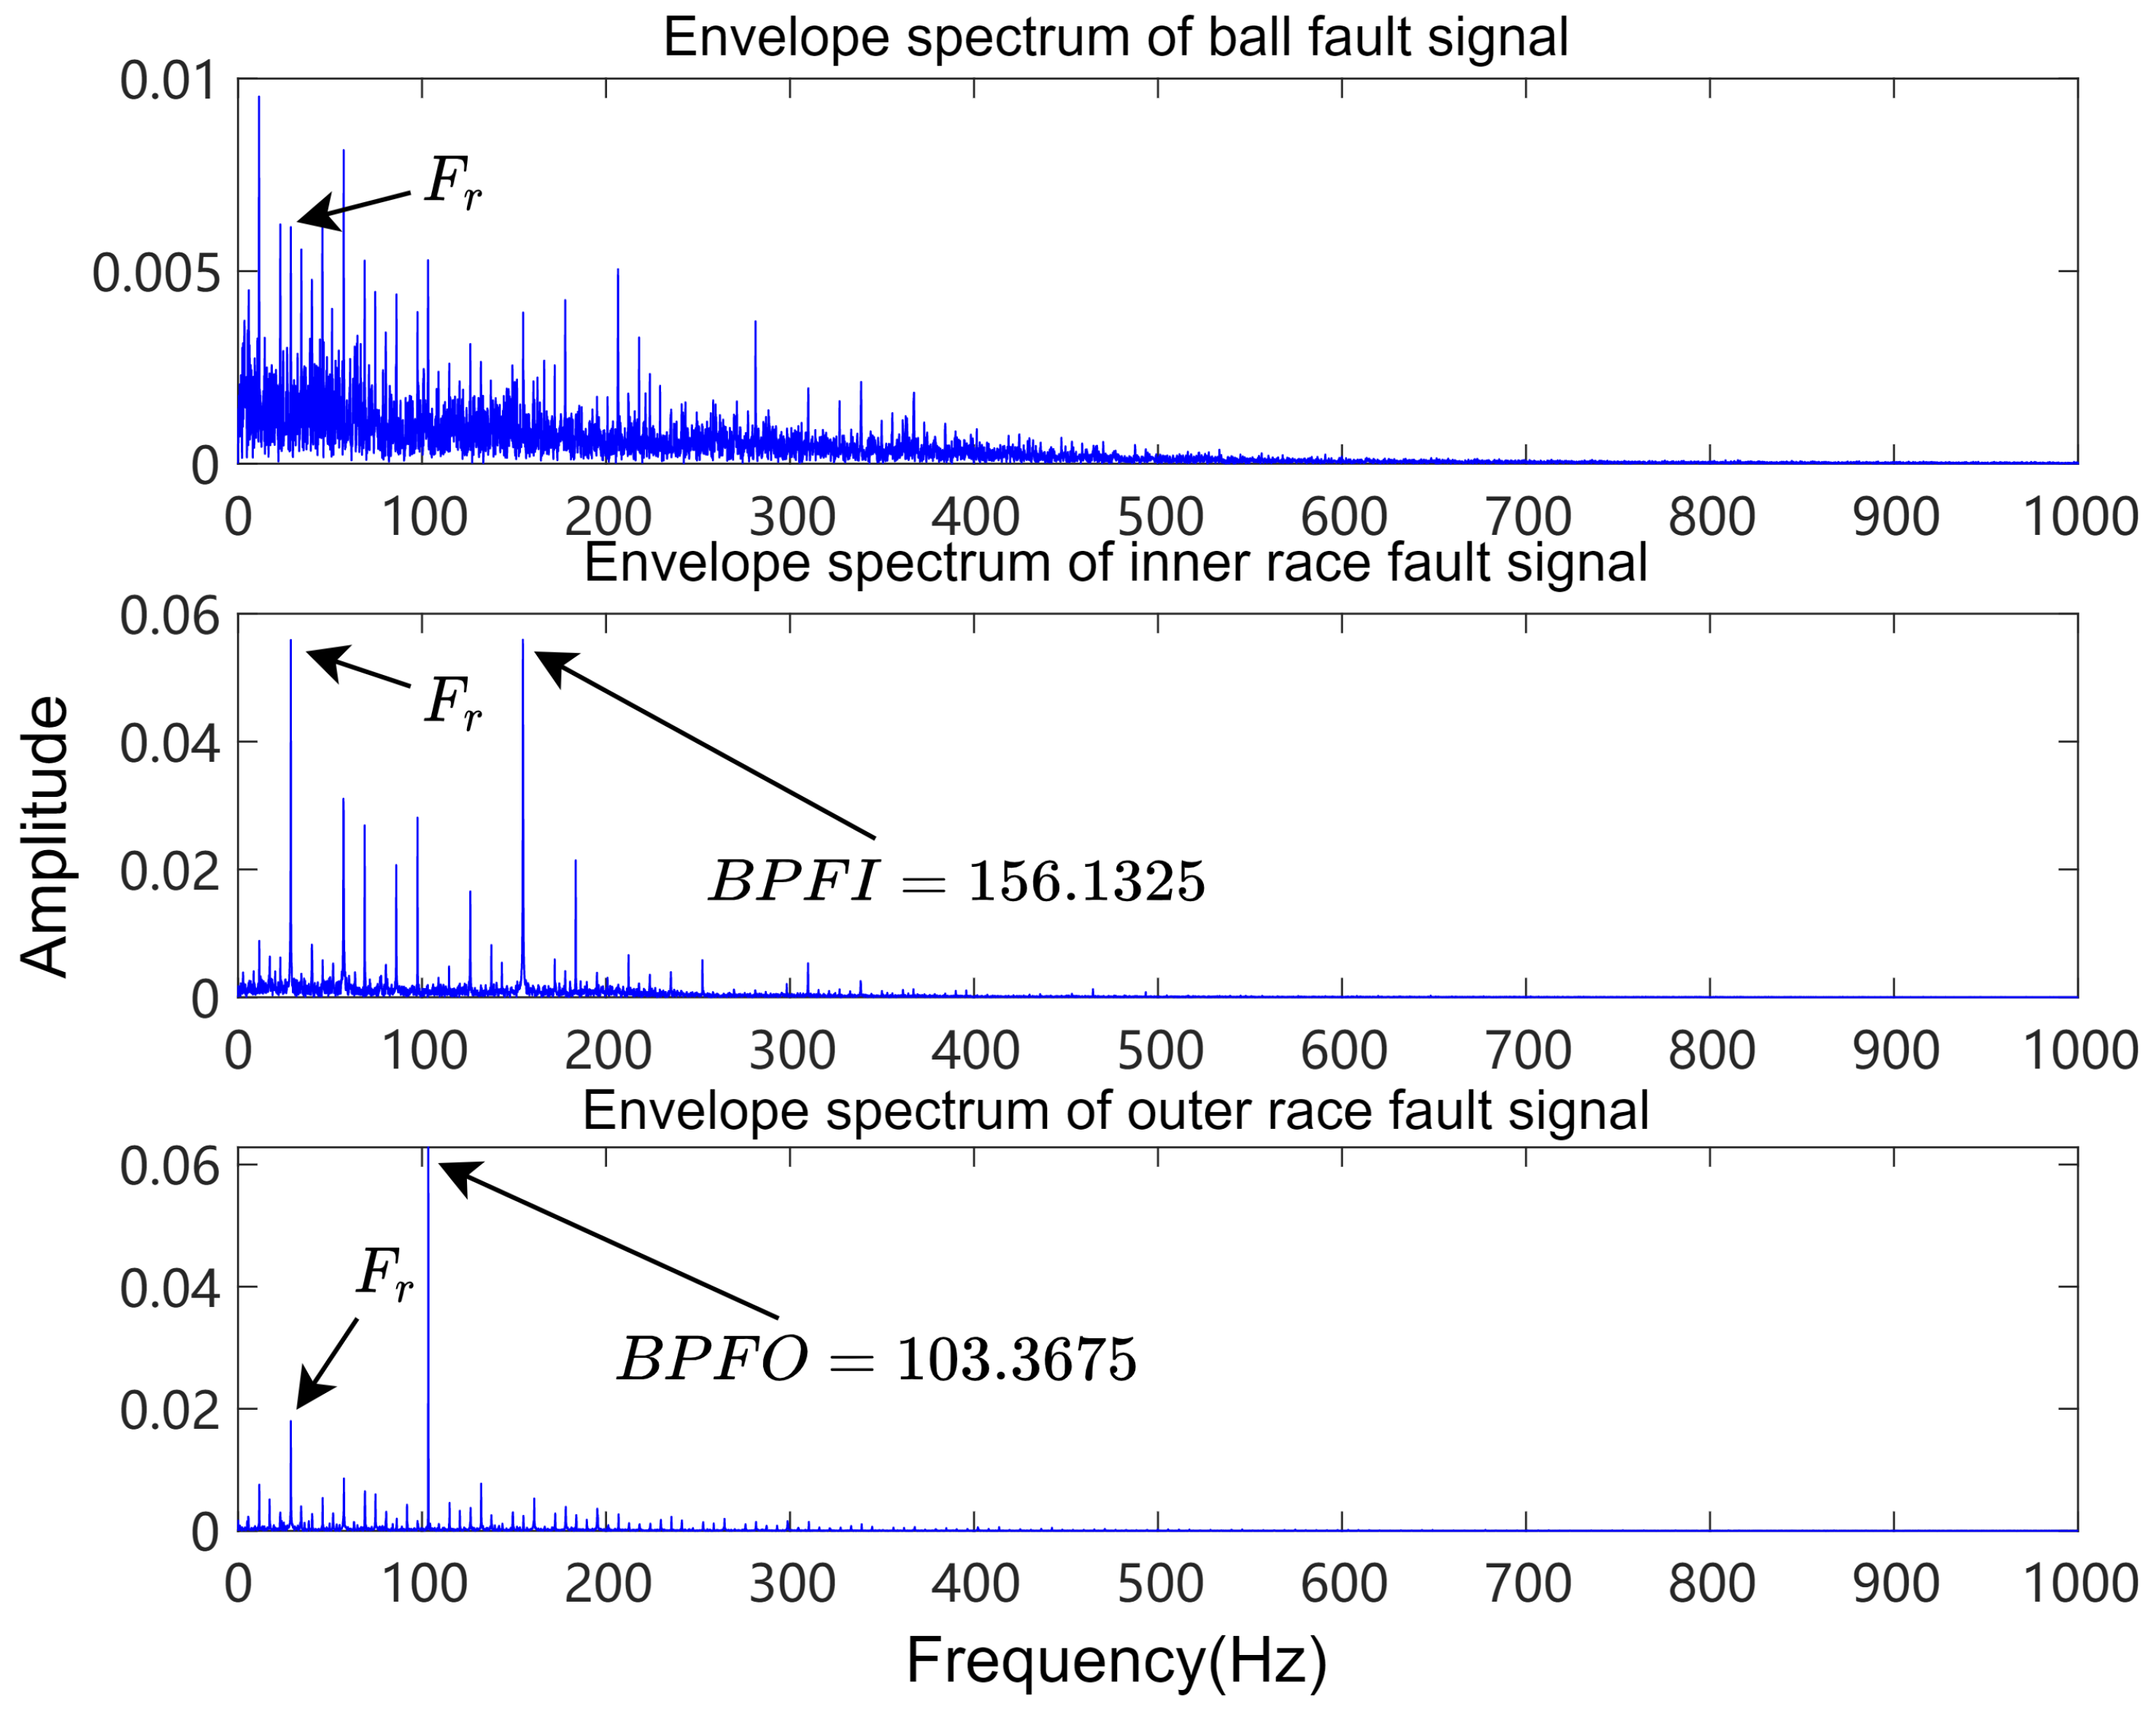
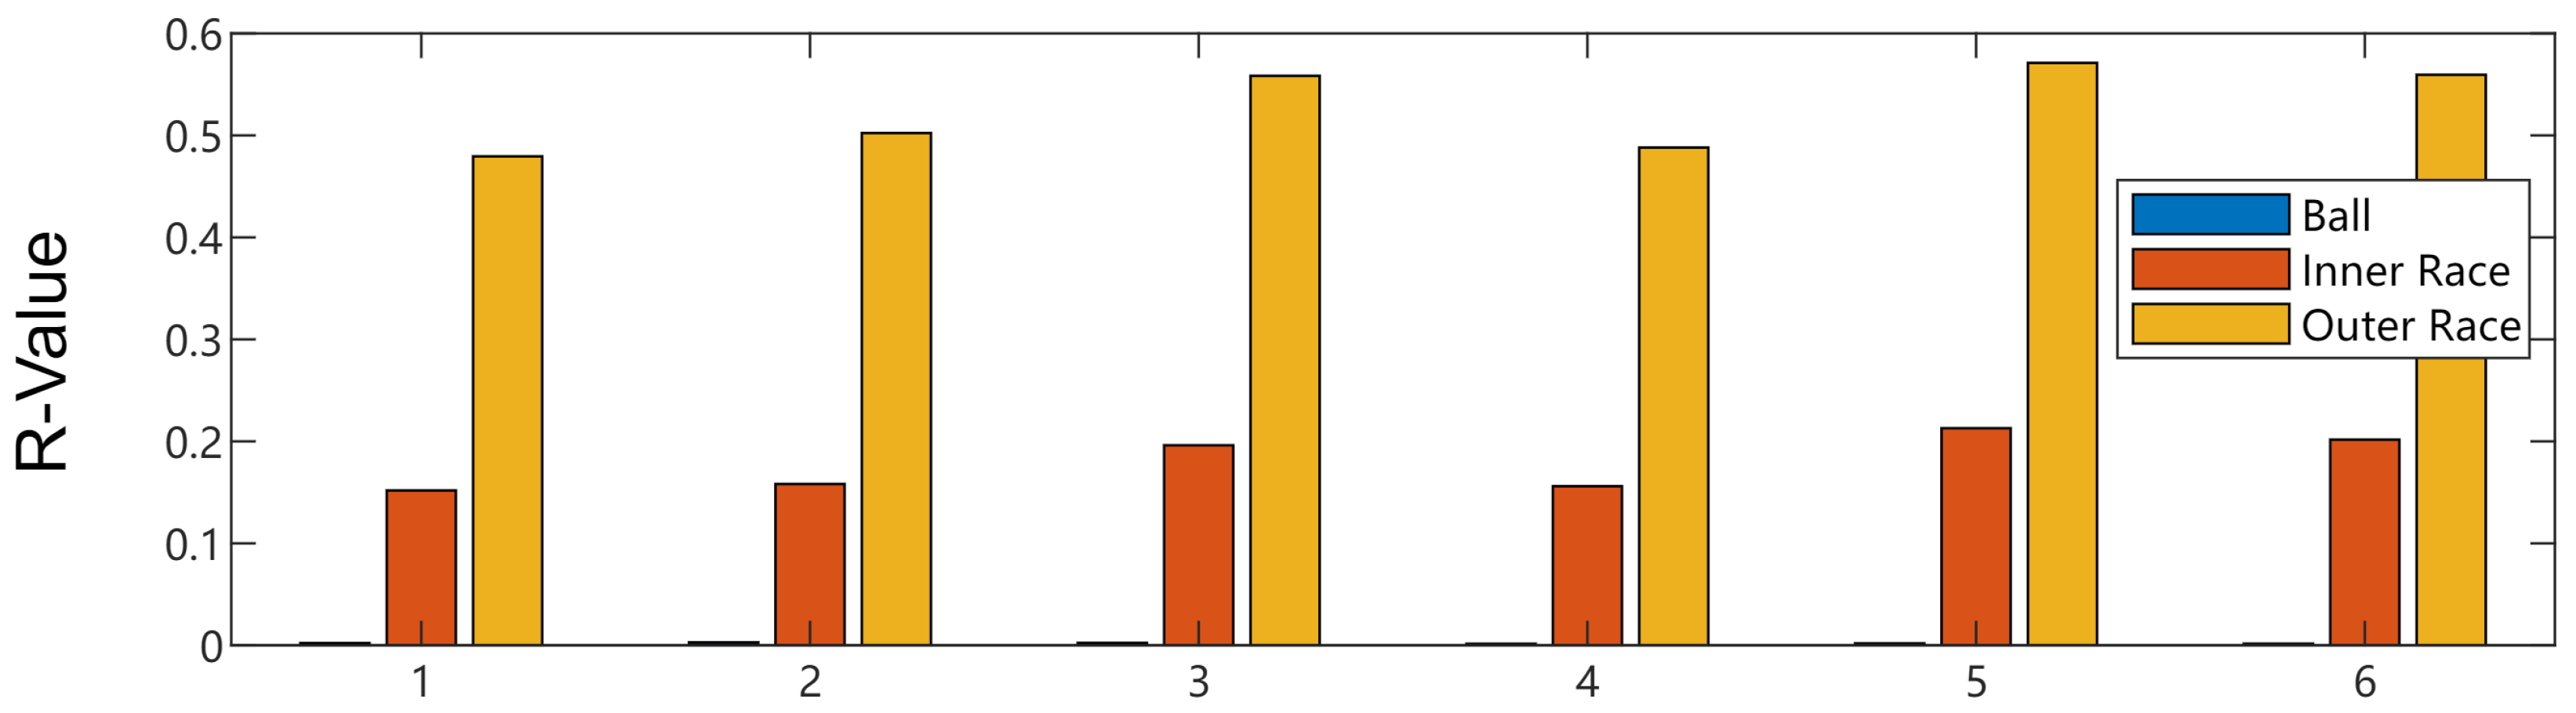
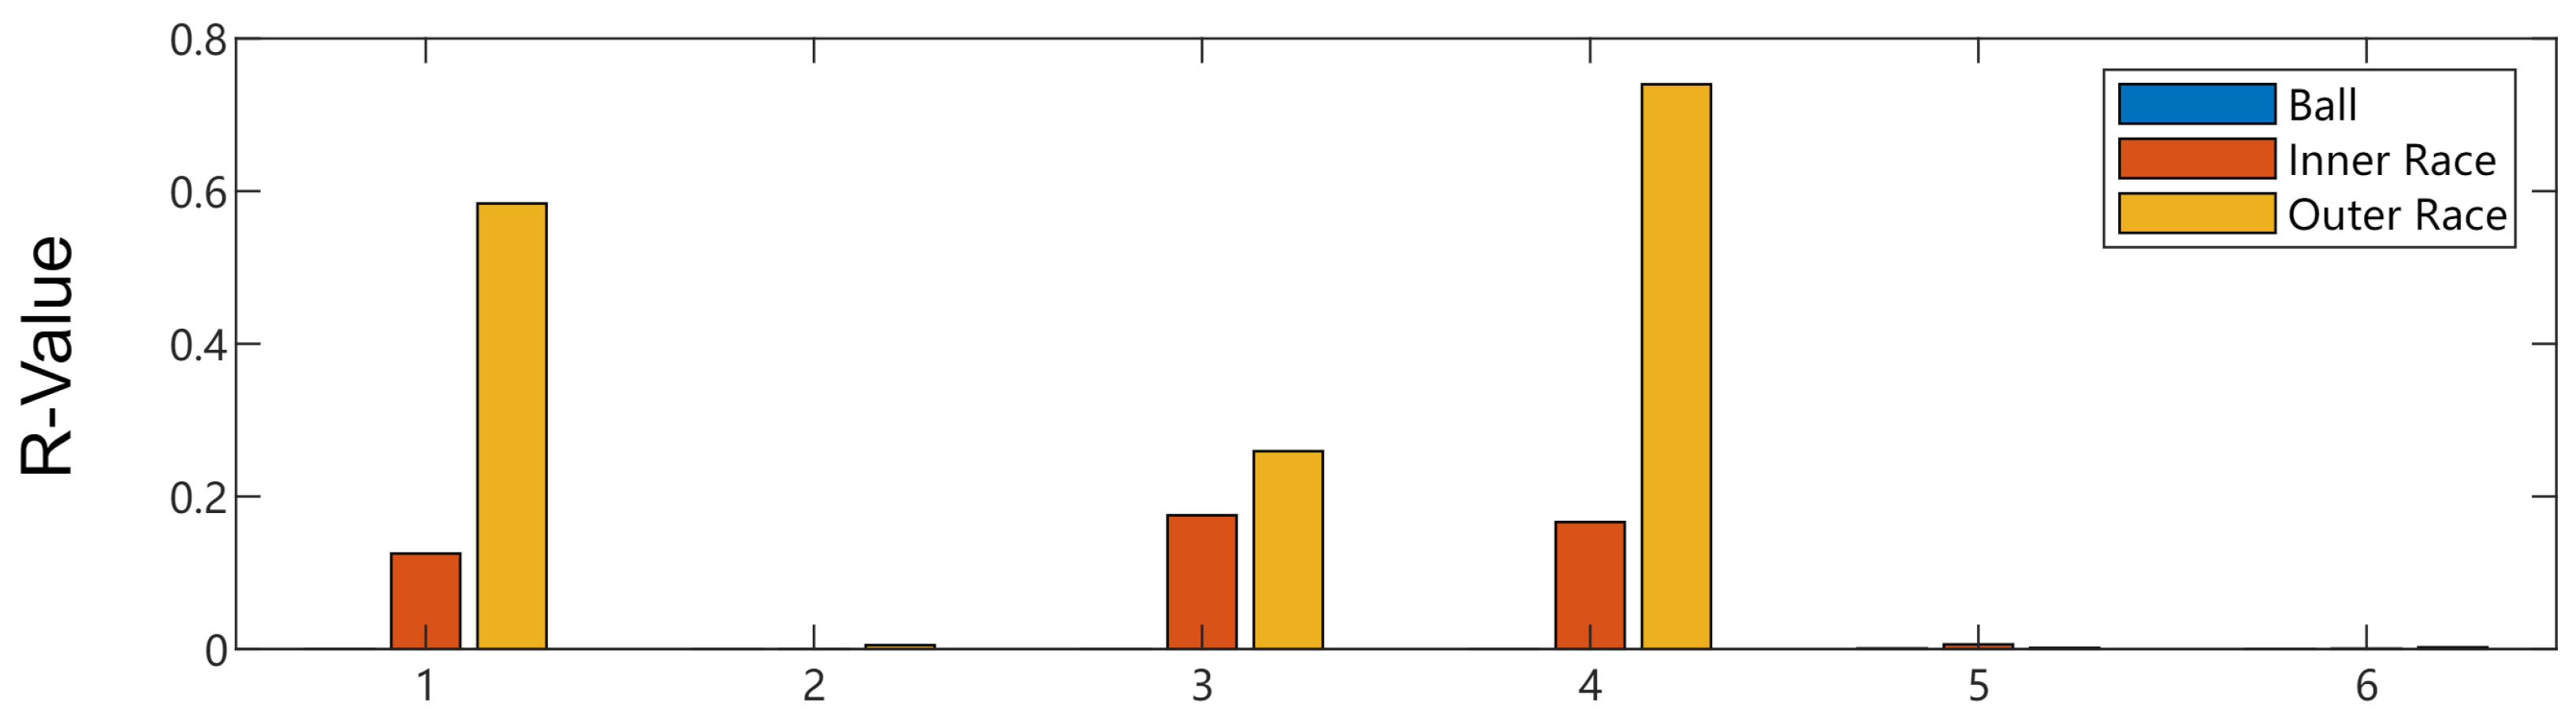
In order to comprehensively capture the fault feature information in the vibration signals of bearings, the LMWT method proposed in this paper is applied to analyze the vibration signals of bearings with different faults shown in Figure 8. First, the vibration signals are decomposed into six wavelet coefficients by one-level multiwavelet decomposition. Then, the relative energy ratios of the correlation coefficients in three characteristic frequency bands were calculated to select the decomposition coefficients that are sensitive to the fault frequency band. Finally, the coefficients with the highest relative energy ratio are further verified. Figure 10 and Figure 11 show the most sensitive decomposition coefficients for the three different fault frequency bands by LMWT and EWT. Based on the decomposition coefficients, the corresponding relative energy ratios can be calculated which are shown in Figure 12 and Figure 13. Figure 12 shows the relative energy ratios of the wavelet coefficients of the LMWT method under different bearing faults. It can be found that all wavelet coefficients can effectively decompose relevant fault features, especially outer ring faults. As shown in Figure 13, the relative energy ratios obtained by different decomposition coefficients are not stable. Moreover, the relative energy ratios are close to 0 at some coefficients. The details of relative energy ratios and average values for the two methods are shown in Table 3.
As shown in Figure 10, the corresponding fault feature frequency peaks can be clearly observed from the decomposition coefficients obtained from LMWT. In contrast, although the characteristic frequencies of inner and outer ring faults can be observed in the decomposition coefficients obtained from EWT, the fault frequency corresponding to the rolling element cannot be observed. Specifically, distinct fault frequency characteristics are evident in the LMWT method within the envelope spectrum of the three faults, and average relative energy ratio is much higher than EWT’s, respectively. However, in the case of ball faults, both methods fail to isolate the fault frequency characteristics of the ball. This suggests that for rolling element faults, the LMWT method proposed in this paper can more accurately extract and analyze its characteristic frequency, which can improve the accuracy and reliability of bearing fault diagnosis.
3.3. Case 3: Compound Fault Signal
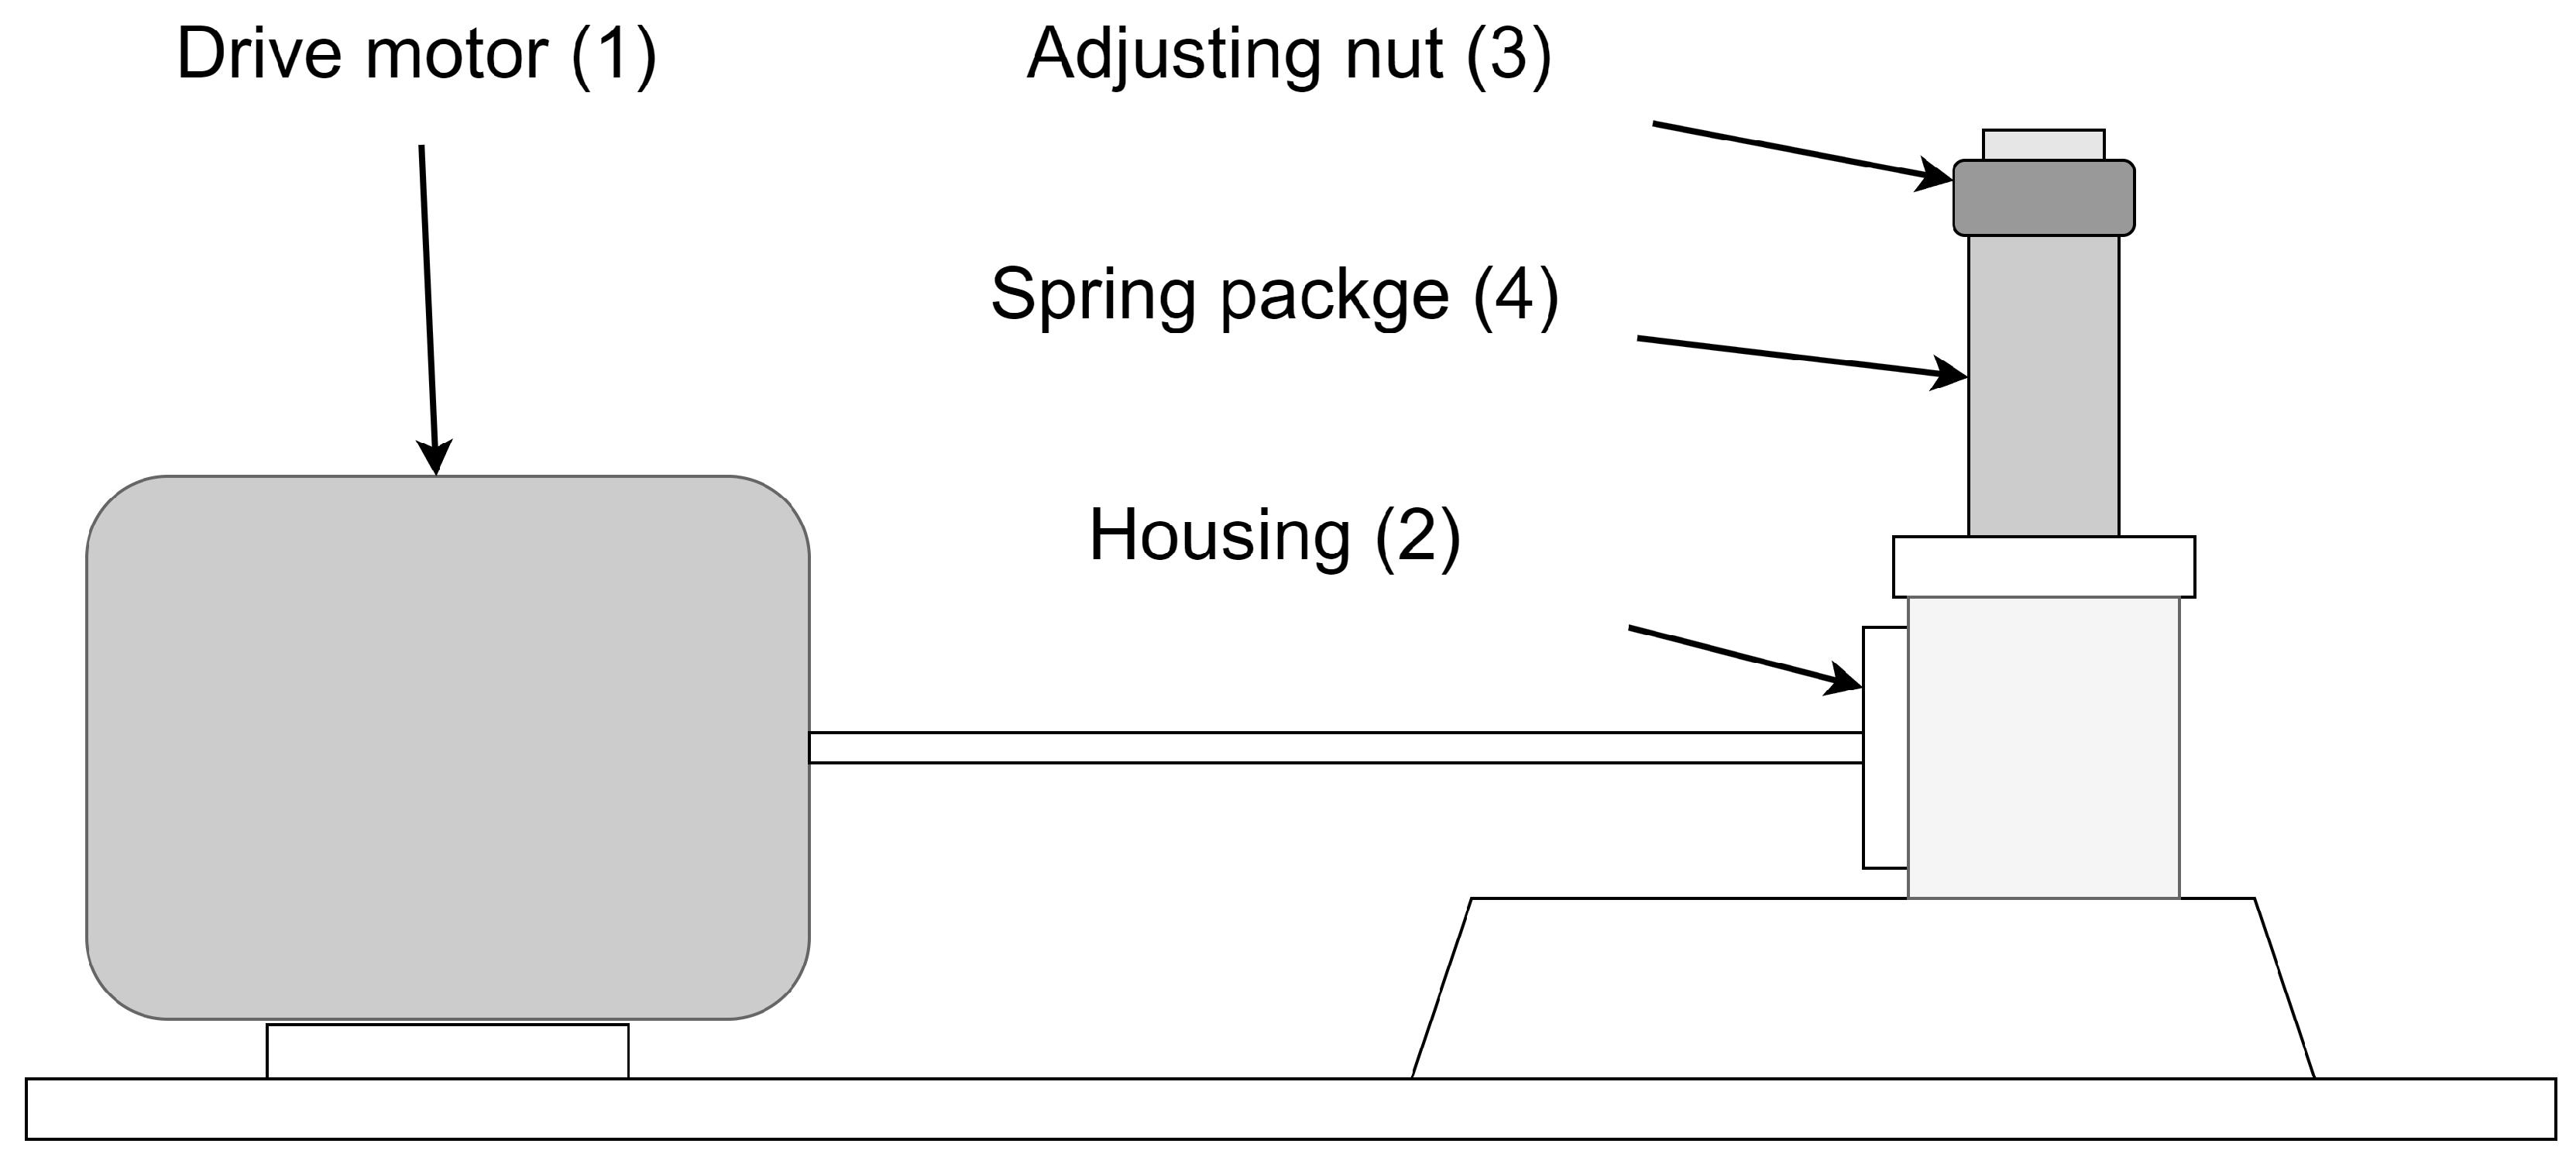
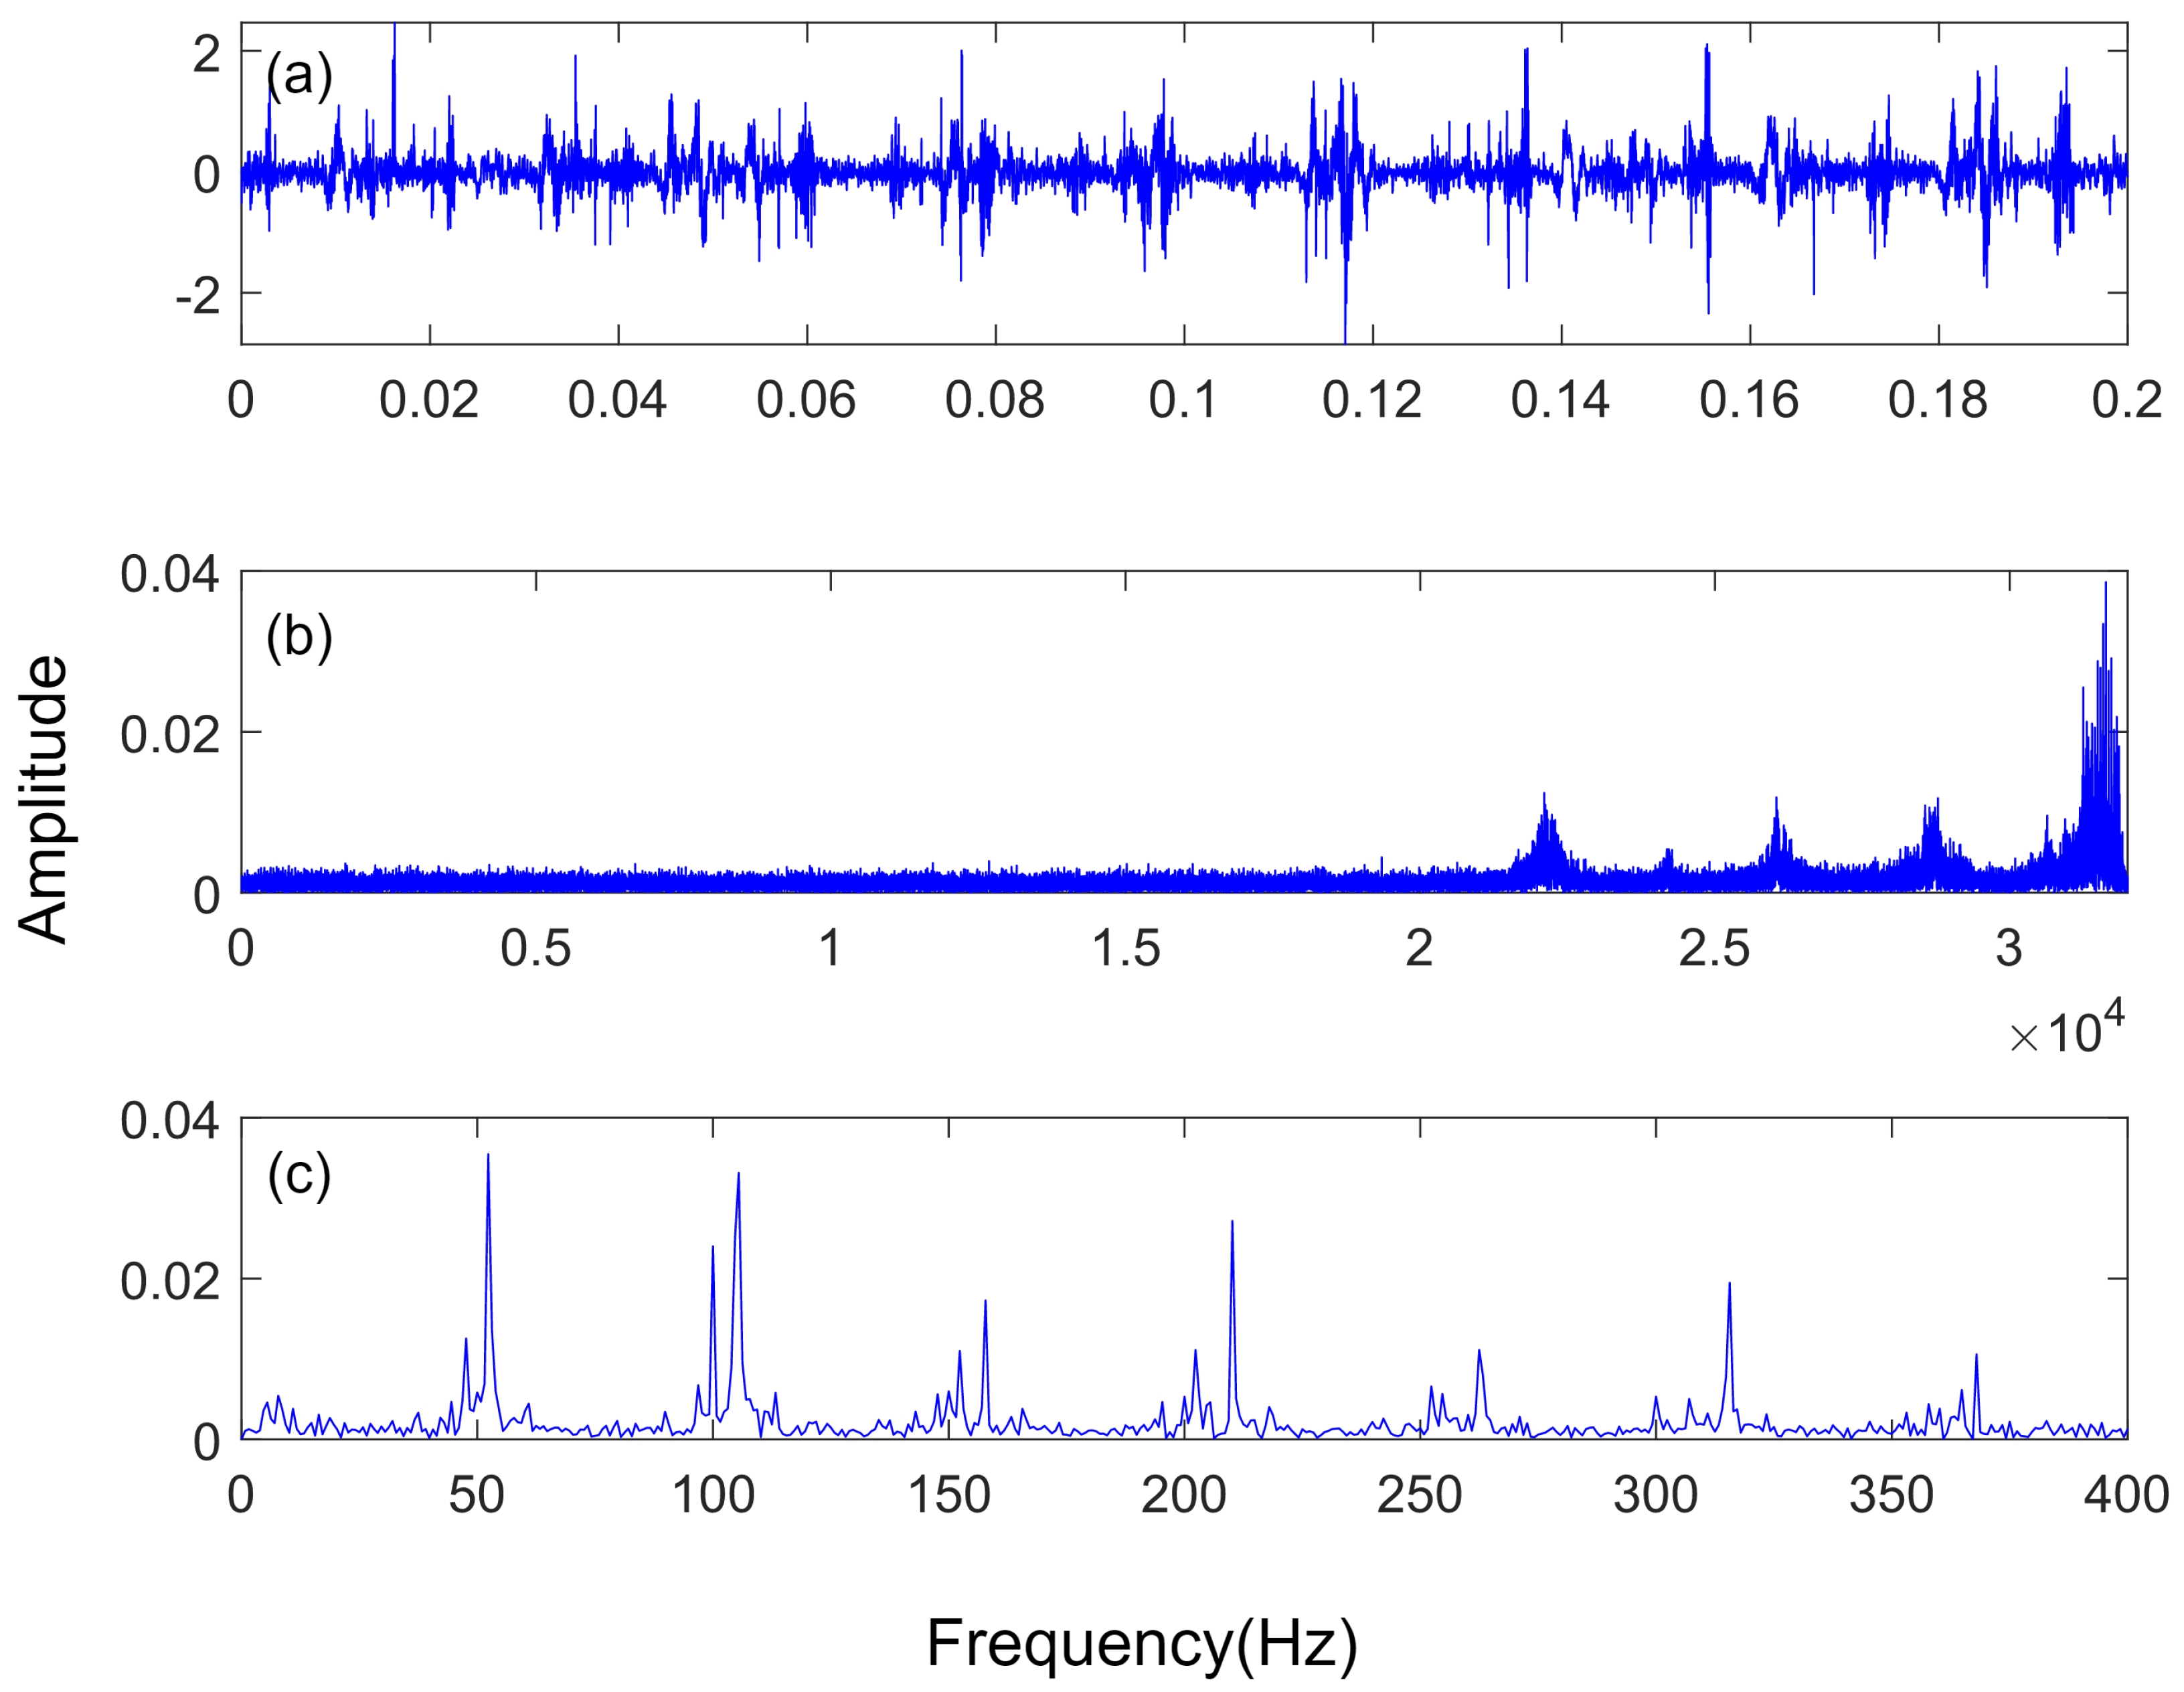
In this section, the proposed method is applied to identify compound faults. The experimental object is a vibration signal generated by a motor from the University of Paderborn in Germany [35]. The experimental setup is shown in Figure 14. This experimental setup consists of a bearing housing and an electric motor. The motor powers the shafts of 6203-type test bearings installed within the bearing housing, and these test bearings rotate under a radial load applied by a spring-screw mechanism. The vibration signal used in this paper is generated by a 6203 bearing, which is one of the components that experienced faults during the experiment, the physical and geometric parameters of the bearing are shown in Table 4. Figure 15 shows the corresponding spectra and direct envelope spectra of these signals. In the envelope spectrum of the compound fault, it is difficult to find frequency information corresponding to the frequency band of the inner and outer race. By applying the LMWT method, this paper aims to detect and identify different types and locations of bearing faults to verify the feasibility and effectiveness of the proposed method.
On the experimental test bench shown in Figure 14, a 6203 bearing numbered KB23 bearing with inner and outer race compound fault was tested; the specific fault information of this signal is given in Table 5. And the frequencies of different faults for the 6203 bearing have been shown in Table 6. The vibration signal was measured at a sampling rate of 64 kHz and a constant speed of 900 RPM. Based on its physical and geometric parameters, the rotation frequency = 15 Hz can be calculated using the formula. The BPFO of the outer race fault is 46.585 Hz, and the BPFI of the inner race fault is 73.9415 Hz, as shown in Table 6. These calculated characteristic frequencies are based on the kinematic and dynamic knowledge of the bearing and can help to identify and locate different types and locations of bearing faults, providing a foundation and basis for subsequent signal processing and analysis.
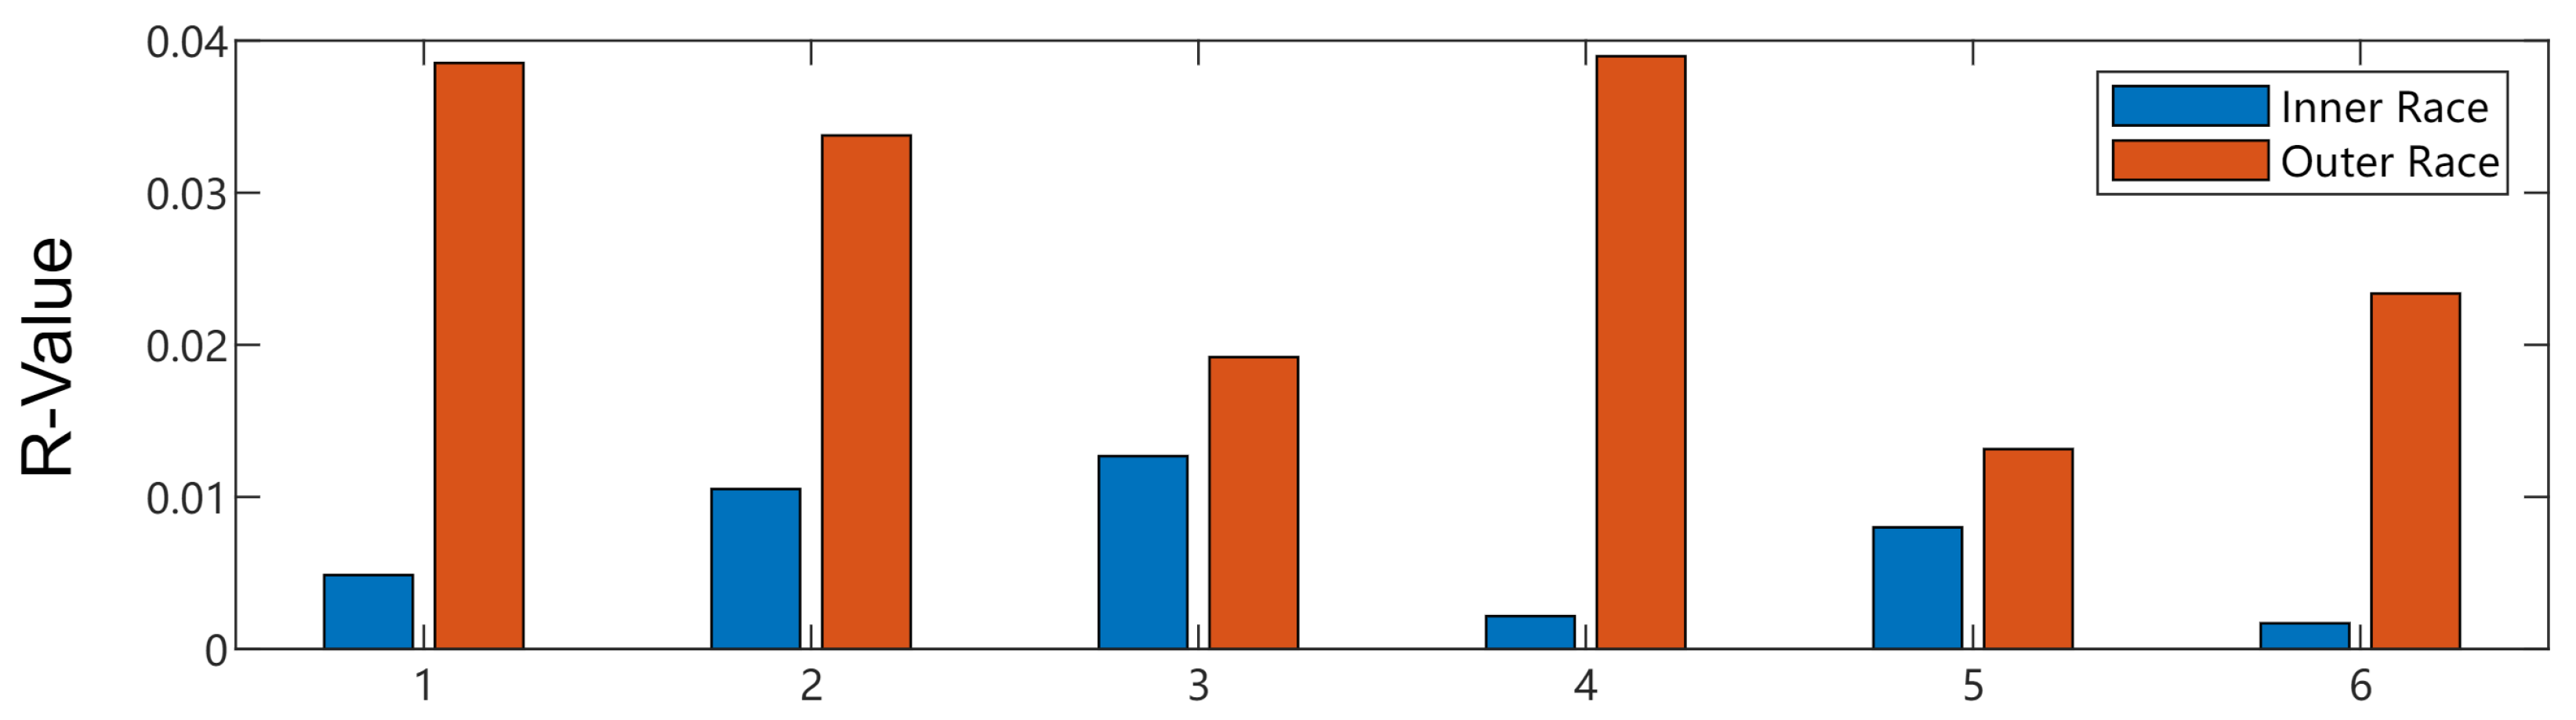
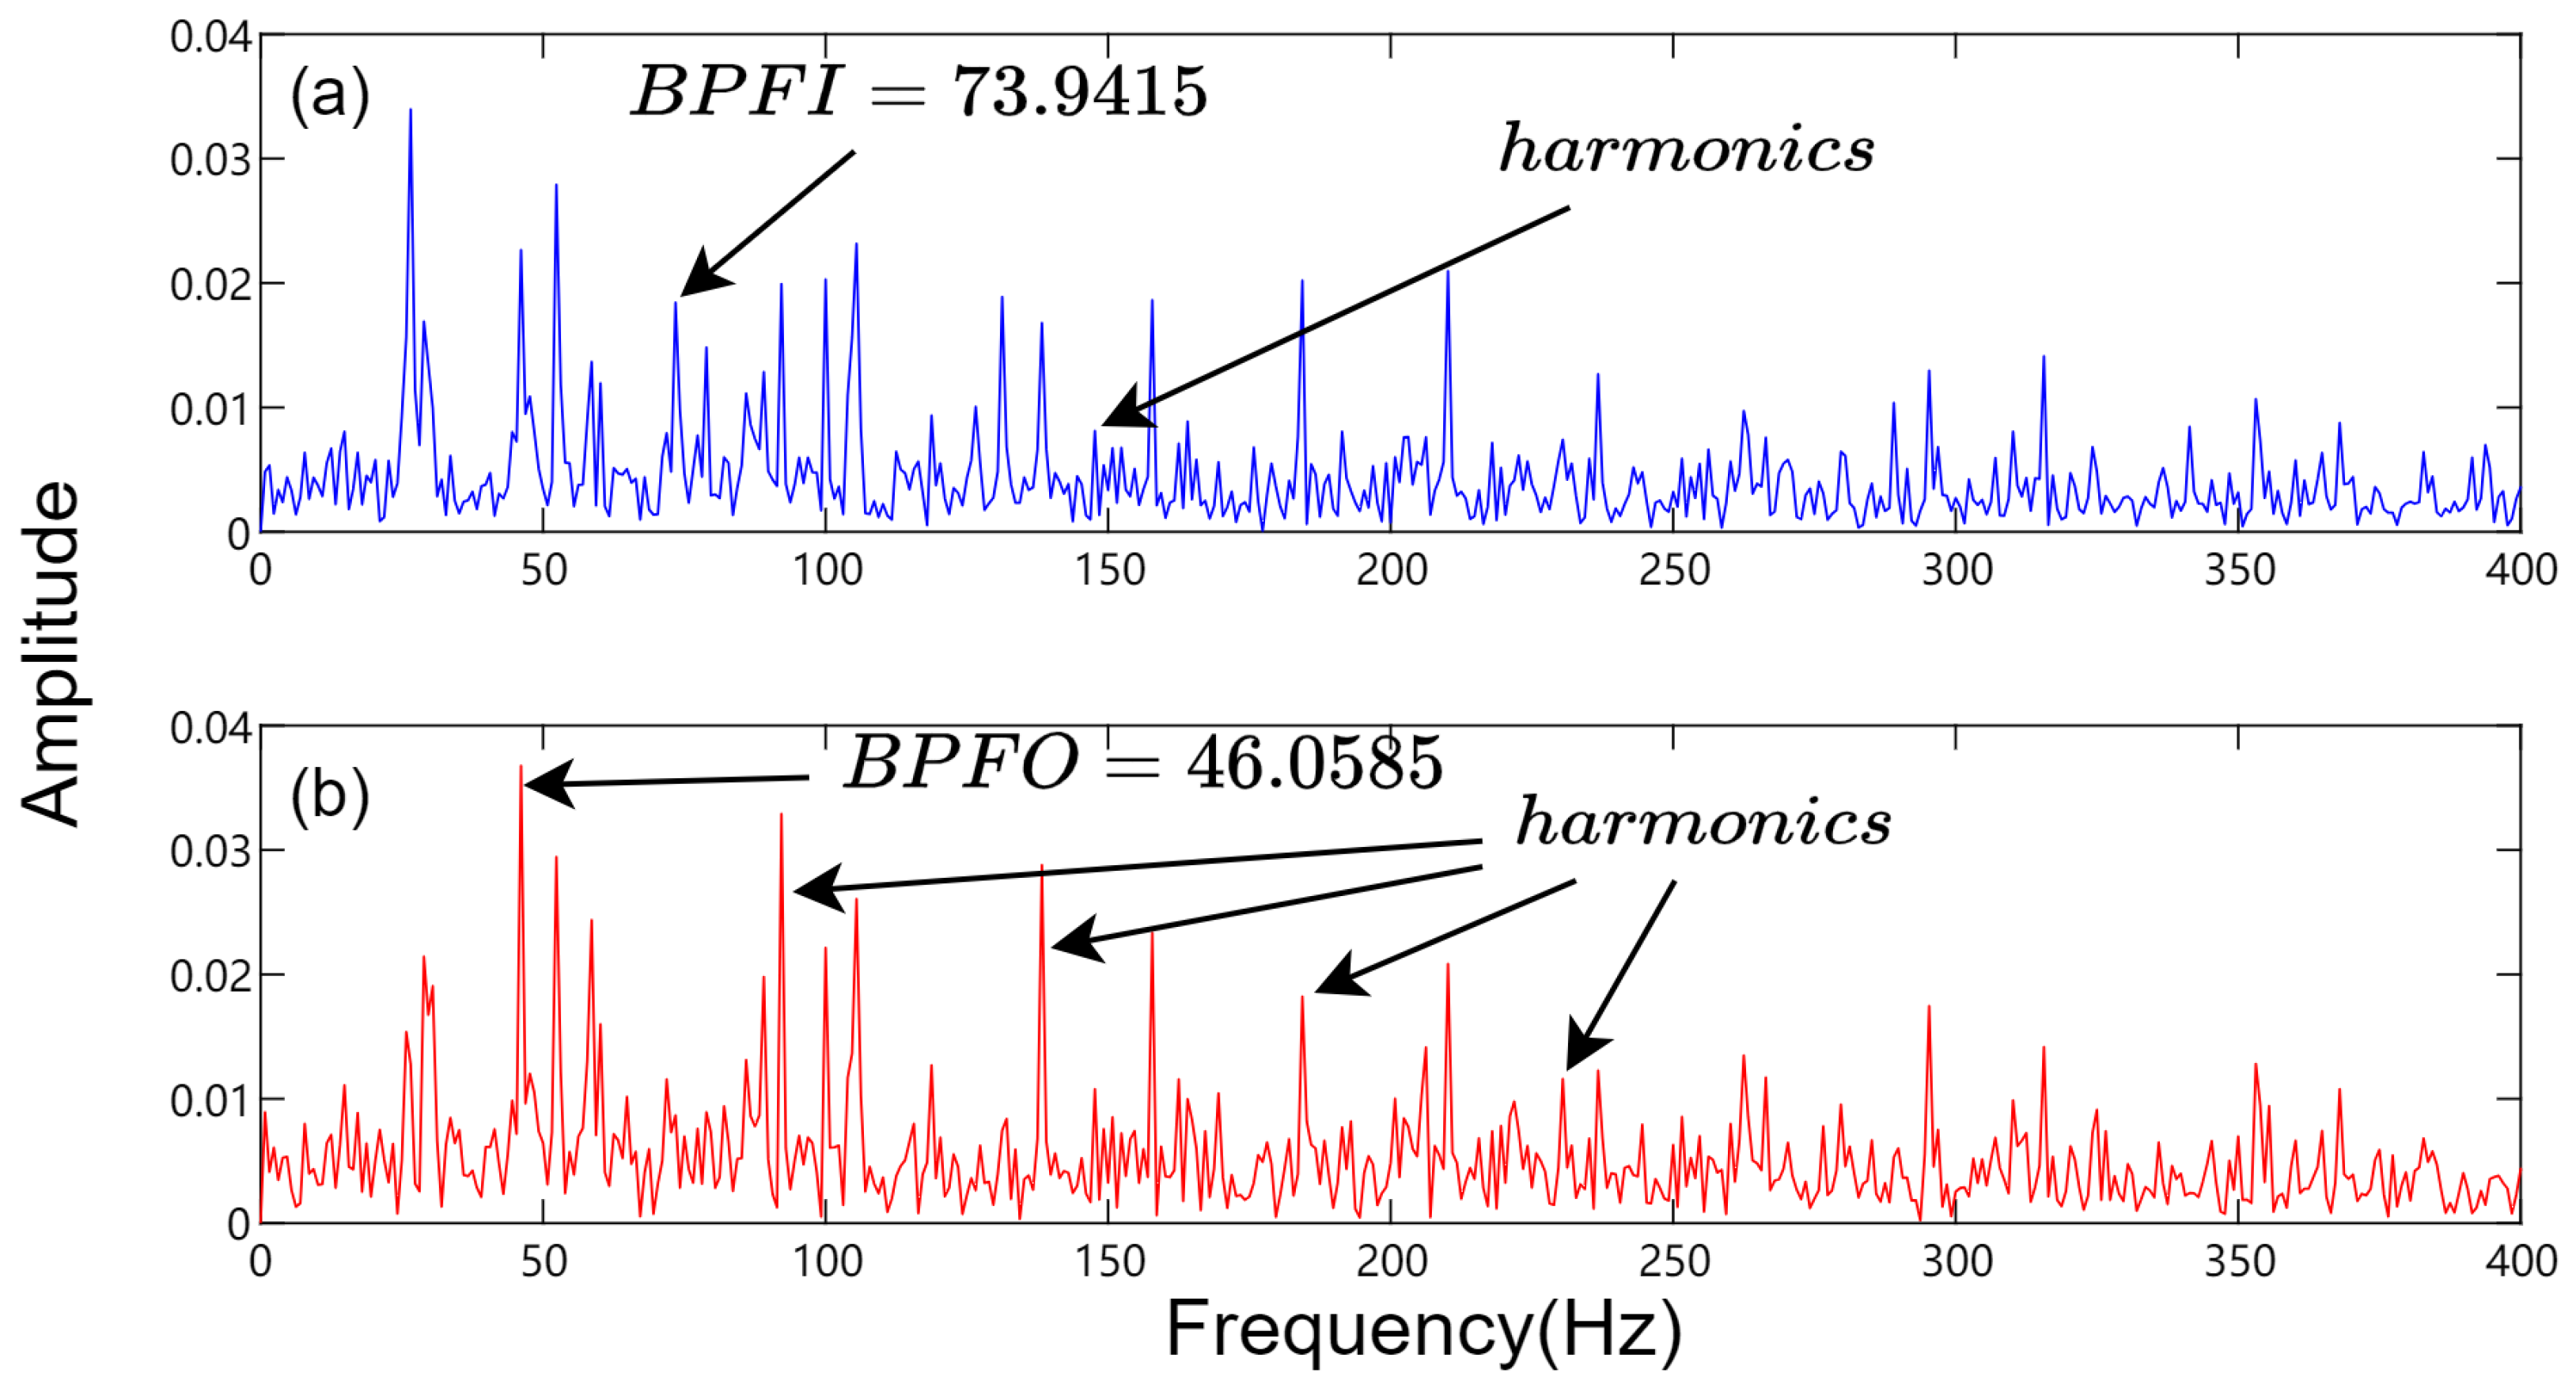
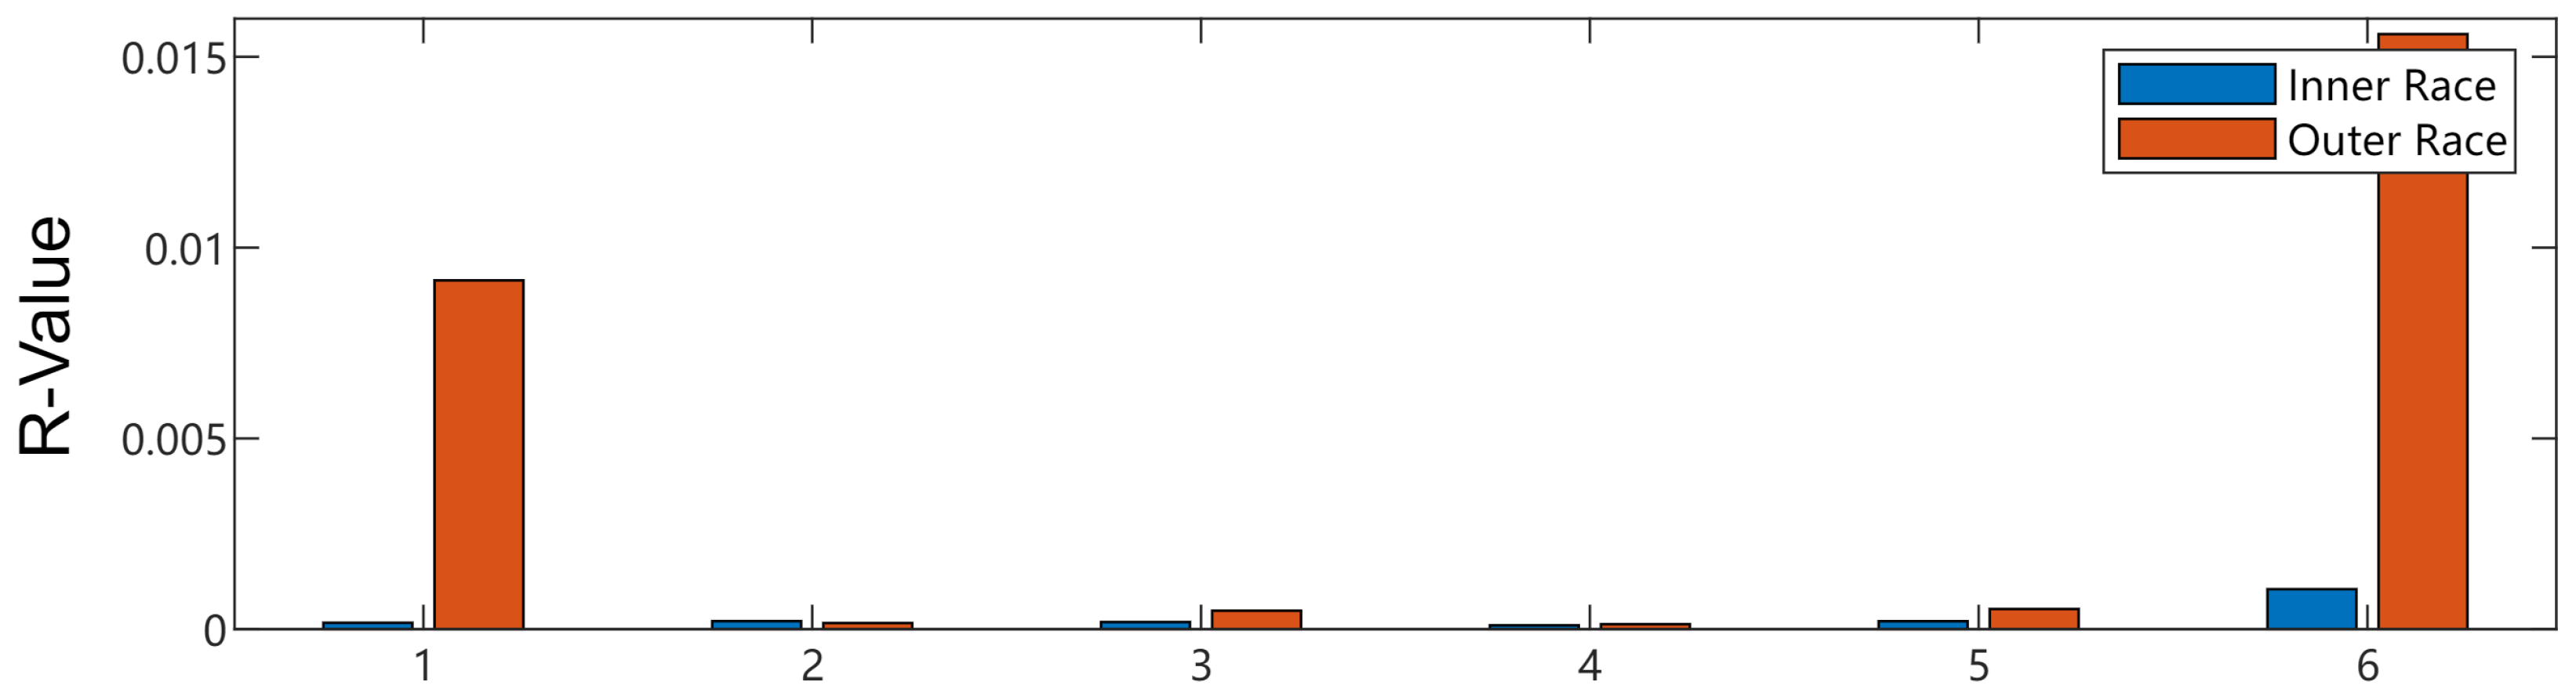
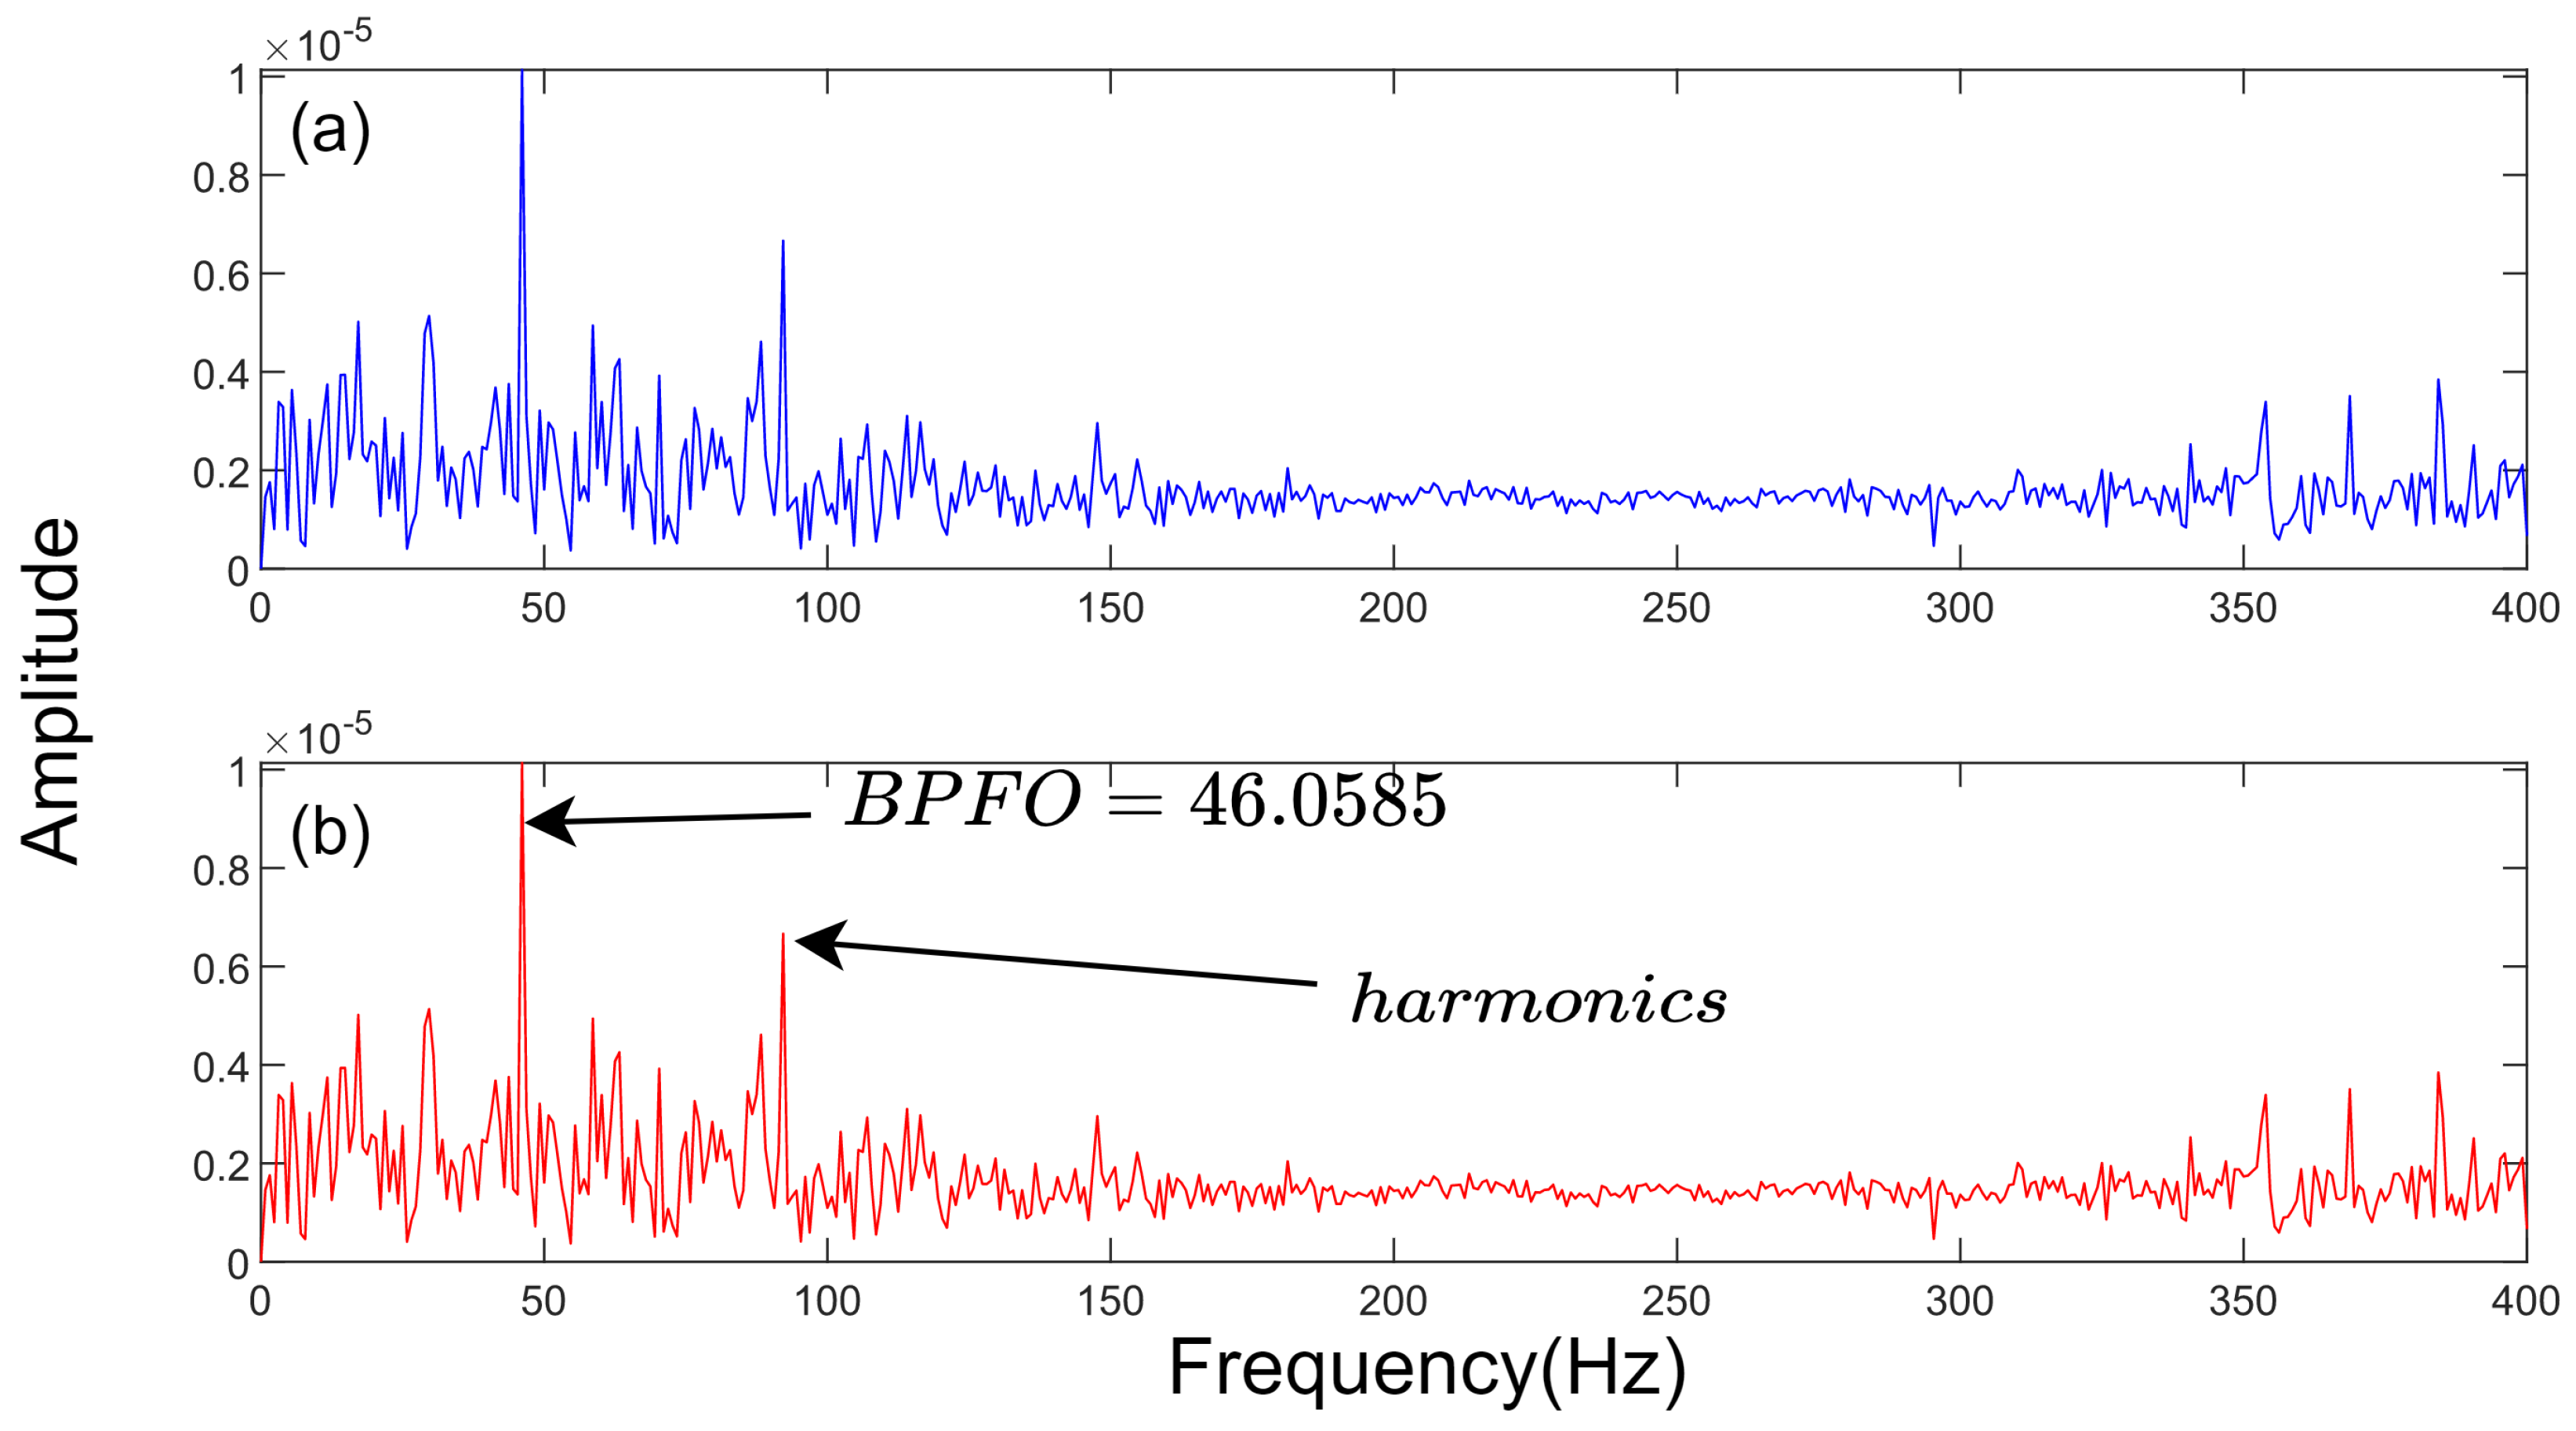
In order to fully capture the fault feature information in the bearing vibration signal, the proposed LMWT method is applied to analyze the vibration signal shown in Figure 16 and Figure 17. Firstly, a one-level decomposition is performed on the vibration signal to obtain six multiwavelet decomposition coefficients. Then, the relative energy ratio of the correlation coefficient in two characteristic frequency bands was calculated to select the decomposition coefficients sensitive to the fault frequency band. Finally, the coefficient with the maximum relative energy ratio is selected for further verification. Figure 17 shows the results obtained by using the LMWT method, which are the decomposition coefficients most sensitive to the outer race fault and the decomposition coefficients most sensitive to the inner race fault, as well as the relative energy ratios of all coefficients relative to the two fault frequency bands. The results of using the EWT method to process the compound fault vibration signal are shown in Figure 18 and Figure 19. The exact values of the two methods are given in Table 7.
In Table 7, the relative energy ratios extracted by EWT are almost close to 0 for inner race faults, and the maximum relative energy ratio for outer loop faults is only 0.016. And the average relative energy ratios of the inner race fault obtained by LMWT is 0.068, and the average relative energy ratio corresponding to the outer race fault is 0.278, which is significantly higher than the EWT method. Furthermore, the characteristic frequency band corresponding to the outer race fault features can be clearly observed in Figure 17, while the inner race fault and the characteristic frequency band are relatively less obvious. By contrast, in the results obtained by EWT shown as Figure 18 and Figure 19, the characteristic frequency band corresponding to the outer race fault can be observed, but the inner race fault cannot be observed, and the relative energy ratio corresponding to the inner race fault is almost zero, indicating that the EWT method cannot extract all fault frequency bands in one step for the compound fault vibration signal.
4. Conclusions
This paper proposes a novel bearing fault detection method based on LMWT, which calculates the relative energy ratio to select the most sensitive components for fault features. The LMWT method is applied to three different cases, and the results show that it can more effectively extract various component fault frequencies compared to the EWT method. Specifically, in simulated environments, the LMWT method outperforms the EWT method in high-noise conditions. In the single fault experiment, the LMWT method yielded relative energy ratios of 0.528, 0.176, and 0.049 for three different faults, while the EWT method only achieved values of 0.275, 0.083, and 0.000, respectively. This indicates that the LMWT method exhibits a 92% increase in sensitivity for outer race faults and a 112% increase in sensitivity for inner race faults compared to EWT. However, for ball faults, although the LMWT method significantly outperformed the EWT method in relative energy ratios, its fault feature frequencies still remained mixed with background noise. In the compound fault experiment, due to the rich regularity and orthogonality of the LMWT method, it achieved relative energy ratios of 0.276 and 0.065 for outer and inner race faults, respectively, while the corresponding ratios in the EWT method were 0.004 and 0.000. Clearly, the LMWT method holds a considerable advantage over the EWT method. However, in the spectrum of the inner race fault, the fault feature frequencies are not distinct and are still entangled with background noise, lacking complete separation. Therefore, the LMWT method can effectively improve the accuracy and reliability of bearing fault diagnosis, and has excellent compound fault detection ability. In the future, combining deep learning methods with the Legendre multiwavelet theory will be developed.
Author Contributions
Conceptualization, X.Z. and Z.L.; methodology, X.Z.; software, Z.L.; validation, Z.L.; formal analysis, X.Z.; investigation, Z.F.; resources, L.C.; data curation, Z.L.; writing—original draft preparation, Z.L.; writing—review and editing, Z.L.; visualization, Z.L.; supervision, X.Z.; project administration, X.Z.; funding acquisition, X.Z. All authors have read and agreed to the published version of the manuscript.
Funding
This work is funded by Fundamental and Advanced Research Project of Chongqing CSTC of China, the project No. are cstc2019jcyj-msxmX0386 and cstc2020jcyj-msxmX0232.
Informed Consent Statement
Not applicable.
Data Availability Statement
In this article, two publicly available bearing datasets were used, namely Case Western Reserve University (CWRU) bearing data and Paderborn University (PU) bearing dataset. CWRU bearing dataset can be found in https://engineering.case.edu/bearingdatacenter (accessed on 23 March 2023), and PU bearing dataset can be found in https://mb.uni-paderborn.de/kat/forschung/kat-datacenter/bearing-datacenter/ (accessed on 3 April 2023).
Conflicts of Interest
The authors declare no conflict of interest. The funders had no role in the design of the study; in the collection, analyses, or interpretation of data; in the writing of the manuscript; or in the decision to publish the results.
References
- Zhang, W.; Peng, G.; Li, C.; Chen, Y.; Zhang, Z. A New Deep Learning Model for Fault Diagnosis with Good Anti-Noise and Domain Adaptation Ability on Raw Vibration Signals. Sensors 2017, 17, 425. [Google Scholar] [CrossRef] [PubMed]
- Liang, P.; Wang, W.; Yuan, X.; Liu, S.; Zhang, L.; Cheng, Y. Intelligent Fault Diagnosis of Rolling Bearing Based on Wavelet Transform and Improved ResNet under Noisy Labels and Environment. Eng. Appl. Artif. Intell. 2022, 115, 105269. [Google Scholar] [CrossRef]
- Tang, J.; Wu, J.; Hu, B.; Liu, J. Towards a Fault Diagnosis Method for Rolling Bearing with Bi-directional Deep Belief Network. Appl. Acoust. 2022, 192, 108727. [Google Scholar] [CrossRef]
- Xu, J.; Zhou, L.; Zhao, W.; Fan, Y.; Ding, X.; Yuan, X. Zero-Shot Learning for Compound Fault Diagnosis of Bearings. Expert Syst. Appl. 2022, 190, 116197. [Google Scholar] [CrossRef]
- Li, H.; Liu, T.; Wu, X.; Chen, Q. A Bearing Fault Diagnosis Method Based on Enhanced Singular Value Decomposition. IEEE Trans. Ind. Inform. 2021, 17, 3220–3230. [Google Scholar] [CrossRef]
- Li, H.; Liu, T.; Wu, X.; Chen, Q. An Optimized VMD Method and Its Applications in Bearing Fault Diagnosis. Measurement 2020, 166, 108185. [Google Scholar] [CrossRef]
- Attoui, I.; Fergani, N.; Boutasseta, N.; Oudjani, B.; Deliou, A. A New Time–Frequency Method for Identification and Classification of Ball Bearing Faults. J. Sound Vib. 2017, 397, 241–265. [Google Scholar] [CrossRef]
- Jiang, X.; Wu, L.; Ge, M. A Novel Faults Diagnosis Method for Rolling Element Bearings Based on EWT and Ambiguity Correlation Classifiers. Entropy 2017, 19, 231. [Google Scholar] [CrossRef]
- Glowacz, A.; Glowacz, W.; Glowacz, Z.; Kozik, J. Early Fault Diagnosis of Bearing and Stator Faults of the Single-Phase Induction Motor Using Acoustic Signals. Measurement 2018, 113, 1–9. [Google Scholar] [CrossRef]
- Zhao, L.; Zhang, Y.; Zhu, D. Rolling Element Bearing Fault Diagnosis Based on Adaptive Local Iterative Filtering Decomposition and Teager–Kaiser Energy Operator. J. Fail. Anal. Prev. 2019, 19, 1018–1022. [Google Scholar] [CrossRef]
- Ding, J. A Double Impulsiveness Measurement Indices-Bilaterally Driven Empirical Wavelet Transform and Its Application to Wheelset-Bearing-System Compound Fault Detection. Measurement 2021, 175, 109135. [Google Scholar] [CrossRef]
- Li, J.; Wang, Z.; Li, Q.; Zhang, J. An Enhanced K-SVD Denoising Algorithm Based on Adaptive Soft-Threshold Shrinkage for Fault Detection of Wind Turbine Rolling Bearing. ISA Trans. 2023, 142, 454–464. [Google Scholar] [CrossRef] [PubMed]
- Konar, P.; Chattopadhyay, P. Bearing Fault Detection of Induction Motor Using Wavelet and Support Vector Machines (SVMs). Appl. Soft Comput. 2011, 11, 4203–4211. [Google Scholar] [CrossRef]
- Damine, Y.; Bessous, N.; Pusca, R.; Megherbi, A.C.; Romary, R.; Sbaa, S. A New Bearing Fault Detection Strategy Based on Combined Modes Ensemble Empirical Mode Decomposition, KMAD, and an Enhanced Deconvolution Process. Energies 2023, 16, 2604. [Google Scholar] [CrossRef]
- Rodriguez, N.; Alvarez, P.; Barba, L.; Cabrera-Guerrero, G. Combining Multi-Scale Wavelet Entropy and Kernelized Classification for Bearing Multi-Fault Diagnosis. Entropy 2019, 21, 152. [Google Scholar] [CrossRef] [PubMed]
- Shao, H.; Jiang, H.; Wang, F.; Wang, Y. Rolling Bearing Fault Diagnosis Using Adaptive Deep Belief Network with Dual-Tree Complex Wavelet Packet. ISA Trans. 2017, 69, 187–201. [Google Scholar] [CrossRef] [PubMed]
- Xu, Y.; Chen, J.; Ma, C.; Zhang, K.; Cao, J. Negentropy Spectrum Decomposition and Its Application in Compound Fault Diagnosis of Rolling Bearing. Entropy 2019, 21, 490. [Google Scholar] [CrossRef]
- Liang, P.; Deng, C.; Wu, J.; Yang, Z.; Zhu, J.; Zhang, Z. Compound Fault Diagnosis of Gearboxes via Multi-label Convolutional Neural Network and Wavelet Transform. Comput. Ind. 2019, 113, 103132. [Google Scholar] [CrossRef]
- Kumar, H.; Manjunath, S. Use of Empirical Mode Decomposition and K- Nearest Neighbour Classifier for Rolling Element Bearing Fault Diagnosis. Mater. Today Proc. 2022, 52, 796–801. [Google Scholar] [CrossRef]
- Ma, L.; Jiang, B.; Xiao, L.; Lu, N. Digital Twin-Assisted Enhanced Meta-Transfer Learning for Rolling Bearing Fault Diagnosis. Mech. Syst. Signal Process. 2023, 200, 110490. [Google Scholar] [CrossRef]
- Zhang, L.; Liu, Y.; Zhou, J.; Luo, M.; Pu, S.; Yang, X. An Imbalanced Fault Diagnosis Method Based on TFFO and CNN for Rotating Machinery. Sensors 2022, 22, 8749. [Google Scholar] [CrossRef] [PubMed]
- Qu, J.; Cheng, X.; Liang, P.; Zheng, L.; Ma, X. Fault Diagnosis of Bearings Using Wavelet Packet Energy Spectrum and SSA-DBN. Processes 2023, 11, 1875. [Google Scholar] [CrossRef]
- Chen, Y.; Zhang, D.; Ni, H.; Cheng, J.; Karimi, H.R. Multi-Scale Split Dual Calibration Network with Periodic Information for Interpretable Fault Diagnosis of Rotating Machinery. Eng. Appl. Artif. Intell. 2023, 123, 106181. [Google Scholar] [CrossRef]
- Hong, L.; Liu, X.; Zuo, H. Compound Faults Diagnosis Based on Customized Balanced Multiwavelets and Adaptive Maximum Correlated Kurtosis Deconvolution. Measurement 2019, 146, 87–100. [Google Scholar] [CrossRef]
- Yuan, J.; Luo, L.; Jiang, H.; Zhao, Q.; Zhou, B. An Intelligent Index-Driven Multiwavelet Feature Extraction Method for Mechanical Fault Diagnosis. Mech. Syst. Signal Process. 2023, 188, 109992. [Google Scholar] [CrossRef]
- Komorska, I.; Puchalski, A. Rotating Machinery Diagnosing in Non-Stationary Conditions with Empirical Mode Decomposition-Based Wavelet Leaders Multifractal Spectra. Sensors 2021, 21, 7677. [Google Scholar] [CrossRef] [PubMed]
- Yuan, J.; Wang, Y.; Peng, Y.; Wei, C. Weak Fault Detection and Health Degradation Monitoring Using Customized Standard Multiwavelets. Mech. Syst. Signal Process. 2017, 94, 384–399. [Google Scholar] [CrossRef]
- Luo, C.; Zheng, X.; Jia, D.; Ye, Z. New Features Extraction Method for Fault Diagnosis of Bearing Based on Legendre Multiwavelet Neural Network. In Proceedings of the 7th International Conference on Computing, Control and Industrial Engineering (CCIE 2023), Hangzhou, China, 25–26 February 2023; Shmaliy, Y.S., Nayyar, A., Eds.; Springer Nature: Singapore, 2023; pp. 1019–1025. [Google Scholar]
- Zheng, X.; Feng, Z.; Lei, Z.; Chen, L. LW-BPNN: A Novel Feature Extraction Method for Rolling Bearing Fault Diagnosis. Processes 2023, 11, 3351. [Google Scholar] [CrossRef]
- Zheng, X.; Chen, L.; Yu, C.; Lei, Z.; Feng, Z.; Wei, Z. Gearbox Compound Fault Diagnosis in Edge-IoT Based on Legendre Multiwavelet Transform and Convolutional Neural Network. Sensors 2023, 23, 8669. [Google Scholar] [CrossRef]
- Alpert, B.K. A Class of Bases in L2 for the Sparse Representation of Integral Operators. SIAM J. Math. Anal. 1993, 24, 246–262. [Google Scholar] [CrossRef]
- Chen, J.; Zi, Y.; He, Z.; Wang, X. Construction of Adaptive Redundant Multiwavelet Packet and Its Application to Compound Faults Detection of Rotating Machinery. Sci. China Technol. Sci. 2012, 55, 2083–2090. [Google Scholar] [CrossRef]
- Randall, R.B.; Antoni, J. Rolling Element Bearing Diagnostics—A Tutorial. Mech. Syst. Signal Process. 2011, 25, 485–520. [Google Scholar] [CrossRef]
- Case School of Engineering|Case Western Reserve University. CWRU Beraing Dataset. Case School of Engineering. 2012. Available online: https://engineering.case.edu/bearingdatacenter (accessed on 23 March 2023).
- Lessmeier, C.; Kimotho, J.K.; Zimmer, D.; Sextro, W. Condition Monitoring of Bearing Damage in Electromechanical Drive Systems by Using Motor Current Signals of Electric Motors: A Benchmark Data Set for Data-Driven Classification. In Proceedings of the PHM Society European Conference, Bilbao, Spain, 5–8 July 2016. [Google Scholar]
Figure 1.
The decomposition stages of the Legendre multiwavelet transform with three base functions. G and H are, respectively, matrix high-pass and low-pass filters.
Figure 1.
The decomposition stages of the Legendre multiwavelet transform with three base functions. G and H are, respectively, matrix high-pass and low-pass filters.

Figure 2.
(a) Simulated signal with fault impulses, (b) added noise, (c) simulated signal with added noise, (d) envelope spectrum of the noisy signal.
Figure 2.
(a) Simulated signal with fault impulses, (b) added noise, (c) simulated signal with added noise, (d) envelope spectrum of the noisy signal.

Figure 3.
The multiwavelet coefficients corresponding to the 4000 sample points of the noisy signal obtained via LMWT.
Figure 3.
The multiwavelet coefficients corresponding to the 4000 sample points of the noisy signal obtained via LMWT.

Figure 4.
The empirical modes of the 4000 sample points of the noisy signal obtained by EWT.

Figure 5.
Envelope spectrum obtained by LMWT (a) and EWT (b).

Figure 6.
Relative energy ratio obtained by LMWT and EWT.

Figure 7.
The schematic of the CRWU bearing dataset. From left to right include accelerometer (1), bearing (2), torque transducer and encoder (3) and dynamometer (4).
Figure 7.
The schematic of the CRWU bearing dataset. From left to right include accelerometer (1), bearing (2), torque transducer and encoder (3) and dynamometer (4).

Figure 8.
The vibration signals of bearing with different fault in CWRU bearing dataset.

Figure 9.
Frequency spectrum and Envelope spectrum of Vibration Signals in Various Faults of CWRU Bearing Dataset: (a,b) Ball Faults, (c,d) Inner Race Faults, (e,f) Outer Race Faults.
Figure 9.
Frequency spectrum and Envelope spectrum of Vibration Signals in Various Faults of CWRU Bearing Dataset: (a,b) Ball Faults, (c,d) Inner Race Faults, (e,f) Outer Race Faults.

Figure 10.
Envelope spectrum obtained by the proposed method of bearing at different faults in CWRU bearing dataset.
Figure 10.
Envelope spectrum obtained by the proposed method of bearing at different faults in CWRU bearing dataset.

Figure 11.
Envelope spectrum obtained by the EWT method of bearing at different faults in CWRU bearing dataset.
Figure 11.
Envelope spectrum obtained by the EWT method of bearing at different faults in CWRU bearing dataset.

Figure 12.
Relative energy ratios obtained by the proposed method of bearing at different faults in CWRU bearing dataset.
Figure 12.
Relative energy ratios obtained by the proposed method of bearing at different faults in CWRU bearing dataset.

Figure 13.
Relative energy ratios obtained by the EWT method of bearing at different faults in CWRU bearing dataset.
Figure 13.
Relative energy ratios obtained by the EWT method of bearing at different faults in CWRU bearing dataset.

Figure 14.
The schematic of the Paderborn bearing dataset, which includes a drive motor (1), housing (2), adjusting nut (3), and spring packge (4).
Figure 14.
The schematic of the Paderborn bearing dataset, which includes a drive motor (1), housing (2), adjusting nut (3), and spring packge (4).

Figure 15.
(a) The vibration signals of compound fault signal in Paderborn bearing dataset and its (b) spectrum, (c) envelope spectrum.
Figure 15.
(a) The vibration signals of compound fault signal in Paderborn bearing dataset and its (b) spectrum, (c) envelope spectrum.

Figure 16.
Relative energy ratio on the six multiwavelet coefficients corresponding to the different parts of the compound fault signal in the Paderborn bearing dataset.
Figure 16.
Relative energy ratio on the six multiwavelet coefficients corresponding to the different parts of the compound fault signal in the Paderborn bearing dataset.

Figure 17.
The envelope spectrums of (a) BPFI and (b) BPFO on the six multiwavelet coefficients corresponding to the different parts of the compound fault signal in the Paderborn bearing dataset.
Figure 17.
The envelope spectrums of (a) BPFI and (b) BPFO on the six multiwavelet coefficients corresponding to the different parts of the compound fault signal in the Paderborn bearing dataset.

Figure 18.
Relative energy ratio on the empirical modes to the different parts of the compound fault signal in the Paderborn bearing dataset.
Figure 18.
Relative energy ratio on the empirical modes to the different parts of the compound fault signal in the Paderborn bearing dataset.

Figure 19.
The envelope spectrums of (a) BPFI, (b) BPFO on the empirical modes to the different parts of the compound fault signal in the Paderborn bearing dataset.
Figure 19.
The envelope spectrums of (a) BPFI, (b) BPFO on the empirical modes to the different parts of the compound fault signal in the Paderborn bearing dataset.


Table 1.
Geometric characteristics of the 6205-2RS JEM SKF bearing.
| Parameter | Value | Parameter | Value |
|---|---|---|---|
| Bore diameter | 25 mm | Outside diameter | 52 mm |
| Overall width | 15 mm | Pitch diameter | 39 mm |
| Ball diameter | 8 mm | Rolling element number | 9 pc. |
| Contact angle | 0 rad |
Table 2.
The fault characteristic frequency of 6205-2RS JEM SKF bearing.
| RPM (r/min) | Characteristic Frequency of Bearing Fault | |||
|---|---|---|---|---|
| BFPO (Hz) | BFPI (Hz) | BSF (Hz) | (Hz) | |
| 1730 | 103.3675 | 156.1325 | 135.9203 | 28.8333 |
Table 3.
Relative energy ratios of LMWT and EWT in different fault.
| 1 | 2 | 3 | 4 | 5 | 6 | Average | ||
|---|---|---|---|---|---|---|---|---|
| LMWT | Ball | 0.063 | 0.072 | 0.049 | 0.024 | 0.037 | 0.053 | 0.049 |
| Inner race | 0.143 | 0.156 | 0.197 | 0.150 | 0.211 | 0.203 | 0.176 | |
| Outer race | 0.485 | 0.503 | 0.557 | 0.489 | 0.572 | 0564 | 0.528 | |
| EWT | Ball | 0.001 | 0.000 | 0.002 | 0.000 | 0.001 | 0.000 | 0.000 |
| Inner race | 0.114 | 0.001 | 0.181 | 0.178 | 0.023 | 0.002 | 0.083 | |
| Outer race | 0.583 | 0.044 | 0.243 | 0.768 | 0.006 | 0.009 | 0.275 |
Table 4.
Geometric characteristics of 6203 bearing.
| Parameter | Value | Parameter | Value |
|---|---|---|---|
| Diameter of inner race | 24 mm | Diameter of outer race | 33.1 mm |
| Pitch circle diameter | 28.55 mm | Number of rolling elements | 8 pc. |
| Rolling element diameter | 6.75 mm | Length of rolling element | 6.75 mm |
| Nominal pressure angle | 0 rad |
Table 5.
The fault information of 6203 bearing.
| Bearing Code | Damage | Bearing Element |
|---|---|---|
| KB23 | fatigue:pitting | IR + OR |
Table 6.
The fault characteristic frequency of 6203 bearing.
| RPM (r/min) | Characteristic Frequency of Bearing Fault | ||
|---|---|---|---|
| BFPO (Hz) | BFPI (Hz) | (Hz) | |
| 900 | 46.0585 | 73.9415 | 15 |
Table 7.
Relative energy ratios of LMWT and EWT in different fault.
| 1 | 2 | 3 | 4 | 5 | 6 | Average | ||
|---|---|---|---|---|---|---|---|---|
| LMWT | Inner race | 0.042 | 0.108 | 0.121 | 0.023 | 0.083 | 0.017 | 0.065 |
| Outer race | 0.386 | 0.332 | 0.189 | 0.392 | 0.127 | 0.232 | 0.276 | |
| EWT | Inner race | 0.000 | 0.000 | 0.000 | 0.000 | 0.000 | 0.002 | 0.000 |
| Outer race | 0.008 | 0.001 | 0.000 | 0.001 | 0.006 | 0.016 | 0.004 |
Disclaimer/Publisher’s Note: The statements, opinions and data contained in all publications are solely those of the individual author(s) and contributor(s) and not of MDPI and/or the editor(s). MDPI and/or the editor(s) disclaim responsibility for any injury to people or property resulting from any ideas, methods, instructions or products referred to in the content. |
© 2023 by the authors. Licensee MDPI, Basel, Switzerland. This article is an open access article distributed under the terms and conditions of the Creative Commons Attribution (CC BY) license (https://creativecommons.org/licenses/by/4.0/).
Share and Cite
MDPI and ACS Style
Zheng, X.; Lei, Z.; Feng, Z.; Chen, L. Legendre Multiwavelet Transform and Its Application in Bearing Fault Detection. Appl. Sci. 2024, 14, 219. https://0-doi-org.brum.beds.ac.uk/10.3390/app14010219
AMA Style
Zheng X, Lei Z, Feng Z, Chen L. Legendre Multiwavelet Transform and Its Application in Bearing Fault Detection. Applied Sciences. 2024; 14(1):219. https://0-doi-org.brum.beds.ac.uk/10.3390/app14010219
Chicago/Turabian StyleZheng, Xiaoyang, Zijian Lei, Zhixia Feng, and Lei Chen. 2024. "Legendre Multiwavelet Transform and Its Application in Bearing Fault Detection" Applied Sciences 14, no. 1: 219. https://0-doi-org.brum.beds.ac.uk/10.3390/app14010219
Note that from the first issue of 2016, this journal uses article numbers instead of page numbers. See further details here.