
Optimizing Extraction of Cellulose and Synthesizing Pharmaceutical Grade Carboxymethyl Sago Cellulose from Malaysian Sago Pulp

Abstract
:
1. Introduction
2. Materials and Methods
2.1. Materials
2.2. Isolation of Alpha Cellulose
2.2.1. Pulping Method 1
2.2.2. Pulping Method 2
2.2.3. Pulping Method 3
2.2.4. Pulping Method 4
2.2.5. Pulping Method 5
2.3. Synthesis of CMSC
2.4. Characterization of Cellulose and CMSC
2.5. Physical Characterization of CMSC
2.5.1. Determination of Degree of Substitution (DS)
2.5.2. Determination of Moisture Content
- A = Mass loss on heating, g
- B = sample used, g
2.5.3. Determination of Solubility and pH
- Wd = weight of dried soluble sample in 25 mL
2.5.4. Determination of Average Molecular Weight
2.6. Determination of Heavy Metals and Other Physicochemical Parameters
2.7. Cytotoxicity and Biocompatibility of CMSC
3. Results and Discussion
3.1. Sago Biomass and Cellulose Composition
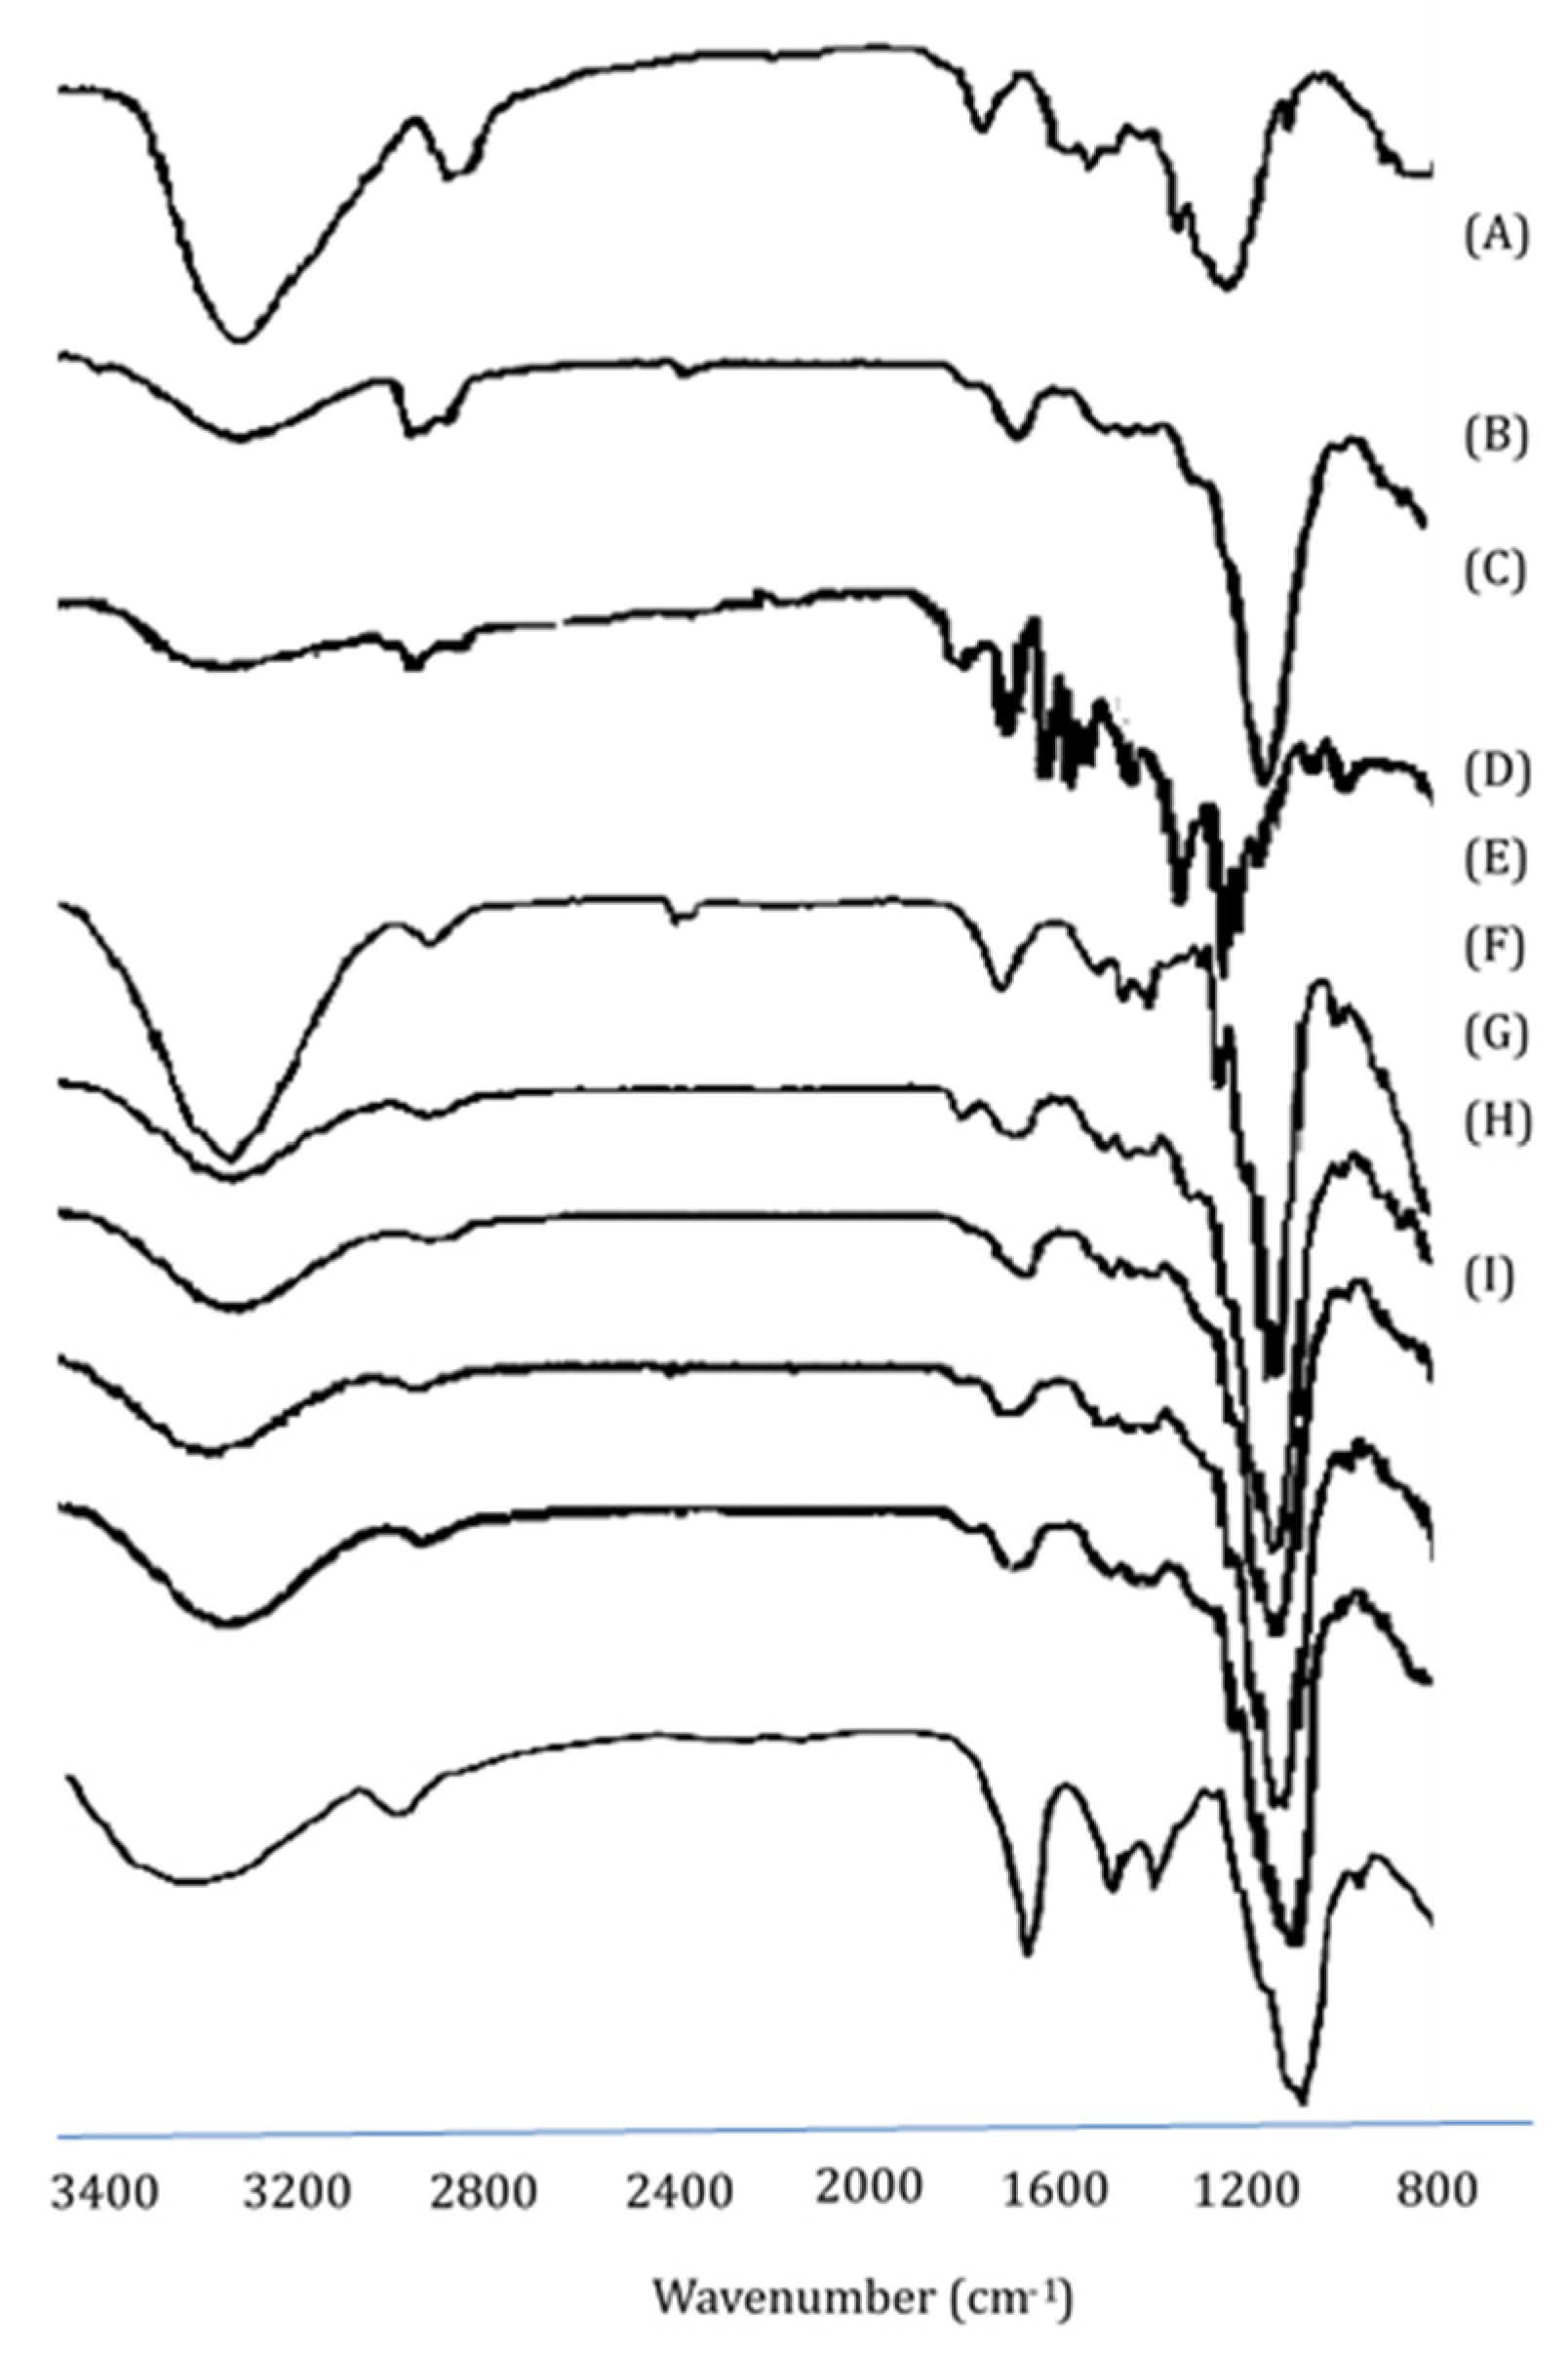
3.2. Fourier Transform Infrared Spectroscopy Studies
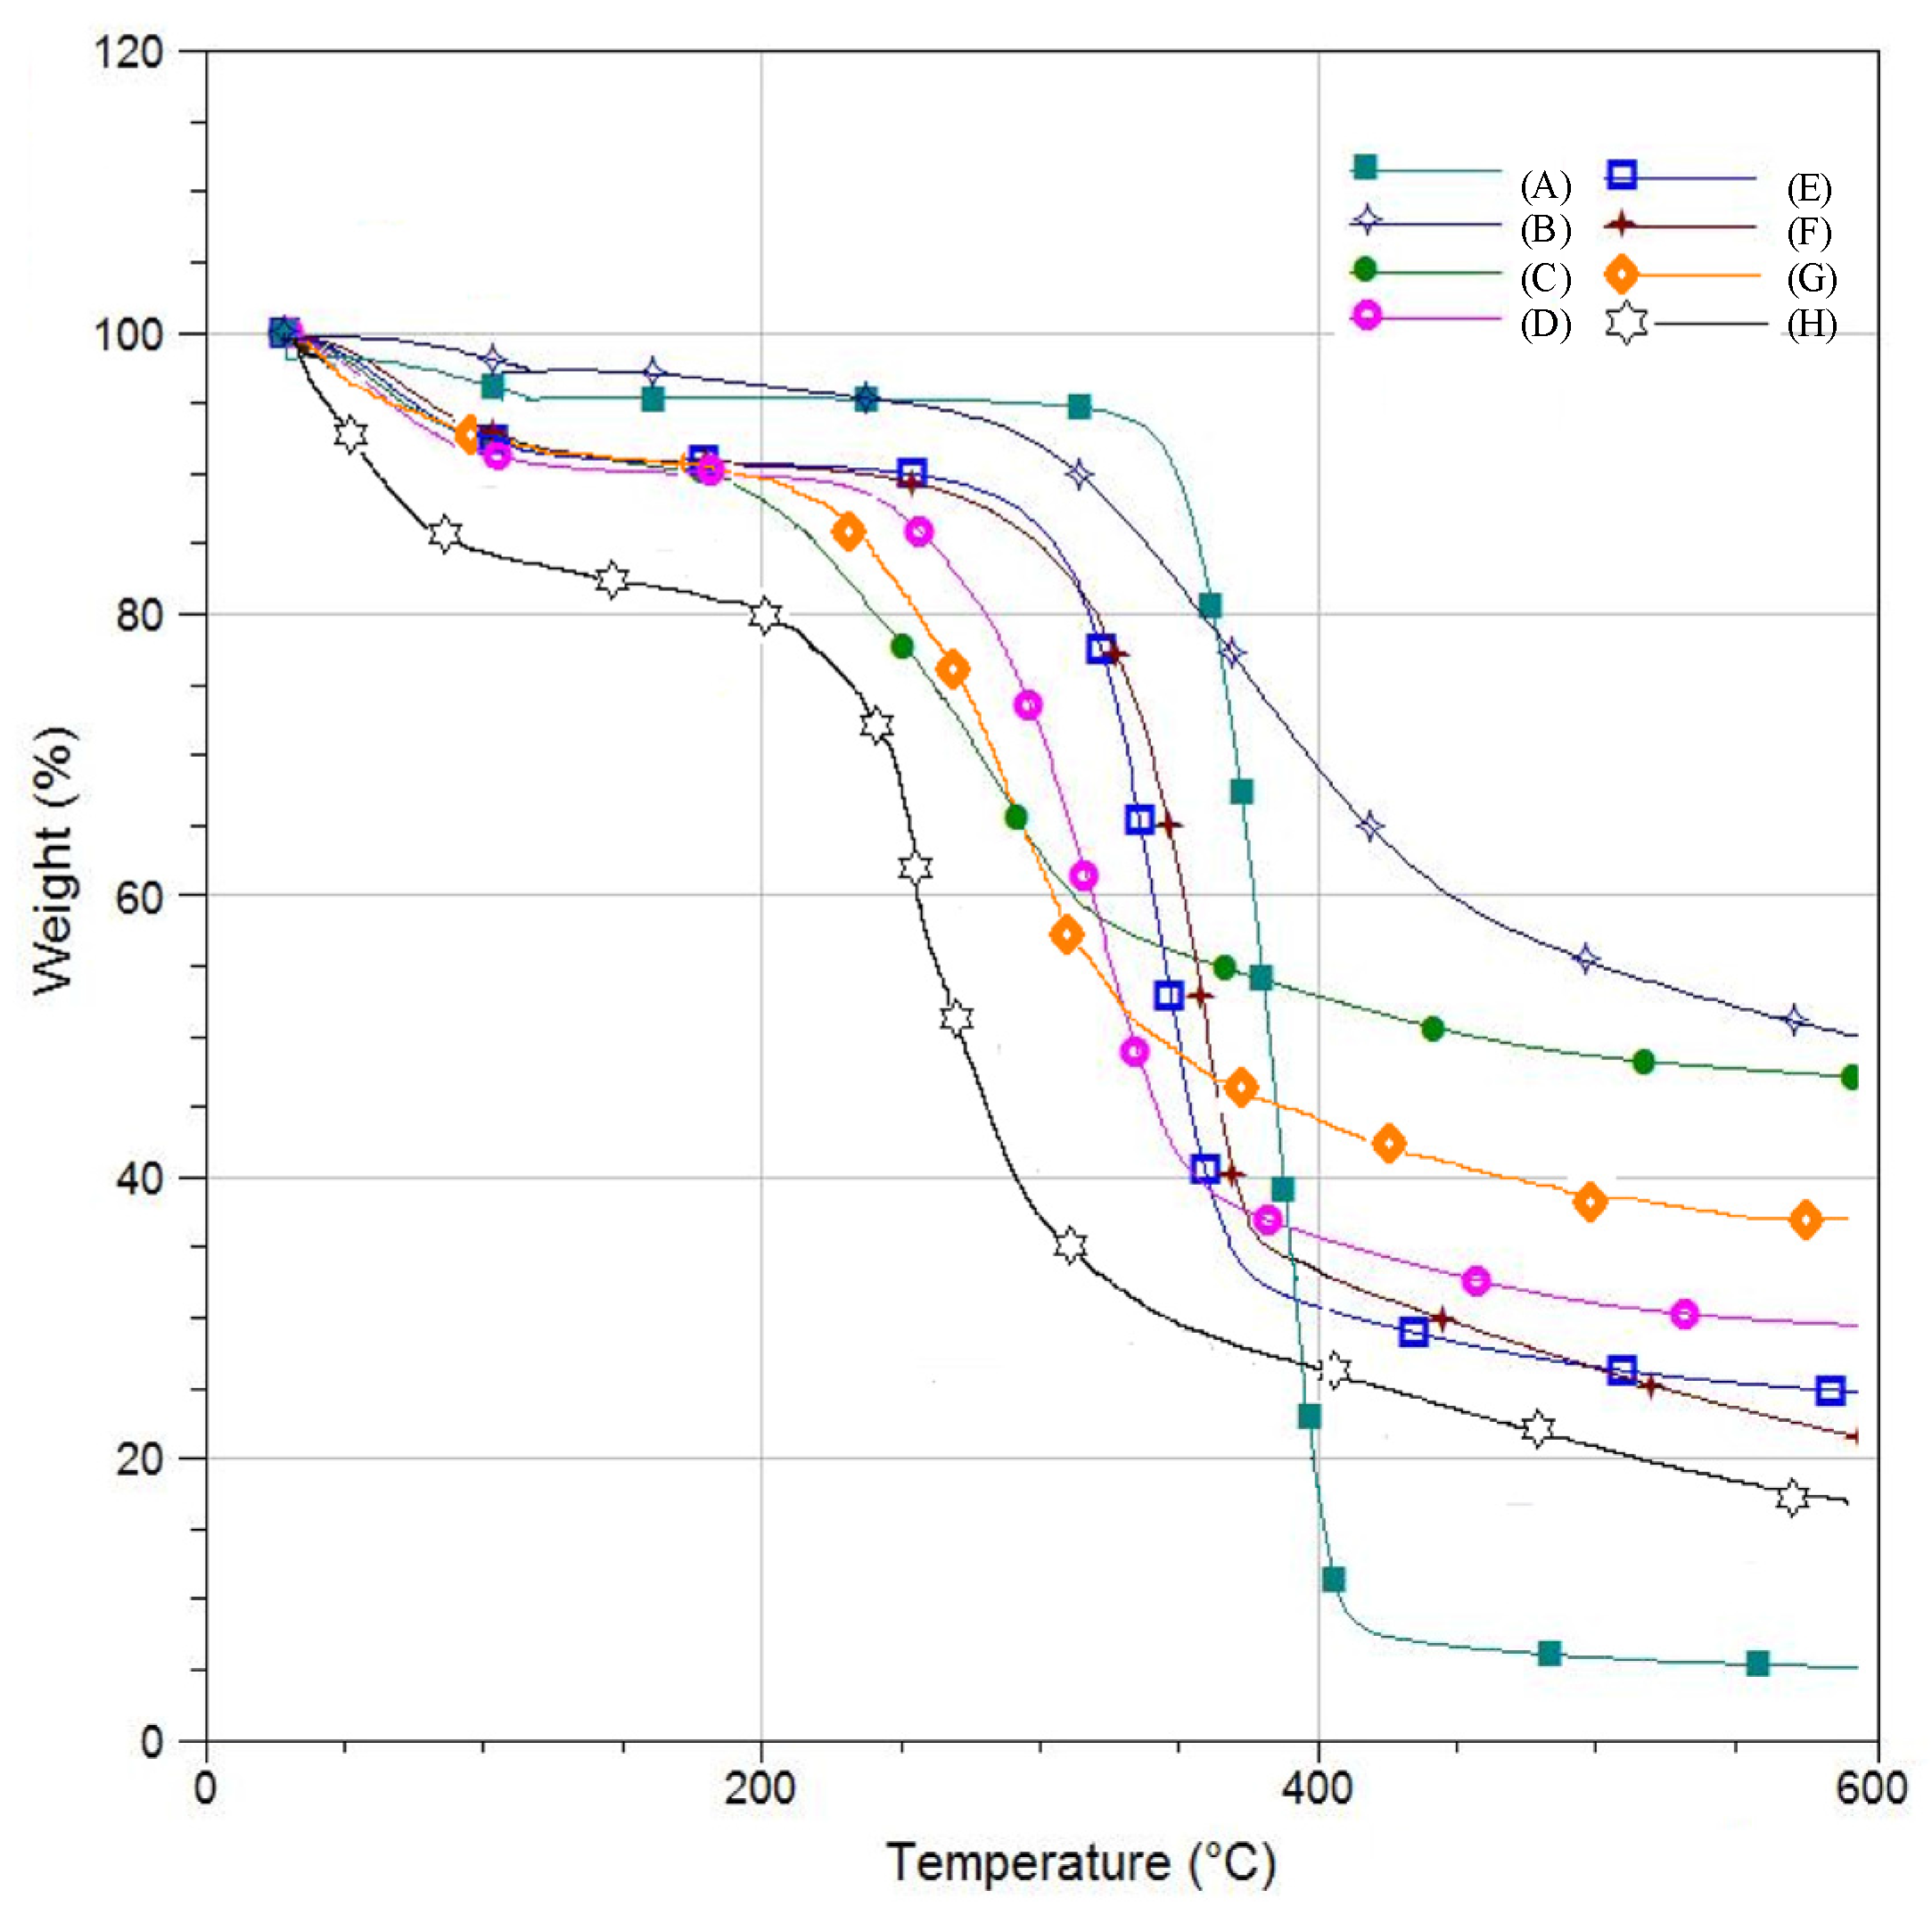
3.3. Thermogravimetric Analysis
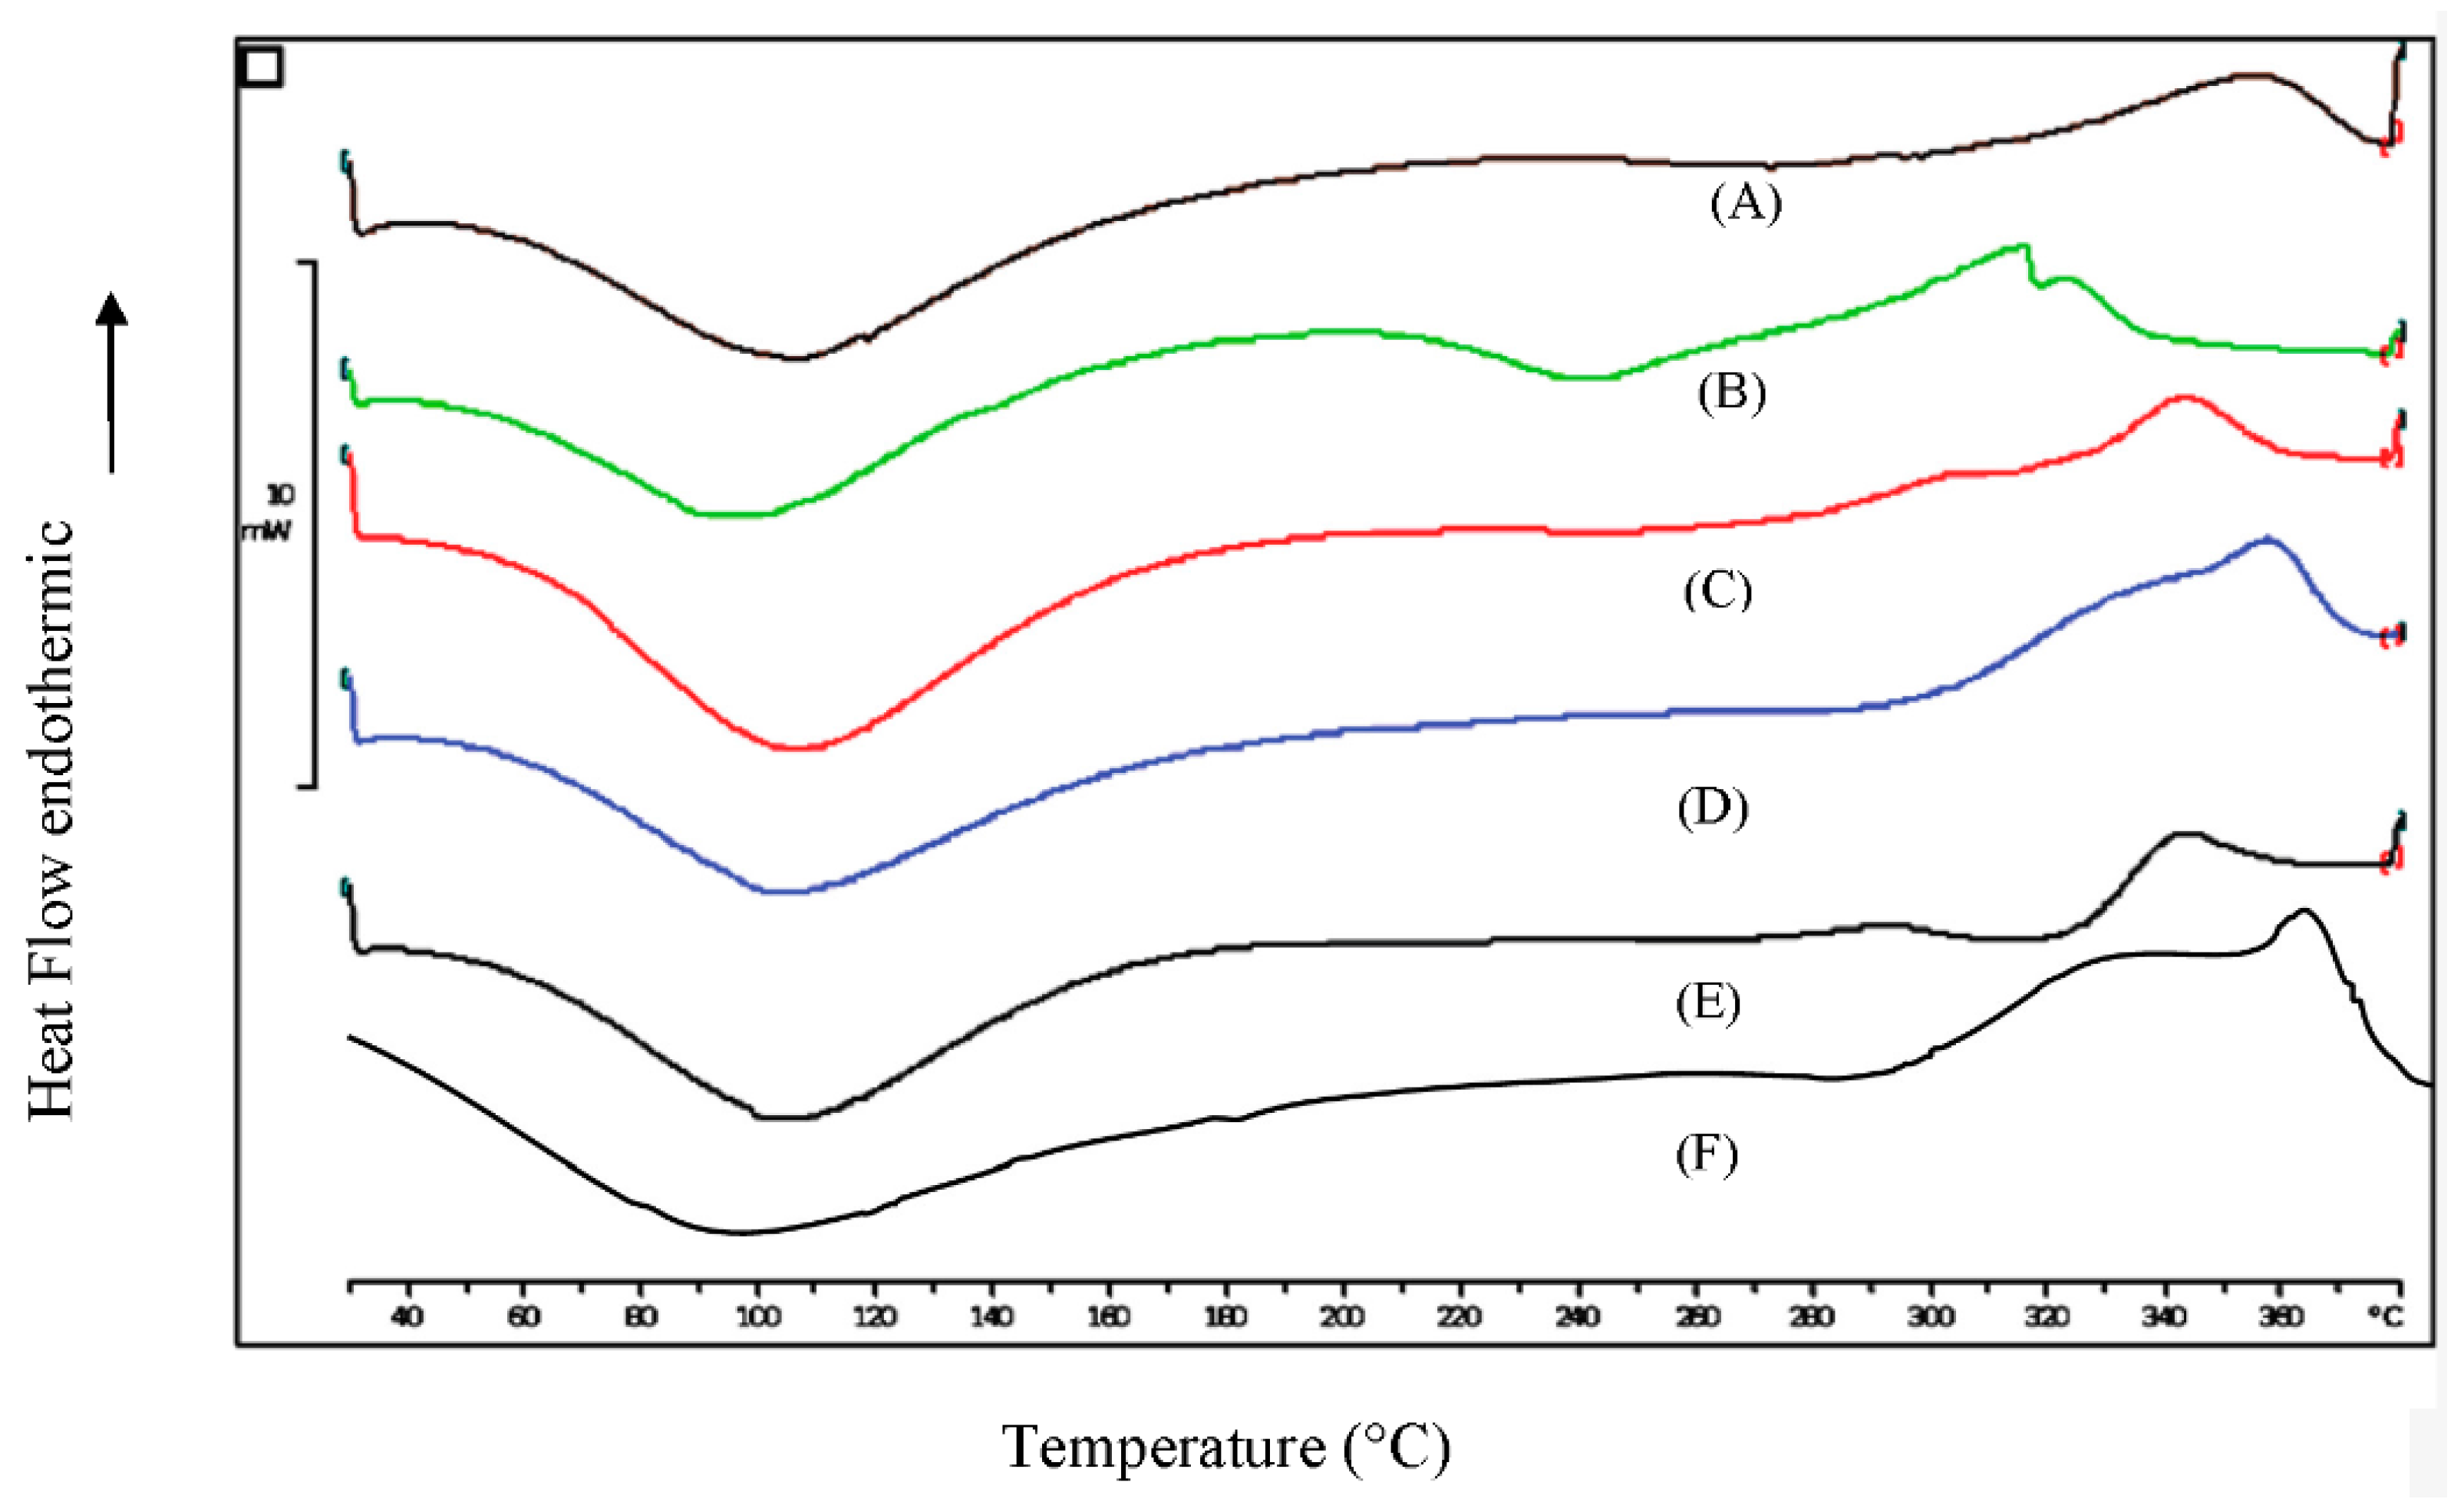
3.4. Differential Scanning Calorimetry
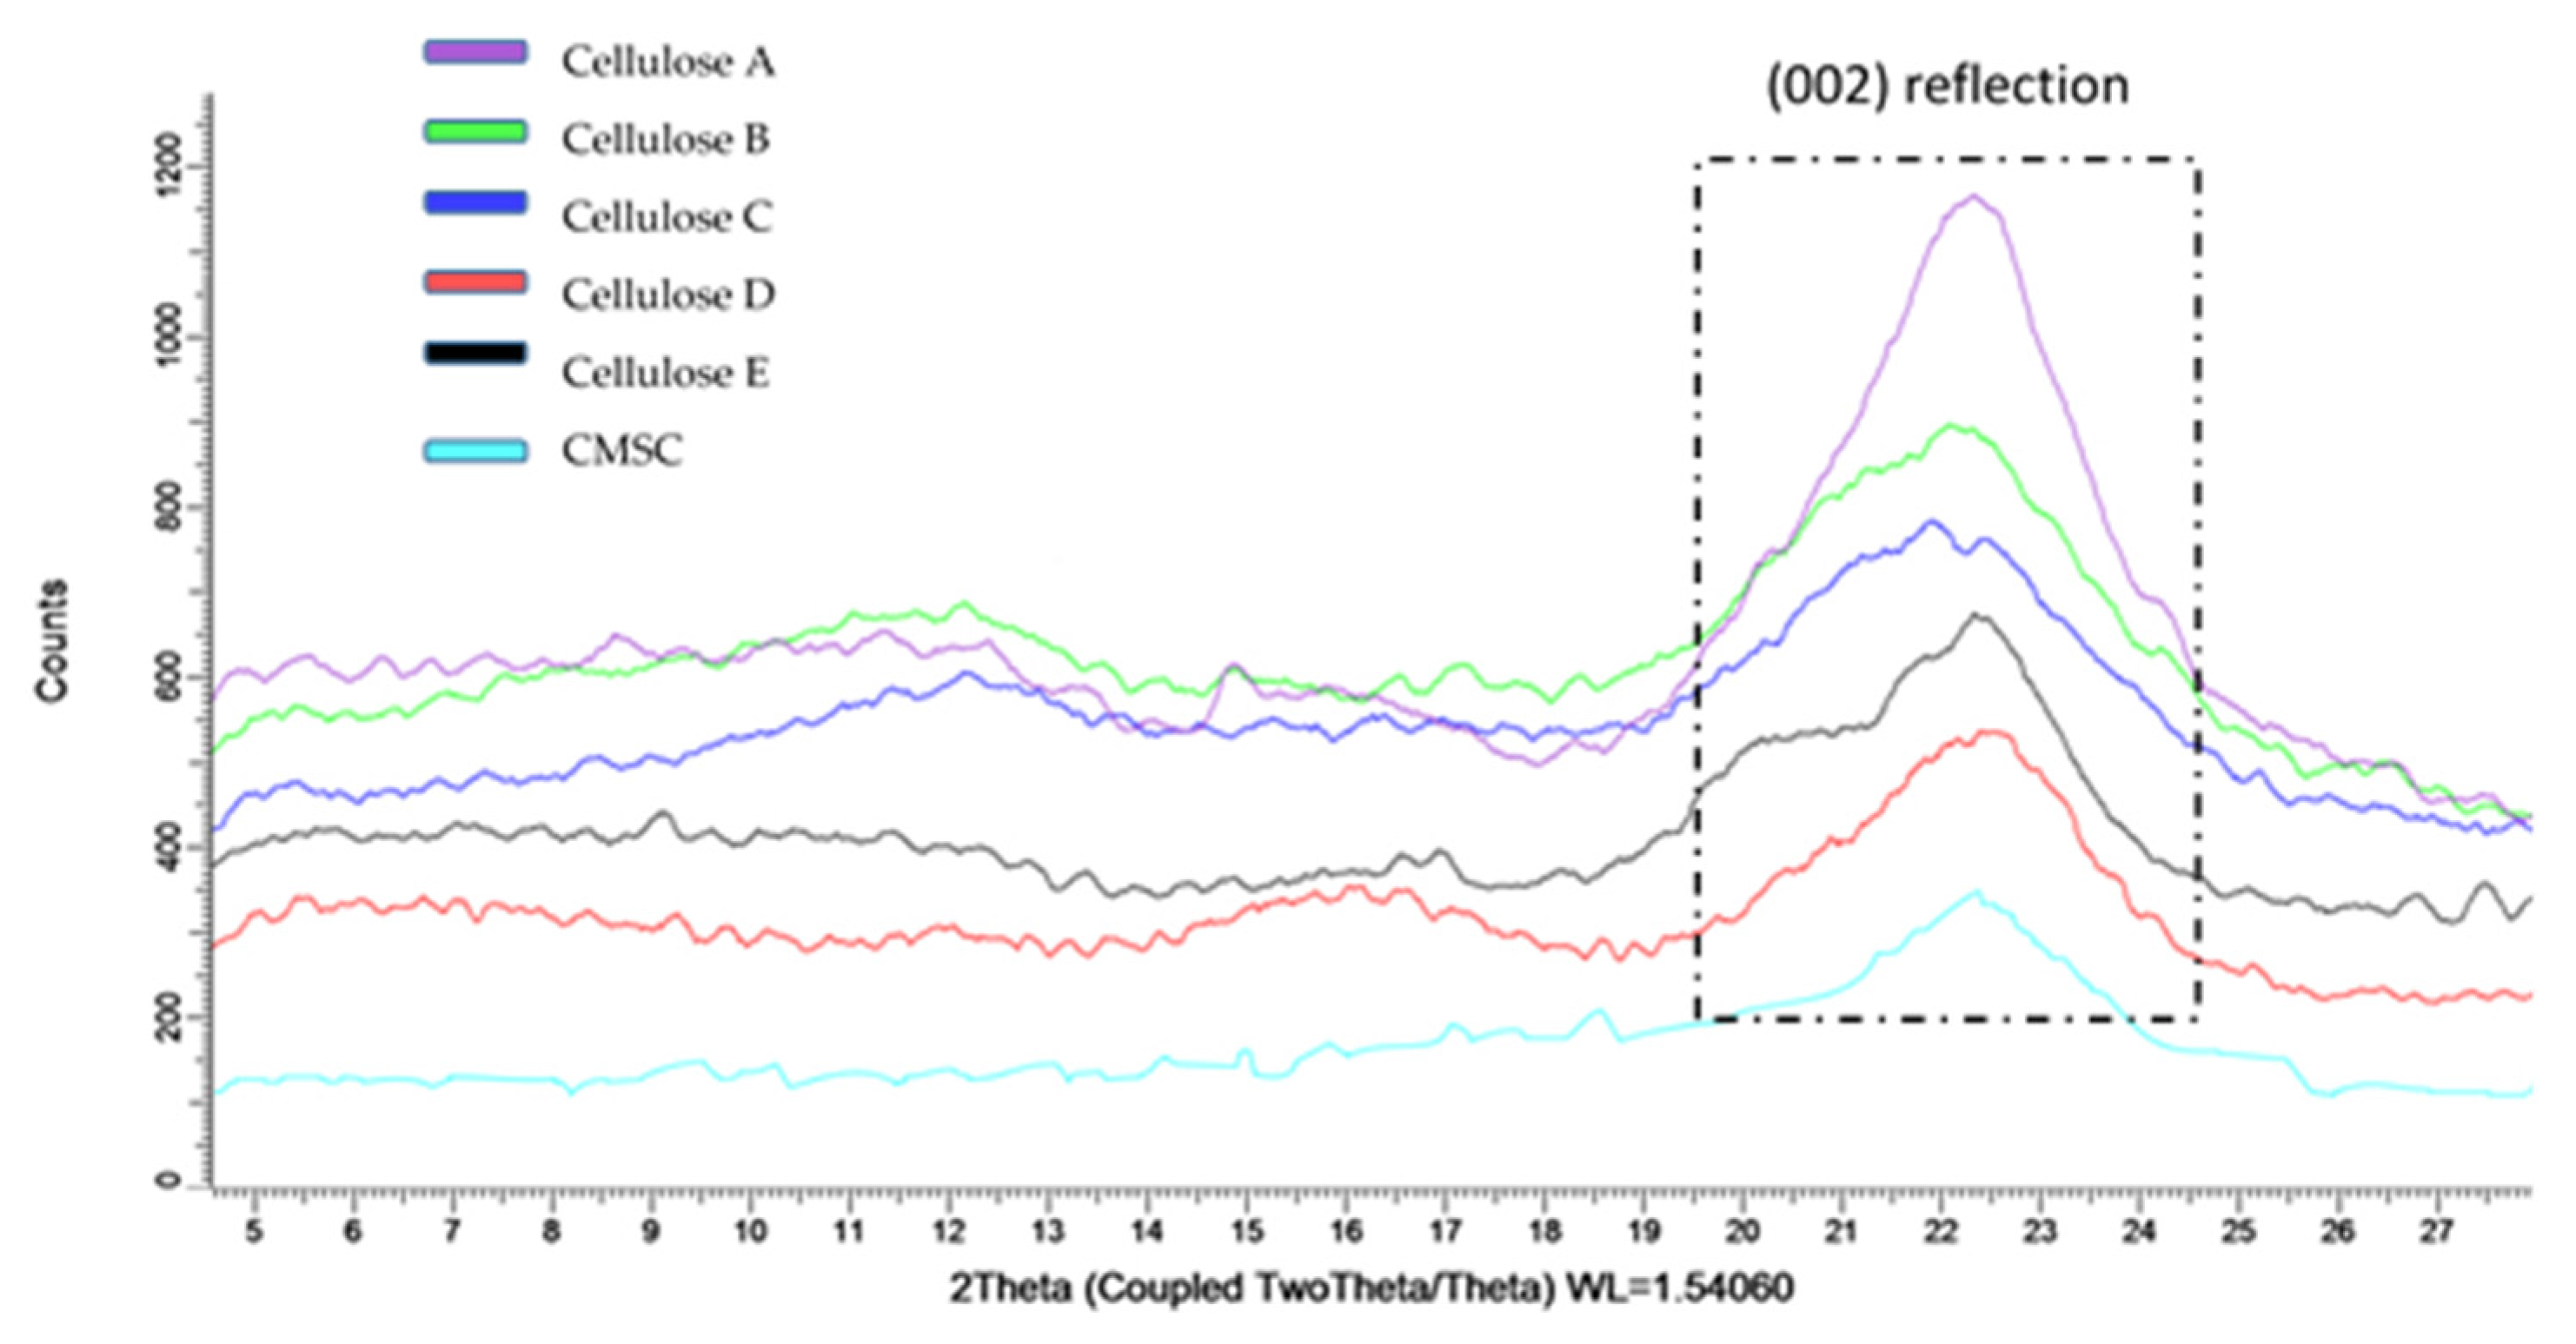
3.5. X-Ray Diffraction
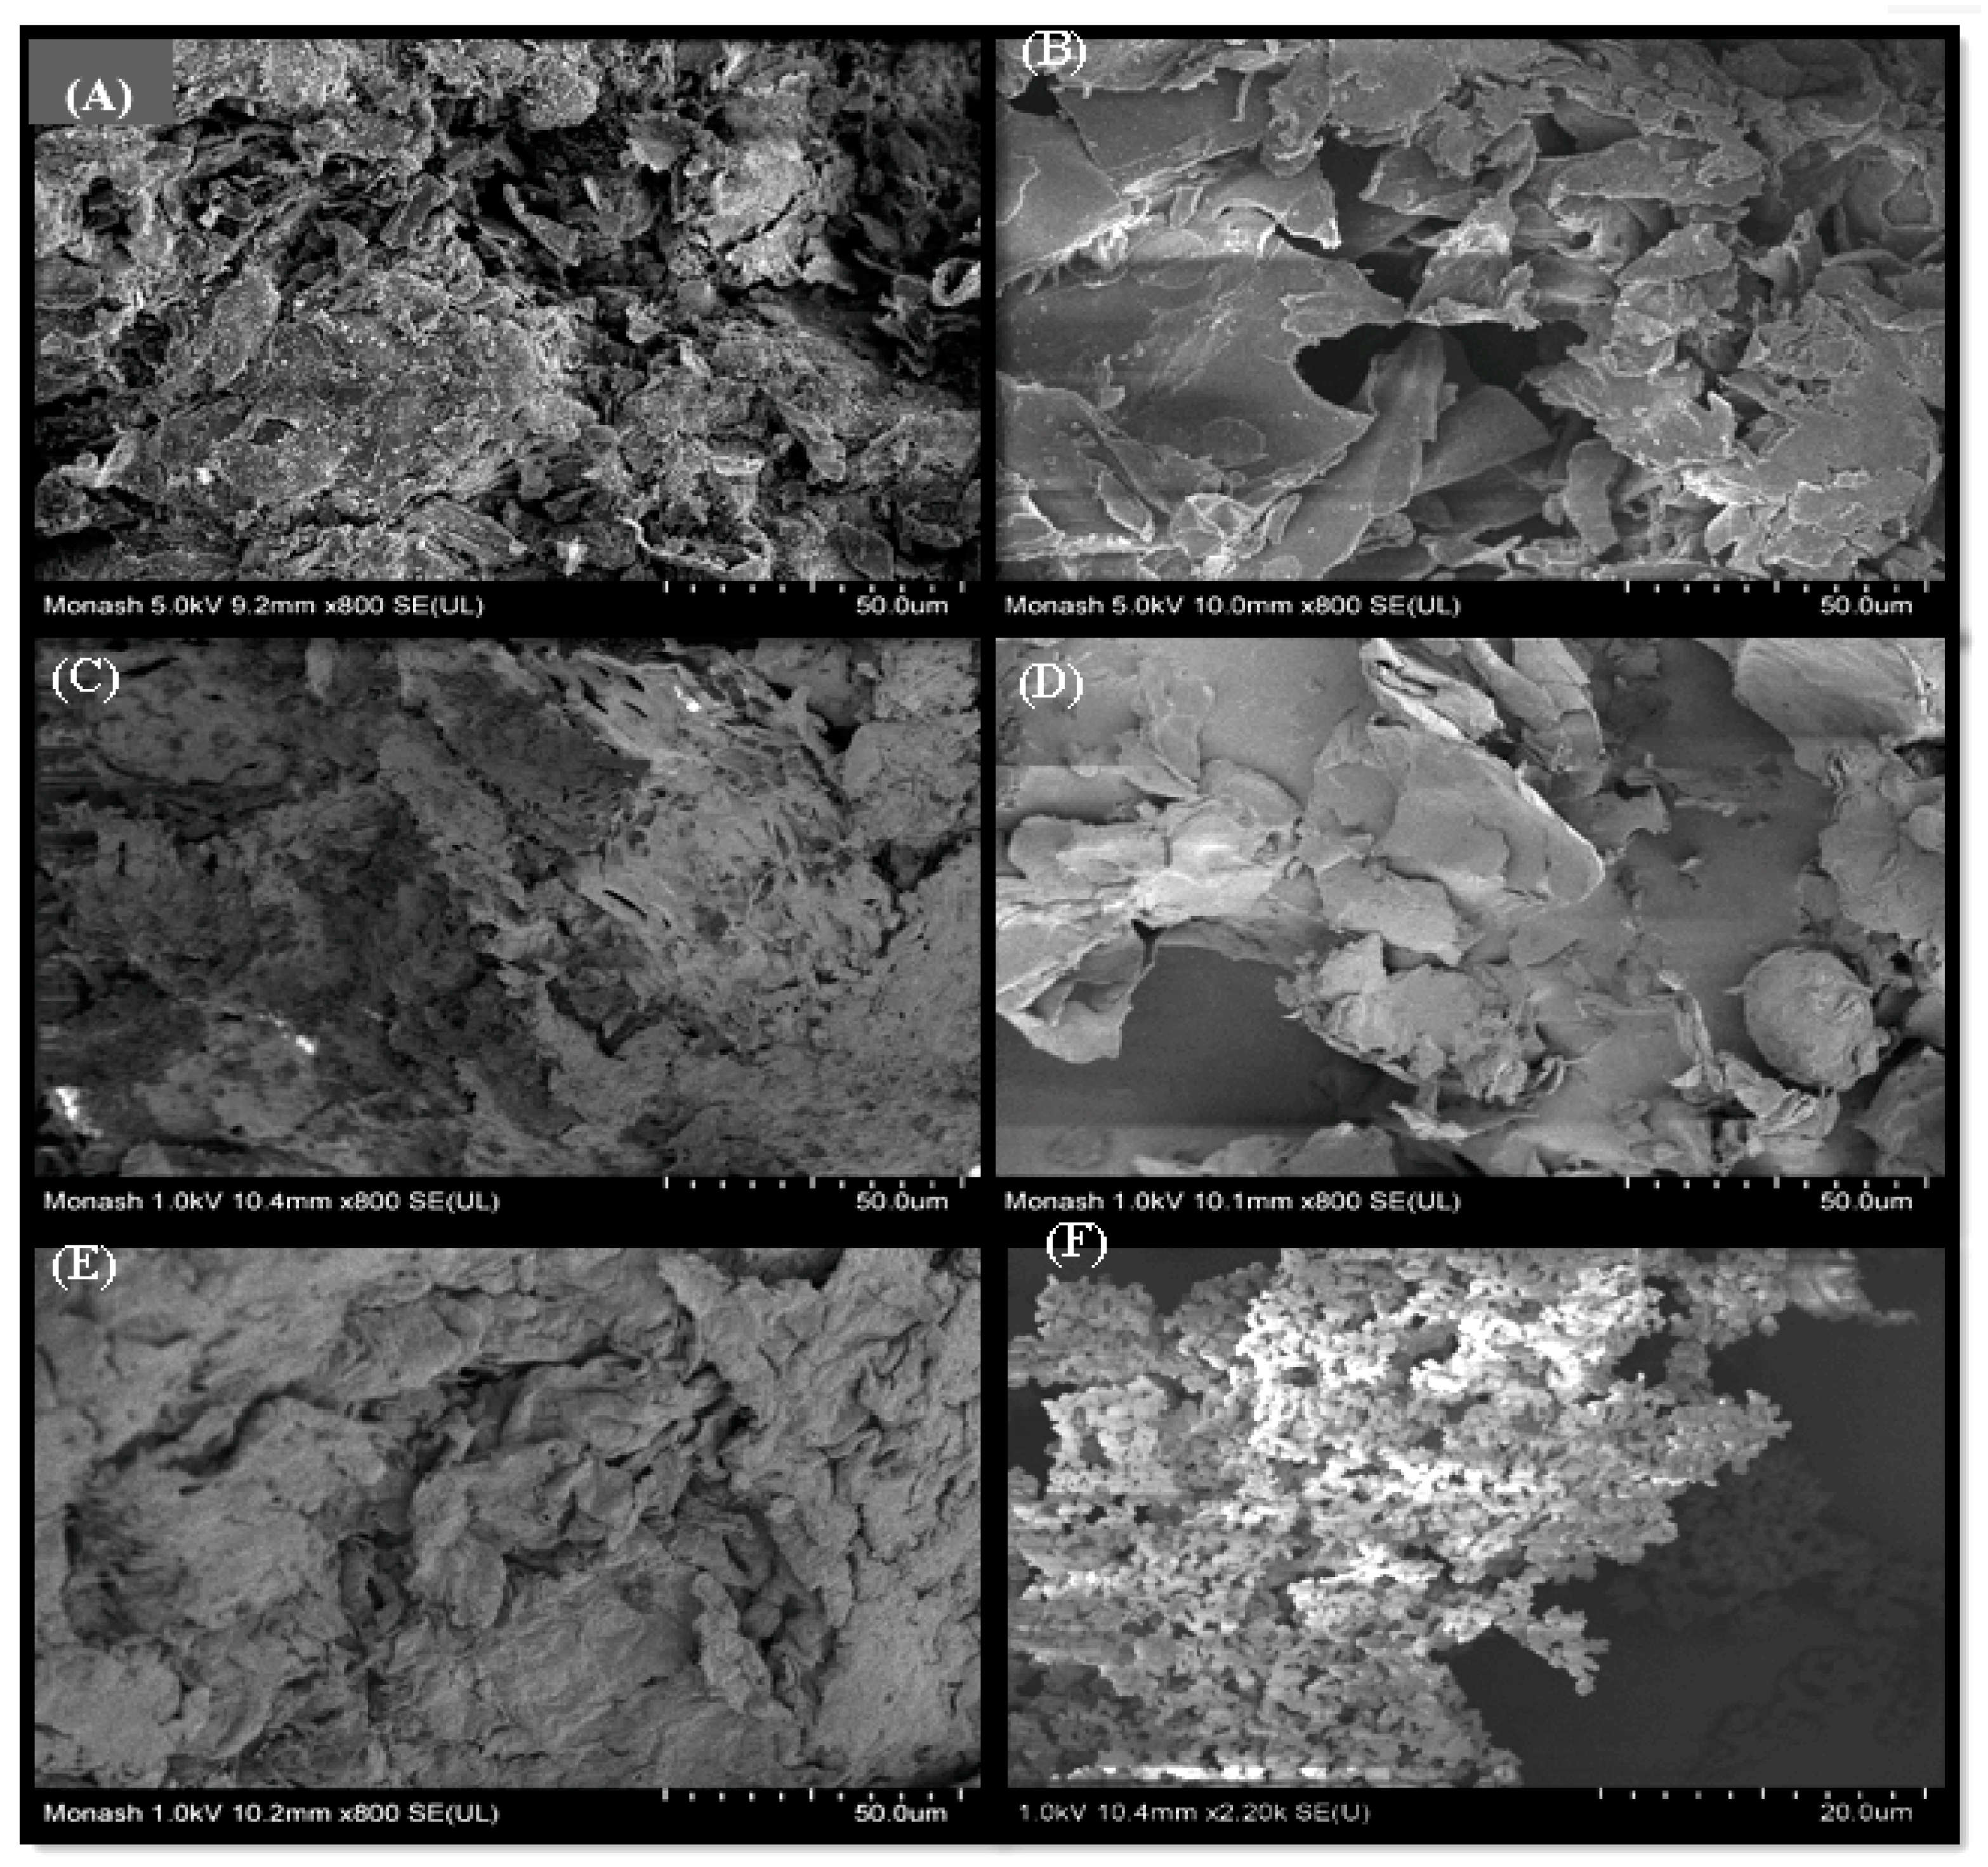
3.6. FESEM
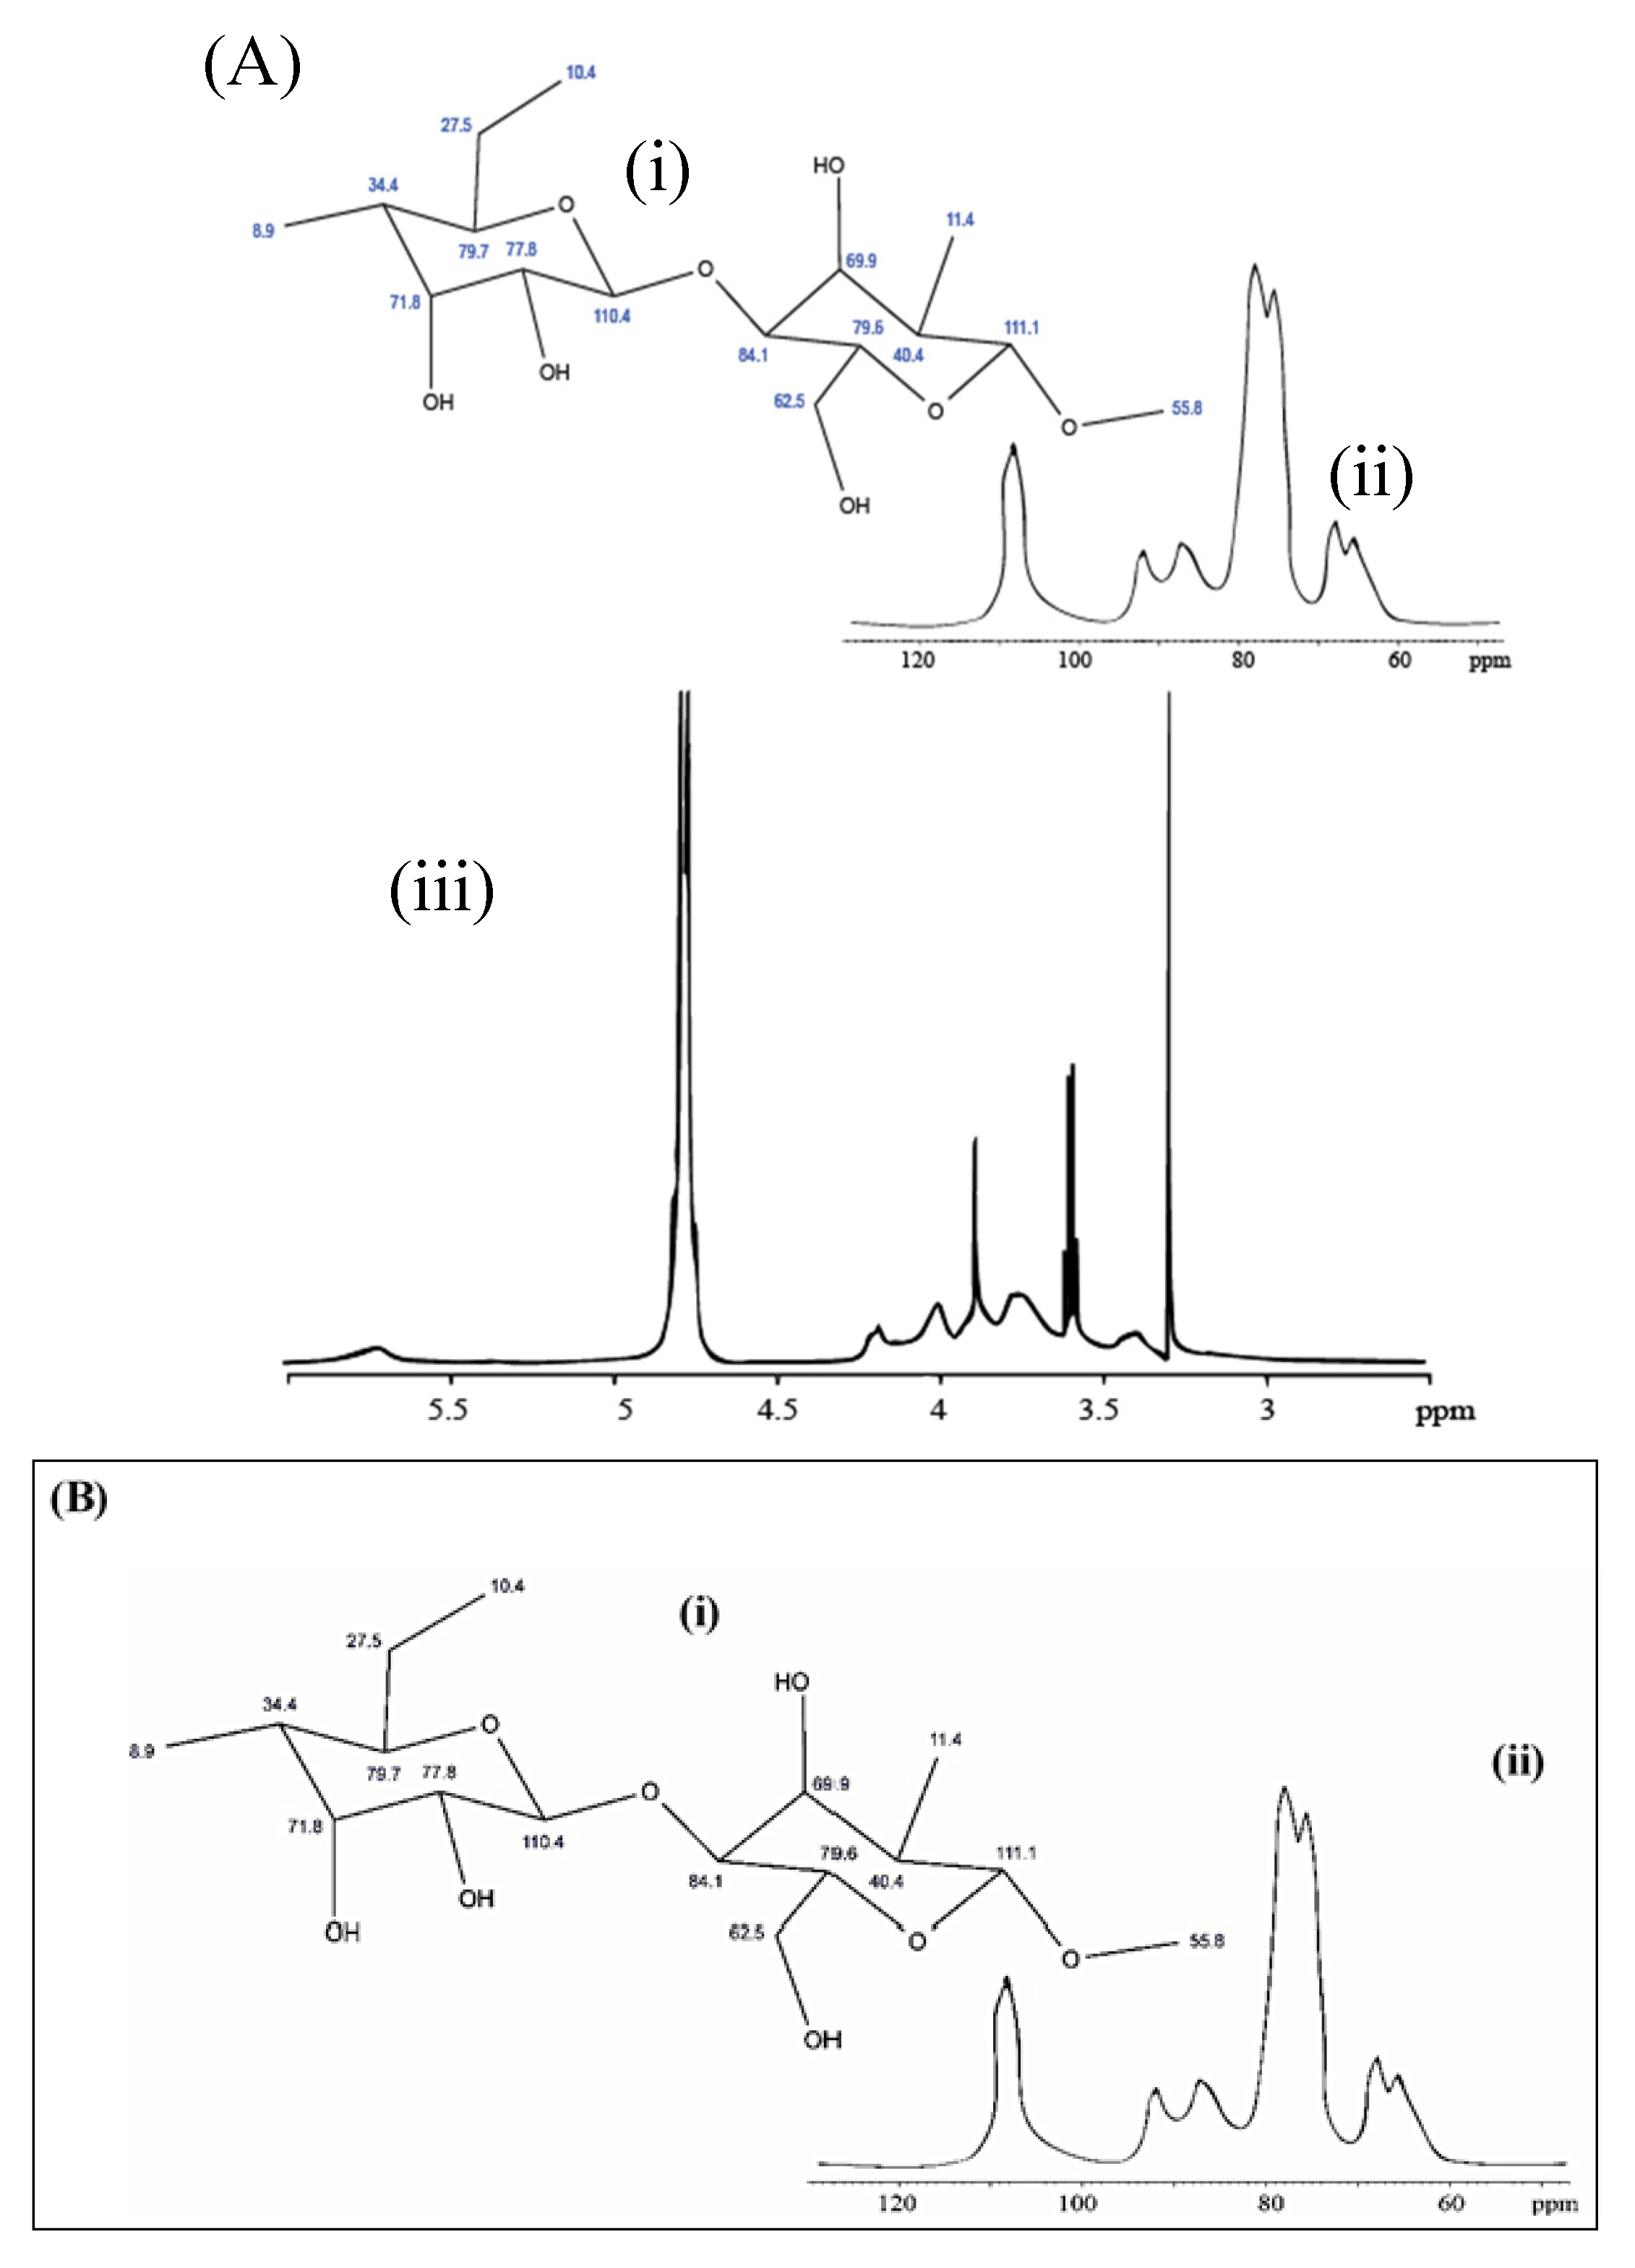
3.7. NMR
3.8. Physical Characterization of CMSC
3.8.1. Degree of Substitution (DS)
3.8.2. Moisture Content
3.8.3. Molecular Weight, Solubility, and pH
3.9. Limit Test for Heavy Metals and other Physicochemical Parameters
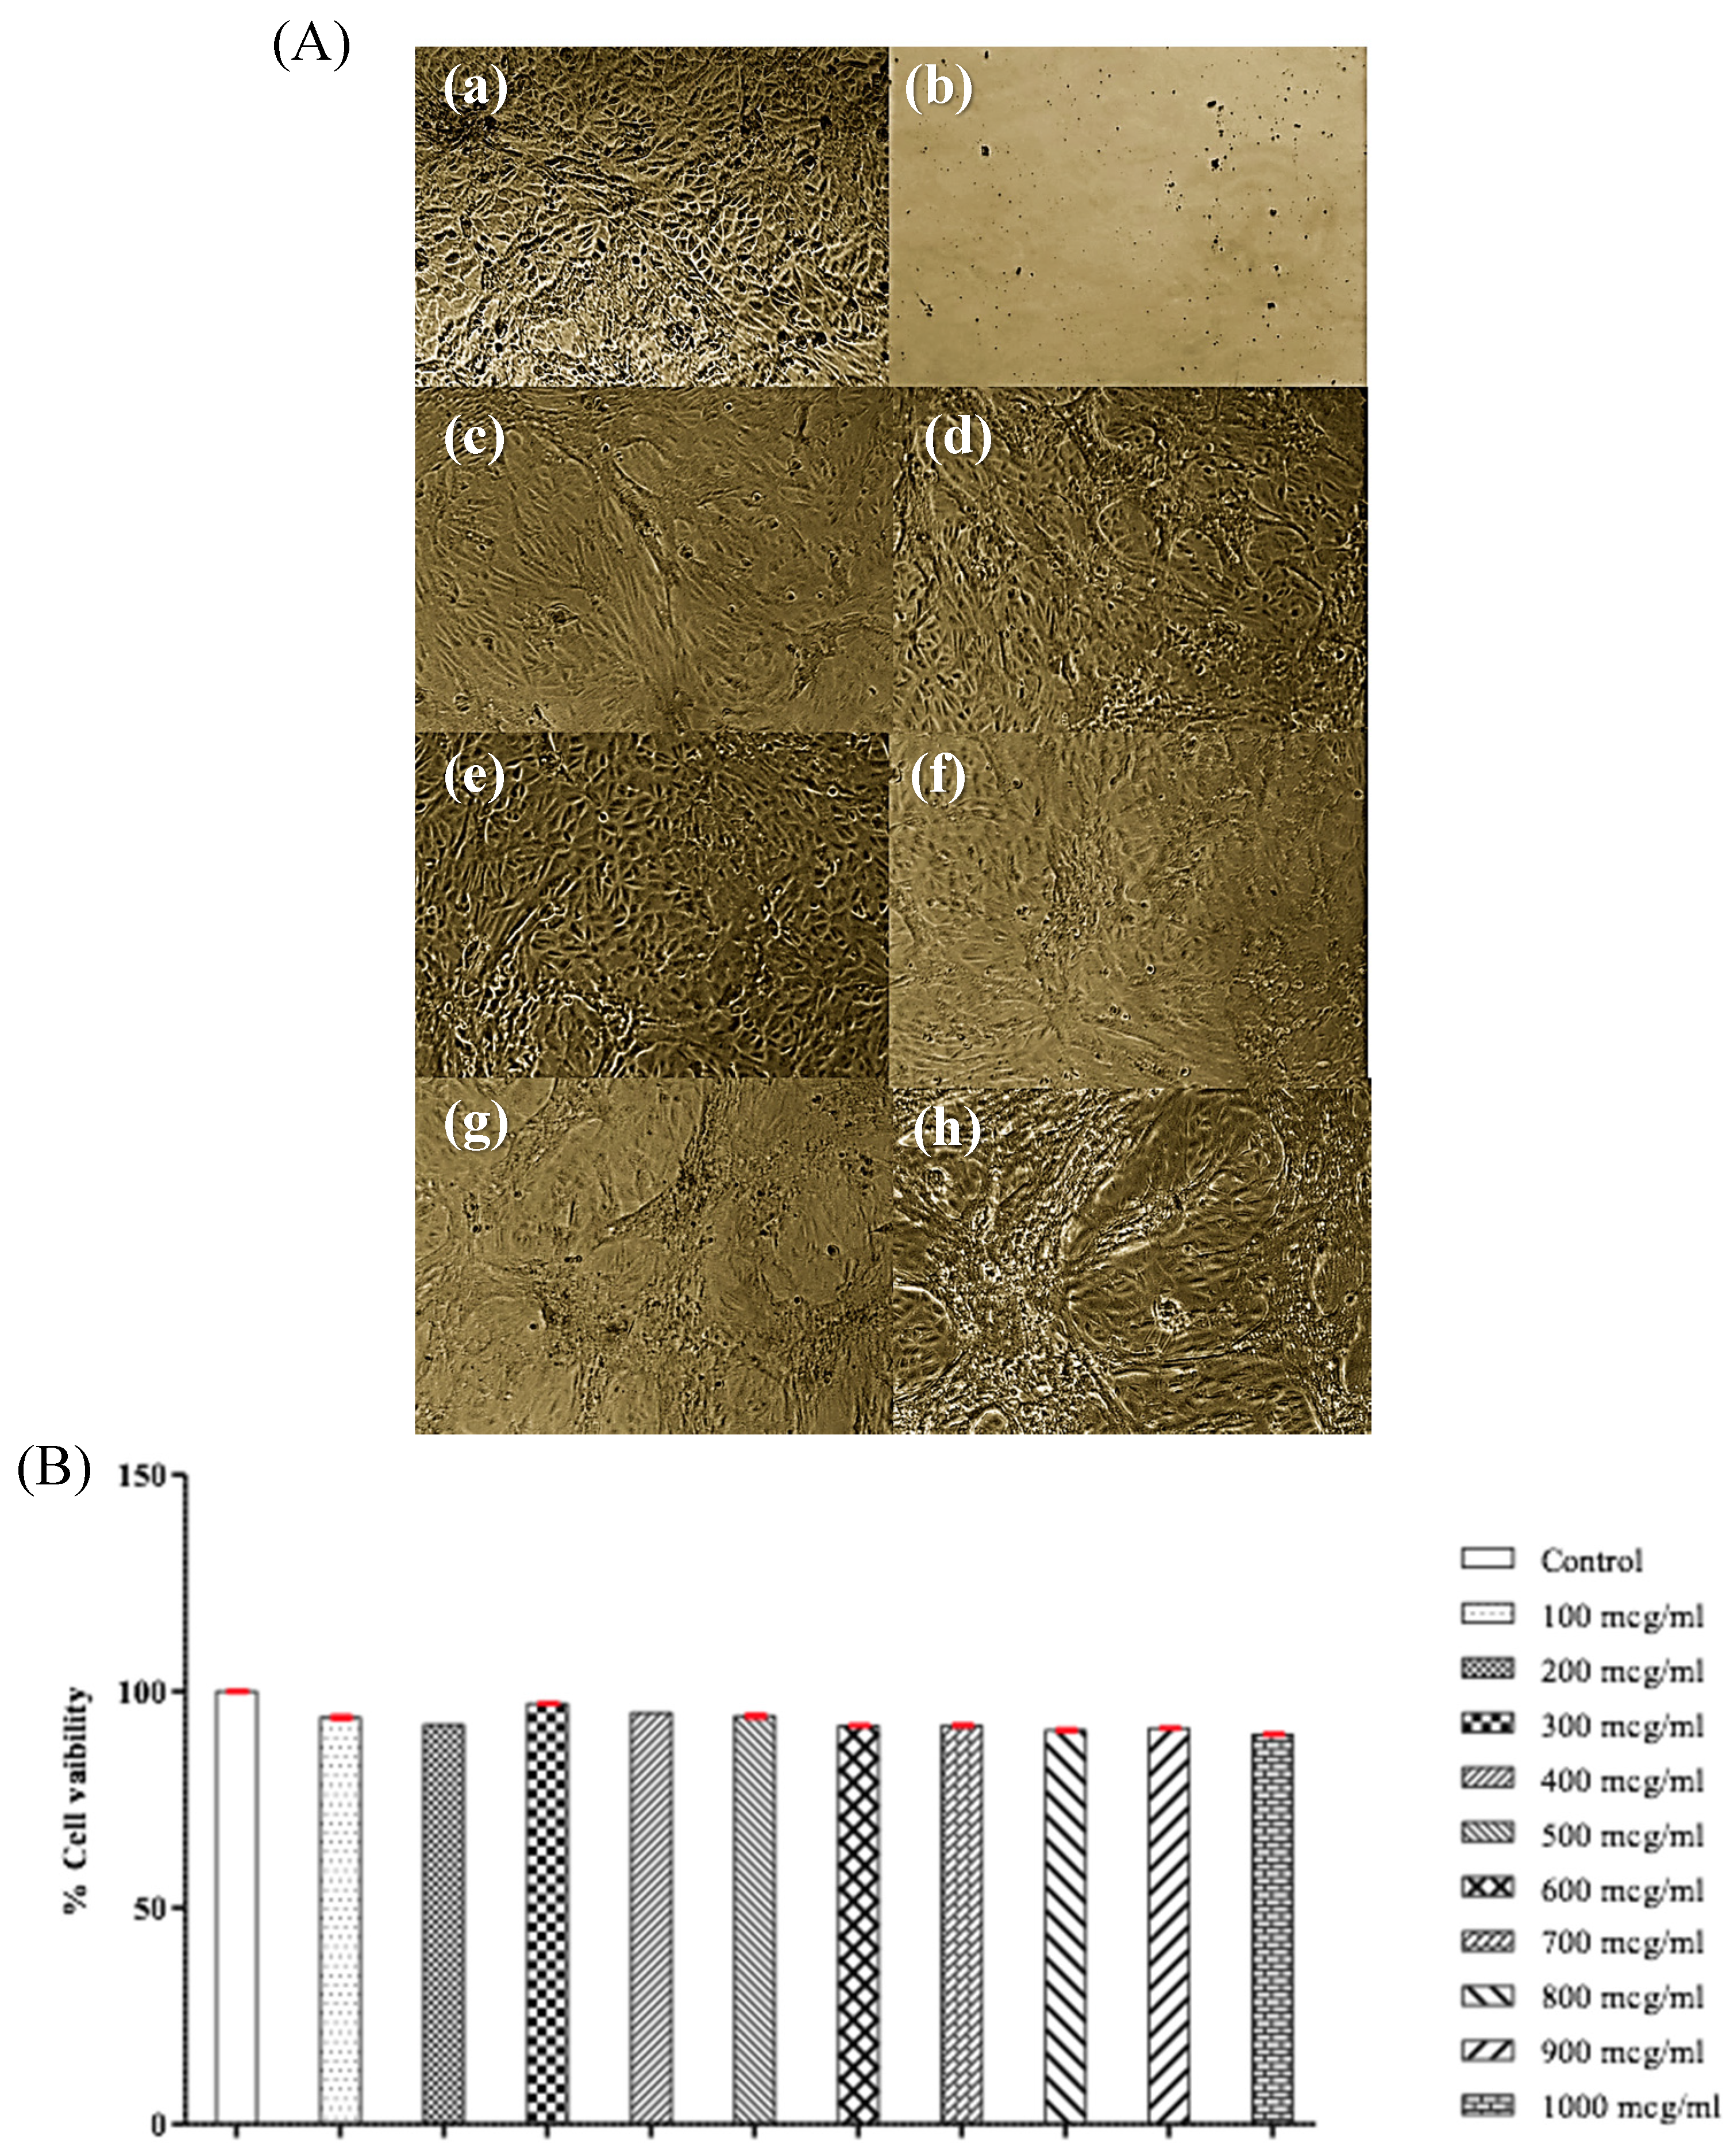
3.10. Cytotoxicity and Biocompatibility
4. Conclusions
Acknowledgments
Author Contributions
Conflicts of Interest
References
- Siracusa, V.; Rocculi, P.; Romani, S.; Dalla Rosa, M. Biodegradable polymers for food packaging: A review. Trends Food Sci. Technol. 2008, 19, 634–643. [Google Scholar] [CrossRef]
- Mathers, R.T.; Meier, M.A. Green Polymerization Methods: Renewable Starting Materials, Catalysis and Waste Reduction; John Wiley & Sons: Hoboken, NJ, USA, 2011. [Google Scholar]
- Rodionova, G.; Lenes, M.; Eriksen, Ø.; Gregersen, Ø. Surface chemical modification of microfibrillated cellulose: Improvement of barrier properties for packaging applications. Cellulose 2011, 18, 127–134. [Google Scholar] [CrossRef]
- Ilevbare, G.A.; Liu, H.; Edgar, K.J.; Taylor, L.S. Inhibition of solution crystal growth of ritonavir by cellulose polymers–factors influencing polymer effectiveness. CrystEngComm 2012, 14, 6503–6514. [Google Scholar] [CrossRef]
- Siqueira, G.; Bras, J.; Dufresne, A. Cellulosic bionanocomposites: A review of preparation, properties and applications. Polymers 2010, 2, 728–765. [Google Scholar] [CrossRef]
- Bing, L.; Zhang, Z.; Deng, K. Efficient one-pot synthesis of 5-(ethoxymethyl) furfural from fructose catalyzed by a novel solid catalyst. Ind. Eng. Chem. Res. 2012, 51, 15331–15336. [Google Scholar] [CrossRef]
- Ge, W.; Wang, X. Application of ionic liquids in lignocellulose biomass dissolution, fraction and chemical modification. Int. J. Condens. Matter Adv. Mater. Supercond. Res. 2014, 13, 369–390. [Google Scholar]
- Cox, B.J.; Ekerdt, J.G. Pretreatment of yellow pine in an acidic ionic liquid: Extraction of hemicellulose and lignin to facilitate enzymatic digestion. Bioresour. Technol. 2013, 134, 59–65. [Google Scholar] [CrossRef] [PubMed]
- Li, R.; Fei, J.; Cai, Y.; Li, Y.; Feng, J.; Yao, J. Cellulose whiskers extracted from mulberry: A novel biomass production. Carbohydr. Polym. 2009, 76, 94–99. [Google Scholar] [CrossRef]
- Revol, J.; Dietrich, A.; Goring, D. Effect of mercerization on the crystallite size and crystallinity index in cellulose from different sources. Can. J. Chem. 1987, 65, 1724–1725. [Google Scholar] [CrossRef]
- Su, Y.; Burger, C.; Ma, H.; Chu, B.; Hsiao, B. Morphological and property investigations of carboxylated cellulose nanofibers extracted from different biological species. Cellulose 2015, 22, 3127–3135. [Google Scholar] [CrossRef]
- Kargarzadeh, H.; Ahmad, I.; Abdullah, I.; Dufresne, A.; Zainudin, S.; Sheltami, R. Effects of hydrolysis conditions on the morphology, crystallinity, and thermal stability of cellulose nanocrystals extracted from kenaf bast fibers. Cellulose 2012, 19, 855–866. [Google Scholar] [CrossRef]
- Krishnan, A.; Jose, C.; George, K. Sisal nanofibril reinforced polypropylene/polystyrene blends: Morphology, mechanical, dynamic mechanical and water transmission studies. Ind. Crops Prod. 2015, 71, 173–184. [Google Scholar] [CrossRef]
- Ikkala, O.; Walther, A.; Ras, R.; Bergland, L.A. Native cellulose nanofibers: From biomimetic nanocomposites to functionalized gel spun fibers and functional aerogels. In Abstracts of Papers of the American Chemical Society, Proceedings of the 11th International Biorelated Polymer Symposium/243rd National Spring Meeting of the American-Chemical-Society (ACS), San Diego, CA, USA, 25–29 Marth 2012.
- Saleh, M.H.S.D.E.; Muhamad, M.D.I.I.; Mamat, S.N.H. Cellulose Nanofiber Isolation and Its Fabrication into Bio-Polymer-A Review. In Proceedings of the International Conference on Agricultural and Food Engineering for Life (Cafei2012), Putrajaya, Malaysia, 26–28 November 2012; p. 28.
- Maiti, S.; Jayaramudu, J.; Das, K.; Reddy, S.M.; Sadiku, R.; Ray, S.S.; Liu, D. Preparation and characterization of nano-cellulose with new shape from different precursor. Carbohydr. Polym. 2013, 98, 562–567. [Google Scholar] [CrossRef] [PubMed]
- Hall, M.; Bansal, P.; Lee, J.H.; Realff, M.J.; Bommarius, A.S. Biological pretreatment of cellulose: Enhancing enzymatic hydrolysis rate using cellulose-binding domains from cellulases. Bioresour. Technol. 2011, 102, 2910–2915. [Google Scholar] [CrossRef] [PubMed]
- Capitani, D.; Porro, F.; Segre, A. High field NMR analysis of the degree of substitution in carboxymethyl cellulose sodium salt. Carbohydr. Polym. 2000, 42, 283–286. [Google Scholar] [CrossRef]
- Lai, Y.-Z. Wood and Wood Products. In Handbook of Industrial Chemistry and Biotechnology; Springer: Berlin, Germany; Heidelberg, Germany, 2012; pp. 1057–1115. [Google Scholar]
- Oyourou, J.-N.; Combrinck, S.; Regnier, T.; Marston, A. Purification, stability and antifungal activity of verbascoside from Lippia javanica and Lantana camara leaf extracts. Ind. Crops Prod. 2013, 43, 820–826. [Google Scholar] [CrossRef]
- Finkenstadt, V.L. A Review on the Complete Utilization of the Sugarbeet. Sugar Tech 2014, 16, 339–346. [Google Scholar] [CrossRef]
- Haleem, N.; Arshad, M.; Shahid, M.; Tahir, M.A. Synthesis of carboxymethyl cellulose from waste of cotton ginning industry. Carbohydr. Polym. 2014, 113, 249–255. [Google Scholar] [CrossRef] [PubMed]
- Heinze, T.; Liebert, T.; Klüfers, P.; Meister, F. Carboxymethylation of cellulose in unconventional media. Cellulose 1999, 6, 153–165. [Google Scholar] [CrossRef]
- Biswas, A.; Kim, S.; Selling, G.W.; Cheng, H. Conversion of agricultural residues to carboxymethylcellulose and carboxymethylcellulose acetate. Ind. Crops Prod. 2014, 60, 259–265. [Google Scholar] [CrossRef]
- Pushpamalar, V.; Langford, S.J.; Ahmad, M.; Hashim, K.; Lim, Y.Y. Preparation of carboxymethyl sago pulp hydrogel from sago waste by electron beam irradiation and swelling behavior in water and various pH media. J. Appl. Polym. Sci. 2013, 128, 451–459. [Google Scholar] [CrossRef] [Green Version]
- Anastas, P.T.; Warner, J.C. Green Chemistry: Theory and Practice; Oxford University Press: New York, NY, USA, 2000. [Google Scholar]
- Wenz, G.; Liepold, P.; Bordeanu, N. Synthesis and SAM formation of water soluble functional carboxymethylcelluloses: thiosulfates and thioethers. Cellulose 2005, 12, 85–96. [Google Scholar] [CrossRef]
- Miranda, I.; Gominho, J.; Mirra, I.; Pereira, H. Fractioning and chemical characterization of barks of Betula pendula and Eucalyptus globulus. Ind. Crops Prod. 2013, 41, 299–305. [Google Scholar] [CrossRef]
- He, Y.; Pang, Y.; Liu, Y.; Li, X.; Wang, K. Physicochemical characterization of rice straw pretreated with sodium hydroxide in the solid state for enhancing biogas production. Energy Fuels 2008, 22, 2775–2781. [Google Scholar] [CrossRef]
- Pushpamalar, V.; Langford, S.; Ahmad, M.; Lim, Y.Y. Optimization of reaction conditions for preparing carboxymethyl cellulose from sago waste. Carbohydr. Polym. 2006, 64, 312–318. [Google Scholar] [CrossRef]
- Zhou, J.; Zhang, L. Solubility of cellulose in NaOH/urea aqueous solution. Polym. J. 2000, 32, 866–870. [Google Scholar] [CrossRef]
- Bao, D.; Chen, M.; Wang, H.; Wang, J.; Liu, C.; Sun, R. Preparation and characterization of double crosslinked hydrogel films from carboxymethylchitosan and carboxymethylcellulose. Carbohydr. Polym. 2014, 110, 113–120. [Google Scholar] [CrossRef] [PubMed]
- Morán, J.I.; Alvarez, V.A.; Cyras, V.P.; Vázquez, A. Extraction of cellulose and preparation of nanocellulose from sisal fibers. Cellulose 2008, 15, 149–159. [Google Scholar] [CrossRef]
- Mammino, L.; Kabanda, M.M. A study of the intramolecular hydrogen bond in acylphloroglucinols. J. Mol. Struct. Theochem 2009, 901, 210–219. [Google Scholar] [CrossRef]
- Schulz, H.; Baranska, M. Identification and quantification of valuable plant substances by IR and Raman spectroscopy. Vib. Spectrosc. 2007, 43, 13–25. [Google Scholar] [CrossRef]
- Wu, L.M.; Tong, D.S.; Zhao, L.Z.; Yu, W.H.; Zhou, C.H.; Wang, H. Fourier transform infrared spectroscopy analysis for hydrothermal transformation of microcrystalline cellulose on montmorillonite. Appl. Clay Sci. 2014, 95, 74–82. [Google Scholar] [CrossRef]
- Singh, R.; Kant, K.; Mahto, V. Study of the Gelation and Rheological Behavior of Carboxymethyl Cellulose-Polyacrylamide Graft Copolymer Hydrogel. J. Dispers. Sci. Technol. 2015, 36, 877–884. [Google Scholar] [CrossRef]
- Park, H.-R.; Ghafoor, K.; Lee, D.; Kim, S.; Kim, S.-H.; Park, J. β-Glycosidase-assisted bioconversion of ginsenosides in purified crude saponin and extracts from red ginseng (Panax ginseng C.A.Meyer). Food Sci. Biotechnol. 2013, 22, 1629–1638. [Google Scholar] [CrossRef]
- Haafiz, M.M.; Hassan, A.; Zakaria, Z.; Inuwa, I. Isolation and characterization of cellulose nanowhiskers from oil palm biomass microcrystalline cellulose. Carbohydr. Polym. 2014, 103, 119–125. [Google Scholar] [CrossRef] [PubMed]
- Haafiz, M.M.; Eichhorn, S.; Hassan, A.; Jawaid, M. Isolation and characterization of microcrystalline cellulose from oil palm biomass residue. Carbohydr. Polym. 2013, 93, 628–634. [Google Scholar] [CrossRef] [PubMed] [Green Version]
- Huang, Y.-B.; Fu, Y. Hydrolysis of cellulose to glucose by solid acid catalysts. Green Chem. 2013, 15, 1095–1111. [Google Scholar] [CrossRef]
- Koo, B.; Kim, H.; Cho, Y.; Lee, K.T.; Choi, N.S.; Cho, J. A Highly Cross-Linked Polymeric Binder for High-Performance Silicon Negative Electrodes in Lithium Ion Batteries. Angew. Chem. Int. Ed. 2012, 51, 8762–8767. [Google Scholar] [CrossRef] [PubMed]
- Gašparovič, L.; Koreňová, Z.; Jelemenský, Ľ. Kinetic study of wood chips decomposition by TGA. Chem. Pap. 2010, 64, 174–181. [Google Scholar] [CrossRef]
- Hamdaoui, L.; Moussaouiti, M.; Gmouh, S. Preparation and characterization of cellulose p-phenylbenzoate by two-step synthesis from microcrystalline and kraft cellulose. Polym. Bull. 2015, 72, 1–12. [Google Scholar] [CrossRef]
- Barneto, A.; Vila, C.; Ariza, J.; Vidal, T. Thermogravimetric measurement of amorphous cellulose content in flax fibre and flax pulp. Cellulose 2011, 18, 17–31. [Google Scholar] [CrossRef]
- Sen, U.K.; Mitra, S. High-rate and high-energy-density lithium-ion battery anode containing 2D MoS2 nanowall and cellulose binder. ACS Appl. Mater. Interfaces 2013, 5, 1240–1247. [Google Scholar] [CrossRef] [PubMed]
- Paunonen, S. Strength and barrier enhancements of cellophane and cellulose derivative films: A review. BioResources 2013, 8, 3098–3121. [Google Scholar] [CrossRef]
- Von Schantz, L.; Schagerlöf, H.; Karlsson, E.N.; Ohlin, M. Characterization of the substitution pattern of cellulose derivatives using carbohydrate-binding modules. BMC Biotechnol. 2014, 14, 113. [Google Scholar] [CrossRef] [PubMed]
- Merkel, K.; Rydarowski, H.; Kazimierczak, J.; Bloda, A. Processing and characterization of reinforced polyethylene composites made with lignocellulosic fibres isolated from waste plant biomass such as hemp. Compos. Part B Eng. 2014, 67, 138–144. [Google Scholar] [CrossRef]
- Zhuang, C.; Tao, F.; Cui, Y. Anti-degradation gelatin films crosslinked by active ester based on cellulose. RSC Adv. 2015, 5, 52183–52193. [Google Scholar] [CrossRef]
- Neto, W.P.F.; Silvério, H.A.; Vieira, J.G.; da Costa e Silva Alves, H.; Pasquini, D.; de Assunção, R.M.N.; Dantas, N.O. Macromolecular Symposia. In Preparation and Characterization of Nanocomposites of Carboxymethyl Cellulose Reinforced with Cellulose Nanocrystals; Wiley Online Library: Weinheim, Germany, 2012; pp. 93–98. [Google Scholar]
- Tzia, C.; Giannou, V.; Lebesi, D.; Cranioti, C. Chemistry and Functional Properties of Carbohydrates and Sugars (Monosaccharides, Disaccharides, and Polysaccharides); CRC Press, Taylor & Francis Group: Park Drive, Abingdon, UK, 2012. [Google Scholar]
- Lazik, W.; Heinze, T.; Pfeiffer, K.; Albrecht, G.; Mischnick, P. Starch derivatives of a high degree of functionalization. VI. Multistep carboxymethylation. J. Appl. Polym. Sci. 2002, 86, 743–752. [Google Scholar] [CrossRef]
- Kono, H. Characterization and properties of carboxymethyl cellulose hydrogels crosslinked by polyethylene glycol. Carbohydr. Polym. 2014, 106, 84–93. [Google Scholar] [CrossRef] [PubMed]
- Isogai, A.; Usuda, M.; Kato, T.; Uryu, T.; Atalla, R.H. Solid-state CP/MAS carbon-13 NMR study of cellulose polymorphs. Macromolecules 1989, 22, 3168–3172. [Google Scholar] [CrossRef]
- Silva, L.S.; Lima, L.C.; Silva, F.C.; Matos, J.M.E.; Santos, M.R.M.; Júnior, L.S.S.; Sousa, K.S.; da Silva Filho, E.C. Dye anionic sorption in aqueous solution onto a cellulose surface chemically modified with aminoethanethiol. Chem. Eng. J. 2013, 218, 89–98. [Google Scholar] [CrossRef]
- Balakshin, M.; Capanema, E.; Gracz, H.; Chang, H.-M.; Jameel, H. Quantification of lignin–carbohydrate linkages with high-resolution NMR spectroscopy. Planta 2011, 233, 1097–1110. [Google Scholar] [CrossRef] [PubMed]
- Waring, M.; Parsons, D. Physico-chemical characterisation of carboxymethylated spun cellulose fibres. Biomaterials 2001, 22, 903–912. [Google Scholar] [CrossRef]
- Heinze, T.; Koschella, A. Macromolecular Symposia. In Carboxymethyl Ethers of Cellulose and starch–A Review; Wiley Online Library: Weinheim, Germany, 2005; pp. 13–40. [Google Scholar]
- Sheldon, R.A. Fundamentals of green chemistry: efficiency in reaction design. Chem. Soc. Rev. 2012, 41, 1437–1451. [Google Scholar] [CrossRef] [PubMed]
- Adinugraha, M.P.; Marseno, D.W. Synthesis and characterization of sodium carboxymethylcellulose from cavendish banana pseudo stem (Musa cavendishii LAMBERT). Carbohydr. Polym. 2005, 62, 164–169. [Google Scholar] [CrossRef]
- Nomura, H.; Koda, S.; Hattori, F. Viscosity of aqueous solutions of polysaccharides and their carboxylate derivatives. J. Appl. Polym. Sci. 1990, 41, 2959–2969. [Google Scholar] [CrossRef]
- Dumitriu, S. Polysaccharides as biomaterials. Polym. Biomater. 2001, 29, 1–61. [Google Scholar]
- Rando, R.F.; Obara, S.; Osterling, M.C.; Mankowski, M.; Miller, S.R.; Ferguson, M.L.; Krebs, F.C.; Wigdahl, B.; Labib, M.; Kokubo, H. Critical design features of phenyl carboxylate-containing polymer microbicides. Antimicrob. Agents Chemother. 2006, 50, 3081–3089. [Google Scholar] [CrossRef] [PubMed]


| Methods | Components Analysed |
|---|---|
| ASTM D 1102-84 | ash content |
| ASTM D 11 11-84 | hot water extractives |
| modified ASTM D 1 107-84 | ethanol/toluene extractives |
| TAPPI 223 cm-84 | Pentosan |
| ASTM D 1106-84 | Lignin content |
| TAPPI T-203 0s-74 | α-cellulose |
| ISO 5351-11998 | The viscosity average degree of polymerization of α-cellulose (DPv) |
| Fraction | % Dry Sago Biomass (% DSB) |
|---|---|
| Ash | 8.00 |
| Ethanol toluene extractives | 2.30 |
| Hot water extractives | 5.20 |
| Xylan (HPLC) | 5.98 |
| Arabinan (HPLC) | 3.10 |
| Klason lignin | 8.10 |
| Chlorite holocellulose | 55.10 |
| α-cellulose | 33.70 |
| Cellulose Composition | Standard Method | Method 1 | Method 2 | Method 3 | Method 4 | Method 5 |
|---|---|---|---|---|---|---|
| Lignin (%) | TAPPI T 15 os-80 oos-80 | 0.56 | 5.20 | 4.58 | 10.26 | 3.60 |
| α-Cellulose (%) (%) | TAPPI T203 om-93 | 93.60 | 70.40 | 90.80 | 92.60 | 87.80 |
| ISO brightness | ISO 3688-1999 | 94.61 | 90.10 | 86.85 | 88.77 | 80.03 |
| Intrinsic Viscosity (mL/g) | Viscosity measurement | 1400–1650 | 525–600 | 600–850 | 550–610 | 700 |
| Crystallinity(2θ) | X-ray diffraction | 0.63 | 0.59 | 0.64 | 0.63 | 0.45 |
| Total yield of cellulose % | HPLC | 5.38 | 10.17 | 7.09 | 3.53 | 8.80 |
| Sample | Degree of Substitution (DS) | Moisture Content (%) | pH | NaOH Content (%) | Tapped Density/g/mL | Solubility/% | Molar Mass (Mw)/(×104) g/mol |
|---|---|---|---|---|---|---|---|
| 1 | 0.59 ± 0.01 | 8.23 ± 0.94 | 9.76 | 1.36 ± 0.21 | 11.02 | 93.06 | 5.8 |
| 2 | 0.61 ± 0.03 | 7.78 ± 0.66 | 9.63 | 1.43± 0.25 | 11.50 | 94.45 | 6.7 |
| 3 | 0.63 ± 0.02 | 8.32 ± 0.77 | 9.70 | 1.27± 0.27 | 12.12 | 94.34 | 6.2 |
| Average | 0.61 ± 0.02 | 8.11 ± 0.79 | 9.70 | 1.35 ± 0.24 | 11.55 | 93.95 | 6.2 |
| Sample | Concentration of Na (ppb) | Concentration of Al (ppb) | Concentration of Mg (ppb) | Concentration of K (ppb) | Concentration of Ca (ppb) |
|---|---|---|---|---|---|
| Average | 14,540.00 ± 141.42 | 12.35 ± 6.81 | 18.08 ± 12.78 | 1125.80 ± 212.41 | 25.70 ± 3.42 |
| Sample | Average Value | ||||||
|---|---|---|---|---|---|---|---|
| L0 * | a0 * | b0 * | L * | a * | b * | ∆E | |
| 1 | - | - | - | 89.40 | 0.93 | 13.30 | 0.1068 |
| 2 | - | - | - | 89.43 | 0.94 | 13.22 | 0.1581 |
| 3 | - | - | - | 89.43 | 0.93 | 13.37 | 0.0510 |
| Commercial CMC | 89.48 | 0.94 | 13.37 | - | - | - | - |
| Average | 0.1053 | ||||||
© 2016 by the authors; licensee MDPI, Basel, Switzerland. This article is an open access article distributed under the terms and conditions of the Creative Commons Attribution (CC-BY) license (http://creativecommons.org/licenses/by/4.0/).
Share and Cite
Veeramachineni, A.K.; Sathasivam, T.; Muniyandy, S.; Janarthanan, P.; Langford, S.J.; Yan, L.Y. Optimizing Extraction of Cellulose and Synthesizing Pharmaceutical Grade Carboxymethyl Sago Cellulose from Malaysian Sago Pulp. Appl. Sci. 2016, 6, 170. https://0-doi-org.brum.beds.ac.uk/10.3390/app6060170
Veeramachineni AK, Sathasivam T, Muniyandy S, Janarthanan P, Langford SJ, Yan LY. Optimizing Extraction of Cellulose and Synthesizing Pharmaceutical Grade Carboxymethyl Sago Cellulose from Malaysian Sago Pulp. Applied Sciences. 2016; 6(6):170. https://0-doi-org.brum.beds.ac.uk/10.3390/app6060170
Chicago/Turabian StyleVeeramachineni, Anand Kumar, Thenapakiam Sathasivam, Saravanan Muniyandy, Pushpamalar Janarthanan, Steven James Langford, and Lim Yau Yan. 2016. "Optimizing Extraction of Cellulose and Synthesizing Pharmaceutical Grade Carboxymethyl Sago Cellulose from Malaysian Sago Pulp" Applied Sciences 6, no. 6: 170. https://0-doi-org.brum.beds.ac.uk/10.3390/app6060170