Article

Development of an Internet of Things Based Electrochemical Microfluidic System for Free Calcium Detection

1
School of Chemistry and Chemical Engineering, Guang Zhou University, Guangzhou 510006, China
2
School of Engineering, Macquarie University, Sydney, NSW 2109, Australia
3
AgResearch Limited, 10 Bisley Street, Hamilton West, Hamilton 3217, New Zealand
*
Author to whom correspondence should be addressed.
These authors contributed equally to this work.
Submission received: 20 July 2018 / Revised: 6 August 2018 / Accepted: 7 August 2018 / Published: 13 August 2018
(This article belongs to the Section Applied Biosciences and Bioengineering)

Abstract

:
This paper represents the design, fabrication, and implementation of an Internet of Things (IoT)-based electrochemical microfluidic system for free calcium concentration detection with a 3D printing technique. Free calcium solutions with desired concentrations between 0 and 40 µM can be obtained. The solutions were used to calibrate the system by using an impedance analyzer for monitoring the impedance change to determine the operating frequency. Continuously, an IoT enabled point of care device was used for real-time detection and to send signals to the cloud for sharing. The relationship between the concentration and reactance are y = 1.3812 Lgx + 0.9809 at a wavelength of 450 Hz, with an R2 of 0.9719. We measured the calcium concentration changing from 39.8 µM to 1.35 µM (nearly real-time) by the PoC device and showed the concentration changes resulting with time on the cell phone app. The results depicted in this paper provide a strong platform for the precise and real-time monitoring of different biomedical samples.

1. Introduction

Microfluidic devices are powerful tools for analytical chemistry, biology, diagnostics, and biomedical research. Several microfluidic devices have been developed to detect adenosine triphosphate (ATP) [1,2], nitrite [3], and bacteria [4] for Urinary tract infection detection [5]. Microfluidic devices can be miniaturized and integrated, thereby affording advantages such as easy handling, portability, and short operating time, low cost, reduced consumption of sample and reagents, and high sensitivity. Controlled volume and flow control can be achieved by the device.
The semi-conductive sensors are widely used for different applications ranging from industrial [6], environmental [7,8,9] and health monitoring [10] due to their easy operating principle, robustness, adaptability, and low-resistance contacts. The silicon sensors have been used constantly on a wide range of biomedical applications [11,12,13,14] due the ability to form devices with high sensitivity, long linear range and low limit of detection. Electrochemical biosensors are widely used as the components of portable lab-on-a-chip devices, which is one kind of the Point-of-Care (PoC) devices. They change the costly and sophisticated laboratory systems into friendly home-use devices [15,16,17]. Different applications had been achieved, especially in the fields of clinical diagnostic and environmental monitoring. This is because of their low cost, ease of use, reliability, and portability [18,19,20,21,22,23,24]. Moreover, some PoC devices can carry out real time testing which can produce results rapidly. By this way, patient-care can be improved with less costs and treatment can start more quickly [25,26].
Wireless transmissions and cloud servers enable transferring and sharing the measured data while being connected with the monitored patient, which enhances the functionalities of the sensing systems [27,28]. It is powered by the Internet of Things (IoT) concept, where all the connected objects that surround us can exchange data over a network. IoT-enabled smart devices and health services can reduce the diagnostic cost, provide real-time information to the house physician, and provide important health information without any mobility of the patient, therefore increasing their quality of life and the efficiency [26,29].
In this paper, we devised the use of silicon-based sensors integrated into the microfluidics system with 3D printing. IoT techniques were used to store and transmit the data to end-users. One of the prominent biomedical applications was where free calcium iron solutions were measured in different concentrations. Commercial calcium buffer solutions were used to calibrate the system. The determination of free calcium is very important in human and veterinary pathology and in dairy chemistry [30,31,32].

2. Materials and Methods

2.1. Materials and Apparatus

A high precision 3536 LCR meter (Hioki, Japan) was employed to conduct EIS experiments. An LCR meter is a type of electronic test equipment used to measure the inductance (L), capacitance (C), and resistance (R) of an electronic component. An Uno Wifi board (Arduino, Australia), AD5933 impedance analyzer chip (Analog Devices, Norwood, MA, USA), and an ADG849 switch chip (Analog Devices, Norwood, MA, USA) were used. Form 2 Desktop Stereolithography (SLA) 3D printer (Formlabs, Somerville, MA, USA) was used. Materials of Sylgard 184 Polydimethylsiloxane (PDMS, Dow Corning Corporation, Midland, MI, USA) and calcium calibration buffer kit (Biotium, Fremont, CA, USA) were used.

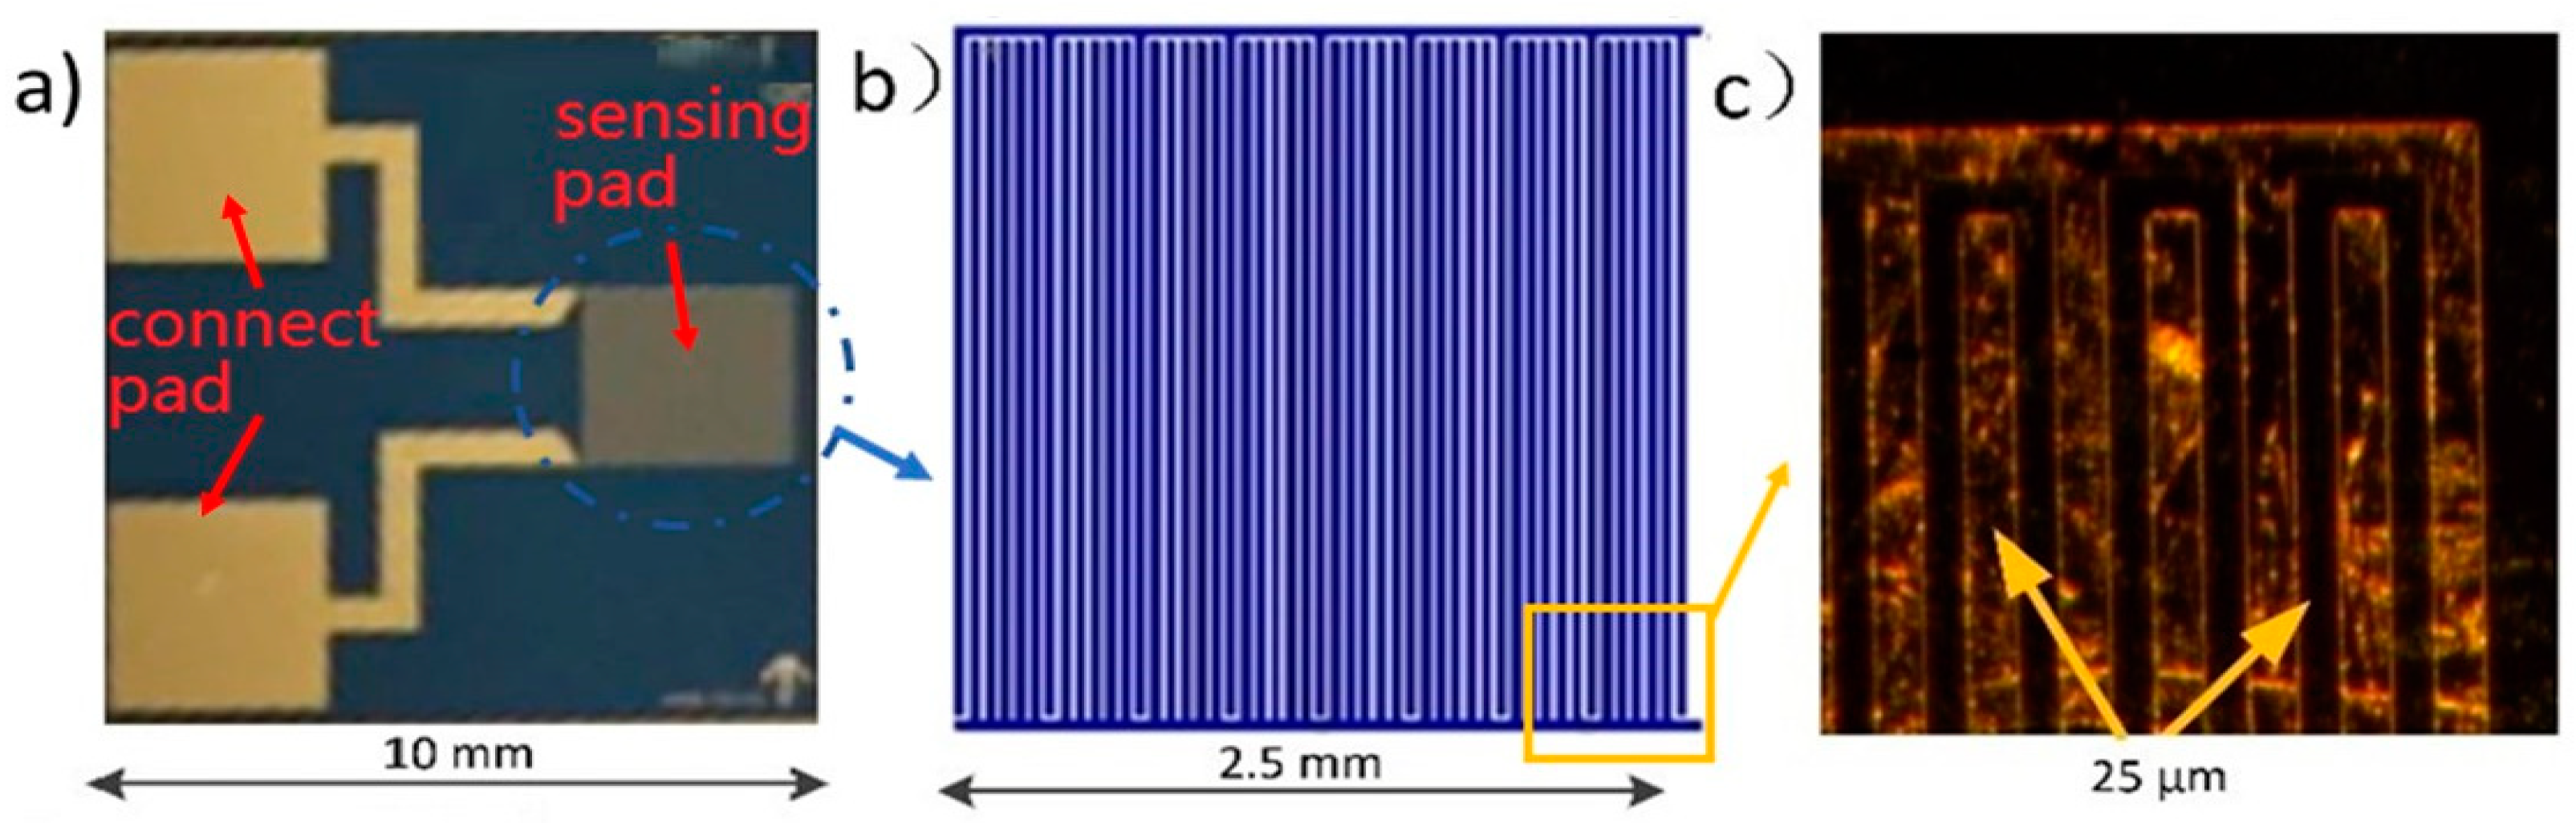
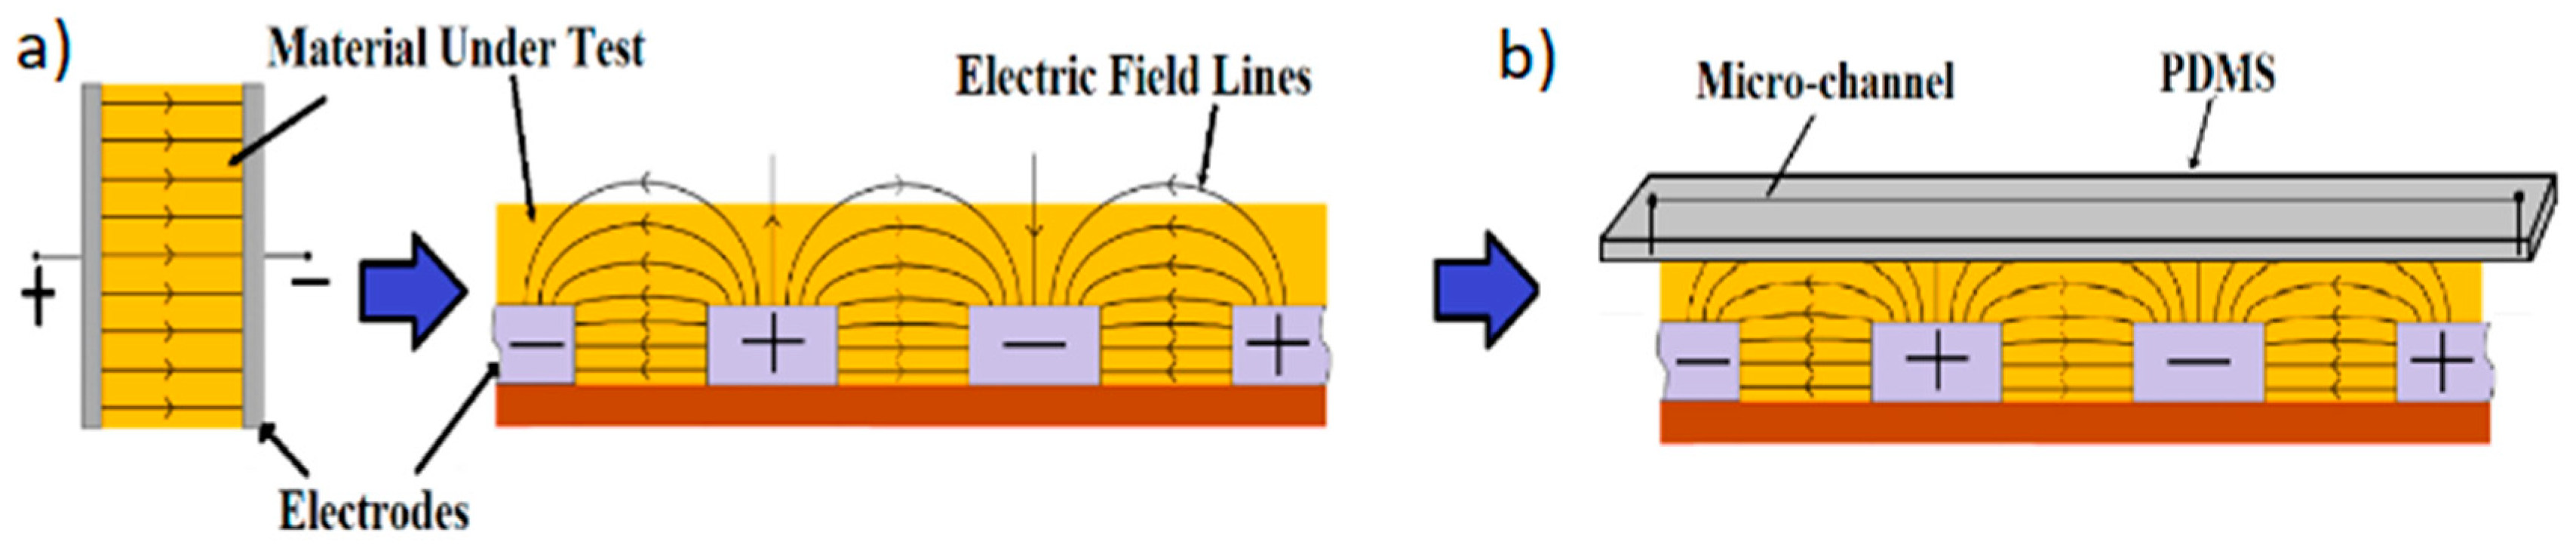
2.2. Multi-Sensing Electrode Interdigital Sensor and Electrochemical Impedance Spectroscopy (EIS) Measurement

In interdigital sensors, the penetration depth of the electric field corresponds to the spatial wavelength of the interdigital sensor [33,34]. To enhance the penetration depth, interdigitated Micro-electrodes (IDµE) can be fabricated directly on a thin layer of poly(N-isopropylacrylamide) polymer (PNIPAm)-graphene nanoplatelet (GR) composite using a shadow mask with a pre-defined pattern [35]. In this article, planar interdigital sensors with multi-sensing electrodes have been designed and fabricated [36].
Figure 1 shows the configuration of the interdigital sensor. On the top of a single 525 µm thick crystal silicon wafer, an over native silicon dioxide (SiO2) insulative layer, and a 500 nm gold (Au) layer were sputtered on top of a 22.5 nm Chromium seed layer to provide defect-free adhesion of thin film gold sensors. The dimension of each sensor is 10 mm × 10 mm (Figure 1a) with a sensing surface of 2.5 mm × 2.5 mm (Figure 1b). The zoom view of the sensing pad shows that electrodes and the gaps between electrodesare all 25-µm wide (Figure 1c).
Due to the interdigitated nature of the sensors, their working principle was based on capacitive principle. Figure 2a,b show the schematic diagram of the operating principle. The interdigitated electrodes of the silicon sensor were planar in nature to operate in a single-sided and non-invasive manner. Because of this design, when a potential difference as a function of time is applied across the electrodes, the electric field lines would bulge from one electrode to another of opposite polarity.
The impedance Z consists of a real part (resistance, R) and an imaginary part (reactance, X) that can be written as below:
Z = R + j   X
X can also be explained based on the capacitance (C) and frequency (f) as follows:
X = 1 2 π f C
where,
C = ε 0 ε r A d
A is the area of each plate, d is the distance between the plates, ε0 and εr are the dielectric constant of free space and the relative dielectric constant of the material, respectively.
If any material was kept in contact or proximity to the electrodes, the field lines penetrate through it. This changes the characteristics of the field lines, which can be studied to simultaneously determine the attributes of the material under test (MUT). In these sensors, the electric field lines penetrate through the liquid flowing through the PDMS-based microfluidic system embedded above the sensing area. The response was studied with different concentrations to determine the characteristics of the samples at different frequencies. The concentration of the MUT will determine the εr. Therefore, the capacitance (C) will be dependent on the εr if the geometry is set. By measuring the relationship between Reactance X and the frequency, we can get the capacitance C, therefore determining the concentration.

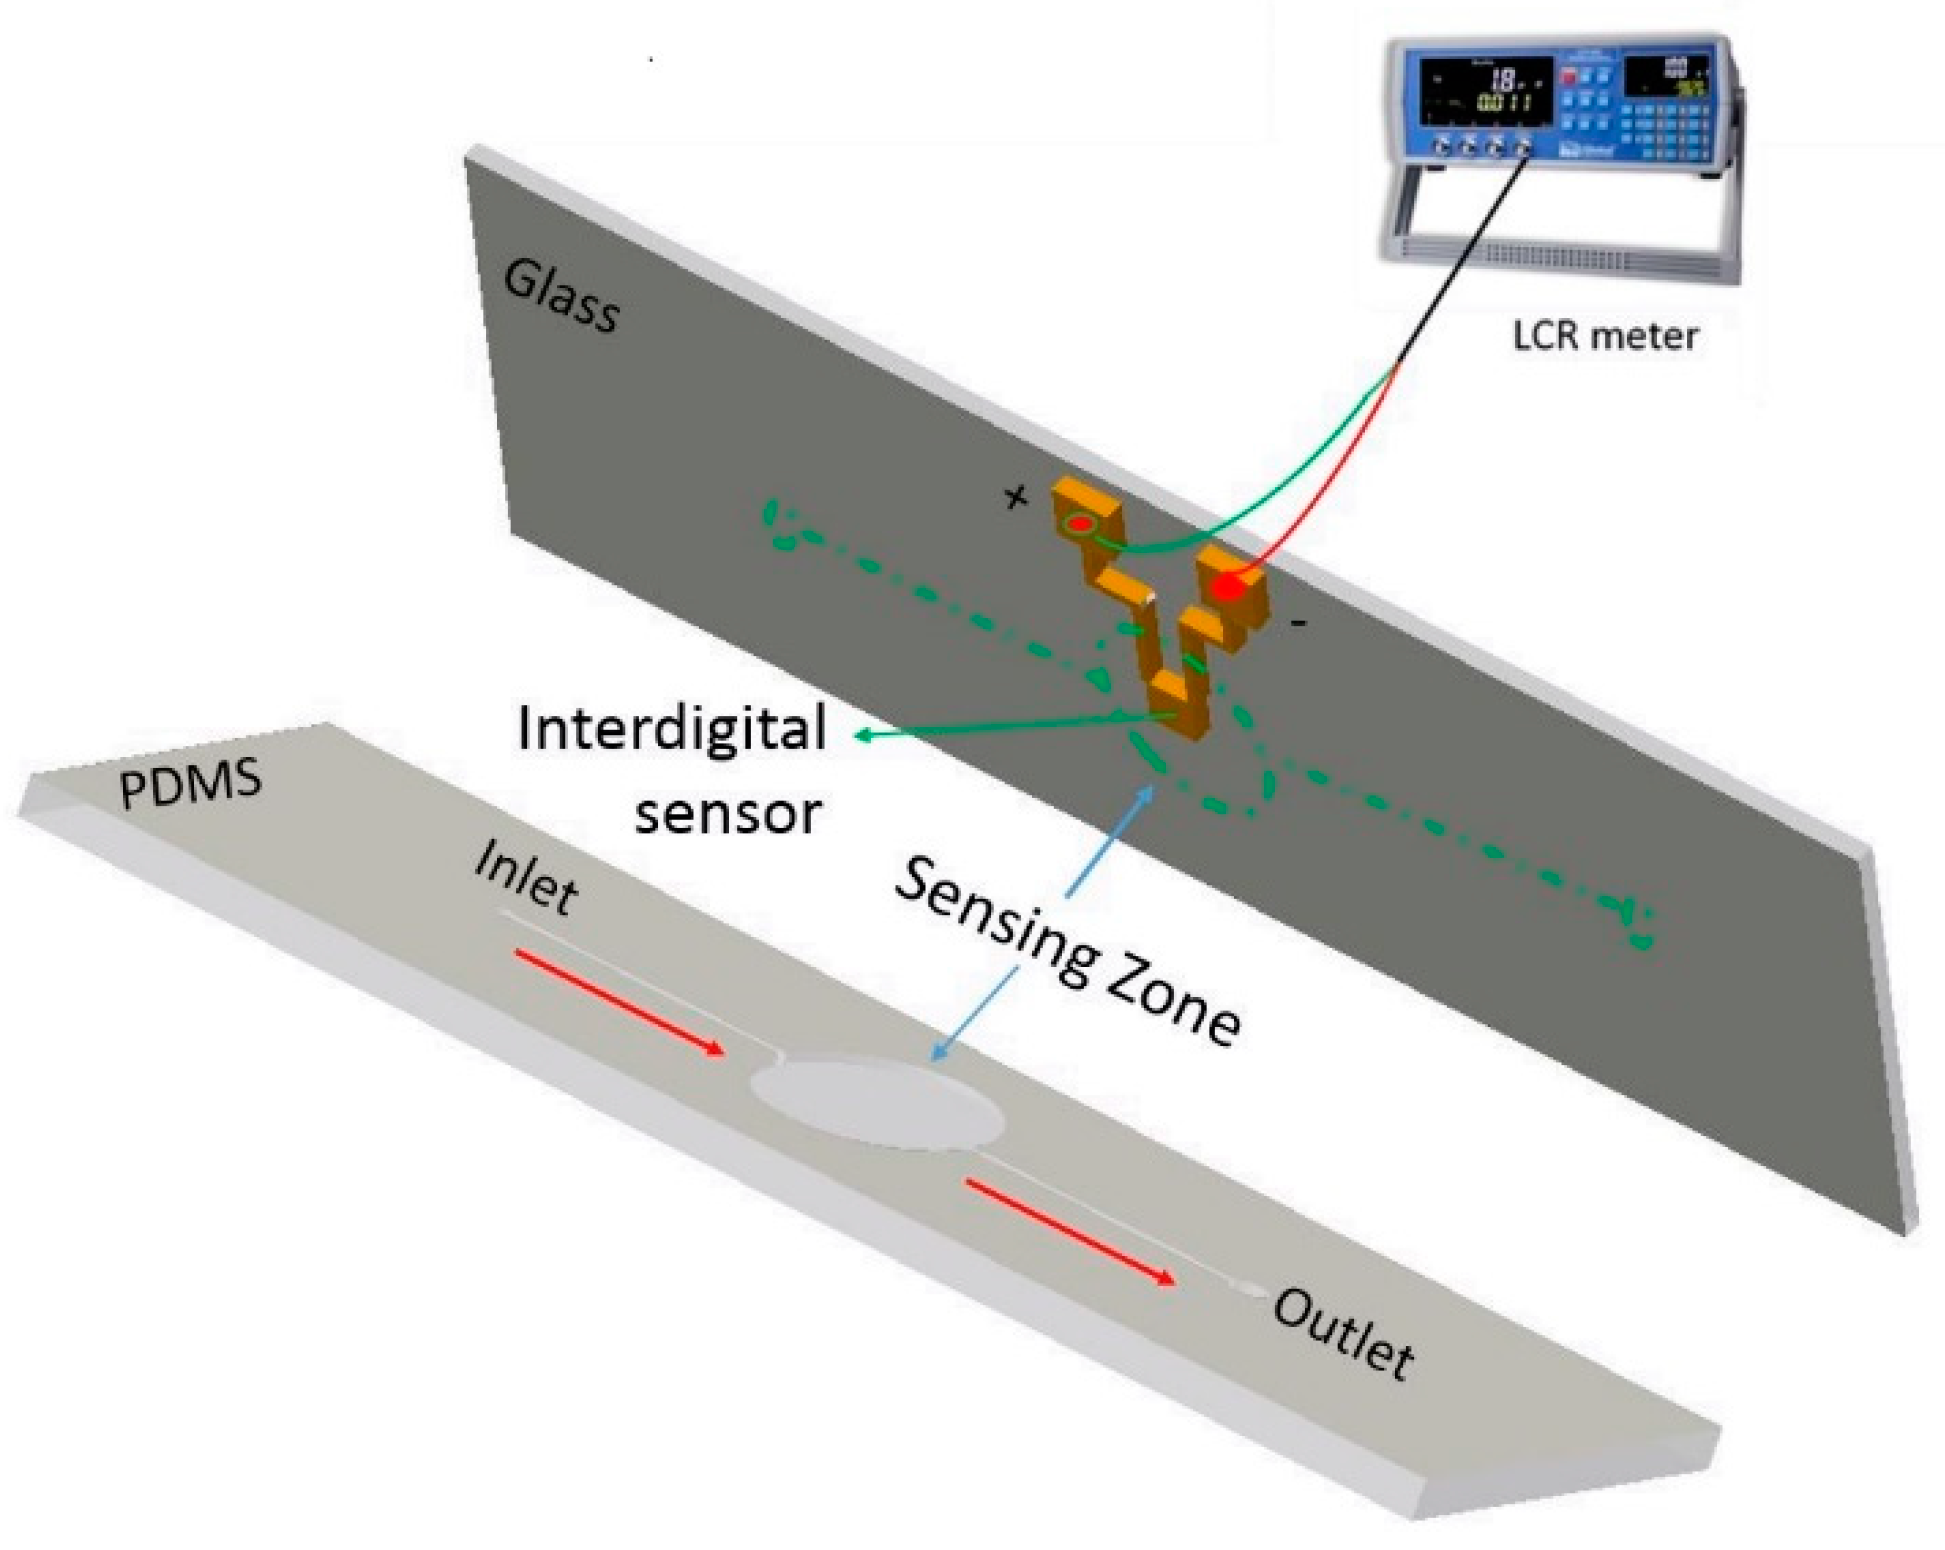
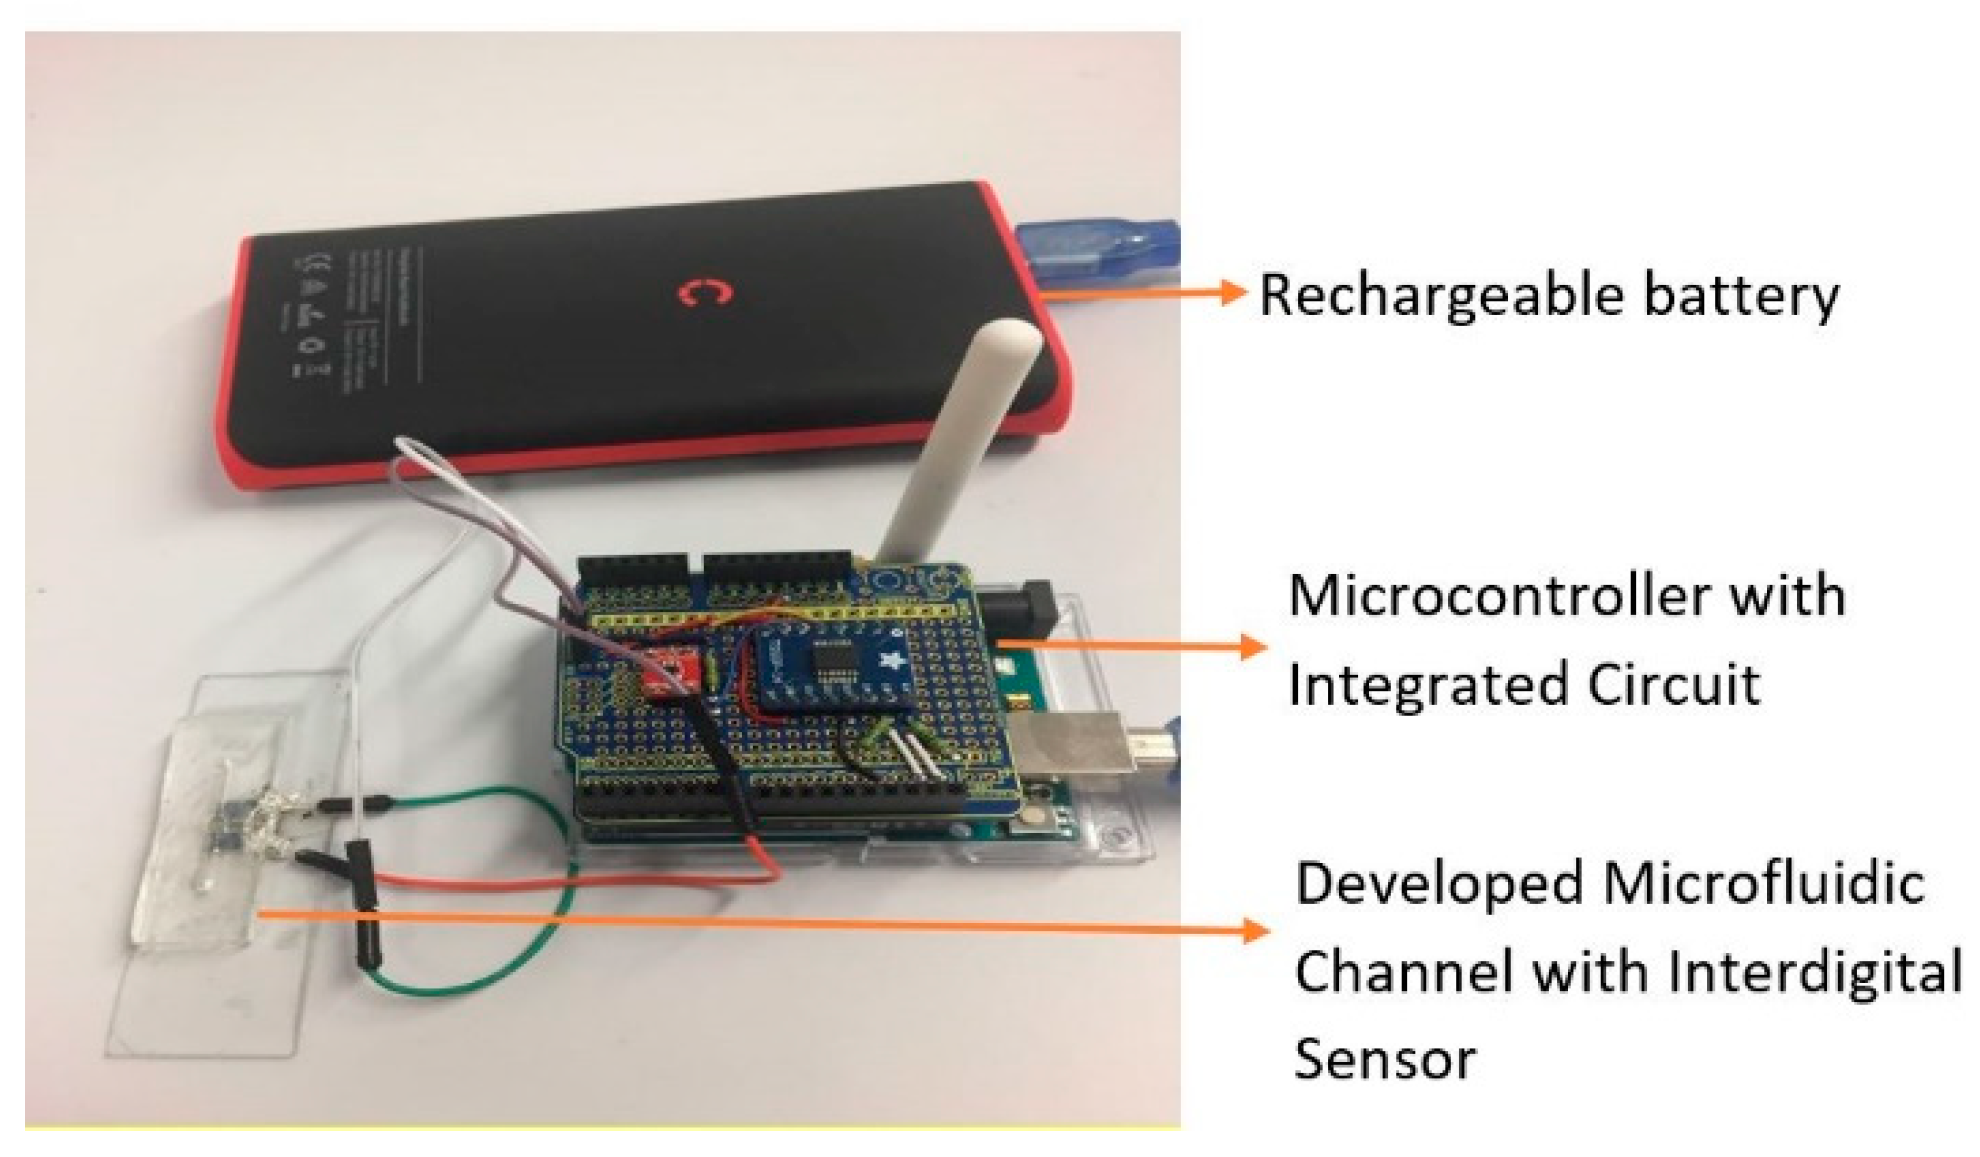
2.3. Fabrication of Microfluidics Detection System

The customized microfluidic chip, as Figure 3 shows, includes two layers: the bottom PDMS layer with a microfluidic pattern and the top PDMS layer with the sensing electrodes. For the bottom PDMS layer, the microfluidic pattern was achieved with 3D printing. The pattern includes the reaction zone with dimensions of 3 mm × 3 mm × 2.5 mm, with 2 2 mm × 1.2 mm × 10 mm channels connecting to the inlet and outlet. Afterward, PDMS was poured directly on the pattern which was left in an oven at 70 °C for 2 h for curing. Finally, the PDMS microfluidic chips were peeled off from the 3D printed mold for further use. There was one inlet, one outlet, and one reaction chamber. For the top sensing platform, liquid PDMS was poured around the electrode sensor to form a uniform layer with sensor surfaces exposure. The top layer and bottom layer were bonded to form the microfluidic chip with enclosed channels. The sensing zone was matched when bonding to keep the chamber from the sensing part of the sensor on the bottom. Two connected pad parts of the electrode sensors (Figure 1a) were connected to the two separated electrostatic wires by the silver epoxy conductive glue, which connected to the external LCR meter.
Figure 4a–f shows the individual steps of fabrication. Figure 4a shows the design of the microfluidic channel, which was done with a commercial designing software CREO Parametric 2.0 (PTC, Needham, MA, USA). A 3D printing system (Form 2: Desktop Stereolithography (SLA) 3D Printer, Formslab, Australia) was used to develop the molds that were subsequently used to form the PDMS-based microfluidic channels. The structure were drawn by Creo Parametric 2.0 (PTC, Needham, MA, USA) and exported as a stl. format. The stl. files were imported into PreForm (version 2.6.0, Formslab, Australia) software. We set the support (Density 1.6 and Point size: 0.6 mm) and orientations of the structures. The resin used was Form 2 Clear V4 Resin and it took around 24 mL for 4 devices. The print resolution was set as 100 µm and the time for printing the 4 devices was around 1.5 h. During the printing, the structures were formed on the platform under UV light in the 3D printer chamber. After the printing, the structures with the supports were easily to dispatch from the platform. Continuously, the supports under the 4 structures can be dispatched easily. The structures were immersed in isopropanol under the ultrasonic treatment for 15 min. Finally, the structures were dried by compressed air and left for further use. A layer of PDMS was cast on the developed molds by mixing the base elastomer and curing agent at a ratio of 10:1. The casted sample was cured in the oven at 70 °C for 2 h to solidify the microfluidic channel (Figure 4b). This part didn’t require the secondary polishing operation and was left in the clean environment. Figure 4c shows the PDMS bottom microfluidics layer after peeling from the mold. This structure was then embedded on top of the sensing area of a sensor. The interdigital sensors were put on the glass slide, around which PDMS was filled around the sensor with the sensing part exposed to form the top layer, as in Figure 4d. After pouring liquid PDMS around the electrode sensor, the liquid PDMS was solidified in an oven at 70 °C for 2 h. Afterwards, the PDMS on the electrode sensor part was cut by knife and peeled away and the electrode sensor part was exposed. Rather than using oxygen plasma treatment, they were bonded naturally to ensure reusability. Once both layers fulfilled the standard of cleanness, the structures were manually put together, and were then naturally bonded together. The bonded device was submerged in degassed water to store for further use. IT is noteworthy that this device was reusable after being cleaned by isopropyl alcohol and dried.
Figure 4e shows the complete structure of the electrochemical microfluidic device after bonding the top and bottom layers. Figure 4f demonstrates the connection between the microfluidic device and the detection instrument. The thickness of the detection chamber was adjusted to 3.2 mm to formulate the flow of the liquid to a volume of 22.5 µL. The height of the channels connecting the chamber to inlets and outlets was designed to be 2.5 mm in height.

2.4. Preparation of the Calcium Samples

A commercial calcium buffer kit was used. There are two components: the zero calcium buffer (10 mM K2EGTA, 100 mM KCl, and 10 mM MOPS; pH 7.20.) and the high calcium buffer (10 mM CaEGTA, 100 mM KCl, and 10 mM MOPS; pH 7.20).
A total of 0.20 mL of the 2 mL of above zero calcium solution was removed and replaced with 0.20 mL of the “high calcium solution”. The resulting solution contained 1.00 mM of total CaEGTA and 0.017 µM [Ca2+] free. Similarly, we can get 0.1, 0.15, 0.351, 0.602, 1.35, and 39.8 µM [Ca2+] free solutions.

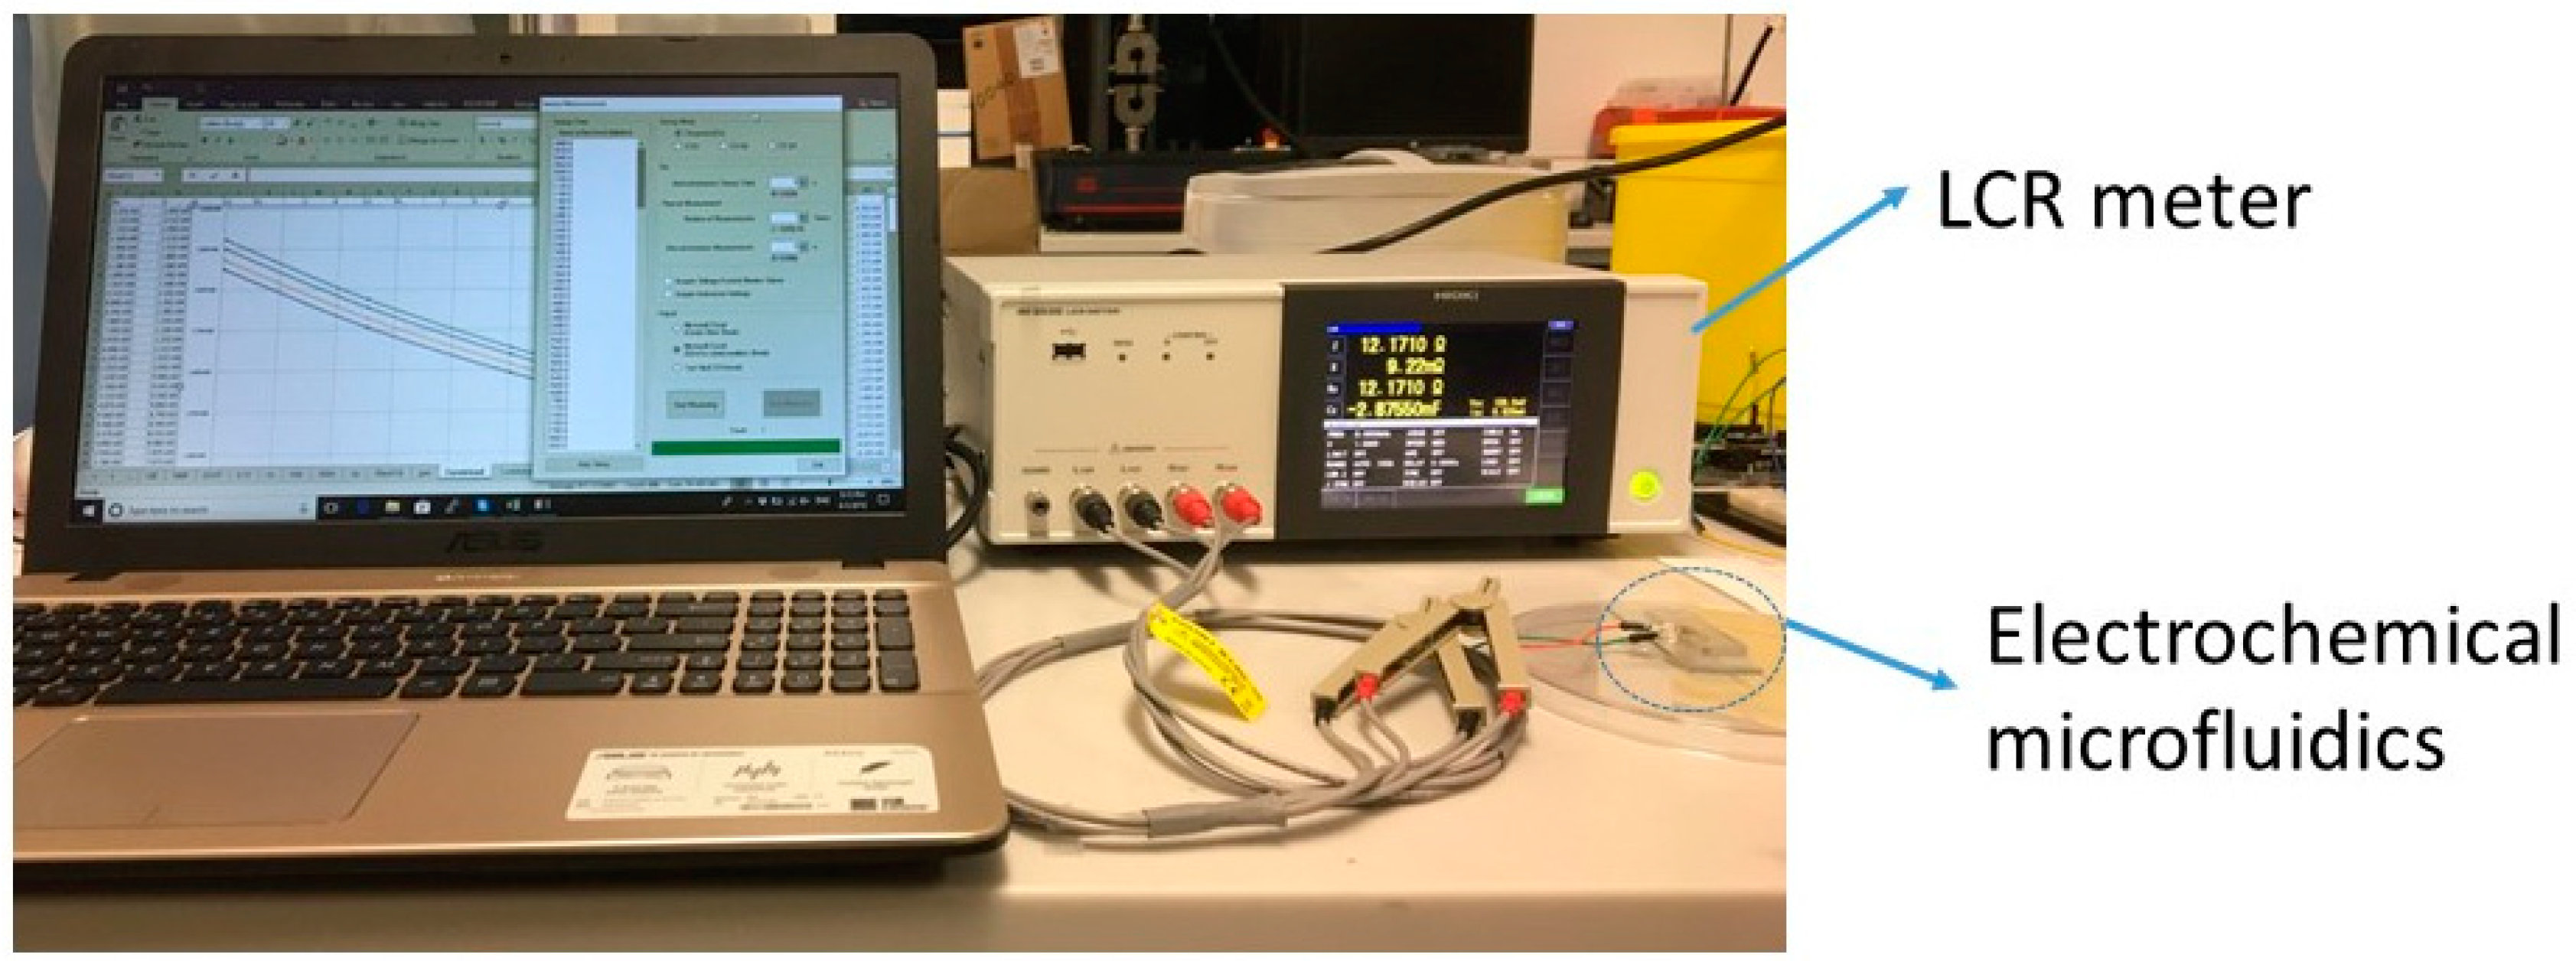
2.5. Experimental Measurements

The EIS technique was used to investigate the dielectric properties of the test samples at different concentrations. Although this measurement technique is very powerful and popular, it is sensitive to humidity and temperature. Therefore, all the experiments were conducted in a controlled laboratory under the same humidity and temperature level. An impedance analyzer (HIOKI IM3536, Hioki, Japan) was used to determine the changes taking place for different experimental samples and different frequencies. The bonding pads of the electrodes of the interdigital sensor were attached to wires with silver epoxy glue for connection purposes. These wires were connected to the impedance analyzer via Kelvin probes and the setup was kept constant during the entire experimental procedure.
As shown in Figure 5, the impedance analyzer was connected to a computer using a USB cable to collect the data in the Microsoft Office Suite® using an automated data acquisition algorithm. The sensors on the electrochemical microfluidics system were connected to the LCR meter and a 10 Hz–100 kHz signal with 1 V amplitude was given to the electrodes. Five different concentrations of prepared calcium solution were used to examine the system. Finally, the optimal frequency for the EIS measurements was chosen. It is noteworthy that the measurement was taken five times and averaged results were used for analysis.

2.6. Electrochemical Impedance Monitoring Using the Microcontroller-Based System

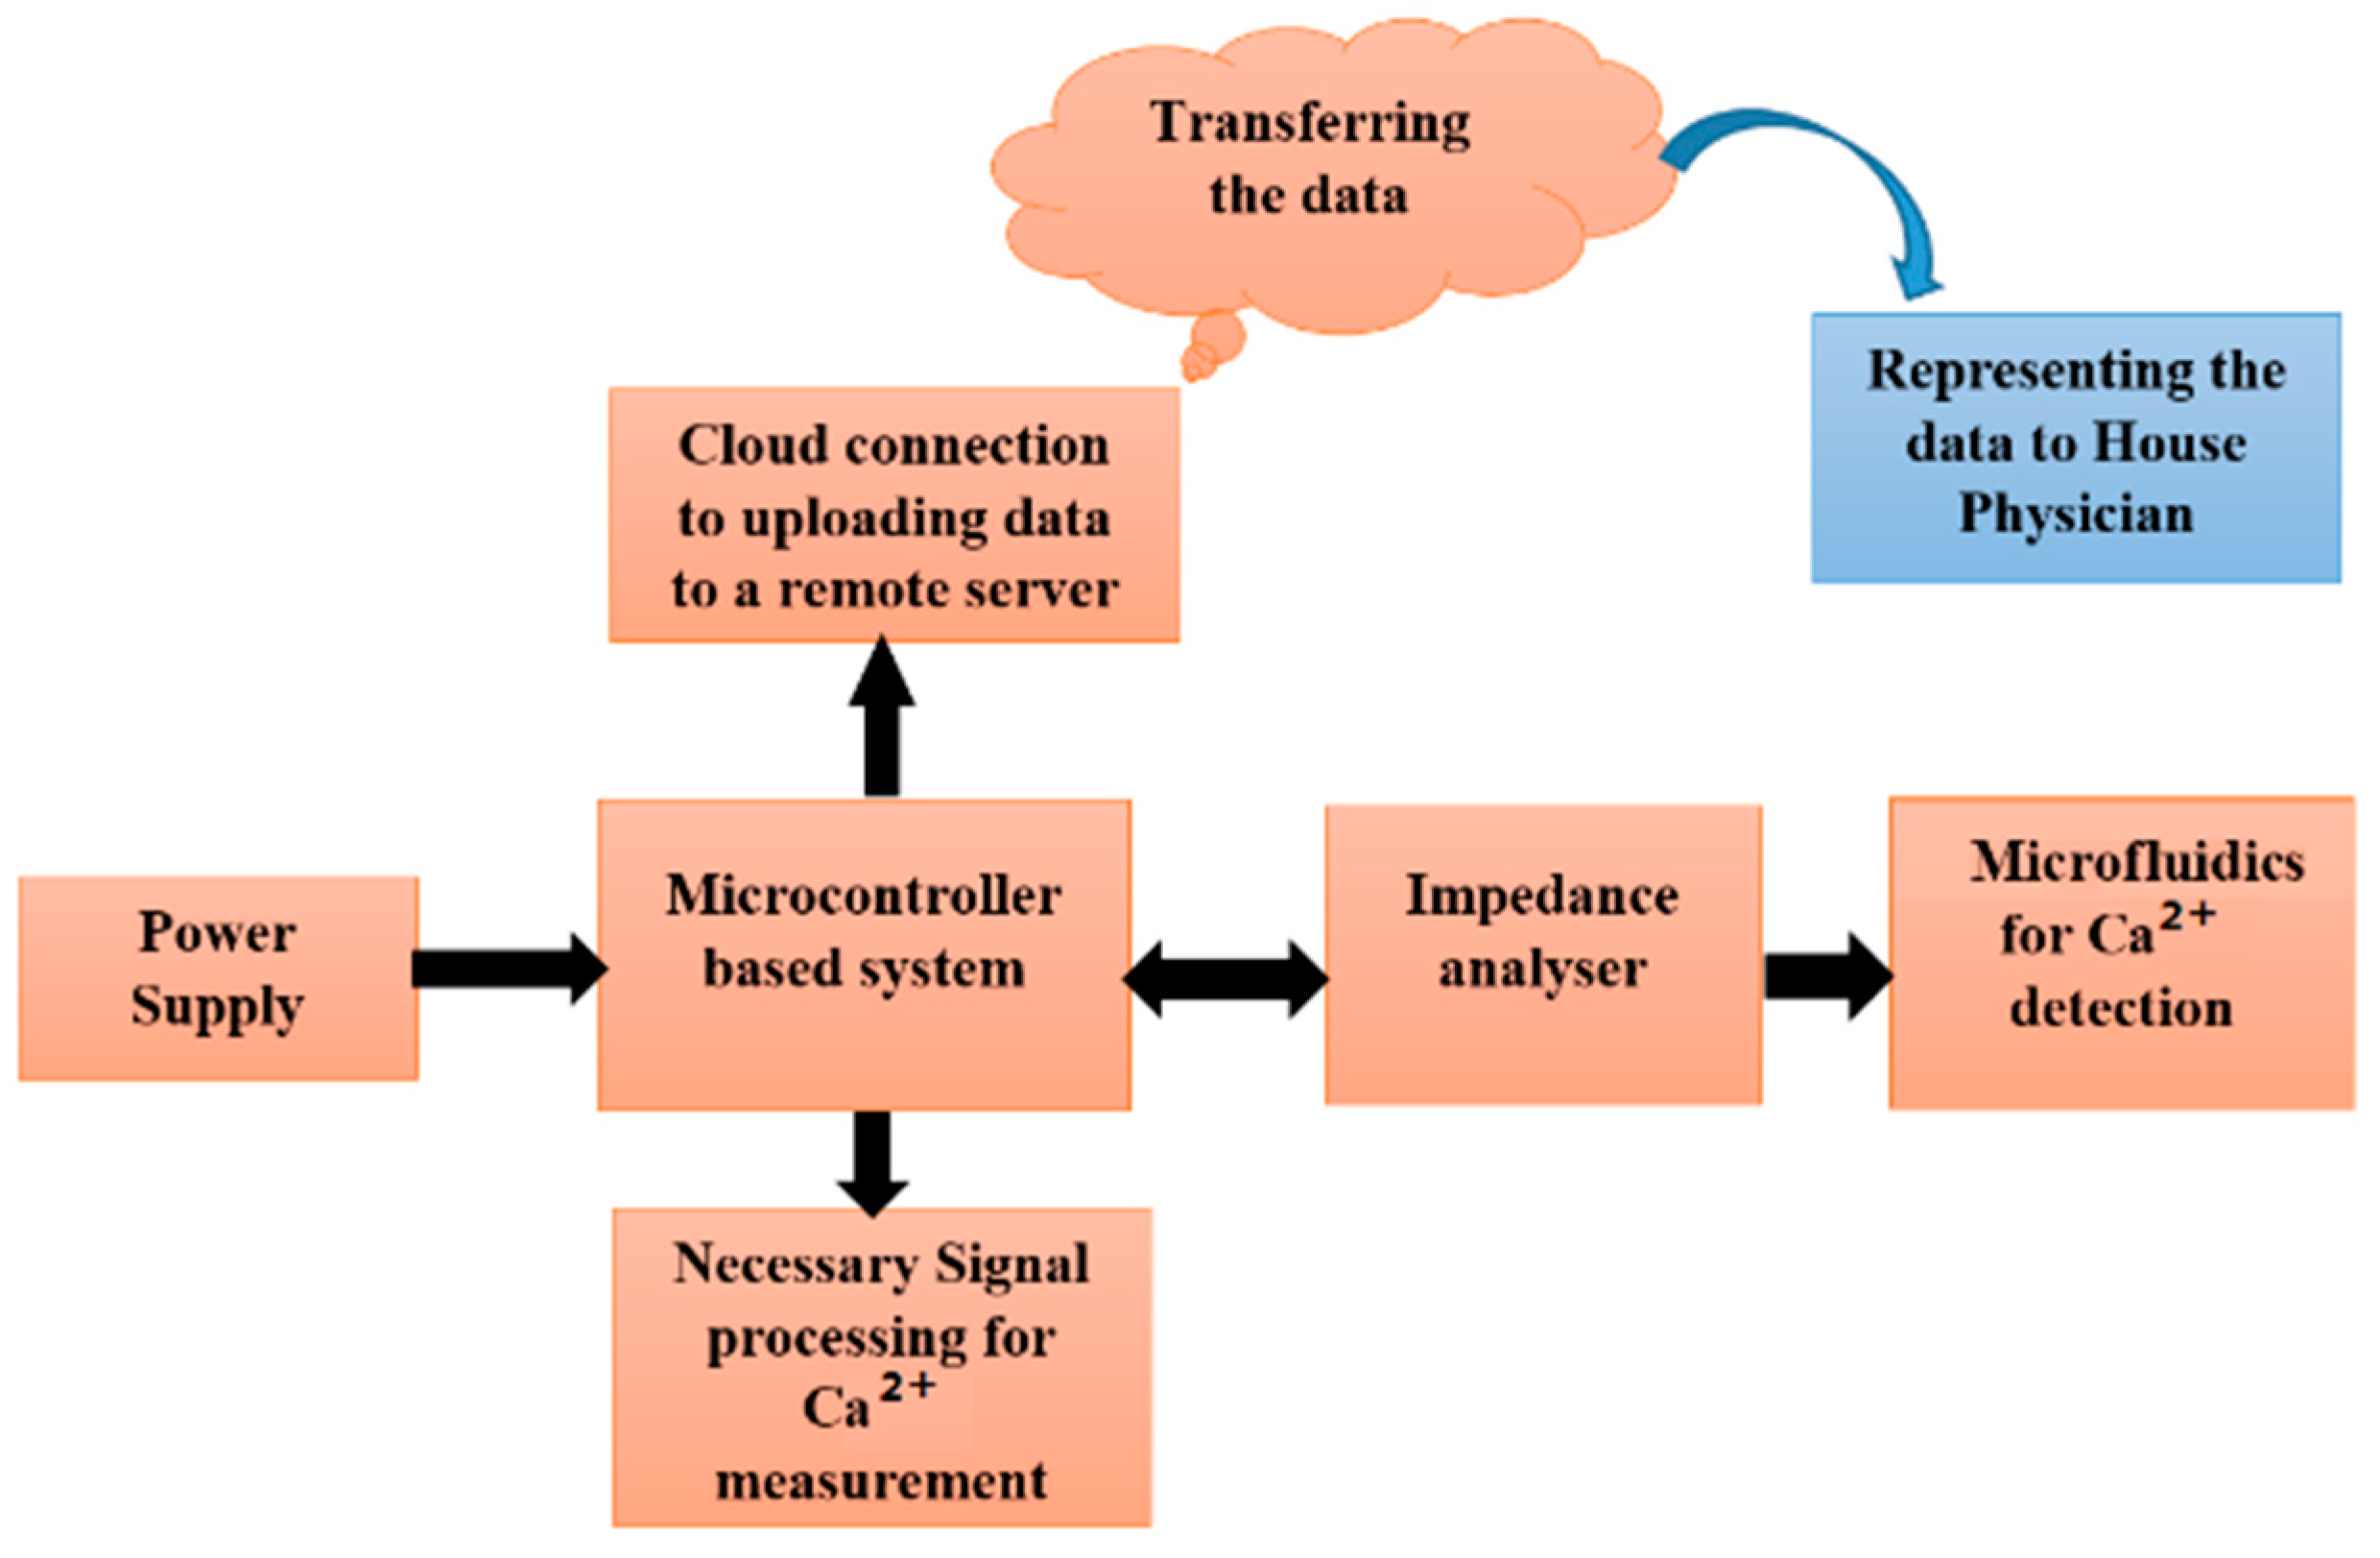
2.6.1. Block Diagram of the Point-of-Care System

Figure 6 shows the block diagram of the proposed point-of-care system.
An impedance analyzer was used to collect the information for impedance variations generated by different calcium concentrations. The low-power-microcontroller converted impedance values to the actual calcium concentrations and transferred the data to an IoT-based cloud server to assess the data.
A WiFi module was integrated with the microcontroller board, which helped to connect the PoC device with any gateway to transfer the measured data to the IoT-based cloud server. Thingspeak [37] was used as a cloud storage to store the data. This cloud server was accessible from any location, not only from laptops but also only from the app in cell phones. This helped the health-care related work to carry out the real-time monitoring. The Arduino ciao [38] library, which applied the Hypertext Transfer Protocol (HTTP) POST protocol (POST is a request method supported by HTTP used by the World Wide Web), was used to transfer the calcium concentration to the designated private channel in Thingspeak.

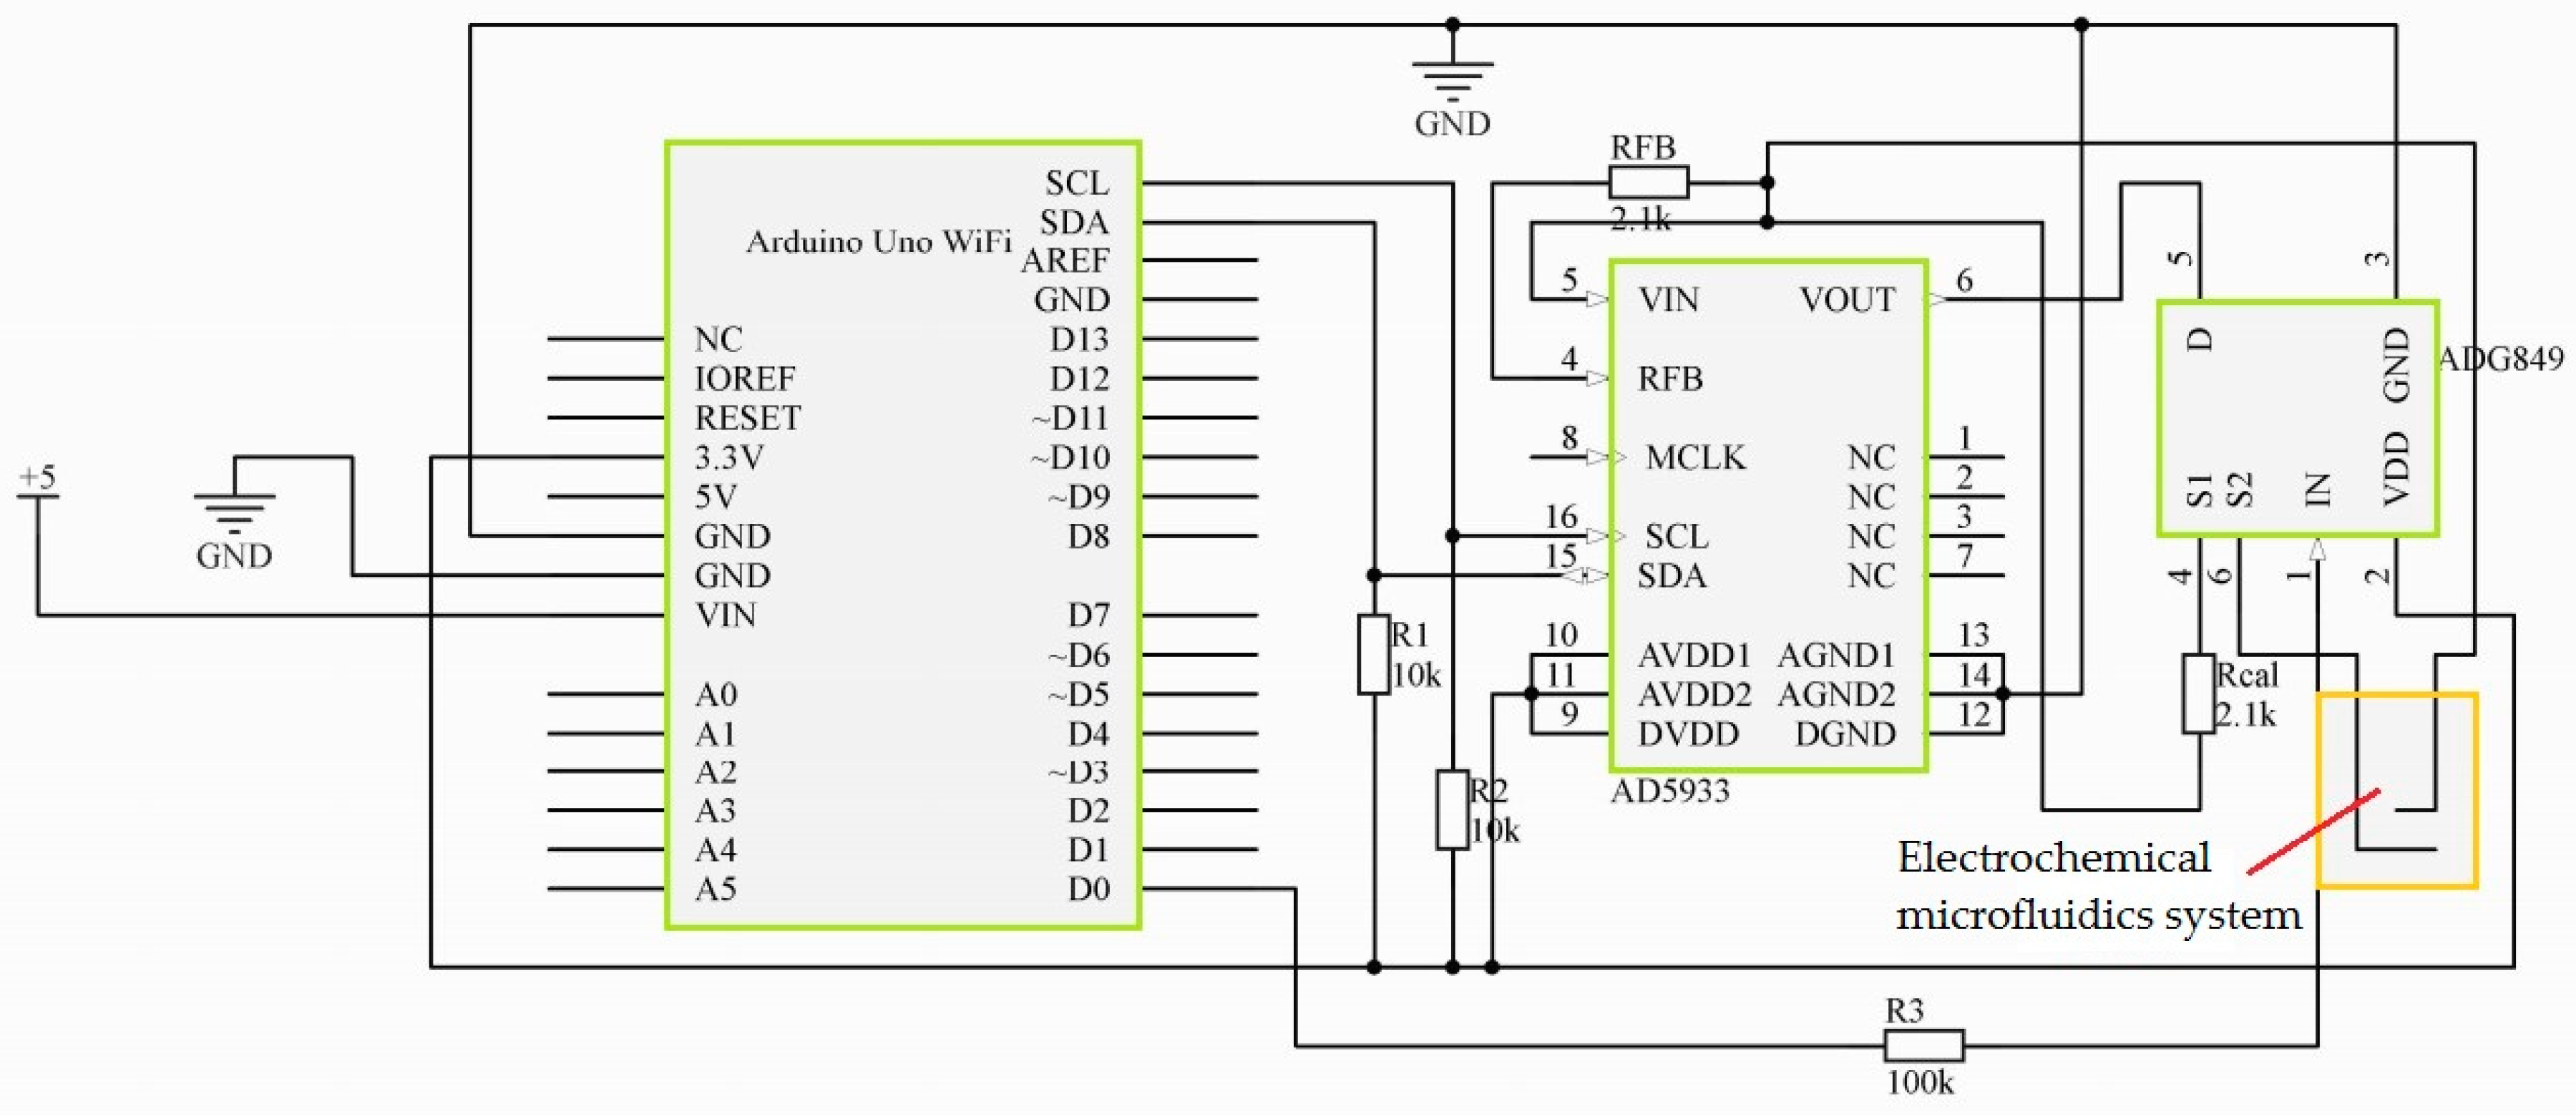
2.6.2. Circuit Diagram of the Proposed System

Figure 7 shows the circuit diagram of the proposed PoC system. Arduino Uno Wifi [39] was used with an AD5933 [40] as an impedance analyzer to calculate the concentration of calcium from the sensor. ADG849 [41] was used as a 2:1 multiplexer to complete the calibration. In order to calculate the gain, a calibration resistance of 2.18 kΩ was used to calibrate the impedance analyzer. It provided an Alternating Current (AC) voltage of 1.98 V and Direct Current (DC) bias voltage of 1.48 V for the excitation electrode of the sensor. The AC excitation signal was generated through the direct digital synthesis (DDS) [42] technique. In this case, the operating frequency was 450 Hz. The impedance data was collected by the I2C protocol [43] from the sensor. A Vcc of 3.3 V was used from the Arduino Uno WiFi to the AD5933 and ADG849. A rechargeable battery was used to provide the sufficient power to the whole system. The impedance data was collected from the impedance analyzer and uses the reference graph to calculate the calcium concentration.

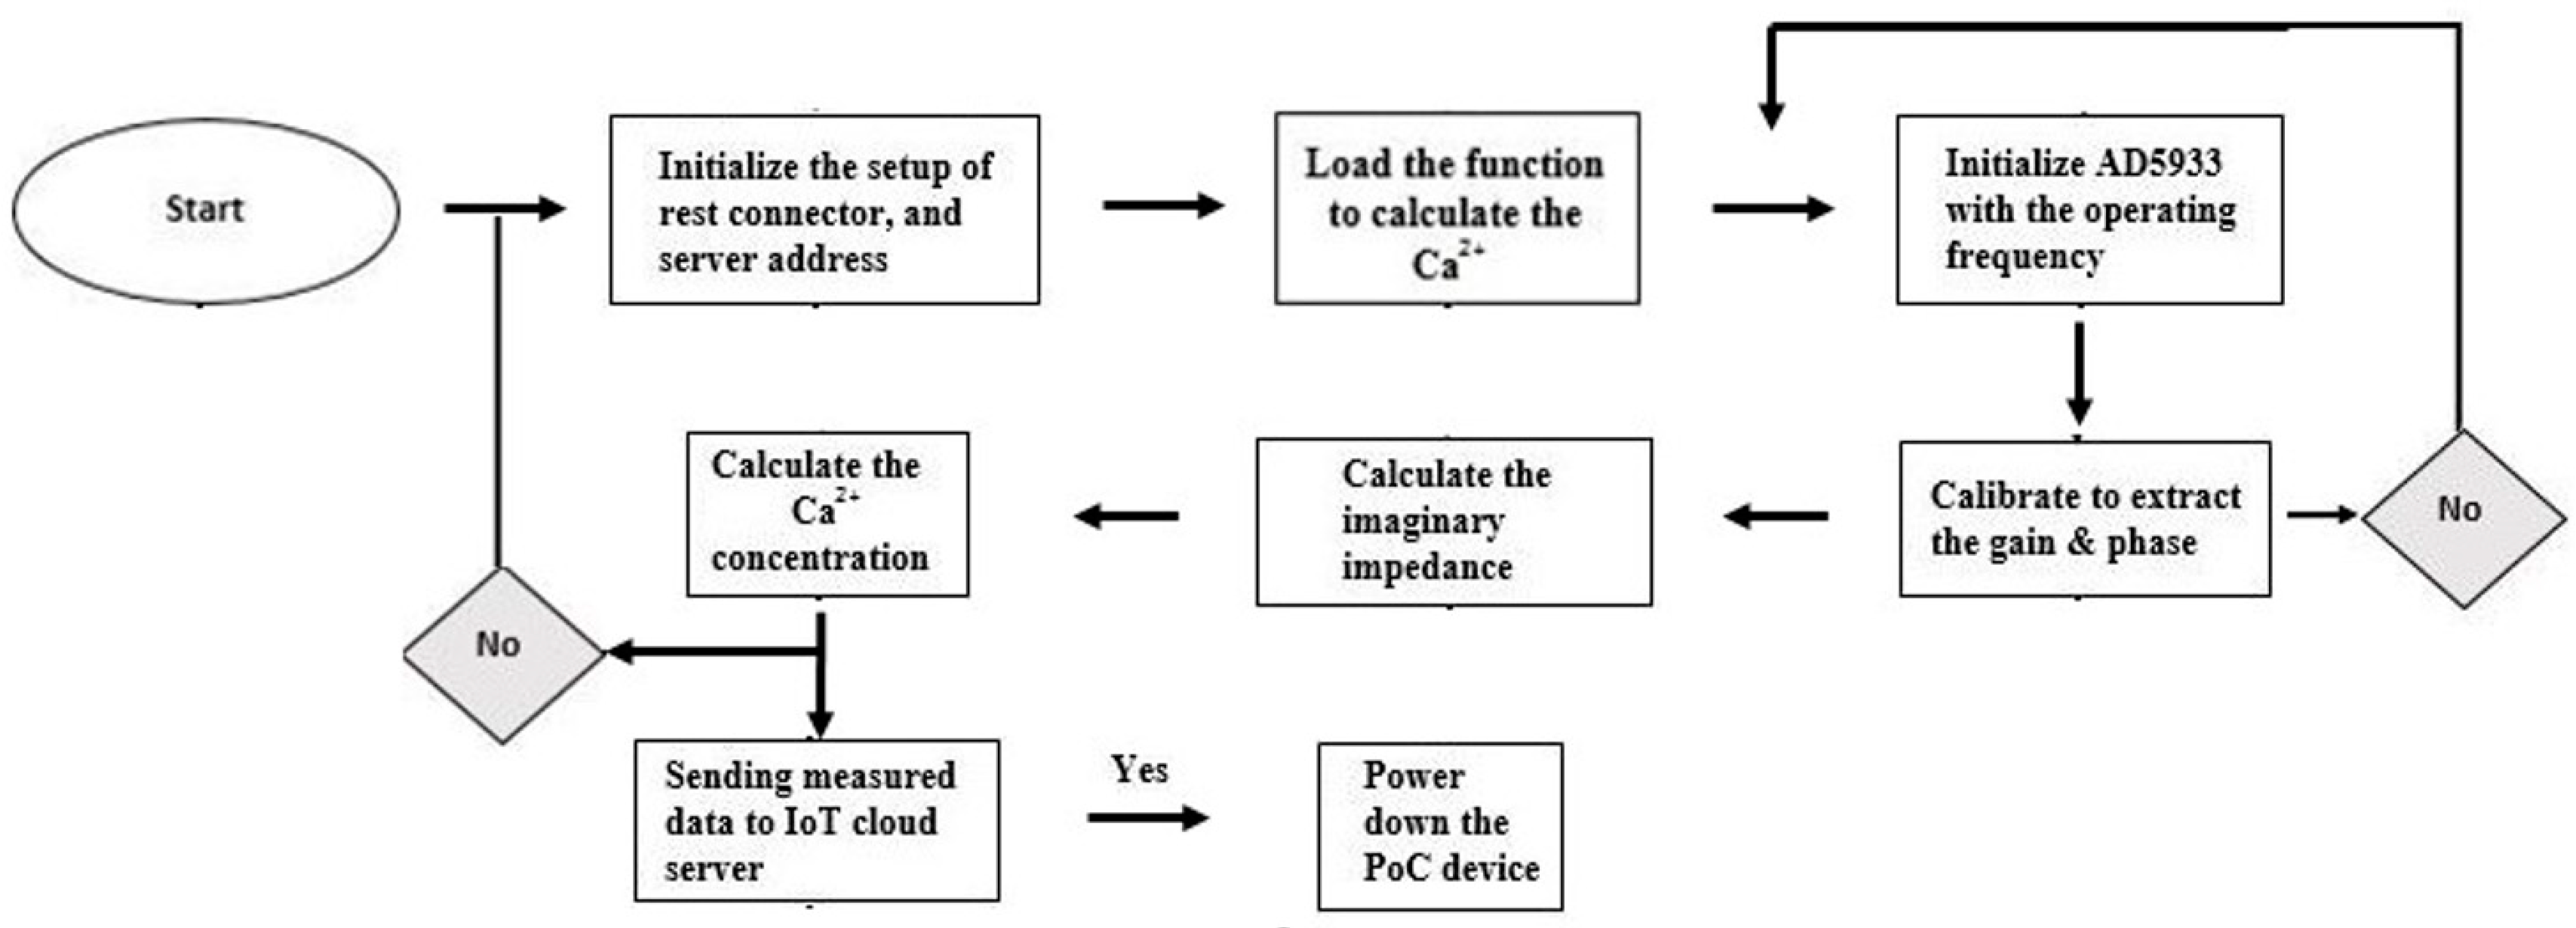
2.6.3. Software Process Flow of the PoC Device

The Arduino Integrated Development Environment (IDE) has a text editor for programming code, a text console, a serial monitor to see the output, a message area, and a toolbar with buttons for common functions [44]. Figure 8 shows the process flow of the PoC device. The microcontroller restarted the rest connector and the server address after powering the device, and a function was developed to measure the calcium concentration. An initialization of the impedance analyzer was also carried out to apply its operating frequency on calculating the gain and impedance for the sensor. If the initialization is wrong, these steps would repeat until the whole process is completed.
Finally, the calcium concentration was transferred to the IoT-based cloud server. If the PoC device was unable to send the calculated data to the cloud server due to a transmission error or losing the communication link, it would start the tasks from the beginning as shown in Figure 8.
The PoC device is able to be connected with any local gateway. The Application Process Interface (API) key was required from the user′s side. This improved the security of the device. The device turned off automatically after data transmitting was completed. The final collected data can be seen almost instantaneously in the Thingspeak cloud for the house physician or the caregiver who is interested in monitoring the calcium concentration.
Figure 8 represents the first prototype, with a dimension of 15 cm × 10 cm that was used as a PoC device.
Figure 9 shows the software flow of the PoC device for calcium calculation detection. The data was transferred to the IoT cloud server.

3. Results and Discussion

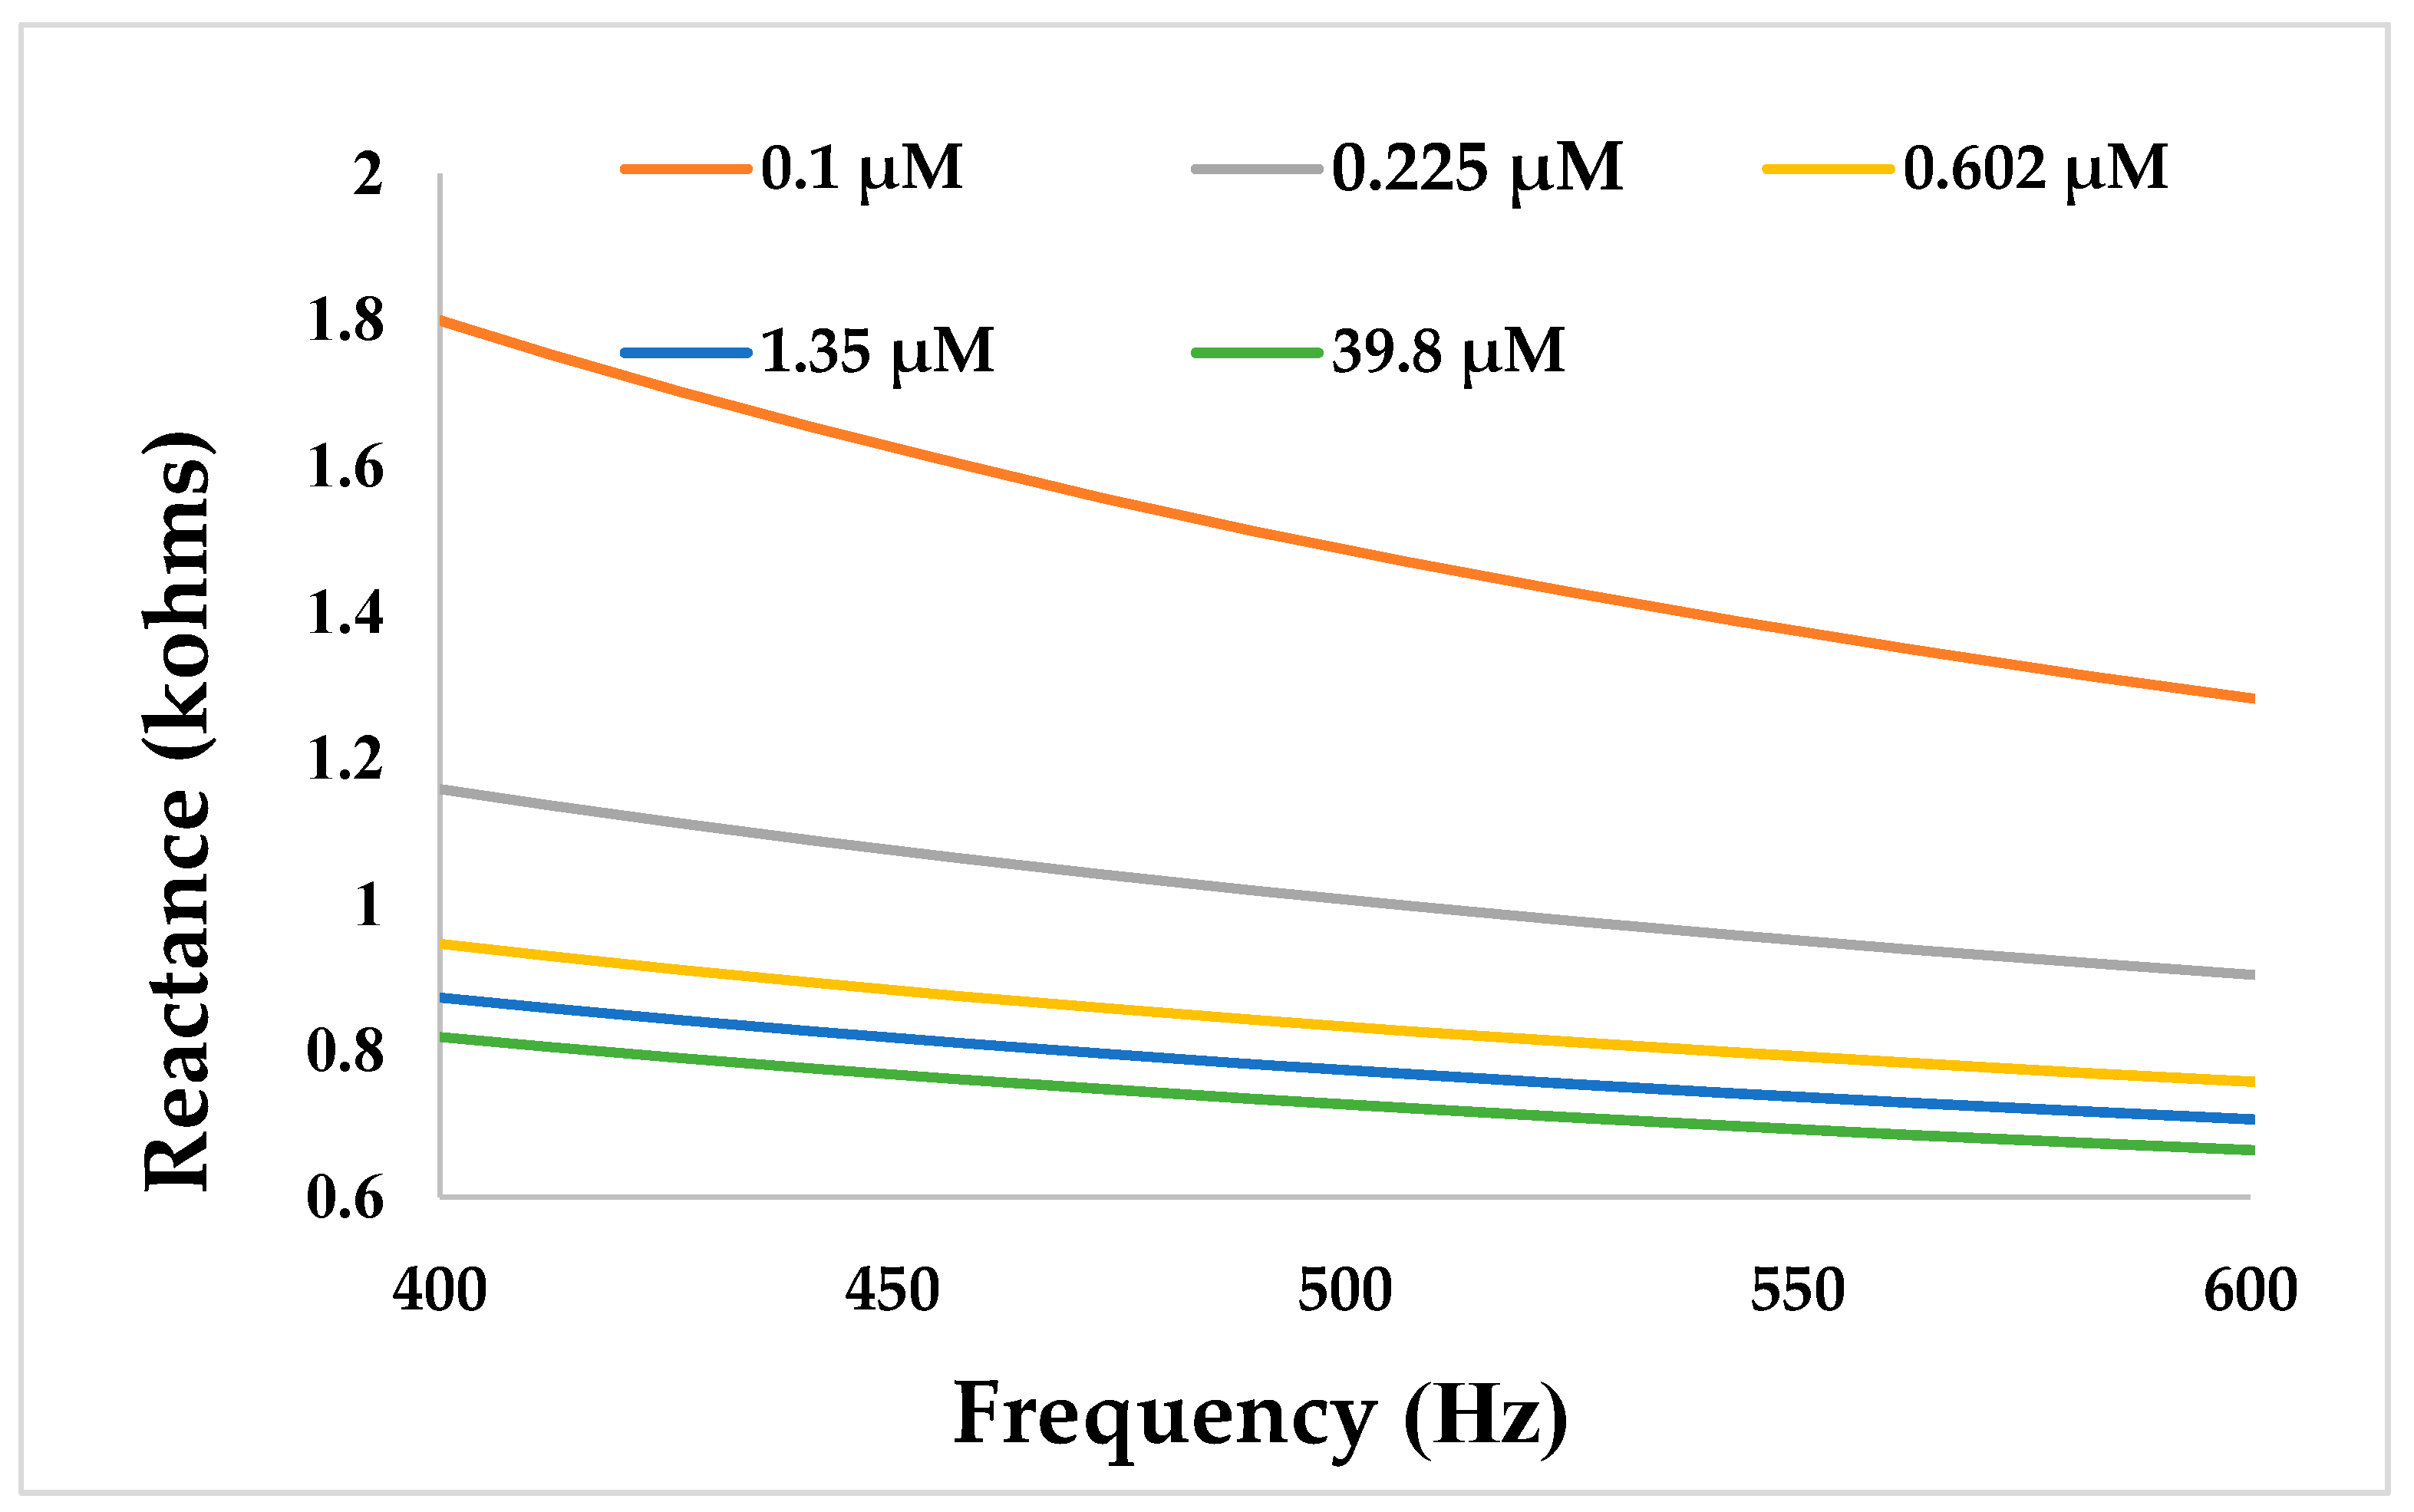
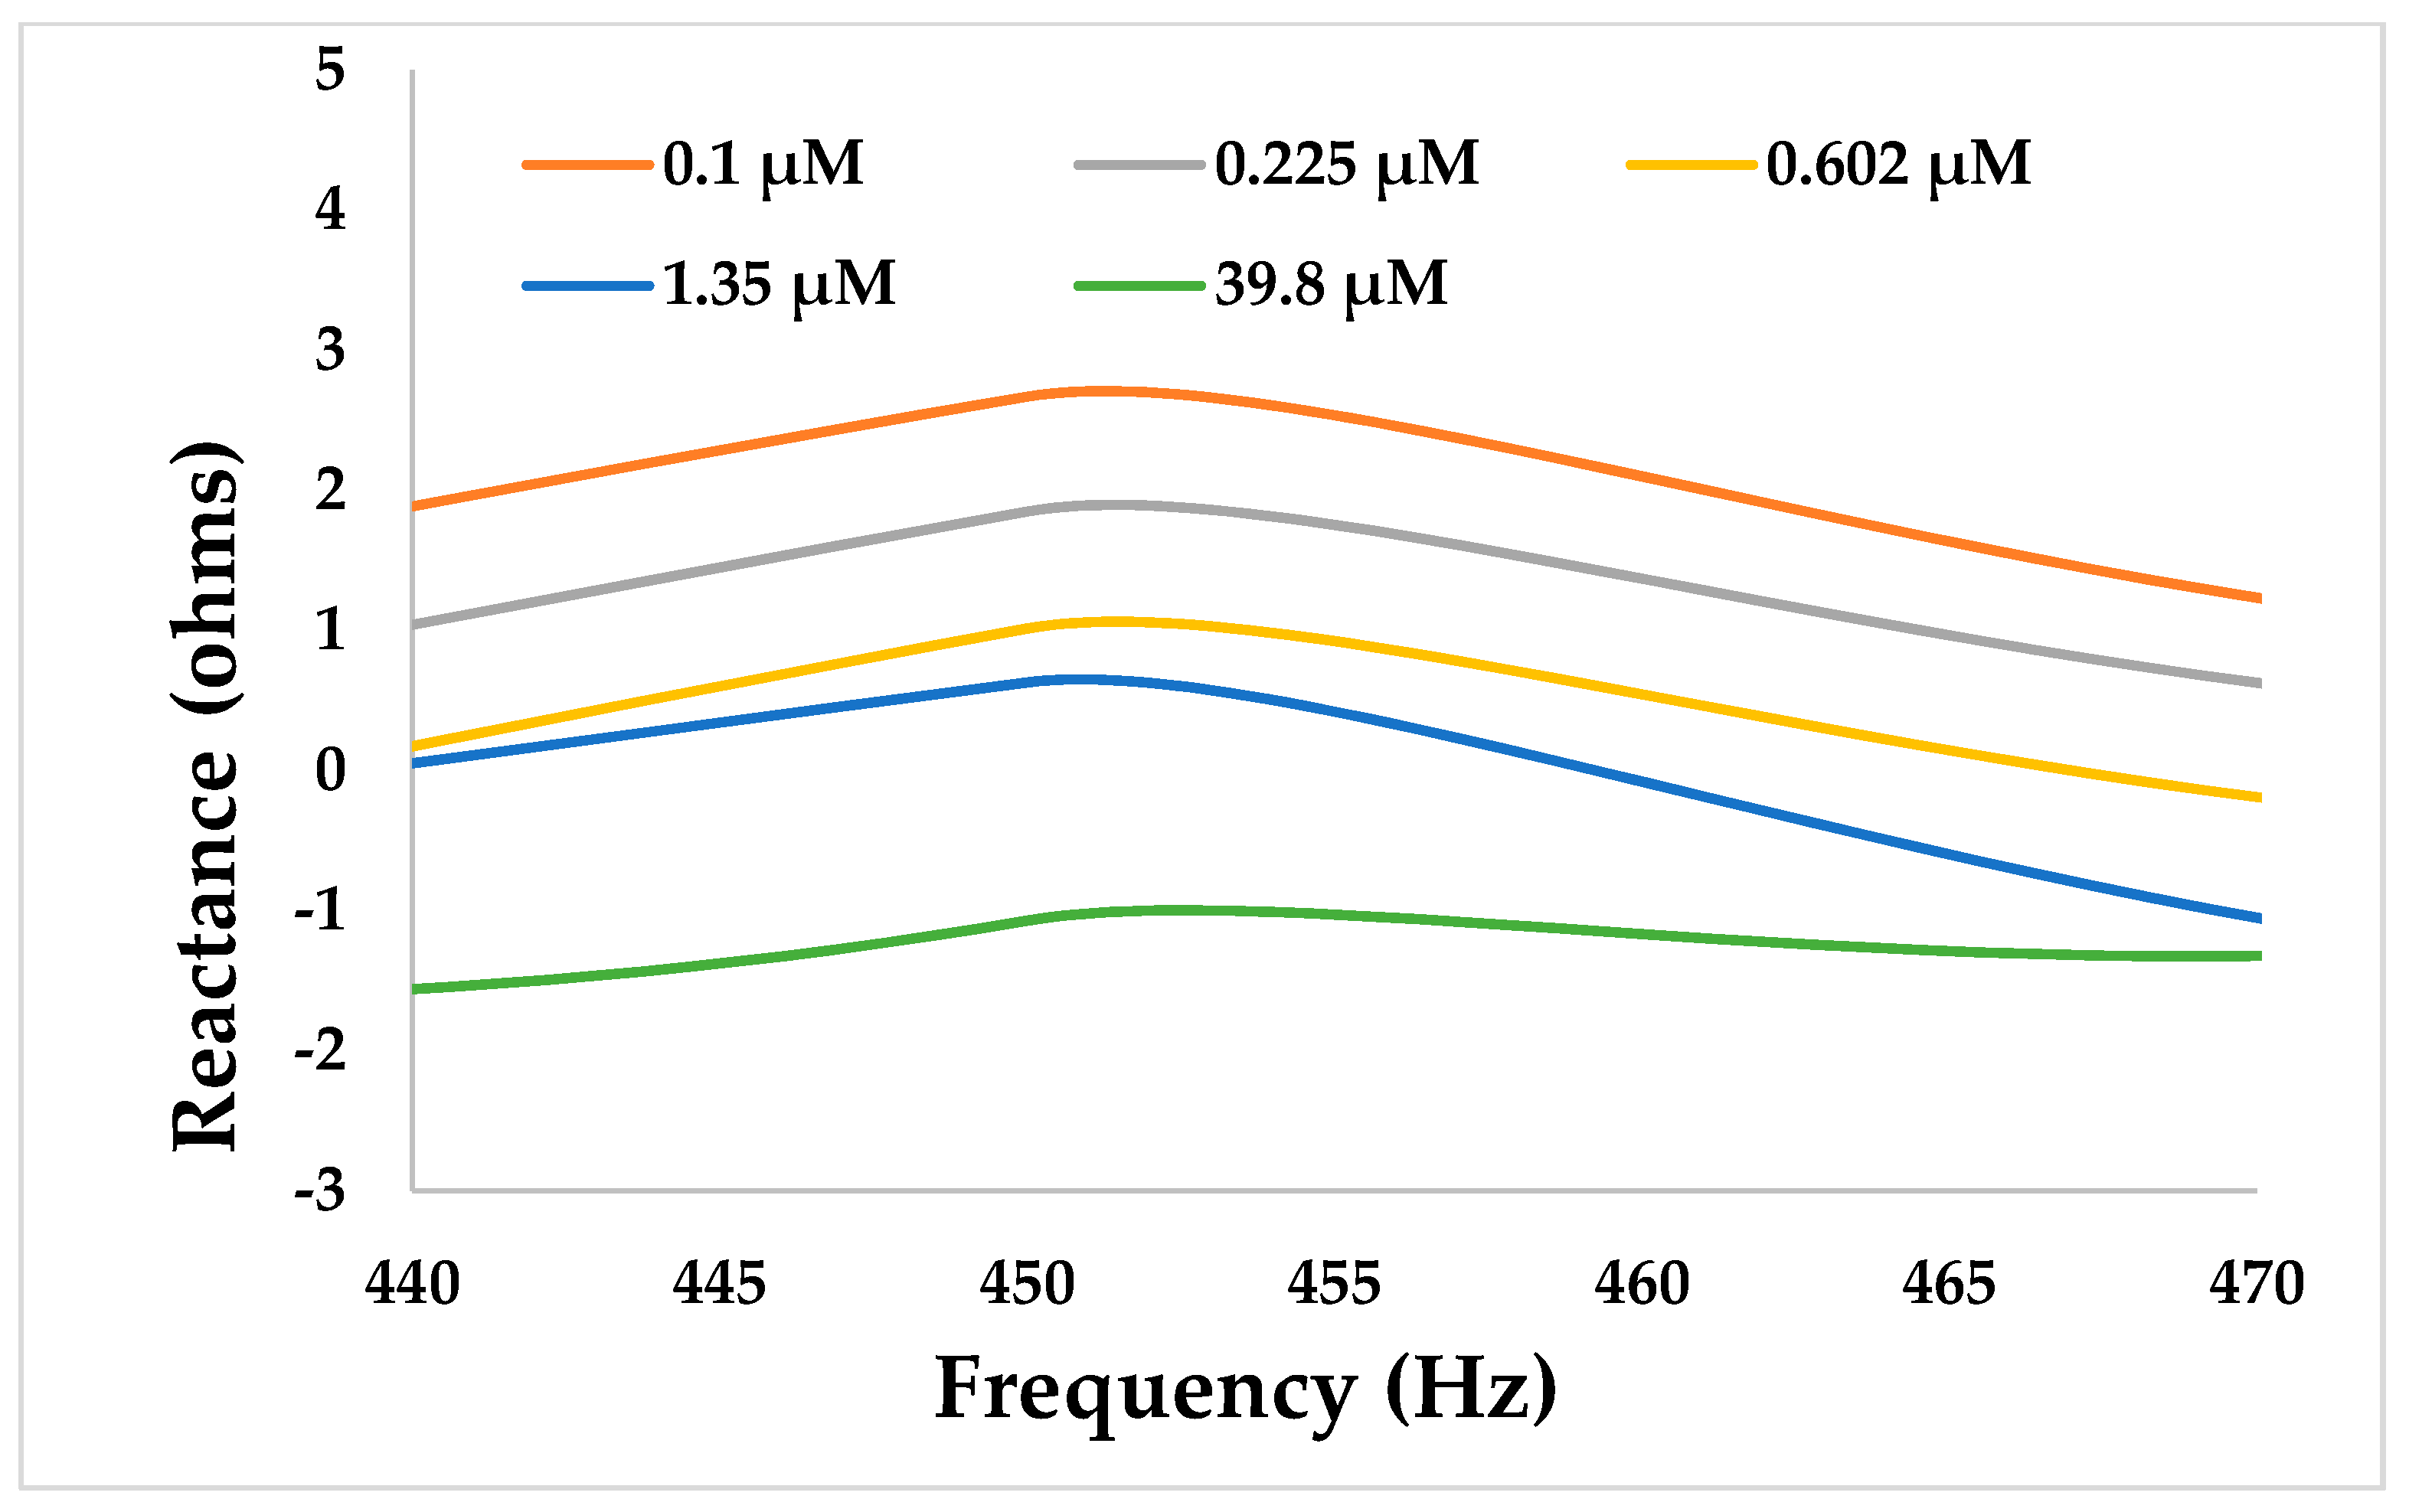
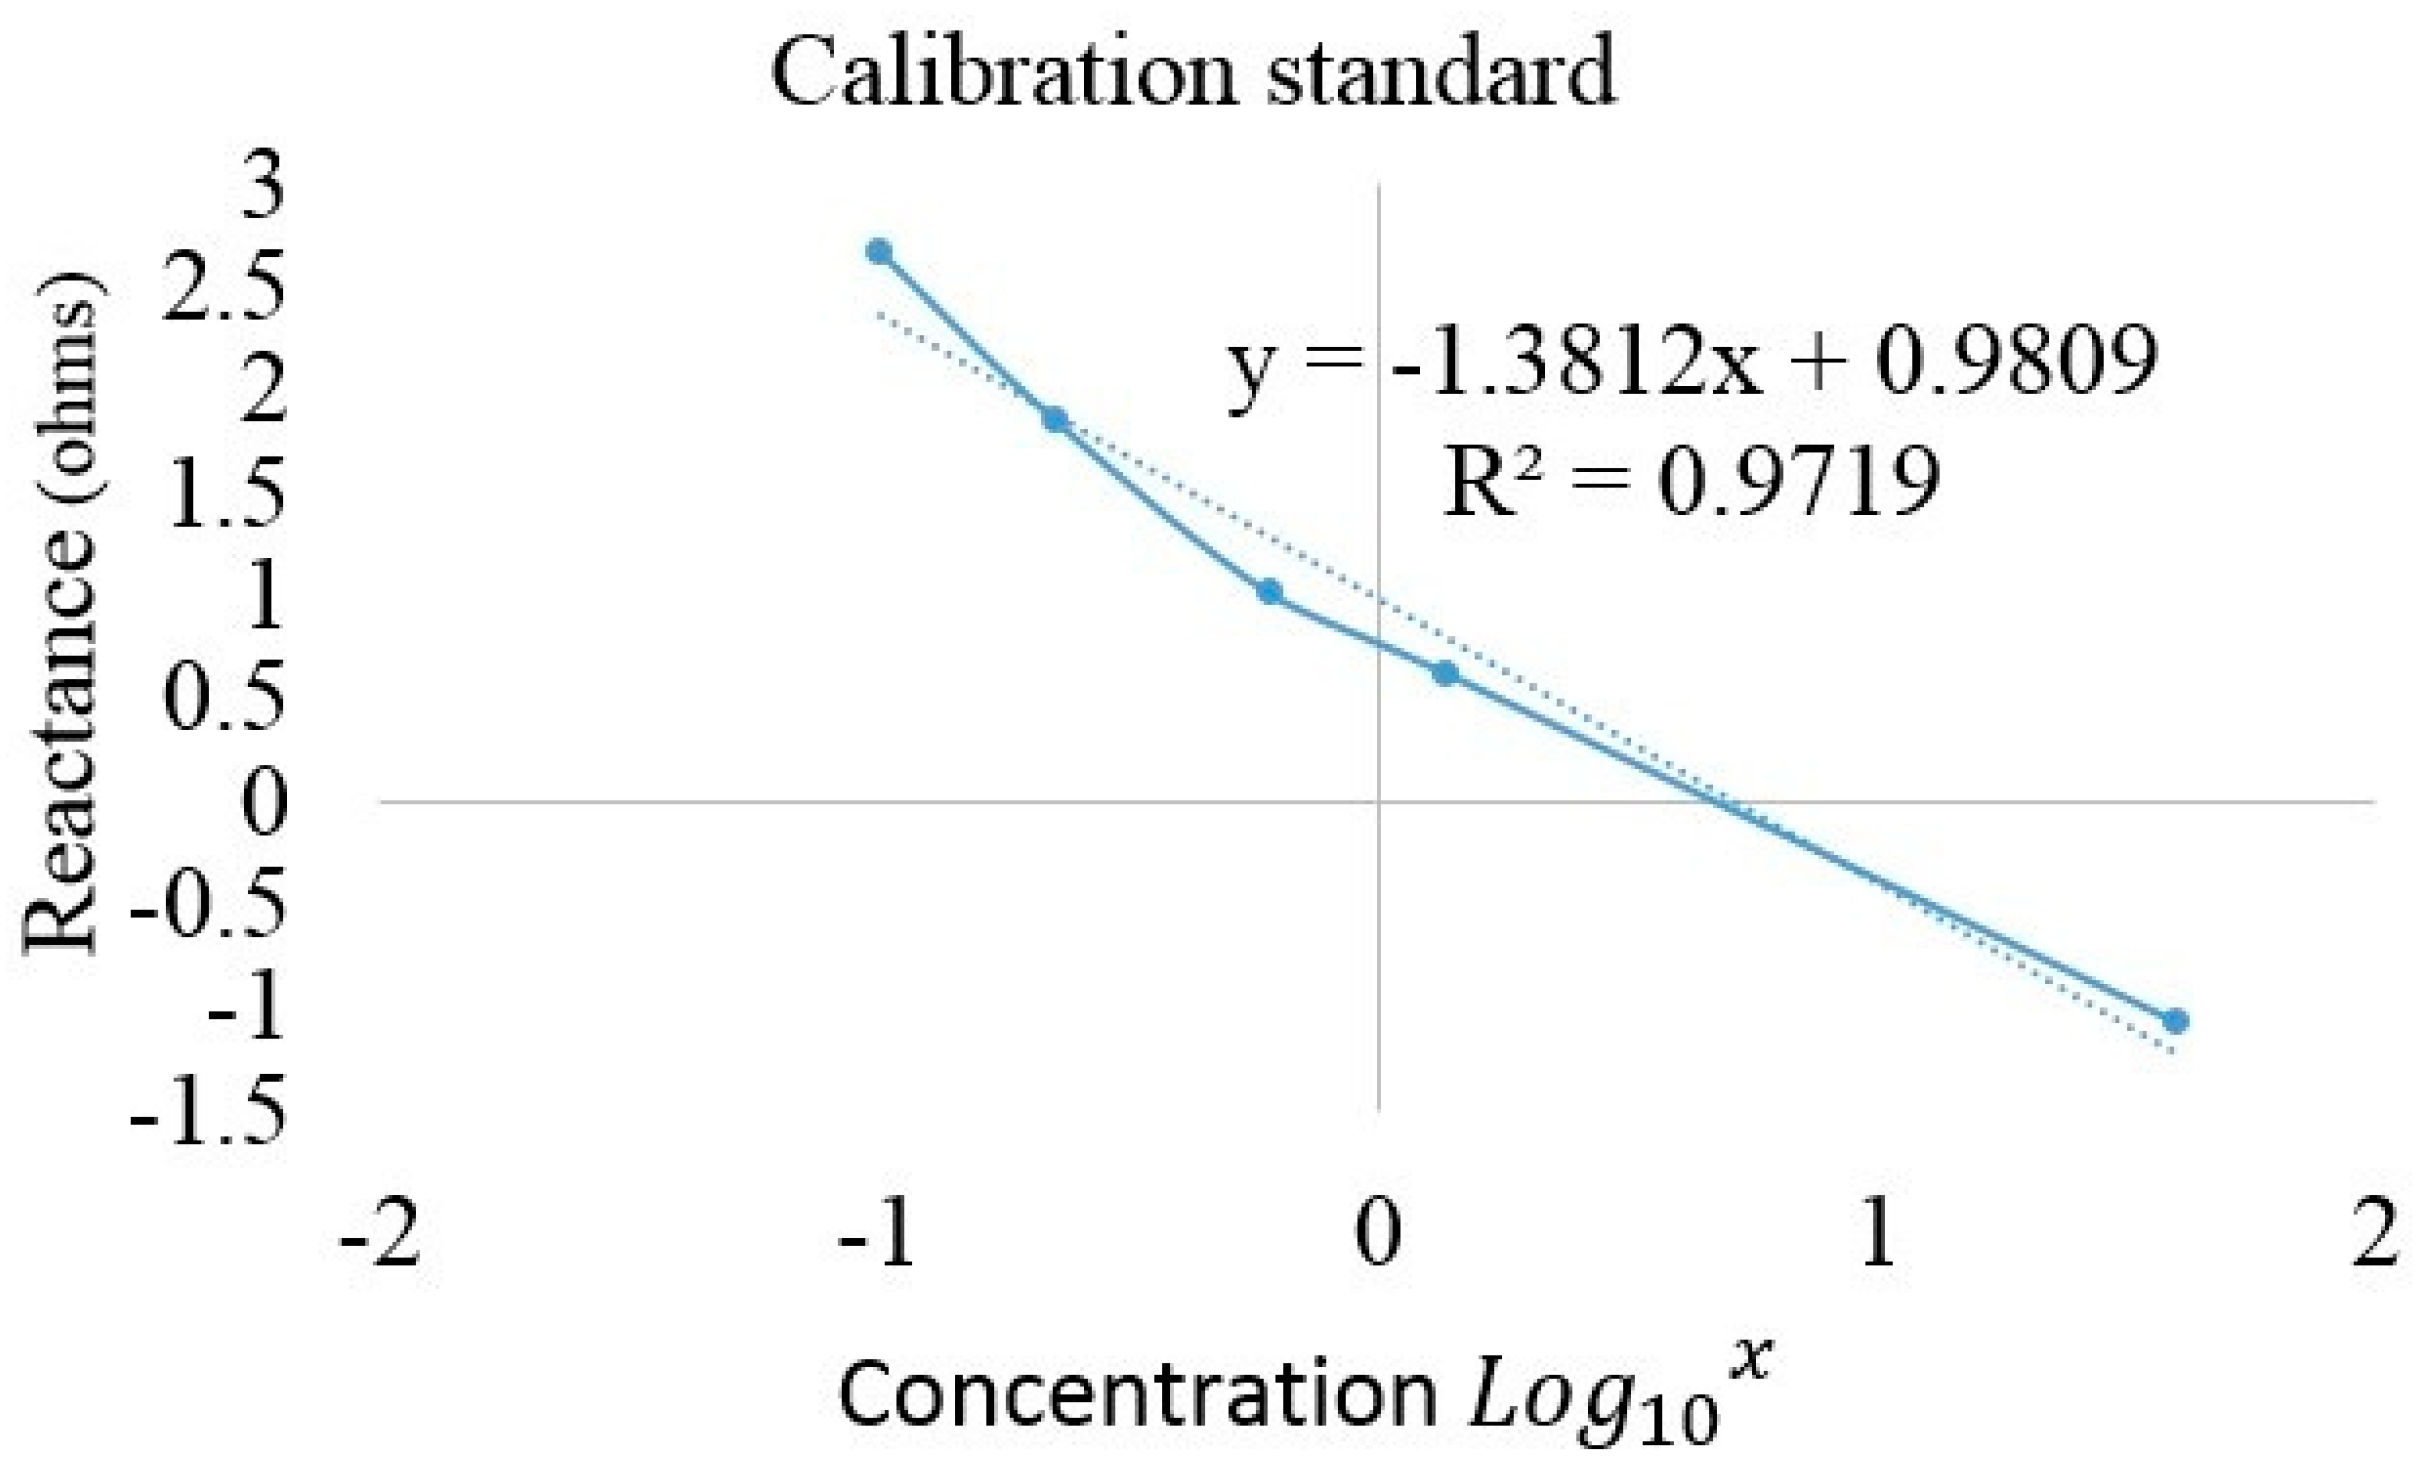
3.1. Detection of the Reactance Measurement of the LCR Meter

Figure 5 shows the settings for response of the microfluidics systems in terms of reactance and frequency to 5 different calcium solutions by the LCR meter. A sinusoidal voltage of 1 V was provided to the sensors with a frequency sweep done between 100 Hz and 500 Hz to determine the optimum frequency range for the chosen samples [45,46,47]. The experimental samples were chosen between 0.1 µM and 40 µM and were formed with the serial dilution method, as 0.1 µM, 0.225 µM, 0.602 µM, 1.35 µM, and 39.8 µM.
Figure 10 shows the response of the developed sensor with respect to the five calcium concentrations in the frequency range of 400 to 500 Hz. It is seen from the figure that the sensor was capable of differentiating the concentrations distinctively. The change in reactance occurred because of the capacitive nature of the interdigital sensors.
Compared to the earlier detections, as mentioned above, it was possible to detect the controlled volume in this case due to the presence of the microfluidic channel above the interdigital sensors. The presence of the channel not only helped in achieving a consistency (22.5 µL) of the detected volume in every experimental round, it also helped in maintaining a uniform shape of the MUT above the sensing area. For the experiments which were conducted without the use of the microfluidic channel, the presence of the sample on the sensing area of the interdigital sensors was oval and not uniform in shape. This had an effect on the response of the sensor as the electric field would not penetrate uniformly through the MUT.

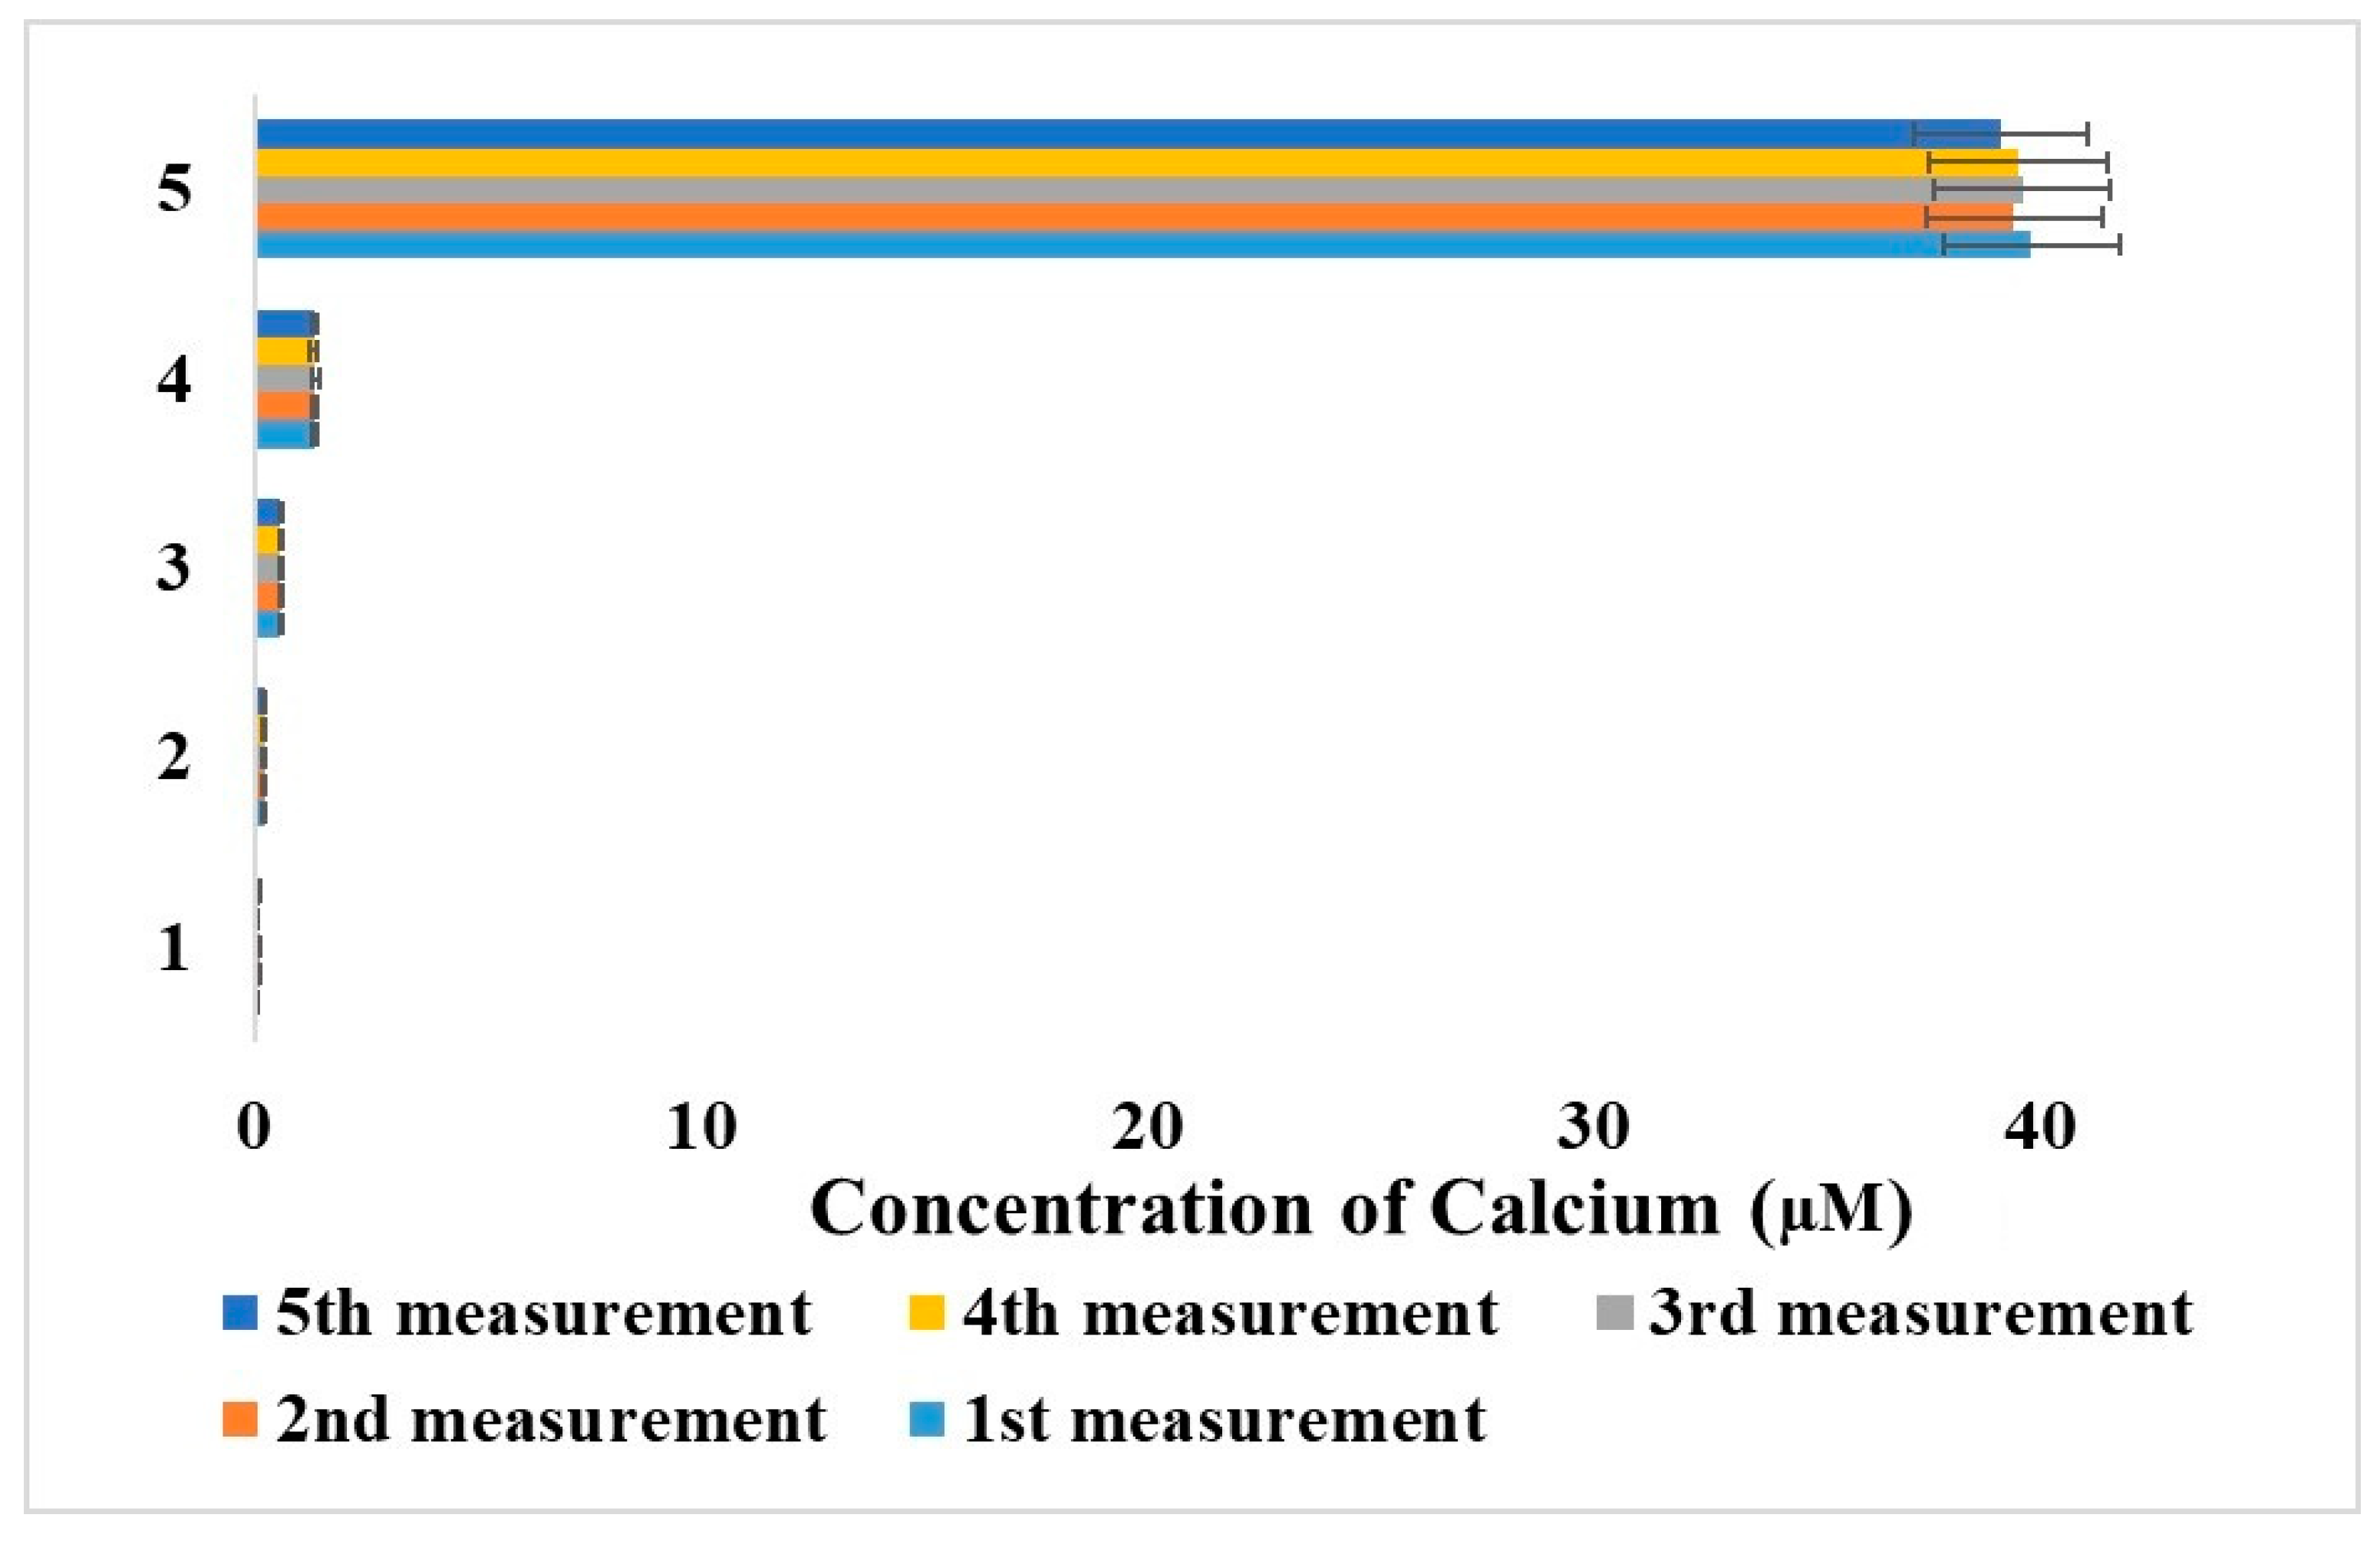
3.2. Measurement of the Reactance Measurement with PoC Device

This chosen frequency was considered to be used in the microcontroller-based system for real-time applications. Figure 11 shows the measurement of different concentrations of calcium for the PoC device during wavelengths of 440–470 and the results are distinguishable.
One of the frequencies, 450 Hz, among this range depicting the highest change with respect to the reactance values was chosen to develop the standard curve for the experimented calcium samples. Figure 12 shows the response of the sensor at the frequency of 450 Hz for the five samples.
The relationship between the concentration and reactance is
y = 1.3812 Lgx + 0.9809
with the R2 being 0.9719. The relatively linear relationship allows for the equation to be used by us for real-time data collection as shown in Figure 8. Figure 13 illustrates the repeatability of the developed system. It can be seen that the results were consistent and the system can be used for calcium detection.

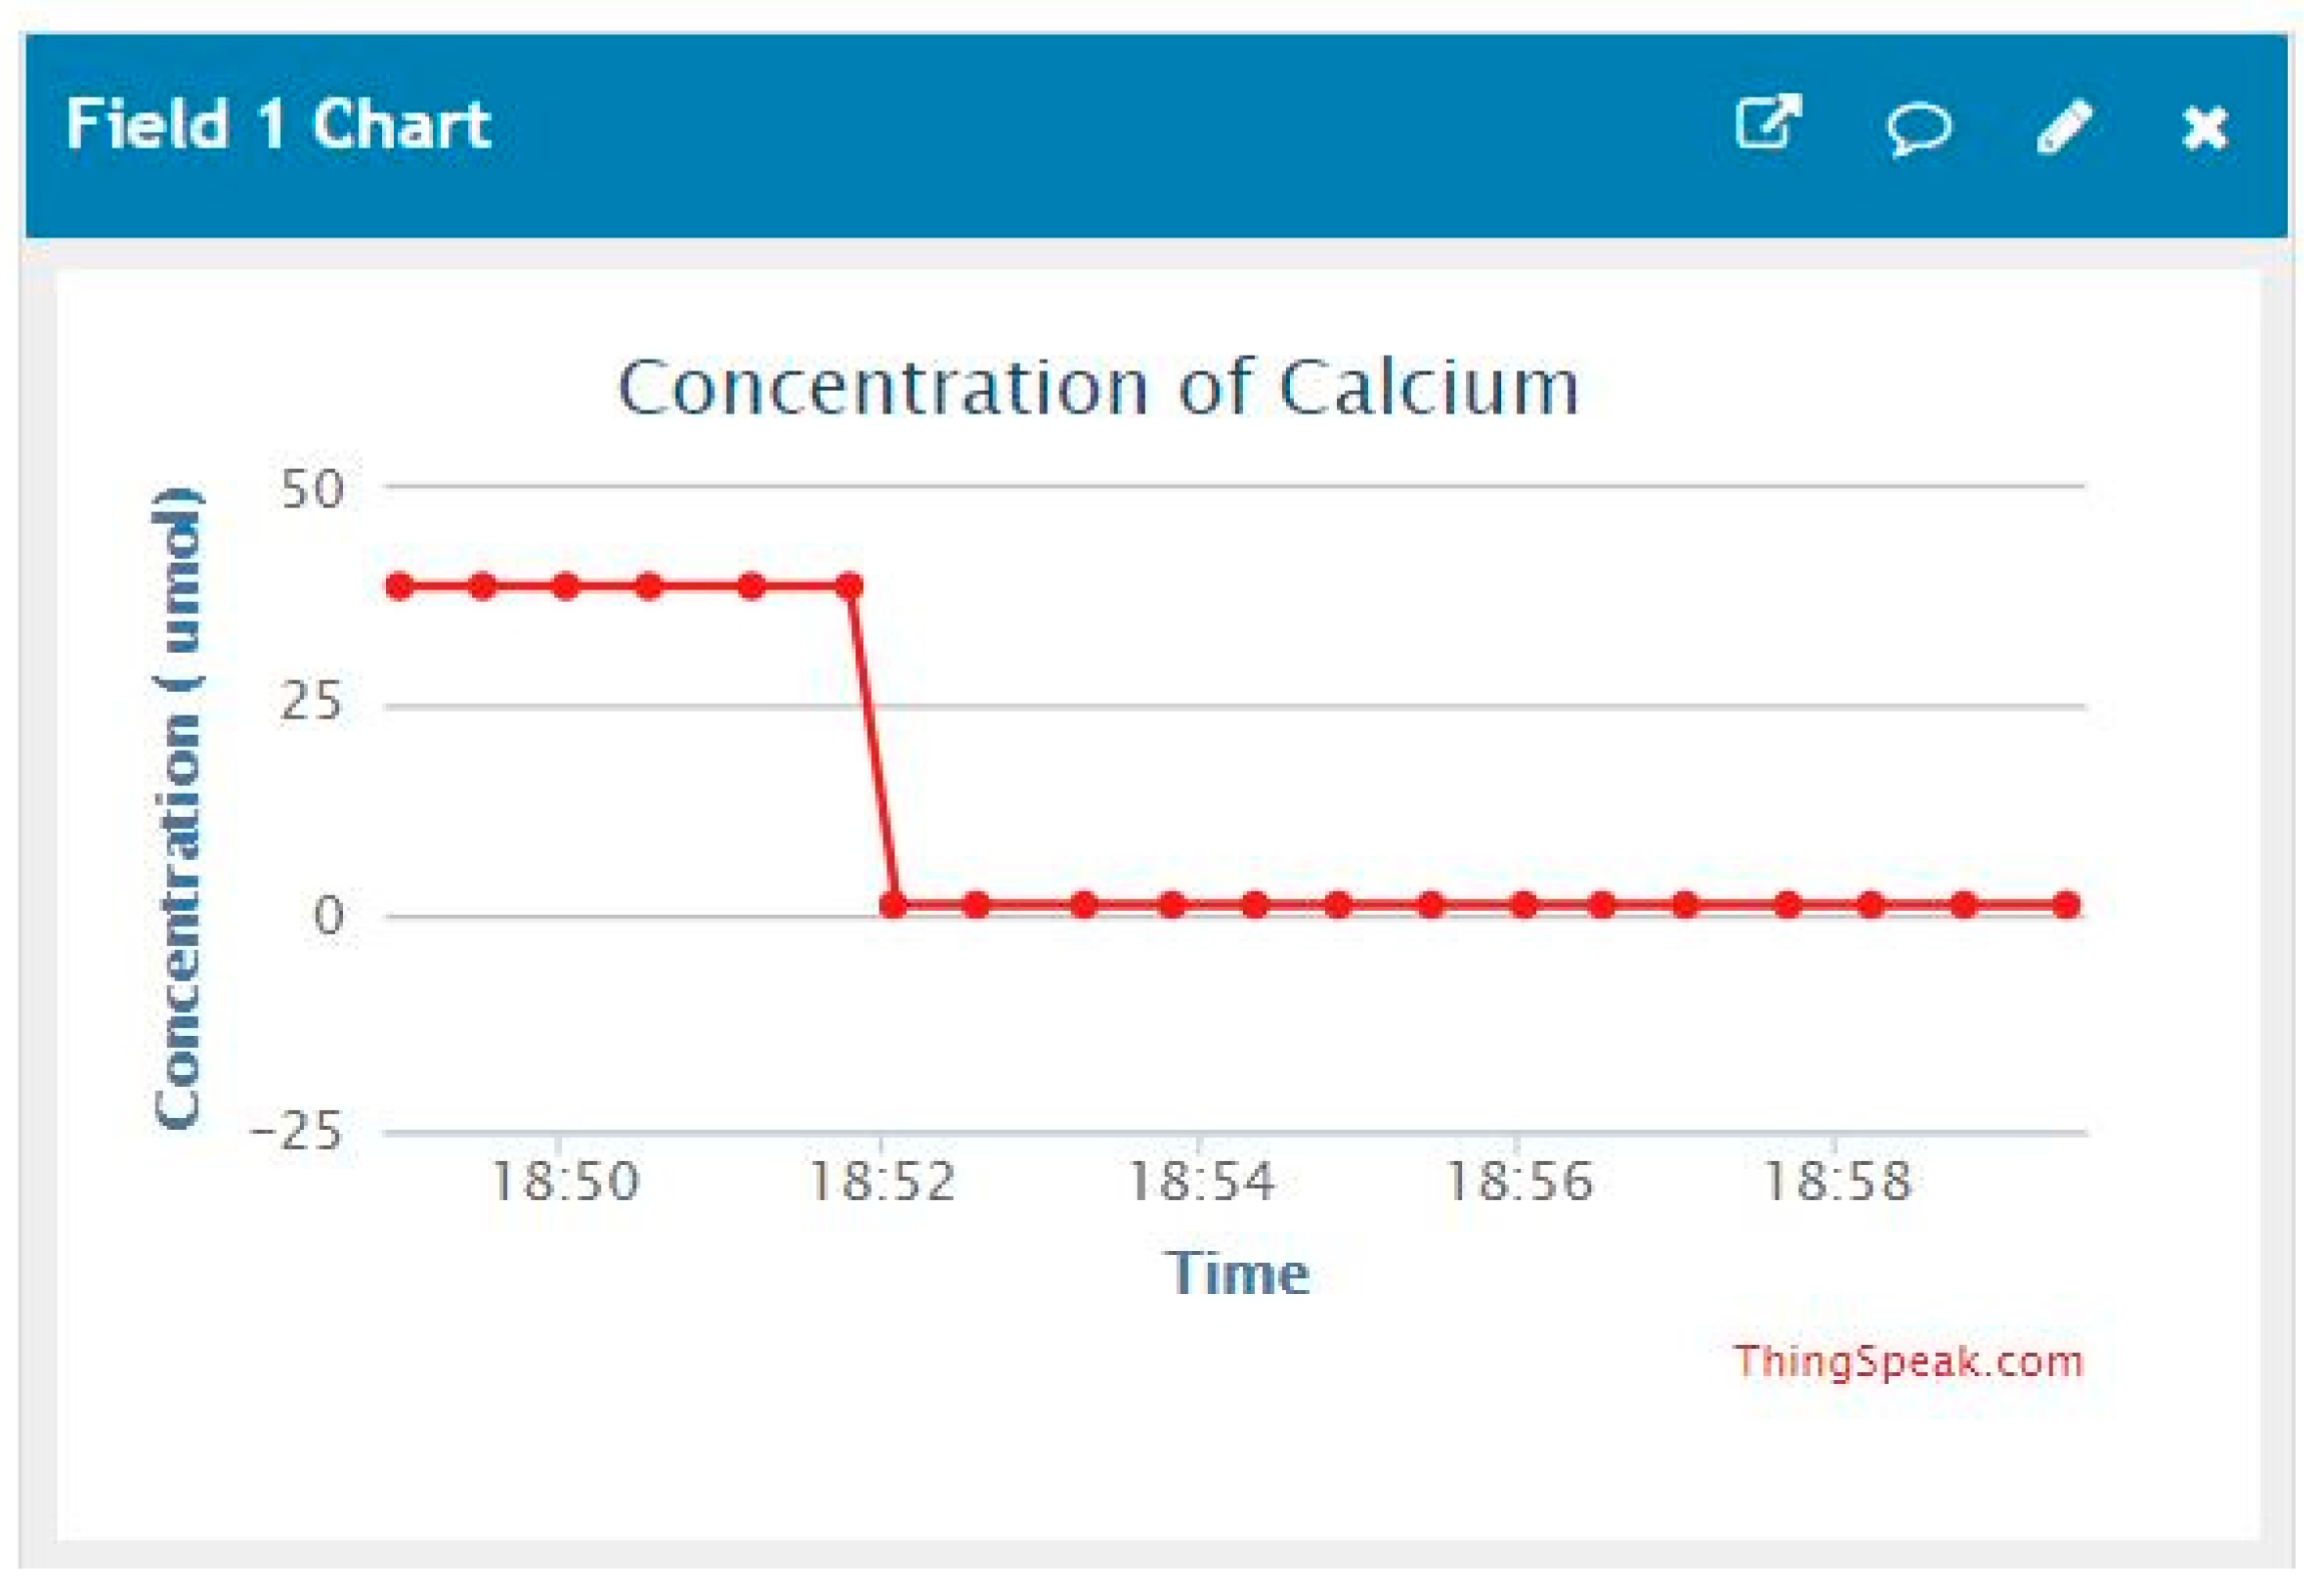
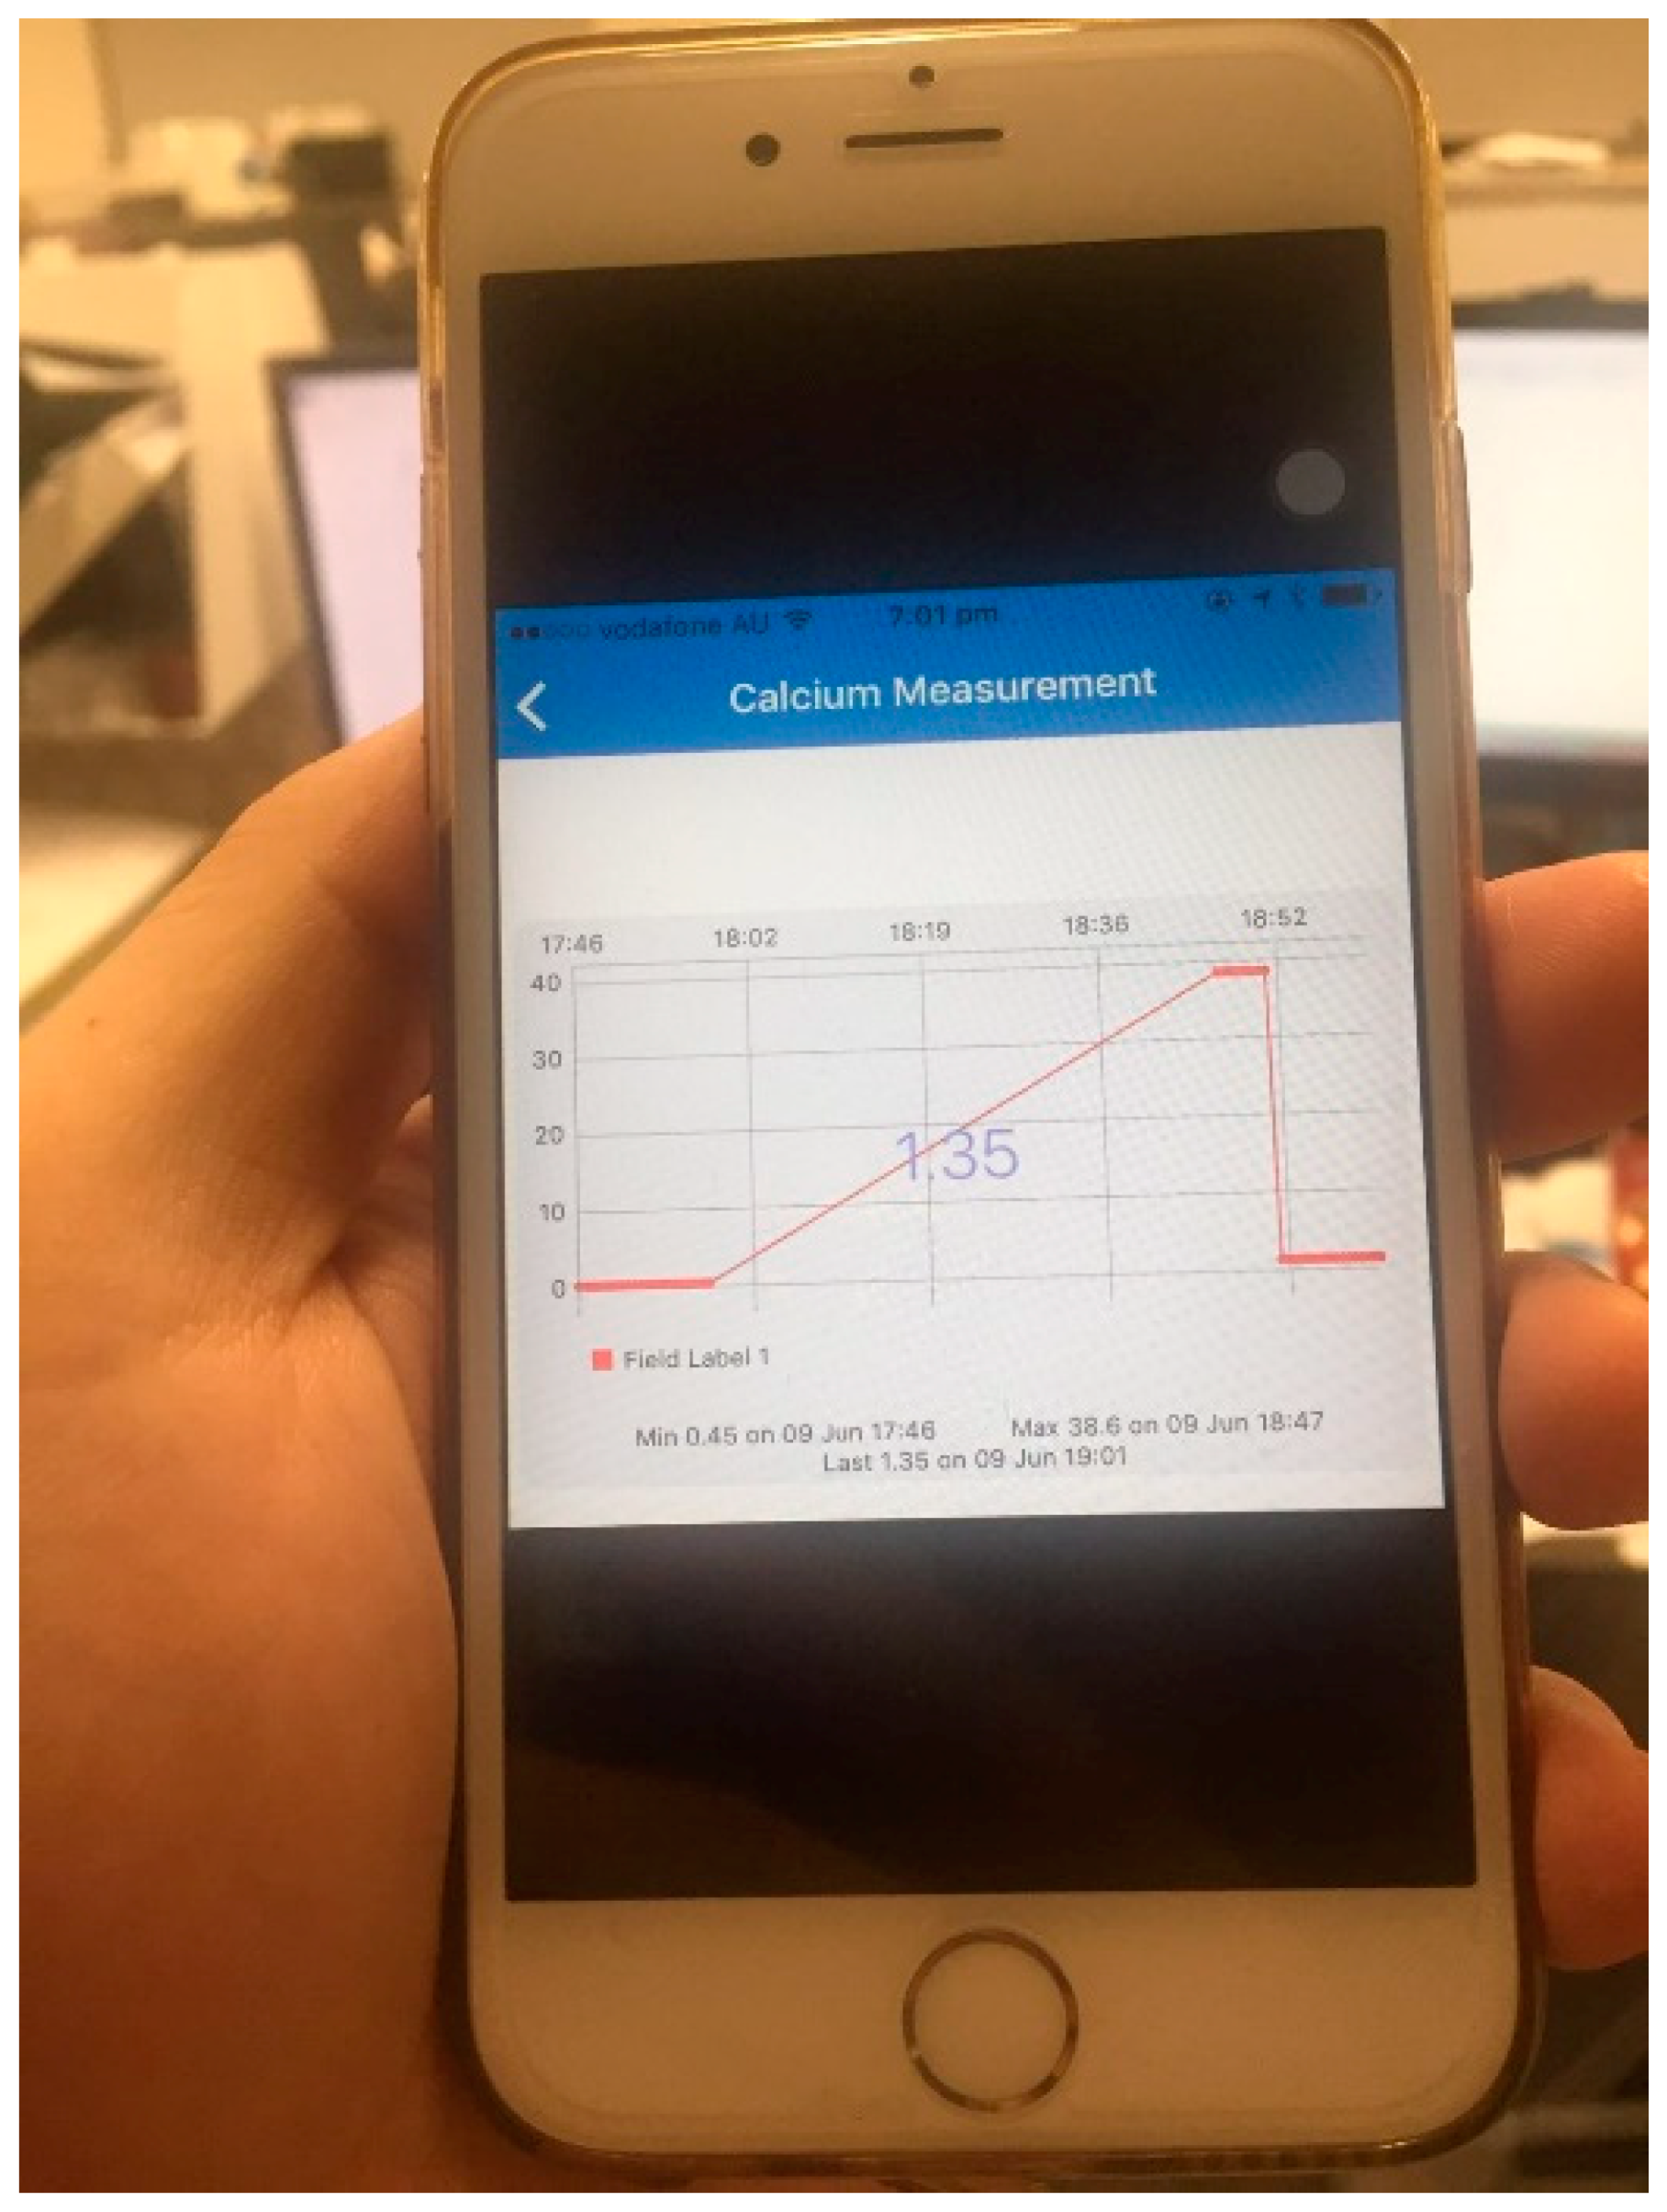
3.3. IoT Data from the Point-of-Care Device

Figure 14 shows the real-time data of calcium concentration based on Equation (4). The measured concentration was 39.8 µM–1.3 µM and the system was used for a few hours to see the performance. Only 10 min of data are shown on this software below.
The results can also be shown on the cell phone app, as shown in Figure 15. The secured server is visible from any location and the physician can easily monitor the calcium level and alert the patient if required. The device is portable, light, and easy to use.

4. Conclusions

In this paper, the design, development, and implementation of an electrochemical microfluidics detection system with the integration of interdigital sensors and IoT was done. The fabrication of the prototypes was done using a 3D printing technique to develop the molds for the microfluidic channels, on top of which the casting of PDMS was done at specific heights. The channel was adjusted to accommodate a fixed volume of 22.5 µL of the sample to flow through it. This PDMS-based microfluidic channel was then embedded on an interdigital sensing bottom platform to perform electrochemical sensing of the tested solutions. The interdigital sensors having gold electrodes operated on capacitive sensing due to the nature of the electrodes. The fabricated sensors were then tested with five different calcium samples to envisage their uses for biomedical applications. The system was capable of measuring the calcium samples at very low concentrations ranging from 400–500 Hz. The advantages of this system includes its low-cost, easy fabrication process, and capability to measure very low concentrations. One of the frequencies (450 Hz) was chosen to develop the standard curve and it was used in combination with a microcontroller-based system. The results of the concentration changing from 39.8 µM to 1.35 µM in nearly real time were shown in the app, which was transported to the cloud for further analysis. It is a platform that can be used for different biomedical applications. Based on the monitoring of the small changes of free calcium in the buffer, we will be able to measure the free calcium change in milk or cell culture in future applications.

Author Contributions

Conceptualization, Y.Y. and S.H.; Investigation, Y.Y and S.H.; Resources, S.F. provides the 3D printing devices, Y.Y. and S.H. provides the PDMS, M.E.E.A. provides the IoT systems and N.A. provides the capacitive sensor; Data Curation, Y.Y. and S.H.; Writing-Original Draft Preparation, Y.Y., S.F., M.E.E.A. and A.N.; Writing-Review & Editing, all authors; Visualization, Y.Y., S.F. and S.H.; Supervision, Y.Y. and S.H.; Project Administration, Y.Y. and S.H.

Funding

This research received financial support from Guangzhou University with the funding code: 69-18ZX10010.

Acknowledgments

The authors thank the Guangzhou University for financial support (funding code: 69-18ZX10010) and thank the Macquarie University for providing the resources.

Conflicts of Interest

The authors declare no conflict of interest.

References

  1. Feng, S.; Dong, T.; Yang, Z. Detection of urinary tract infections on lab-on-chip device by measuring photons emitted from atp bioluminescence. In Proceedings of the 36th Annual International Conference of the IEEE Engineering in Medicine and Biology Society (EMBC), Chicago, IL, USA, 26–30 August 2014; pp. 3114–3117. [Google Scholar]
  2. Feng, S.; Dong, T. Design and characterization of a lab-on-chip for continuous bioluminescent measurements of atp. In Proceedings of the 2014 IEEE International Symposium on Medical Measurements and Applications (MeMeA), Lisboa, Portugal, 11–12 June 2014; pp. 1–4. [Google Scholar]
  3. Feng, S.L.; Dong, T. Applied technology in diaper-based uti testing for elder people by using nitrite ion selective electrode. Appl. Mech. Mater. 2014, 662, 225–228. [Google Scholar] [CrossRef]
  4. Feng, S.; Roseng, L.E.; Dong, T. Quantitative detection of escherichia coli and measurement of urinary tract infection diagnosis possibility by use of a portable, handheld sensor. In Proceedings of the 2015 IEEE International Symposium on Medical Measurements and Applications (MeMeA), Turin, Italy, 7–9 May 2015; pp. 586–589. [Google Scholar]
  5. Feng, S. Investigations of Paper-based Lab-on-Chips for On-Diaper Point-of-Care Screening of Urinary Tract Infections. Master′s Thesis, Universitetet i Sørøst-Norge, Porsgrunn, Norway, 2015. [Google Scholar]
  6. Nag, A.; Zia, A.I.; Li, X.; Mukhopadhyay, S.C.; Kosel, J. Novel sensing approach for lpg leakage detection—Part ii: Effects of particle size, composition, and coating layer thickness. IEEE Sens. J. 2016, 16, 1088–1094. [Google Scholar] [CrossRef]
  7. Rahman, M.S.A.; Mukhopadhyay, S.C.; Yu, P.-L. Novel planar interdigital sensors. In Novel Sensors for Food Inspection: Modelling, Fabrication and Experimentation; Springer: Berlin/Heidelberg, Germany, 2014; Volume 10, pp. 11–35. [Google Scholar]
  8. Mohd Syaifudin, A.; Yunus, M.; Mukhopadhyay, S.; Jayasundera, K. A novel planar interdigital sensor for environmental monitoring. In Proceedings of the 2009 IEEE SENSORS, Christchurch, New Zealand, 25–28 October 2009; pp. 105–110. [Google Scholar]
  9. Syaifudin, A.M.; Jayasundera, K.; Mukhopadhyay, S. A low cost novel sensing system for detection of dangerous marine biotoxins in seafood. Sens. Actuat. B-Chem. 2009, 137, 67–75. [Google Scholar] [CrossRef]
  10. Afsarimanesh, N.; Mukhopadhyay, S.C.; Kruger, M. Molecularly imprinted polymer-based electrochemical biosensor for bone loss detection. IEEE Trans. Biomed. Eng. 2018, 65, 1264–1267. [Google Scholar] [CrossRef] [PubMed]
  11. Beebe, D.J.; Denton, D.D.; Radwin, R.G.; Webster, J.G. A silicon-based tactile sensor for finger-mounted applications. IEEE Trans. Biomed. Eng. 1998, 45, 151–159. [Google Scholar] [CrossRef] [PubMed] [Green Version]
  12. Nambiar, S.; Yeow, J.T. Conductive polymer-based sensors for biomedical applications. Biosens. Bioelectron. 2011, 26, 1825–1832. [Google Scholar] [CrossRef] [PubMed]
  13. Pramanik, C.; Saha, H.; Gangopadhyay, U. Design optimization of a high performance silicon mems piezoresistive pressure sensor for biomedical applications. J. Micromech. Microeng. 2006, 16, 2060. [Google Scholar] [CrossRef]
  14. Errachid, A.; Ivorra, A.; Aguilo, J.; Villa, R.; Zine, N.; Bausells, J. New technology for multi-sensor silicon needles for biomedical applications. Sens. Actuat. B-Chem. 2001, 78, 279–284. [Google Scholar] [CrossRef]
  15. Nag, A.; Afasrimanesh, N.; Feng, S.; Mukhopadhyay, S.C. Strain induced graphite/pdms sensors for biomedical applications. Sens. Actuat. A-Phys. 2018, 271, 257–269. [Google Scholar] [CrossRef]
  16. Vashist, S.K. Point-of-care diagnostics: Recent advances and trends. Biosensors 2017, 7, 62. [Google Scholar] [CrossRef] [PubMed]
  17. Khan, M.S.; Misra, S.K.; Wang, Z.; Daza, E.; Schwartz-Duval, A.S.; Kus, J.M.; Pan, D.; Pan, D. Based analytical biosensor chip designed from graphene-nanoplatelet-amphiphilic-diblock-co-polymer composite for cortisol detection in human saliva. Anal. Chem. 2017, 89, 2107–2115. [Google Scholar] [CrossRef] [PubMed]
  18. Uludag, Y.; Narter, F.; Sağlam, E.; Köktürk, G.; Gök, M.Y.; Akgün, M.; Barut, S.; Budak, S. An integrated lab-on-a-chip-based electrochemical biosensor for rapid and sensitive detection of cancer biomarkers. Anal. Bioanal. Chem. 2016, 408, 7775–7783. [Google Scholar] [CrossRef] [PubMed]
  19. Wu, Y.; Xue, P.; Kang, Y.; Hui, K.M. Based microfluidic electrochemical immunodevice integrated with nanobioprobes onto graphene film for ultrasensitive multiplexed detection of cancer biomarkers. Anal. Chem. 2013, 85, 8661–8668. [Google Scholar] [CrossRef] [PubMed]
  20. Wu, Y.; Xue, P.; Hui, K.M.; Kang, Y. A paper-based microfluidic electrochemical immunodevice integrated with amplification-by-polymerization for the ultrasensitive multiplexed detection of cancer biomarkers. Biosens. Bioelectron. 2014, 52, 180–187. [Google Scholar] [CrossRef] [PubMed]
  21. Korotcenkov, G.; Brinzari, V.; Cho, B.K. Conductometric gas sensors based on metal oxides modified with gold nanoparticles: A review. Microchim. Acta 2016, 183, 1033–1054. [Google Scholar] [CrossRef]
  22. Hung, D.Q.; Nekrassova, O.; Compton, R.G. Analytical methods for inorganic arsenic in water: A review. Talanta 2004, 64, 269–277. [Google Scholar] [CrossRef] [PubMed]
  23. Alahi, M.E.E.; Li, X.; Mukhopadhyay, S.; Burkitt, L. A temperature compensated smart nitrate-sensor for agricultural industry. IEEE Trans. Ind. Electron. 2017, 64, 7333–7341. [Google Scholar] [CrossRef]
  24. Khan, M.S.; Misra, S.K.; Schwartz-Duval, A.S.; Daza, E.; Ostadhossein, F.; Bowman, M.; Jain, A.; Taylor, G.; McDonagh, D.; Labriola, L.T. Real-time monitoring of post-surgical and post-traumatic eye injuries using multilayered electrical biosensor chip. ACS Appl. Mater. Interfaces 2017, 9, 8609–8622. [Google Scholar] [CrossRef] [PubMed]
  25. Nukala, B.T.; Nakano, T.; Rodriguez, A.; Tsay, J.; Lopez, J.; Nguyen, T.Q.; Zupancic, S.; Lie, D.Y. Real-time classification of patients with balance disorders vs. Normal subjects using a low-cost small wireless wearable gait sensor. Biosensors 2016, 6, 58. [Google Scholar] [CrossRef] [PubMed]
  26. Sharma, S.; Zapatero-Rodríguez, J.; Estrela, P.; O′Kennedy, R. Point-of-care diagnostics in low resource settings: Present status and future role of microfluidics. Biosensors 2015, 5, 577–601. [Google Scholar] [CrossRef] [PubMed] [Green Version]
  27. Sheikh, N.J.; Sheikh, O. Forecasting of biosensor technologies for emerging point of care and medical iot applications using bibliometrics and patent analysis. In Proceedings of the 2016 Portland International Conference on Management of Engineering and Technology (PICMET), Honolulu, HI, USA, 4–8 September 2016; pp. 3082–3093. [Google Scholar]
  28. Mora, H.; Gil, D.; Terol, R.M.; Azorín, J.; Szymanski, J. An iot-based computational framework for healthcare monitoring in mobile environments. Sensors 2017, 17, 2302. [Google Scholar] [CrossRef] [PubMed]
  29. Islam, S.M.R.; Kwak, D.; Kabir, M.H.; Hossain, M.; Kwak, K.S. The internet of things for health care: A comprehensive survey. IEEE Access 2015, 3, 678–708. [Google Scholar] [CrossRef]
  30. Smeets, W.T.G.; Seekles, L. Determination of the content of calcium ions in milk ultrafiltrate. Nature 1952, 169, 802. [Google Scholar] [CrossRef] [PubMed]
  31. Nirschl, M.; Ottl, J.; Vörös, J. Conformational changes of calmodulin on calcium and peptide binding monitored by film bulk acoustic resonators. Biosensors 2011, 1, 164–176. [Google Scholar] [CrossRef] [PubMed] [Green Version]
  32. Pinton, P.; Rimessi, A.; Romagnoli, A.; Prandini, A.; Rizzuto, R. Biosensors for the detection of calcium and pH. Methods Cell Biol. 2007, 80, 297–325. [Google Scholar] [PubMed]
  33. Mamishev, A.V.; Sundara-Rajan, K.; Fumin, Y.; Yanqing, D.; Zahn, M. Interdigital sensors and transducers. Proc. IEEE 2004, 92, 808–845. [Google Scholar] [CrossRef] [Green Version]
  34. Mamishev, A.V.; Du, Y.; Bau, J.H.; Lesieutre, B.C.; Zahn, M. Evaluation of diffusion-driven material property profiles using three-wavelength interdigital sensor. IEEE Trans. Dielectr. Electr. Insul. 2001, 8, 785–798. [Google Scholar] [CrossRef] [Green Version]
  35. Khan, M.S.; Misra, S.K.; Dighe, K.; Wang, Z.; Schwartz-Duval, A.S.; Sar, D.; Pan, D. Electrically-receptive and thermally-responsive paper-based sensor chip for rapid detection of bacterial cells. Biosens. Bioelectron. 2018, 110, 132–140. [Google Scholar] [CrossRef] [PubMed]
  36. Zia, A.I.; Rahman, M.S.A.; Mukhopadhyay, S.C.; Yu, P.-L.; Al-Bahadly, I.H.; Gooneratne, C.P.; Kosel, J.; Liao, T.-S. Technique for rapid detection of phthalates in water and beverages. J. Food Eng. 2013, 116, 515–523. [Google Scholar] [CrossRef]
  37. Thingspeak. Available online: https://thingspeak.com/ (accessed on 26 August 2017).
  38. Arduino. Available online: https://www.arduino.cc/en/Reference/Ciao (accessed on 26 August 2017).
  39. Arduino Uno Wifi. Available online: https://store.arduino.cc/usa/arduino-uno-wifi (accessed on 4 September 2017).
  40. Devices, A. Ad5933: Impedance Analyzer. Available online: http://www.analog.com/media/en/technical-documentation/data-sheets/AD5933.pdf (accessed on 4 September 2017).
  41. Devices, A. Adg849. Available online: http://www.analog.com/media/en/technical-documentation/data-sheets/ADG849.pdf (accessed on 8 September 2017).
  42. Device, A. Direct Digital Synthesis. Available online: http://www.analog.com/media/en/analog-dialogue/volume-38/number-3/articles/all-about-direct-digital-synthesis.pdf (accessed on 8 September 2017).
  43. Mankar, J.; Darode, C.; Trivedi, K.; Kanoje, M.; Shahare, P. Review of i2c protocol. Int. J. 2014, 2, 474–479. [Google Scholar]
  44. Arduino. Available online: https://www.arduino.cc/en/Guide/Environment (accessed on 10 July 2018).
  45. Manickam, A.; Johnson, C.A.; Kavusi, S.; Hassibi, A. Interface design for cmos-integrated electrochemical impedance spectroscopy (eis) biosensors. Sensors 2012, 12, 14467–14488. [Google Scholar] [CrossRef] [PubMed]
  46. Scott, D.W.; Alseiha, Y. Determining detection limits of aqueous anions using electrochemical impedance spectroscopy. J. Anal. Sci. Technol. 2017, 8, 17. [Google Scholar] [CrossRef]
  47. Khan, M.S.; Dosoky, N.S.; Mustafa, G.; Patel, D.; Berdiev, B.; Williams, J.D. Electrophysiology of epithelial sodium channel (enac) embedded in supported lipid bilayer using a single nanopore chip. Langmuir 2017, 33, 13680–13688. [Google Scholar] [CrossRef] [PubMed]
Figure 1. The configuration of the interdigital sensor. (a) The configuration of the whole sensor with 2 connect pads and one sending pad. (b) The configuration of the sensing pad with an area of 2.5 mm × 2.5 mm. (c) The zoom view on the sensing pad, showing the widths of the electrodes and the gaps between the electrodes are all 25 µm.
Applsci 08 01357 g001
Figure 2. The schematic diagram of the working principle of the developed sensor prototypes. (a) The operation of the interdigital sensors was in resemblance to a planar parallel-plate capacitor where the electric field lines would penetrate through the material under test (MUT) that is kept in contact or proximity to the sensing area. (b) The field penetrates through the sample flowing through the microfluidic channel to determine their responses at different frequencies.
Applsci 08 01357 g002
Figure 3. The layout of our microfluidics detection system.
Applsci 08 01357 g003
Figure 4. The individual steps of fabrication. (a) The drawing of the molds by Creo Parametric 2.0. (b) The PDMS-filled 3D printed mold and curing. (c) The PDMS bottom layer. (d) The interdigital sensors were put on the glass slide, around which were filled with PDMS with the sensing part exposed. (e) The complete structure of the electrochemical microfluidic device. (f) The connecting wires to the instrument.
Applsci 08 01357 g004
Figure 5. The Impedance Analyzer (LCR meter) was used for experimental calibration measurements.
Applsci 08 01357 g005
Figure 6. The complete block diagram of the point-of-care (PoC) system.
Applsci 08 01357 g006
Figure 7. The circuit diagram of the proposed PoC device.
Applsci 08 01357 g007
Figure 8. The structure of our whole Point-of-Care System.
Applsci 08 01357 g008
Figure 9. The software flow of the point-of-care device for the calcium calculation and transfer to the IoT cloud server.
Applsci 08 01357 g009
Figure 10. The response of the developed sensors in terms of reactance versus frequency to different calcium solutions by the LCR meter.
Applsci 08 01357 g010
Figure 11. The measurement of different concentrations of calcium from the PoC device (reactance versus frequency).
Applsci 08 01357 g011
Figure 12. The calibration standard of the PoC device at a frequency of 450 Hz.
Applsci 08 01357 g012
Figure 13. Repeatability of the measurement.
Applsci 08 01357 g013
Figure 14. The real-time data from the developed point-of-care device.
Applsci 08 01357 g014
Figure 15. The app on a cell phone.
Applsci 08 01357 g015

