An Analysis of Land-Use and Land-Cover Change in the Zhujiang–Xijiang Economic Belt, China, from 1990 to 2017


1
State Key Laboratory of Resources and Environmental Information System, Institute of Geographic Sciences and Natural Resources Research, Chinese Academy of Sciences, Beijing 100101, China
2
Department of Geography, Humboldt–Universität zu Berlin, Unter den Linden 6, 10099 Berlin, Germany
3
Leibniz Centre for Agricultural Landscape Research (ZALF), Eberswalder Straße 84, 15374 Müncheberg, Germany
*
Authors to whom correspondence should be addressed.
Appl. Sci. 2018, 8(9), 1524; https://0-doi-org.brum.beds.ac.uk/10.3390/app8091524
Submission received: 16 July 2018
/
Revised: 21 August 2018
/
Accepted: 24 August 2018
/
Published: 1 September 2018
(This article belongs to the Section Environmental Sciences)
Abstract
:Land-use and land-cover change (LUCC) are currently contested topics in the research of global environment change and sustainable change. Identifying the historic land-use change process is important for the new economic development belt (the Zhujiang–Xijiang Economic Belt, ZXEB). During this research, based on long-time-series land-use and land-cover data, while using a combination of a transition matrix method and Markov chain model, the authors derive the patterns, processes, and spatial autocorrelations of land-use and land-cover changes in the ZXEB for the periods 1990–2000 and 2000–2017. Additionally, the authors discuss the spatial autocorrelation of land-use in the ZXEB and the major drivers of urbanization. The results indicate the following: (1) The area of cropland reduces during the two periods, and woodland decreases after the year 2000. The woodland is the most stable land-use type in both periods. (2) Built-up land expansion is the most important land-use conversion process; the major drivers of built-up land expansion are policy intervention, GDP (gross domestic product), population growth, and rural population migration. (3) Transition possibilities indicate that after 2000, most land-use activities become stronger, the global and local Moran’s I of all land-use types show that the spatial autocorrelations have become more closely related, and the spatial autocorrelation of built-up land has become stronger. Policies focus on migration from rural to urban, and peri-urban development is crucial for future sustainable urbanization.
1. Introduction
Land-use and land-cover change (LUCC), as a present feature of global environmental change, are directly driven by human activities [1,2] and have become a contested topic in research on global environmental change and sustainable change [3,4,5]. LUCC specifically refers to changes in the biophysical attributes of the Earth’s surface and the application of these attributes for human purposes [6]. Previous studies have provided examples showing that LUCC is closely related to land degradation [7,8], soil erosion [9], and biodiversity losses [5], as well as threatening food security [5] and contributing to climate change [10].
China is an important part of the global environment. The LUCC and land management in China have experienced significant changes since the 1980s, as the country launched market reforms and actively intersected with globalization [3,11,12]. Different land-use conversion patterns have occurred in different sub-regions of China. Examples include grassland degradation in the northern region [13]; deforestation in the southern region [14]; water body loss in the northern region [15]; the loss of cropland, particularly in coastal regions [16]; and built-up land expansion throughout China [17]. Built-up land expansion is a major land-use conversion process in China and has been shown to have direct and indirect effects on land-use transformation [18]. Specifically, experts and scholars have revealed the patterns, drivers, and ecological issues related to this expansion [12,19,20]. Urban land expansion is occurring rapidly all over the world, causing various problems and relationships with other land-use types, not only in China. Timon et al. [21] indicate that rapid urbanization in North America has challenged the conservation biodiversity and regional ecosystem services, and urbanization has also led to a series of conversions from other land-use types to built-up land. Deriving the historical urbanization patterns and processes is crucial for the sustainable development of urbanization in the future [21,22].
Since 1978, economic reform in China and built-up land expansion, especially urban land expansion, have mainly been a result of economic development, extensive population growth, and policy changes [23,24]. Built-up land expansion includes urban land expansion, rural settlement expansion, and infrastructure area expansion [25,26,27]. Urban land is defined as the built-up land used for urban settlements, and urban land expansion is defined as the urban land containing new built-up areas that are built within a certain time period [23]. The term urban land expansion in this research refers to urbanization. Urban land in China has experienced a significant increase, especially since the 1980s. The number of cities increased from 69 in 1947 to 223 in 1990. Until 2012, there were 670 cities, hosting about 44% of the total population of China [12]. The count of prefecture-level cities rose from 188 in 1990 to 287 in 2000. The percentage of urban population (the population that lives on urban land) reached 49.9% in 2010 and exceeded 50% by the end of 2012. China has become a predominantly urbanized country [17]. The rapid urbanization process has had significant effects on climate change [28], soil protection [29,30], and water conservation [31], and the urban island has led to air pollution, threatening human health [29]. Additionally, urbanization has also affected rural land via the “ecological footprint” through the consumption of cropland in peri-urban residential areas, as well as through infrastructure and amenity uses [5].
Above all, determining detailed land-use change information over a long time period and determining urban land expansion patterns and processes is strategically important for understanding land-use patterns and driving forces in China, as well as for sustainable land-use planning. The Zhujiang–Xijiang Economic Belt (ZXEB) developed a national level strategy in 2014. The strategy aims to develop the ZXEB’s economy, to promote the development in the east and minority areas of China, to strengthen ecological construction and environmental protection, and to narrow regional development differences [32]. The ZXEB is chosen as a case study because of its economic status and urgent land needs. The ZXEB, as a new economic belt in China, faces both huge development opportunities and huge challenges. Thus, the balance between economic development and environmental protection is an important topic for ecological researchers. Determining historical LUCC information and major land-use conversion processes, as well as the urban explosion over the past four decades, is a prerequisite for the sustainable development in the ZXEB. Analyzing the urban dynamics at the regional scale and identifying the characteristics over space and time is important for sustainable urban development in the ZXEB. Urbanization is always accompanied by a population boom and growing gross domestic product (GDP) [12,33]. Growth in population size and economics are a result of urbanization, but also accelerate the process [12,24,34].
A combination of a land-use matrix, Markov chain, and Maron’s I is used to project land-use patterns, processes, and spatial autocorrelation features in this study. Both a land-use matrix and Markov chain methods are used widely to evaluate LUCC conversion patterns. These methods can provide processes and historic transition directions of land-use dynamics. The Markov chain was generally adopted to understand the dynamic change in land use and land cover at different scales [35,36], including urban areas and non-urban areas [37]. It focuses on initial proportion and transition possibilities in different state, and predicting future state based on the current development trend [38]. Many previous researchers have tested and validated these methods [39,40]. Moran’s I is used explore internal differences and spatial correlation characteristics of land-use in ZXEB.
Using LUCC data from China’s land-use/land-cover datasets (CLUDs) [41], the objectives of this study are as follows: (1) to evaluate the LUCC patterns and transition process in the ZXEB from 1990–2017; (2) to identify the urbanization process that has occurred based on LUCC in this region; and (3) to discuss the general drivers of built-up land expansion.
2. Materials and Methods
2.1. Study Area
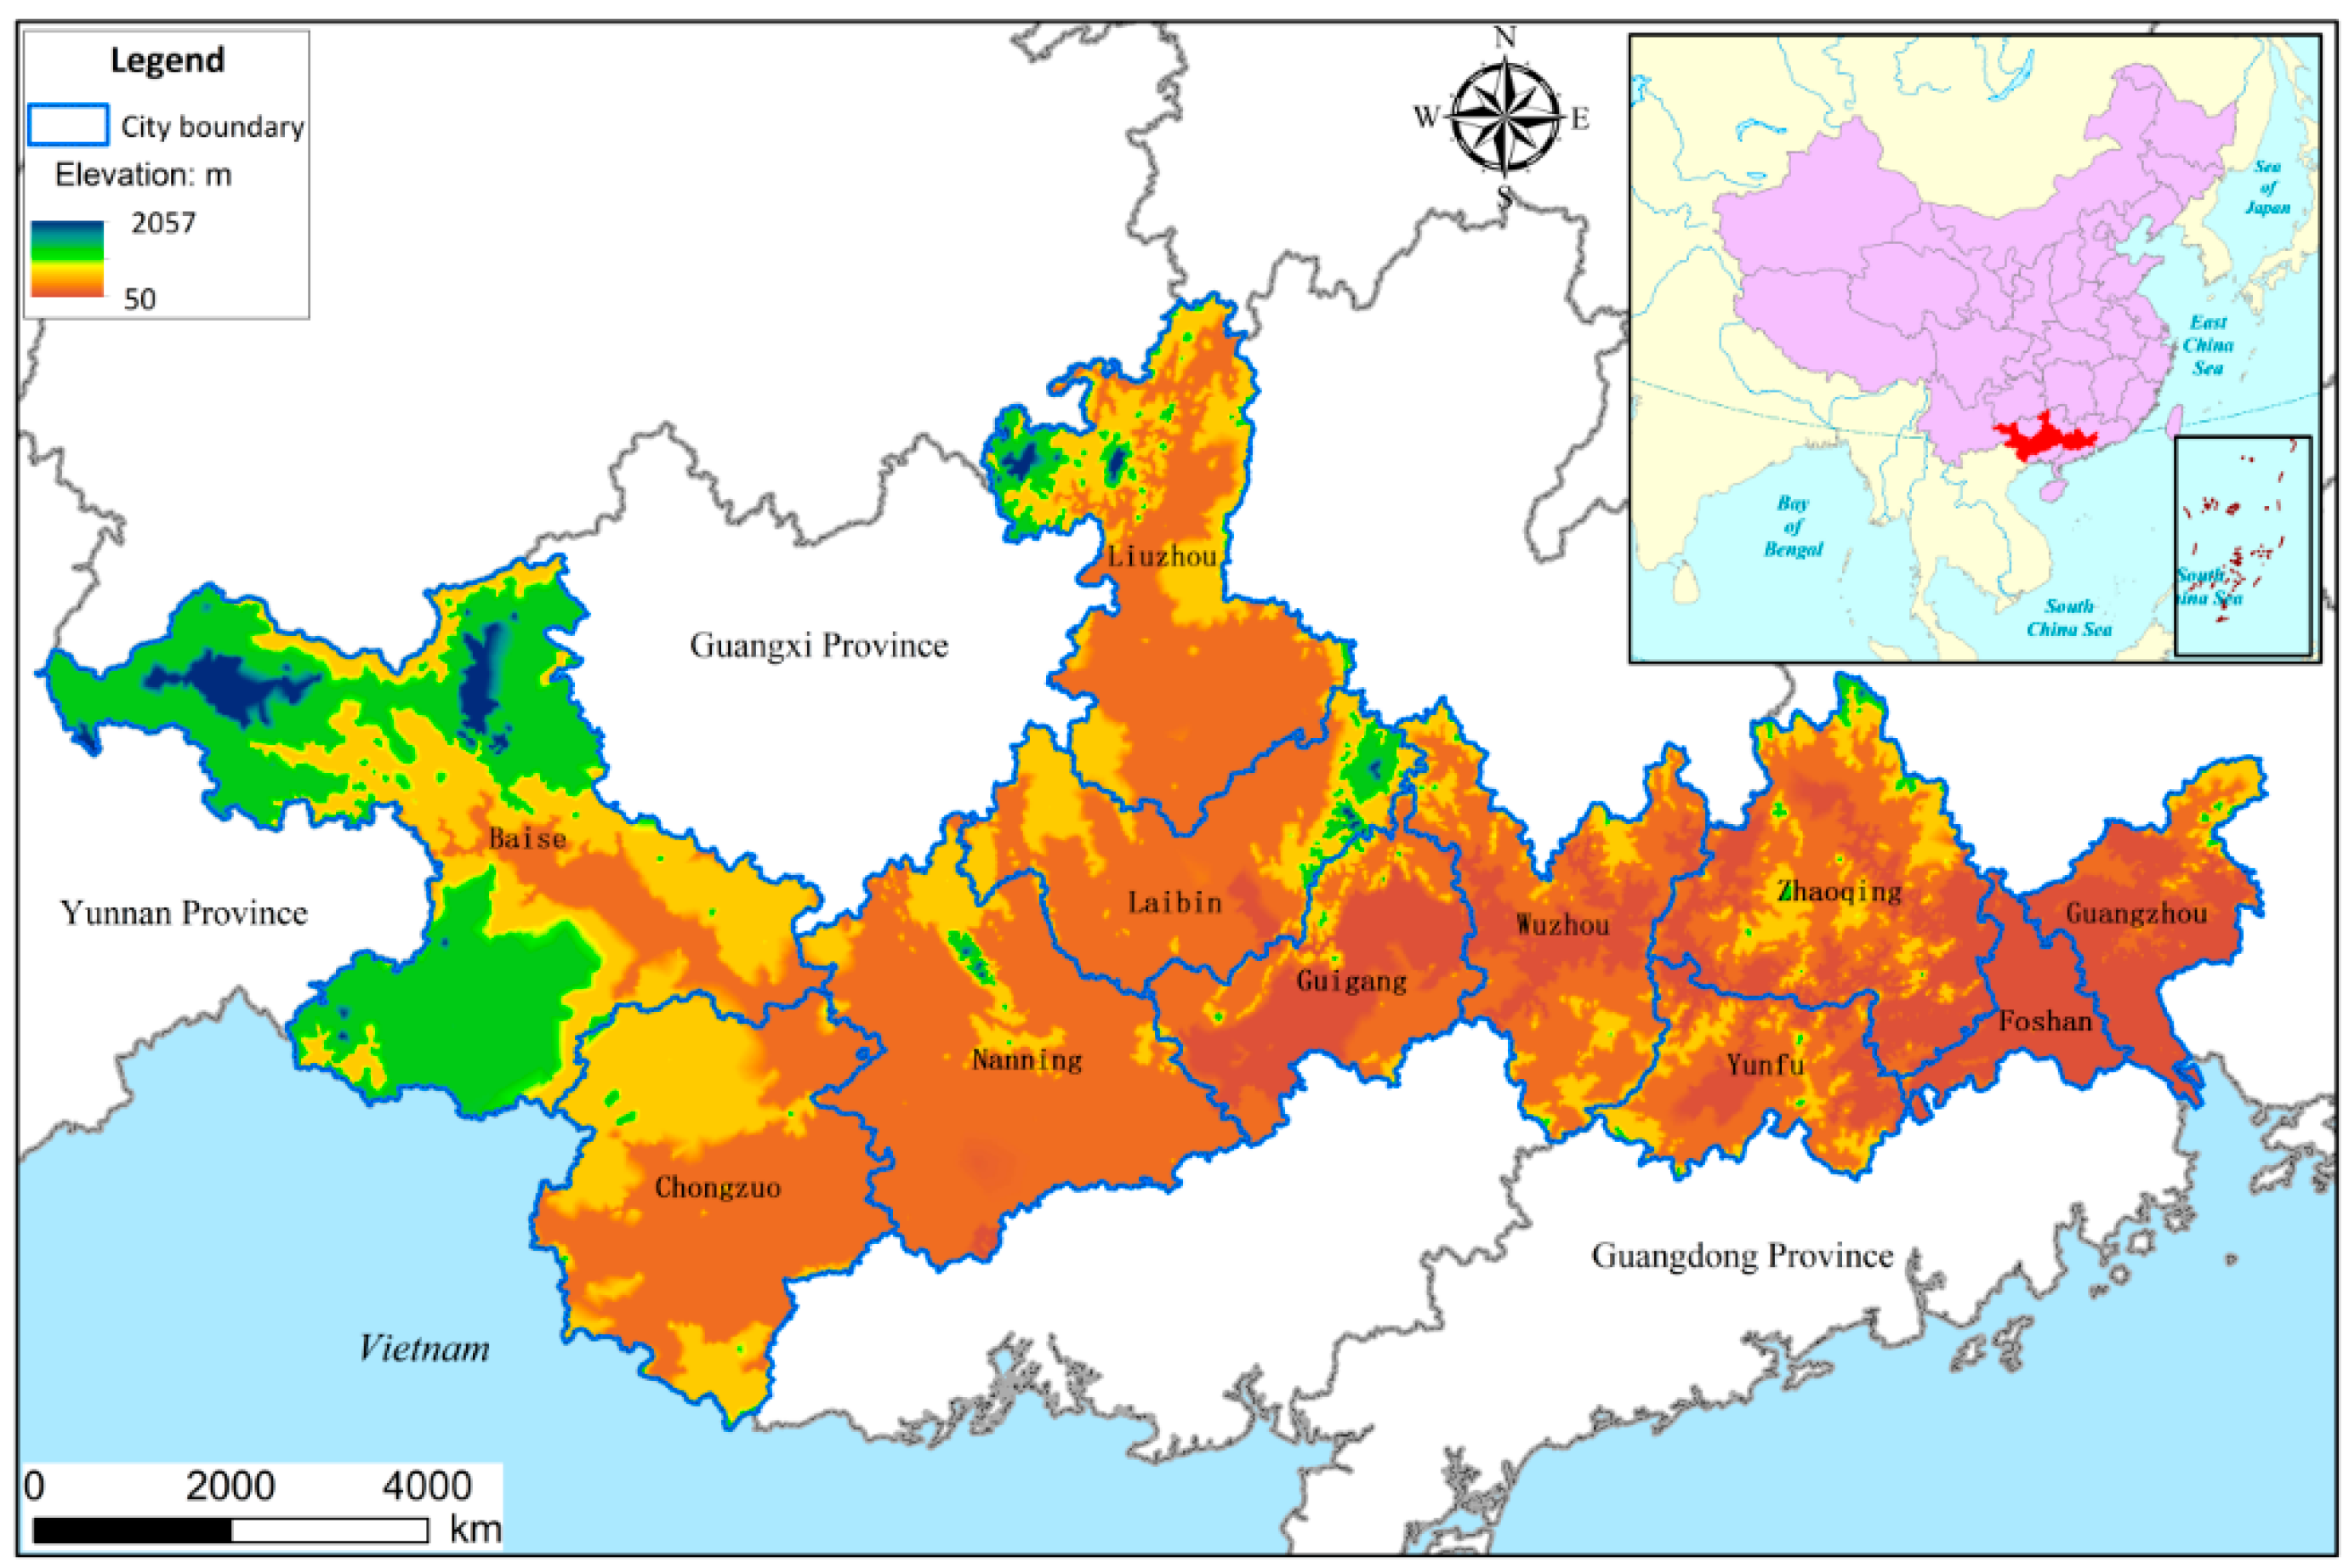
The Zhujiang–Xijiang Economic Belt (ZXEB), located in Southern China, covers an area of 16.45 × 10⁴ km2 and is located at 104°3′–114°3′ E and 22°04′–26°05′ N. The area has an elevation of 50–2057 m (Figure 1). The total population was 4923 × 104 as of 2015; at this time, the gross domestic product (GDP) was 1110 × 104 billion yuan. The ZXEB is a typical karst landscape, and soil from thick limestone material is widely distributed in the area [42]. The ZXEB includes four prefecture-level cities, namely, Zhaoqing, Yunfu, Foshan, and Guangzhou, in Guangdong province, and seven cities, namely, Baise, Chongzuo, Nanning, Laibin, Liuzhou, Guigang, and Wuzhou, in Guangxi province. The ZXEB was created to connect the developed area in the East to the undeveloped area in the West, thus uniting Guangdong and Guangxi, which are connected to Yunnan and Guizhou in northern China and Hong Kong and Macao in southern China [32]. The ZXEB—as a new, developing zone, was created in 2014 and aims to improve the economic development in the majority of China. It is critical that the historic land-use conversion process and urbanization patterns in this special region are studied to provide reference information for sustainable development in the ZXEB.
2.2. Data Collection
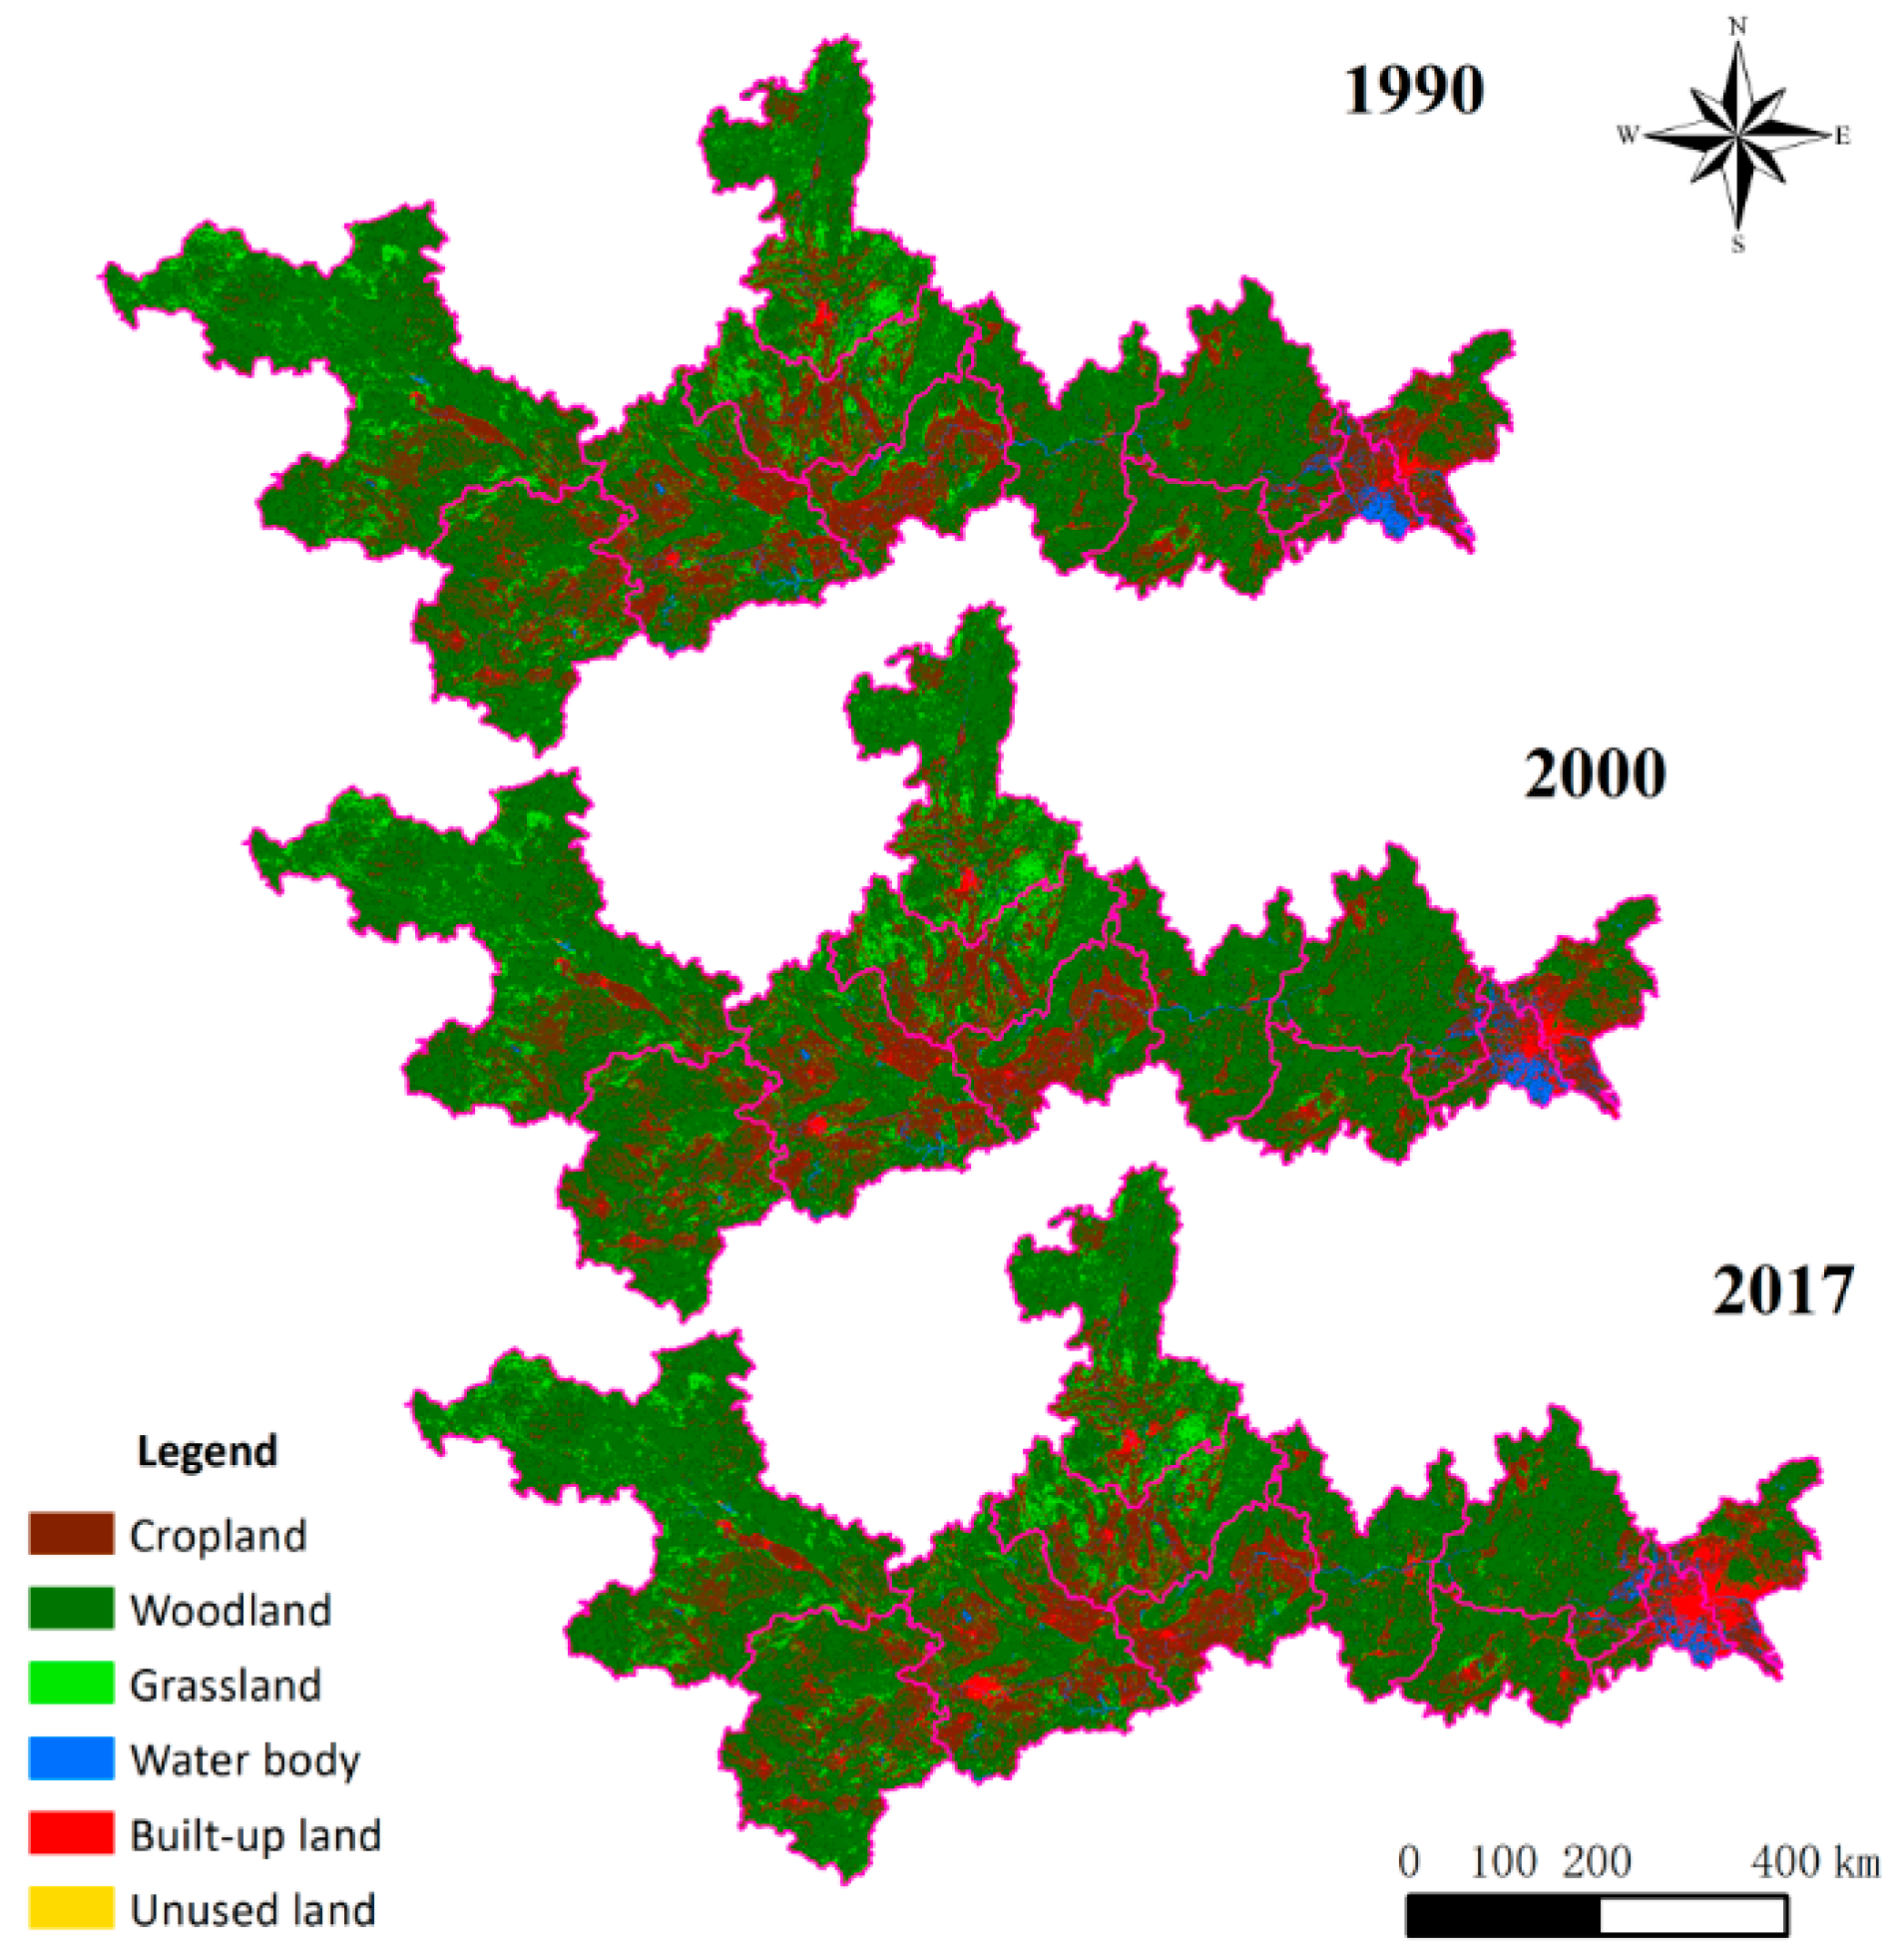
During this research, LUCC data from 1990, 2000 (based on Landsat MSS/TM/ETM+/OLI), and 2017 from Gaofen-1 (GF-1) (http://www.cresda.com/CN/Satellite/3076.shtml) were used as the key information sources (Figure 2). The spatial resolution of the data was 30 m for 1990 and 2000 and 8 m for 2017, which was sufficient for land-use analysis [1,2,6]. The land-use and land-cover data were produced by the Chinese Academy of Science (CAS). During the 1990s, the CAS created the National Resource and Environments Database and has since accumulated massive amounts of LUCC data [43]. The original data source for these LUCC data was remote images. More than 500 remote sensing images from Landsat TM/ETM+/OLI (https://www.usgs.gov/) have been used to map LUCC data for China [6,43]. Most of the images were obtained from similar seasons (July–October) and under cloud-free conditions. Human–computer interactive interpretation, renowned for its high accuracy, was used to digitize the LUCC data at a spatial scale of 1:100,000 [16,41]. The interpretation was approached based on 25 subclasses of land-use types that were defined by Liu et al. [16]. The data were then classified into six classes—including cropland, woodland, grassland, water body, unused land, and built-up land—and 25 subclasses (Table 1, Liu et al., and Dent et al. [16,41]).
The accuracy of the LUCC data was validated by field surveys. The results indicated that the overall accuracy of the first-level land use types was 94.0%, and the accuracy for the 25 sub-classes was 91.2% [41]. These data have been used previously to evaluate land degradation [13], to identify the major driver of LUCC change [2,41], to predict future land-use change [44], and to model optimal land-use strategies [45]. The classification system is important for the production of LUCC data. The classification used in this study was based on six land-use types defined by Liu et al. [16]. Twenty-five subclasses were grouped into the following six classes: cropland, woodland, grassland, water bodies, built-up land, and unused land. To measure urban expansion in the ZXEB, the authors also analyzed the following sub-classes: urban land, rural settlements, and infrastructure areas, all of which belong to the general class of built-up land (Table 1).
To analyze the socio-economic drivers of built-up land expansion, the authors also collected gross domestic product (GDP) (for ZXEB, except Chongzuo), urban and rural net income (for ZXEB, except Chongzuo), and total population (for Guangdong and Guangxi province); data were collected from 1994 to 2015. Some of the statistical data in Chongzuo were not available because of an administrative level change. The rural and employment data in Guangxi and Guangdong provinces were collected from 1980 to 2010. All the data were collected from the National Bureau of Statistics of China [46], in order to keep the statistical data consistent.
2.3. Methods
2.3.1. Transition Matrix
To determine the land-use type conversion processes based on Markov model, a land-use transition matrix (primary matrix) was used to describe the net land-use change or lack of change in two time periods: 1990–2000 and 2000–2017 [2]. Additionally, a further calculation using the matrix table was made to calculate gains (increases) and losses (decreases). Gains in one land-use type represented the degree to which a land-use type increased between the study periods, while losses measured the extent to which a land-use type was reduced [39].
2.3.2. Markov Modeling of Land-Use and Land-Cover Change
The primary occupation and transition probabilities (TPs) of different periods were used to determine the trend of development and predict the state of the future [40]. Markov chains have been widely used to evaluate changes in land-use and land-cover at different scales, covering different land-use types [35,40,47]. The applicability and feasibility of Markov chains have been testified by many previous studies and the results approximately conform to observed results [36,48]. Moreover, the combination of a geographic information system (GIS), remote sensing data, and Markov chains was promoted because of the nature of GIS and its integration with remote sensing [35,40]
Markov chains have many assumptions. One basic assumption of land-use and land-cover change is that they are a stochastic process, and different categories are the states of a chain [35]. A chain is defined as a stochastic process with the property value of the process at time t, where Xt only depends on the value at previous time t–1, Xt–1, and is not related to the sequence of values Xt–2, Xt–2 ……. X0. [40,49]. A chain is a transition process from one state to another state. P is transition possibility, standing for the possibility of change from current state to next state, and can be expressed as follows:
where P stands for probability from state i to state j.
Equation (1) must satisfy the following two conditions:
During this study, Markov chain analysis was used as a descriptive tool to understand and quantify the land-use transition processes in ZXEB.
2.3.3. Detection of Spatial Autocorrelation
Spatial autocorrelation, including global spatial autocorrelation and local spatial autocorrelation, can be used to describe and compare the spatial structure of the data. Generally, global spatial autocorrelation was used to present the average degree of spatial difference between a region and its surroundings, while local spatial autocorrelation was used for further analysis as to whether there was a high or low value of local space and the aggregation of the observed value [50].
Here, the authors introduced the principle of Moran’s I regarding spatial autocorrelation as follows [50]:
where, for , n was the total amount of the space unit and Xi was the observation value in the space unit i; was the average value of Xi; and Wij was the spatial weight matrix, which represented the neighborhood relation of area i and area j and can be measured by distance criterion of adjacency criterion. The authors calculated the global spatial autocorrelation and local spatial autocorrelation via Geoda [51]. The value of Moran’s I, which is normally between [−1, 1]—although when the value was larger than 0, it showed a positive autocorrelation, and vice versa when the value was 0—implied no autocorrelation between the data [52].
3. Results
3.1. The LUCC Pattern in 1990, 2000, and 2017
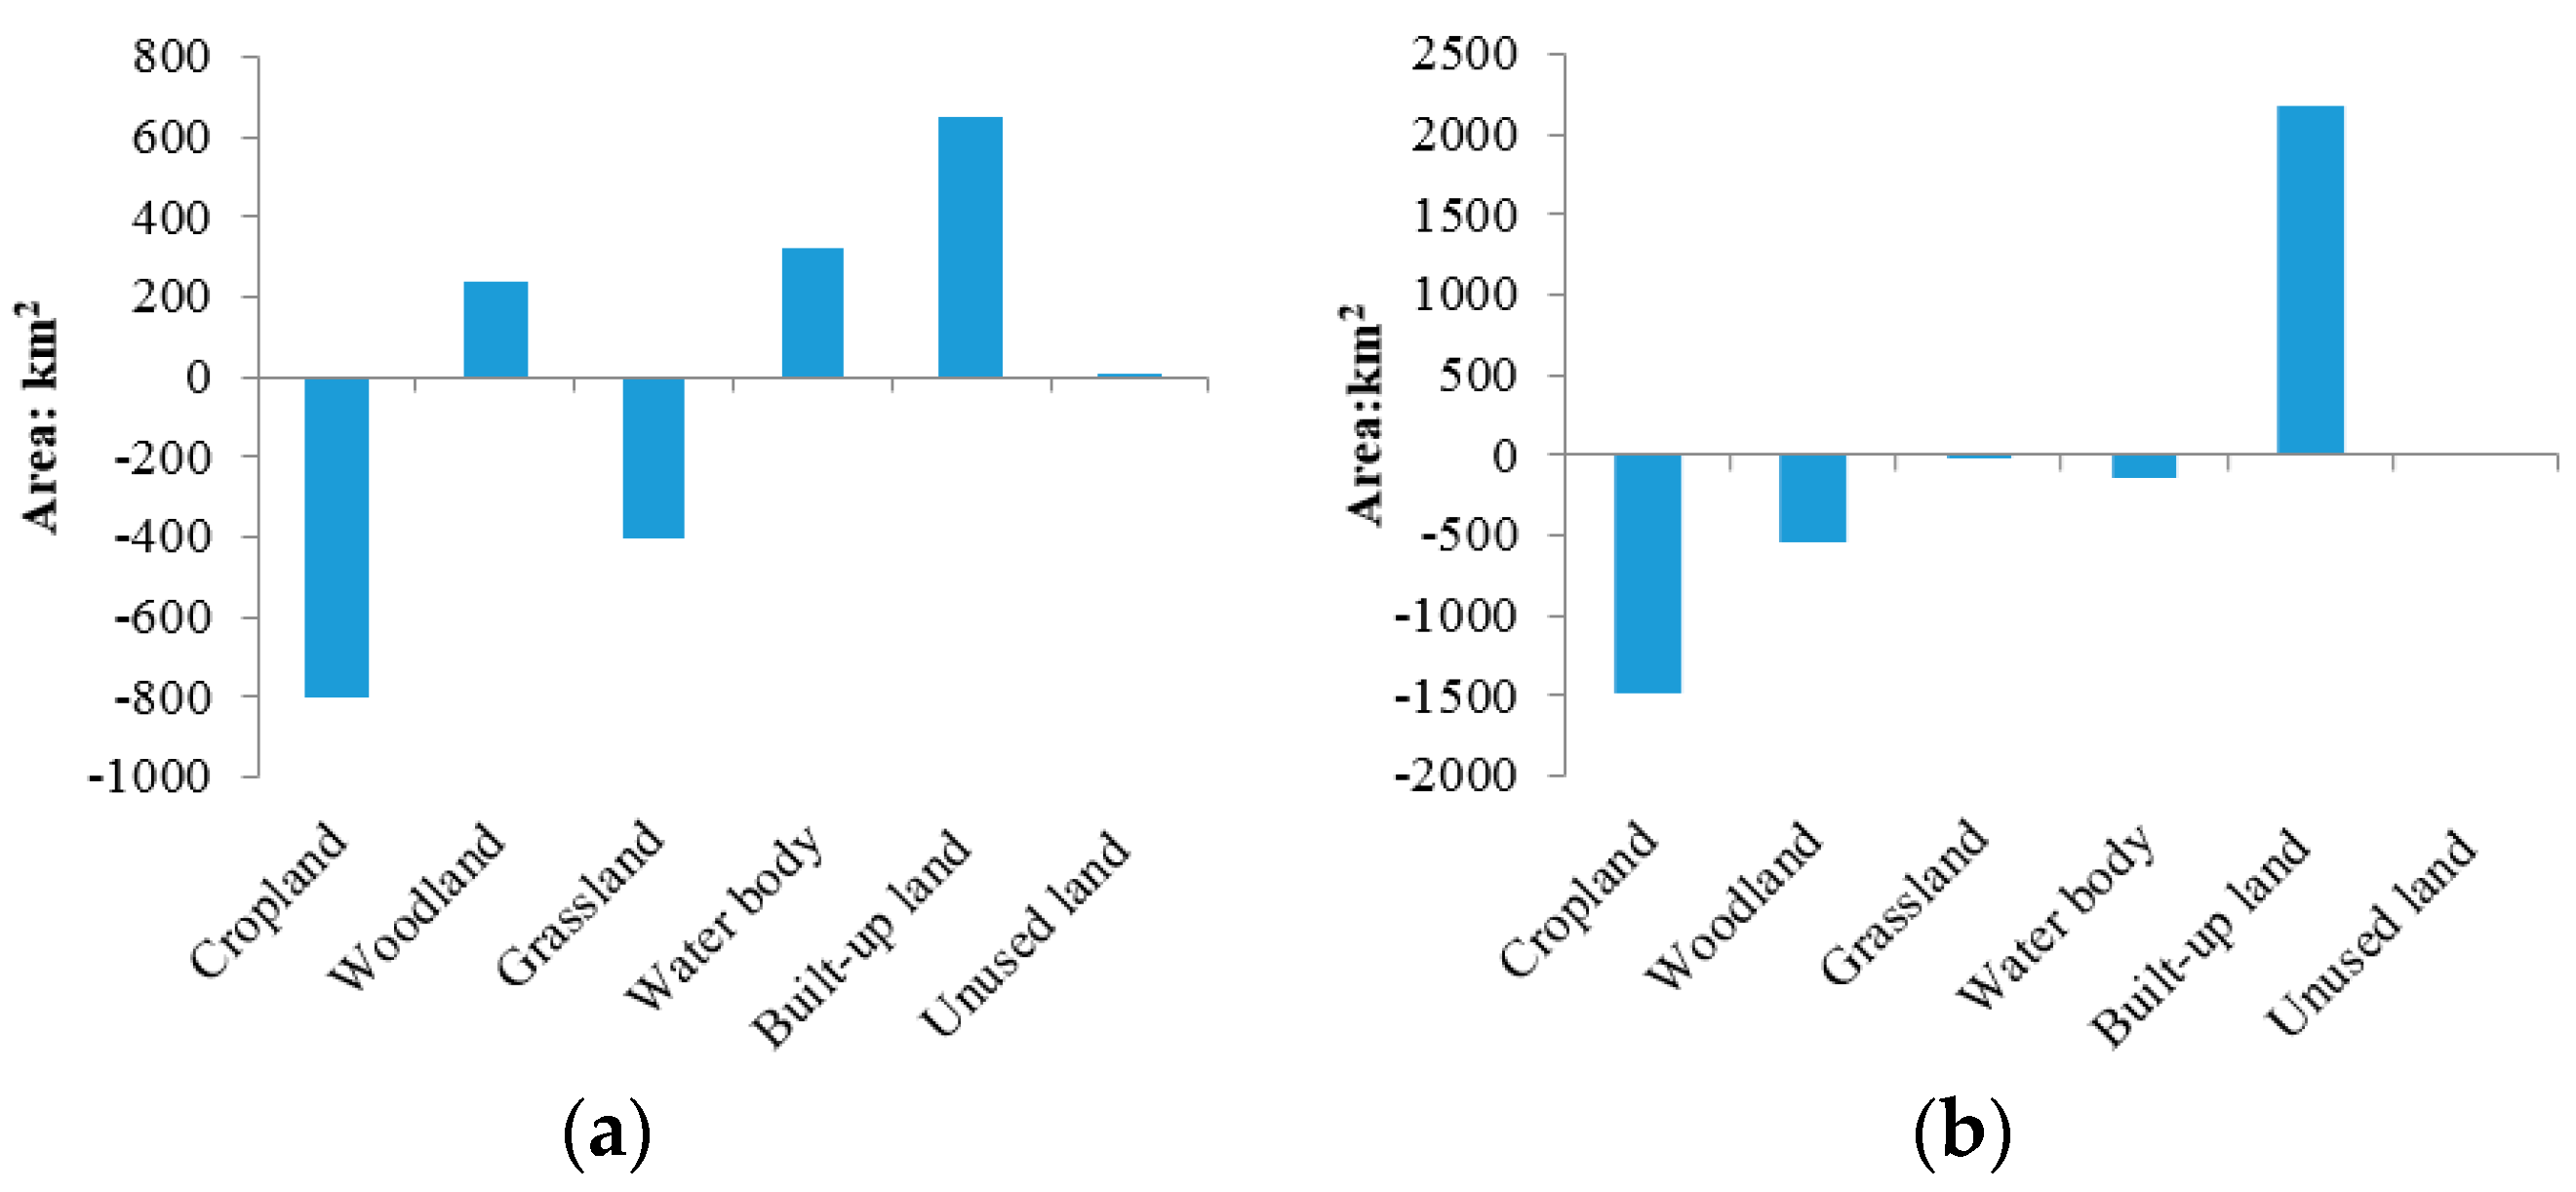
Woodland was the dominant land-use type (63.4% of the total area) in the ZXEB in 2017, followed by cropland and grassland (22.9% and 7.1%, respectively). Total built-up land, water bodies, and unused land comprised less than 10% of this area. During the period from 1990 to 2000, cropland experienced the largest decrease, and built-up land saw the largest increase in total area (−0.49% and 0.39%, respectively) (Figure 2 and Figure S1). Grassland decreased by 404 km2, while woodland and water bodies increased by 238 km2 and 321 km2, respectively. Considering the time frame from 2000 to 2017, the areas of cropland, woodland, grassland, and water bodies decreased. Cropland experienced the largest decrease in total area (1481 km2 or 0.9%), followed by woodland and water bodies (0.33% and 0.09%, respectively). Built-up land increased by 2176 km2 (1.32%) (Figure 3 and Figure S1). Above all, built-up land always increased, and cropland decreased between 1990–2017. Alternatively, woodland and water body areas first increased and then decreased, and grassland areas experienced slight decreases in both periods.
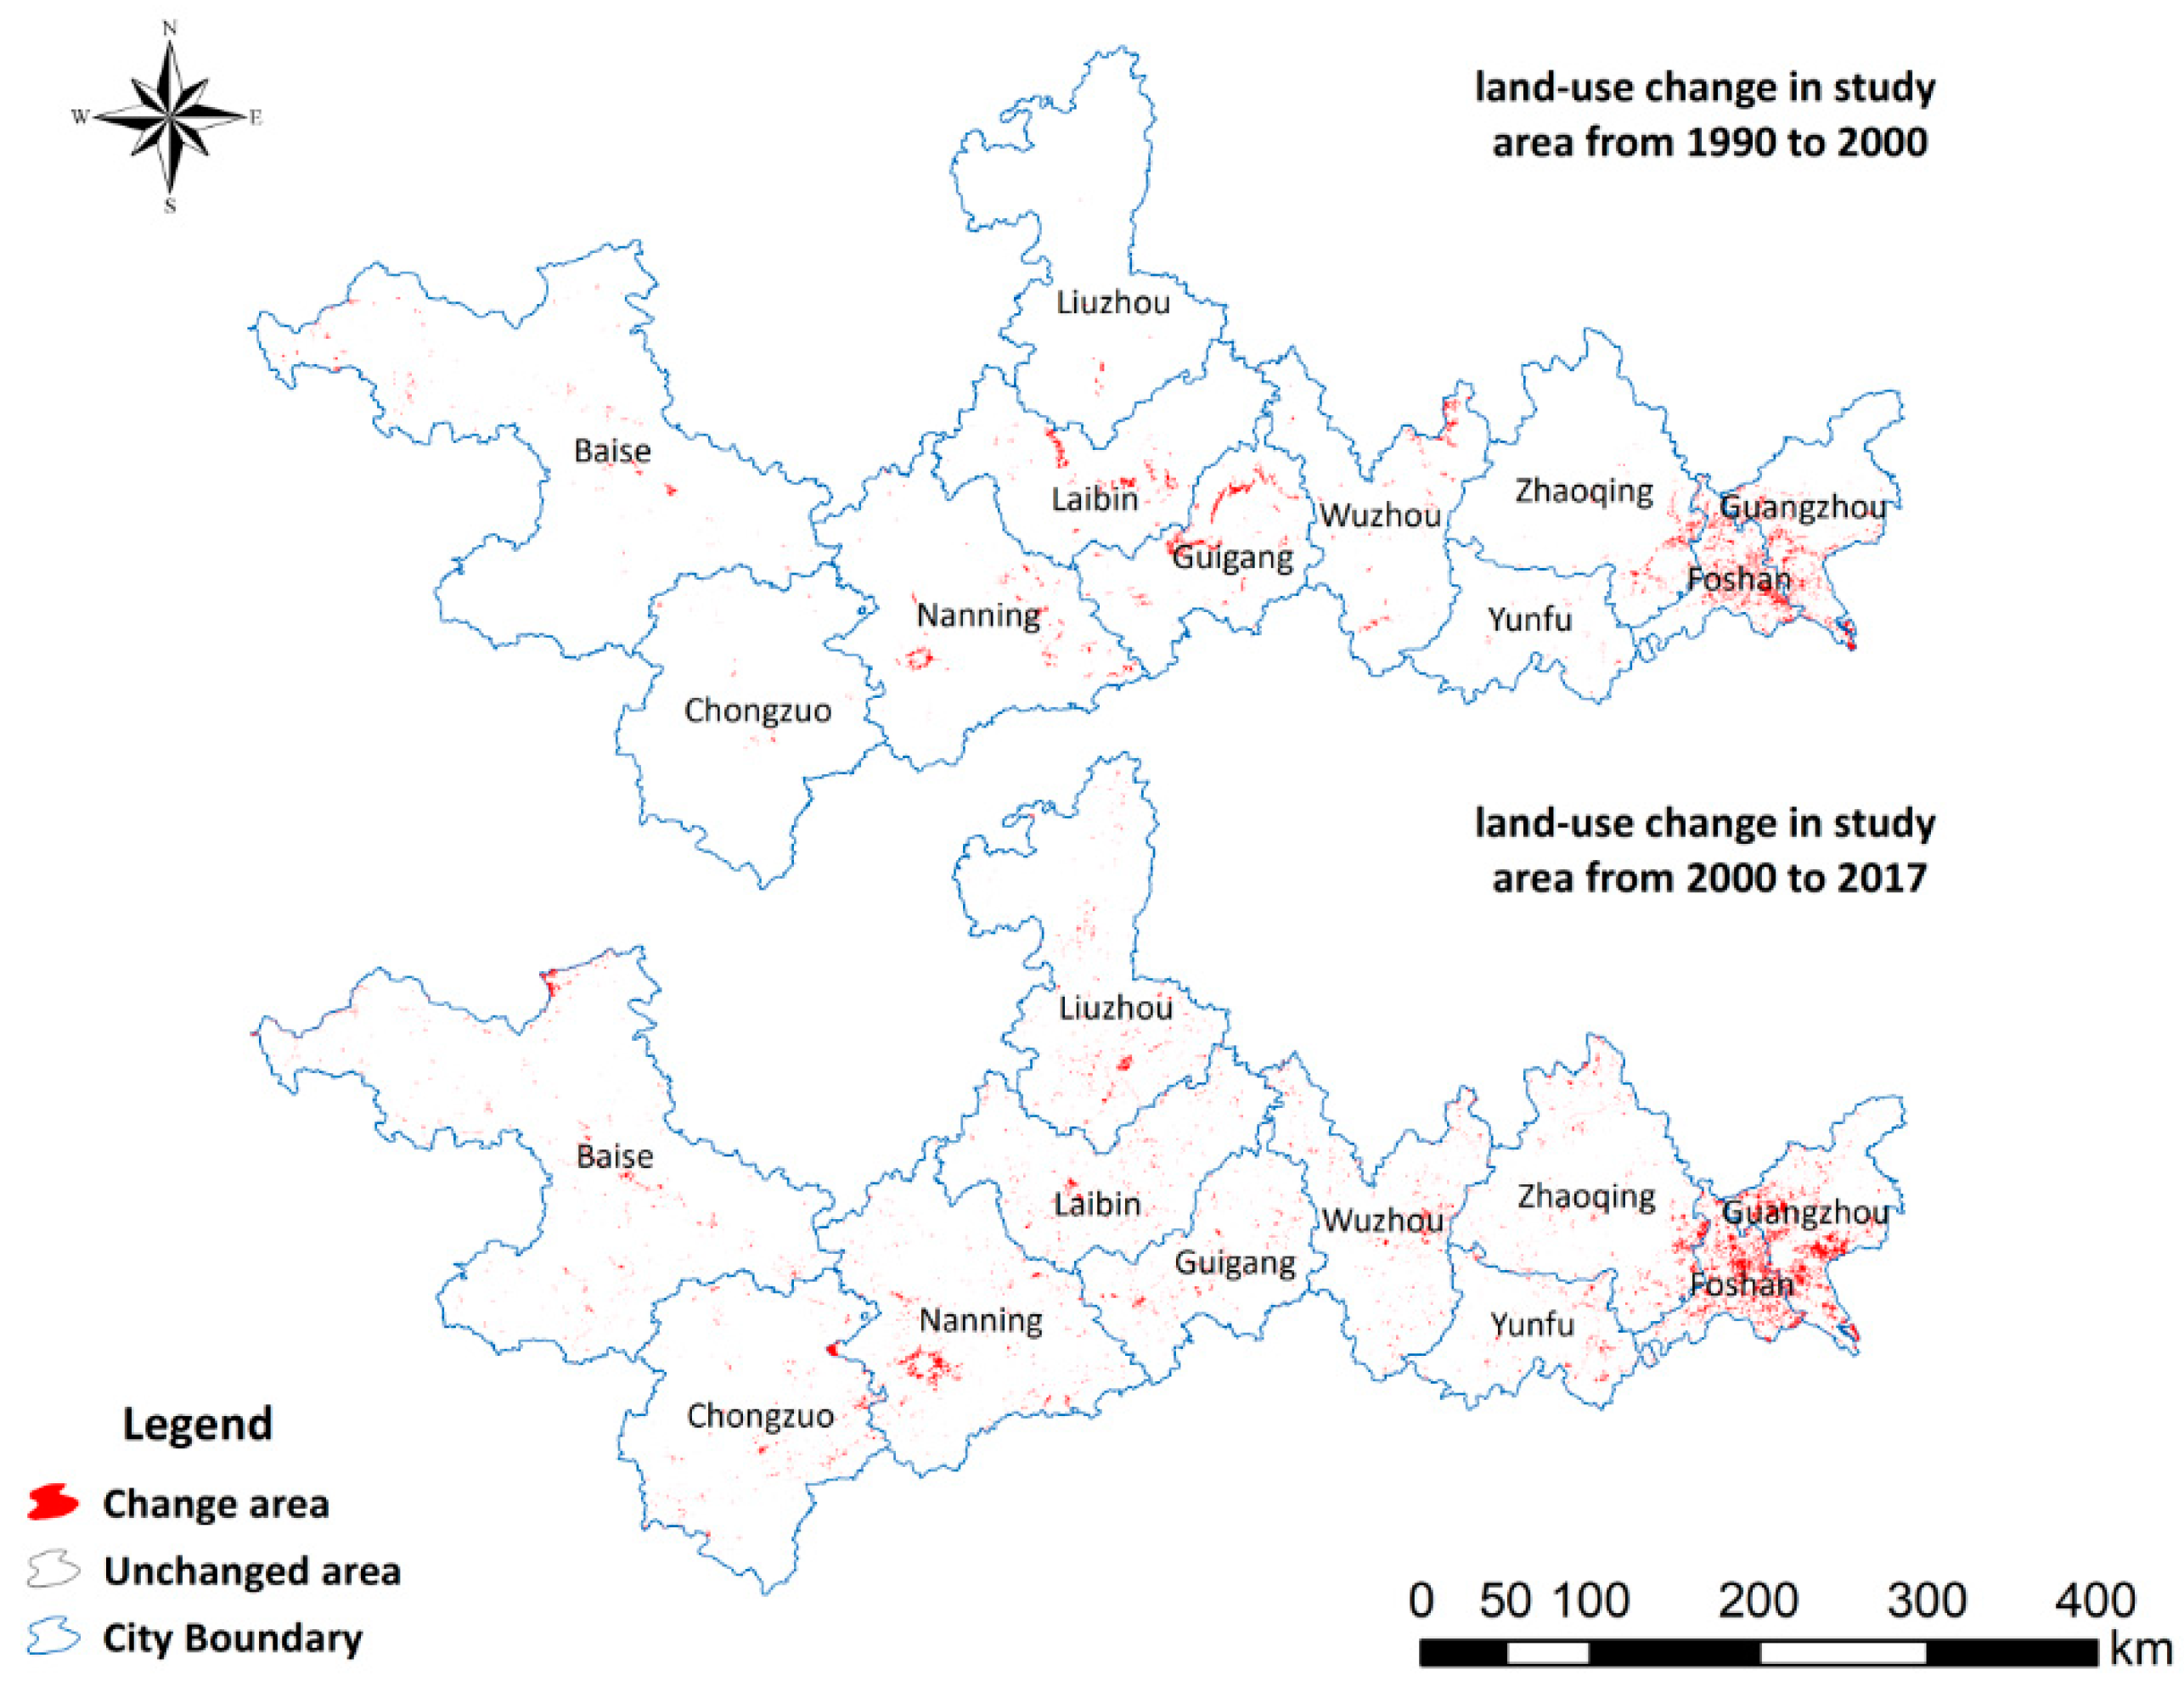
Land-use change was unbalanced in all cities in both periods (Figure 4). During 1990–2000, a total of 1906 km2 (1.16% of the total area) of six land-use classes changed in the ZXEB. Regarding 1990–2000, the most obvious change occurred in the east (Foshan and Guangzhou) and middle areas (Guigang, Nanning, and Laibin) of the ZXEB, followed by the eastern cities, Zhaoqing and Wuzhou. Concerning the western cities, Baise and Chongzuo experienced less change in LUCC. During the period from 2000–2017, a total of 3256 km2 (1.98% of the total area) of all land-use types experienced greater changes than in the earlier period. Similar to the first period, the most obvious change occurred in the eastern cities that belong to Guangdong province (Guangzhou, Foshan, and Zhaoqing), followed by the middle area cities, Nanning and Wuzhou. The western city, Baise, experienced more LUCC during this period. Concurrently, Laibin and Guigang experienced less change compared with the previous period.
3.2. The Temporal and Spatial Variation Trends of LUCC Since 1990
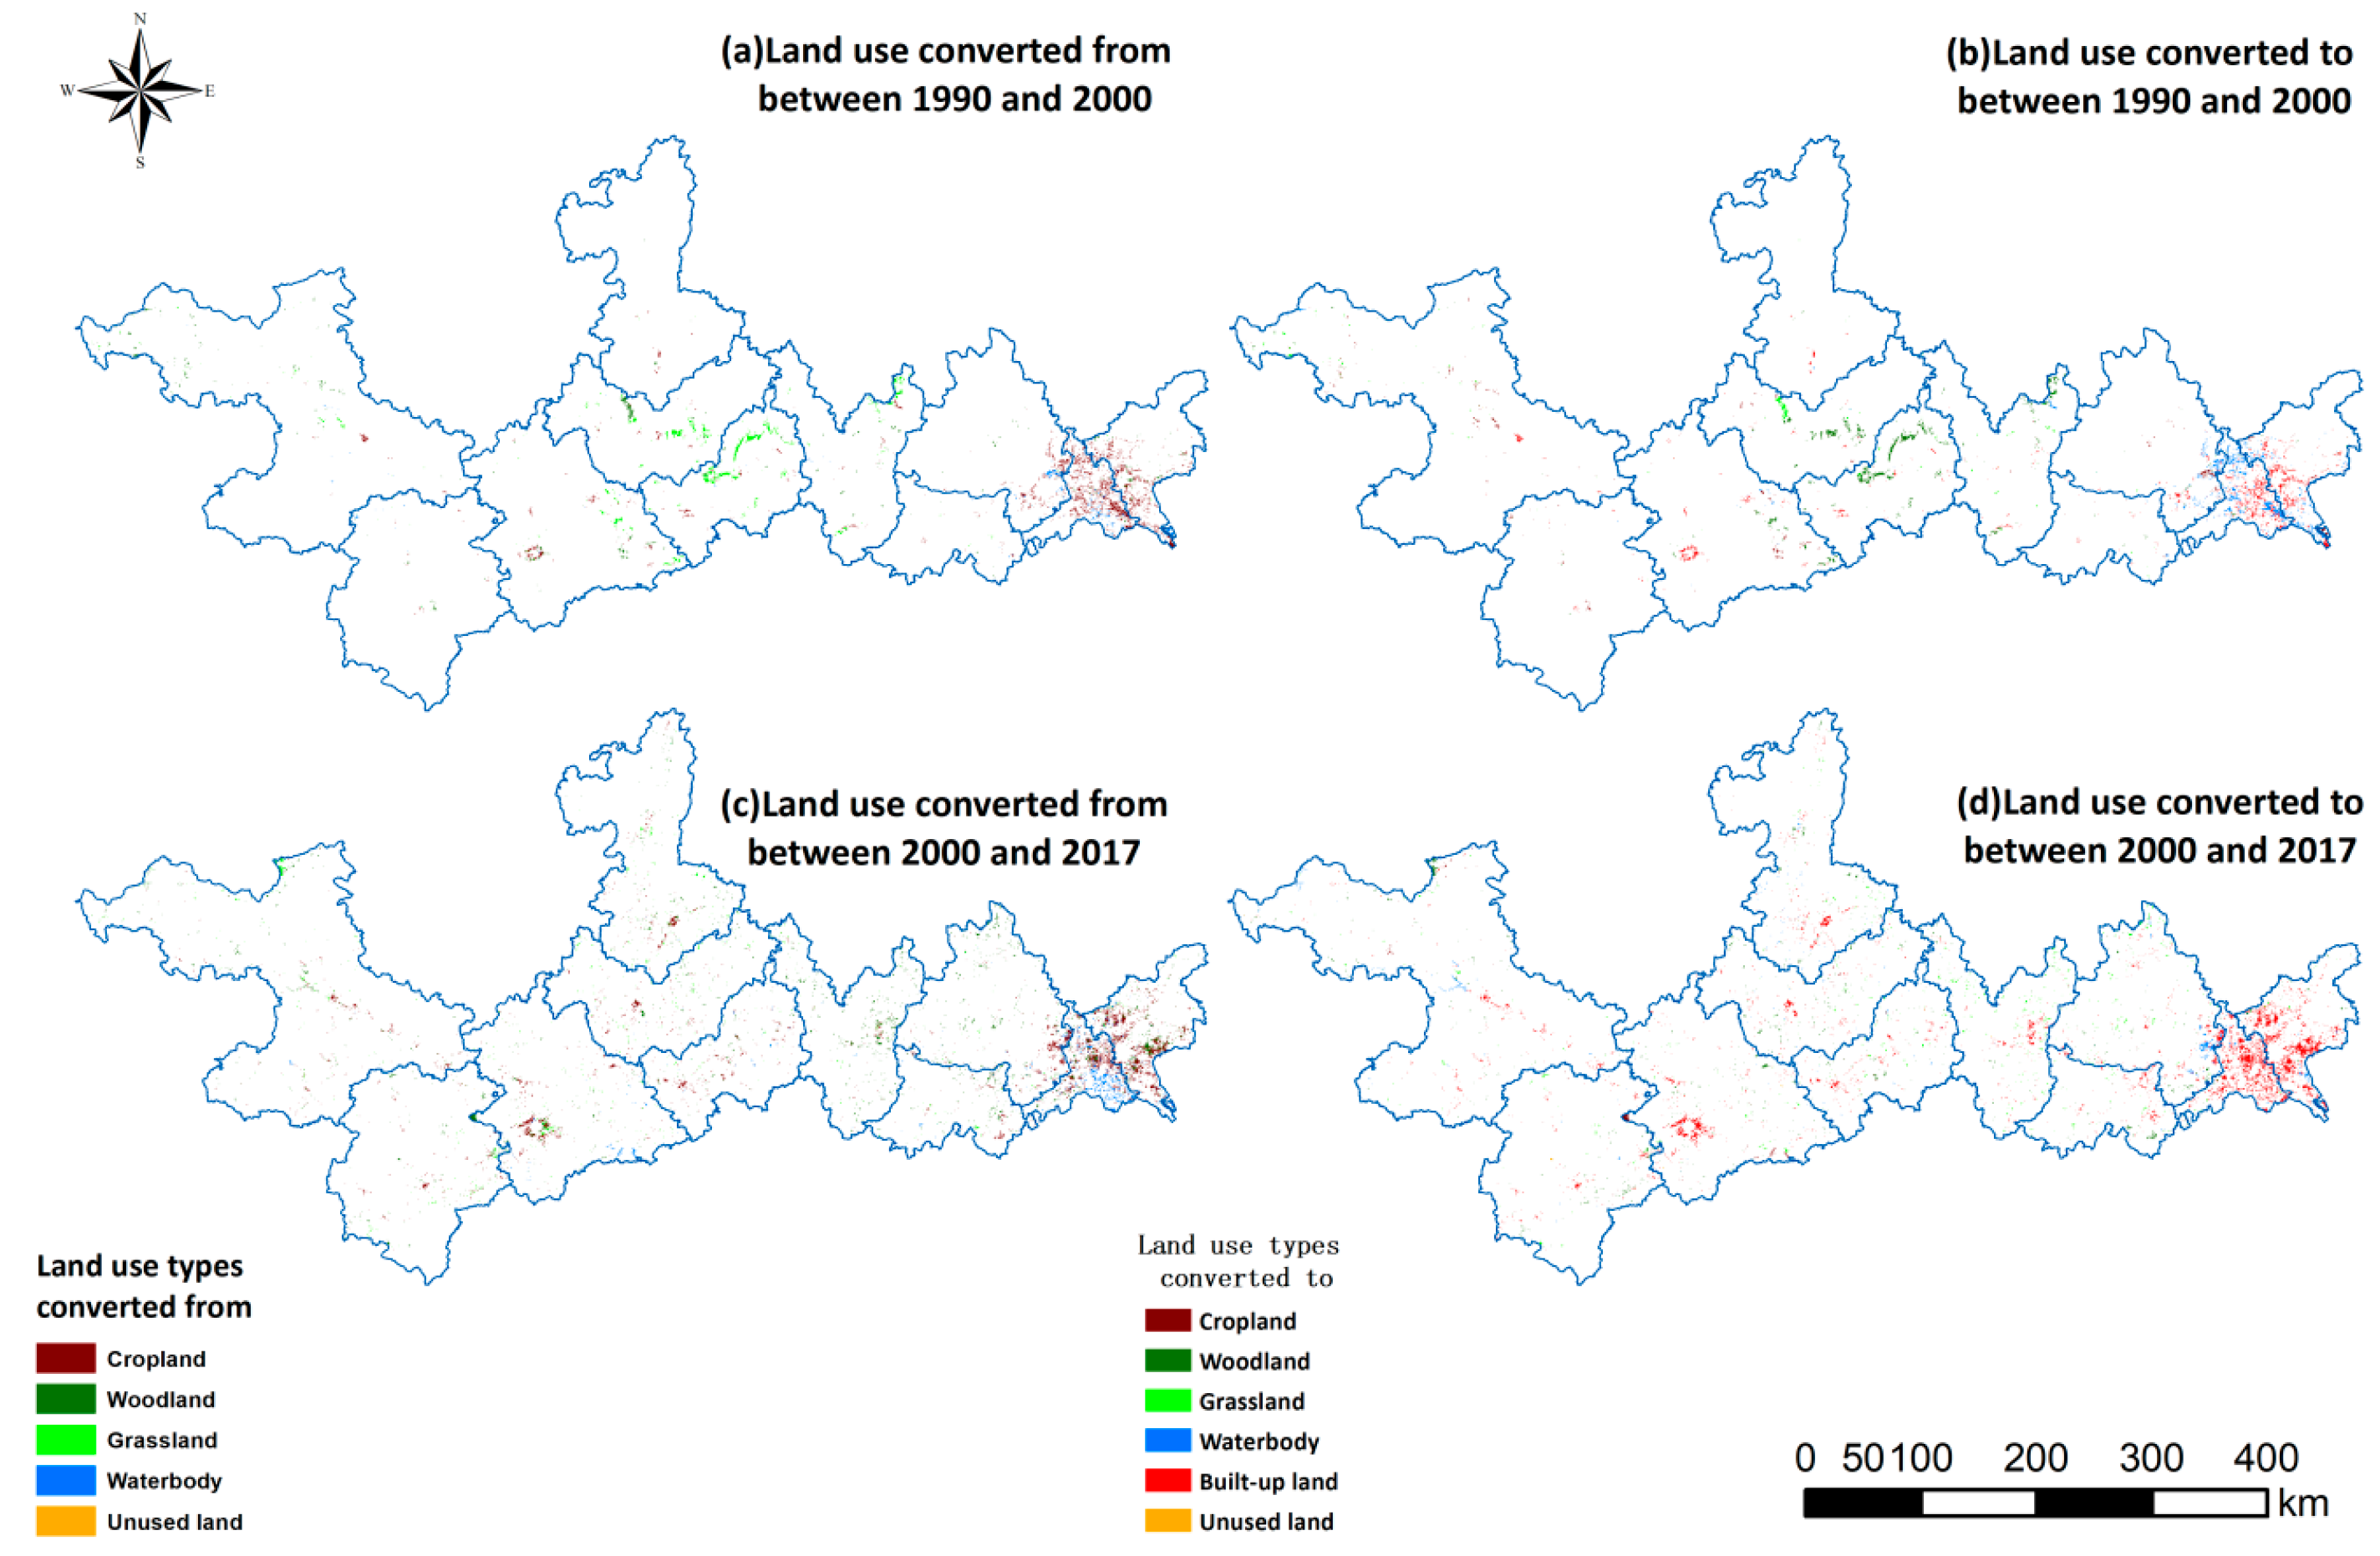
The spatiotemporal characteristics of LUCC were presented using a conversion matrix by areas. The TPs in the ZXEB are shown in Table 2, Table 3, Table 4 and Table 5, the map of this conversion process is projected in Figure 5. During both periods, unused land was the smallest land-use type (less than 0.01% of total area), so this class was not analyzed.
During 1990–2000, the TPs of all the land-use types were kept relatively stable and were larger than 0.95. However, TPs indicated that woodland was the most stable land-use type with 0.9973 TPs. Woodland was also the dominant land-use type (63% of total area) having experienced both gain and loss processes; a total of 522 km2 of woodland was increased and then 286 km2 decreased (Table 2). The most obvious woodland increase occurred in the middle cities Guigang, Laibin, and Nanning (Figure 5a).
The most dynamic classes were grassland with TPs of 0.9564, followed by cropland and water bodies with TPs of 0.9672 and 0.9741 (Table 3), respectively. Approximately 527 km2 of grassland was converted into other land-use types, mostly woodland (470 km2). Meanwhile, a total of 123 km2 of grassland was converted from other land-use types. The most obvious losses in grassland occurred in Guiang, Laibin, Wuzhou, and Nanning. Cropland decreased by about 992 km2. Most of it turned into water bodies and built-up land, and the most obvious cropland losses occurred in Guangdong province (Guangzhou, Foshan, and Zhaoqing). The size of water bodies increased dramatically during this period, predominantly as a result of conversion from cropland, and mainly in the eastern cities (Zhaoqing, Foshan, and Guangzhou).
Built-up land experienced the most obvious increase (648 km2) during this period, most significantly in Guangdong province (Guanghzhou and Foshan) (Figure 5b). There was no loss of built-up land during this period.
Compared with last period, the TPs and transition area of most land-use types decreased; the land-use activities in this region became stronger in this period (Table 4 and Table 5).
During 2000–2017, woodland was still the most stable class with TPs of 0.9909. Woodland areas experienced deforestation (woodland lost) in the eastern cities (Wuzhou, Guangzhou, and Zhaoqing) during this period. Most of the lost woodland was converted into built-up land and grassland.
Water bodies were the most dynamic land-use types with TPs of 0.9186, followed by cropland and grassland (Table 5). Water bodies continued to increase during this period (346 km2). Cropland continued to decrease by a total of 1600 km2 (Table 4). The most obvious loss of cropland occurred in the eastern cities and supported the built-up land expansion (Figure 5c,d). Grassland changed slightly (Table 4). The most obvious loss in grassland was in the western and middle areas of the ZXEB, while most of the grassland increases occurred in the middle and eastern areas (Wuzhou and Zhaoqing) (Figure 5d).
Built-up land dramatically increased in Guangzhou and Foshan, followed by Nanning and Zhaoqing. Other cities experienced different levels of built-up land expansion (Table 3 and Figure 5d). To summarize, four land-use conversion processes occurred in this region; namely, built-up land expansion, woodland loss, water body increases, and cropland decreases.
3.3. Built-up Land Expansion Since 1990
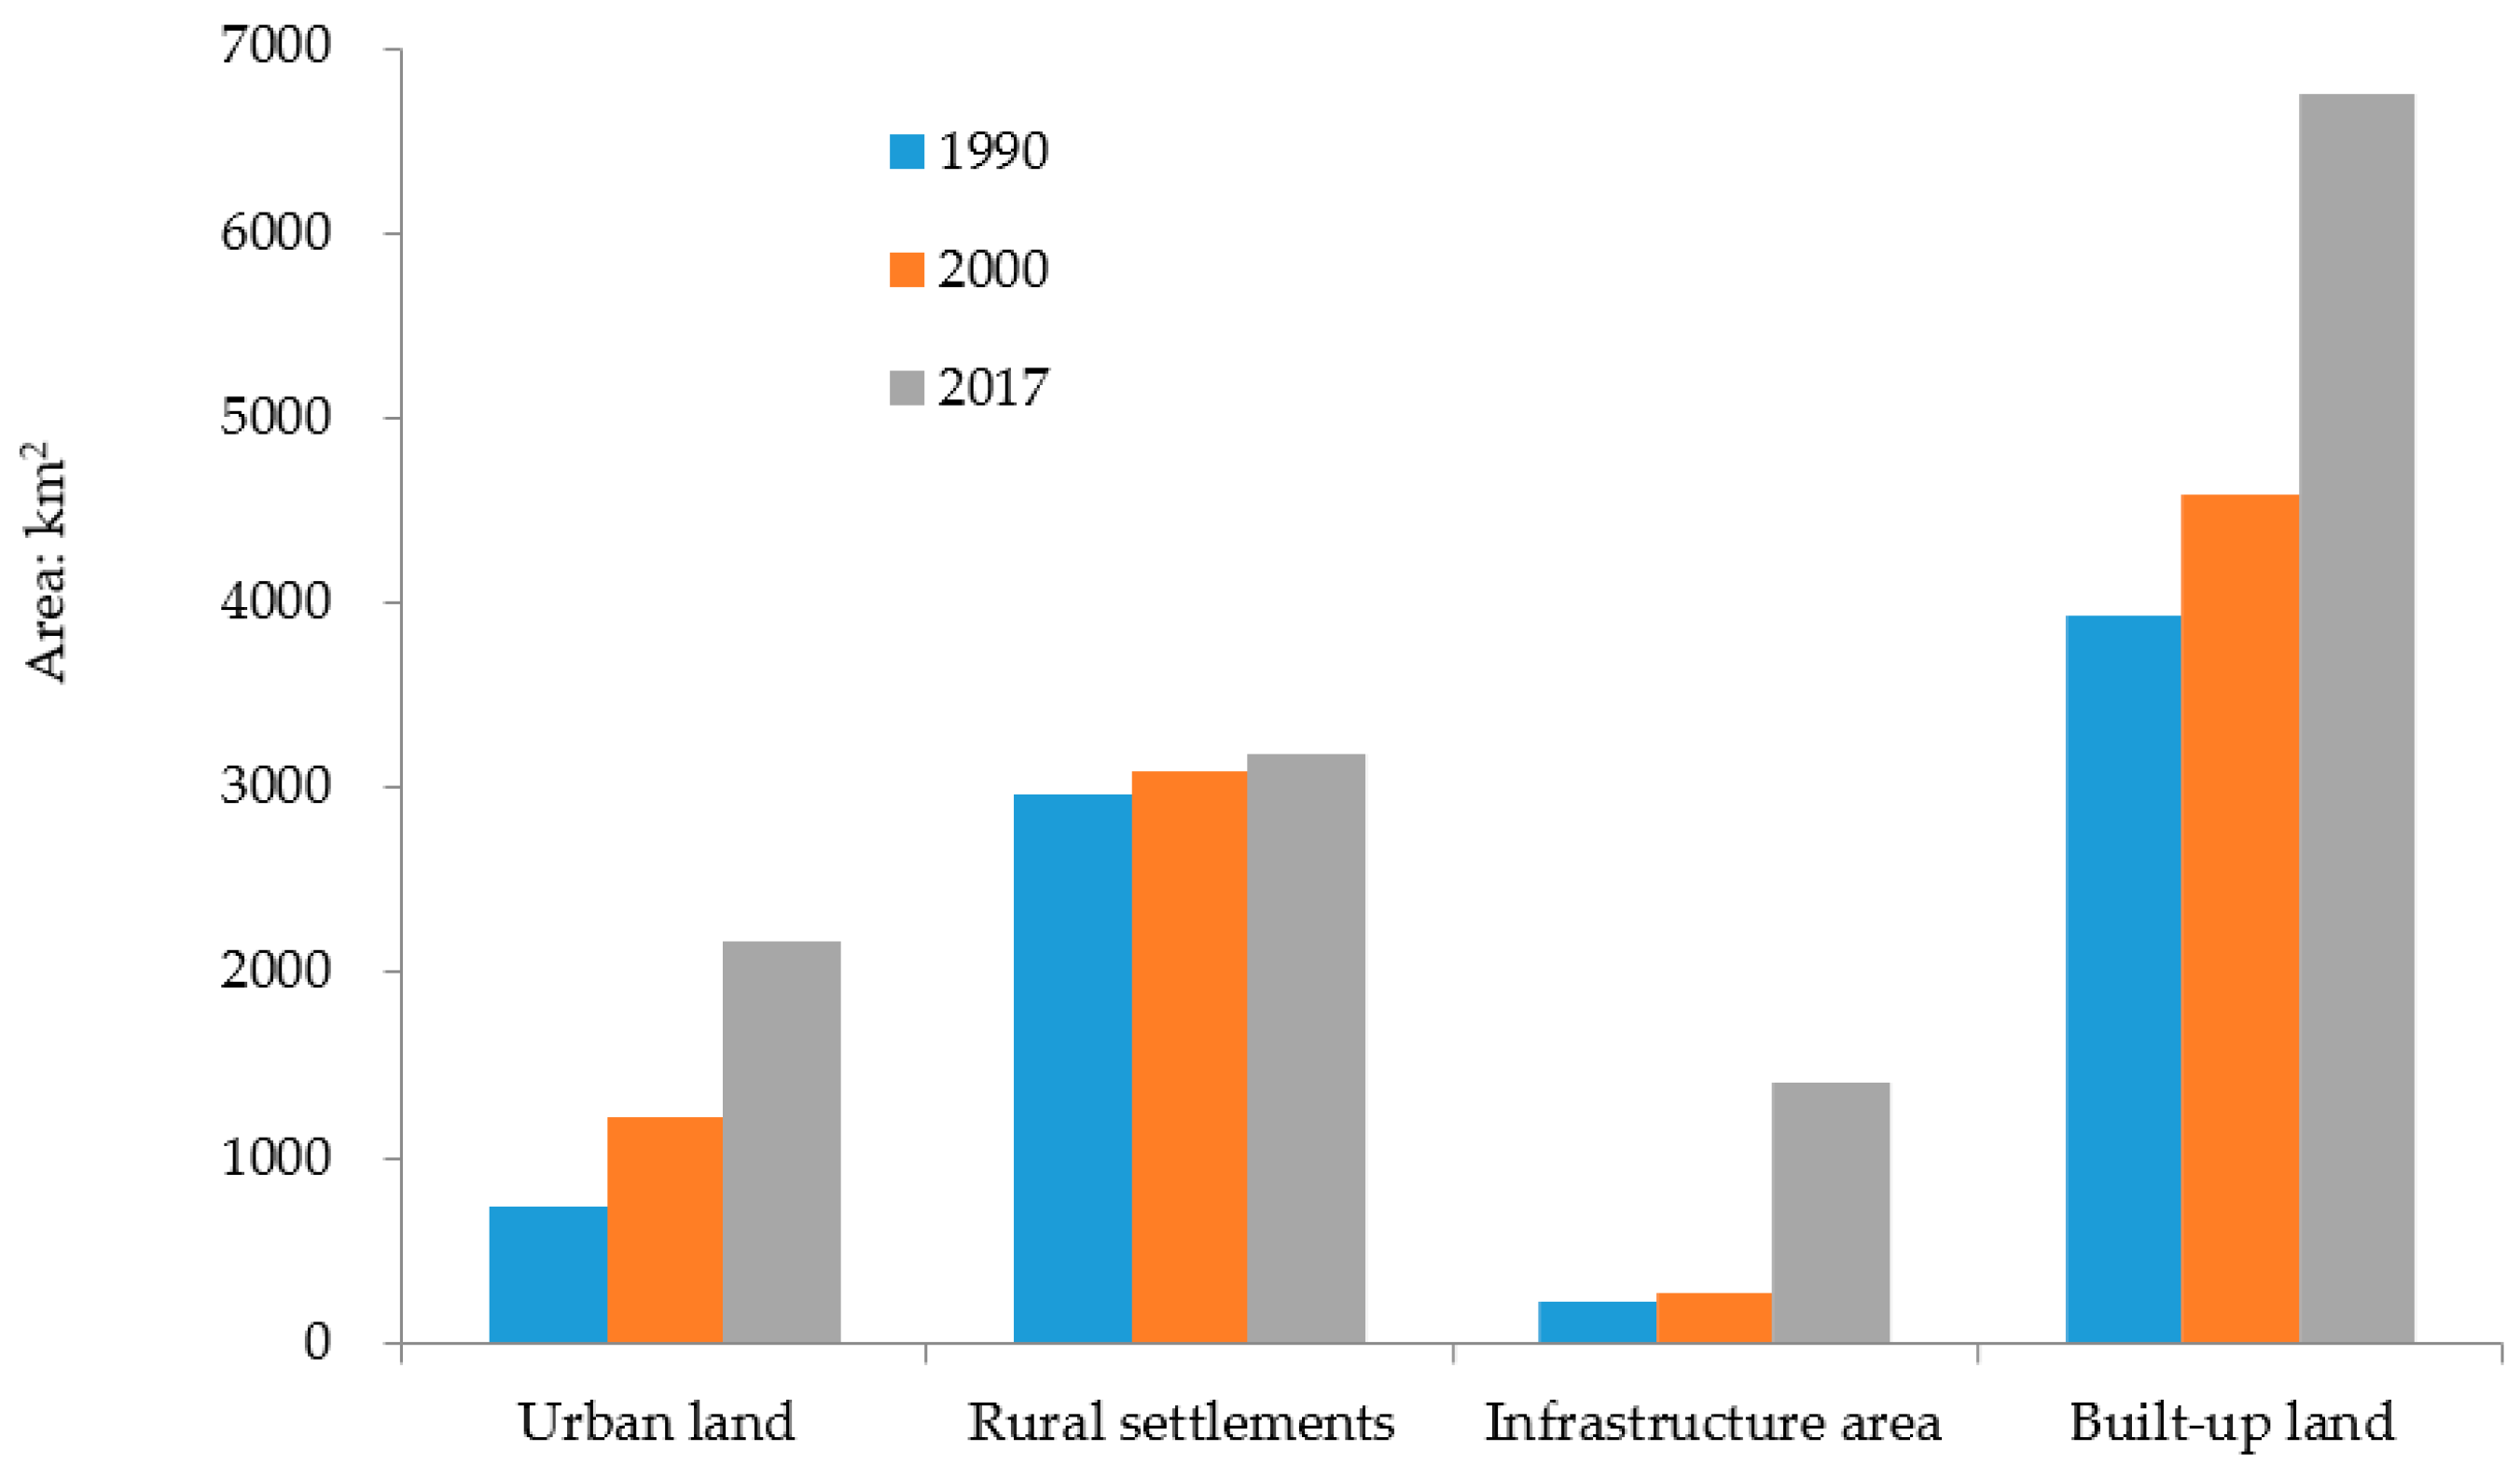
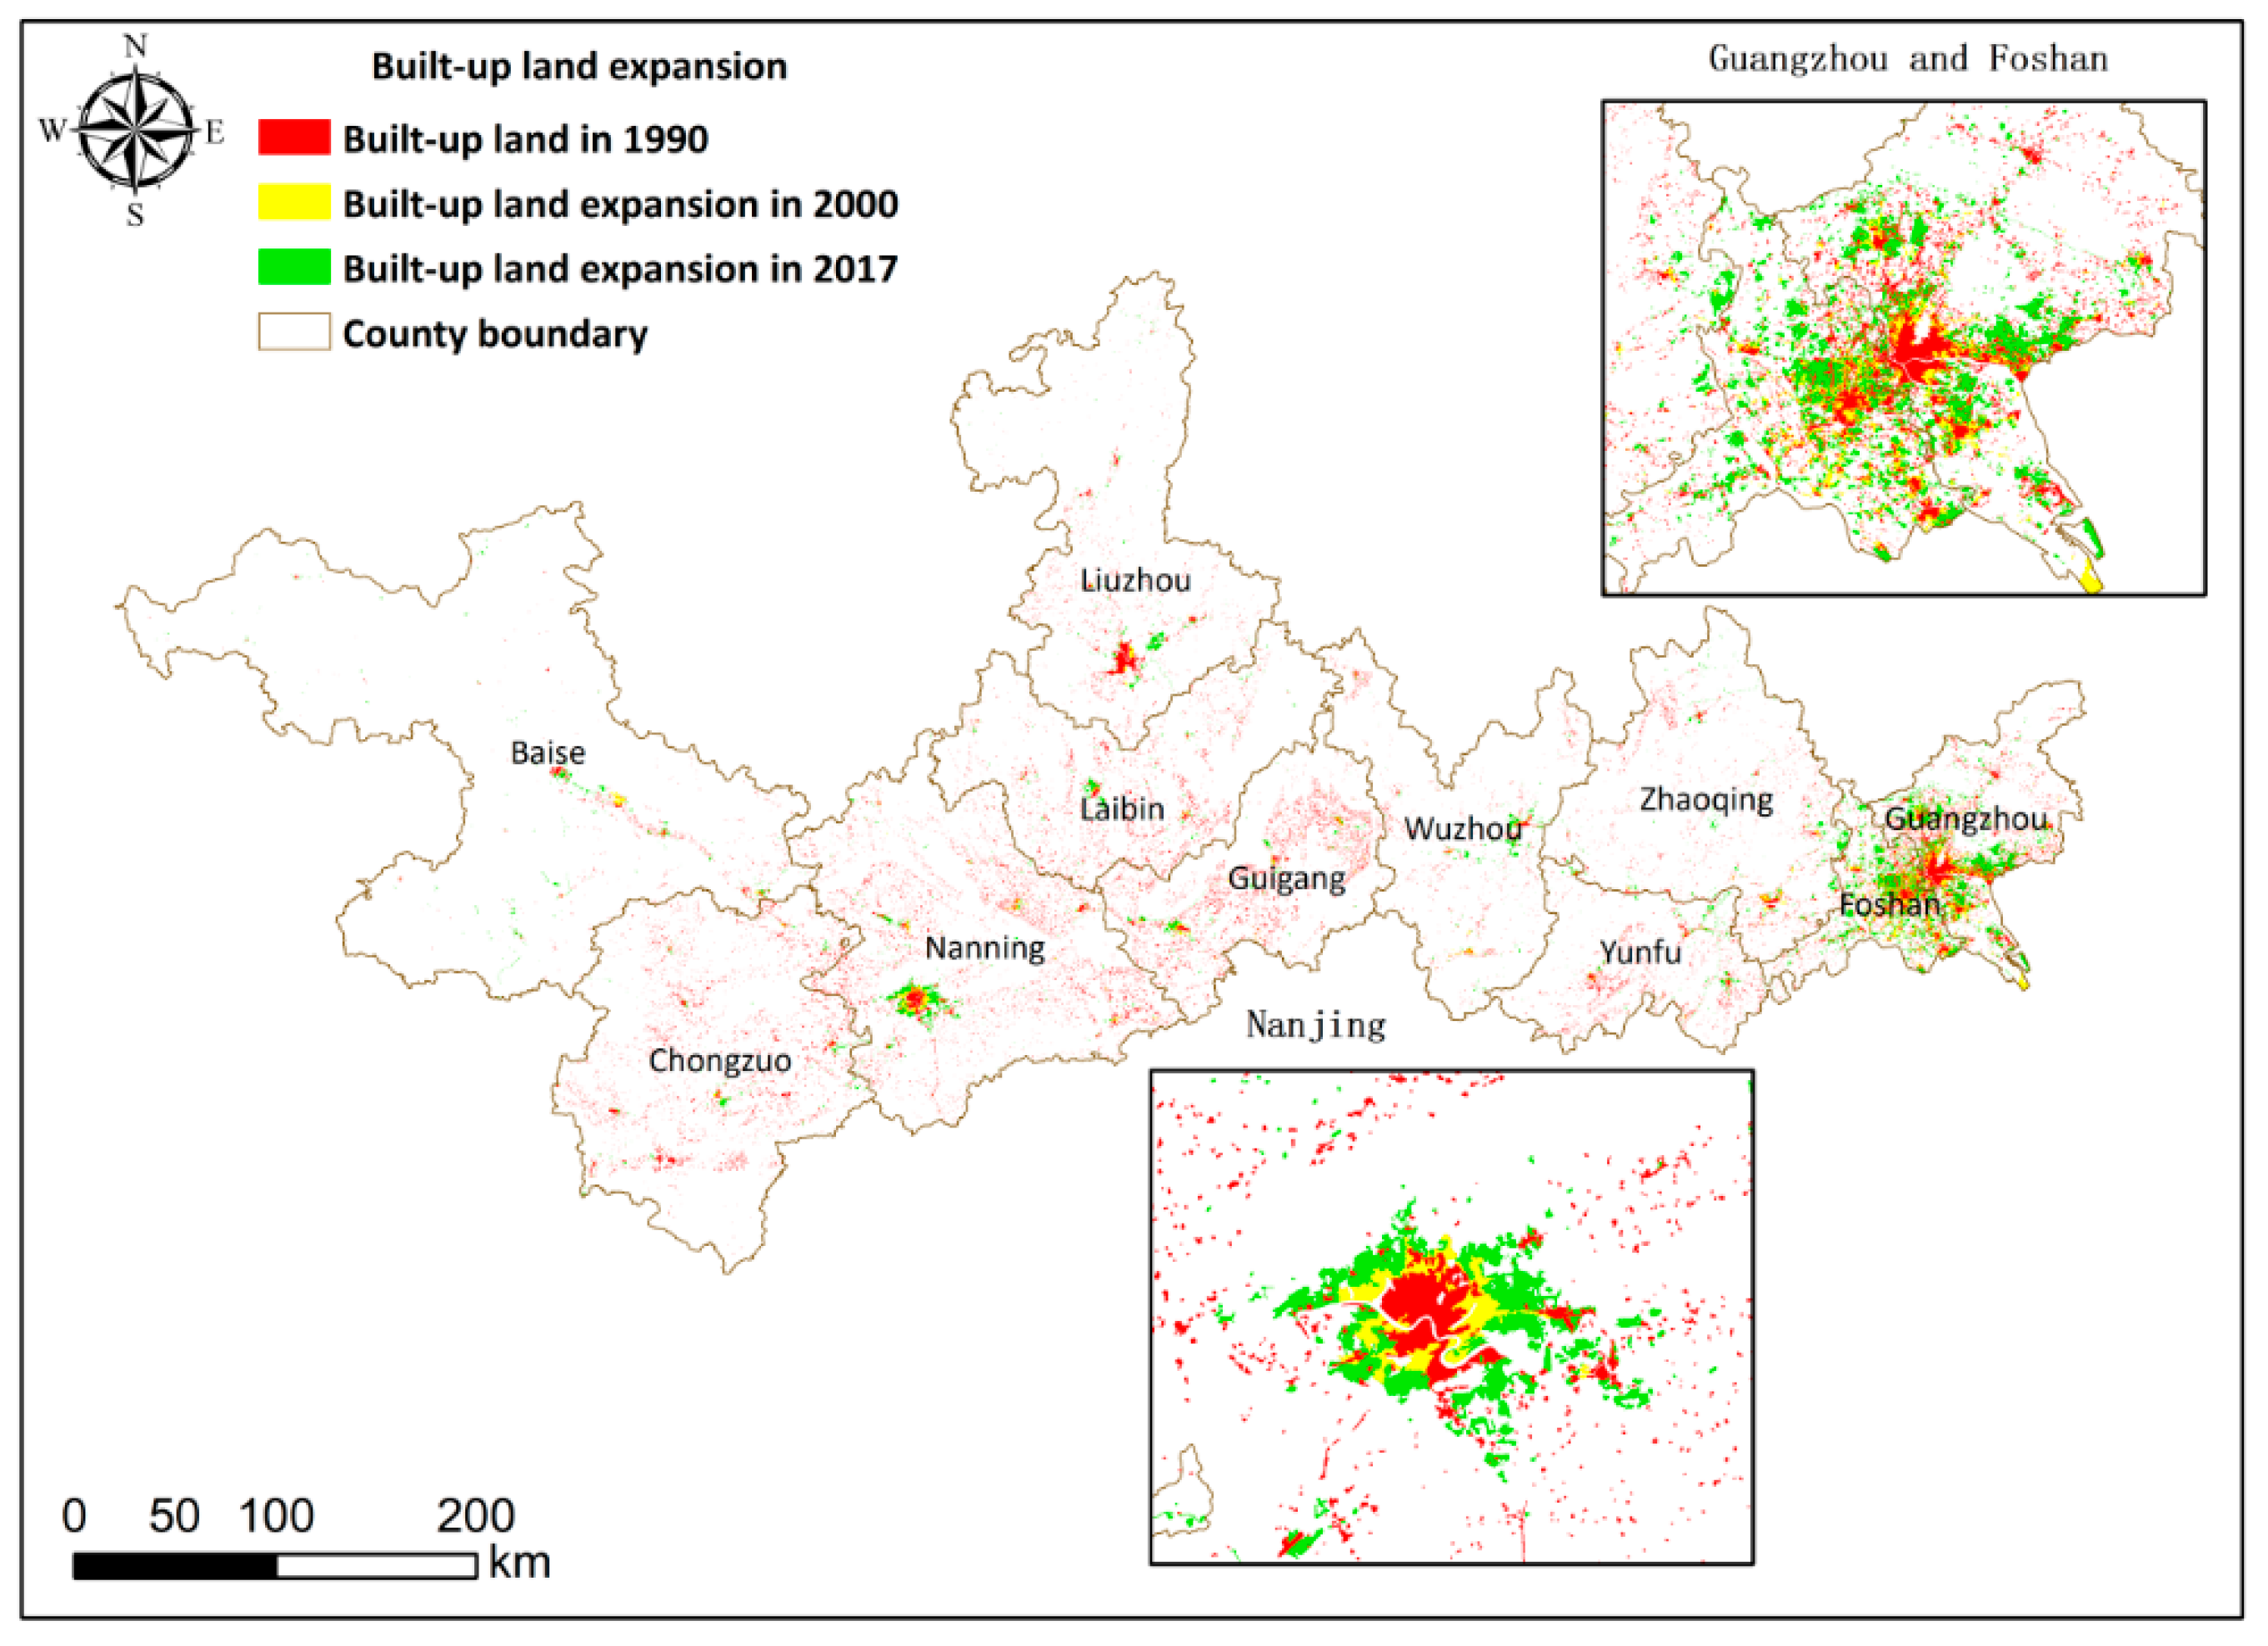
Built-up land expansion was the major land-use conversion process in the ZXEB from 1990 to 2017. The total area of built-up land increased significantly, from 3930 km2 in 1990 to 6755 km2 in 2017, of which urban land increased by 1431 km2, the infrastructure area increased by 1181 km2, and rural settlements increased by a minimum of 212 km2 (Figure 6). Regarding the two periods, 1990–2000 and 2000–2017, the most obvious built-up land expansion occurred in Guangzhou and Foshan, followed by Nanning and Zhaoqing (Figure 7). Yunfu, Chongzuo, and Laibin experienced the least amount of expansion. During both periods, all sub-classes of built-up land (urban land, rural settlements, and infrastructure area) continued to increase. Rural settlements constituted the most significant sub-class of built-up land in the ZXEB, showing a steady increase in size (Table 3 and Table 4).
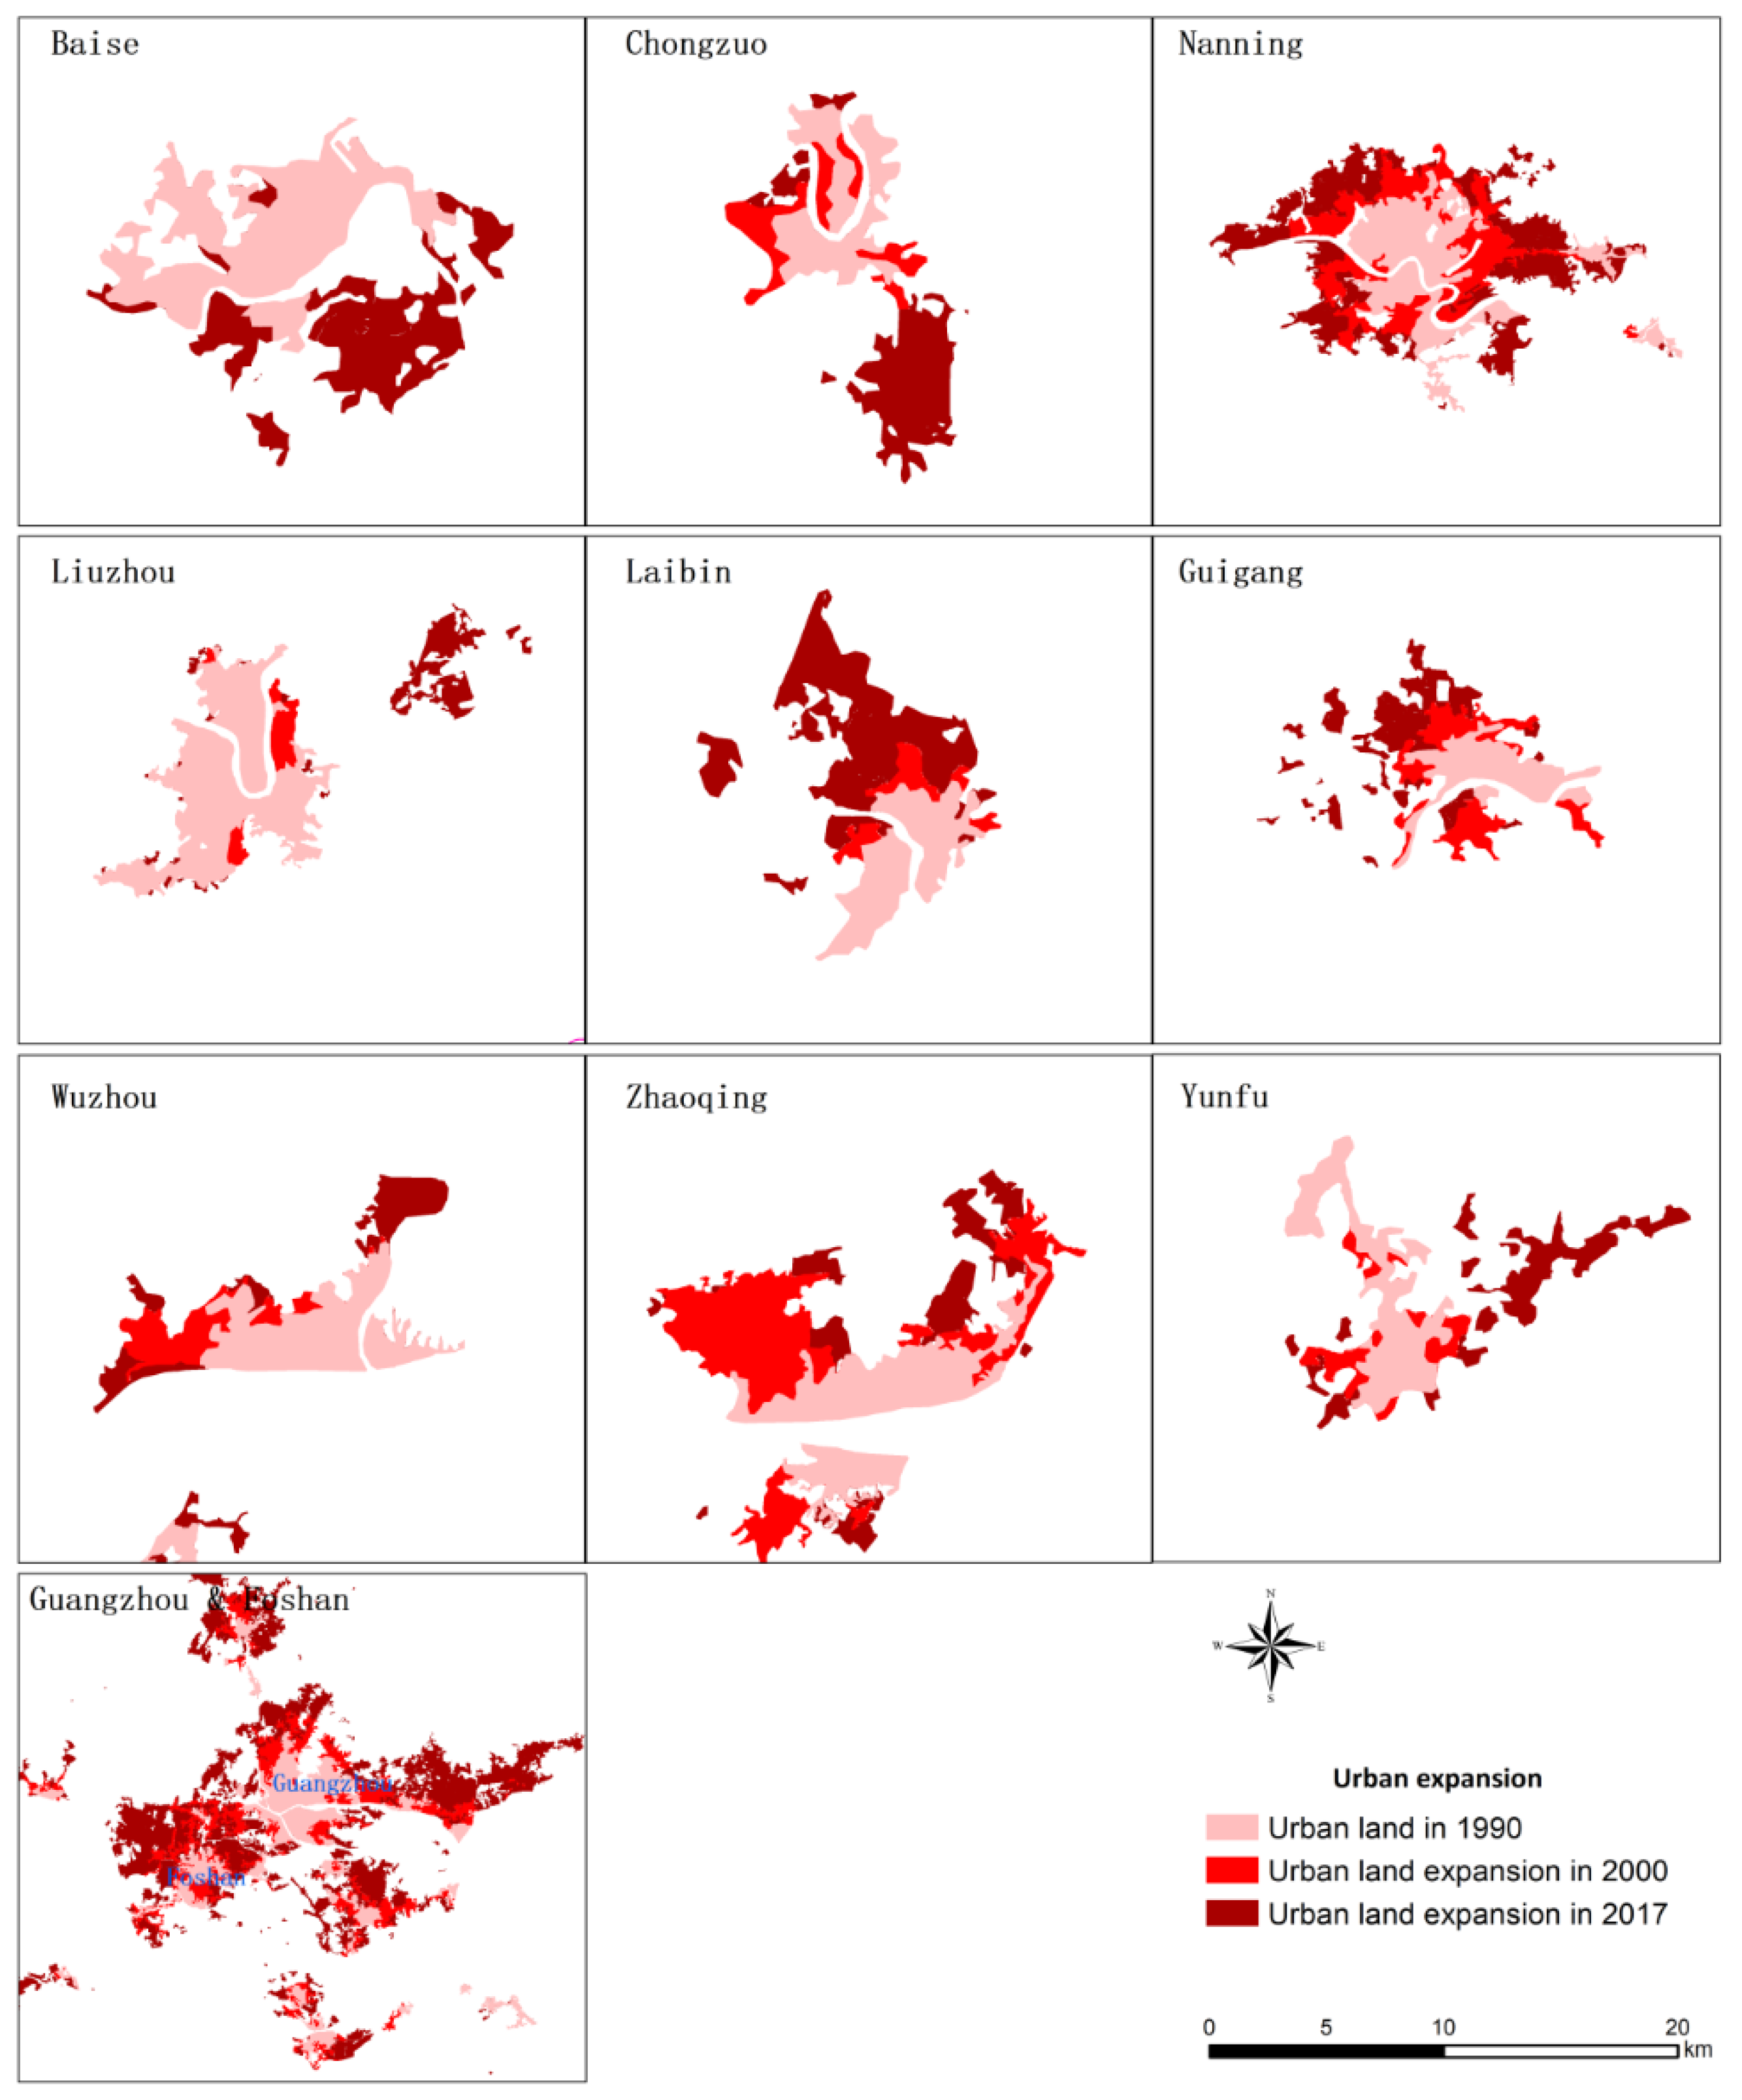
To determine the regional differences in urban expansion, the authors analyzed the built-land expansion and mapped the urban land expansion (Class Code 51, Table 1, Figure 8). Urban land increased in size significantly, from 739 km2 in 1990 to 2169 km2 in 2017. Guangdong, Foshan, and Nanning experienced the largest increase in urban land in both periods, followed by Nanning and Zhaoqing; generally, the cities in Guangdong province evolved the fastest (Figure 8), and such urban expansion was at the expense of croplands. Guangxi province, Nanning, followed by Liuzhou and Baise, was found to have experienced the greatest increase in urban land from 1990 to 2017, while Wuzhou, Chongzuo, and Yunfu (Guangdong) saw the least growth.
4. Discussion
During this research, the authors investigated the LUCC and urbanization processes in the ZXEB from 1990 to 2017 and revealed the characteristics of LUCC over space and time. Spatial autocorrelation of land-use types were also related closely to economic and policy conditions. Socioeconomic and policy factors were also the dominant driving forces of Chinese urbanization and industrialization [17]. Here, the authors analyze the most important drivers in these processes; namely, population, GDP, policy, and rural–urban migration. Population growth and economic development are the most reported possible drivers of urbanization [5,23,53]. Economic reform was launched in China in the 1980s and rural–urban migration accelerated the urbanization and industrialization processes [24].
4.1. The Spatial Autocorrelation of Land Use and Drivers Analysis in ZXEB
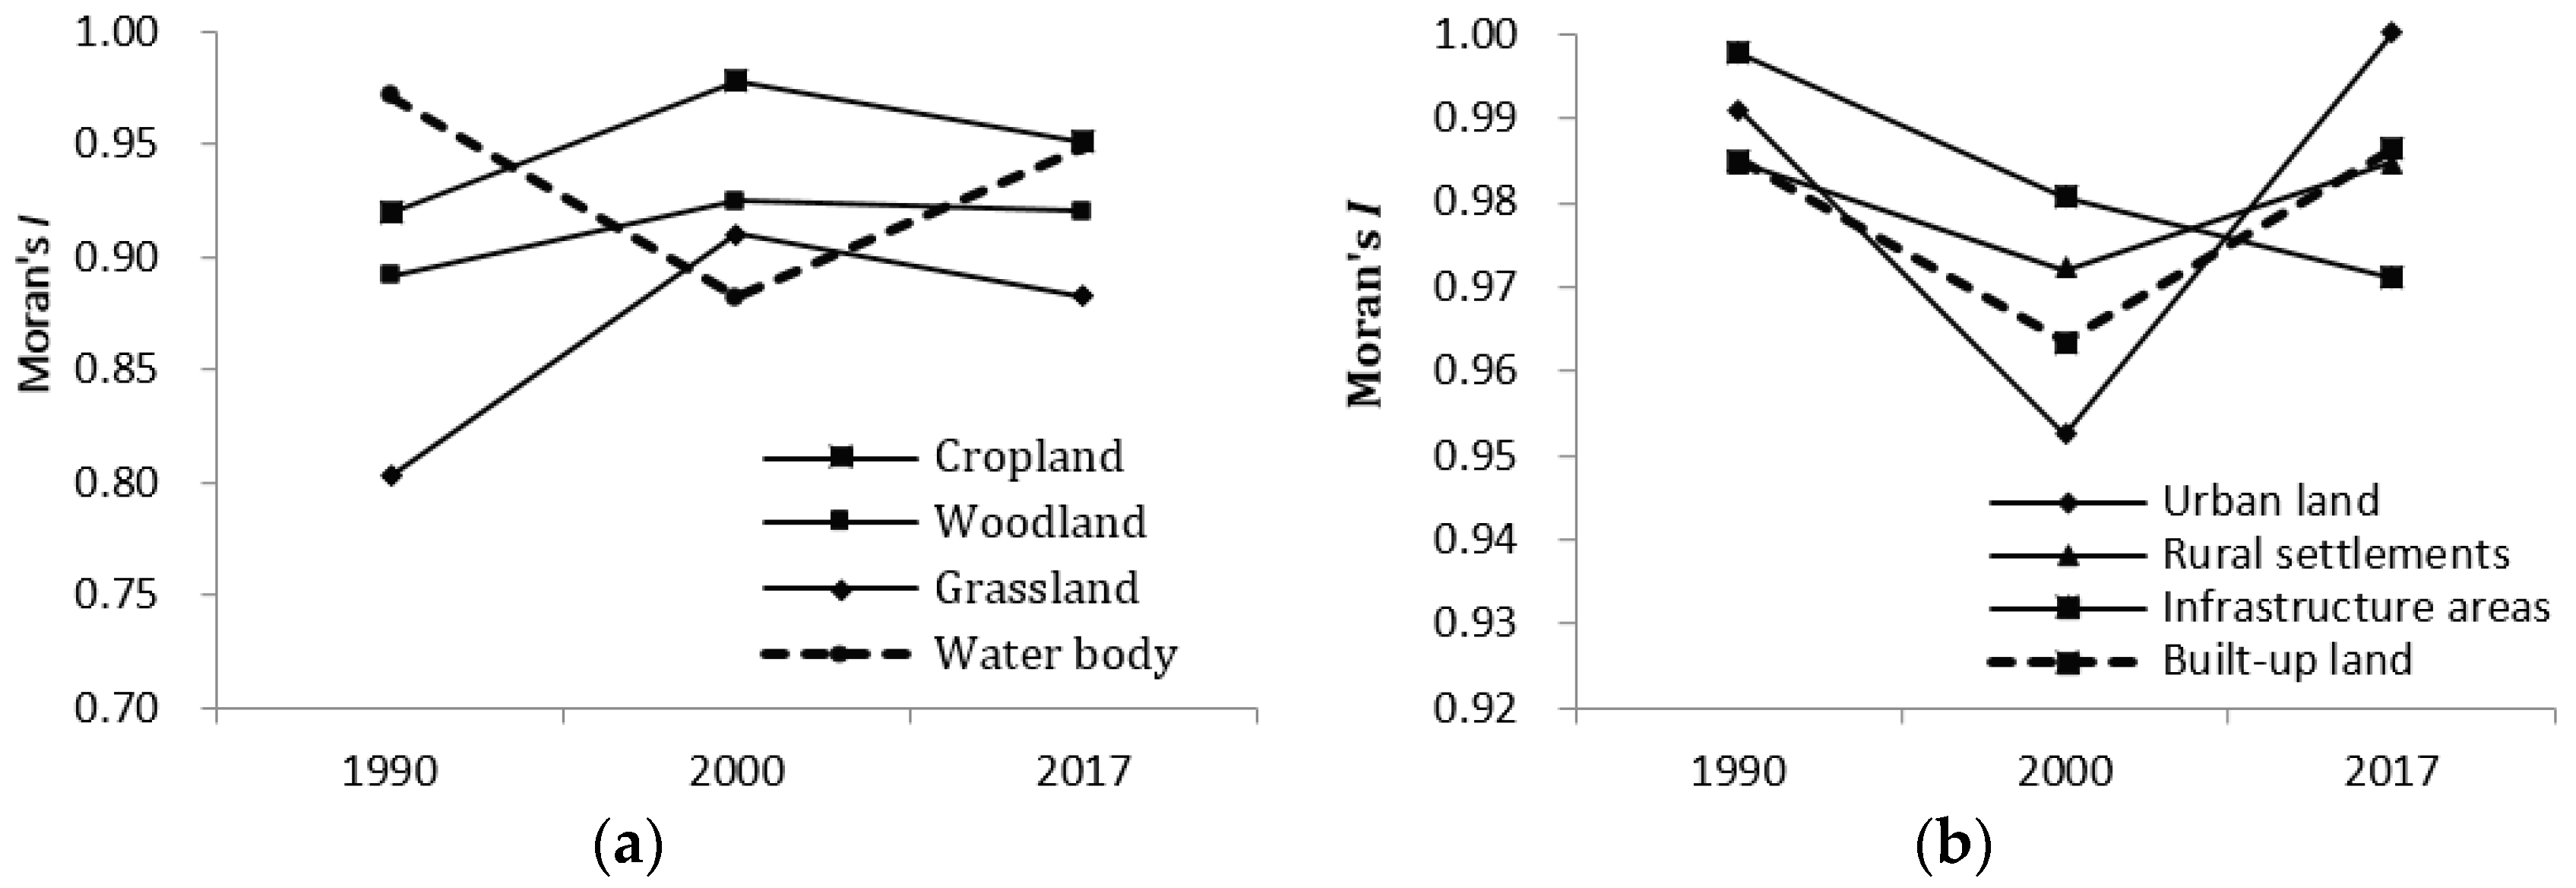
The Moran’s I for all global land-use types that presented spatial autocorrelation in 1990, 2000, and 2017 has been summarized in Figure 9. Figure 9a indicates that, before 2000, the Moran’s I of cropland, woodland, and grassland increased. This was mainly a result of the three land-use conversions being relatively stable during this period; the TPs were larger than 0.95, generally, even when slightly increased (woodland) or decreased (cropland, grassland), the aggregation still increased. The Moran’s I of water bodies decreased, mainly because of a water-use increase in the area during this period, which increased the aggregation of water bodies. Following 2000, the Moran’s I showed an opposite trend; the Moran’s I of cropland, woodland, and grassland decreased, and that for water bodies and built-up land increased. This was mainly a result of the rapid urbanization process, causing large areas of cropland, woodland, and grassland to change into built-up land.
Figure 9b indicates that the Moran’s I of built-up land, as well the urban land and rural settlements, increased first and then decreased, while Moran’s I of infrastructure areas always decreased. This was mainly a result of the development of built-up land like “make a Pisa”; the gap between peri-urban and urban land decreased quickly [54]. The Moran’s I indicated that all land-use types in the ZXEB area were related highly and, after 2000, the mode of land-use conversion process changed.
4.2. The Socioeconomic Driving Forces of Urbanization
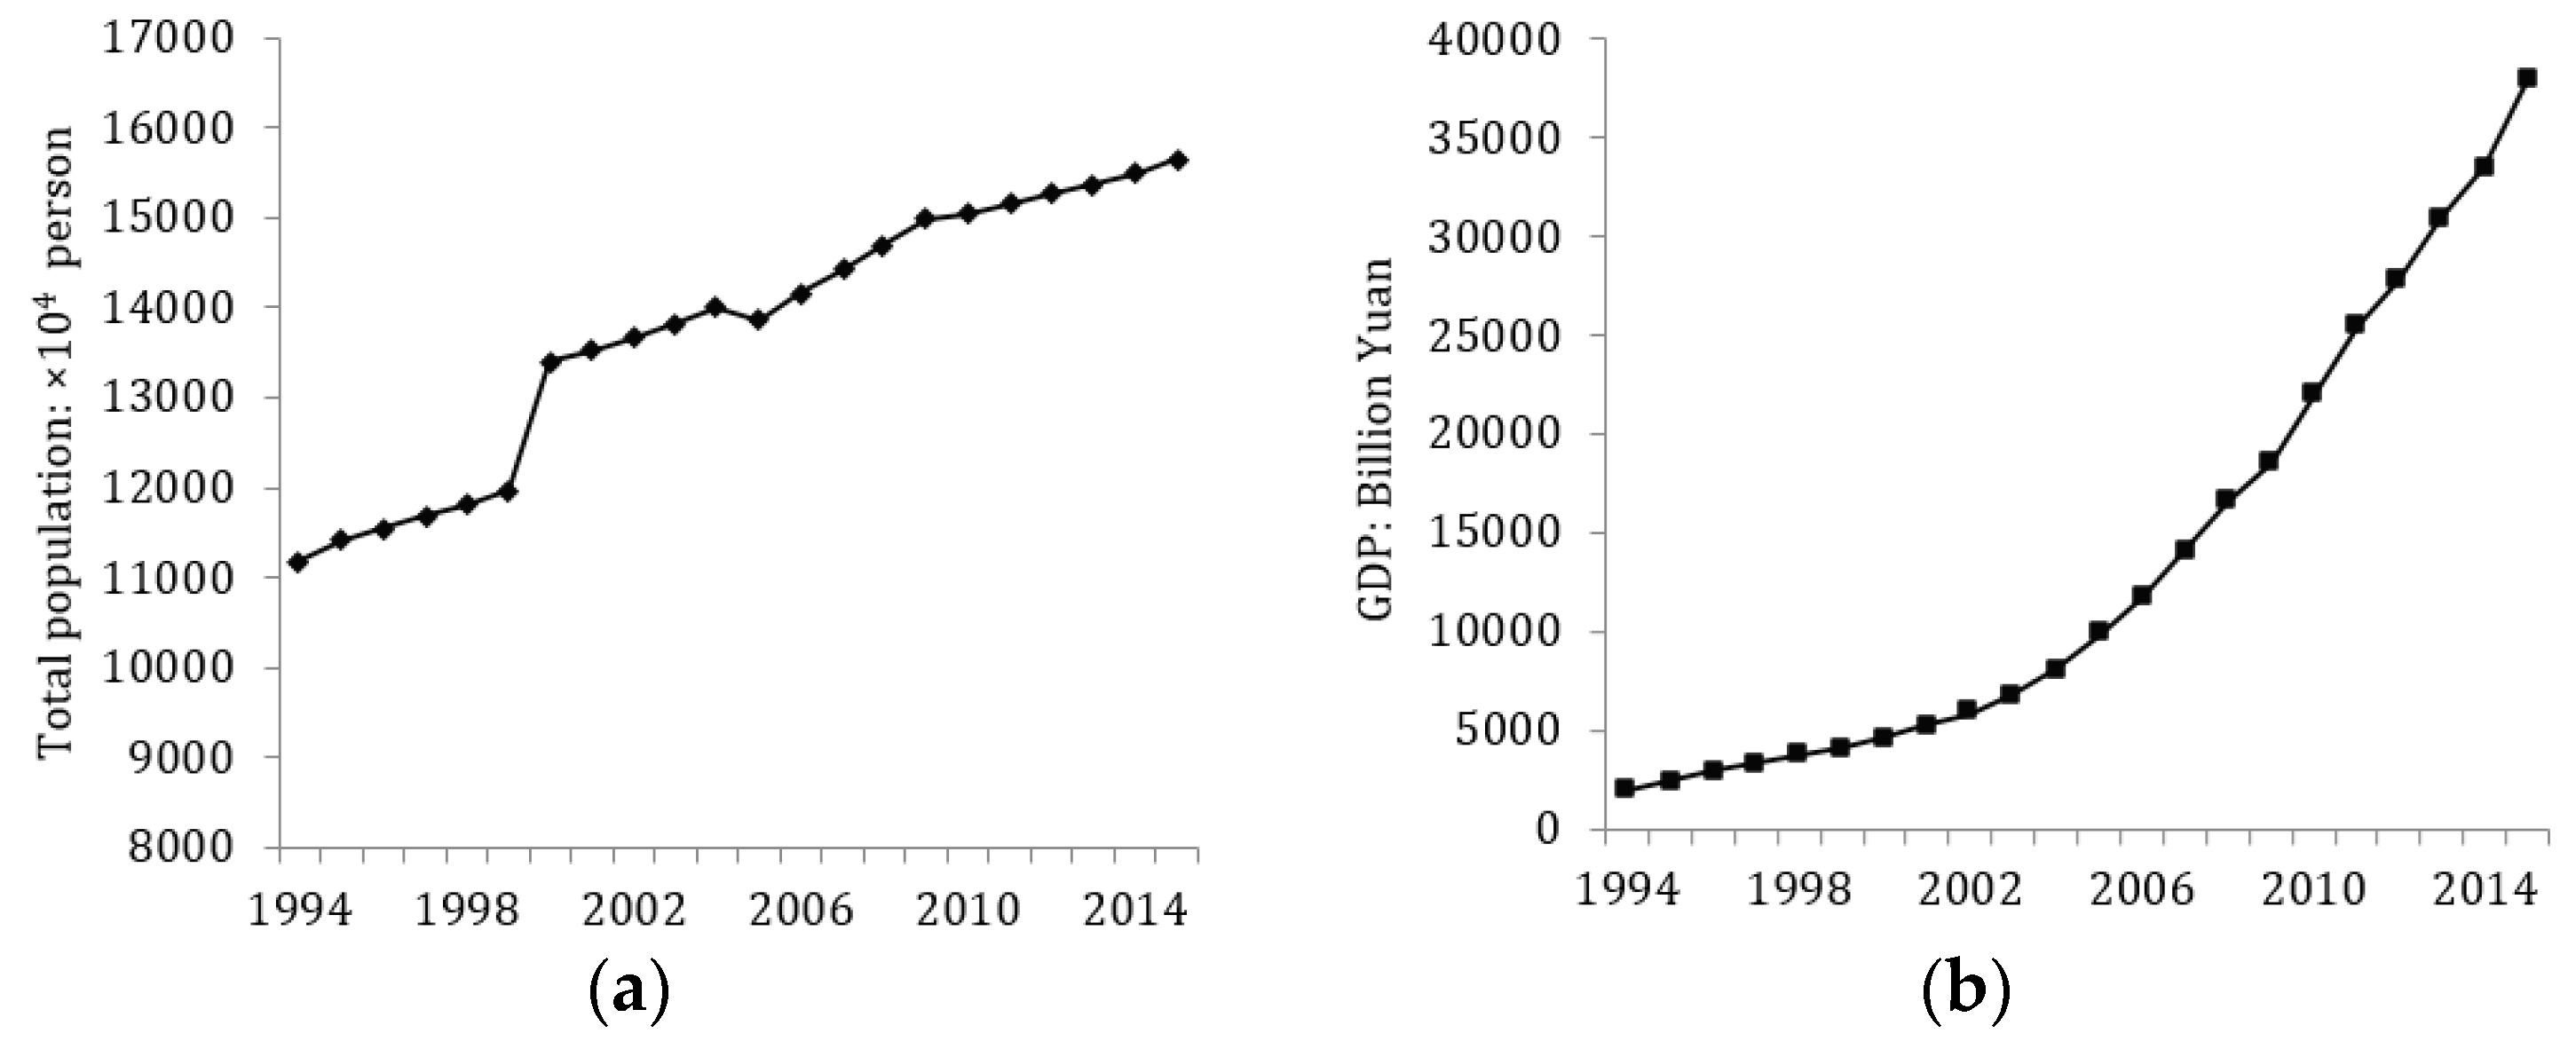
Social and economic behavior dominates urban expansion processes [27]. Population growth and economic development have been the major drivers of urbanization in China [12,23]. Generally, urbanization is defined as a rise in the ratio of the urban population to the total population, and economic development is defined as the shift in a nation’s population from rural to urban [23]. Found in Guangdong and Guangxi province, the total population experienced dramatic growth, increasing from 11,182 × 104 in 1994 to 15,645 × 104 in 2015 (Figure 10a). The GDP increased 20-fold (from 2008.5 billion yuan in 1994 to 41,057.9 billion yuan in 2016) (Figure 10b). During 1990–2017, urban land increased from 784 km2 in 1990 to 2169 km2 in 2017 (Figure 6). Urbanization has a close causal effect on economic growth [34]. Kuang et al. [17] indicated that GDP growth was correlated closely with urbanization, especially during 2000–2005. Deng et al. suggested [23,26] that urban land must increase by 3% and that GDP must grow by 10% if China wants to maintain high economic growth. Thus, urban land expansion might have to continue. Urbanization is strongly affected by population increases [2,12].
4.3. Rural–Urban Migration and Peri-Urban Development
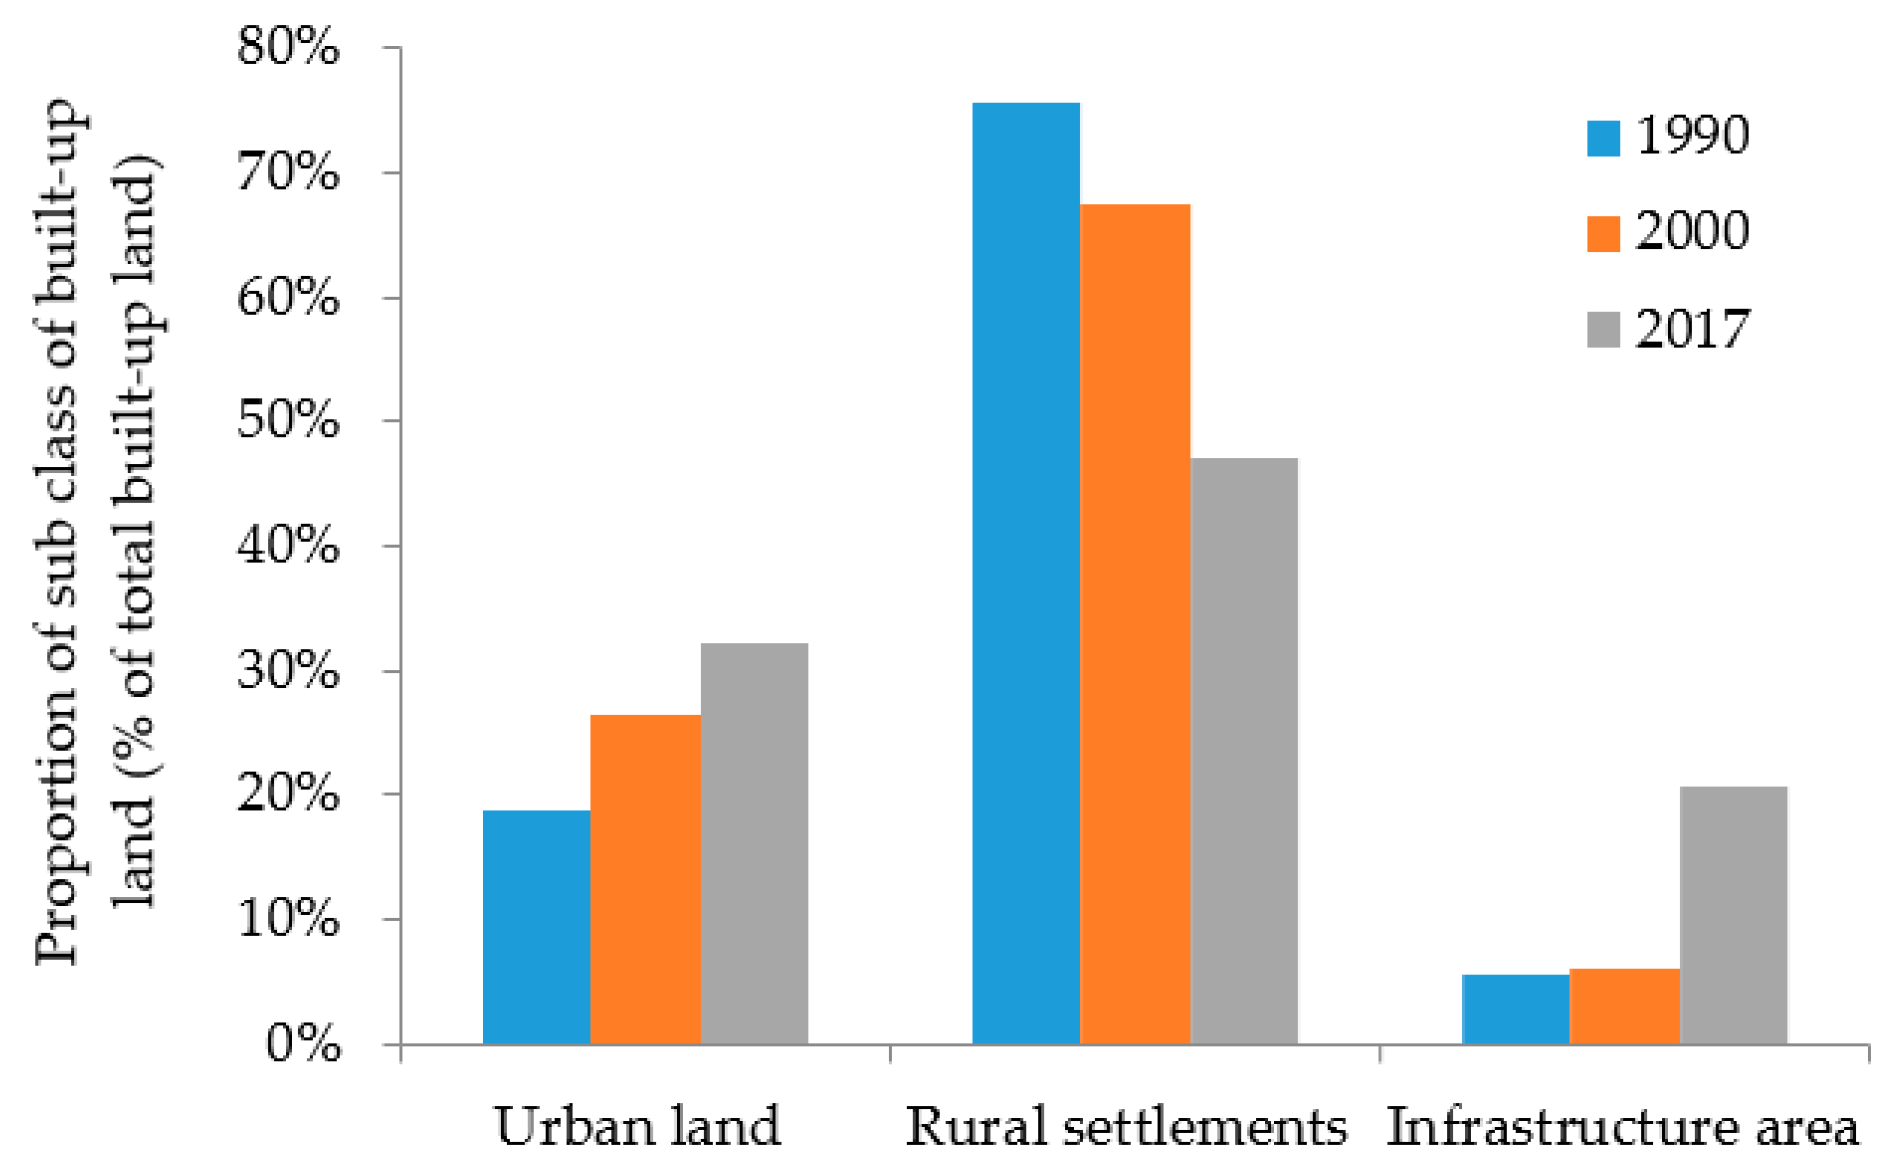
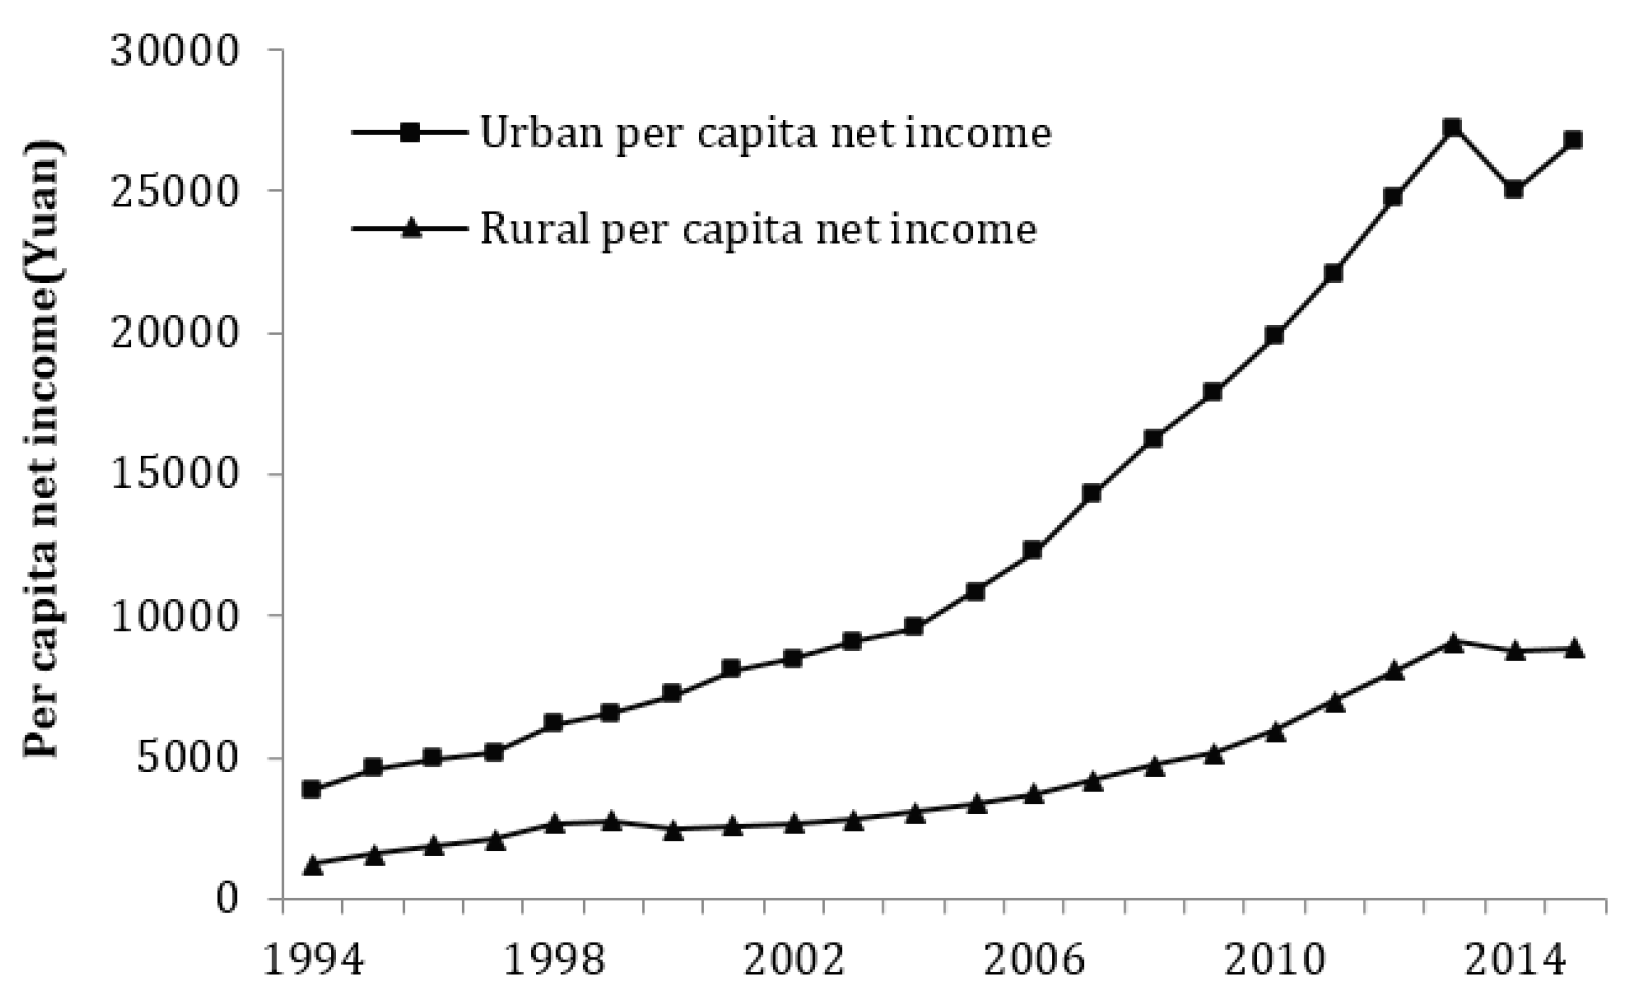
Previous studies presented that rural–urban migration was the dominant driver of urbanization. Figure 11 shows that with the built-up land expansion, the proportion of rural settlements dramatically decreased from 76% of built-up land in 1990 to 47% in 2017, while the proportion of urban built-up land significantly increased over this entire time period. Previous research indicated that, before 2000, urbanization occupied less cropland compared with rural settlements (village areas), whereas, after 2000, this conversion trend reversed [25]. Rural–urban migration was the dominant factor for urbanization in China [55]. Liu et al. [27] indicated that urban land in China will continue to expand at a rather rapid rate until 2030, so more than 50% of the population will be living in urban areas. Zhang et al. [55] stated that the income gap between rural and urban was the root cause for this migration. Figure 12 indicated that income gap between rural and urban has widened from 1994 to 2016 in ZXEB. Additionally, because of modernization and the shortage of agriculture in China, the surplus labor in the agricultural area moved to cities to seek better employment and higher income, resulting in migrant laborers (broadly defined) comprising 46% of the urban work force [56]. Concurrently, the relaxation of rural controls caused citizens to be active not only in traditional home industries, but in all types of commercial undertakings. The increase in urban employment reflected more quickly than that in rural employment, especially in Guangxi (Supplementary Figure S1B). All this activity accelerated rural–urban migration and urban land expansion [24,57].
Large migration has accelerated the urbanization process; most of the migration was concentrated in the peri-urban areas (in China, also called “Chengzhongcun”) because of low-rental housing and a lack of space within Chinese cities [57,58,59]. The urban expansion has invaded cropland, especially in peri-urban areas. The farmers lost their land resources, but remain in housing plots [60,61] in a bid to meet the huge demands of housing construction for migrants from rural areas. Previous studies show that urban expansion has led to more than 40 million farmers losing their important land resources, with this number increasing at a rate of 2 million per year in China [61]. Peri-urban development resulted from the rapid urbanization and migration from rural, with its feedback driving urbanization and urban-rural migration [59,62]. However, the peri-urban area has been facing many problems, like land-use efficiency, industrial structure, and environmental protection, for example [62,63], and peri-urban areas also have a mix of urban and rural functions and are related closely to food provision for the urban lands [62,64]. Additionally, the major effect of urbanization is the loss of cultivated land, especially in peri-urban areas [25,62]. Most of this cropland was of high quality, and its loss threatens food security [17,65]. Based on this, peri-urban development is crucial for the urbanization process. More specific-area polices for sustainable development in the peri-urban area, along with urban development, should be followed in the future.
4.4. Policy Driving Force of Urbanization
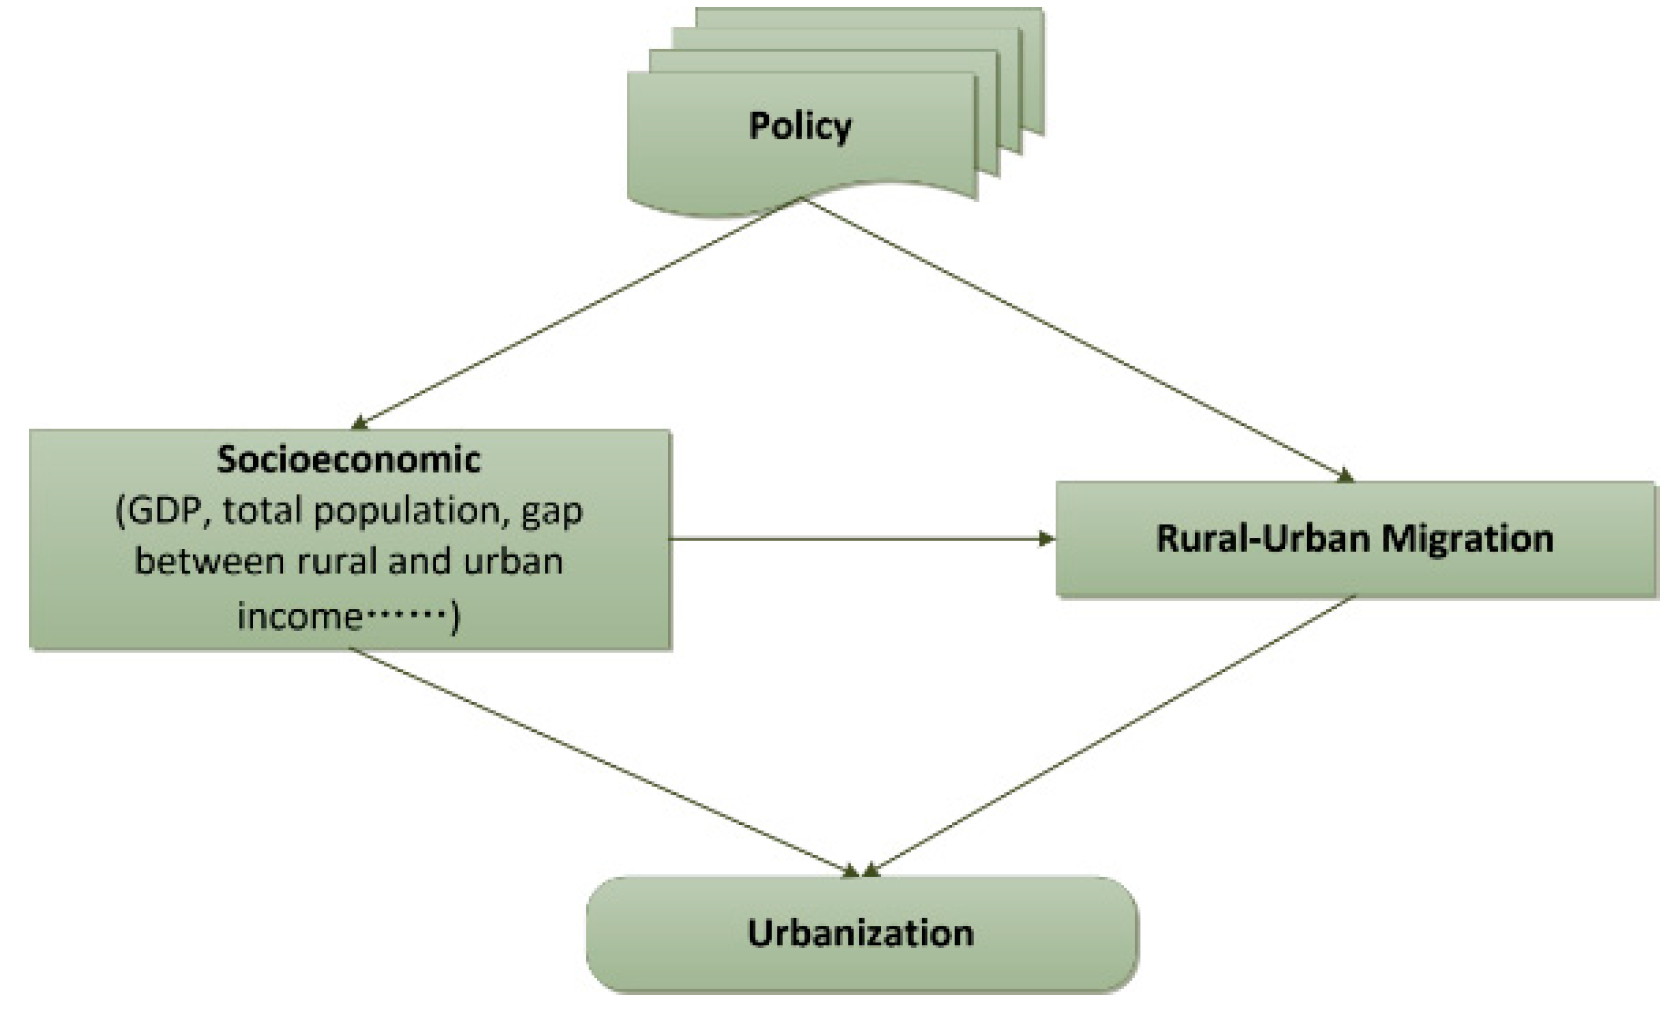
Socioeconomics and rural–urban migration were the direct driving factors for urbanization in China. Policies, as the indirect driver, have been presented as the dominant driver of urbanization in China [12,17], with the rate and pattern of urbanization often guided by national policies [12,65]. Figure 13 shows that socioeconomics and migration were the dominant factors of urbanization and policy has influenced the socioeconomic development and migration from rural areas to urban directly. The socioeconomic factors (especially the gap between rural and urban) have caused the rural–urban migration. Since 1978, economic reform and open policies have been carried out, and the urban area has increased by 4–5-fold [66]. A set of regional economic development policies were enacted—the CWDP (China Western Development Plan, 2000), the NARP (Northeast Area Revitalization Plan, 2004), and the RCCP (Rise of Central China Plan, 2006). Thus, investment in this region increased, accelerating urban land expansion [12,17]. However, not only the developed policies, but also the spatial planning related to peri-urban development, cropland protection, and so on, should be enforced in this region in the future [62,67].
More details about whether a specific policy adopt a reactive role on the land use change process, for example, evaluating which one policy is more closely related to urbanization processes, population structure and the net income over space and time, will be a contested topic in the future to provide a further suggestion for urban development. The frontier research focus on the regulations and fires on forest have been presented by Paulo Mourao et al. [68].
5. Conclusions
Using a combination of long-time-series land-use and land-cover data and statistical data, based on the land-use transition matrix, Markov chain, and Moran’s I methods, this research identified the pattern and process of all land-use types in the ZXEB during the 1990–2000 and 2000–2017 periods. The authors identified the urbanization process and discussed the possible drivers of urban land expansion. The following was found:
- (1)
- Woodland was the dominant land-use type in ZXEB, cropland increased, and woodland decreased dramatically in both periods. In the two periods, 1990–2000 and 2000–2017, woodland was found to be the most stable land-use type, and land-use activities have become stronger compared with the past.
- (2)
- Built-up land expansion was the major land-use conversion process in the two periods and most built-up land increases came from cropland and woodland. Both the urban land and rural settlements have increased in area; however, the proportion of rural settlements in built-up land has decreased since 2000.
- (3)
- The spatial autocorrelation of all land-use types in ZXEB was related highly and the modes of land-use change have changed mainly because of the change in socioeconomics, rural–urban migration, and policies.
- (4)
- Both GDP and total population have increased dramatically from 1994 to 2015, and directly caused urbanization; while rural–urban migration has led to urbanization and its process, as well as accelerated the peri-urban development.
Policy, as an indirect but dominant driver, not only influences the economic development and leads to urbanization, but also should be enforced to reduce the gap between rural–urban incomes and promote peri-urban sustainable development.
Supplementary Materials
The following are available online at https://0-www-mdpi-com.brum.beds.ac.uk/2076-3417/8/9/1524/s1.
Author Contributions
Y.H. designed and supervised the research. B.(Batunacun) completed the data analysis and drafting work. Y.H. and B.(Batunacun) together completed the revision of the paper.
Funding
This study was supported by the National Key Research and Development Plan (2016YFC0503701, 2016YFB0501502), the Strategic Priority Research Program of CAS (XDA19040301, XDA20010202), and the Key Project of High-Resolution Earth Observation (No. 00-Y30B14-9001-14/16).
Acknowledgments
We would like to give thanks to the two anonymous referees and all editors who provided great suggestions for this study.
Conflicts of Interest
The authors declare no conflict of interest.
References
- Liu, J.; Zhang, Z.; Xu, X.; Kuang, W.; Zhou, W.; Zhang, S.; Li, R.; Yan, C.; Yu, D.; Wu, S.; Jiang, N. Spatial patterns and driving forces of land use change in China during the early 21st century. J. Geogr. Sci. 2010, 20, 483–494. [Google Scholar] [CrossRef]
- Shi, G.; Jiang, N.; Yao, L. Land Use and Cover Change during the Rapid Economic Growth Period from 1990 to 2010: A Case Study of Shanghai. Sustainability 2018, 10, 426. [Google Scholar] [CrossRef]
- Ning, J.; Liu, J.; Kuang, W.; Xu, X.; Zhang, S.; Yan, C.; Li, R.; Wu, S.; Hu, Y.; Du, G.; et al. Spatiotemporal patterns and characteristics of land-use change in China during 2010–2015. J. Geogr. Sci. 2018, 28, 547–562. [Google Scholar] [CrossRef]
- Diouf, A.; Lambin, E.F. Monitoring land-cover changes in semi-arid regions: remote sensing data and field observations in the Ferlo, Senegal. J. Arid Environ. 2001, 48, 129–148. [Google Scholar] [CrossRef]
- Lambin, E.F.; Geist, H.J.; Lepers, E. Dynamics of Land-Use and Land-Cover Change in Tropical Regions. Annu. Rev. Environ. Resour. 2003, 28, 205–241. [Google Scholar] [CrossRef]
- Liu, J.; Liu, M.; Zhuang, D.; Zhang, Z.; Deng, X. Study on spatial pattern of land-use change in China during 1995–2000. Sci. China Ser. Earth Sci. 2003, 46, 373–384. [Google Scholar]
- Bajocco, S.; De Angelis, A.; Perini, L.; Ferrara, A.; Salvati, L. The impact of land use/land cover changes on land degradation dynamics: a Mediterranean case study. Environ. Manag. 2012, 49, 980–989. [Google Scholar] [CrossRef] [PubMed]
- Maitima, J.M.; Mugatha, S.M.; Reid, R.S.; Gachimbi, L.N.; Majule, A.; Lyaruu, H.; Pomery, D.; Mathai, S.; Mugisha, S. The linkages between land use change, land degradation and biodiversity across East Africa. Afr. J. Environ. Sci. Technol. 2009, 3, 310–325. [Google Scholar]
- Yang, D.; Kanae, S.; Oki, T.; Koike, T.; Musiake, K. Global potential soil erosion with reference to land use and climate changes. Hydrol. Process. 2003, 17, 2913–2928. [Google Scholar] [CrossRef]
- Lambin, E.F.; Turner, B.L.; Geist, H.J.; Agbola, S.B.; Angelsen, A.; Bruce, J.W.; Coomes, O.T.; Dirzo, R.; Fischer, G.; Folke, C.; et al. The causes of land-use and land-cover change: moving beyond the myths. Glob. Environ. Chang. 2001, 11, 261–269. [Google Scholar] [CrossRef] [Green Version]
- Lin, G.C.; Ho, S.P. China’s land resources and land-use change: insights from the 1996 land survey. Land Use Policy 2003, 20, 87–107. [Google Scholar] [CrossRef]
- Liu, J.; Zhang, Q.; Hu, Y. Regional differences of China’s urban expansion from late 20th to early 21st century based on remote sensing information. Chin. Geogr. Sci. 2012, 22, 1–14. [Google Scholar] [CrossRef]
- Batunacun; Nendel, C.; Hu, Y.; Lakes, T. Land-use change and land degradation on the Mongolian Plateau from 1975 to 2015—A case study from Xilingol, China. Land Degrad. Dev. 2018, 29, 1595–1606. [Google Scholar] [CrossRef]
- Song, C.; Zhang, Y. Forest Cover in China from 1949 to 2006. In Reforesting Landscapes; Nagendra, H., Southworth, J., Eds.; Springer Netherlands: Dordrecht, The Netherlands, 2009; Volume 10, pp. 341–356. ISBN 978-1-4020-9655-6. [Google Scholar]
- Tao, S.; Fang, J.; Zhao, X.; Zhao, S.; Shen, H.; Hu, H.; Tang, Z.; Wang, Z.; Guo, Q. Rapid loss of lakes on the Mongolian Plateau. Proc. Natl. Acad. Sci. 2015, 112, 2281–2286. [Google Scholar] [CrossRef] [PubMed] [Green Version]
- Liu, J.; Liu, M.; Tian, H.; Zhuang, D.; Zhang, Z.; Zhang, W.; Tang, X.; Deng, X. Spatial and temporal patterns of China’s cropland during 1990–2000: An analysis based on Landsat TM data. Remote Sens. Environ. 2005, 98, 442–456. [Google Scholar] [CrossRef]
- Kuang, W.; Liu, J.; Dong, J.; Chi, W.; Zhang, C. The rapid and massive urban and industrial land expansions in China between 1990 and 2010: A CLUD-based analysis of their trajectories, patterns, and drivers. Landsc. Urban Plan. 2016, 145, 21–33. [Google Scholar] [CrossRef] [Green Version]
- Lin, G.C.S. Reproducing Spaces of Chinese Urbanisation: New City-based and Land-centred Urban Transformation. Urban Stud. 2007, 44, 1827–1855. [Google Scholar] [CrossRef]
- Xiao, J.; Shen, Y.; Ge, J.; Tateishi, R.; Tang, C.; Liang, Y.; Huang, Z. Evaluating urban expansion and land use change in Shijiazhuang, China, by using GIS and remote sensing. Landsc. Urban Plan. 2006, 75, 69–80. [Google Scholar] [CrossRef]
- He, C.; Huang, Z.; Wang, R. Land use change and economic growth in urban China: A structural equation analysis. Urban Stud. 2014, 51, 2880–2898. [Google Scholar] [CrossRef]
- Elmqvist, T.; Fragkias, M.; Goodness, J.; Güneralp, B.; Marcotullio, P.J.; McDonald, R.I.; Parnell, S.; Schewenius, M.; Sendstad, M.; Seto, K.C.; et al. Urbanization, Biodiversity and Ecosystem Services: Challenges and Opportunities: A Global Assessment, 1st ed.; Springer Netherlands: Dordrecht, The Netherlands, 2013; ISBN 978-94-007-7087-4. [Google Scholar]
- World Urbanization Prospects—Population Division—United Nations. Available online: https://esa.un.org/unpd/wup/ (accessed on 14 August 2018).
- Deng, X.; Huang, J.; Rozelle, S.; Uchida, E. Economic Growth and the Expansion of Urban Land in China. Urban Stud. 2010, 47, 813–843. [Google Scholar] [CrossRef]
- Ho, S.P.S.; George, C.S. Lin Non-Agricultural Land Use in Post-Reform China. China Q. 2004, 758–781. [Google Scholar] [CrossRef]
- Deng, X.; Huang, J.; Rozelle, S.; Zhang, J.; Li, Z. Impact of urbanization on cultivated land changes in China. Land Use Policy 2015, 45, 1–7. [Google Scholar] [CrossRef] [Green Version]
- Deng, X.; Huang, J.; Rozelle, S.; Uchida, E. Growth, population and industrialization, and urban land expansion of China. J. Urban Econ. 2008, 63, 96–115. [Google Scholar] [CrossRef]
- Liu, J.; Zhan, J.; Deng, X. Spatio-temporal patterns and driving forces of urban land expansion in China during the economic reform era. Ambio 2005, 34, 450–455. [Google Scholar] [CrossRef] [PubMed]
- Kalnay, E.; Cai, M. Impact of urbanization and land-use change on climate. Nature 2003, 423, 528–531. [Google Scholar] [CrossRef] [PubMed]
- Chen, J. Rapid urbanization in China: A real challenge to soil protection and food security. CATENA 2007, 69, 1–15. [Google Scholar] [CrossRef]
- Tang, C.-S.; Shi, B.; Gao, L.; Daniels, J.L.; Jiang, H.-T.; Liu, C. Urbanization effect on soil temperature in Nanjing, China. Energy Build. 2011, 43, 3090–3098. [Google Scholar] [CrossRef]
- Hall, R.I.; Leavitt, P.R.; Quinlan, R.; Dixit, A.S.; Smol, J.P. Effects of agriculture, urbanization, and climate on water quality in the northern Great Plains. Limnol. Oceanogr. 1999, 44, 739–756. [Google Scholar] [CrossRef] [Green Version]
- Development Plan for Zhujiang-Xijiang Economic Belt. 2013. Available online: http://img.thupdi.com/news/2015/08/1440492277635777 (accessed on 30 August 2013).
- Huang, G.; Jiang, Y. Urbanization and Socioeconomic Development in Inner Mongolia in 2000 and 2010: A GIS Analysis. Sustainability 2017, 9, 235. [Google Scholar] [CrossRef]
- Bai, X.; Chen, J.; Shi, P. Landscape Urbanization and Economic Growth in China: Positive Feedbacks and Sustainability Dilemmas. Environ. Sci. Technol. 2012, 46, 132–139. [Google Scholar] [CrossRef] [PubMed]
- Kumar, S.; Radhakrishnan, N.; Mathew, S. Land use change modelling using a Markov model and remote sensing. Geomat. Nat. Hazards Risk 2014, 5, 145–156. [Google Scholar] [CrossRef]
- Muller, M.R.; Middleton, J. A Markov model of land-use change dynamics in the Niagara Region, Ontario, Canada. Landsc. Ecol. 1994, 9, 151–157. [Google Scholar]
- Tang, J.; Wang, L.; Yao, Z. Spatio-temporal urban landscape change analysis using the Markov chain model and a modified genetic algorithm. Int. J. Remote Sens. 2007, 28, 3255–3271. [Google Scholar] [CrossRef]
- Lopez, E.; Bocco, G.; Mendoza, M.; Duhau, E. Predicting land-cover and land-use change in the urban fringe A case in Morelia city, Mexico. Landsc. Urban Plan. 2001, 55, 271–285. [Google Scholar] [CrossRef]
- Biondini, M.; Kandus, P. Transition matrix analysis of land-cover change in the accretion area of the Lower Delta of the Paraná River (Argentina) reveals two succession pathways. Wetlands 2006, 26, 981–991. [Google Scholar] [CrossRef]
- Weng, Q. Land use change analysis in the Zhujiang Delta of China using satellite remote sensing, GIS and stochastic modelling. J. Environ. Manag. 2002, 64, 273–284. [Google Scholar] [CrossRef] [Green Version]
- Liu, J.; Kuang, W.; Zhang, Z.; Xu, X.; Qin, Y.; Ning, J.; Zhou, W.; Zhang, S.; Li, R.; Yan, C.; et al. Spatiotemporal characteristics, patterns, and causes of land-use changes in China since the late 1980s. J. Geogr. Sci. 2014, 24, 195–210. [Google Scholar] [CrossRef]
- Li, P.; Fan, J. Regional Ecological Vulnerability Assessment of the Guangxi Xijiang River Economic Belt in Southwest China with VSD Model. J. Resour. Ecol. 2014, 5, 163–170. [Google Scholar] [CrossRef]
- Liu, J.Y.; Zhuang, D.F.; Zhang, Z.X.; Gao, Z.; Deng, X. The Establishment of Land-use Spatial-temporal Database and Its Relative Studies in China. J. Geo-Inf. Sci. 2012, 4, 3–7. (In Chinese) [Google Scholar]
- Zhan, J.Y.; Deng, X.Z.; Jiang, O.; Shi, N.N. The Application of System Dynamics and CLUE-S Model in Land Use Change Dynamic Simulation: A Case Study in Taips County, Inner Mongolia of China. In Proceedings of the Conference on System Science, Management Science & System Dynamics, Shanghai, China, 19–21 October 2007; pp. 2781–2790. Available online: https://www.researchgate.net/publication/228986766_The_Application_of_System_Dynamics_and_CLUE-S_Model_in_Land_Use_Change_Dynamic_Simulation_a_Case_Study_in_Taips_County_Inner_Mongolia_of_China (accessed on 5 October 2016).
- Zheng, Y.; Xu, Z.; Kemp, D.; Akahashi, T.; Jones, R. Modeling Optimal Grazing Management for Grassland Rehabilitation on the Typical Steppe: A Case Study in Taipusi Banner, Inner Mongolia, China. Philipp. Agric. Sci. 2011, 93, 420–428. [Google Scholar]
- National Bureau of Statistics of China. Available online: http://www.stats.gov.cn/english/ (accessed on 11 June 2018).
- Houet, T.; Hubert-Moy, L. Modeling and projecting land-use and land-cover changes with Cellular Automaton in considering landscape trajectories. EARSeL EProceedings Eur. Assoc. Remote Sens. Lab. 2006, 5, 63–76. [Google Scholar]
- Bell, E.J. Markov analysis of land use change—an application of stochastic processes to remotely sensed data. Socioecon. Plan. Sci. 1974, 8, 311–316. [Google Scholar] [CrossRef]
- Cheng, Z.; Cao, S. Markov Processes in Modeling Land Use and Land Cover Change in Tibetan Platau. In Proceedings of the 2011 International Conference on Remote Sensing, Environment and Transportation Engineering, Nanjing, China, 24–26 June 2011; pp. 457–459. [Google Scholar]
- Niu, L.; Luo, W.; Jiang, M.; Lu, N. Land-Use Degree and Spatial Autocorrelation Analysis in Kunming City Based on Big Data. In Proceedings of the 2018 International Conference on Intelligent Transportation, Big Data & Smart City (ICITBS), Xiamen, China, 25– 26 January 2018; pp. 97–100. [Google Scholar]
- GeoDa on Github. Available online: https://geodacenter.github.io/ (accessed on 27 August 2018).
- Overmars, K.P.; de Koning, G.H.J.; Veldkamp, A. Spatial autocorrelation in multi-scale land use models. Ecol. Model. 2003, 164, 257–270. [Google Scholar] [CrossRef] [Green Version]
- Meyer, W.B.; Turner, B.L., II. Human Population Growth and Global Land-Use/Cover Change. Annu. Rev. Ecol. Syst. 1992, 23, 39–61. [Google Scholar] [CrossRef]
- Xie, Z.F.; Wang, Q. Spatial Autocorrelation Analysis of Land Use Intensity in Guangzhou City. Trop. Geogr. 2009, 29, 129–133. [Google Scholar]
- Zhang, K.H.; Song, S. Rural–urban migration and urbanization in China: Evidence from time-series and cross-section analyses. China Econ. Rev. 2003, 14, 386–400. [Google Scholar] [CrossRef]
- Xiao, W.; Zhao, G. Agricultural land and rural-urban migration in China: A new pattern. Land Use Policy 2018, 74, 142–150. [Google Scholar] [CrossRef]
- Gallin, B. Contesting Citizenship in Urban China: Peasant Migrants, the State, and the Logic of the Market. China Rev. Int. 2001, 8, 220–223. [Google Scholar] [CrossRef]
- Wu, F. Housing in Chinese Urban Villages: The Dwellers, Conditions and Tenancy Informality. Hous. Stud. 2016, 31, 852–870. [Google Scholar] [CrossRef]
- Zhao, P. Urban-rural transition in China’s metropolises: New trends in peri-urbanisation in Beijing. Int. Dev. Plan. Rev. 2012, 34, 269–294. [Google Scholar] [CrossRef]
- Pribadi, D.O.; Pauleit, S. The dynamics of peri-urban agriculture during rapid urbanization of Jabodetabek Metropolitan Area. Land Use Policy 2015, 48, 13–24. [Google Scholar] [CrossRef]
- Liu, Y.; He, S.; Wu, F.; Webster, C. Urban villages under China’s rapid urbanization: Unregulated assets and transitional neighbourhoods. Habitat Int. 2010, 34, 135–144. [Google Scholar] [CrossRef]
- Wandl, A.; Magoni, M. Sustainable Planning of Peri-Urban Areas: Introduction to the Special Issue. Plan. Pract. Res. 2017, 32, 1–3. [Google Scholar] [CrossRef]
- Ge, B.; Tian, L. Characteristics and driving forces of peri-urban areas: the case of shanghai, China. In Proceedings of the 2011 5th International Association for China Planning Conference, Beijing, China, 17–19 June 2011; pp. 1–7. [Google Scholar]
- Kleemann, J.; Inkoom, J.N.; Thiel, M.; Shankar, S.; Lautenbach, S.; Fürst, C. Peri-urban land use pattern and its relation to land use planning in Ghana, West Africa. Landsc. Urban Plan. 2017, 165, 280–294. [Google Scholar] [CrossRef]
- Song, W.; Pijanowski, B.C. The effects of China’s cultivated land balance program on potential land productivity at a national scale. Appl. Geogr. 2014, 46, 158–170. [Google Scholar] [CrossRef]
- Schneider, A.; Mertes, C.M. Expansion and growth in Chinese cities, 1978–2010. Environ. Res. Lett. 2014, 9, 024008. [Google Scholar] [CrossRef] [Green Version]
- Land Conversion in Transitional China. Available online: http://edepot.wur.nl/14504 (accessed on 1 October 2009).
- Mourao, P.R.; Martinho, V.D. Discussing structural breaks in the Portuguese regulation on forest fires—An economic approach. Land Use Policy 2016, 54, 460–478. [Google Scholar] [CrossRef]
Figure 1.
Location of the study area and its eleven municipalities.

Figure 2.
Land use maps in 1990, 2000, and 2017.

Figure 3.
Net change in land-use and land-cover from 1990 to 2017. (a) 1990–2000. (b) 2000–2017.

Figure 4.
Map of the net change in six land-use types from 1990 to 2000 and 2000 to 2017.

Figure 5.
The spatial pattern of land-use and land-cover change (LUCC) in the Zhujiang–Xijiang Economic Belt (ZXEB). (top): 1990–2000, (bottom): 2000–2017.
Figure 5.
The spatial pattern of land-use and land-cover change (LUCC) in the Zhujiang–Xijiang Economic Belt (ZXEB). (top): 1990–2000, (bottom): 2000–2017.

Figure 6.
Built-up land expansion in the ZXEB from 1990 to 2017.

Figure 7.
Map of built-up land expansion from 1990 to 2017.

Figure 8.
Urban expansion in eleven prefecture-level cities in the ZXEB (1990, 2000, and 2017). Note: Guangzhou and Foshan are connected.
Figure 8.
Urban expansion in eleven prefecture-level cities in the ZXEB (1990, 2000, and 2017). Note: Guangzhou and Foshan are connected.

Figure 9.
Moran’s I of land-use/cover of study area during 1990 and 2005. Note: unused land was ignored as a result of it being the smallest area (less than 0.01% of total area), (a) Moran’s I of cropland, woodland, grassland and water body, (b) Moran’s I of urban land, rural settlements, infrastructure areas and built-up land.

Figure 10.
Population and gross domestic product (GDP) change from 1994 to 2015. (a) Total population in ZXEB from 1994–2015. (b) GDP in the Zhujiang–Xijiang Economic Belt (ZXEB) from 1994–2015.
Figure 10.
Population and gross domestic product (GDP) change from 1994 to 2015. (a) Total population in ZXEB from 1994–2015. (b) GDP in the Zhujiang–Xijiang Economic Belt (ZXEB) from 1994–2015.

Figure 11.
Proportion of sub-class of built-up land change in 1990, 2000, and 2017.

Figure 12.
Urban and rural per capita net income.

Figure 13.
The linkage between policy, socioeconomic, rural–urban migration, and urbanization.


Table 1.
The land-use classification system.
| Classes | Code | Description |
|---|---|---|
| Cropland | 1 | Land for growing crops. |
| Woodland | 2 | Land for growing trees, arbor, shrubs, bamboo, and forestry use. |
| Grassland | 3 | Land for herbaceous plants. |
| Water bodies | 4 | Natural water areas, including constructed reservoirs as well as water reservations and irrigation facilities. |
| Unused land | 6 | Land that is not put into practical use or that is difficult to use. |
| Built-up land | 5 | Human settlements in urban and rural areas as well as factories and transportation facilities. |
| Urban land | 51 | Built-up areas used for urban settlements |
| Rural settlements | 52 | Land used for small towns or village settlements. |
| Infrastructure areas | 53 | Land used for factories, quarries, mining, and oil fields outside cities, as well as land for roads and other transportation infrastructure |
Table 2.
The land-use and land-cover change (LUCC) matrix in the Zhujiang–Xijiang Economic Belt (ZXEB) from 1990 to 2000 (unit: km2).
Table 2.
The land-use and land-cover change (LUCC) matrix in the Zhujiang–Xijiang Economic Belt (ZXEB) from 1990 to 2000 (unit: km2).
| Cropland | Woodland | Grassland | Water Body | Built-Up Land | Unused Land | Losses | ||
|---|---|---|---|---|---|---|---|---|
| 1990–2000 | Cropland | 38,936.19 | 49.77 | 3.27 | 396.47 | 542.02 | 0.01 | 991.54 |
| Woodland | 92.23 | 104,364.36 | 119.25 | 20.78 | 53.29 | 0.00 | 285.55 | |
| Grassland | 42.73 | 470.11 | 11,577.32 | 5.15 | 9.19 | 0.00 | 527.18 | |
| Water body | 55.69 | 2.00 | 0.47 | 3824.41 | 43.59 | 0.09 | 101.85 | |
| Built-up land | 0.00 | 0.00 | 0.00 | 0.00 | 3930.47 | 0.00 | 0.00 | |
| Unused land | 0.00 | 0.00 | 0.00 | 0.03 | 0.00 | 24.48 | 0.03 | |
| Gains | 190.66 | 521.88 | 123.00 | 422.42 | 648.09 | 0.10 | 1906.16 |
Table 3.
Land-use transition possibilities, 1990–2000.
| Cropland | Woodland | Grassland | Water Body | Built-Up Land | Unused Land | ||
|---|---|---|---|---|---|---|---|
| 1990–2000 | Cropland | 0.9752 | 0.0012 | 0.0001 | 0.0099 | 0.0136 | 0.0000 |
| Woodland | 0.0009 | 0.9973 | 0.0011 | 0.0002 | 0.0005 | 0.0000 | |
| Grassland | 0.0035 | 0.0388 | 0.9564 | 0.0004 | 0.0008 | 0.0000 | |
| Water body | 0.0142 | 0.0005 | 0.0001 | 0.9741 | 0.0111 | 0.0000 | |
| Built-up land | 0.0000 | 0.0000 | 0.0000 | 0.0000 | 1.0000 | 0.0000 | |
| Unused land | 0.0000 | 0.0000 | 0.0000 | 0.0012 | 0.0000 | 0.9988 |
Note: The built-up land generally did not change into other land-use types, so the transition possibility was “0.0000”.
Table 4.
The LUCC matrix in the ZXEB from 2000 to 2017 (units: km2).
| Cropland | Woodland | Grassland | Water Body | Built-Up Land | Unused Land | Losses | ||
|---|---|---|---|---|---|---|---|---|
| 2000–2017 | Cropland | 37,526.41 | 157.99 | 12.86 | 131.98 | 1296.82 | 0.82 | 1600.46 |
| Woodland | 81.47 | 103,935.64 | 293.33 | 48.21 | 526.45 | 3.01 | 952.48 | |
| Grassland | 4.26 | 248.41 | 11,345.65 | 17.23 | 84.78 | 0.04 | 354.73 | |
| Water body | 33.94 | 6.95 | 36.22 | 3901.20 | 266.68 | 1.89 | 345.68 | |
| Built-up land | 0.00 | 0.00 | 0.00 | 0.00 | 4578.57 | 0.00 | 0.00 | |
| Unused land | 0.02 | 0.42 | 0.02 | 0.42 | 1.55 | 22.16 | 2.43 | |
| Gains | 119.70 | 413.77 | 342.42 | 197.85 | 2176.28 | 5.77 | 3255.78 |
Table 5.
Land-use transition possibilities, 2000–2017.
| Cropland | Woodland | Grassland | Water Body | Built-Up Land | Unused Land | ||
|---|---|---|---|---|---|---|---|
| 2000–2017 | Cropland | 0.9591 | 0.0040 | 0.0003 | 0.0034 | 0.0331 | 0.0000 |
| Woodland | 0.0008 | 0.9909 | 0.0028 | 0.0005 | 0.0050 | 0.0000 | |
| Grassland | 0.0004 | 0.0212 | 0.9697 | 0.0015 | 0.0072 | 0.0000 | |
| Water body | 0.0080 | 0.0016 | 0.0085 | 0.9186 | 0.0628 | 0.0004 | |
| Built-up land | 0.0000 | 0.0000 | 0.0000 | 0.0000 | 1.0000 | 0.0000 | |
| Unused land | 0.0008 | 0.0171 | 0.0008 | 0.0171 | 0.0630 | 0.9012 |
© 2018 by the authors. Licensee MDPI, Basel, Switzerland. This article is an open access article distributed under the terms and conditions of the Creative Commons Attribution (CC BY) license (http://creativecommons.org/licenses/by/4.0/).
Share and Cite
MDPI and ACS Style
Hu, Y.; Batunacun. An Analysis of Land-Use and Land-Cover Change in the Zhujiang–Xijiang Economic Belt, China, from 1990 to 2017. Appl. Sci. 2018, 8, 1524. https://0-doi-org.brum.beds.ac.uk/10.3390/app8091524
AMA Style
Hu Y, Batunacun. An Analysis of Land-Use and Land-Cover Change in the Zhujiang–Xijiang Economic Belt, China, from 1990 to 2017. Applied Sciences. 2018; 8(9):1524. https://0-doi-org.brum.beds.ac.uk/10.3390/app8091524
Chicago/Turabian StyleHu, Yunfeng, and Batunacun. 2018. "An Analysis of Land-Use and Land-Cover Change in the Zhujiang–Xijiang Economic Belt, China, from 1990 to 2017" Applied Sciences 8, no. 9: 1524. https://0-doi-org.brum.beds.ac.uk/10.3390/app8091524
Note that from the first issue of 2016, this journal uses article numbers instead of page numbers. See further details here.