Article

Eccentric Compressive Behavior of Reinforced Concrete Columns Strengthened Using Steel Mesh Reinforced Resin Concrete

1
Department of Bridge Engineering, School of Civil Engineering, Southwest Jiaotong University, Chengdu 610031, China
2
Sichuan Jiaoda Inspection and Consulting Engineering Company Limited, Chengdu 610031, China
3
Department of Civil, Environmental and Ocean Engineering, Stevens Institute of Technology, Hoboken, NJ 07030, USA
*
Author to whom correspondence should be addressed.
Submission received: 5 September 2018 / Revised: 25 September 2018 / Accepted: 27 September 2018 / Published: 5 October 2018
(This article belongs to the Section Materials Science and Engineering)

Abstract

:
Rapid strengthening is focused on recently to reduce the time for reinforcement process and decrease the losses. However, there are some limits for the existing reinforcement technologies to be used for rapid strengthening. The paper reports an experimental investigation on eccentric compressive behavior of reinforced concrete columns that are strengthened using steel mesh reinforced resin concrete (SMRC) for rapid strengthening. Four reinforced concrete columns with 180 mm × 250 mm test cross section and 1000 mm test height were fabricated and tested under large eccentric compressive load. Among the four columns, three columns were strengthened using SMRC with different numbers of steel mesh layers; the other column was not strengthened and was used as the control specimen. The effect of layer number of steel mesh on the failure mode, cracking load and load capacity of the columns were studied. Finite element analysis was carried out to evaluate the effects of the layer number of steel mesh, thickness of SMRC layer, and the load-holding level on the load capacity of the columns. Results show that the crack distribution of the strengthened columns was influenced by the layer number of steel mesh. The layer number was the dominant variable for the load capacity, rather than the thickness of the SMRC layer. With the increase of load-holding level, the load capacity of the strengthened column decreased following a bilinear trend. Some conclusions can be drawn that the reasonable reinforcement ratio of steel mesh is about 2%. Resin concrete is mainly used as bonding layer. The decreasing rate of the bearing capacity is higher at the high load-holding levels.

1. Introduction

Civil infrastructure is aging all over the world [1], and the ages of many structures are approaching to the designed service life [2]. However, the aging bridges are subjected to increasing traffic loading [3] and climate change impacts [4]. Among various structural components, the degradation of columns is attracting increasing research interests for structural engineers, because column resists vertical loading and directly affects the structural safety [5,6,7].
Model test and In-situ test have been considered as the effective approach to investigate the mechanical performance of bridge structures [8,9,10,11,12,13,14]. Reinforced concrete columns have been strengthened using different materials, such as reinforced concrete, steel, and fiber reinforced polymers (FRP). Hadi et al. [15] investigated the flexural behavior of RC columns that are strengthened by reactive powder concrete (RPC) and showed RPC could increase the ultimate flexural load effectively. However, a long time was needed after the reinforcement process to let RPC reach certain strength. Lee et al. [16], and Parghi and Alam [17] analyzed the seismic behavior of bridge piers strengthened by steel and FRP, respectively, and validated the effectiveness. However a flat and smooth surface is needed to apply steel plate or FRP jacketing. In addition, the bond strength between the steel plate and FRP, and concrete structure must be considered because there is a large possibility to debonding failure [18,19,20]. Ferrocement, which is a composite material that consists of steel mesh with dense spacing and concrete or mortar, was developed for reinforced concrete columns [21]. Mashrei et al. [22] and Gandomi et al. [23] investigated the flexural strength of ferrocement members while using a neural network model and gene expression programming, respectively, and a higher flexural strength of ferrocement as compared with FRP plates was demonstrated. Mansur et al. [24] studied the influence of the diameter of steel mesh on corrosion resistance of ferrocement. The small diameter of steel mesh was proved to be beneficial to the corrosion resistance. Xiong et al. [25] conducted an experimental study and found that the ductility of concrete column strengthened using ferrocement was higher than that of concrete column strengthened using FRP. Mourad and Shannag [26] researched the reinforcement effect of ferrocement on reinforced concrete columns under sustaining load, and the bearing capacity of the column was improved effectively when compared with the control column. Kaish et al. [27,28] proposed an improved ferrocement strengthening technique for square columns when circumferential strengthening method was applied. The technique that is proposed can address the stress concentration problem for the corner effectively.
The works that are mentioned above show the ferrocement strengthening technique has shown great promise. However, new requirements are put forward for the strengthening material. For the bridge structures in a traffic-intensive location, the time for bridge reinforcement should be shortened as much as possible in order to recover the traffic rapidly and decrease losses. Though there are many advantages for ferrocement material, the concrete or mortar in ferrocement requires a long curing time, which may increase the downtime of main route. This potentially increases the traffic pressure in urban settings. Therefore, this is a need to develop new materials for rapid strengthening.
Steel mesh reinforced resin concrete (SMRC) has been presented as a strengthening material for solving the problem that is mentioned above [29]. Yan [29] advised to replace the concrete or mortar in conventional ferrocement with the high-performance resin concrete. The resin concrete can reach certain strength in a short of period and the time for reinforcement process can be reduced using SMRC material. When the resin concrete was cured at 20 °C and a relative humidity of more than 90%, the compressive strength reached more than 80% that of the 28-day compressive strength within 24 h [29]. The resin concrete was composed of liquid epoxy resin, curing agent and the Portland cement, and the component ratio could be determined according to the requirement, such as the strength or fluidity. Besides, the woven steel mesh was used to reinforce resin concrete and it showed high tensile strength. The flexural behavior of RC beam strengthened by SMRC had been investigated, and the results showed that SMRC was practical with improved strengthening effect and the width of the crack could be decreased [29]. Except the beam structures, the compressive behavior of column structures strengthened by SMRC is also needed to be investigated, because column structure directly affects the structural safety.
This study aims to investigate the strengthening performance of SMRC for reinforced concrete columns under eccentric compression. Four reinforced concrete columns that had a cross section of 180 mm × 250 mm and a height of 1500 mm were fabricated and tested to failure. The failure mode, cracking load, and load capacity of the columns were analyzed. A finite element analysis (FEA) was established to evaluate the effects of the thickness of reinforcement layer and the load-holding level on the load capacity of the columns.

2. Experimental Program

2.1. Materials

2.1.1. Resin Concrete

The resin concrete was composed of three components, designated as A, B, and C. Among them, A is a liquid epoxy resin; B is a liquid curing agent; and, C is a mix of ordinary Portland cement and sand (average particle size: 5 mm). The mass ratio of A:B:C was 1:0.29:6.21.
The compressive strength of the resin concrete was tested in accordance with GB/T 50081-2002 [30]. To evaluate the growth of compressive strength over time, cube specimens measuring 150 mm in side length were tested at 1.5, 2, 3, 5, 7, 11, 14, 21, and 28 days at 6 °C and a relative humidity of about 40%. At each age, three cube specimens were tested and their results were averaged, as shown in Figure 1. At 5 days, the compressive strength is 85.06 MPa, which is more than 95% that of the compressive strength (88.34 MPa) at 28 days. Figure 1 also shows a stable development trend after curing for five days. The performances of resin concrete at five days were adopted in the test.
Three prism specimens measuring in 150 mm × 150 mm × 300 mm were tested to determine the compressive stress-strain relationship at five days, as shown in Figure 2, in accordance with GB/T 50081-2002 [30]. The prism specimens were tested under displacement control at a displacement rate of 0.1 mm/min. The Young’s modulus was determined 20.8 GPa ± 0.5 GPa (mean value ± standard deviation).
Three dogbone specimens were tested to determine the tensile stress-strain relationship at five days, as described in Figure 3, in accordance with SL 352-2006 [31]. The dogbone specimens were tested under displacement control at a displacement rate of 0.1 mm/min. The tensile strength was determined 7.9 MPa ± 0.4 MPa (mean value ± standard deviation).
Push-out test was conducted to determine the bond strength between the resin concrete and normal concrete (the same material used for the experimental columns) at five days, as shown in Figure 4. Three specimens were tested. Each specimen consisted of two normal concrete prisms (150 mm × 150 mm × 300 mm) and one resin concrete prism (150 mm × 150 mm × 300 mm). The bond area was 150 mm × 150 mm. The specimens were tested under force control at a rate of 10 kN/min. The bond strength was determined 3.2 MPa ± 0.1 MPa (mean value ± standard deviation).

2.1.2. Steel Mesh

The steel mesh was woven through steel wire, and had steel wires along two perpendicular directions, as shown in Figure 5a, in accordance with the previous work [29]. The spacing in both directions was 20 mm. The diameter of the steel wires was 2 mm. Uniaxial tensile testing was conducted to evaluate the tensile properties of the steel wires. The yield strength and ultimate tensile strength were 748 MPa and 1114 MPa, respectively. Batson et al. [32] investigated the Young’s modulus of a lot of woven steel wires, and 165 GPa is advised for the Young’s modulus of the steel mesh that was used in the test.

2.1.3. Concrete and Steel Bars

Normal concrete was used to fabricate the columns in this study. The compressive strength was tested 62.8 MPa ± 2.9 MPa (mean value ± standard deviation). The Young’s modulus was tested 42.9 GPa ± 0.7 GPa (mean value ± standard deviation).
Two types of deformed steel bars were used, which were HRB335 and HPB235 [33]. HRB335 steel bar had a yield strength of 320 MPa and a Young’s modulus of 200 GPa, and it was used as the longitudinal reinforcement. HPB235 steel bar had a yield strength of 240 MPa and a Young’s modulus of 199 GPa, and it was used as the stirrup.

2.2. Column Specimens

Table 1 shows the four reinforced concrete columns, designated S-0, S-1, S-2, and S-3. The number of steel mesh layer of S-0 to S-3 was 0, 1, 2, and 3, respectively. The non-strengthened specimen S-0 was taken as the control specimen. According to the works done by Yan [29], a reinforcement ratio of 1.99% and a cover thickness more than 0.5 cm for steel mesh were suggested. In this test, the thickness of reinforcement layer was kept to 20 mm for these strengthened specimens to study the effect of the layer number of steel mesh, and the cover thickness more than 0.5 cm can be guaranteed, even with three layers of steel mesh in the reinforcement layer.
Figure 6 illustrates the dimension and layout of reinforcement of the columns. For each column, the total height was 1500 mm and the clear test height was 1000 mm. The cross section was 180 mm × 250 mm within the 1000 mm test height, and 180 mm × 400 mm within the 150-mm length of the corbel at each end of the column. The corbel was used to apply eccentric load. Each column was reinforced using four 16 mm steel bar along the longitudinal direction of the column. The reinforcement ratio was 1.8%, which is larger than the minimum reinforcement ratio 0.6% [33]. The spacing of the stirrups was 200 mm within the test height; the spacing was reduced to 50 mm beyond the test height at each end of the column to prevent local failure in the corbel.
For each column, 12 strain gauges were installed on the surface of steel bars and 14 strain gauges were attached on the surface of concrete, as shown in Figure 6. Both at the tensile side and the compressive side, three strain gauges were attached on the surface of concrete, respectively. At the two lateral sides, four strain gauges were attached on the surface of concrete, respectively. Besides, one strain gauge was attached on the surface of the four steel bars, respectively, at three different positions along the column.
Liu et al. [34] suggested that the column could be strengthened in horizontal position firstly, and then applied the load in vertical direction. The impact of this process could be neglected.
The SMRC was applied to strengthen the reinforced concrete columns in four steps: Step 1: Clean and wet the surface of the columns (Figure 7a). Step 2: Install the formwork and prepare the SMRC (Figure 7b). Step 3: Install the steel mesh in the formwork (Figure 7c). Step 4: Cast the resin concrete in the formwork, and then remove the formwork after five days (Figure 7d).

2.3. Test Setup and Instrumentation

Each column was tested under eccentric compressive load while using a 3200 kN hydraulic load with an eccentricity of 150 mm. Figure 8a shows the customized loading device. The test column was elevated by the woods at the two ends, making the column contactless with the ground. In order to reduce the friction between the woods and the column, two polytetrafluoroethylene (PTFE) plates were laid down on at the two ends. Figure 8b shows the two ends of the device. The column was loaded under displacement control at a displacement rate of 1 mm/min. For each column, the testing was terminated when the applied load dropped to 85% of the measured peak load [35].
Three dial meters with a measurement range of ±50 mm and a precision of 0.01 mm were used to measure the lateral deformation of column throughout the testing, as shown in Figure 8a. The data of the dial meters could be read automatically through a data acquisition system. A crackscope (precision: 0.2 mm) was used to examine the cracks on the columns after the column failed and was unloaded.
The electrical resistance value and sensitivity coefficient of the strain gauges were 120 ± 0.3 and 2.08 ± 0.01, respectively.

3. Experimental Results and Discussions

3.1. Failure Mode and Analysis

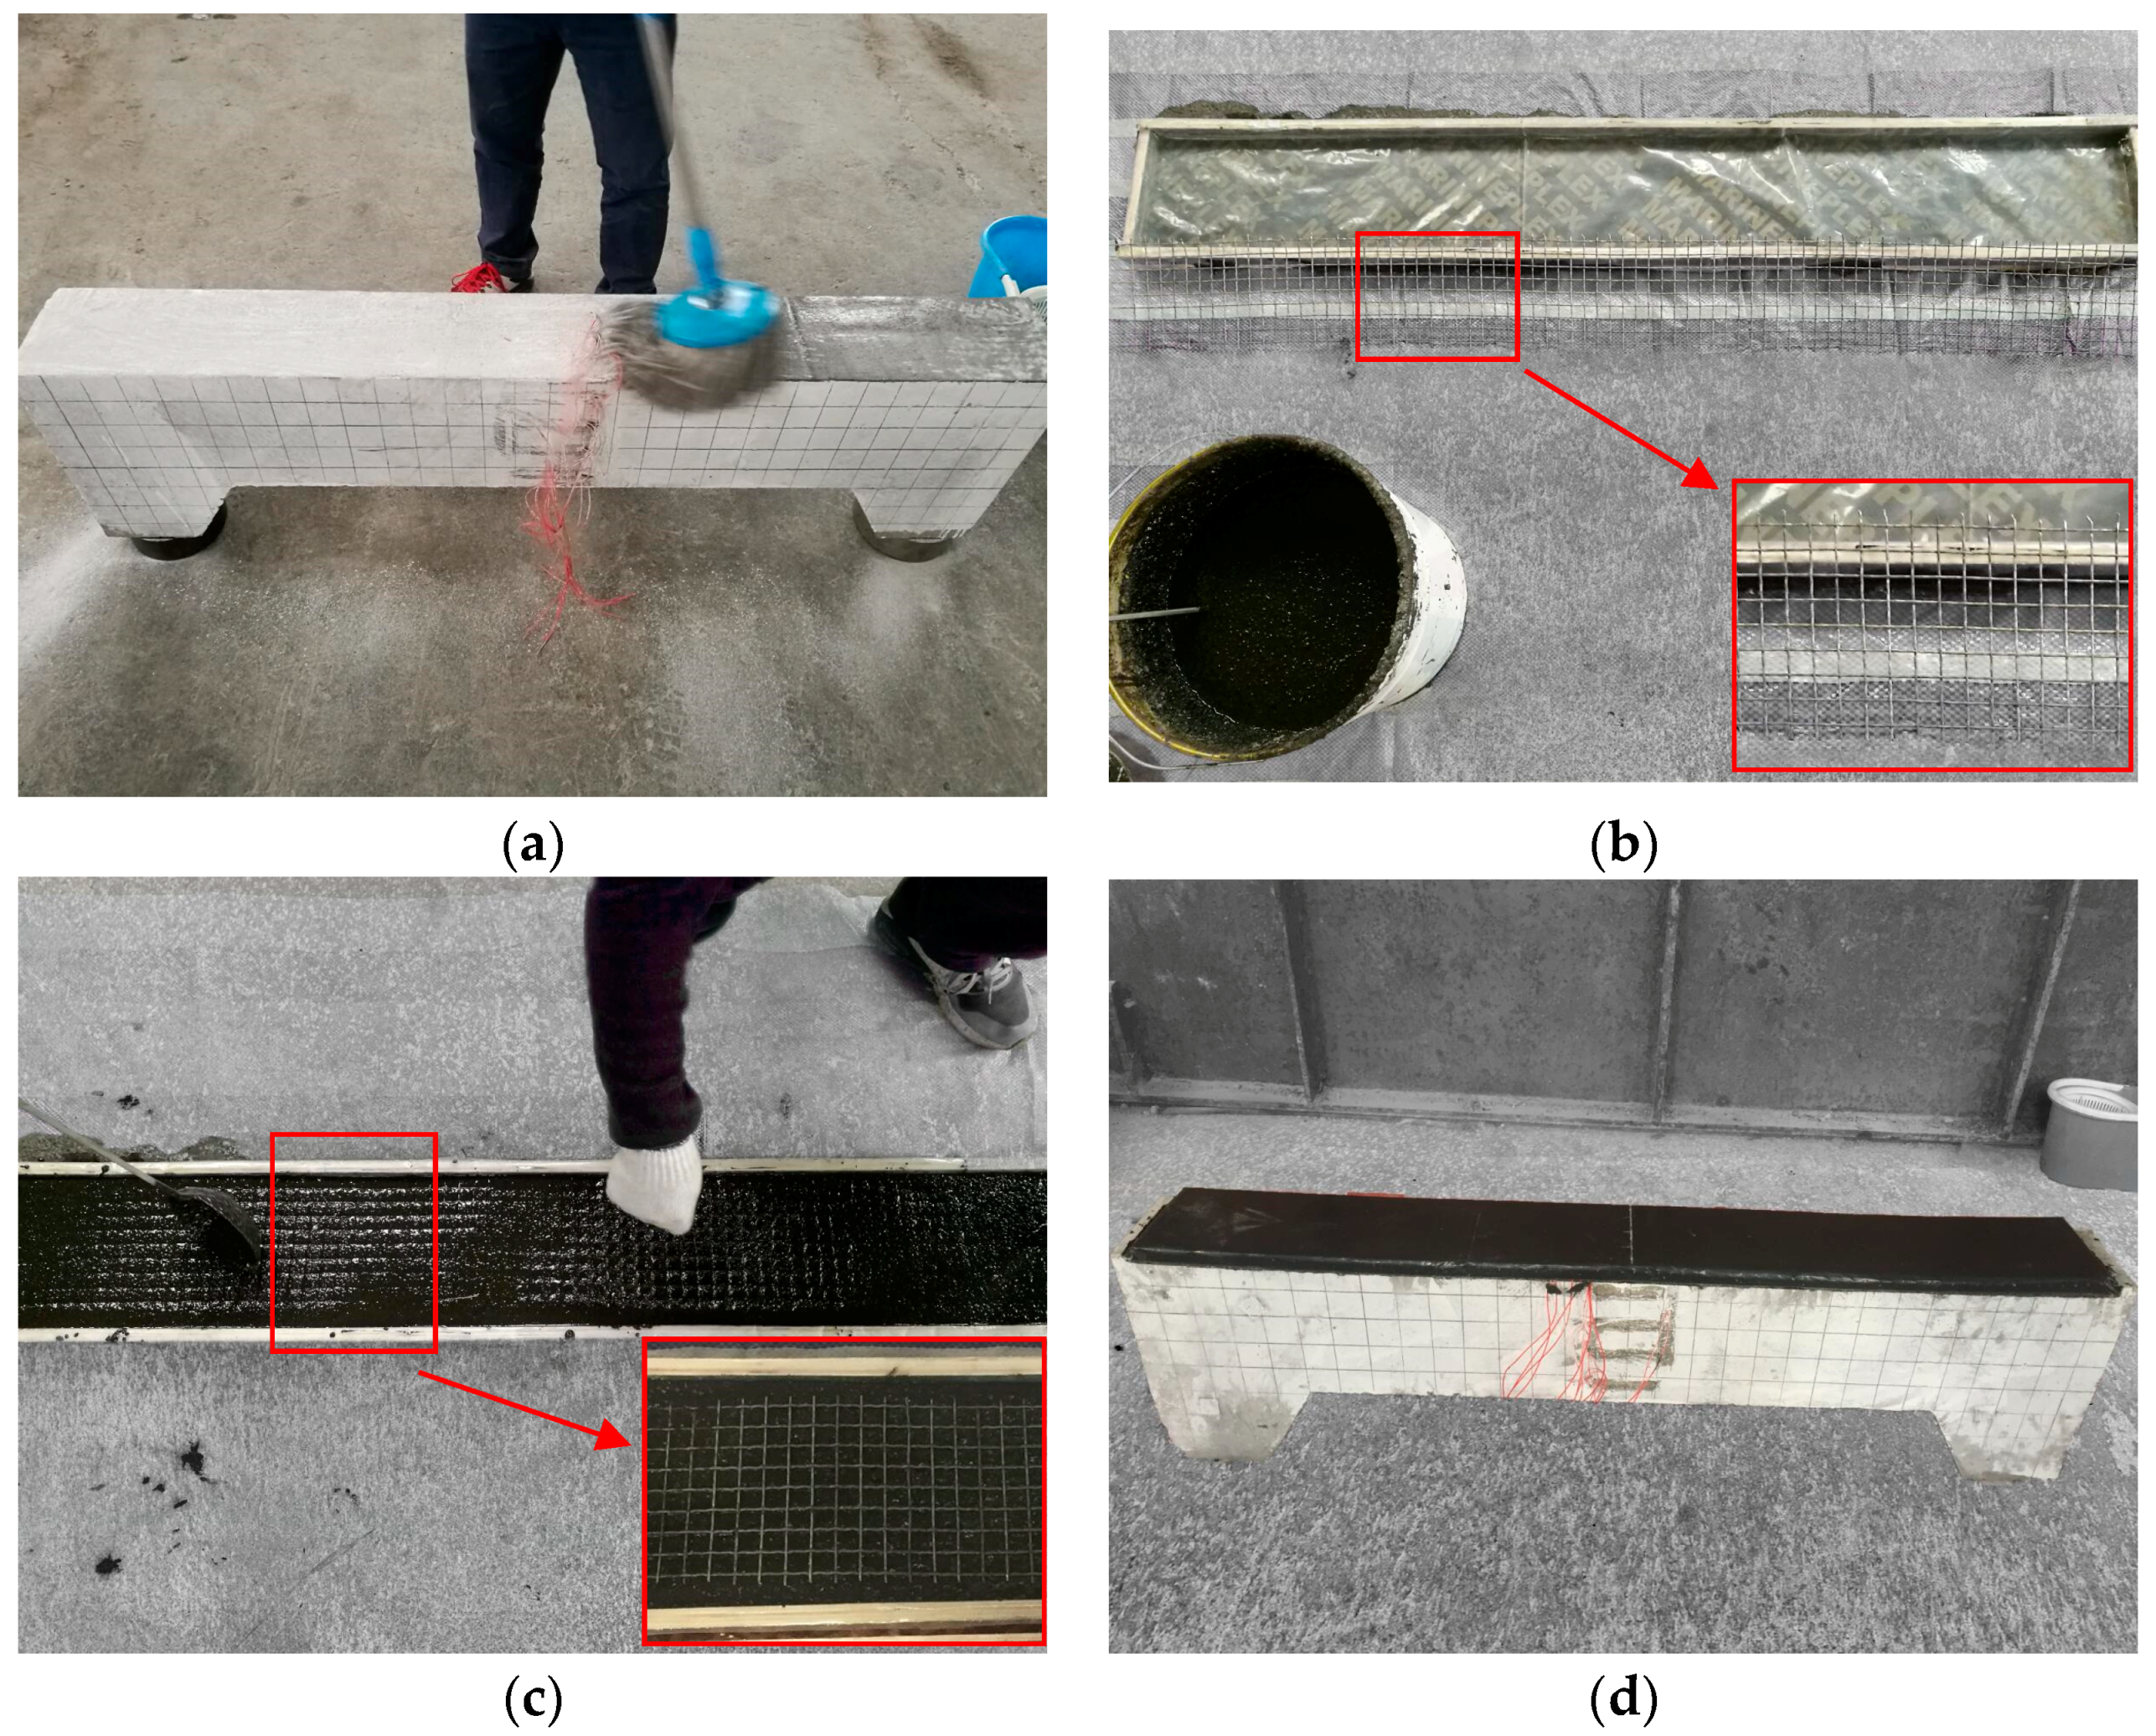
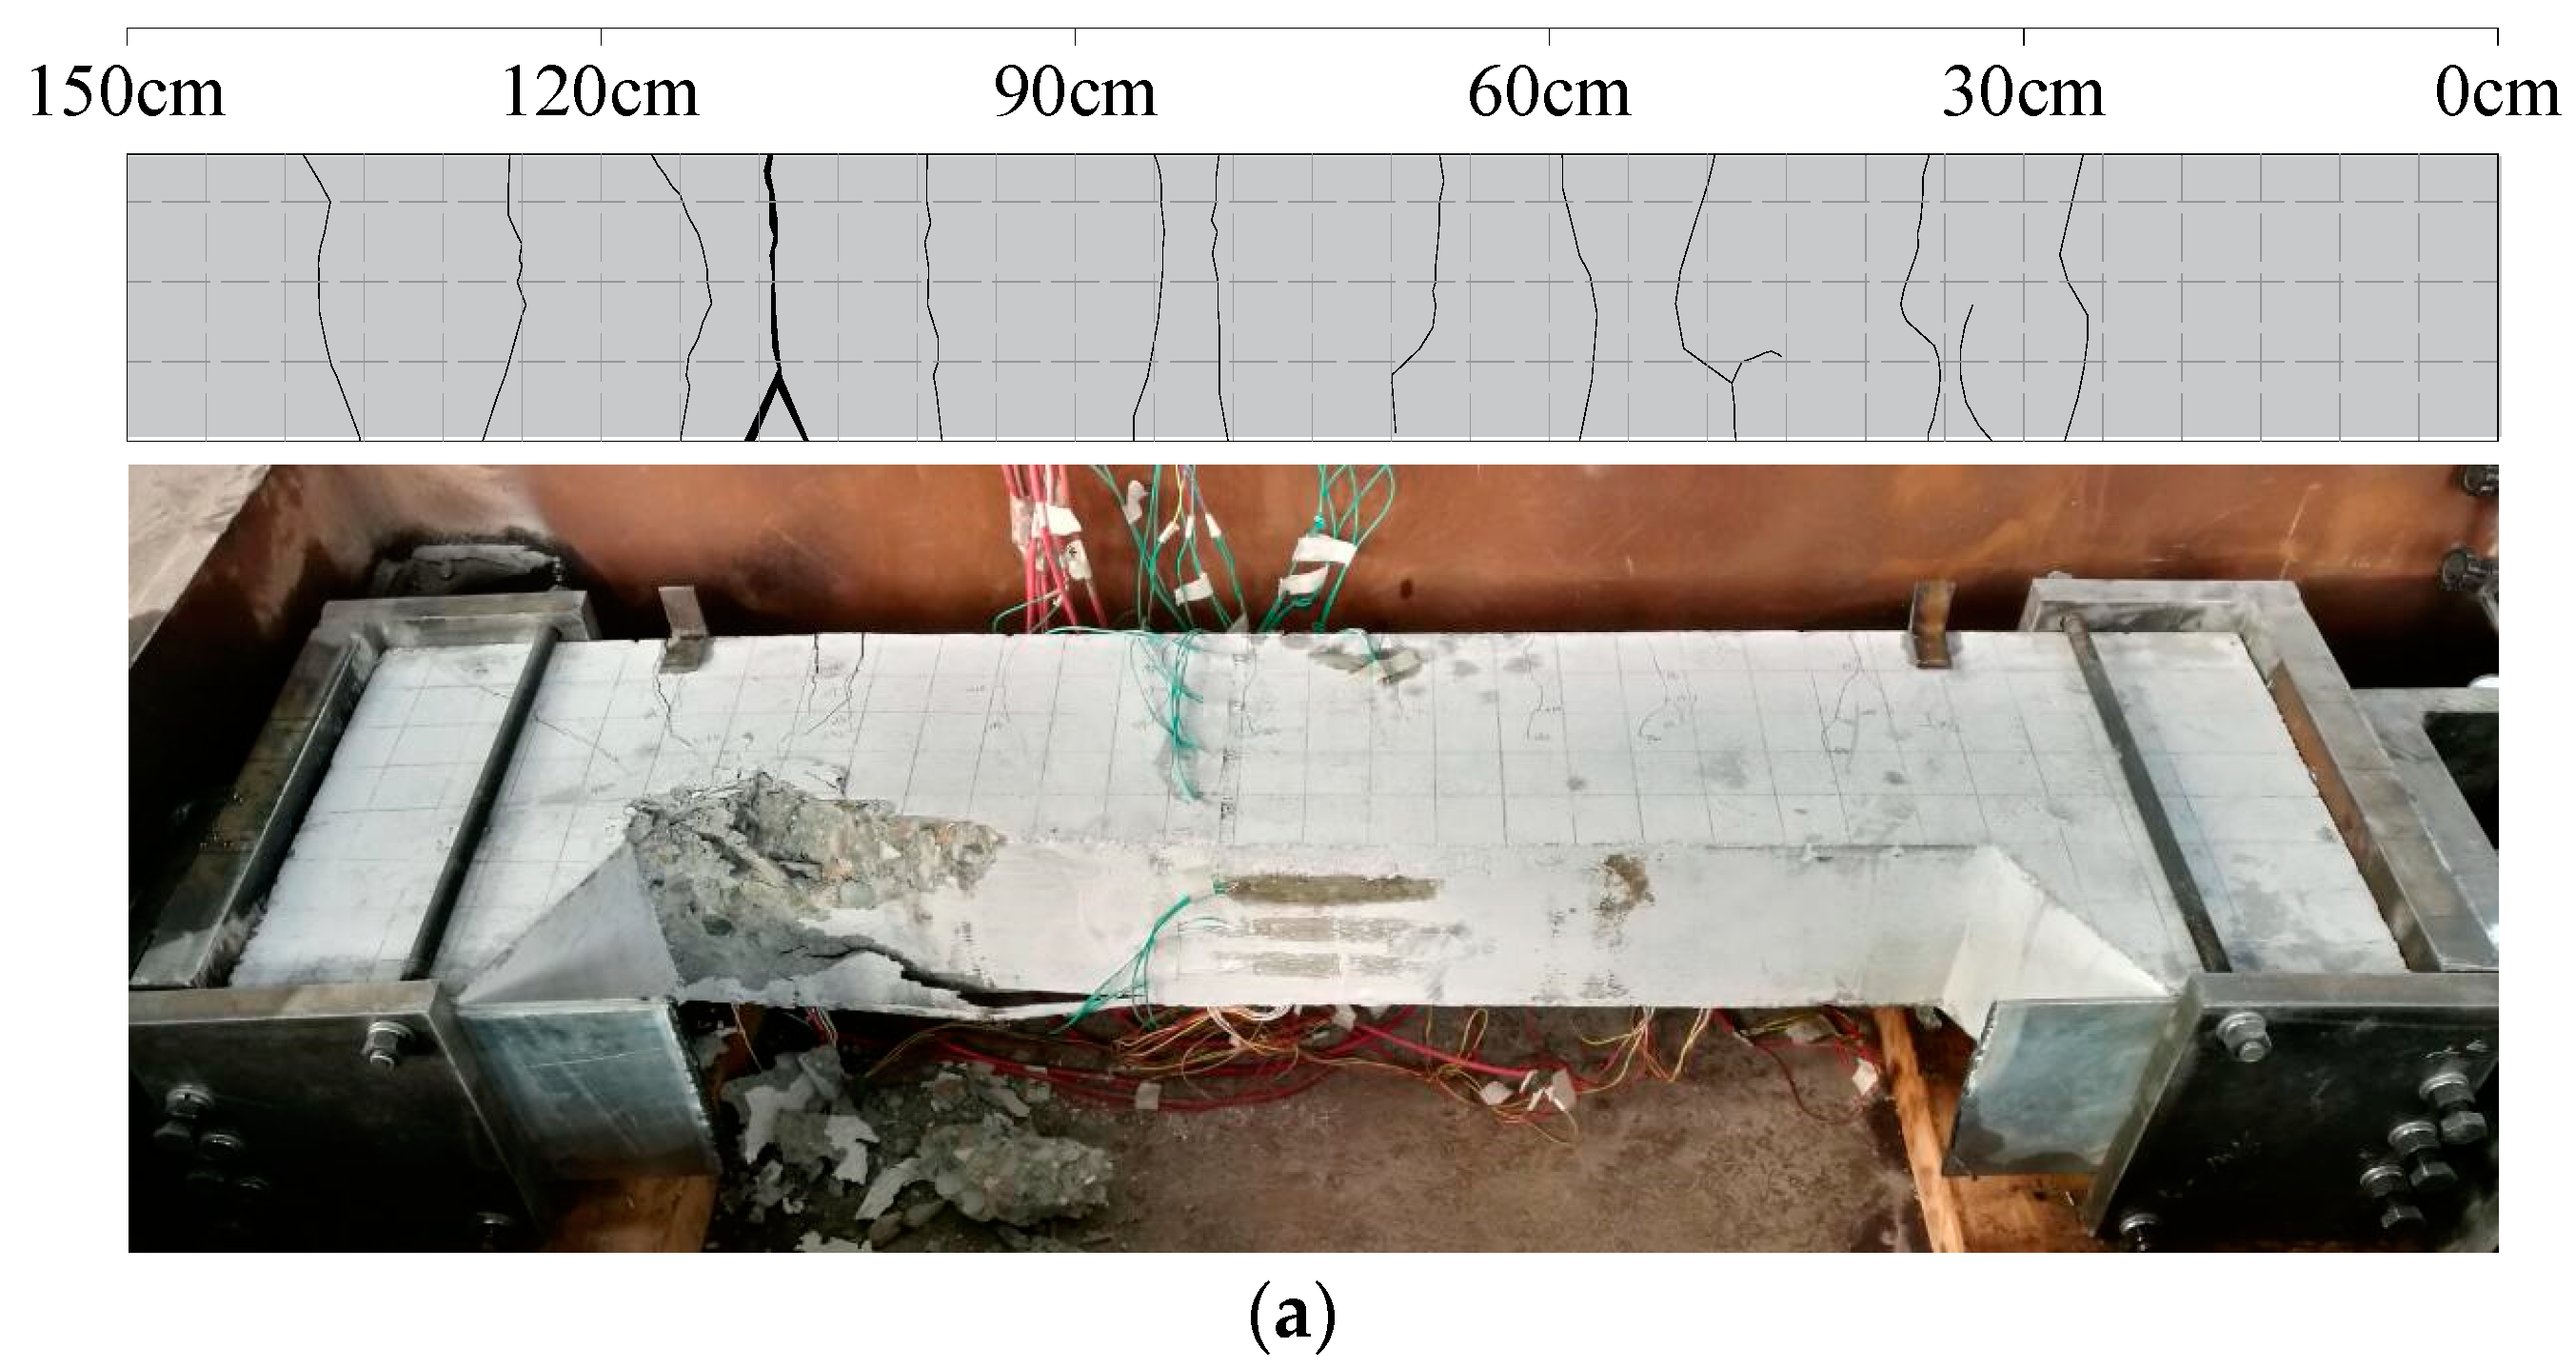
Figure 9a–d show the failure modes of the four columns. No debonding was observed at the interface between the concrete and SMRC. For each column, the crack pattern of the SMRC surface is plotted. Multiple distributed cracks were observed in the four columns. When the column failed, crushed concrete was observed in the compression zone.
In S-0, the first crack appeared when the load was increased to 73 kN. The distance between the crack and the actuator was 110 cm, as shown in Figure 9a. With the increase of the load, the crack was widened and propagated; more cracks appeared in the column at the tensile side. After the column failed, 13 major cracks were observed. The average spacing of the major cracks was 115 mm. The maximum crack width was 4.2 mm.
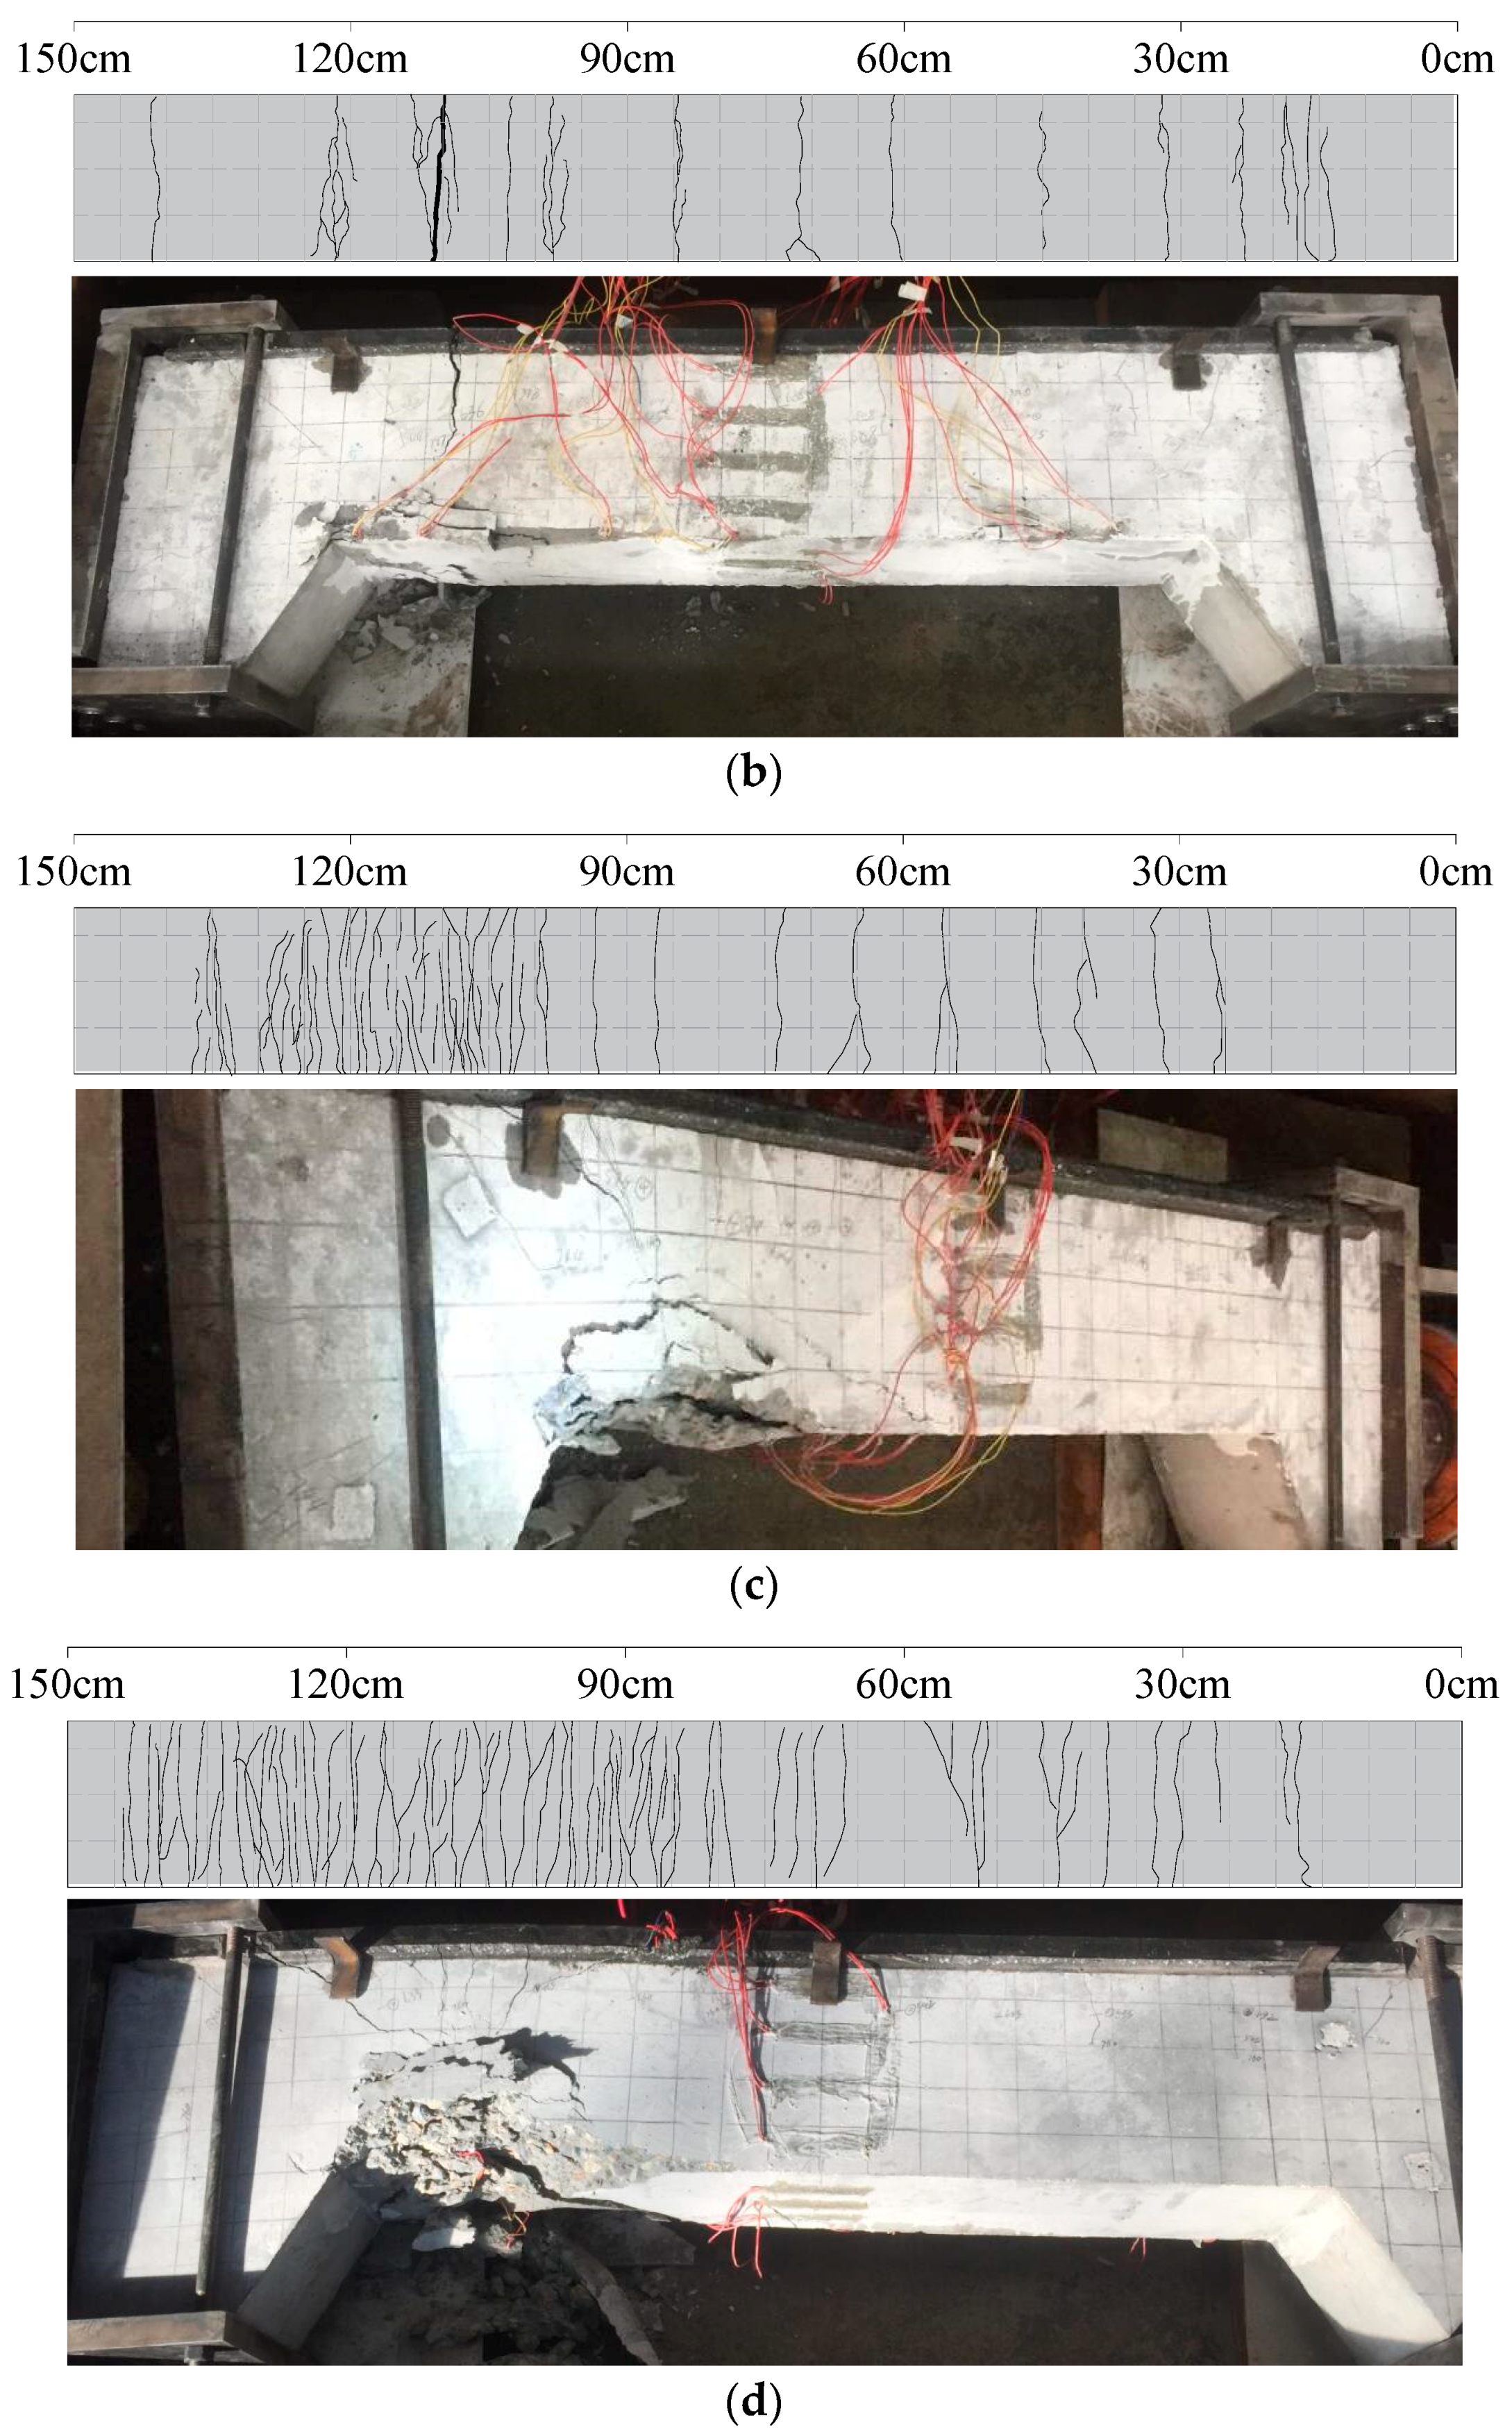
In S-1, the first crack in the SMRC appeared, when the load was increased to 143 kN. The distance between the crack and the actuator was 110 cm, as shown in Figure 9b. The second crack in the SMRC appeared near the mid-span, when the load was increased to 162 kN, and the strain gauges that were attached on the SMRC failed because of the cracks. No crack was observed in the normal concrete until the load was increased to 220 kN. The crack was at the cross section that was about 45 cm away from the actuator. At the same time, five cracks were observed in the SMRC. The five cracks were, respectively, 110 cm, 72 cm, 45 cm, 33 cm, and 85 cm away from the actuator. After the column failed, 12 major cracks were observed in the SMRC; the average spacing between the major cracks was 125 mm; the maximum crack width was 7.1 mm. A limited number of microcracks were observed in the vicinity of the major cracks. The steel mesh in the SMRC was ruptured.
In S-2, the first crack in the SMRC appeared, when the load was increased to 155 kN. The distance between the crack and the actuator was 105 cm, as shown in Figure 9c. The first crack in the normal concrete was observed when the load was increased to 250 kN. The crack was at the cross section that was about 27 cm away from the actuator. At the same time, six cracks were observed in the SMRC. The six cracks were respectively 105 cm, 120 cm, 98 cm, 86 cm, 65 cm, and 27 cm away from the actuator. As the load was further increased, a number of densely distributed microcracks appeared. After the column failed, the maximum crack width was 2.4 mm. A limited number of wires of the steel meshes were ruptured.
In S-3, the first crack in the SMRC appeared, when the load was increased to 158 kN. The distance between the crack and the actuator was 115 cm, as shown in Figure 9d. The first crack in the normal concrete was observed when the load was increased to 285 kN. The crack was at the cross section that was about 48 cm away from the actuator. At the same time, five cracks were observed in the SMRC. The five cracks were, respectively, 115 cm, 66 cm, 95 cm, 51 cm, and 105 cm away from the actuator. Similar to S-2, as the load was further increased, a number of densely distributed microcracks appeared. After the column failed, the maximum crack width was 1.8 mm. No wire of the steel meshes was ruptured.
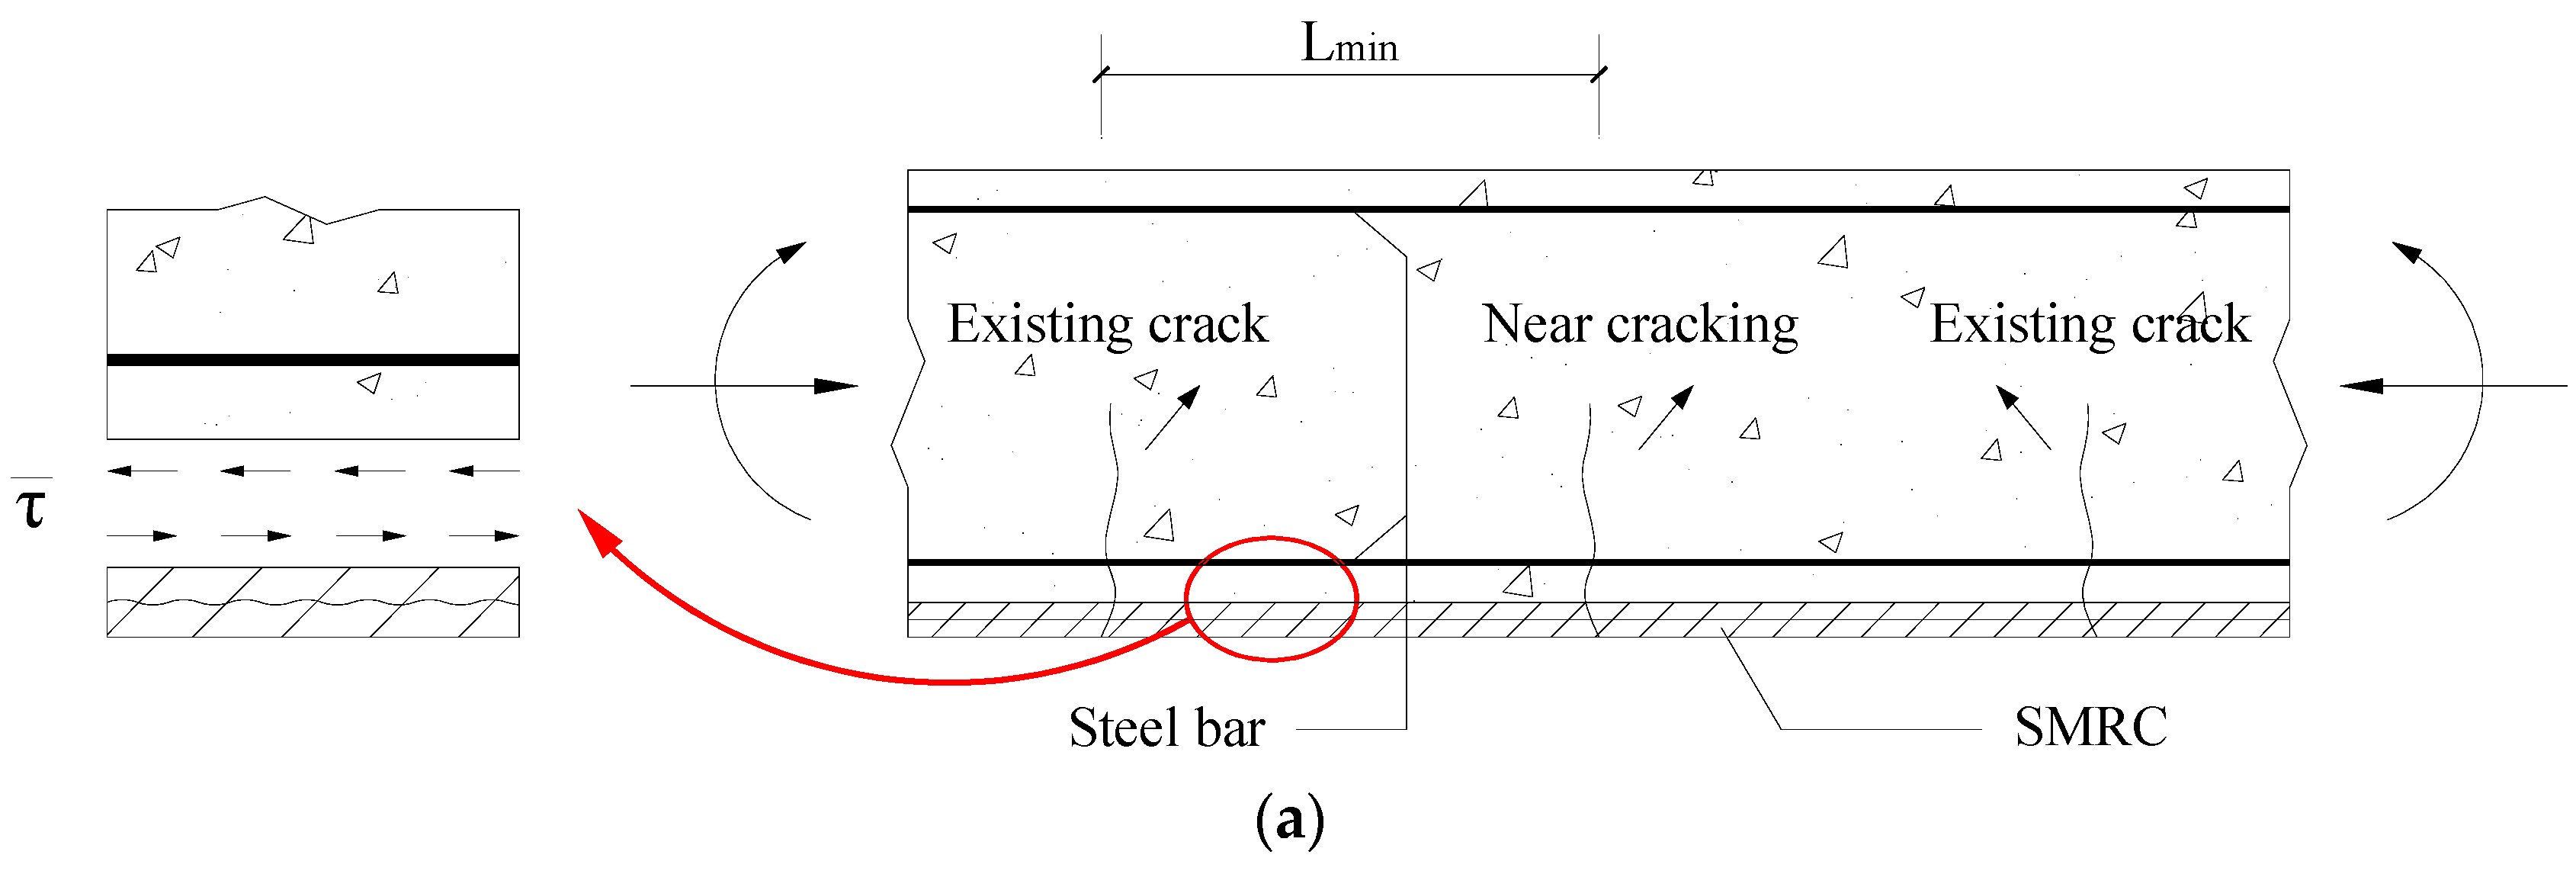
Further analysis is conducted to understand the crack patterns. 
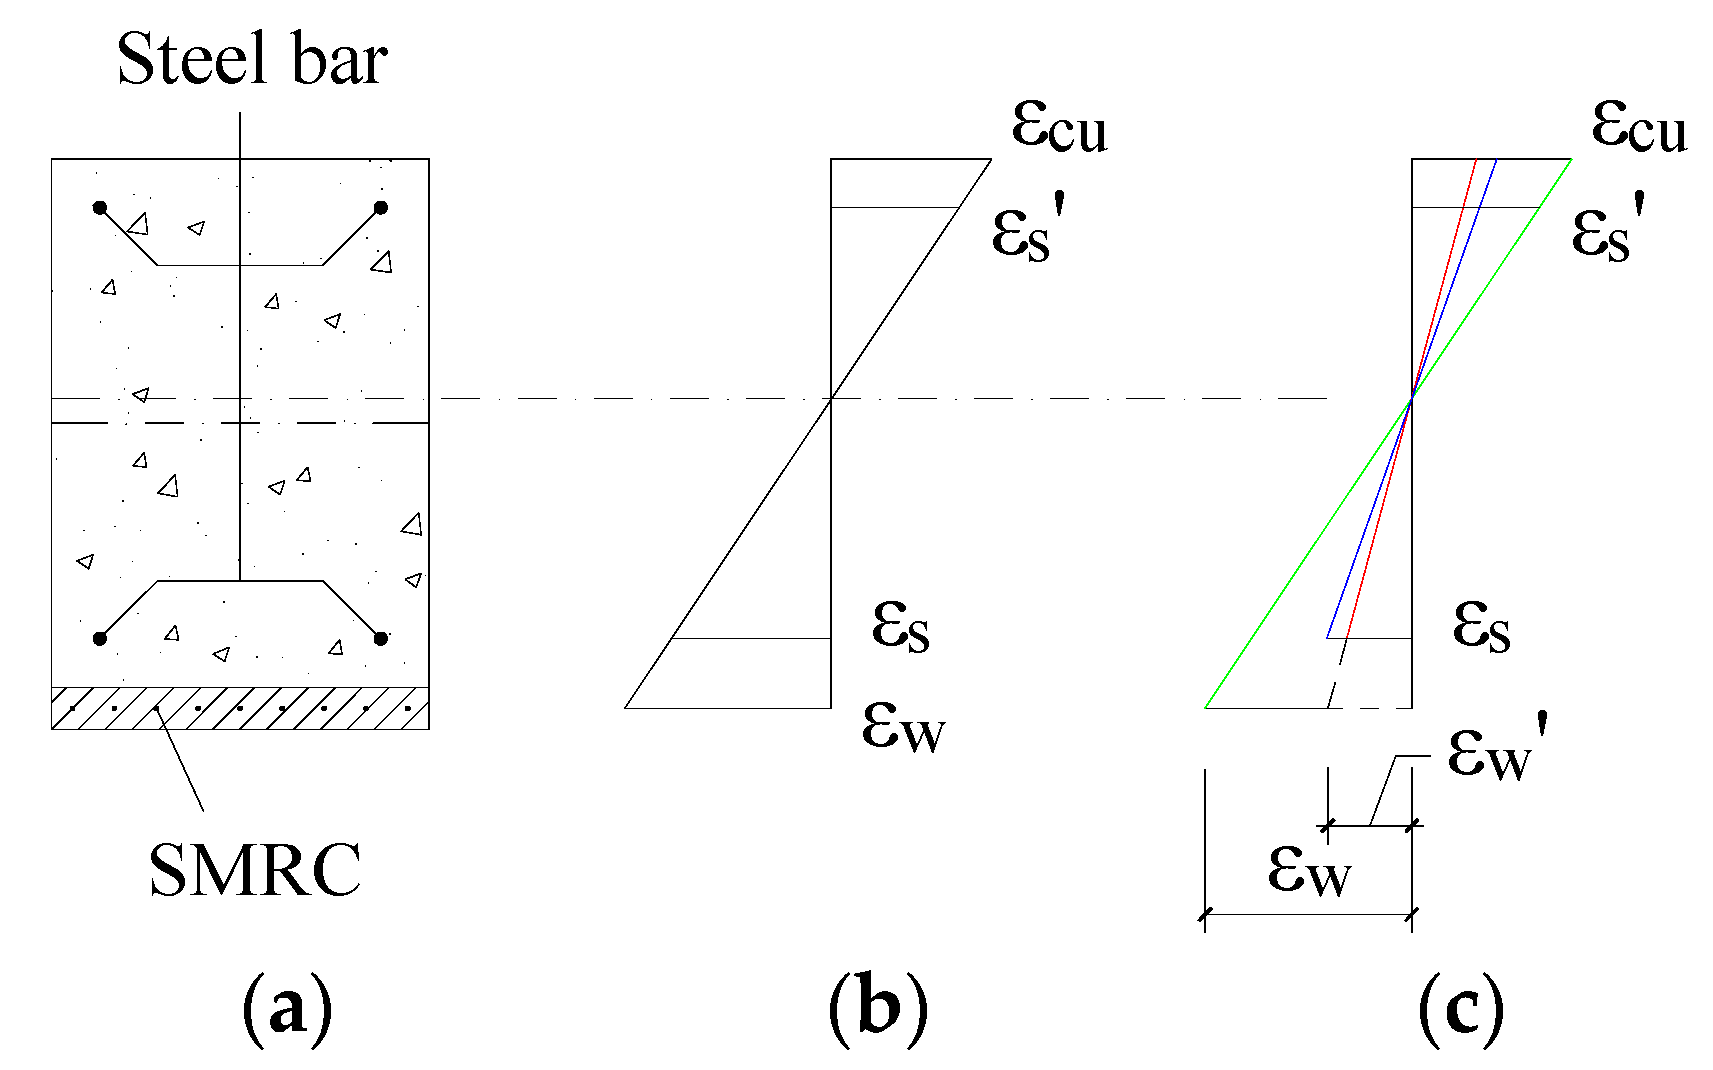
Figure 10a illustrates a segment of a column for analyzing stresses in the steel bar, steel mesh and concrete. The stress in the steel bar is denoted by σs, which reaches the maximum value at the crack section. Between two adjacent cracks, σs decreases because a part of tensile force is resisted by the concrete due to force transfer between steel bar and concrete. The stress reduction is denoted by Δσs. Similarly, the stress in steel wire is denoted by σw; and, the stress reduction is denoted by Δσw. The shear stress between steel bar and concrete is denoted by τs; the shear stress between steel bar and concrete is denoted by τw. Both τs and τw are zero at the crack section and the center between two adjacent cracks.
Equations (1) and (2) can be obtained according to the force equilibrium of the segmental model [36].
Δ σ w A w L min τ ¯ = A r f r / 2
Δ σ s A s + L min τ ¯ = A t f t / 2
where A s and A w are the total areas of cross section of steel bar and steel wire, respectively; A t and A r are the areas of concrete and resin concrete in effective tensile zone, respectively; f t and f r are the tensile strengths of concrete and resin concrete, respectively; L min is the minimum spacing of cracks; and, τ ¯ is the average bond stress between SMRC and concrete.
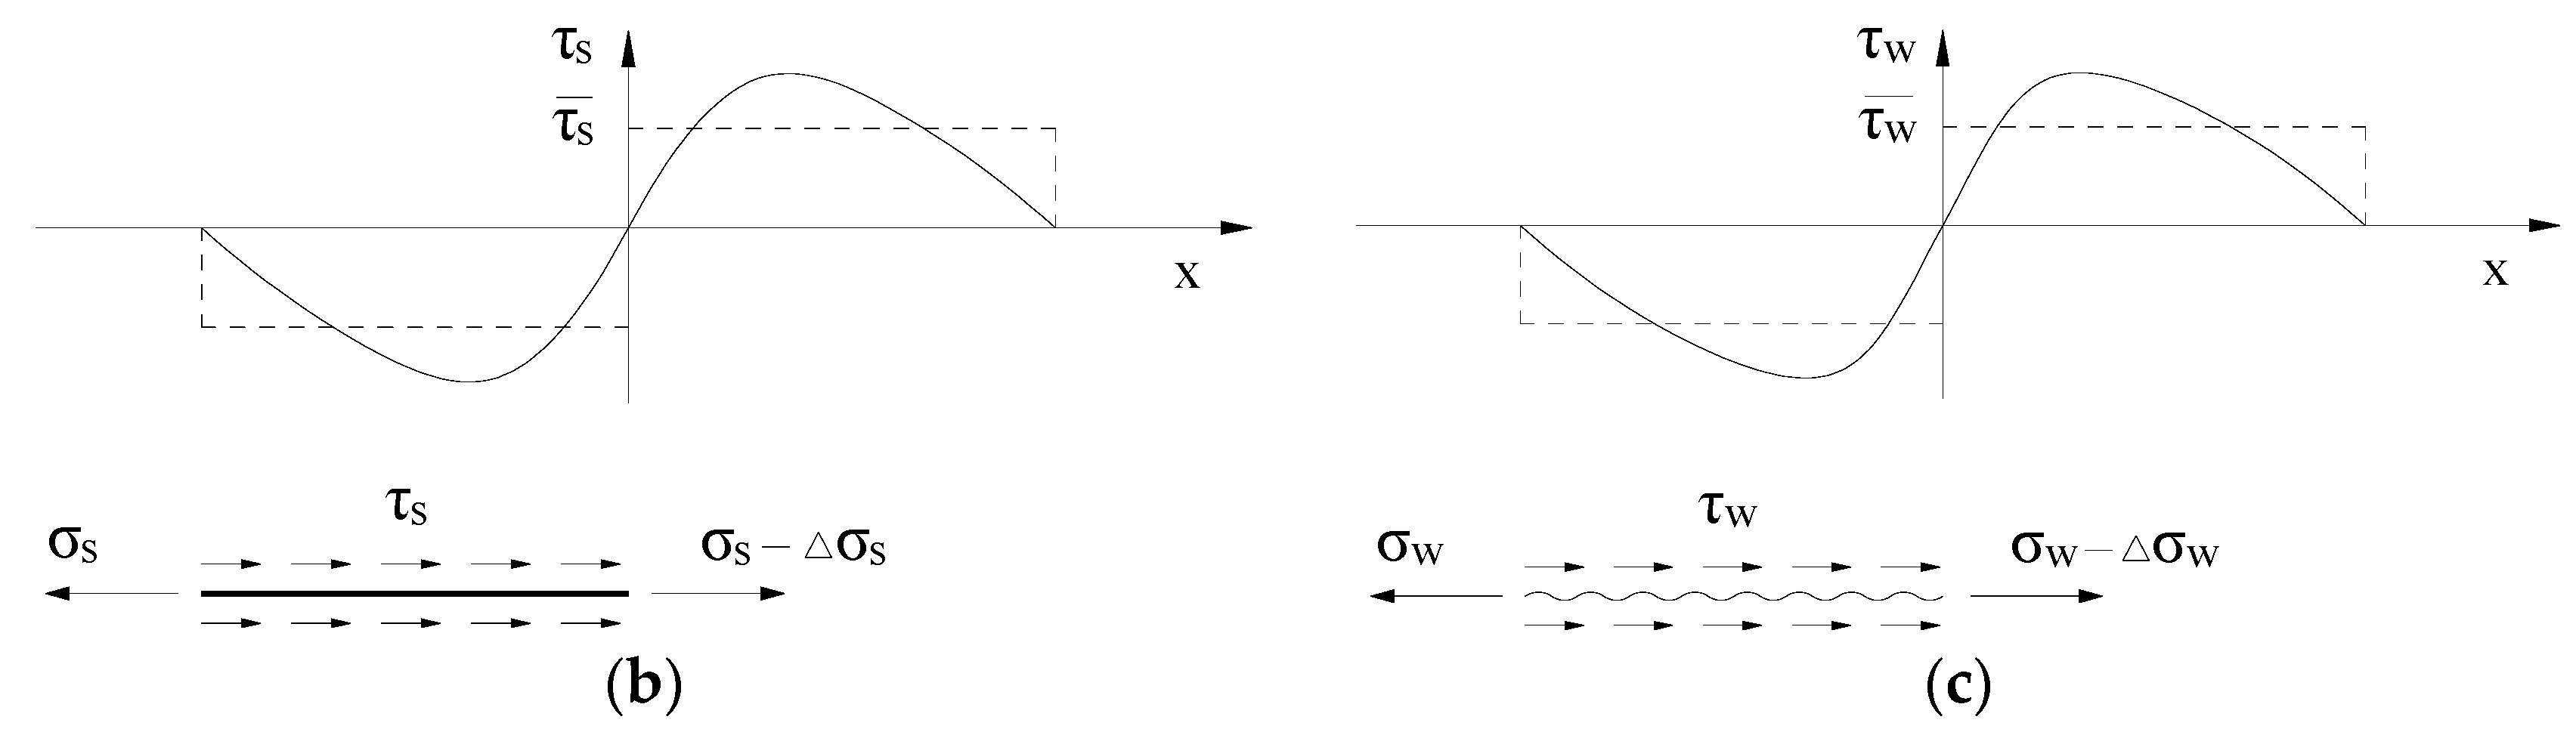
As shown in Figure 10b,c, the Equations (3) and (4) can be obtained according to the force equilibrium of the isolated bodies of steel bar and steel wire, respectively.
Δ σ s A s = Ω s τ s ¯ L min
Δ σ w A w = Ω w τ w ¯ L min
where Ω s and Ω w are the total perimeters of steel bar and steel wire, respectively; τ s ¯ and τ w ¯ are the mean values of bonding stress between steel bar and concrete, and between steel wire and resin concrete, respectively.
Based on Equations (1) to (4), the average spacing of the cracks ( L c ) can be expressed in Equation (5).
L c = 1.5 L min = 0 . 75 ( A t f t + A r f r ) / ( τ s ¯ Ω s + τ w ¯ Ω w )
Equation (5) shows that the average spacing of cracks decreases with the total perimeter of steel wires. The average crack width can be solved using the different strains in the steel wire and the resin concrete between two adjacent cracks. Yuan et al. [36] investigated the relationship between the crack width and the spacing between adjacent cracks that are based on the flexural structures reinforcement test. The crack width decreases with the decreasing of spacing between adjacent cracks.

3.2. Lateral Deformation and Strain Distribution in Cross Sections

Figure 11 shows the lateral deformation curves and the fitting curves of the four columns. A sine function (Equation (6)) is used to fit the measured lateral deformations. The maximum discrepancy between the measured deformation and fitting result is 14%, indicating that the fitting curves provide an adequate prediction of the lateral deformation of the columns.
u = u m sin ( π Z / Z m )
where u is the lateral deformation; u m is the maximum value of u ; Z is the length from the measured point to the loading point; Z m is the total length of the column (=1500 mm).
The longitudinal strain at the mid-span position of column can be used to validate whether the plane section assumption is satisfied or not. Figure 12 shows the longitudinal strain measured through the strain gauges on the RC column and the strain gauges on the SMRC under different load grades. As can be seen from Figure 12, plane section assumption is satisfied during the deformation of specimen under different load grades.

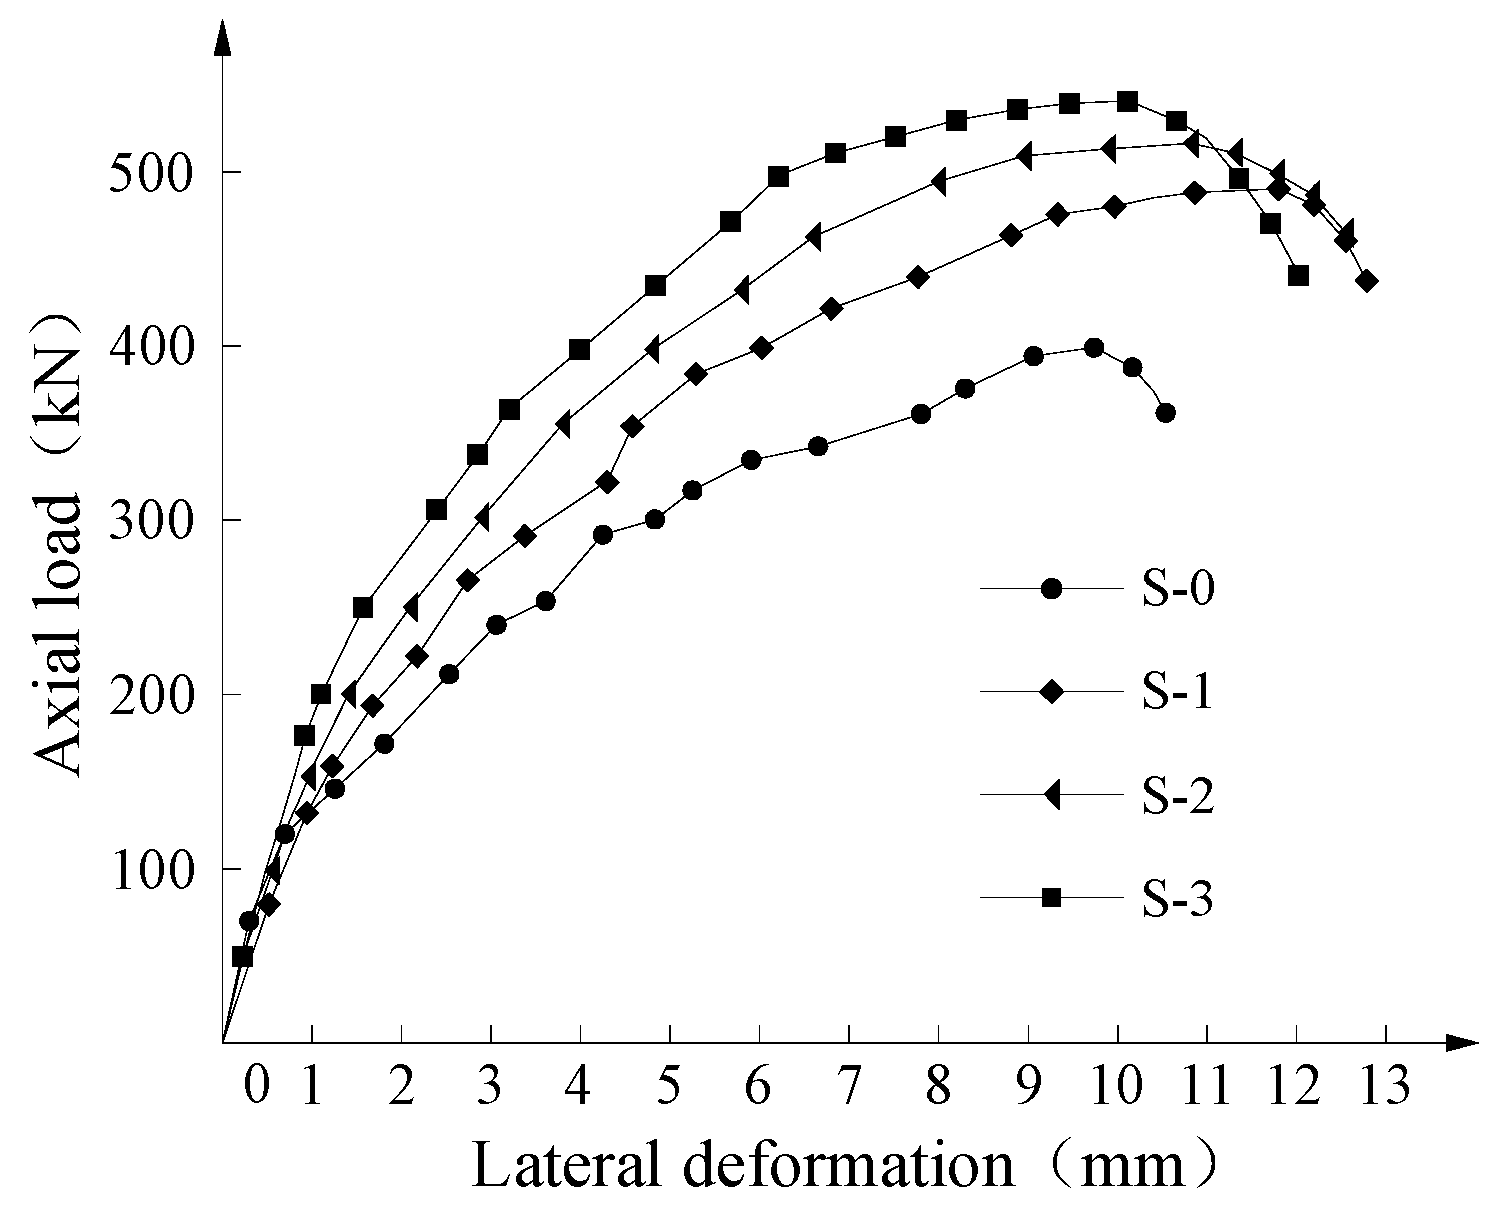
3.3. Load-Deflection Curves

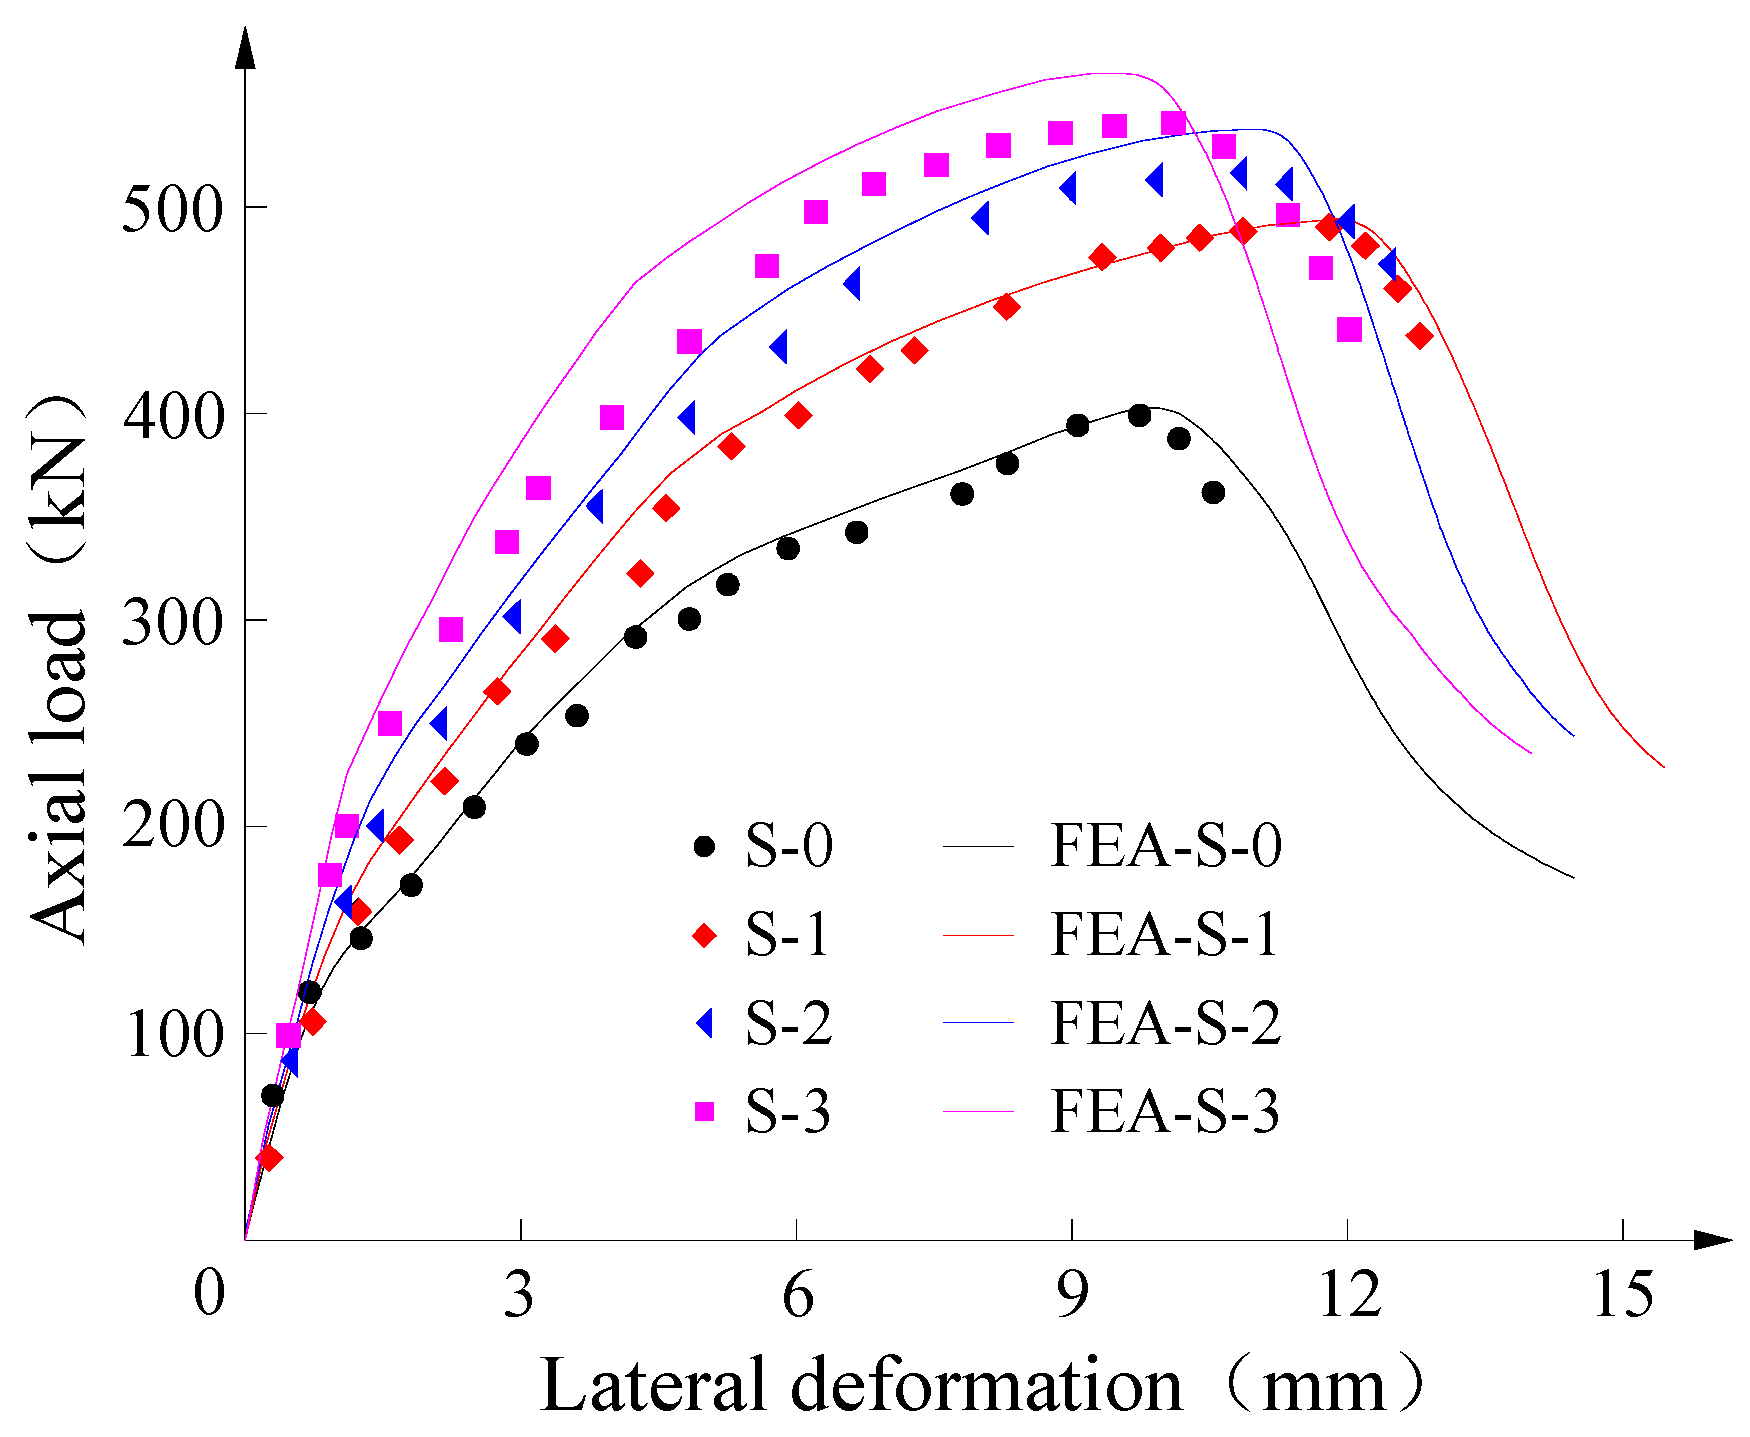
Figure 13 shows the relationship between the load and the mid-span deflection. When compared with S-0 that was not strengthened, the other three columns (S-1 to S-3) that were strengthened while using SMRC had higher load capacities and peak deflections. In each curve, the peak load represents the load capacity, and the mid-span deflection of the load capacity represents the peak deflection. As the number of steel mesh increases from one to three, the load capacity is increased from 492 kN to 539 kN, while the peak deflection is reduced from 11.8 mm to 10.1 mm. The main reason why the peak deflection decreases with the increasing of layer number of steel mesh is that the whole stiffness of the specimen increases with more steel meshes.
There are three phases for the load-deflection curve [37]. The first phase is the linear elastic phase. In this phase, the load that is applied on the column is small and there are no cracks on the SMRC or RC column. The second phase is the crack propagation phase. With the increase of the load, the resin concrete begins to crack. The cracks occur in different position of resin concrete, and the spacing between these cracks is large. Besides, some cracks on the RC column can be observed. The third phase is steel bar yielding phase. When the load applied on the column approaches the load capacity, the steel bars yield. Many cracks occur on the resin concrete in a short period with small spacing. Obvious flexural deformation for column can be observed. Also, the stress of steel mesh increases rapidly because of the yielding of steel bar.
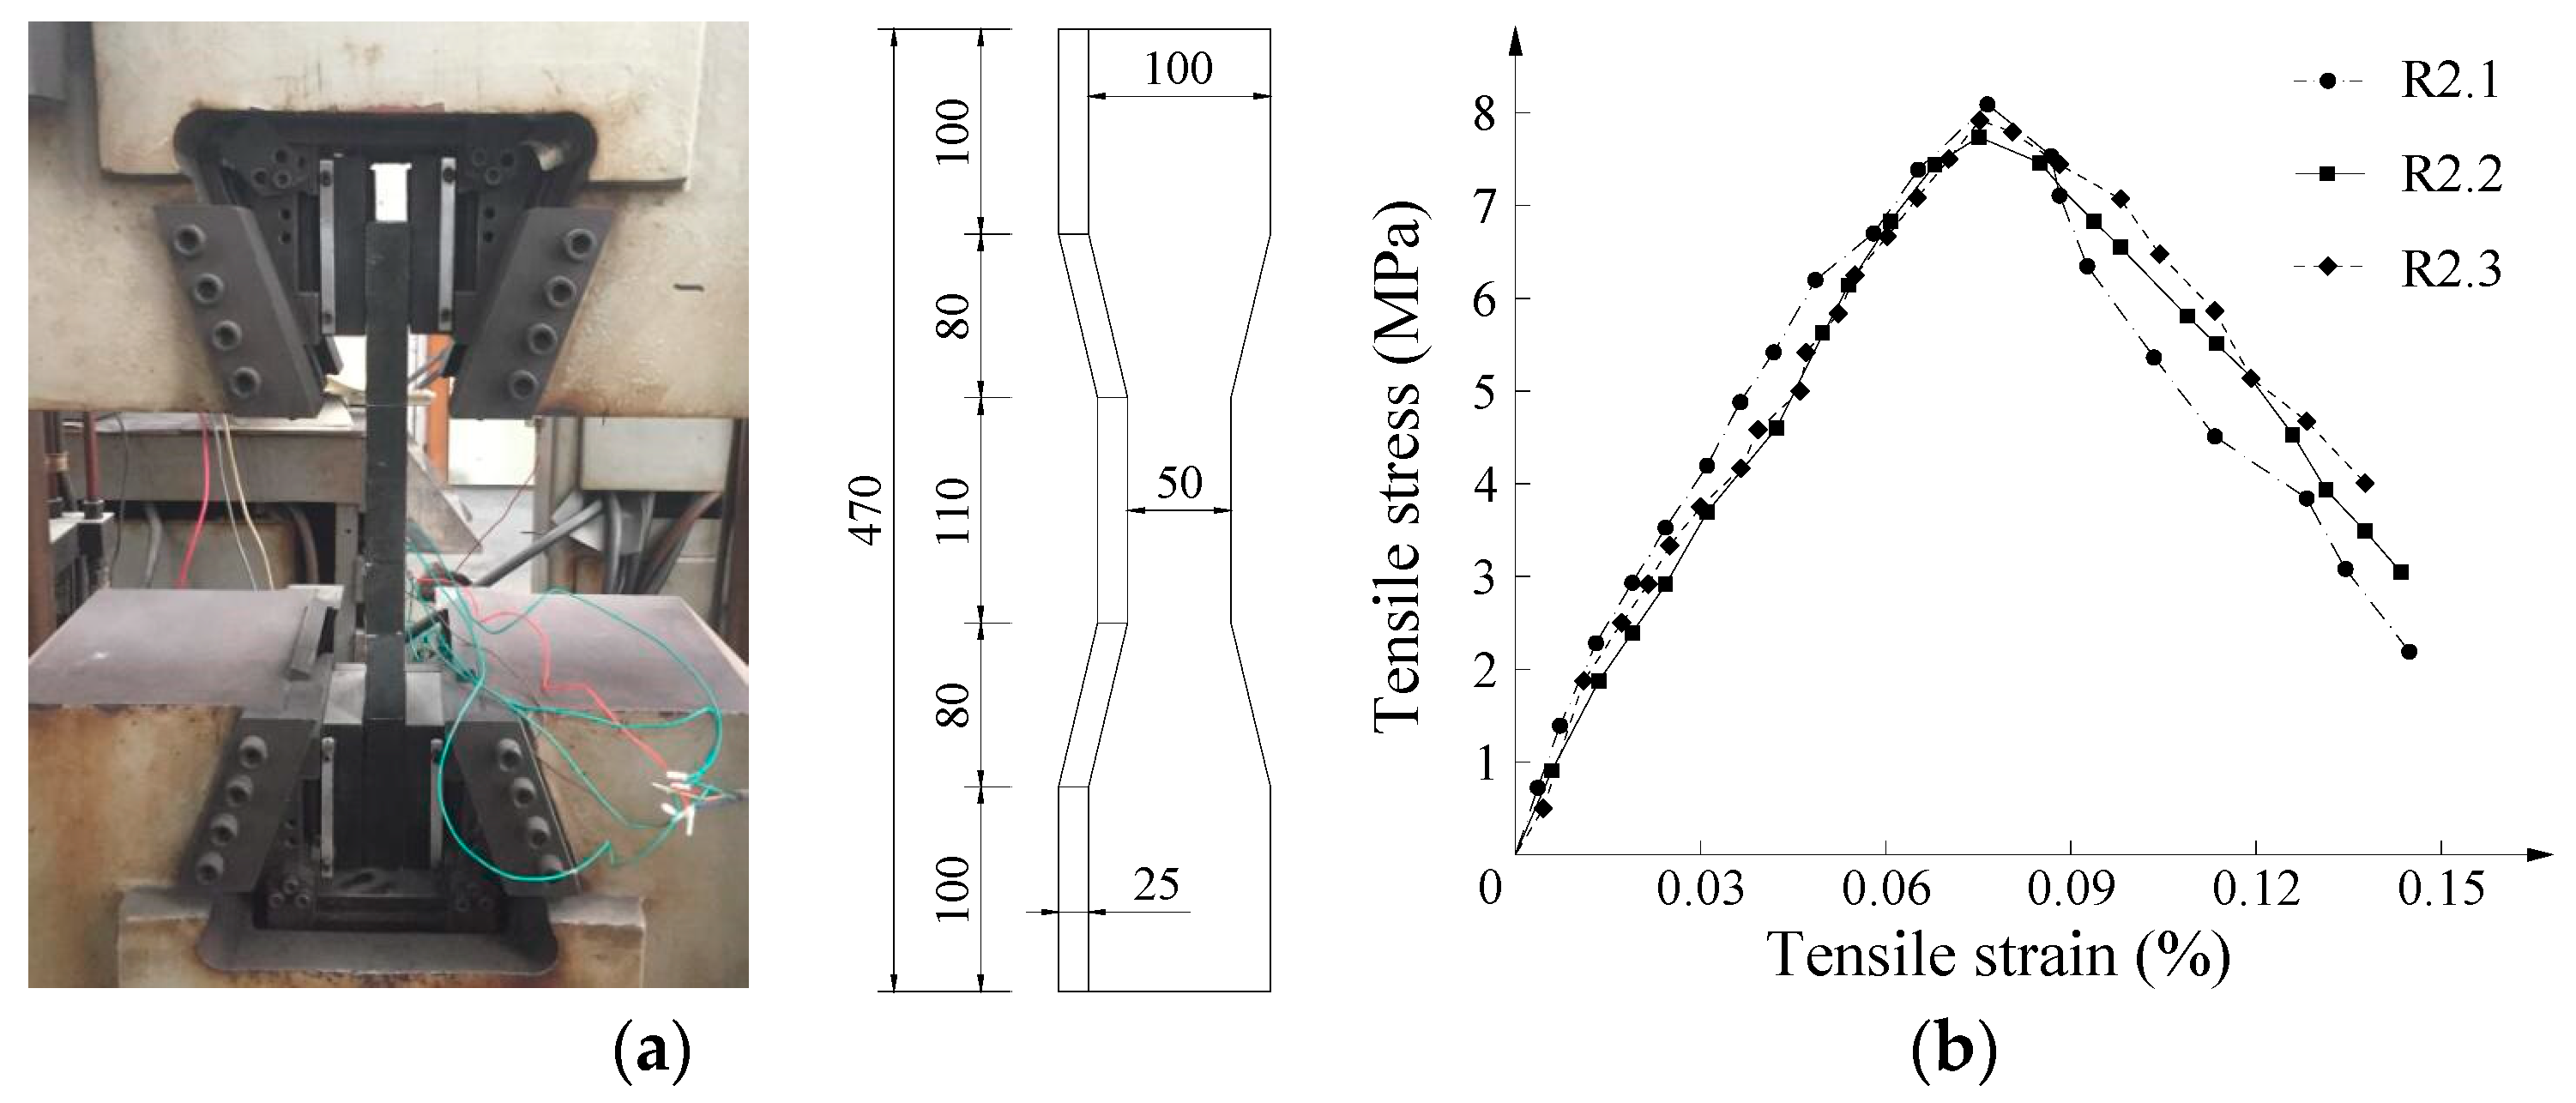
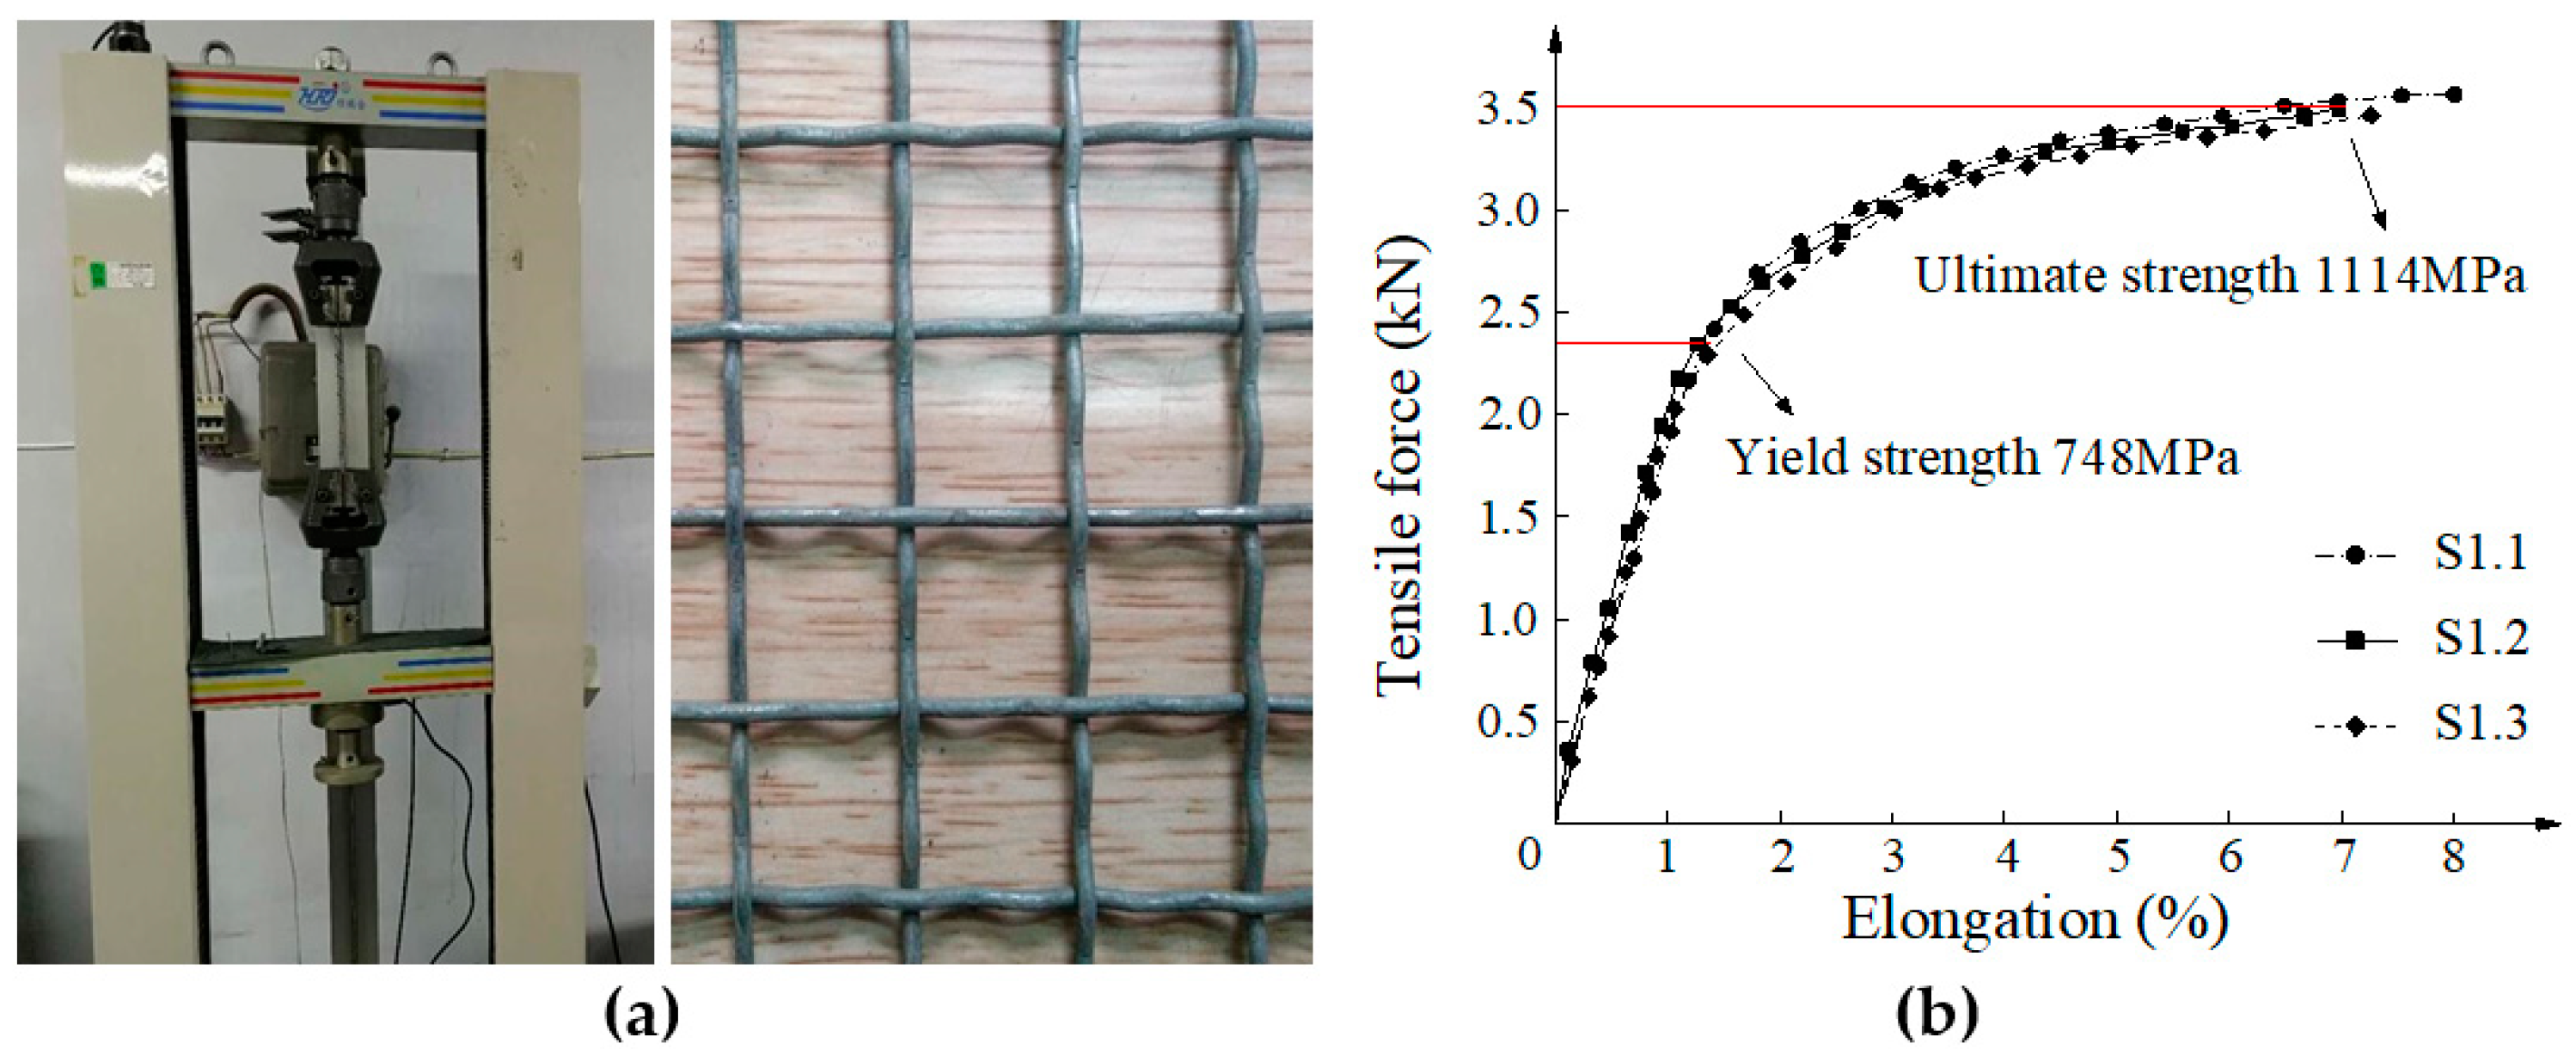
Table 2 summarizes the compressive test results of the four columns. When compared with S-0, the use of one steel mesh in the SMRC increases the cracking load by 96%, the load capacity by 23%, and the peak deflection by 22%. The result indicates that the use of SMRC can delay the presence of crack, enhance the load capacity, and improve the deformability. Increasing the steel mesh layer number from one to three increases the cracking load by 10% and the load capacity by 10%, and it decreases the peak deflection by 14%, and the maximum crack width by 75%. The result indicates that the increase of steel mesh layer can delay the presence of crack, enhance the load capacity and reduce the maximum crack width, but it may compromise the deformability. The main reason why the reinforcement material can improve the deformability of the RC column is the high-performance of resin concrete. As can be seen in 
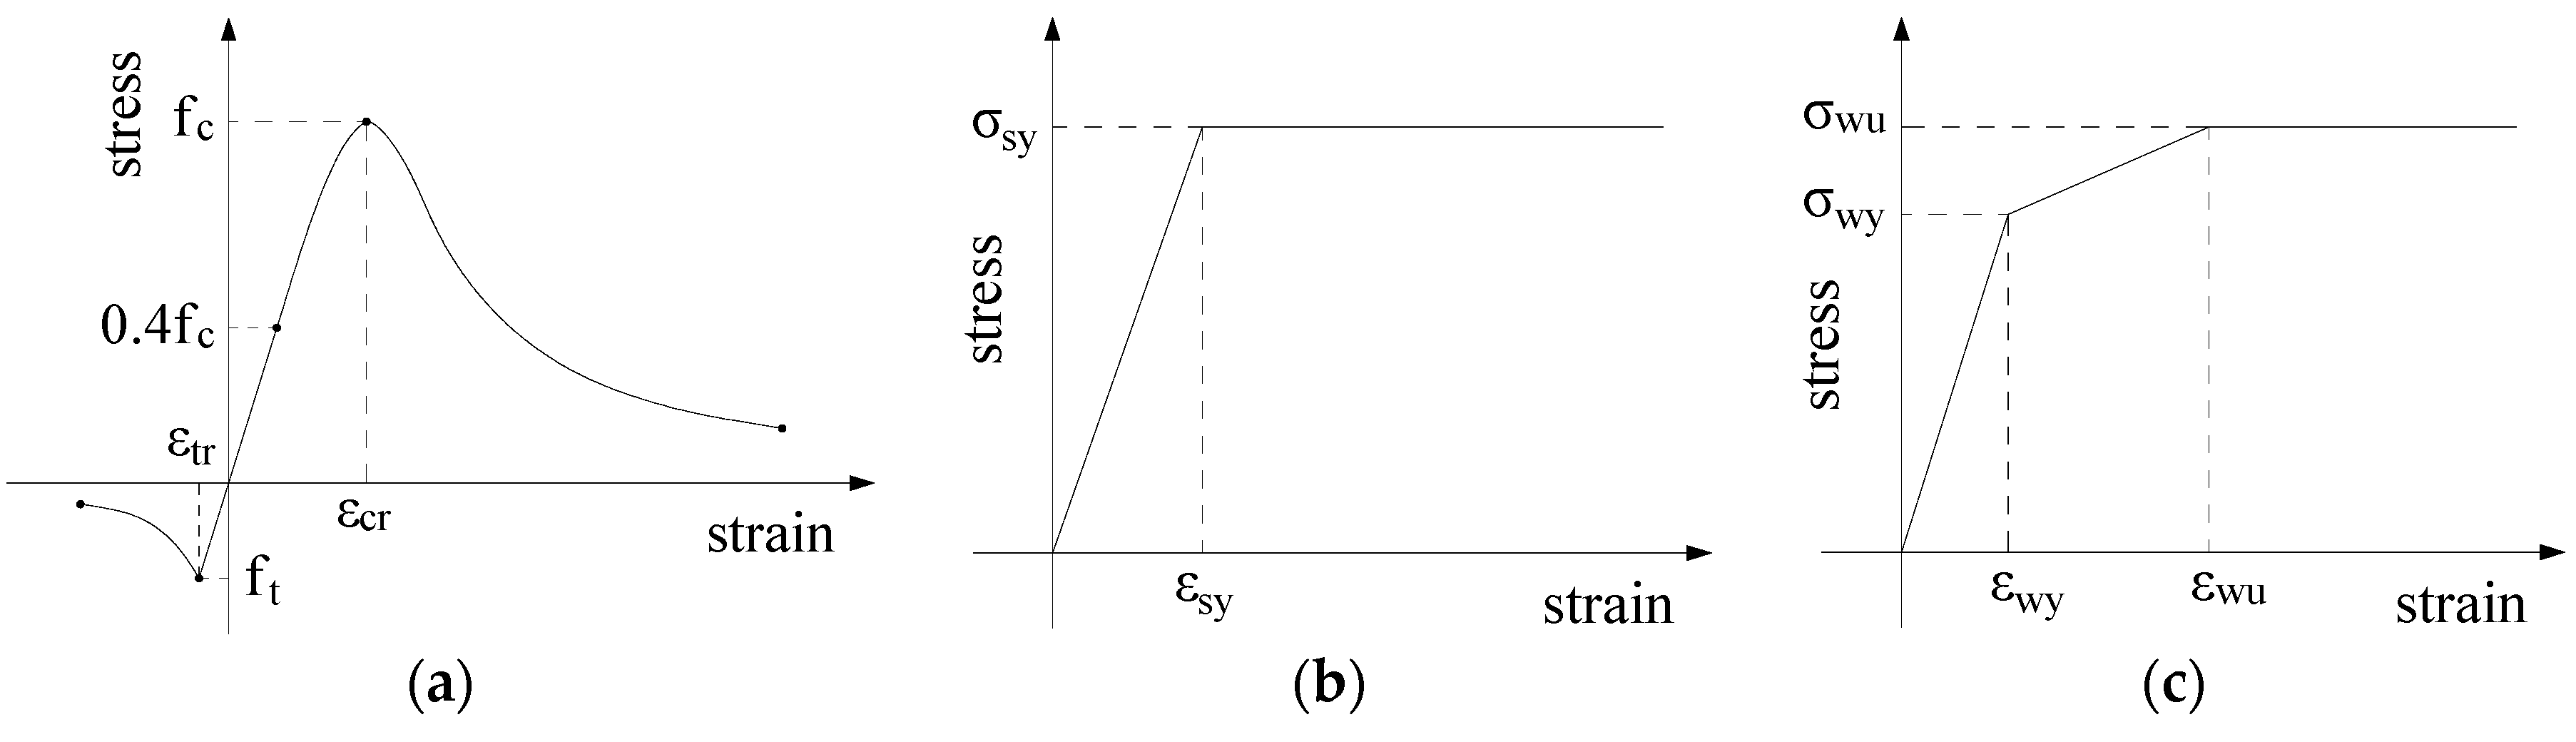
Figure 3b, the ultimate tensile strain of resin concrete is much larger than the normal concrete.

4. Finite Element Analysis

4.1. Model Description

Concrete damage plasticity model in ABAQUS was used to model concrete as it can accurately describe the elastic-plastic behavior as well as damage of concrete.
The constitutive relationships of resin concrete material at five days were used (see Figure 2b and Figure 3b). Constitutive relationships of normal concrete recommended in GB 50010-2010 [33] were adopted, as shown in Figure 14a. Three parts of the compressive constitutive relationship are identified. The first part is the elastic range, and the proportional limit stress can be determined to 0.4 f c , where f c is the cubic compressive strength. The second part is the nonlinear ascending range, and it is determined by Equation (7).
σ c = ρ c n n 1 + x c n E c ε c
where σ c and ε c are the compressive stress and strain, respectively; ρ c = f c / ( E c ε cr ) ; E c is the Young’s modulus; ε cr (=0.0021) is the strain when the σ c reaches f c ; and, n = E c ε cr / ( E c ε cr f c ) ; x c = ε c / ε cr and x c 1 for the ascending range.
The third part is the descending part, as expressed Equation (8).
σ c = ρ c α c ( x c 1 ) 2 + x c E c ε c
where α c is a parameter related to the shape of descending part of compressive constitutive relationship. x c > 1 for the descending part.
The tensile constitutive relationship of concrete can be defined in two parts. The first part is the elastic part, and the stress is from zero to the ultimate value. The second part is the descending part, and it can be determined by Equation (9).
σ t = ρ t α t ( x t 1 ) 1.7 + x t E c ε t
where σ t and ε t are the tensile stress and tensile strain, respectively; ρ t = f t / ( E c ε tr ) ; f t is the tensile strength; ε tr (=0.0001) is the strain when the σ t reaches f t ; α t is a parameter related to the shape of descending part of tensile constitutive relationship; and, x t = ε t / ε tr ; x t > 1 for the descending part.
The simple elastic-plastic model (Figure 14b) and the strengthening elastic-plastic model (Figure 14c) were used for the constitutive relationship of steel bar and steel mesh, respectively.
The normal concrete and resin concrete were modeled using C3D8R elements. C3D8R is an eight-node linear element and there is only one integral point in the center of the element and the displacement solution is more accurate using this element, as compared with C3D8 element; the reinforcing bars and steel mesh were modeled using T3D2 element. T3D3 is a two-node linear three-dimensional (3-D) truss element, and is validated to simulate the steel bar effectively [38]. Mesh convergence study was carried out and the global mesh size was determined to be 20 mm combining the calculation time and accuracy. With this mesh size, the finite element model had 10,244 C3D8R elements and 5427 truss elements (S-3). Figure 15 shows the meshed finite element model.
The contact between SMRC and normal concrete was defined while using the key word ‘Tie’, which does not allow for any relative movement between the SMRC and normal concrete. The reinforcing bars and steel mesh were respectively embedded in the normal concrete and resin concrete, meaning there was no slip between steel and concrete. The tie contact was also defined between the cushion block and bearing steel, and between the bearing steel and the column. Displacement control was adopted to apply the loading to the columns. All of the translational displacements were restrained for the loading point and constraint line, except U y of the loading point. All of the rotational displacements except R z were restrained both for the loading point and constraint line to simulate the hinge supports that can only rotate in the direction of Z.

4.2. Model Validation

Figure 16 shows the comparison of the experimental and simulation results of the load deflection curves. The simulation results of the load-deflection relationship follow the same trends as the experimental results. Both for the strengthened and non-strengthened specimens, the finite element model can simulate the force condition of specimen well. However, it can be seen that the stiffness of FEA-S-3 is larger than that of S-3. This phenomenon can be explained by that, when arranging three layers of steel mesh in 20 mm thick reinforcement layer, the effectiveness of bonding property between the steel mesh and resin concrete cannot be ensured in practical experiment. While in FEA, the bonding property between steel mesh and resin concrete is still assumed to be effective, and the relative slip is ignored, resulting in the larger stiffness when compared with the experiment.
Table 3 summarizes the experimental and simulation results of the load capacity. The finite element model overestimates the load capacity of each column. The maximum discrepancy is 5.2%. It is reasonable to reflect the load capacity of specimens using this finite element model. The error between the experimental result and the FEA result is within 10%, indicating that the finite element model provides a reasonable prediction of the load-deflection relationship of the columns.

4.3. Parametric Studies

4.3.1. Layer Number of Steel Mesh

Since the SMRC layer can accommodate limit number of steel mesh, the investigated layer number is limited to five in this study. Figure 17 shows the effect of steel mesh layer number on the load capacity of the column. The load capacity increases with the layer number of steel mesh; however, the increasing rate decreases with the layer number. The improvement percentage of the load capacity changes along a logarithmic function line with the increase of the layer number of steel mesh.
Table 4 shows the effect of the steel mesh layer number on the improvement proportion of load capacity (compared with non-strengthened specimen) of the column. The improvement of load capacity is within 8% for the specimen that is strengthened by SMRC without steel mesh. The same conclusion was drawn by Liu et al. [39]. Eccentric compressive behavior of RC column strengthened by textile-reinforced mortar was investigated. When the column was only strengthened by mortar, the load-deflection curve was almost the same with non-strengthened column.

4.3.2. Thickness of Reinforcement Layer

The investigated thickness of the reinforcement layer is increased from 20 mm to 40 mm, and the layer number of steel mesh was three. Figure 18 shows the effect of different thicknesses of SMRC layer on the load capacity of the column. The load capacity approximately linearly increases with the SMRC thickness.
Table 5 shows the effect of thickness of reinforcement layer on the improvement proportion of load capacity (compared with the specimen with a reinforcement layer thickness of 20 mm) of the column. As the SMRC thickness is increased from 20 mm to 40 mm and the load capacity is increased by 5%.

4.3.3. Load Holding Level

In the practical application, the strengthening operation is often performed when the structure is subjected to sustained load [39]. The load holding level represents the ratio of the sustained load to the load capacity of S-0. Figure 19 shows the effect of load holding level on the load capacity. As the load-holding level increases, the load capacity decreases following a bilinear trend. The decreasing rate is higher at the high load-holding levels. The inflection point (B) of the curve corresponds to the load level that causes yielding in the reinforcing bars in the column. Jiang et al. [40] investigated the eccentric compressive behavior of RC column strengthened by high performance ferrocement material under sustaining load, and the result also indicated that the strengthening material had little contributor to improving the bearing capacity when the load holding level is close to 1.
Table 6 shows the effect of load holding level on the reduction proportion of load capacity of the column. As the load-holding level is increased from 0 to 80%, the load capacity is reduced by 5.1%. As the load-holding level is increased from 80% to 95%, the load capacity is reduced by 6.2%.

4.3.4. Mechanism Analysis

The effect of different parameters on the bearing capacity can be analyzed through Figure 20.
For the effect of steel mesh, the participation of steel mesh improves the bearing capacity of the column. The area of the steel mesh participating to resist the external load increases with the increasing of layer of steel mesh, causing the bearing capacity increases.
For the effect of thickness of reinforcement layer, when assuming the compressive strain of the concrete at the compressive side reaches the ultimate compressive strain ε cu , according to the plane section assumption, the tensile strain of resin concrete at the tensile side is much larger than the ultimate tensile strain, indicating that the resin concrete has broken before, as can be seen in Figure 20b. As a result, only increasing the thickness of reinforcement layer has a little effect on the improvement of bearing capacity of the column.
For the effect of load holding level, as can be seen in Figure 20c, assume that the blue line represents the strain distribution caused by the sustaining load before reinforcement. When the column is strengthened by SMRC at this time, the strain will redistribute, and assume that the red line represents strain redistribution. The strain of the steel mesh is ε w at this moment. After the reinforcement, the strain of steel mesh increases to ε w with the increasing of the external load. Obviously, the strain of steel mesh resisting to the external load is ε w ε w . With the increasing of the sustaining load, ε w increases and the strain of steel mesh resisting to external load decreases, making the reinforcement effect worse.

5. Recommendations for Practice and Future Study

Some recommendations for practice can be given through the research of the performance of SMRC and the column reinforcement experiment.
SMRC is a suitable method for rapid reinforcement because of the high-performance of resin concrete. For example, SMRC is advised to strengthen the pier of bridge to shorten the time of reinforcement process, and reduce the loss caused by the interrupting traffic. Besides, the process of buffing for the concrete structure is not needed because of the good bonding properties between the resin concrete and normal concrete. Cleaning up the dust at the surface of concrete structure is recommended before reinforcement.
The tests are focused on the research of strengthening the structure at the tensile side while using SMRC because of the high-tensile strength of steel mesh. Circumferential reinforcement for columns using SMRC deserves further research. The confining effect for column with steel mesh can be considered. In this case, however, the stress concentration of the corner should be analyzed carefully if strengthening for the rectangular column.
The failure mode and the crack distribution are mainly influenced by the reinforcement ratio of steel mesh. A reinforcement ratio of 2% is recommended for practice.
The main reason for the use of resin concrete is its high-performance of reaching to certain strength in a short period. However, considering the high cost of resin concrete, it is meaningful to look for the other high-performance materials to replace resin concrete, and comparing their differences by taking the reinforcement effect and economy into consideration is recommended in the future study.

6. Conclusions

Eccentric compressive behavior of RC column strengthened by SMRC was investigated through four specimens. The impacts of the key parameter of layer number of steel mesh on failure mode, cracking load, load capacity, and lateral deformation were analyzed. In addition, the finite element method was used to study the impacts of other parametersm such as the thickness of reinforcement layer and load holding level on the load capacity. The main conclusions can be drawn as below:
The cracking load and load capacity of reinforced concrete columns were improved effectively by using SMRC that has a rapid strength growth rate and is promising for rapid strengthening.
The use of one steel mesh in the SMRC increases the cracking load by 96%, the load capacity by 23%, and the peak deflection by 22% compared with non-strengthened specimen. Increasing the steel mesh layer number from one to three increases the cracking load by 10% and the load capacity by 10%, and it decreases the peak deflection by 14%. The result indicates that the increase of steel mesh layer can delay the presence of crack and enhance the load capacity, but it may compromise the deformability.
Crack distribution at the tensile side of strengthened specimen is dependent on the layer number of steel mesh. As the layer number is increased from one to three, the maximum crack width is reduced by 75%. When the layer number is more than one (a reinforcement ratio of about 2%), densely distributed microcracks can be produced, instead of limited number of coarse cracks.
Resin concrete mainly acts as an adhesive layer. The load capacity approximately linearly increases with the SMRC thickness. As the SMRC thickness is increased from 20 mm to 40 mm, the load capacity is increased by 5%. The improvement of load capacity is mainly influenced by the steel mesh. With the increase of layer number of steel mesh, the improvement proportion of load capacity increases along a logarithmic function. When the layers of steel mesh are arranged too many, the improvement of load capacity tends to be stable.
The load capacity decreases following a bilinear trend with the load-holding level. The decreasing rate is higher at the high load-holding levels. As the load-holding level is increased from 0 to 80%, the load capacity is reduced by 5.1%. As the load-holding level is increased from 80% to 95%, the load capacity is reduced by 6.2%.

Author Contributions

Conceptualization, H.X. and H.G.; Methodology, H.X.; Software, H.X.; Validation, X.L., H.G. and M.Y.; Formal Analysis, H.X.; Investigation, G.Z.; Resources, X.L.; Data Curation, Y.B.; Writing-Original Draft Preparation, H.X.; Writing-Review & Editing, H.G.; Visualization, H.X.; Supervision, H.G.; Project Administration, X.L.; Funding Acquisition, M.Y.

Funding

This research was funded by the National Natural Science Foundation of China (Grant Nos. 51508474 and 51878563), the Sichuan Science and Technology Program (Grant Nos. 2018121, 2018JY0294 and 2018JY0549), and the Science and Technology Research and Development Plan of China Railway Construction (Grant No. 2014-C34).

Conflicts of Interest

The authors declare no conflict of interest.

Nomenclature

σ c compressive stress of concrete, MPa
A r area of resin concrete in effective tensile zone, mm2
A s area of cross section of steel bar, mm2
A t area of concrete in effective tensile zone, mm2
A w area of cross section of steel mesh, mm2
E c Young’s modulus of concrete, MPa
f c cubic compressive strength of concrete, MPa
f r tensile strength of resin concrete, MPa
f t tensile strength of concrete, MPa
L c average spacing of the cracks, mm
L min minimum spacing of cracks, mm
n coefficient in constitutive relation of concrete
u lateral deformation of specimen, mm
u m maximum value of u, mm
Z length from a point to the loading point, mm
Z m total length of specimen, mm
σ t tensile stress of concrete, MPa
ε c compressive strain of concrete
ε cu ultimate compressive strain of concrete
ε s ultimate tensile strain of steel bar
ε s ultimate compressive strain of steel bar
ε t tensile strain of concrete
ε w ultimate tensile strain of steel mesh
α c parameter related to the shape of descending part of compressive constitutive relationship
α t parameter related to the shape of descending part of tensile constitutive relationship
Δ σ s stress reduction of steel bar between two adjacent cracks, MPa
Δ σ w stress reduction of steel mesh between two adjacent cracks, MPa
τ ¯ average bond stress between SMRC and concrete, MPa
τ s ¯ average bond stress between steel bar and concrete, MPa
τ w ¯ average bond stress between steel wire and resin concrete, MPa
Ω s total perimeter of steel bar, mm
Ω w total perimeter of steel wire, mm

References

  1. Wang, C.S.; Zhai, M.S.; Duan, L.; Wang, Y.Z. Cold reinforcement and evaluation of steel bridges with fatigue cracks. J. Bridge Eng. 2018, 23, 04018014. [Google Scholar] [CrossRef]
  2. ASCE. Report Card for America’s Infrastructure; American Society of Civil Engineers: Reston, VA, USA, 2017. [Google Scholar]
  3. Tu, B.; Fang, Z.; Dong, Y.; Frangopol, D.M. Time-variant reliability analysis of widened deteriorating prestressed concrete bridges considering shrinkage and creep. Eng. Struct. 2017, 153, 1–16. [Google Scholar] [CrossRef]
  4. Blomfors, M.; Zandi, K.; Lundgren, K.; Coronelli, D. Engineering bond model for corroded reinforcement. Eng. Struct. 2018, 156, 394–410. [Google Scholar] [CrossRef]
  5. Wang, W.; Morgenthal, G. Reliability analyses of RC bridge piers subjected to barge impact using efficient models. Eng. Struct. 2018, 166, 485–495. [Google Scholar] [CrossRef]
  6. Cassese, P.; Ricci, P.; Verderame, G.M. Experimental study on the seismic performance of existing reinforced concrete bridge piers with hollow rectangular section. Eng. Struct. 2017, 144, 88–106. [Google Scholar] [CrossRef]
  7. Kashani, M.M.; Lowes, L.N.; Crewe, A.J.; Alexander, N.A. Nonlinear fibre element modelling of RC bridge piers considering inelastic buckling of reinforcement. Eng. Struct. 2016, 116, 163–177. [Google Scholar] [CrossRef] [Green Version]
  8. Gou, H.Y.; Shi, X.Y.; Zhou, W.; Cui, K.; Pu, Q.H. Dynamic performance of continuous railway bridges: Numerical analyses and field tests. Proc. Inst. Mech. Eng. Part F J. Rail Rapid Transit. 2018, 232, 396–955. [Google Scholar] [CrossRef]
  9. Gou, H.Y.; Wang, W.; Shi, X.Y.; Pu, Q.H.; Kang, R. Behavior of steel-concrete composite cable anchorage system. Steel Compos. Struct. 2018, 26, 115–123. [Google Scholar]
  10. Pu, Q.H.; Wang, H.Y.; Gou, H.Y.; Bao, Y.; Yan, M. Fatigue behavior of prestressed concrete beam for straddle-type monorail tracks. Appl. Sci. 2018, 8, 1136. [Google Scholar] [CrossRef]
  11. Gou, H.Y.; Zhou, W.; Bao, Y.; Li, X.; Pu, Q. Experimental study on dynamic effects of a long-span railway continuous beam bridge. Appl. Sci. 2018, 8, 669. [Google Scholar] [CrossRef]
  12. Gou, H.Y.; Zhou, W.; Yang, C.; Bao, Y.; Pu, Q. Dynamic response of long-span concrete-filled steel tube tied arch bridge and riding comfort of monorail trains. Appl. Sci. 2018, 8, 650. [Google Scholar] [CrossRef]
  13. Gou, H.Y.; He, Y.N.; Zhou, W.; Bao, Y.; Chen, G.D. Experimental and numerical investigations of the dynamic responses of an asymmetrical arch railway bridge. Proc. Inst. Mech. Eng. Part F J. Rail Rapid Transit. 2018. [Google Scholar] [CrossRef]
  14. Gou, H.Y.; Zhou, W.; Chen, G.D.; Bao, Y.; Pu, Q.H. In-situ test and dynamic analysis of a double-deck tied-arch bridge. Steel Compos. Struct. 2018, 27, 161–175. [Google Scholar]
  15. Hadi, M.N.S.; Algburi, A.H.M.; Sheikh, M.N.; Carrigan, A.T. Axial and flexural behaviour of circular reinforced concrete columns strengthened with reactive powder concrete jacket and fibre reinforced polymer wrapping. Constr. Build. Mater. 2018, 172, 717–727. [Google Scholar] [CrossRef]
  16. Lee, D.H.; Park, J.; Lee, K.; Kim, B.H. Nonlinear seismic assessment for the post-repair response of RC bridge piers. Compos. Part B Eng. 2011, 42, 1318–1329. [Google Scholar] [CrossRef]
  17. Parghi, A.; Alam, M.S. Seismic behavior of deficient reinforced concrete bridge piers confined with FRP—A fractional factorial analysis. Eng. Struct. 2016, 126, 531–546. [Google Scholar] [CrossRef]
  18. Sajedi, S.; Huang, Q. Probabilistic prediction model for average bond strength at steel-concrete interface considering corrosion effect. Eng. Struct. 2015, 99, 120–131. [Google Scholar] [CrossRef]
  19. Daud, R.A.; Cunningham, L.S.; Wang, Y.C. Static and fatigue behaviour of the bond interface between concrete and externally bonded CFRP in single shear. Eng. Struct. 2015, 97, 54–67. [Google Scholar] [CrossRef]
  20. Chen, G.M.; Teng, J.G.; Chen, J.F.; Xiao, Q.G. Finite element modeling of debonding failures in FRP-strengthened RC beams: A dynamic approach. Comput. Struct. 2015, 158, 167–183. [Google Scholar] [CrossRef] [Green Version]
  21. Kaish, A.B.M.A.; Jamil, M.; Raman, S.N.; Zain, M.F.M.; Nahar, L. Ferrocement composites for strengthening of concrete columns: A review. Constr. Build. Mater. 2018, 160, 326–340. [Google Scholar] [CrossRef]
  22. Mashrei, M.A.; Abdulrazzaq, N.; Abdalla, T.Y.; Rahman, M.S. Neural networks model and adaptive neuro-fuzzy inference system for predicting the moment capacity of ferrocement members. Eng. Struct. 2010, 32, 1723–1734. [Google Scholar] [CrossRef]
  23. Gandomi, A.H.; Roke, D.A.; Sett, K. Genetic programming for moment capacity modeling of ferrocement members. Eng. Struct. 2013, 57, 169–176. [Google Scholar] [CrossRef]
  24. Mansur, M.A.; Maalej, M.; Ismail, M. A study on corrosion durability of ferrocement. ACI Mater. J. 2008, 105, 28–34. [Google Scholar]
  25. Xiong, G.J.; Wu, X.Y.; Li, F.F.; Yan, Z. Load carrying capacity and ductility of circular concrete columns confined by ferrocement including steel bars. Constr. Build. Mater. 2011, 25, 2263–2268. [Google Scholar] [CrossRef]
  26. Mourad, S.M.; Shannag, M.J. Repair and strengthening of reinforced concrete square columns using ferrocement jackets. Cem. Concr. Compos. 2012, 34, 288–294. [Google Scholar] [CrossRef]
  27. Kaish, A.B.M.A.; Alam, M.R.; Jamil, M.; Zain, M.F.M.; Wahed, M.A. Improved ferrocement jacketing for restrengthening of square RC short column. Constr. Build. Mater. 2012, 36, 228–237. [Google Scholar] [CrossRef]
  28. Kaish, A.B.M.A.; Jamil, M.; Raman, S.N.; Zain, M.F.M.; Alam, M.R. An approach to improve conventional square ferrocement jacket for strengthening application of short square RC column. Mater. Struct. 2015, 49, 1–13. [Google Scholar] [CrossRef]
  29. Yan, M. High Toughness Resin Concrete with Steel Wire Mesh and the Reinforcement Theoretical Research on Prestressed Concrete Simply Supported Plate Beam Bridge; Southwest Jiaotong University: Chengdu, China, 2015. [Google Scholar]
  30. China Architecture and Building Press. Standard for Test Method of Mechanical Properties on Ordinary Concrete; GB/T 50081-2002; China Architecture and Building Press: Beijing, China, 2002. [Google Scholar]
  31. China Water Power Press. Test Code for Hydraulic Concrete; SL 352-2006; China Water Power Press: Beijing, China, 2006. [Google Scholar]
  32. Batson, G.B.; Castro, J.O.; Guerra, A.J.; Iorns, M.E.; Johnston, C.D.; Naaman, A.E.; Romualdi, J.P.; Shah, S.P.; Zollo, R.F.; Swamy, N.; et al. Guide for the design, construction, and repair of ferrocement. ACI Struct. J. 1999, 85, 325–351. [Google Scholar]
  33. China Architecture and Building Press. Code for Design of Concrete Structures; GB 50010-2010; China Architecture and Building Press: Beijing, China, 2010. [Google Scholar]
  34. Liu, D.J.; Huang, H.W.; Yue, Q.R.; Xue, Y.D.; Wang, M.Z. Behaviour of tunnel lining strengthened by textile-reinforced concrete. Struct. Infrastruct. Eng. 2015, 12, 964–976. [Google Scholar] [CrossRef]
  35. Li, X.L.; Wang, J.; Bao, Y.; Chen, G.D. Cyclic behavior of damaged reinforced concrete columns repaired with high-performance fiber-reinforced cementitious composite. Eng. Struct. 2017, 136, 26–35. [Google Scholar] [CrossRef]
  36. Yuan, X.B.; He, S.H.; Song, Y.F. Calculation method on bending crack in RC beams strengthened with FRP. China J. Highw. Transp. 2006, 19, 54–58. [Google Scholar]
  37. Larbi, A.S.; Contamine, R.; Hamelin, P. TRC and hybrid solutions for repairing and/or strengthening reinforced concrete beams. Eng. Struct. 2012, 45, 12–20. [Google Scholar] [CrossRef]
  38. Behnam, H.; Kuang, J.S.; Samali, B. Parametric finite element analysis of RC wide beam-column connections. Comput. Struct. 2018, 205, 28–44. [Google Scholar] [CrossRef]
  39. Liu, D.J.; Huang, H.W.; Zuo, J.P.; Duan, K.; Xue, Y.D.; Liu, Y.J. Experimental and numerical study on short eccentric columns strengthened by textile-reinforced concrete under sustaining load. J. Reinf. Plast. Compos. 2017, 36, 1712–1726. [Google Scholar] [CrossRef]
  40. Jiang, L.M.; Shang, S.P.; Liu, L.H. Experimental investigation and research on calculation method of load-carrying capacity for eccentrically compressed RC columns strengthened by high performance ferrocement laminates under twice loading. J. Build. Struct. 2011, 32, 72–79. [Google Scholar]
Figure 1. Compressive strength of resin concrete.
Applsci 08 01827 g001
Figure 2. Compressive test of resin concrete: (a) Setup and prism specimen (mm), (b) stress-strain relationship.
Applsci 08 01827 g002
Figure 3. Tensile test of resin concrete: (a) Setup and dogbone specimen (mm), (b) stress-strain relationship.
Applsci 08 01827 g003
Figure 4. Bond strength test for the bond strength between the resin concrete and normal concrete: (a) Physical map, (b) sketch map (mm).
Applsci 08 01827 g004
Figure 5. Tensile test of steel mesh: (a) Setup and steel mesh, (b) force-elongation relationship.
Applsci 08 01827 g005
Figure 6. Design of the column specimens (unit in mm).
Applsci 08 01827 g006
Figure 7. Reinforcement process of S specimens: (a) Clean and wet the surface, (b) install the formwork, (c) install the steel mesh, (d) cast resin concrete and demold after five days.
Applsci 08 01827 g007
Figure 8. Test setup for eccentric compressive testing: (a) Overall view and dimensions (unit: mm), (b) details at the two ends of the loading device.
Applsci 08 01827 g008
Figure 9. Crack patterns and failure modes of: (a) S-0; (b) S-1; (c) S-2; (d) S-3.
Applsci 08 01827 g009aApplsci 08 01827 g009b
Figure 10. Analysis of crack distribution: (a) Segmental model, (b) bonding stress distribution between steel bar and concrete, (c) bonding stress distribution between steel wire and resin concrete.
Applsci 08 01827 g010aApplsci 08 01827 g010b
Figure 11. Lateral deformation of: (a) S-0; (b) S-1; (c) S-2; (d) S-3.
Applsci 08 01827 g011
Figure 12. Strain at different depths of the mid-span cross section: (a) S-0, (b) S-1, (c) S-2, (d) S-3. Strain gauge No. 6 failed at the highest loading levels in each figure.
Applsci 08 01827 g012aApplsci 08 01827 g012b
Figure 13. Test result of load-deflection curves.
Applsci 08 01827 g013
Figure 14. Constitutive relationship in finite element analysis (FEA): (a) Concrete, (b) steel bar, (c) steel mesh.
Applsci 08 01827 g014
Figure 15. Finite element model and boundary condition. SMRC indicates steel mesh reinforced resin concrete.
Applsci 08 01827 g015
Figure 16. Comparison of lateral deformation curves.
Applsci 08 01827 g016
Figure 17. Effect of layer number of steel mesh.
Applsci 08 01827 g017
Figure 18. Effect of thickness of reinforcement layer.
Applsci 08 01827 g018
Figure 19. Effect of load holding level.
Applsci 08 01827 g019
Figure 20. Mechanism analysis: (a) cross-section, (b) strain distribution without sustaining load, (c) strain distribution under sustaining load.
Applsci 08 01827 g020
Table 1. Column specimens.
DesignationNumber of Steel Mesh LayerReinforcement Ratio *Reinforcement Position
S-000Non-strengthened
S-110.8%Tensile side
S-221.6%Tensile side
S-332.4%Tensile side
* The reinforcement ratio represents the ratio of cross section area of steel mesh to the gross cross section area of steel mesh reinforced resin concrete (SMRC).
Table 2. Summary of compressive test results of the four columns.
DesignationCracking Load (kN)Load Capacity (kN)Peak Deflection (mm)Maximum Crack Width (mm)
(0) S-0733999.74.2
(1) S-114349211.87.1
(2) S-215551610.82.4
(3) S-315853910.11.8
(1)/(0)1.961.231.22/
(2)/(1)1.081.050.920.34
(3)/(1)1.101.100.860.25
Table 3. Comparison of load capacity.
DesignationExperiment (kN)Simulation (kN)Discrepancy (%)
S-03994010.5
S-14924940.3
S-25165374.0
S-35395685.2
Table 4. Improvement proportion caused by increasing layer number of steel mesh.
Steel Mesh Layer NumberLoad Capacity (kN)Improvement Proportion
04337.9%
149423.2%
253733.9%
356841.6%
459147.4%
560250.1%
Table 5. Improvement proportion caused by increasing thickness of reinforcement layer.
Thickness of Reinforcement LayerLoad Capacity (kN)Improvement Proportion
20568/
255761%
305822%
355914%
405965%
Table 6. Reduction proportion caused by increasing load holding level.
Load Holding LevelLoad Capacity (kN)Reduction Proportion
0568/
80%5405.1%
95%5086.2%

