Analysis of Heat Transfer and Thermal Environment in a Rural Residential Building for Addressing Energy Poverty


1
Faculty of Civil Engineering, Xi’an University of Technology, Xi’an 710048, China
2
Department of Engineering and Design, University of Sussex, Brighton BN1 9RH, UK
*
Author to whom correspondence should be addressed.
Appl. Sci. 2018, 8(11), 2077; https://0-doi-org.brum.beds.ac.uk/10.3390/app8112077
Submission received: 7 October 2018
/
Revised: 24 October 2018
/
Accepted: 25 October 2018
/
Published: 28 October 2018
(This article belongs to the Special Issue Sustainable Energy Systems Planning, Integration and Management)
Abstract
:Reducing energy consumption and creating a comfortable thermal indoor environment in rural residential buildings can play a key role in fighting global warming in China. As a result of economic development, rural residents are building new houses and modernizing existing buildings. This paper investigated and analyzed a typical rural residential building in the Ningxia Hui Autonomous Region in Northwest China through field measurements and numerical simulation. The results showed that making full use of solar energy resources is an important way to improve the indoor temperature. Reasonable building layout and good thermal performance of the building envelope can reduce wind velocities and convective heat loss. Insulation materials and double-glazed windows should be used to reduce energy loss in new buildings, although it is an evolution process in creating thermally efficient buildings in rural China. This research provides a reference for the design and construction of rural residential buildings in Northwest China and similar areas for addressing energy poverty.
1. Introduction
Climate change has become a worldwide issue and buildings account for over 40% of global energy consumption, a figure which is still rising [1,2]. Building sectors can potentially make significant reductions in greenhouse gas emissions compared with other sectors. Energy efficiency in the built environment can make great contributions to a sustainable economy [3]. In addition to minimizing energy requirements, sustainable buildings should also be designed and constructed to reduce water consumption, use low environmental impact materials, reduce wastage, protect the natural environment, and safeguard human health and wellbeing [4,5]. In China, there are about 600 million people living in rural areas. With the economic development over the last several decades, people in these areas have been building new houses, and a great amount of energy consumption is expected as a consequence of the growing living standard [6]. A report of building energy efficiency in rural China by Evans et al. [7] found that most of these buildings are very energy inefficient. Shan et al. [8] and Liu et al. [9] also reported energy and environmental situations, challenges, and intervention strategies in Chinese rural buildings. They found that the walls are typically built of solid bricks and single-layer glass windows with large window/wall ratios being commonly used in northern China. The energy consumption per household in northern China can be 10 times as much as that in southern China. Although a large amount of energy is consumed for space heating in northern China, the indoor thermal environment is still poor and does not meet the thermal comfort requirement of the occupants [10,11]. Rural energy inefficient buildings, however, are not just a concern in China, which is a developing country; as reported by Roberts et al. [12] and Bouzarovski et al. [13], the level of fuel poverty in the United Kingdom increased rapidly from 2003 to 2010 due to the dramatic increase in electricity and gas prices. Fuel poverty is when people are unable to adequately heat their homes due to a lack of resources and because of the inefficiency of house insulation and heating. Fuel poverty in China should be addressed because poor thermal comfort can lead to respiratory problems, circulatory problems, pneumonia, etc. [14]. To increase building energy efficiency, common measures such as the cavity wall, roof insulation, double glazing, low-emissivity glass, and draught proofing can be used [15]. Boeck et al. [16] reviewed many methods which can be used to improve the energy performance of residential buildings. These measures can potentially solve energy efficiency problems in buildings; however, they need to be adapted to the local environment, building types, and occupants’ habits. To achieve an optimal building design, the overall concept of the construction needs to respond to the local environment and the intended use of the building. As pointed out by Mitterer et al. [17] and Wang et al. [18], a profound understanding of the reaction of a building to the specific climate and user’s behavior is important in holistic building climate designs.
Building form can affect energy consumption. Hemsath and Bandhosseini [19] highlighted that the vertical and horizontal geometric proportions are sensitive factors related to building energy use. Larger surface-to-volume ratios increase heat transfer through the building envelope by conduction and convection. Montazeri et al. [20] conducted research on the effect of the ratio of building width to height on the convective heat transfer coefficient at the windward facades. They found that the convective heat transfer coefficient reduces when the building’s width/height ratio increases. It was explained that the wind blocking effect is more pronounced for wider buildings, and the time that air is in contact with the upstream building facades increases, which therefore decreases the temperature difference between the air and the windward facades.
Solar radiation affects the surface temperature of walls [21], and it can be explored in building space heating. Pisello et al. [22] continuously monitored indoor and outdoor thermal conditions in two types of buildings which had different envelopes and a window/wall ratio of 0.17 for the south facade. Because of the different construction of the envelopes, they found that the difference of radiant temperature was more than 1 °C.
According to the climate regions of architecture in China, most areas in Northwest China are in cold or severe cold zones with a fragile ecological environment and lagging economic development. A large number of rural residents have built many widely distributed rural buildings, yet the design and construction of rural residential buildings still lack the guidance of scientific theory. It is an indisputable fact that the indoor thermal environment is poor in winter and there is high heating energy consumption. Therefore, it is very important to understand the climate characteristics, building types, and thermal performance of the enclosure structure in this area, which is particularly important to improve the indoor thermal environment quality and reduce building energy consumption in rural residential areas in the Northwest and similar areas of China.
Ningxia Hui Autonomous Region, in the hinterland of Northwest China, is located at the intersection zone of Ningxia, Gansu, and Mongolia provinces and has climate characteristics and residential forms typical of Northwest China [23]. Therefore, in this paper, a typical rural residential building in Zhongwei, Ningxia was studied to show the effect of the building’s construction, layout, occupant habits, and solar radiation on the building’s energy efficiency. The aim of the paper is to foster an evolution process for enhancing building thermal efficiency in rural buildings. Heat flow rate and heat flux through the building envelopes were analyzed with ANSYS finite element simulations and field measurements. Because the convective heat transfer coefficient plays a major role in the heat transfer of buildings, the effects of the building enclosures on the heat transfer coefficient in the rural residential buildings were studied in this paper as well. ANSYS CFX was employed to simulate air velocities around the building.
2. Methods
2.1. Object Selection
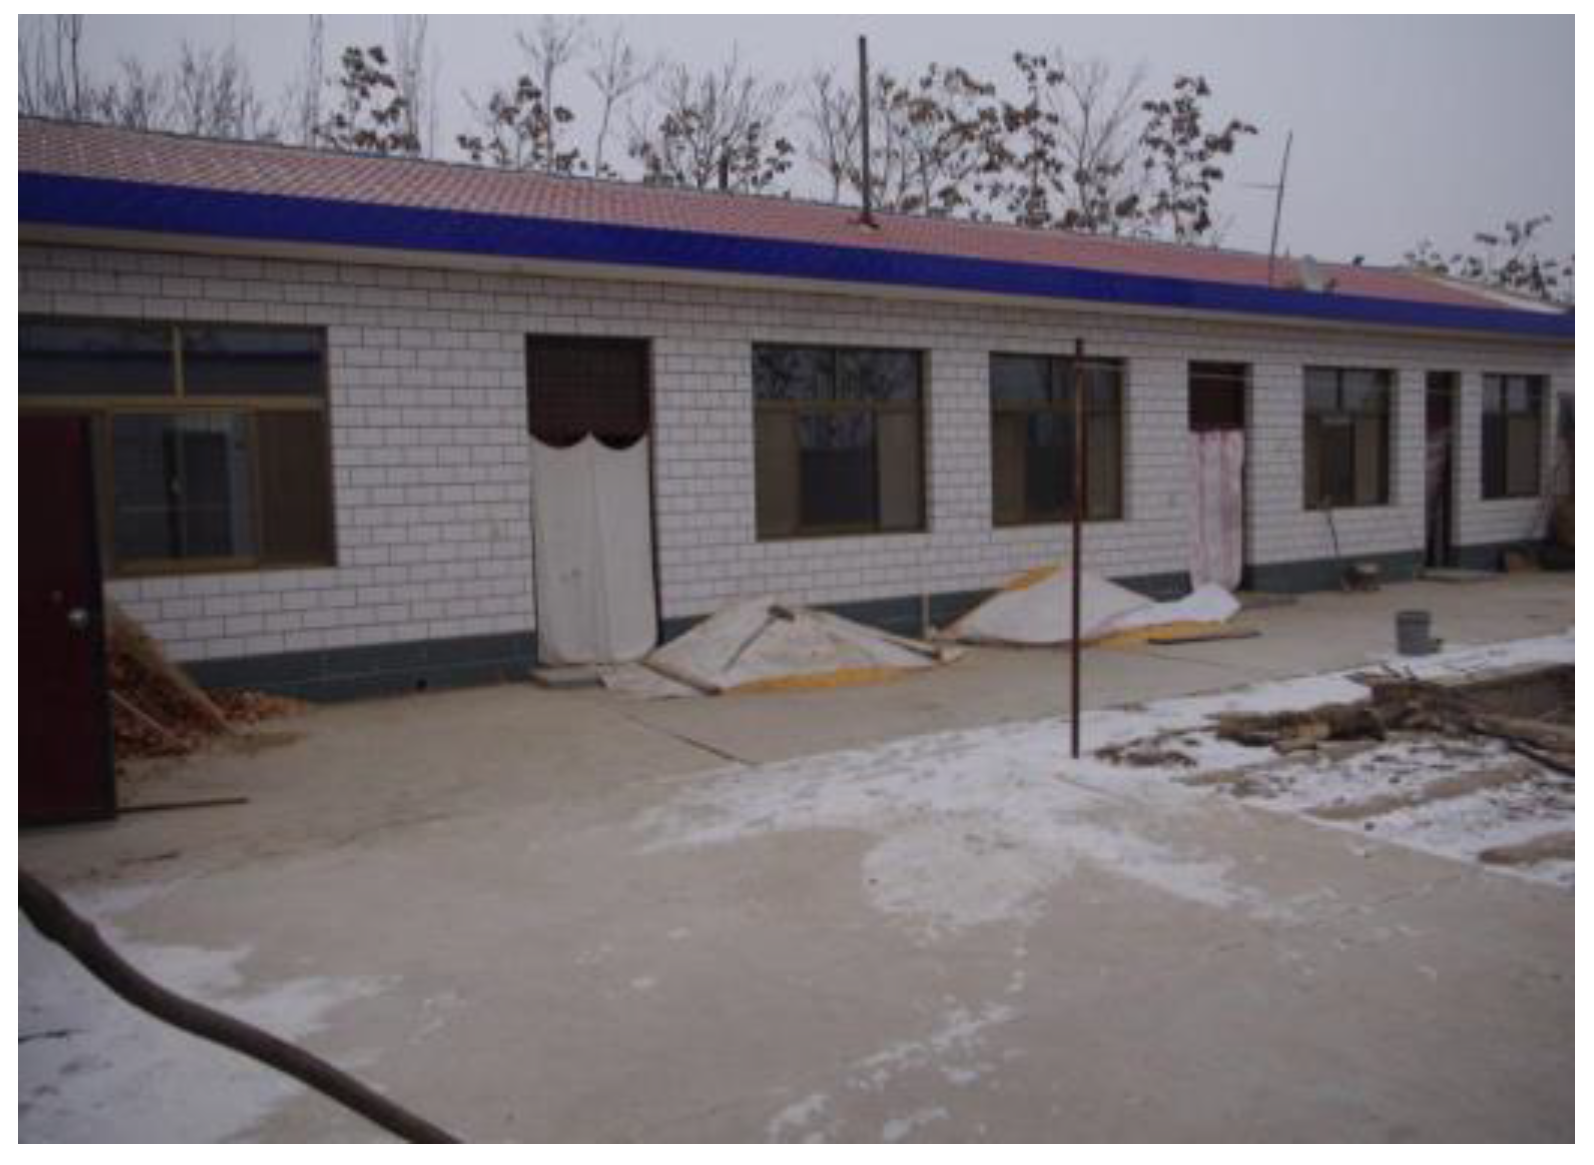
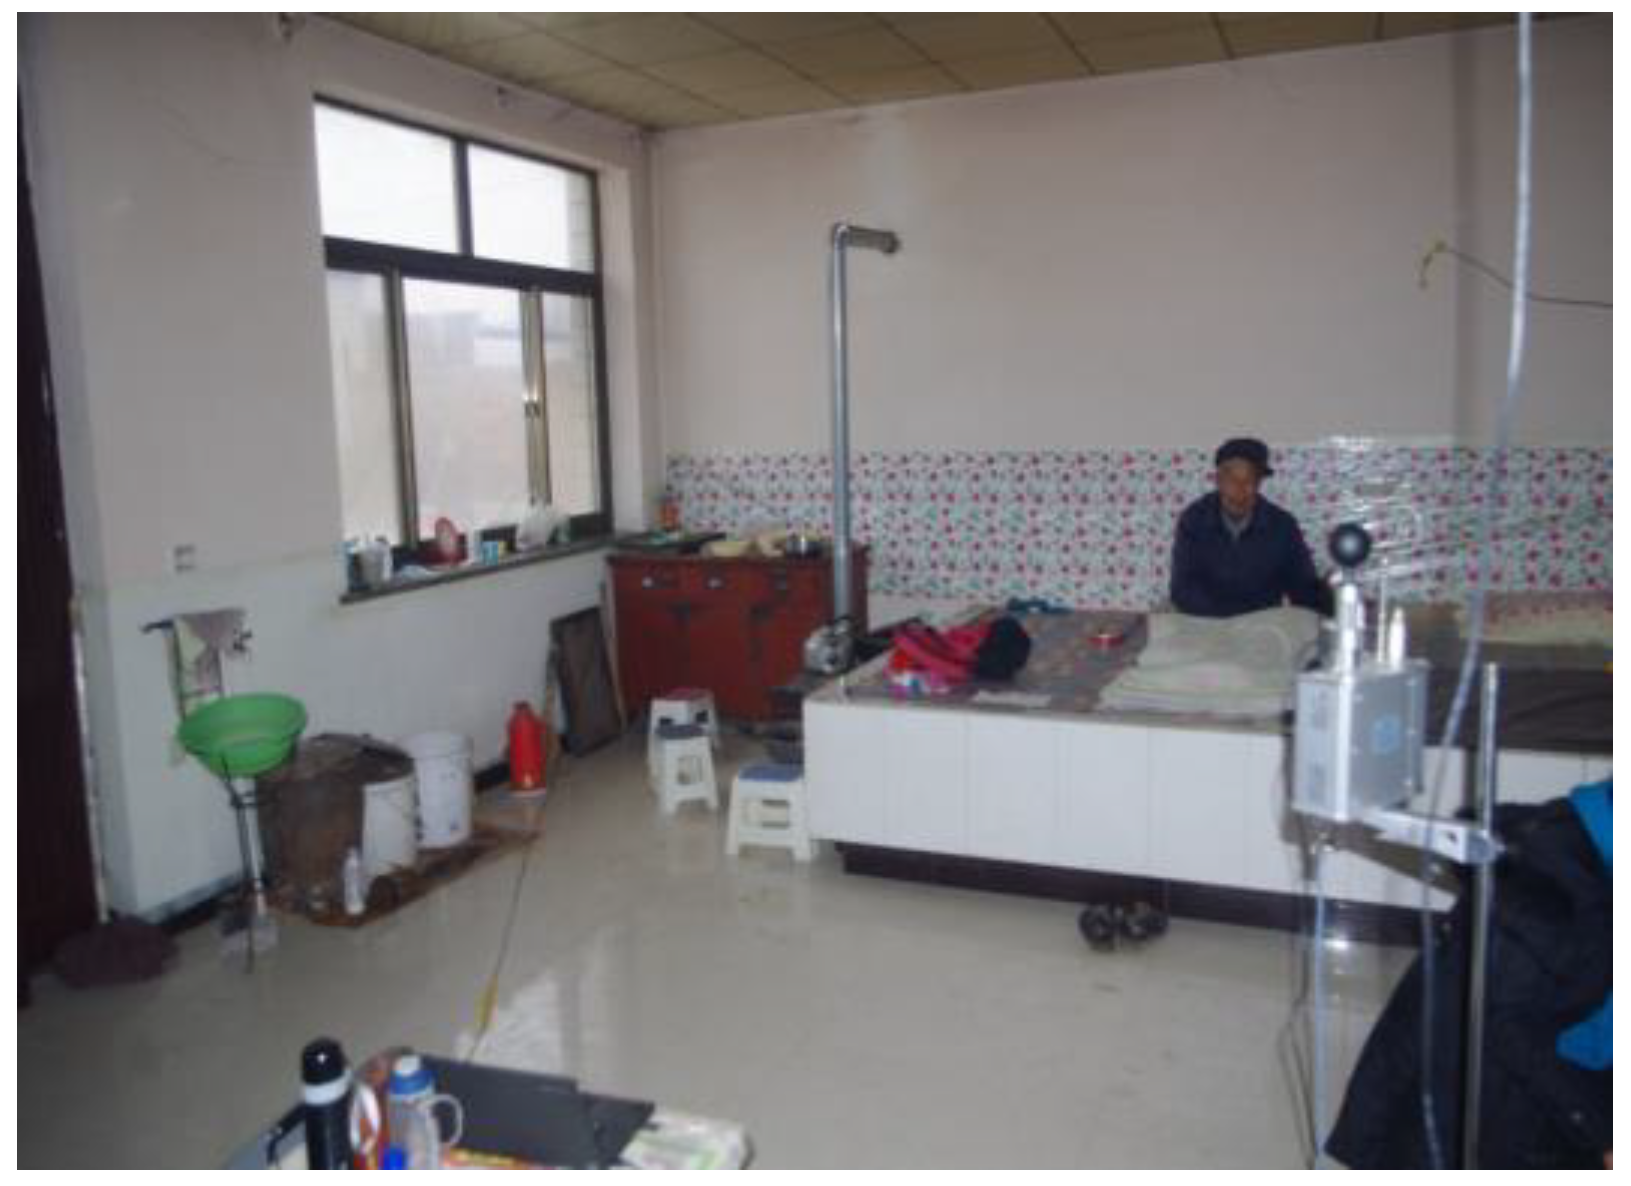
During the period from 16 to 20 January 2015, we carried out a field survey targeting rural residential buildings in the Ningxia Zhongwei areas. It was found that in the local area, there exist two kinds of residential buildings: earth houses and brick houses, which account for 13% and 87% of the residential structures, respectively. The survey also found that most of the new brick houses face south, with a long east–west and short north–south layout. The outer wall is often made of 370-mm solid clay brick, the roof is usually flat or in double slope, and most of the windows are in single frame and made of aluminum alloy or plastics. Based on the above initial analysis, in order to investigate the indoor thermal environment and thermal efficiency in local dwellings, a representative brick concrete building, as shown in Figure 1, was selected in this paper for subsequent measurements and analysis. The inside of the main bedroom was also being used as living room, as shown in Figure 2.
2.2. Data Acquisition
The outdoor measurement parameters included air temperature and solar radiation intensity, and indoor measurement parameters included air temperature and air velocity.
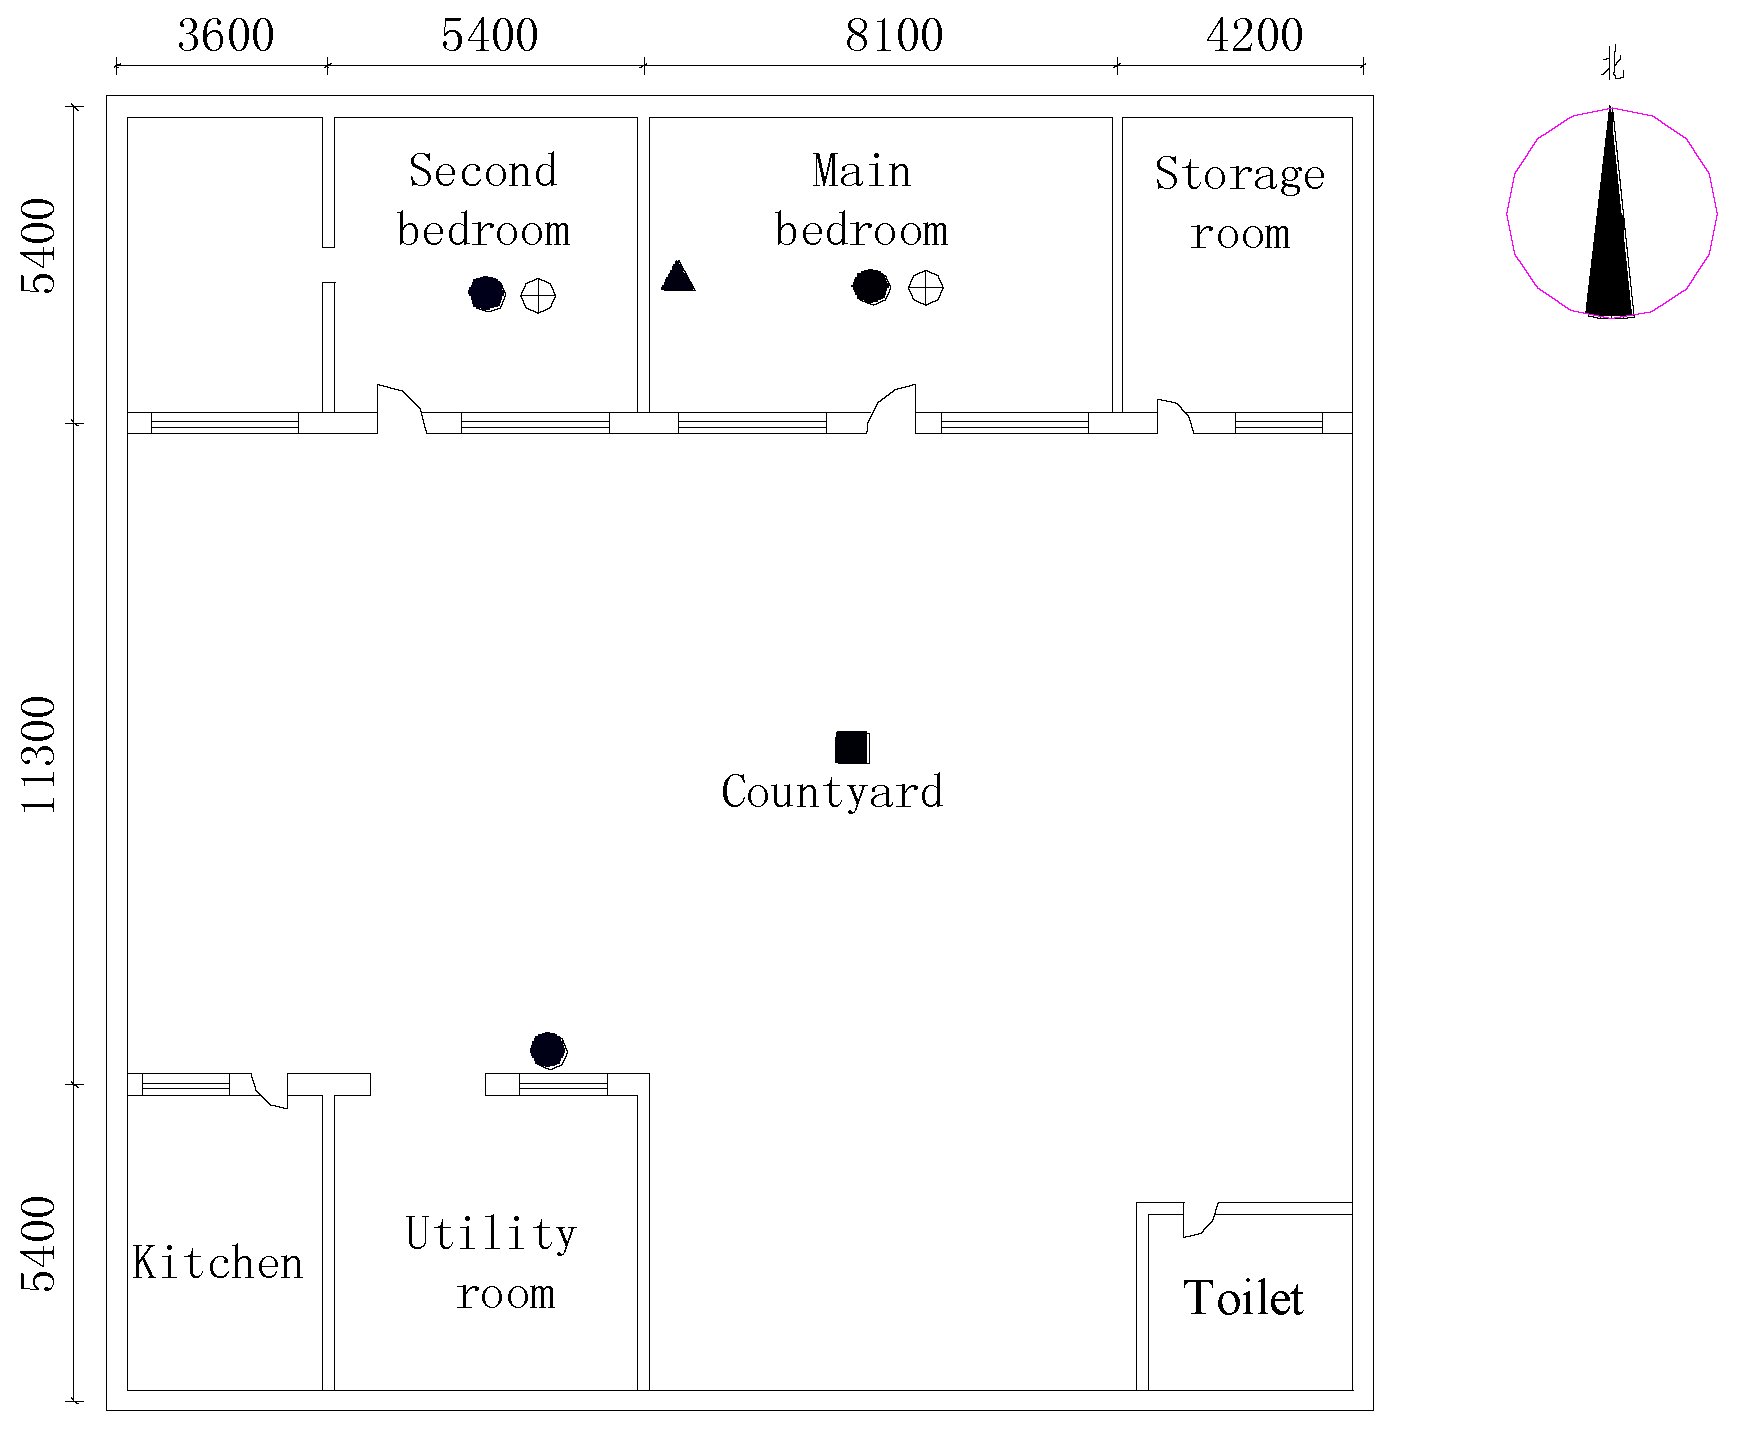
The intensity of solar radiation was measured by a solar radiometer, and the measuring points were arranged outdoors with no shelter, as denoted by the symbol “■” in Figure 3. The air temperature was measured with a thermometer and hydrometer. The measuring points of outdoor air temperature were under outdoor shades, and the measuring points of the indoor temperature were at 1.5 m above the floor in the center of the room, as denoted by the symbol “●” in Figure 3. The interior wall surface temperature was measured by an enclosure heat transfer coefficient field detector, and the measuring point was located at the middle of the measured wall surface, as denoted by the symbol “▲” in Figure 3. However, due to the concern that it would be inconvenient to place a hot wire anemometer in the room for a long time, the measurements of average wind speed were done by intermittent tests, and the measuring point was placed at the height of 1.0 m above the floor in the center of the room, as denoted by the symbol “⊕” in Figure 3. The monitoring period for the above measuring points was 24 h, and the acquisition time interval was 10 min. The models and parameters of the instruments are listed in Table 1, and the layout of the measuring points are shown in Figure 3.
To conduct numerical heat transfer simulations, the following material properties of the building envelope listed in Table 2 were used. In the numerical simulations, heat transfer by convection and conduction were considered. Heat transfers by radiation were studied by analyzing the heat transfer rates from the measured temperature data and the simulated results.
In the convective heat transfer analysis, the convective heat transfer coefficients were affected by the temperature difference between wall and fluid. As reported by Obyn and Van [24], the selection of surface convective heat transfer coefficient affects the evaluation of energy consumption of buildings. In the work carried out by Awbi and Hatton [25], convective heat transfer coefficients of buildings in the range of 1–6 W/m2·K were obtained.
According to a number of intermittent field tests, the average wind velocity of the indoor movement area is 0.06 m/s at maximum, far below the human body’s sensory threshold to air (0.2 m/s). Therefore, the convective heat transfer coefficient was calculated using the free convection method. This was also done because the measured indoor temperature was mainly in the single figures and the mean outdoor temperature was −2.98 °C according to the field tests. Air properties at 0 °C (273 K) were used to calculate the convective heat transfer coefficient:
Prandtl number Pr = 0.715 μ·cp/k, thermal conductivity k = 0.0243 W/m·K, dynamic viscosity μ = 1.720 × 10⁻⁵ N·s/m2, specific heat cp=1005 J/kg·K, and density ρ = 1.293 kg/m3.
For the vertical walls of this house, the characteristic length was 3.0 m, which was the height of the room. Thus, the Grashof number Gr was
From Equation (2), the Ra is greater than 109; therefore, the flow of the air inside the room was turbulent. The average Nusselt number Nuavg was
The average heat transfer coefficient havg was
The calculated convective heat transfer coefficient was 1.21 W/m2·K, which was in the range of data reported by Awbi and Hatton [25].
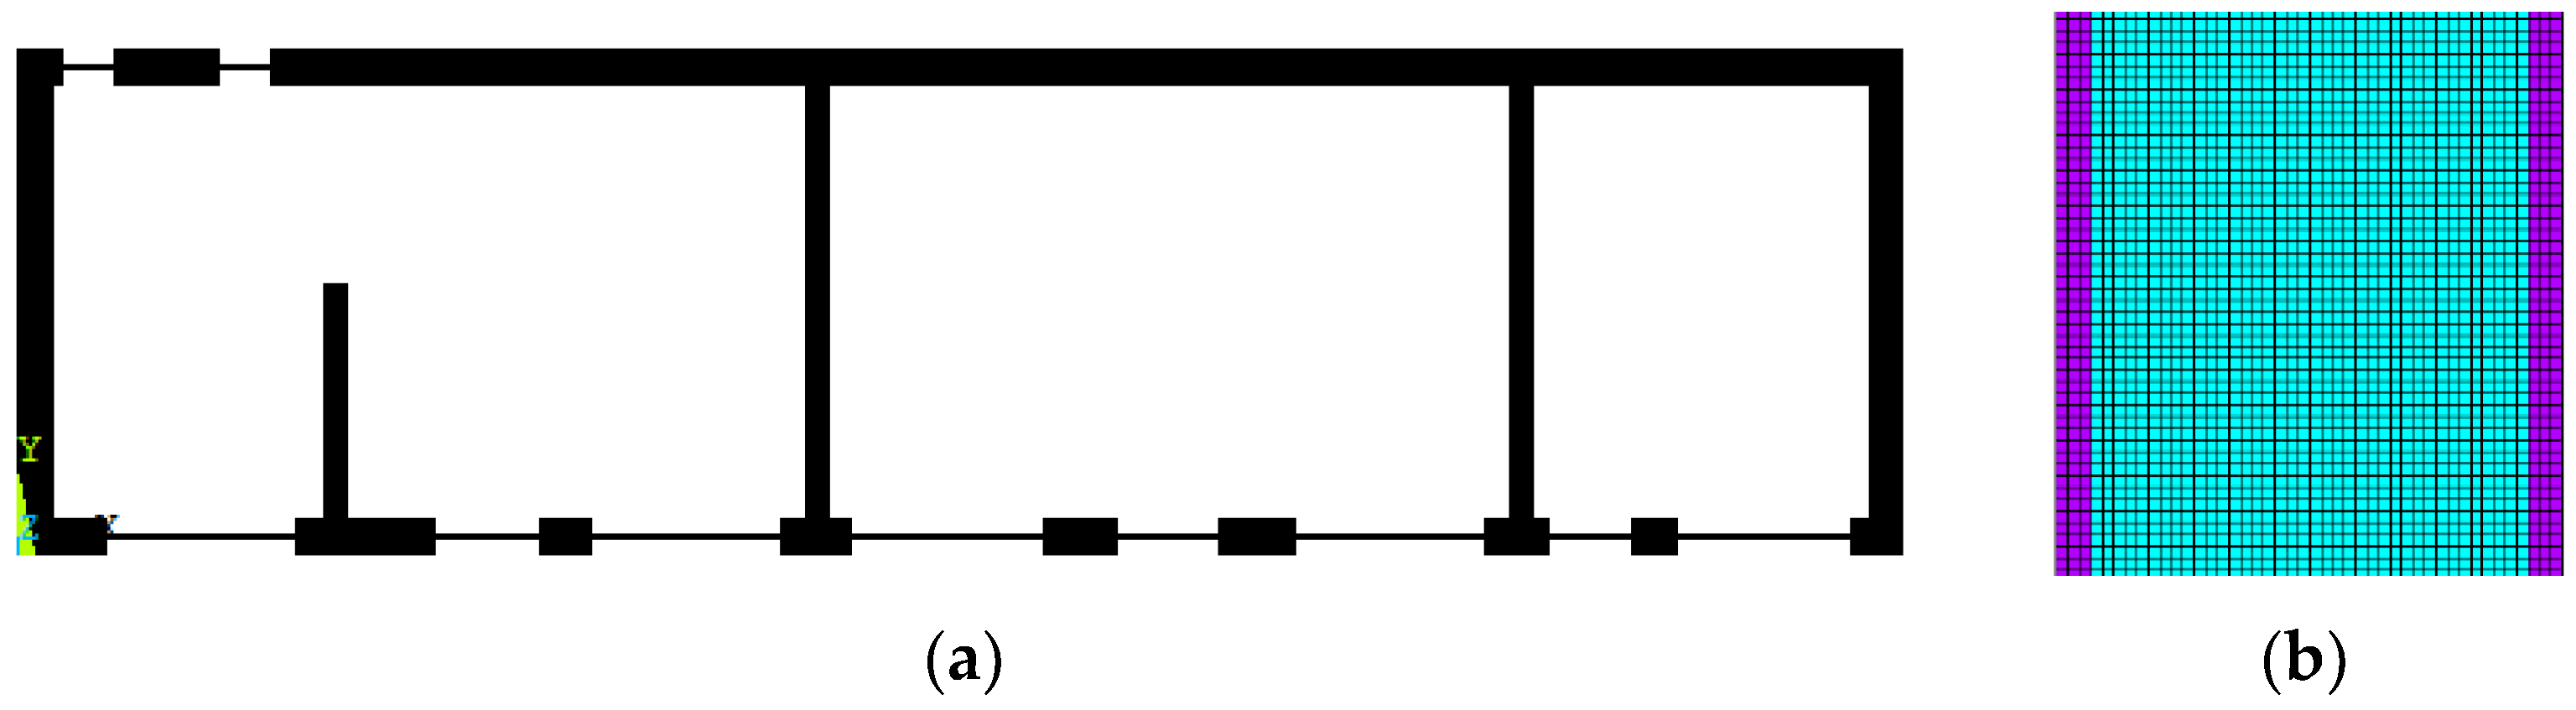
Based on the building layout and dimensions in Figure 3, a 2D model was created in ANSYS software to analyze the heat flux through the building. The model is shown in Figure 4a. Because of the thin glass panel in the windows, a mesh size of 0.006 m was used, and the ANSYS 2D plane thermal element type 55 was used for meshing the walls, windows, and doors. The calculated convective heat transfer coefficient of 1.21 W/m2·K was applied to the wall, window, and door surfaces. The mesh of the internal partition wall with different material layers are shown in Figure 4b, for which there was one layer of mortar plasters on each side of the clay brick internal wall. The external surface of the front wall had a layer of ceramic tiles.
To analyze heat transfer by convection and minimize heat loss via the convection mode, the relationships between the external convective heat transfer coefficient and wind velocity were studied. Hagishima and Tanimoto [26] measured the convective heat transfer coefficient for building envelopes, which is influenced by wind speed. Mirsadeghi et al. [27] reviewed prediction models of external convective heat transfer coefficients in building energy simulation programs and pointed out that different models can result in 30% deviations in the yearly energy demand. It is recommended by Liu and Harris [28] that the model should be used for one-story buildings; hence, it was adopted in this paper.
External convective heat transfer coefficient hc,ext for total wind velocity at 0.5 m away from the wall is shown in Equations (5) and (6) [28].
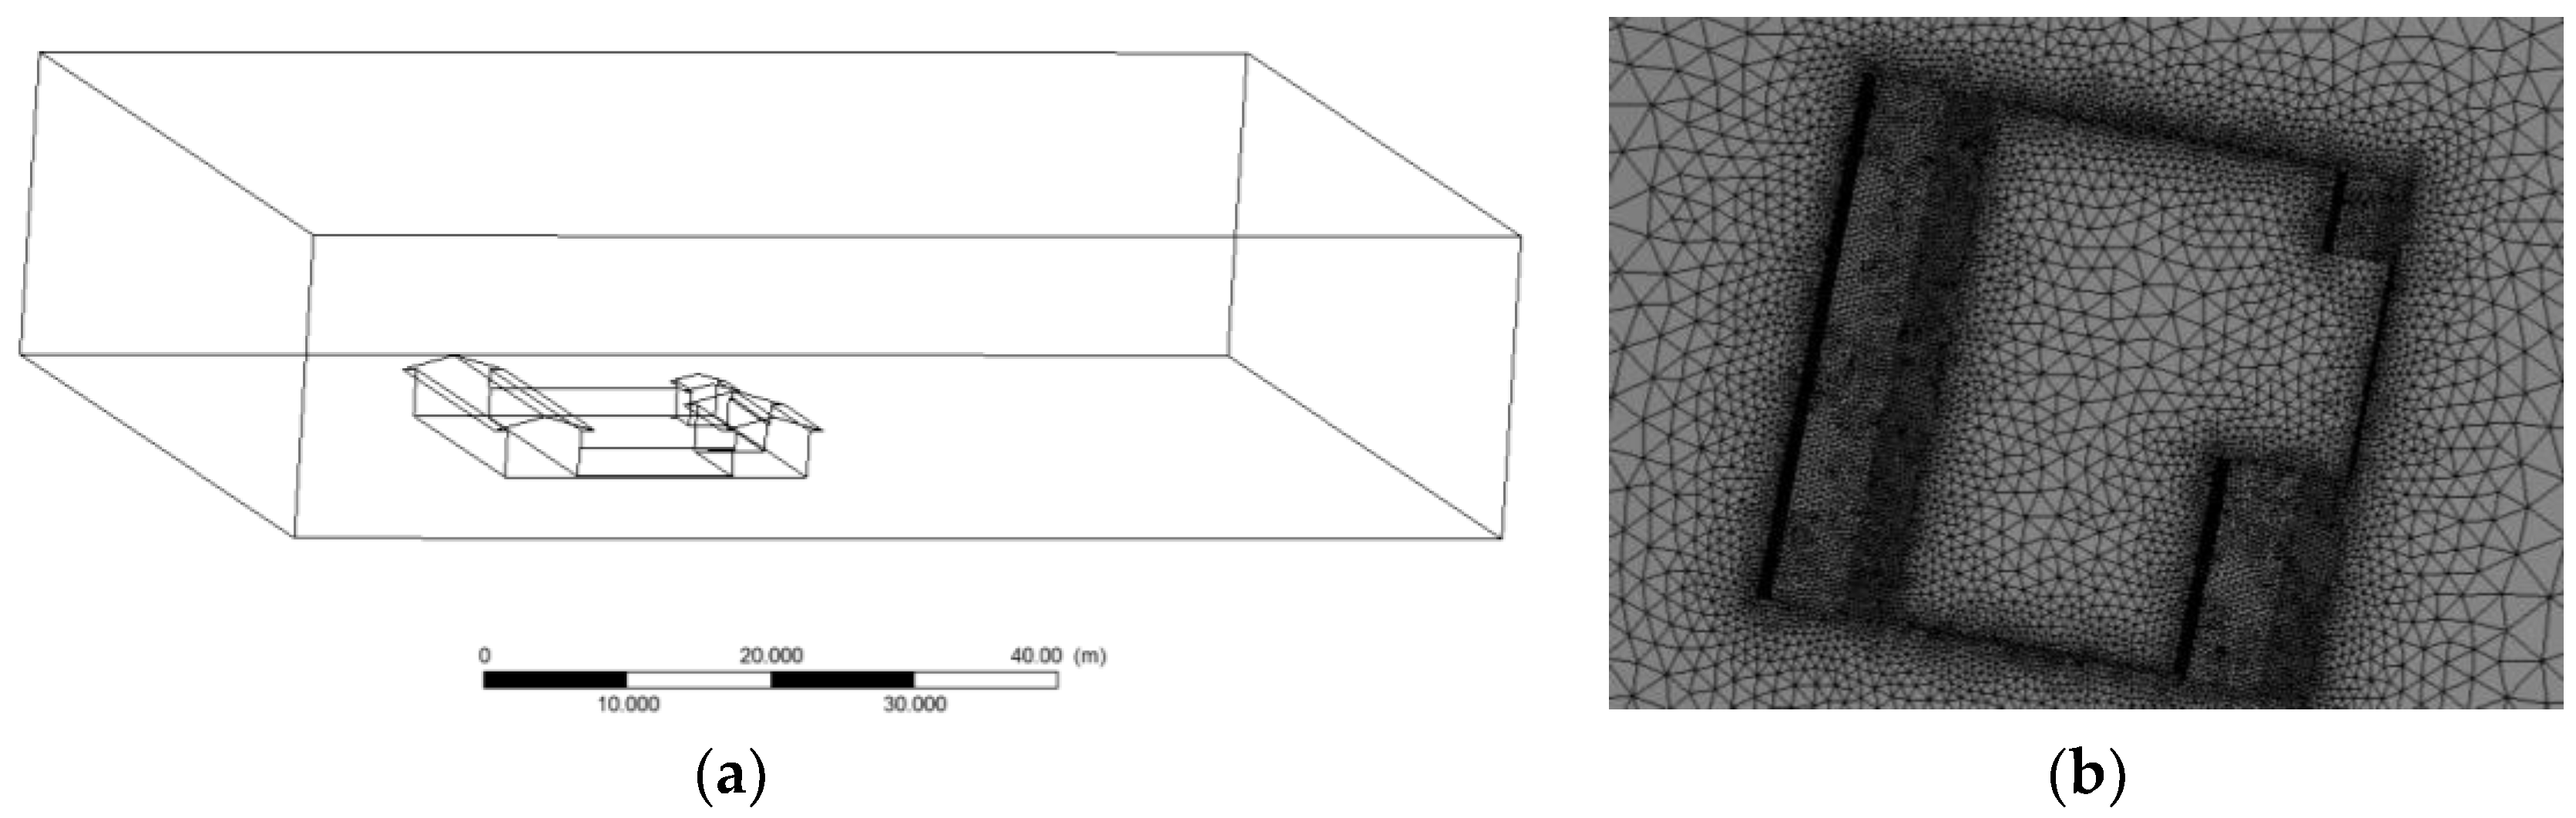
In order to analyze the effect of wind on the heat transfer coefficient and understand the effect of the building layout on the wind velocities, a numerical model was created using ANSYS CFX software to obtain wind velocities near the buildings. Fine meshes were used in the modelling; an element size of 0.2 m was used for meshing the surfaces of the building. To simulate the mean flow characteristics for turbulent flow conditions, the most common k-ε model was used as it is suitable for a wide range of simulations. A no-slip wall boundary condition was applied to all surfaces, and the standard wall function in ANSYS CFX was used with zero roughness height, as used by Ramponi and Blocken [29]. The model and a part of the numerical mesh are shown in Figure 5a,b, respectively. When the north and west winds were simulated separately, a typical wind velocity of 10 m/s was applied to the model to show the variations of wind velocities near the building envelopes.
3. Results
The tests were all done on fine days and the outdoor weather conditions were similar. Therefore, the indoor thermal environment parameters on 17 January were analyzed.
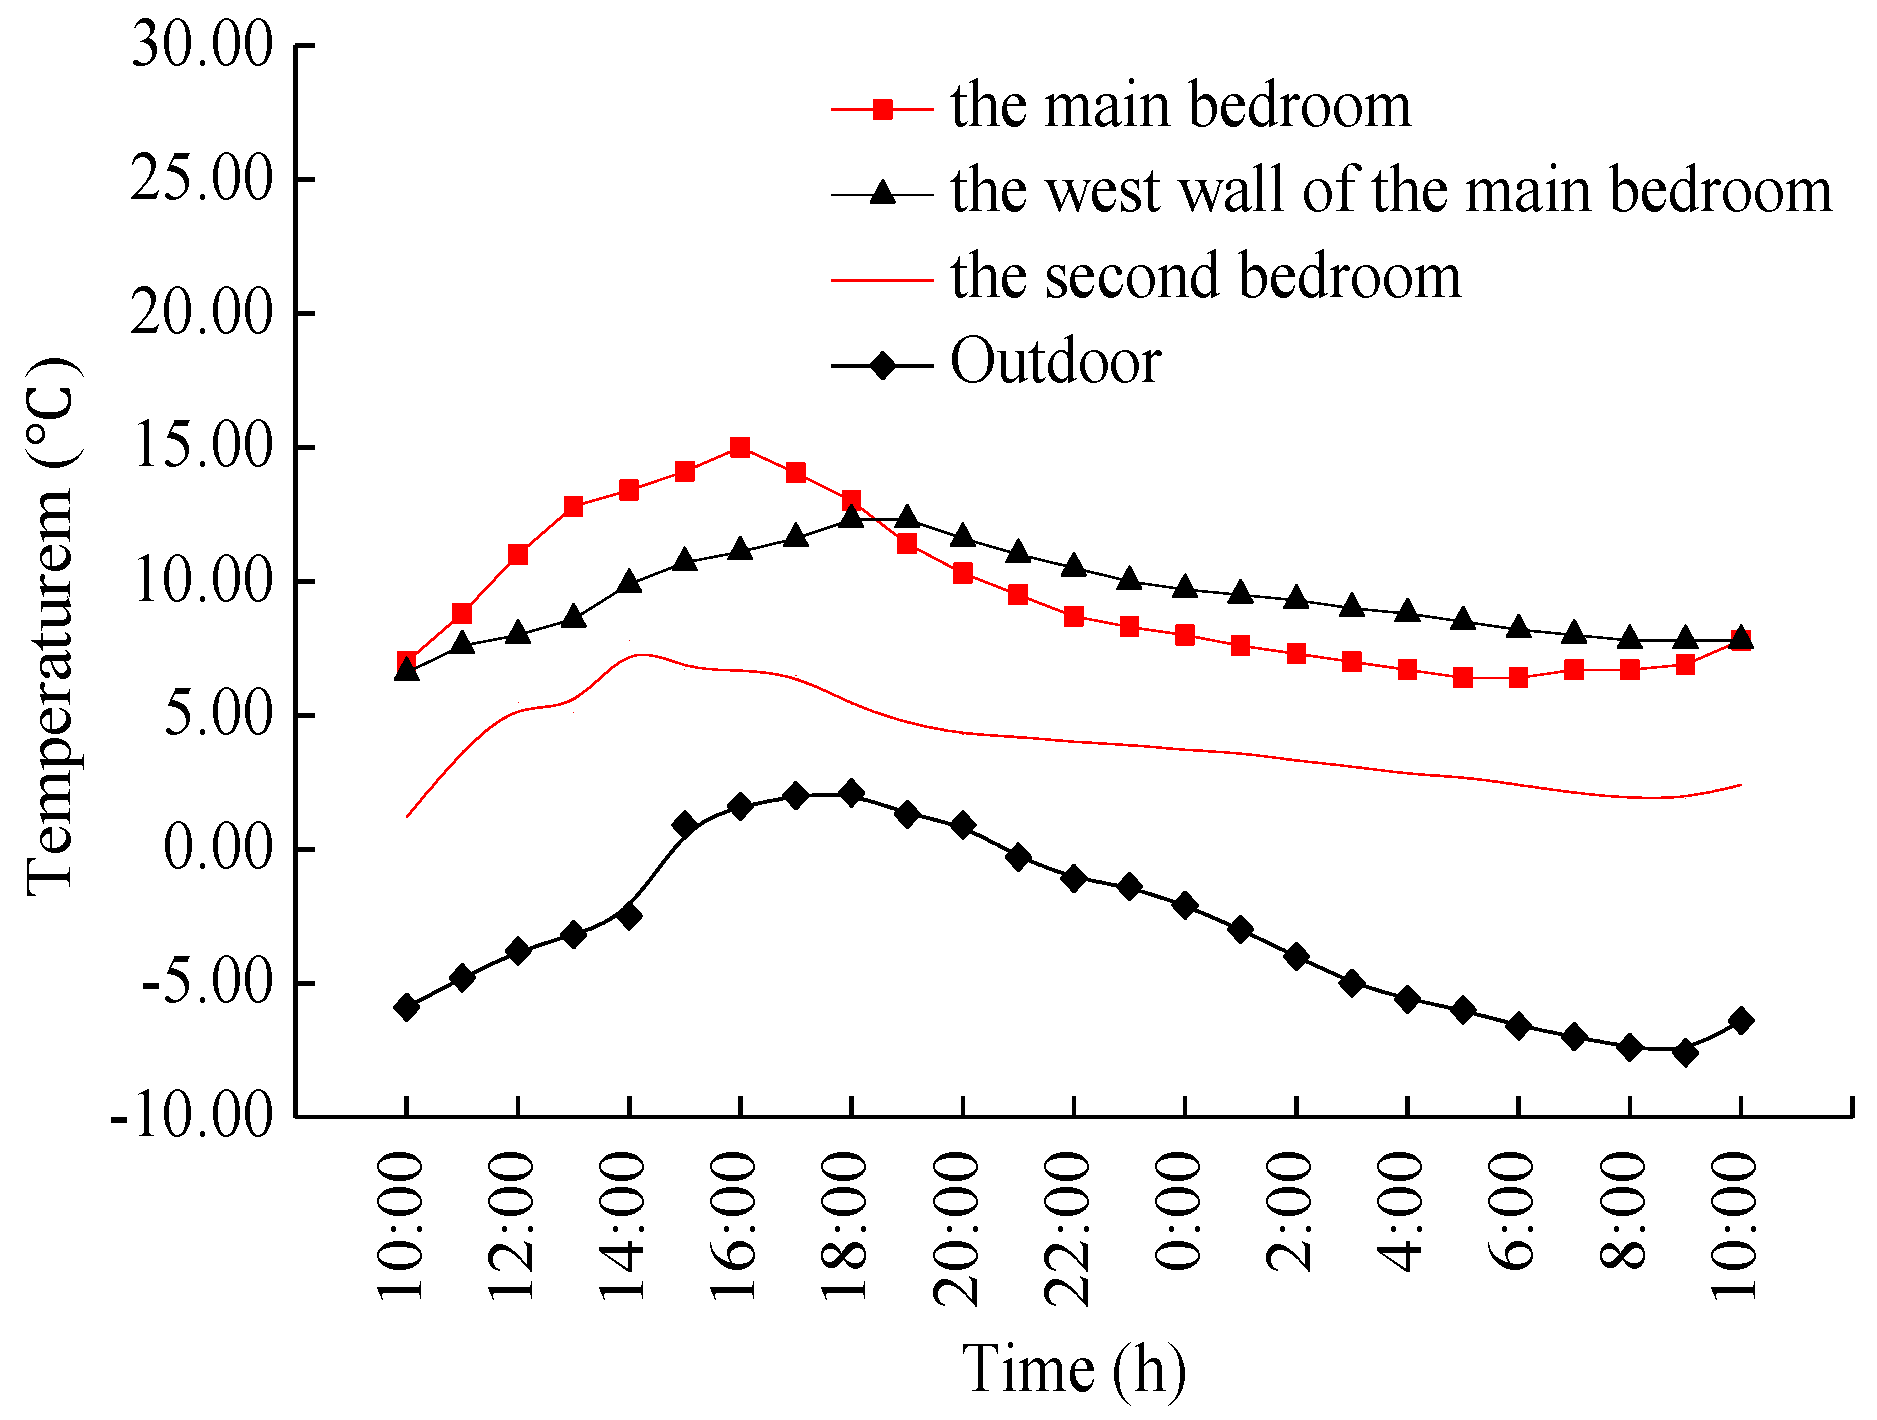
The changes of indoor and outdoor temperatures of the residential building during the tests are shown in Figure 6.
It can be concluded from Figure 6 that the outdoor temperature varied from −7.6 to 2.5 °C and the mean temperature was −2.7 °C. The indoor average temperature was 9.48 °C in the main function room, and the average temperature in the secondary function room was 4.02 °C. The average surface temperature of the west wall of the main bedroom was 9.45 °C. To conclude, in this region it is cold and the indoor temperature is low in winter.
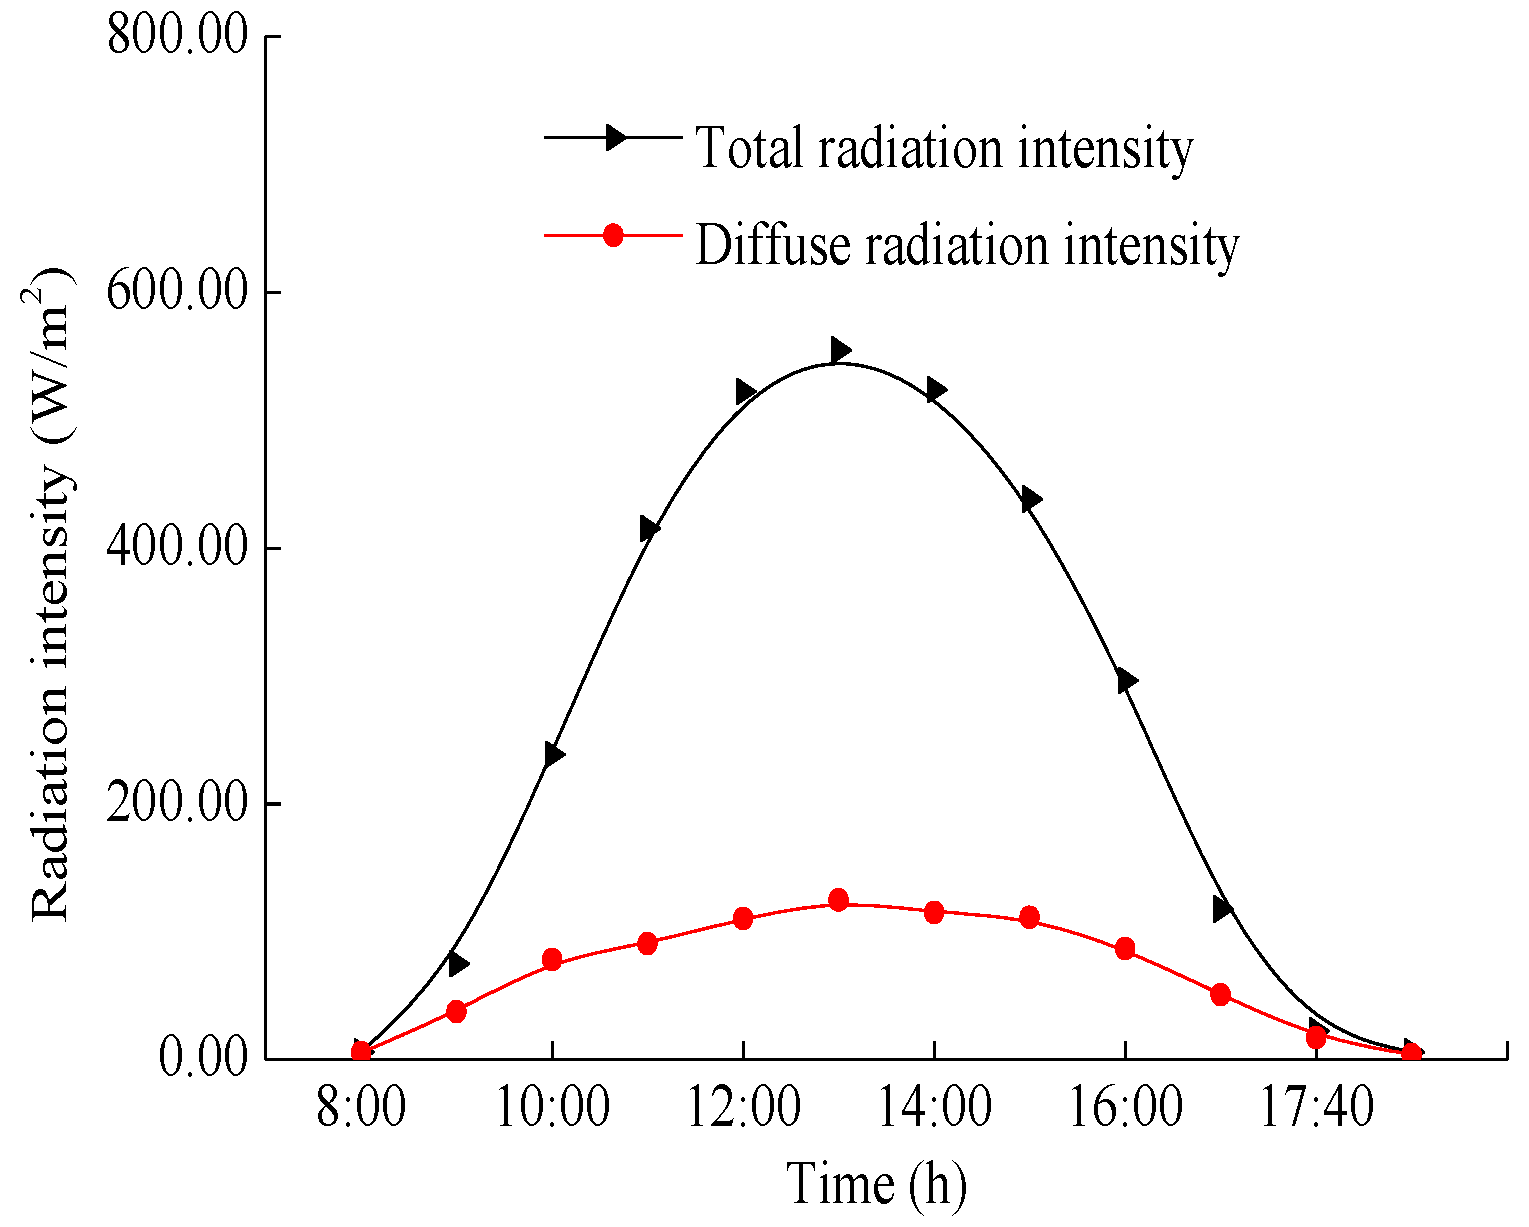
The changes of solar radiation intensity during the tests are as shown in Figure 7.
Figure 7 shows that the local sunshine duration was about 11 h, the solar radiation intensity was 286 W/m2 on average and came to the peak value of 544.8 W/m2 at around 4:00 pm, the scattered radiation intensity was 124.9 W/m2, and the direct solar radiation intensity accounted for about 80% of the total radiation intensity. In summary, the sunshine in this area lasts longer and the solar radiation intensity is higher. The solar radiation certainly needs to be considered and explored further in the building designs.
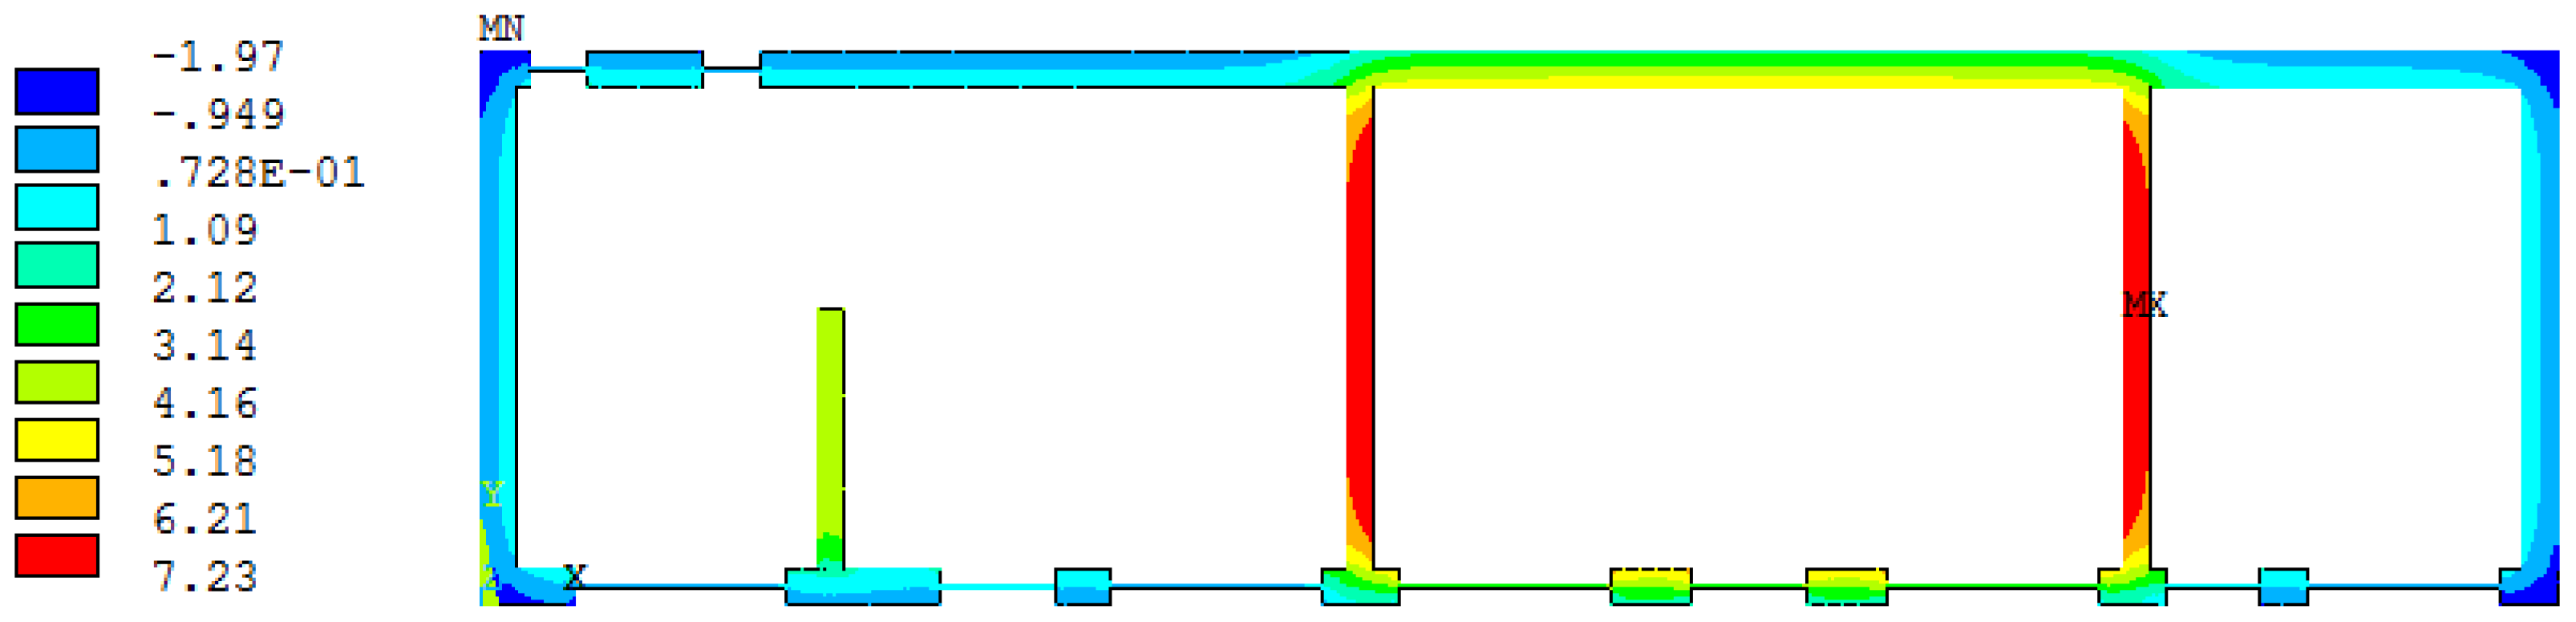
Figure 8 shows that when the air temperature of the main bedroom was 9.48 °C, the surface temperatures of the west and east side walls of the main bedroom were about 7.23 °C and the inside surface temperature of the north wall was 4.87 °C, which is about half of the room temperature.
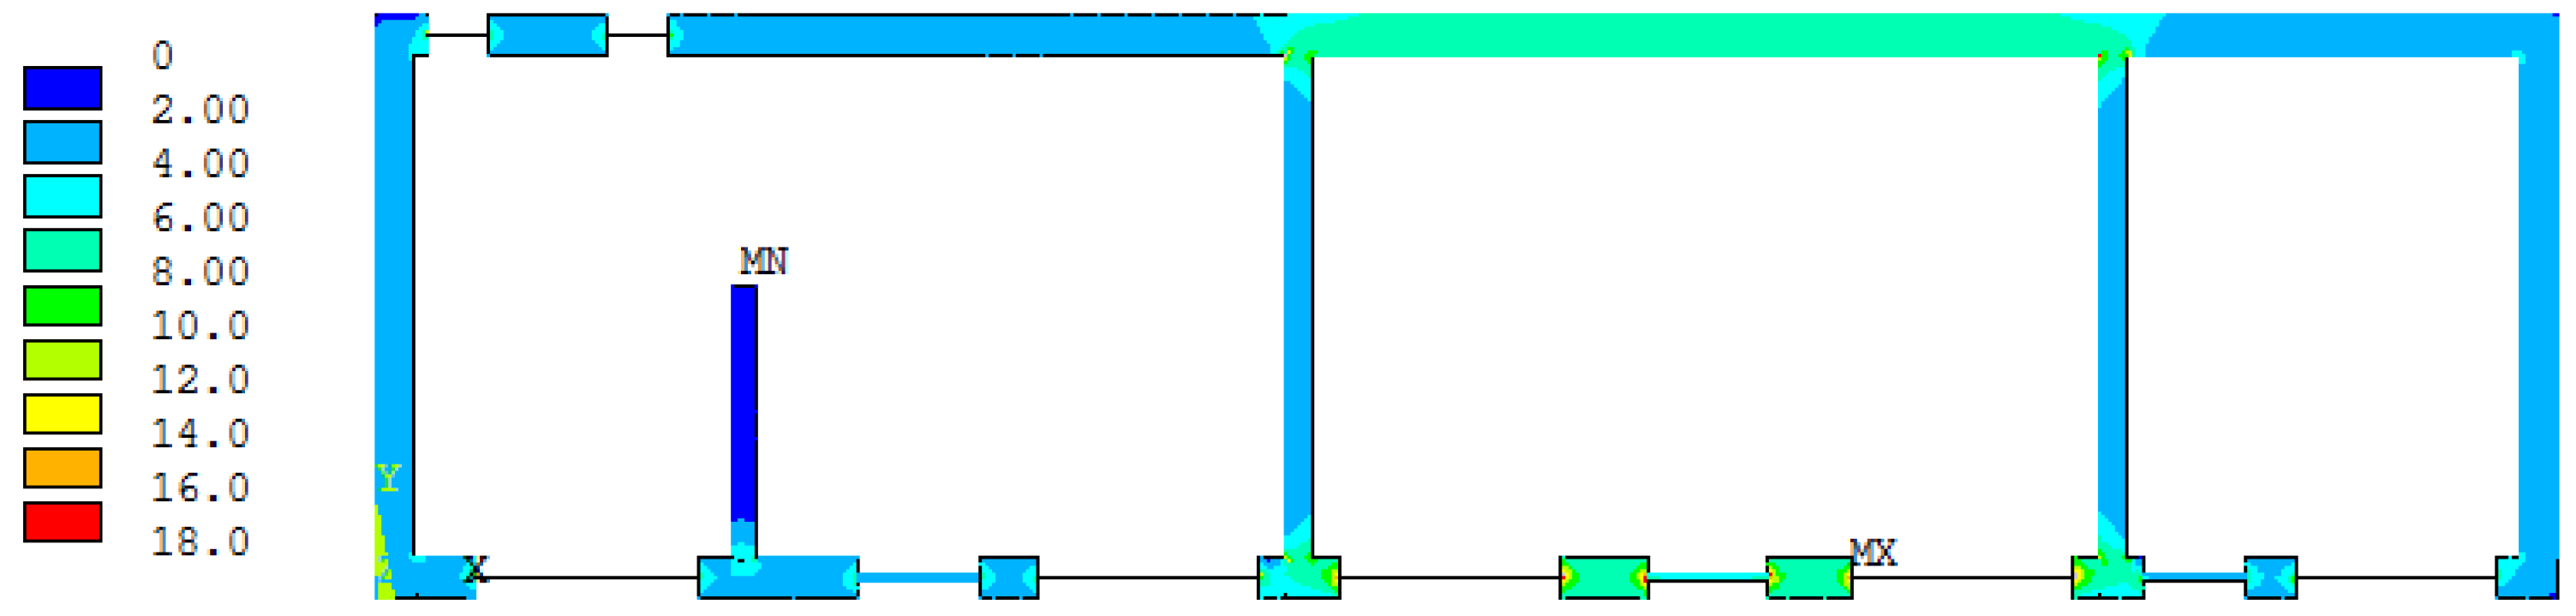
It can be seen from Figure 9 that heat flux at the middle section of the partition wall between the main bedroom and the second room was 3.04 W/m2. The relatively large heat flux occurred at the window corners at south and north walls of the main bedroom. From the simulation results, the flow rate from the main bedroom to the second bedroom through the partition wall was 55.3 W, and the heat flow through the north, south, and west side enclosures of the second bedroom was 260.5 W. The difference between the two heat flow rates is 205.2 W.
The above heat flow rates were calculated based on the existing windows, which have a single layer of glass. If two layers of glass with a 12-mm air gap between them were installed, the heat flow rate through the north, south, and west enclosures of the second bedroom would be reduced to 242.2 W, with a reduction of 18.2 W or about 7% of the current heat flow rate out of the second bedroom.
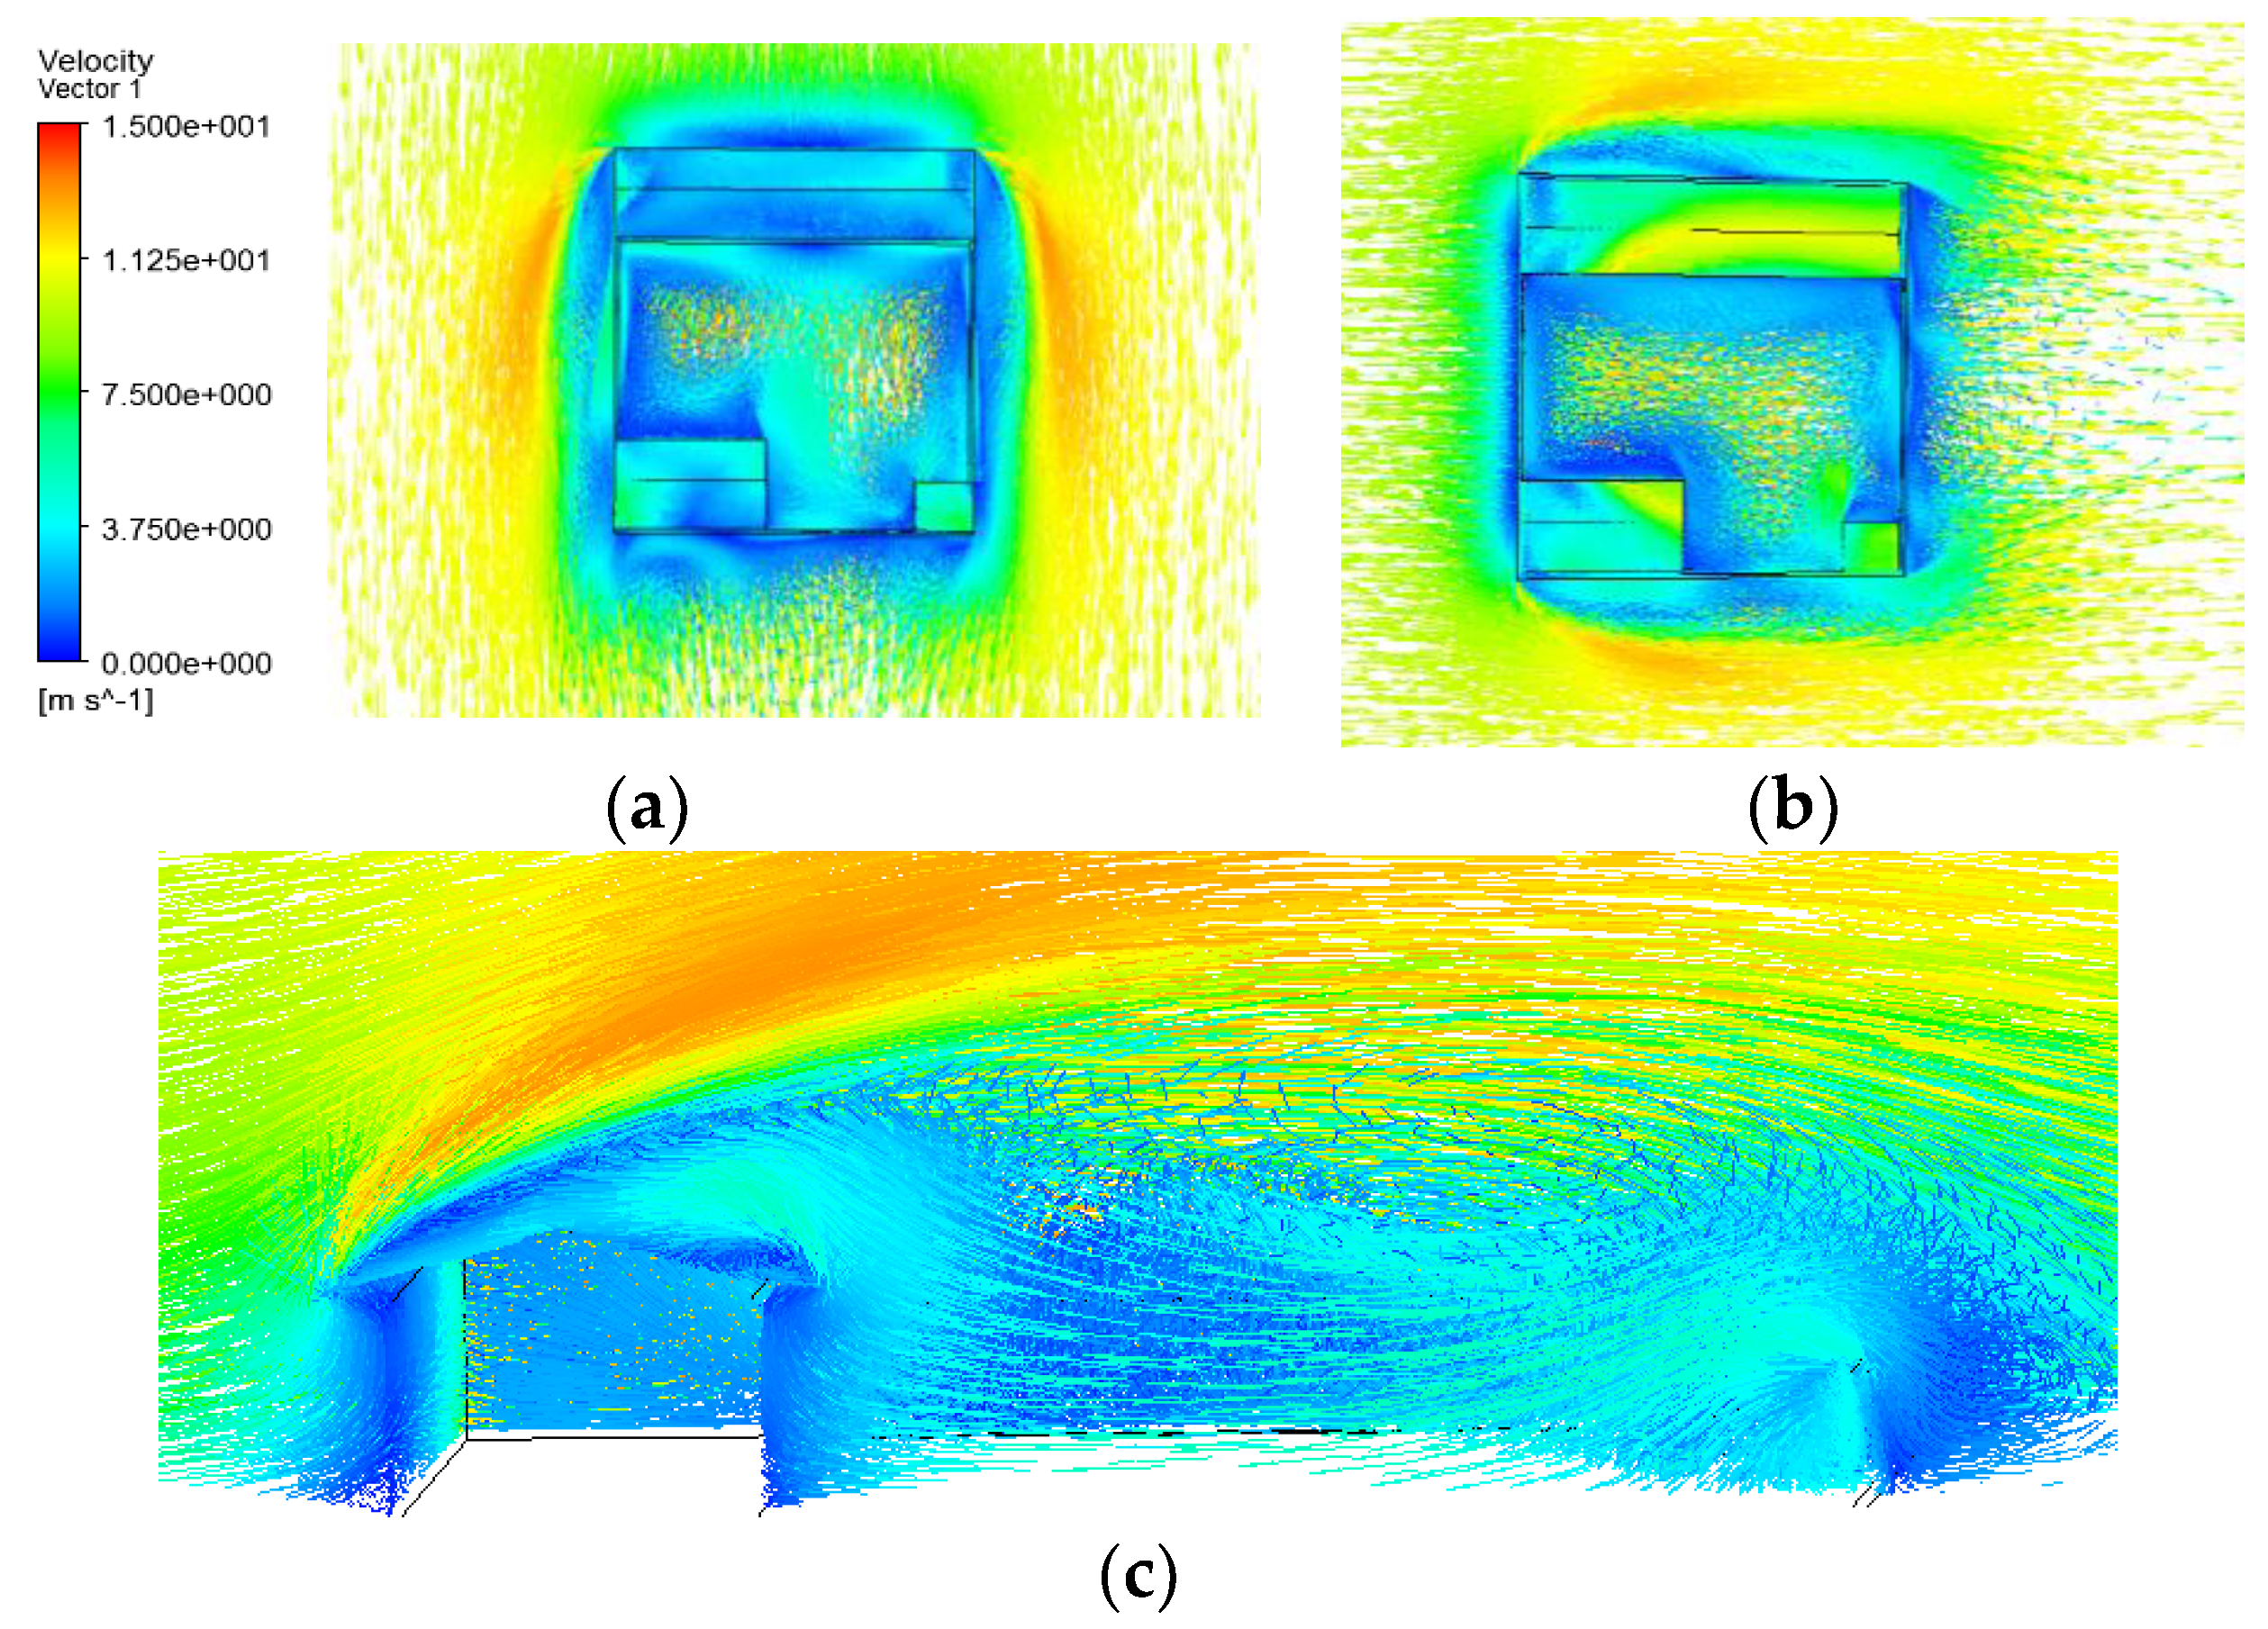
North and west wind velocities around the buildings are shown in Figure 10a,b. Also, a sectional view of the velocity distribution in the north wind simulation is shown in Figure 10c.
It can be seen from Figure 10 that the wind velocities around the building in the north wind is smaller than that in the west wind. Wind velocities on the top of the roof are much higher in the west wind than that in the north wind.
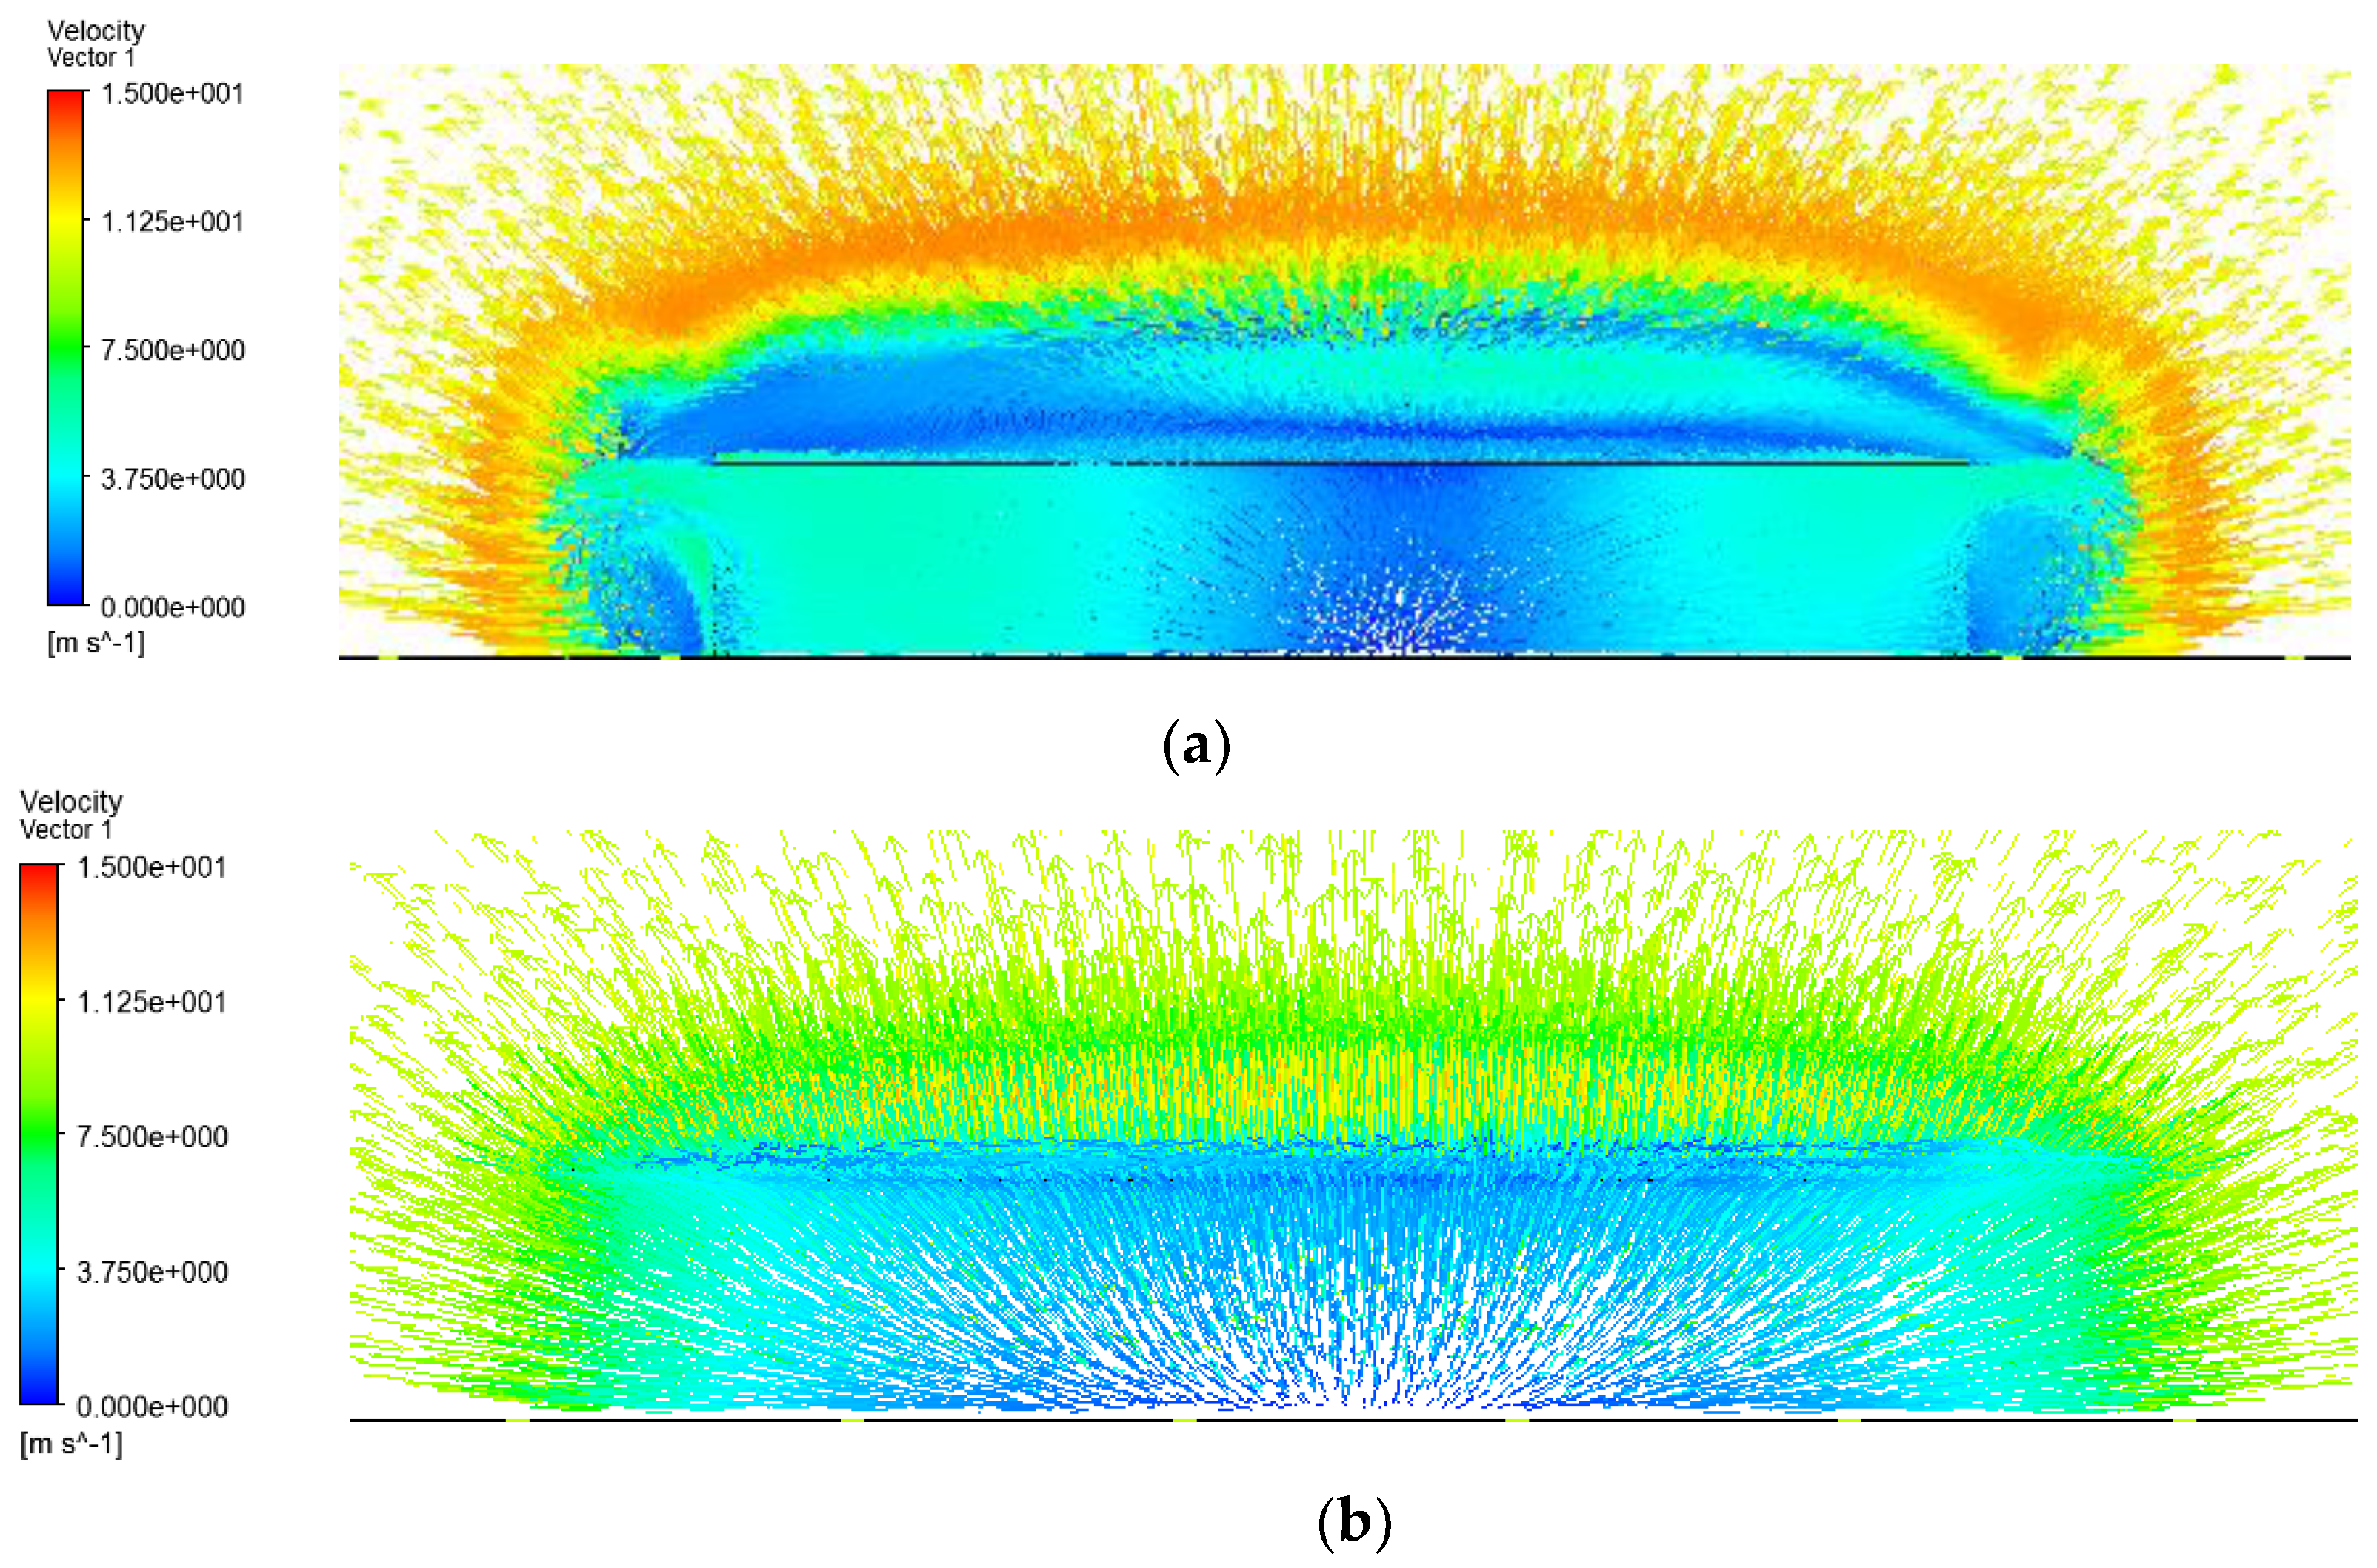
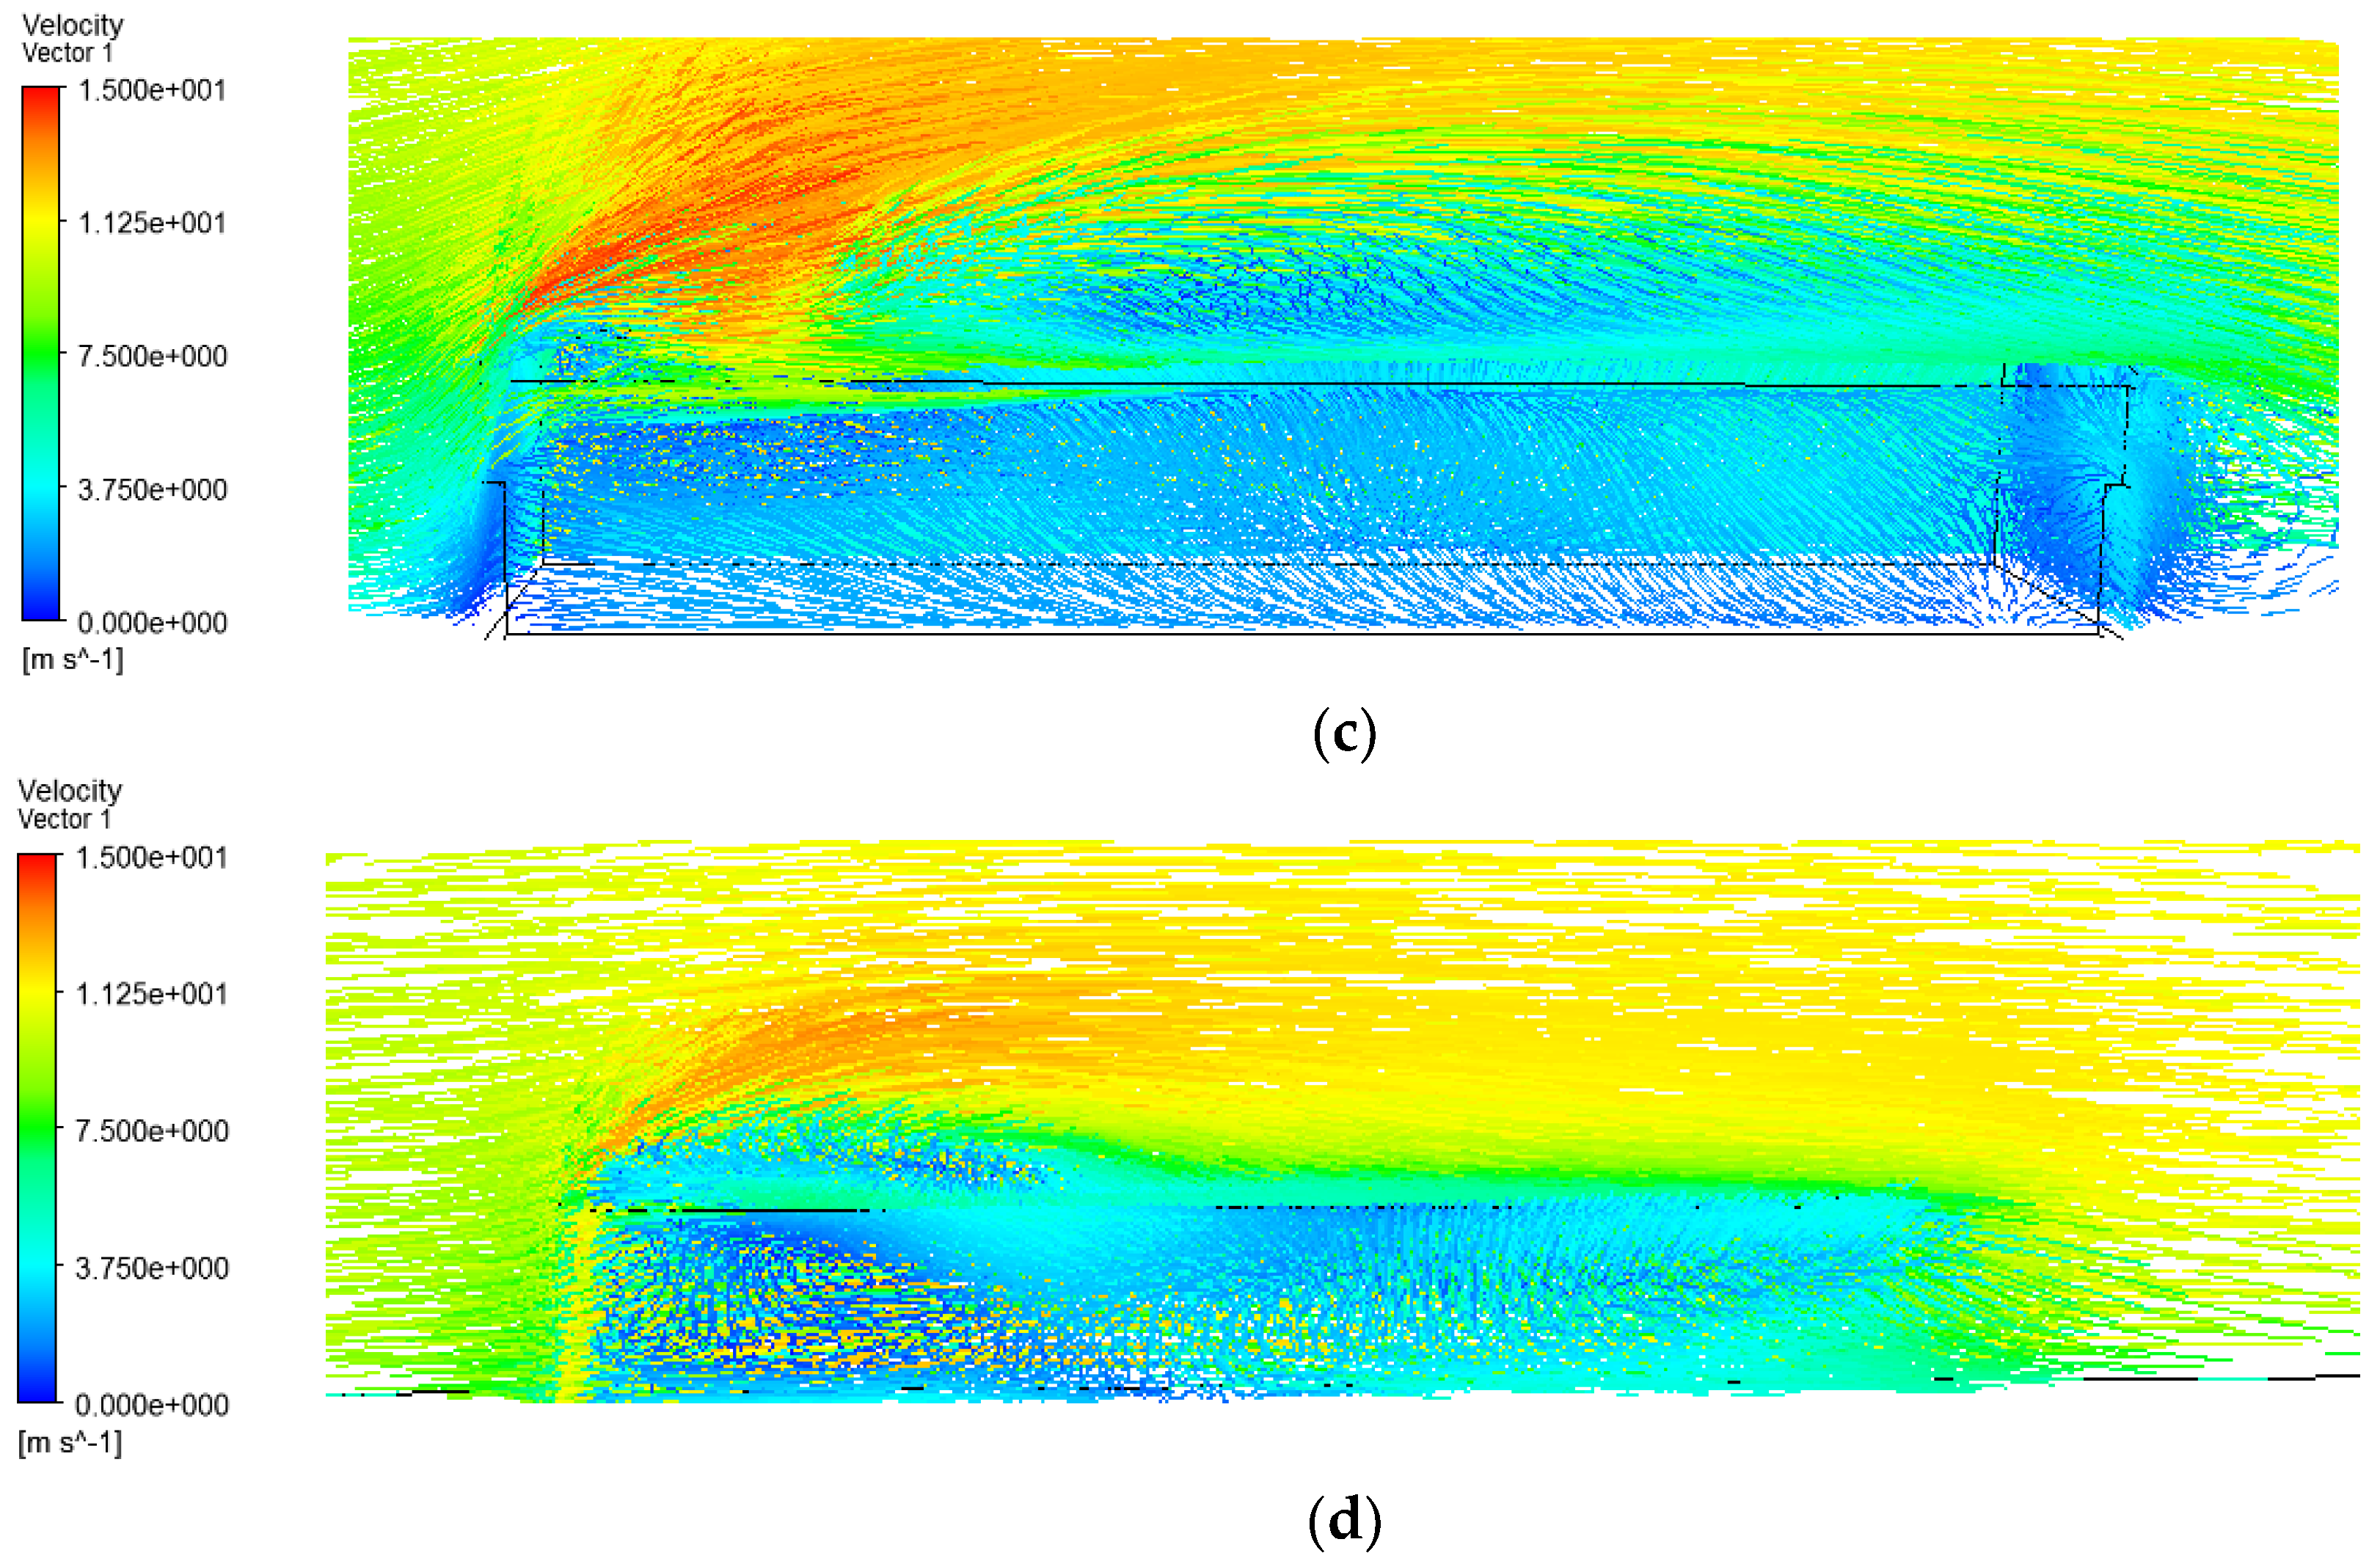
The wind velocities at 0.5 m from the south and north wall surfaces are presented in Figure 11a,b in the north wind simulations, respectively. The velocities at 0.5 m from the south wall vary from 1.1 to 4.0 m/s. The velocities at 0.5 m from the north wall vary from 1.2 to 6 m/s. The wind velocities at 0.5 m from the south wall surface in the west wind are also shown in Figure 11c, which vary from 2.5 to 3.5 m/s. However, the wind velocities at 0.5 m from the north wall surface in the west wind, as shown in Figure 11d, vary from 2.2 to 5.8 m/s.
4. Discussion
As Shan et al. [8] reported, a comfortable indoor temperature is around 15 °C in rural areas in northern China in contrast to 20 °C in urban areas because rural occupants wear thick clothing and move in and out rooms more frequently. From the measured data shown in Figure 6, the indoor temperature is much lower than 15 °C, except at 4:00 p.m. The indoor average temperature of the main bedroom is 9.48 °C, which is only 63% of 15 °C, in secondary rooms, and the indoor average temperature is 4.02 °C, which is only 26.8% of 15 °C. As reported by Santamouris et al. [30], there are several national and international standards which define comfortable indoor temperatures, and they are in the range of 18–21 °C. Therefore, the indoor temperature was quite low in the current study, and low indoor temperatures have a great impact and effect on various illness. In 2000, Clinch and Healy [31] studied housing standards and excess winter mortality in Ireland and Norway. They reported that relative excess winter mortality from cardiovascular and respiratory diseases in Ireland was higher than that in Norway. A possible explanation for this may be due to poorer Irish housing standards than those in Norway and that the indoor temperature was greatly impacted by falls of outdoor temperature. Zhao et al. [32] recently studied the effect of cold temperatures on clinical visits for cardiorespiratory diseases in the Ningxia Hui Autonomous Region, the same region as this study. They collected cardiovascular and respiratory illness data from 203 villages between 1 January 2012 and 31 December 2015. The average temperature in the 203 villages was 8.5 °C. They concluded that the overall suboptimal temperatures were responsible for 13.1% of total clinic visits for cardiovascular illness, and 25.9% of total clinic visits for respiratory disorders. From Figure 8 and Figure 9, it can be seen that most of the heat loss from the main bedroom is through the north and south walls, windows, and doors. Paolini et al. [33] studied the hydrothermal performances of residential buildings at urban and rural sites and found that the most significant differences between urban and rural indoor conditions were related to the moisture levels, as computed by the indoor Humidex index. With the lower average temperature of 9.48 °C in the main bedroom and a variation of about 10 °C within 24 h, the relative humidity in the indoor environment fluctuates, and the effect of this will be studied in future work.
It can be concluded from Figure 6 that from 8:30 am to 5:00 pm, the outdoor temperature is on the rise, while from 5:00 pm to 8:30 am the next day, the outdoor temperature shows a decreasing trend. From 10:00 a.m. to 4:00 p.m., the temperature in the main bedroom increased from 7 to 15.0 °C in 6 h, and the temperature change rate was 1.0 °C/h. From 12:00 to 6:00 a.m., the indoor temperature of the main bedroom reduced from 8.0 to 6.4 °C in 6 h, and the temperature change rate was −0.27 °C/h. However, during the same period, the corresponding outdoor temperature change rates were 1.25 and −0.75 °C/h, respectively. The higher indoor temperature rise rate between 10:00 a.m. and 4:00 p.m. can be explained by the heating contribution from solar radiation, which is shown in Figure 7. The slower indoor temperature decreasing rate is due to the energy stored in the wall. The surface temperature of the west side wall of the main bedrooms was lower than the room temperature between 10:00 a.m. and 6:00 p.m., however, it was reversed between 7:00 p.m. and 10:00 a.m. the following day. It is evident that the walls transfer their stored energy to the room. As reviewed by Navarro et al. [34], high thermal mass materials in buildings can provide thermal stability and smooth thermal fluctuations. Yang et al. [35] pointed out that using a thermal storage medium to utilize solar energy is a relatively simple, economical, and reliable way to improve the building thermal environment.
It is interesting to note here that there was no coal stove in the second bedroom; the heat sources were solar radiation energy and the heat from the internal walls adjacent to the main bedroom. The solar radiation intensity is shown in Figure 7. It can be seen that the maximum of solar radiation occurred at 1:00 p.m. and the higher values of radiation were between 12:00 and 2:00 p.m. The air temperature in the second bedroom increased from 1.2 to 7.8 °C, a notable increase of 6.8 °C, between 10:00 a.m. and 2:00 p.m. This building is in one of the richest regions in terms of solar resources in China [23], so solar radiation certainly needs to be considered and explored further in building designs.
To further analyze the contribution of solar radiation in room space heating, the analysis of the heat flow rate of the second bedroom shows that there is more heat leaving the second room than is gained from the main bedroom through the internal wall. From the calculations of heat flow rate, the net heat flow rate out of the second bedroom is 205.2 W. Because the average indoor and outdoor temperatures were used in the simulation, the average solar energy gained by the second bedroom should be at least 205.2 W, which is about 3.7 times the energy gained from the internal wall which is adjacent to the main bedroom. This means that solar radiation plays a big role in maintaining the higher temperature in the second bedroom than the outdoor temperature.
The average surface temperature of the west side wall of the main bedroom is 9.45 °C, which is very close to the average air temperature of 9.48 °C in the main bedroom. This can be explained by the location of the coal stove which was close the west side of the main bedroom, as seen in Figure 2. The simulated wall surface temperature as shown in Figure 8 was about 2 °C less than that of the main bedroom temperature; this is due to the omission of the radiation effect of the coal stove on the wall surface temperatures.
Rural buildings in northern China have a unique style. Courtyards are often open and main buildings face south, which can maximize the exposure of the walls and windows of the building to the sun and reduce the velocity of cold northern winds. It is evident from the simulations and analysis that a great amount of solar energy is absorbed by the building. From the simulation results shown in Figure 10 and Figure 11, the building and the enclosures reduce the wind velocities in the courtyard. When the building is south facing, not only is the solar radiation energy absorbed by the room, it can be seen that the wind velocity on the roof of the building in the north wind is much less than that in the west wind, and the wind velocity is reduced greatly in the front of the main bedroom. The north wind is the dominate wind in the region; therefore, south-facing buildings should be constructed.
When a north wind velocity of 10 m/s was simulated, it was found that the wind velocities at 0.5 m from the building in the south of the building varied from 1.1 to 4 m/s. The convective heat transfer coefficients obtained from Equation (6) are 4.37 to 8.92 W/m2·K, which will affect the heat transfer rate in individual rooms in the building. Therefore, to accurately predict the heat flow rate in the building, numerical simulations can help determine the convective heat transfer coefficients at various points in the building. The simulation results echo the findings by Montazeri et al. [20] that a wider building has more impact on wind blocking.
It can be seen from Figure 6 that the temperature of the main bedroom dropped below 10 °C between 9:00 p.m. and 10:00 a.m. on the following day. To maintain a comfortable indoor temperature in a rural residential building, more energy needs to be consumed. With growing concerns about energy consumption, builders and owners want to design and build energy efficient buildings in rural China. Because most of the heat is lost through the south and north walls of the main bedroom, it is important to show the builders and owners the benefits of using insulation materials and increasing wall thickness, even if this may incur additional costs to the initial budget. Studies suggest that insulation board or double-glazed windows could be installed to reduce heat loss, as shown in the paper. Since energy is so important in maintaining a comfortable thermal environment for occupants, to minimize the building energy used while choosing building envelopes and insulation materials, their environmental impact also needs to be considered. Huedo et al. [36] provided a sustainability evaluation model based on a lifecycle assessment for different envelope assemblies, building orientations, and climate zones. Making buildings more energy efficient will be an evolution process in rural China since people are not used to changing windows or installing insulation materials on existing buildings. Santamouris et al. [30] showed that the indoor temperature in dwellings of very-high-deprivation residents in Athens, Greece was very low, with an average temperature of 12.2 °C, and that the thermal quality of the building envelope was low. They suggested improving the thermal performance of low-income houses to improve indoor environmental quality. To address energy poverty and improve building energy efficiency, as suggested by He et al. [37], some easy methods could be used in rural cold regions, Including improving the tightness of doors and windows and reducing window and door cold bridges such as by coating wood doors with heat preservation materials. Heat transfer through the roof and floors are usually overlooked in rural regions, and a sloping roof tends to have better insulation effect than a flat roof. Further, moisture-proofing and insulation design under the floors can reduce heat loss. Other measures for reducing energy consumption could be optimizing the length/with ratio and shape coefficient of rural buildings.
5. Conclusions
The typical rural residential building studied in this paper has its merits. Its south-facing layout is not only able to absorb solar radiation during the winter, it also can reduce north wind velocities around the building. The wind blocking effect can then reduce the convective heat transfer coefficients and minimize heat loss. The computer simulations can predict the velocity distributions of the wind around the building, from which the function of the rooms or the layout of the building could be optimized. The good practice of constructing south-facing buildings and enclosures in rural areas should be promoted with the demonstrated benefits in this study. The solar energy absorbed by the room raised the room temperature around 7 °C above the outdoor average temperature, so solar energy should be maximized in the area for space heating. Heat loss from the room also can be minimized by using double-glazed windows and insulation boards, which should be considered and used in new residential buildings. To conduct heat flow rate calculations in the building energy efficiency analysis, computational fluid dynamics should be used to obtain the convective heat transfer coefficient at different locations.
Author Contributions
Funding acquisition, Y.Z.; Methodology, Y.Z. and G.S.; Investigation, X.F. and G.S.; Modelling, C.W.; Preparing the manuscript, X.F. and C.W.
Acknowledgments
This research was funded by the National Natural Science Foundation of China, grant number [51678483], and the APC was funded by [51678483].
Conflicts of Interest
The authors declared no conflicts of interest.
References
- UNEP SBCI. Buildings and Climate Change, Summary for Decision-Makers; United Nations Environment Programme: Paris, France, 2009. [Google Scholar]
- Aksoezen, M.; Daniel, M.; Hassler, U.; Kohler, N. Building age as an indicator for energy consumption. Eng. Build. 2015, 87, 74–86. [Google Scholar] [CrossRef]
- Clarke, J.A.; Johnstone, C.M.; Kelly, N.J.; Strachan, P.A.; Tuohy, P. The role of built environment energy efficiency in a sustainable UK energy economy. Energy Policy 2008, 36, 4605–4609. [Google Scholar] [CrossRef] [Green Version]
- Akadiri, P.O.; Chinyio, E.A.; Olomolaiye, P.O. Design of a sustainable building: A conceptual framework for implementing sustainability in the building sector. Buildings 2012, 2, 126–152. [Google Scholar] [CrossRef]
- Ortiz, O.; Castells, F.; Sonnemann, G. Sustainability in the construction industry: A review of recent of recent developments based on LCA. Build. Mater. 2009, 23, 28–39. [Google Scholar] [CrossRef]
- Li, K.Q. Inclusive Development: A Better World for All. British Think Tanks, 18 June 2014. [Google Scholar]
- Evans, M.; Yu, S.; Song, B.; Deng, Q.Q.; Liu, J.; Delgado, A. Building energy efficiency in rural China. Energy Policy 2014, 64, 243–251. [Google Scholar] [CrossRef]
- Shan, M.; Wang, P.S.; Li, J.; Yue, J.; Yang, X. Energy and environment in Chinese rural buildings: Situations, challenges, and intervention strategies. Build. Environ. 2015, 91, 271–282. [Google Scholar] [CrossRef]
- Liu, J.P.; Wang, L.Y.; Yoshino, Y.; Liu, Y.F. The thermal mechanism of warm in winter and cool in summer in China traditional vernacular dwellings. Build. Environ. 2011, 46, 1709–1715. [Google Scholar] [CrossRef]
- Liu, Y.Y.; Jiang, J.; Wang, D.J.; Liu, J.P. The indoor thermal environment of rural school classrooms in Northwestern China. Indoor Built Environ. 2017, 25, 631–641. [Google Scholar] [CrossRef]
- Liu, Y.Y.; Song, C.; Zhou, X.J.; Liu, J.P. Thermal requirements of the sleeping human body in bed warming conditions. Eng. Build. 2016, 130, 709–720. [Google Scholar] [CrossRef]
- Roberts, D.; Vera-Toscano, E.; Phimister, E. Fuel poverty in the UK: Is there a difference between rural and urban areas? Energy Policy 2015, 87, 216–223. [Google Scholar] [CrossRef] [Green Version]
- Bouzarovski, S.; Petrova, S.; Sarlamanov, R. Energy poverty policies in the EU: A critical perspective. Energy Policy 2012, 49, 76–82. [Google Scholar] [CrossRef]
- Healy, J.D.; Clinch, J.P. Fuel poverty thermal comfort and occupancy: Results of a national household-survey in Ireland. Appl. Energy 2002, 73, 339–343. [Google Scholar] [CrossRef]
- Fan, X.N.; Zhu, Y.Y.; Sang, G.C. Optimization design of enclosure structure of solar energy building in Northwest China based on indoor zoning. In Proceedings of the 2017 6th International Conference on Energy and Environmental Protection, Zhuhai, China, 30 June–2 July 2018; Atlantis Press: Hong Kong, China, 2017; Volume 143, pp. 30–40. [Google Scholar]
- Boeck, L.D.; Verbeke, S.; Audenaert, A.; Mesmaeker, L.D. Improving the energy performance of residential buildings: A literature review. Renew. Sustain. Energy Rev. 2016, 52, 960–975. [Google Scholar] [CrossRef]
- Mitterer, C.; Kunzel, HM.; Herkel, S.; Holm, A. Optimizing energy efficiency and occupant comfort with climate specific design of the building. Front. Archit. Res. 2012, 1, 229–235. [Google Scholar] [CrossRef]
- Wang, D.J.; Jiang, J.; Liu, Y.F.; Wang, Y.Y.; Xu, Y.C. Student responses to classroom thermal environment in rural primary and secondary schools in winter. Build. Environ. 2017, 115, 104–117. [Google Scholar] [CrossRef]
- Hemsath, T.L.; Bandhosseini, K.A. Sensitivity analysis evaluating basic building geometry’s effect on energy use. Renew. Energy 2015, 76, 526–538. [Google Scholar] [CrossRef]
- Montazeri, H.; Blocken, B.; Derome, D.; Carmeliet, J.; Hensen, J.L.M. CFD analysis of forced convective heat transfer coefficients at windward building facades: Influence of building geometry. J. Wind Eng. Ind. Aerodyn. 2015, 146, 102–116. [Google Scholar] [CrossRef] [Green Version]
- Hassanain, A.A.; Hokam, E.M.; Mallick, T.K. Effect of solar storage wall on the passive solar heating construction. Eng. Build. 2011, 43, 737–747. [Google Scholar] [CrossRef]
- Pisello, A.L.; Pignatta, G.; Piselli, C.; Castaldo, V.L.; Cotana, F. Effect of dynamic characteristics of building envelope on thermal-energy performance in winter conditions: In field experiment. Energy Build. 2014, 80, 218–230. [Google Scholar] [CrossRef]
- Zhang, Q.Y.; Joe, H. Chinese Standard Weather Databank for Buildings; Machine Industry Press: Beijing, China, 2014. (In Chinese) [Google Scholar]
- Obyn, S.; Van, M.G. Variability and impact of internal surfaces convective heat transfer coefficients in the thermal evaluation of office buildings. Appl. Therm. Eng. 2015, 97, 258–272. [Google Scholar] [CrossRef]
- Awbi, H.B.; Hatton, A. Natural convection from heated room surfaces. Energy Build. 1999, 30, 233–244. [Google Scholar] [CrossRef]
- Hagishima, A.; Tanimoto, J. Field measurements for estimating the convective heat transfer coefficient at building surface. Build. Environ. 2003, 38, 873–881. [Google Scholar] [CrossRef]
- Mirsadeghi, M.; Costola, D.; Blocken, B.; Hensen, J.L.M. Review of external convective heat transfer coefficient models in building energy simulation programs: Implementation and uncertainty. Appl. Therm. Eng. 2013, 56, 134–151. [Google Scholar] [CrossRef]
- Liu, Y.; Harris, D.J. Full-scale measurements of convective coefficient on external surface of a low-rise building in sheltered conditions. Build. Environ. 2007, 42, 2718–2736. [Google Scholar] [CrossRef]
- Ramponi, R.; Blocken, B. CFD simulation of cross-ventilation for a generic isolated building: Impact of computational parameters. Build. Environ. 2012, 53, 34–48. [Google Scholar] [CrossRef] [Green Version]
- Santamouris, M.; Alevizos, S.M.; Aslanoglou, L.; Mantzios, D.; Milonas, P.; Sarelli, I.; Karatasou, S.; Cartalis, K.; Paravantis, J.A. Freezing the poor-indoor environmental quality in low and very low income households during the winter period in Athens. Energy. Build. 2014, 70, 61–70. [Google Scholar] [CrossRef]
- Clinch, J.P.; Healy, J.D. Housing standards and excess winter mortality. J. Epidemiol. Community Health 2000, 54, 719–720. [Google Scholar] [CrossRef] [PubMed] [Green Version]
- Zhao, Q.; Zhao, Y.; Li, S.; Zhang, Y.; Wang, Q.; Zhang, H.; Qiao, H.; Li, W.; Huxley, R.; Williams, G.; et al. Impact of ambient temperature on clinical visits for cardio-respiratory diseases in rural villages in northwest China. Sci. Total Environ. 2018, 612, 379–385. [Google Scholar] [CrossRef] [PubMed]
- Paolini, R.; Zani, A.; MeshkinKiya, M.; Castaldo, V.L.; Pisello, A.L.; Antretter, F.; Poli, T.; Cotana, F. The hydrothermal performance of residential buildings at urban and rural sites: Sensible and latent energy loads and indoor environmental conditions. Energy Build. 2017, 152, 792–803. [Google Scholar] [CrossRef]
- Navarro, L.; Gracia, A.D.; Colclough, S.; Browne, M.; Mccormack, S.J. Thermal energy storage in building integrated thermal systems: A review. Part 2. Integration as passive system. Renew. Energy 2016, 85, 1334–1356. [Google Scholar] [CrossRef] [Green Version]
- Yang, L.; He, B.J.; Ye, M. The application of solar technologies in building energy efficiency: BISE design in solar-powered residential buildings. Technol. Soc. 2014, 38, 111–118. [Google Scholar] [CrossRef]
- Huedo, P.; Mulet, E.; Lopez-Mesa, B. A model for the sustainable selection of building envelope assemblies. Environ. Impact Assess. Rev. 2016, 57, 63–77. [Google Scholar] [CrossRef] [Green Version]
- He, B.J.; Yang, L.; Ye, M. Building energy efficiency in China rural areas: Situation, drawbacks, challenges, corresponding measures and policies. Sustain. Cities Soc. 2014, 11, 7–15. [Google Scholar] [CrossRef]
Figure 1.
A typical residential building in Ningxia.

Figure 2.
The inside situation of the main bedroom.

Figure 3.
Layout of the residential building.

Figure 4.
(a) Finite element model of the building (plan view) and (b) finite element mesh of the internal partition wall.
Figure 4.
(a) Finite element model of the building (plan view) and (b) finite element mesh of the internal partition wall.

Figure 5.
(a) Fluid domain and (b) meshes around the building in the simulation.

Figure 6.
Indoor and outdoor temperatures of the residential building.

Figure 7.
Solar radiation intensity outside the residential building.

Figure 8.
Temperature distributions in the walls with natural convection on the surface.

Figure 9.
Heat flux through the walls under the free convection simulation.

Figure 10.
Wind velocity around the building: (a) north wind, (b) west wind, and (c) sectional view of velocity distribution in the north wind.
Figure 10.
Wind velocity around the building: (a) north wind, (b) west wind, and (c) sectional view of velocity distribution in the north wind.

Figure 11.
Wind velocities at 0.5 m to the walls of the building: (a) south wall in the north wind, (b) north wall in the north wind, (c) south wall in the west wind, and (d) north wall in the west wind.
Figure 11.
Wind velocities at 0.5 m to the walls of the building: (a) south wall in the north wind, (b) north wall in the north wind, (c) south wall in the west wind, and (d) north wall in the west wind.


Table 1.
Models and parameters of the measuring instruments.
| Test Instrument | Type | Test Parameters | Range | Accuracy |
|---|---|---|---|---|
| Solar radiometer | JTDL-4 | Solar radiation intensity | 0–2000 W/m2 | ±0.2 °C |
| Thermometer and hydrometer | TESTO175-H | Air temperature | −20 to 70 °C | ±0.1 °C |
| Envelope structure heat transfer coefficient detector | JTNT-C | Interior wall surface temperature | −20 to 85 °C | ±0.2 °C |
| Hot wire anemometer | Testo425 | Air velocity | 0–20 m/s | ±0.03% |
Table 2.
Thermal conductivities of materials.
| Material | Thermal Conductivity (W/m·K) |
|---|---|
| Solid clay brick | 0.81 |
| Mortar plasters | 0.93 |
| Glass | 1.3 |
| Door (PVC) | 0.19 |
| Air | 0.024 |
© 2018 by the authors. Licensee MDPI, Basel, Switzerland. This article is an open access article distributed under the terms and conditions of the Creative Commons Attribution (CC BY) license (http://creativecommons.org/licenses/by/4.0/).
Share and Cite
MDPI and ACS Style
Zhu, Y.; Fan, X.; Wang, C.; Sang, G. Analysis of Heat Transfer and Thermal Environment in a Rural Residential Building for Addressing Energy Poverty. Appl. Sci. 2018, 8, 2077. https://0-doi-org.brum.beds.ac.uk/10.3390/app8112077
AMA Style
Zhu Y, Fan X, Wang C, Sang G. Analysis of Heat Transfer and Thermal Environment in a Rural Residential Building for Addressing Energy Poverty. Applied Sciences. 2018; 8(11):2077. https://0-doi-org.brum.beds.ac.uk/10.3390/app8112077
Chicago/Turabian StyleZhu, Yiyun, Xiaona Fan, Changjiang Wang, and Guochen Sang. 2018. "Analysis of Heat Transfer and Thermal Environment in a Rural Residential Building for Addressing Energy Poverty" Applied Sciences 8, no. 11: 2077. https://0-doi-org.brum.beds.ac.uk/10.3390/app8112077
Note that from the first issue of 2016, this journal uses article numbers instead of page numbers. See further details here.