Article

A Fully Coupled Computational Fluid Dynamics Method for Analysis of Semi-Submersible Floating Offshore Wind Turbines Under Wind-Wave Excitation Conditions Based on OC5 Data

Faculty of Wind Energy Engineering Graduate School, Jeju National University, Jeju City 63243, Korea
*
Author to whom correspondence should be addressed.
Submission received: 27 September 2018 / Revised: 15 November 2018 / Accepted: 16 November 2018 / Published: 20 November 2018
(This article belongs to the Special Issue Wind Turbine Aerodynamics)

Abstract

:
Accurate prediction of the time-dependent system dynamic responses of floating offshore wind turbines (FOWTs) under aero-hydro-coupled conditions is a challenge. This paper presents a numerical modeling tool using commercial computational fluid dynamics software, STAR-CCM+(V12.02.010), to perform a fully coupled dynamic analysis of the DeepCwind semi-submersible floating platform with the National Renewable Engineering Lab (NREL) 5-MW baseline wind turbine model under combined wind–wave excitation environment conditions. Free-decay tests for rigid-body degrees of freedom (DOF) in still water and hydrodynamic tests for a regular wave are performed to validate the numerical model by inputting gross system parameters supported in the Offshore Code Comparison, Collaboration, Continued, with Correlations (OC5) project. A full-configuration FOWT simulation, with the simultaneous motion of the rotating blade due to 6-DOF platform dynamics, was performed. A relatively heavy load on the hub and blade was observed for the FOWT compared with the onshore wind turbine, leading to a 7.8% increase in the thrust curve; a 10% decrease in the power curve was also observed for the floating-type turbines, which could be attributed to the smaller project area and relative wind speed required for the rotor to receive wind power when the platform pitches. Finally, the tower-blade interference effects, blade-tip vortices, turbulent wakes, and shedding vortices in the fluid domain with relatively complex unsteady flow conditions were observed and investigated in detail.

1. Introduction

Energy generation from offshore wind farms has been garnering the attention of researchers, owing to the abundance of resources and low environmental impact. Compared to offshore wind turbines in shallow water, floating offshore wind turbines (FOWTs) have more advantages [1]; i.e., there are several deep-water sites suitable for installing turbines, wind is more abundant in offshore areas, and public concerns on the visual and environmental impacts are minimized with this technology. Some floating wind farms have been established; for instance, the first full-scale 2.3-MW FOWT was installed in Hywind near the coast of Norway, and last year, five 6-MW FOWTs were installed in the North Sea off the coast of Peterhead, Scotland.
However, it is difficult and expensive to operate a real-scale test model and accurately calculate critical loads because the complex multi-physical phenomena are not easy to simulate in reality. In addition, this technology is dependent on extreme weather situations (such as 25 m/s cut-out speeds). Thus, the use of computational methods, involving virtual full-scale modeling, may increase the development of the controllers’ reliability (such as structure and loads) of FOWTs, reduce the risks involved, and build confidence in the design stage. Among the codes used, one of the most famous ones is the Fatigue, Aerodynamics, Structures, and Turbulence code (FAST), which was developed by the National Renewable Engineering Lab (NREL) based on the blade element momentum (BEM) theory [2]. However, the BEM theory is seldom applied in FOWT situations owing to its theoretical limitation. In contrast, the fluid structure interaction (FSI) simulations, as a modern computational analysis method, has proven to be an accurate and convincing method for considering aero-hydro-servo-elastic problems; however, complex fluid conditions and blade deformation presents significant computational challenges.
Further, correctly simulating the movement of floaters on free surfaces is also a major challenge; many researchers from different institutions have developed various codes and solvers to simulate the hydrodynamic performance of floaters. Nearly all solvers are based on the following theories: the potential-based panel approach and Morrison equation. The former cannot determine viscous flow details and is usually used together with the damping coefficient obtained from experimental test data. The FAST code HydroDyn module has applied this method. The Morison equation is a semi-empirical equation; this equation mainly describes the inline force in oscillatory flow conditions; this also has theoretical limitations and it cannot adequately describe the time-dependent force. Examples include the wave analysis MIT (WAMIT), TimeFloat, and CHARM3D. However, there are still some physical phenomena that cannot be fully described. Conversely, the unsteady computational fluid dynamics (CFD) approach can simulate with consideration of all physical effects, including flow viscosity, hydrostatic forces, wave diffraction, radiation, wave run-up, and slamming and provide reliable and accurate results regarding the platform movement.
Owing to the reasons mentioned above, the CFD method is widely considered an effective and reliable method to simulate the FOWT problem; to date, several CFD-related investigations have been performed. However, previous studies have used the following methods, ignoring some effects, leading to inaccurate results. First, to investigate the hydrodynamic load and motion response of a platform on an FOWT, some studies just simplified the problem into wind turbine aerodynamic loading or ignored the tower and rotor-nacelle-assembly. Second, some studies focused on aerodynamic loading but restricted the motion of the floating platforms to a prescribed position or did not allow the platform to move with 6 DOF.
Unai Fernandez-Gamiz et al. [3] developed an improved BEM-based solver to verify the NREL 5-MW wind turbine and determined the bending moment and thrust force in the blade root; they also investigated rectangular sub-boundary layer vortex generators using the CFD method [4], which showed the highest vortex generator suitable for separation control. Nematbakhsh et al. [5] developed a CFD spar model and successfully captured strong nonlinear effects, which cannot be captured using the FAST code. Furthermore, their study also observed that when the wave amplitude was large, a discrepancy could exist between CFD and FAST. Vaal et al. [6] used the BEM method to investigate the surge motion of FOWTs. This showed that the BEM method could only provide a reasonable solution under slow surge motion conditions; this is because, in this condition, the wake dynamics can be ignored. Zhao and Wan [7] used a Naoe-FOAM-SJTU simulated OC4 platform to study the effects of the presence of wind turbines. They carried out platform pitch motions at high wind speeds and investigated the wind turbine effect on the floating platform. Tran et al. [8] set the platform to execute a prescribed sinusoidal pitching motion and changed the motion amplitudes and frequencies, instead of modeling a floating platform with 6 DOF using the unsteady BEM theory, generalized dynamic wake (GDW), and CFD; large discrepancies were observed when the pitch amplitude increased to 4°. Tran et al. [9] analyzed an FOWT system under a prescribed sinusoidal surge motion, and found that thrust and power varied significantly, which is related to the oscillation frequency; the surge motion amplitude also varied significantly. Liu et al. [10] superimposed three DOF platform motions (surge, heave, and pitch) and concluded that the platform motion significantly impacted the thrust and torque of the wind turbine. Ren et al. [11] used FLUENT analysis for a 5-MW tension-leg-platform-type turbine under coupled wave-wind conditions and validated the simulation results against experimental data. They only considered the surge motion and concluded that during the variation in the average/mean surge response of the system, aerodynamic forces played the main role. Quallen et al. [12] performed a CFD simulation involving an OC3 spar-type FOWT model under wind–wave excitation conditions. The mean surge motion predicted using the CFD model was 25% less than that predicted using FAST. Tran and Kim [13] modeled an OC4 semi-submersible FOWT using the dynamic fluid body interaction (DFBI) method and an overset mesh technique under wind–wave excitation conditions. A good overall agreement was found between the CFD results and FAST data. Both codes used the quasistatic method for modeling the mooring lines. S. Gueydon et al. [14] modeled a semi-submersible platform using the aNyPHATAS code to investigate operating rotor effects on drift motions and additional damping. Chen et al. [15] modeled a semi-submersible FOWT with two different blade configurations in a wave basin to further optimize the blade design for FOWTs. A.J. Dunbar et al. [16] developed an open-source CFD/6-DOF solver based on OpenFOAM and compared rotational and translational motions with FAST, demonstrating the accuracy of this tightly coupled solver.
The main purpose of this study was to conduct a virtual test of a real-scale 5-WM semi-submersible FOWT using the advanced CFD method. The hydrodynamic responses were validated using the latest physical test data of the Offshore Code Comparison, Collaboration, Continued, with Correlations (OC5) projects. Full-configuration FOWT simulations, simultaneously considering the rotating blade motion with 6-DOF platform dynamics were performed; a relatively large discrepancy in the predicted power was observed owing to the different properties of the mooring line and rotating inertia moment between the OC4 and OC5 projects. This proves the high infinity result of OC5 project. Further, this study may provide some reference for the validation of the CFD method for use in the OC5 Phase II system and high-fidelity simulation investigations of FOWTs in coupled aero-hydro conditions.
The OC5 DeepCWind semi-submersible floating wind turbine model was used for the investigation, which is briefly described in Section 2. The numerical methods used in the study are introduced in Section 3. The aerodynamic validation studies performed using different modeling tools are briefly presented in Section 4. Section 5 presents the results of the dynamic responses of the floating system under regular wave conditions. Section 6 presents the simulation results of the fully coupled configuration. Section 7 presents the conclusions of the study.

2. Floating Offshore Wind Turbine Model

2.1. Model Description

A semi-submersible FOWT tested in Phase II of the OC5 project was investigated. The design parameters of the full-scale OC5 DeepCWind semi-submersible platform are summarized in Table 1. The NREL 5-MW baseline wind turbine model was set above the tower, 87.6 m from the water surface; we used airfoil data from the DOWEC project, which is also mentioned in Jonkman’s work [1] from NREL. The major properties of the NREL 5-MW baseline wind turbine are given in Table 2; the cross-sections of the rotor blade were composed of a series of Delft university of technology (DU) and national advisory committee for aeronautics (NACA) 64 airfoils from the hub to the tip of the outboard section. The computer-aided design (CAD) model of the blade was first developed using Solidworks software (Dassault systems, Velizy-Villacoublay, France), as shown in Figure 1. Except for the cylinder in the blade root and transition section, the control airfoil spread along the blade includes the DU series airfoil from 40% to 21% thickness and a NACA airfoil of 18% thickness. Details concerning the wind blade aerodynamics including the blade twist, chord length, and airfoil designation are presented in Table 3.

2.2. OC4 and OC5 Projects

Previous studies mostly used test data from the study by Coulling et al. [17], which was led by the University of Maine at the maritime research institute Netherlands (MARIN) offshore wave basin in 2011; however, the geometrically scaled model did not perform as expected under the low-Reynolds number wind conditions. In addition, only semi-submersible properties (center of mass, inertia force, etc.) were considered in the OC4 project, while the OC5 project considered the properties of the full system, and the mooring line properties could be adjusted. Hence, a new model was built that resulted in better-scaled thrust and torque loads. However, this turbine was retested in 2013, and this turbine was examined in Phase II of the OC5 project [18]. The different physical properties of the semi-submersible platforms in the two projects are summarized in Table 4.
The turbine is a 1/50th scale horizontal-axis model of the NREL 5-MW reference wind turbine with a flexible tower affixed atop a semi-submersible platform. The DeepCwind semisubmersible platform is composed of the main column and three offset columns linked to the main column via several pontoons and braces, as mentioned in the OC5 report [18]; the 1/50th scale and full-scale models are shown in Figure 2. A 5-MW baseline wind turbine is vertically mounted on the main column so that the hub height from the sea surface is 90 m. In addition, the platform is moored with three catenary mooring lines, with fairleads located at the base columns. The anchors are located 200 m below the sea surface, on the seabed. One mooring line is aligned in the wave direction, which is also the platform surge direction; the other two mooring lines are distributed around the platform uniformly and the attachment angle between each mooring line is 120°.

3. Simulation Method

3.1. Numerical Setting and Governing Equations

This paper presents a numerical modeling tool using commercial CFD software, STAR-CCM+(V12.02.010) (Siemens, Munich, Germany), to perform a fully coupled dynamic analysis of the DeepCwind semi-submersible floating platform with the NREL 5-MW baseline wind turbine model under combined wind-wave excitation conditions.
This investigation used the unsteady incompressible Navier–Stokes equations, according to the first principles of the conservation of mass and momentum. To solve the pressure–velocity coupling, a semi-implicit method was used, which involved a predictor–corrector approach. Second-order upwind and central difference schemes were used for the convection terms and temporal time discretization, respectively. Additionally, the shear stress transport (SST) k-ω turbulence model (Menter’s Shear Stress Transport) is a robust two-equation, eddy-viscosity turbulence model used for many aerodynamic applications to resolve turbulent behavior in the fluid domain and was first introduced in 1995 by F.R. Menter [19]. The model combines the k-ω and k-e turbulence models; therefore, the k-ω turbulence model can be used in the inner region of the boundary, and the k-e turbulence model can be used in free shear flow. Menter’s SST turbulence model can be expressed as follows:
  ( ρ k ) t + ( ρ u j k ) x j = P β * ρ ω k + x j [ ( μ + σ k μ t ) k x j ]  
  ( ρ ω ) t + ( ρ u j ω ) x j = γ v t P β ρ ω 2 + x j [ ( μ + σ ω μ t ) ω x j ] + 2 ( 1 F 1 ) ρ σ ω 2 ω k x j ω x j  
To obtain details of the free surface between air and water, the unsteady CFD method with the volume of fraction (VOF) approach coupled with the 6 DOF solver was used for the hydrodynamic analysis considering the surge, sway, heave, roll, pitch, and yaw motions of the platform.

3.2. Dynamic Fluid Body Interaction (DFBI) Method

The DFBI method was applied to simulate the motion of the rigid FOWT body in response to pressure and shear forces in the fluid domain and consider the recovery force from the mooring lines. STAR-CCM+ was used to calculate the resultant force and moment acting on the body due to various influences and also to solve the governing equations of rigid body motion to determine the new position of the rigid body. A flow chart illustrating the DFBI method is shown in Figure 3.

3.3. Overset Mesh Technology

The overset mesh technique, also called overlapping or chimera grids, was applied. A new internal interface node was created within the overset mesh region. This volume-type interface enables the coupling of solutions on the domains using automatically generated sets of acceptor cells in one mesh and donor cells in another mesh. Varying values of the donor cells affect the values of the acceptor cells based on interpolation. This method can handle complex geometries and body motions in dynamic simulations.

3.4. Mooring Line Modeling and Damping

The catenary coupling model was used to model an elastic, quasi-stationary catenary, hanging between two endpoints and subject to its own weight in the field of gravity. In a local Cartesian coordinate system, the shape of the catenary is given by the following set of parametric equations:
  x = a u + b s i n ( u ) + α  
y = a c o s h ( u ) + b 2 s i n h 2 ( u ) + β  
f o r   u 1 u u 2  
In addition, a wave-damping area was applied, considering the wave reflection near the outlet boundary; this treatment includes a wave-damping zone. The wave-damping area was designed to minimize the effects of wave reflections on the far downstream outlet boundary. As a result, the VOF wave could be damped in the pressure outlet boundary to reduce wave oscillations. This damping introduces vertical resistance to the vertical motion of the wave.

4. Aerodynamic Validation of Wind Turbine

4.1. Numerical Setting and Mesh Convergence Test

An aerodynamic simulation of the rotor part was performed to validate the accuracy of the 3D model and the numerical model using the CFD method. The hexahedral computation domain size and boundary type was 8D(x) × 5D(y) × 3D(z) and extended up to 2.5D and 5.5D in the upstream and downstream x-directions from the wind turbine, respectively.
Both poly grids and trim grids were tried in the mesh test procedure, and the trim mesh was finally selected owing to its robust features and relatively low computational cost. Nineteen layers of prism grids were generated to determine the blade-attached flow, and the near-wall first boundary layer thickness was 3.82 × 10⁻⁶ m. A mesh convergence test was also performed, and the results are given in Table 5; five sets of grids were generated with different grid densities while all the other parameters remained unchanged. A total of 22 million grids were selected with both a short calculation time and acceptable power loss. Details of the trim mesh around the blade tip are presented in Figure 4; at the same time, denser grids around the leading and trailing edges of the airfoils were used to detect fluid details. Y plus is a dimensionless value used to measure the mesh quality; a value below 1 is produced when the k- ω SST turbulence model is applied. In this study, the Y plus value was much lower than 1 in all five cases.

4.2. Validation of Rotor Aerodynamic Performance

Currently, there are three main methods used for simulating aerodynamic performance: the BEM method, generalized dynamic wake (GDW) model, and CFD model. The results of each model are shown in Figure 5. The CFD results are in good agreement with those of the other codes with regard to both power and thrust prediction, which were collected by Gyeongsang national university (GNU) using FAST code. The BEM method was observed to overestimate results at a relatively high wind speed, which is also noted in other studies [20]. Sivalingam et al. also compared results between the CFD and BEM methods; there was a good agreement in terms of the thrust and torque results below the rated speed. However, because of tip loss factors at relatively high wind speeds, a deviation of axial induction factors was shown by the BEM method, while the CFD method captured wake rotation accurately [21].

4.3. Study of Wind Profile and Tower Dam Effect Under Onshore Wind Turbine Generator Conditions

The aerodynamics of the NREL 5-MW fixed wind turbine was studied on a full-scale without the floating platform. The results will later be compared with the data for a floating wind turbine. All the numerical settings used in the CFD-rigid body motion (RBM) approach in the previous simulations were applied to the rotor part, except the inlet uniform wind was replaced with the wind profile.
The wind profile shows variations in the horizontal wind speed with height, which may result in increased fatigue loading and reduced power output, usually characterized by the power law, as follows:
  v = v = v h u b ( H / H h u b ) α  
The wind shear exponent (alpha) was 0.12 for flat onshore conditions. Figure 6 illustrates the computational mesh domain; the upstream boundary of the inlet is defined as velocity inlet and the pressure outlet is defined as the downstream boundary. Symmetric boundary conditions were applied in the far field region and a no-slip wall condition was imposed on the surface. Tran et al. [20] had carried out a convergence test to determine the fluid domain size; herein, we used a hexahedral computational domain size of 1000 m × 600 m × 275 m (length, width, height), the same as that used by Tran et al, in the x-direction; the fluid domain extended 313 m upstream and 687 m downstream to help analyze the fluid domain and consider the impact of the vortex after the tower, considering the time-dependent motion of the rotating blades; we used the RBM method in this study.
Aerodynamic simulations of onshore wind turbines were conducted using the RBM method under unsteady conditions; the obtained torque output under 11 m/s wind conditions was compared with the results of the FSI method obtained at the University of California. As shown in Figure 7, there was good agreement between both, but the predictions from our simulation were slightly higher, which may be because blade deformation was ignored in the RBM method [22,23].

5. Hydrodynamic Response of Floating Platform

5.1. Free-Decay Test

Free-decay tests are methods generally used in a wave tank to determine the natural period of a floating system. The OC4 project was based on a 1/50th-scale semi-submersible platform in the MARIN wave basin in 2011. This model was revised two years later, to provide more precise test data for the OC5 project [18]. Owing to the different properties of the mooring line (line stiffness) and rotating inertia forces in the two tests, the OC4 and OC5 data reveal good agreement in terms of translation motions (surge, sway, and heave) but a relatively large discrepancy in terms of rotating motions (roll, pitch, and yaw), as observed in Table 6. Six-DOF free decay tests were conducted to determine the hydrodynamic damping characteristics of the OC5 semi-submersible platform.
The wave mode was set as still water, and the air density was zero. Only the platform was considered to simplify the simulation; however, the gross mass should also be considered. The platform was given a prescribed displacement and released to move freely from the initial position. This test considered only three rigid-body DOFs, that is, the surge, pitch, and heave motions.
The results are presented in Figure 8, along with the simulation results from GNU and the wave basin test results from phase II of the OC5 project. The heave and surge time-domain responses for the platforms are in good agreement, as similar results were obtained in the heave and surge periods in the OC4 and OC5 projects. However, in the case of pitch, a relatively large discrepancy was observed in the time-domain response for the GNU simulation. As mentioned above, this effect may be owing to the different properties of the mooring line and rotating inertia forces of the platforms used in the two projects. Based on the natural period of the pitch, the pitch results were in good agreement with the OC5 test data.

5.2. Hydrodynamic Response Under Regular Waves

The characteristics of the DeepCWind platform under regular wave conditions were investigated by calculating the response amplitude operators (RAOs). An RAO is the normalized value of the amplitude of the periodic response of a field variable divided by the amplitude of a regular wave [24]. The platform was initialized at a static position, and a regular wave was introduced. The regular wave had an amplitude of 3.79 m and a period of 14.3 s. A fifth-order wave was applied in the regular wave test; here, the fifth-order wave was modeled with a fifth order approximation to the Stokes theory of waves [25]. This wave more closely resembled a real wave than one that was generated by the first-order method. The transient start-up period should not be considered in the results. After simulation runs for 400 s, the platform movement achieved a periodic quasi-steady state. The surge, heave, and pitch motion amplitudes were calculated by averaging the amplitudes over the last eight wave periods [24]. These values were then normalized using the amplitude of the regular wave to obtain the RAO. The RAOs of Phase II of the OC5 project were higher for the surge, heave, and pitch DOFs, similar to our simulation results obtained using the unsteady CFD method, as shown in Figure 9.

6. Fully Coupled Wind–Wave Simulation

The full-scale DeepCwind OC5 model in a coupled wind–wave excitation condition was finally conducted using the DFBI method mentioned above. 
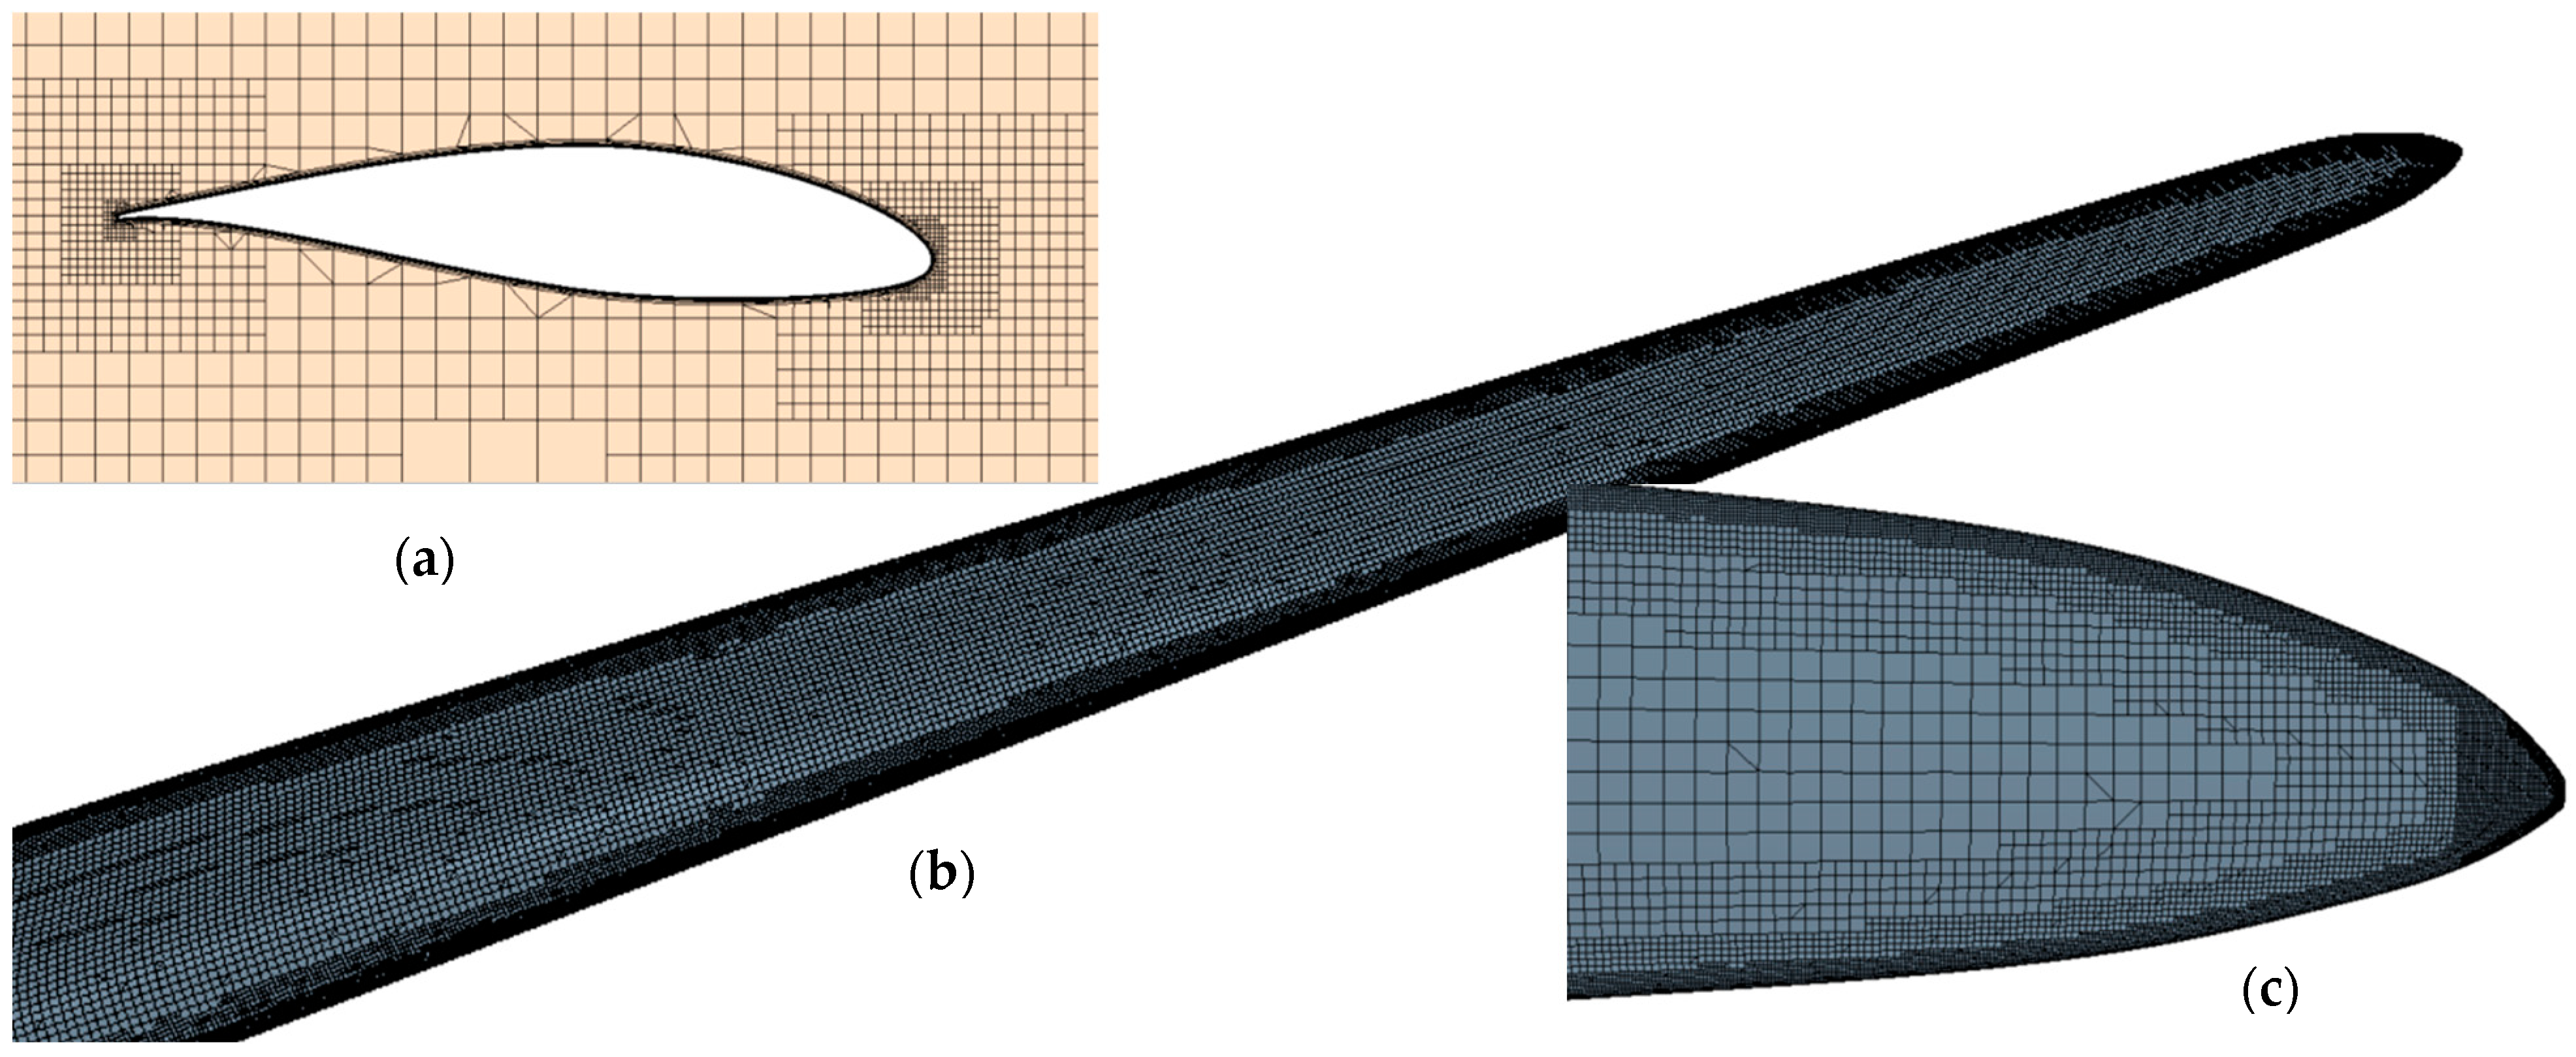
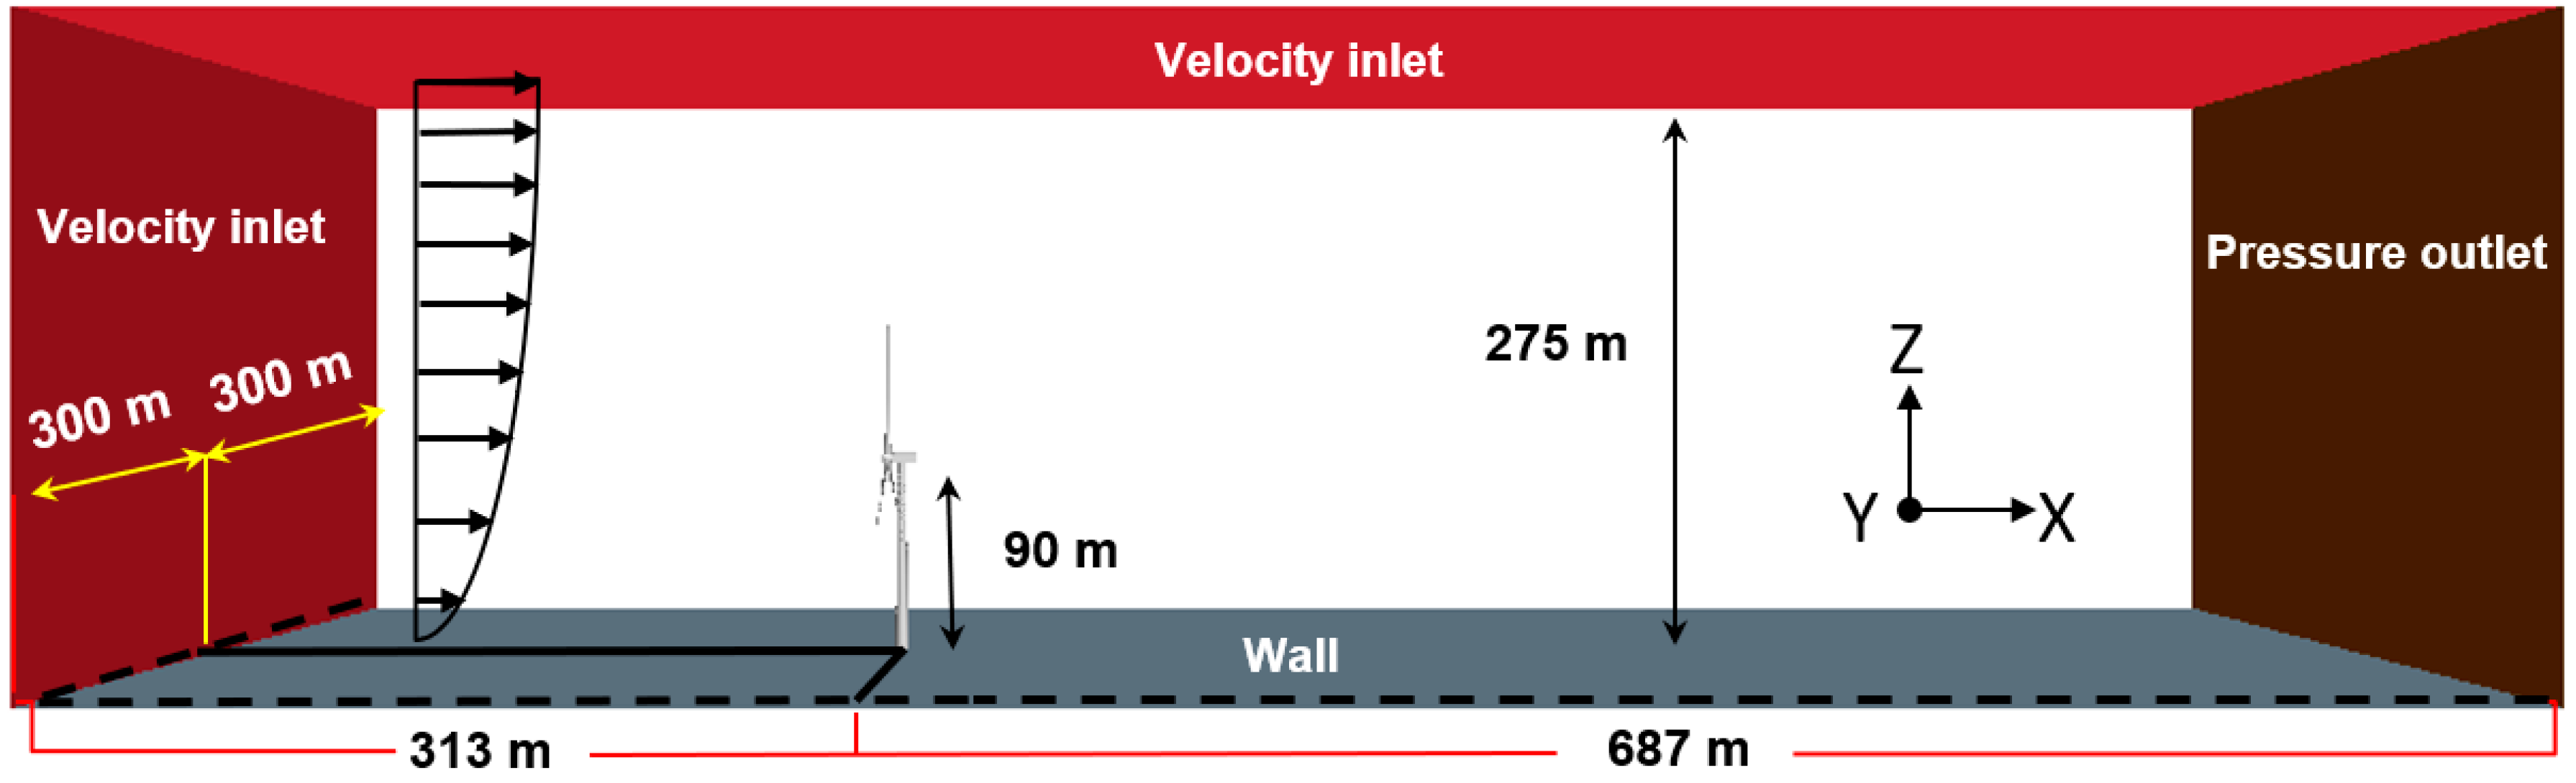
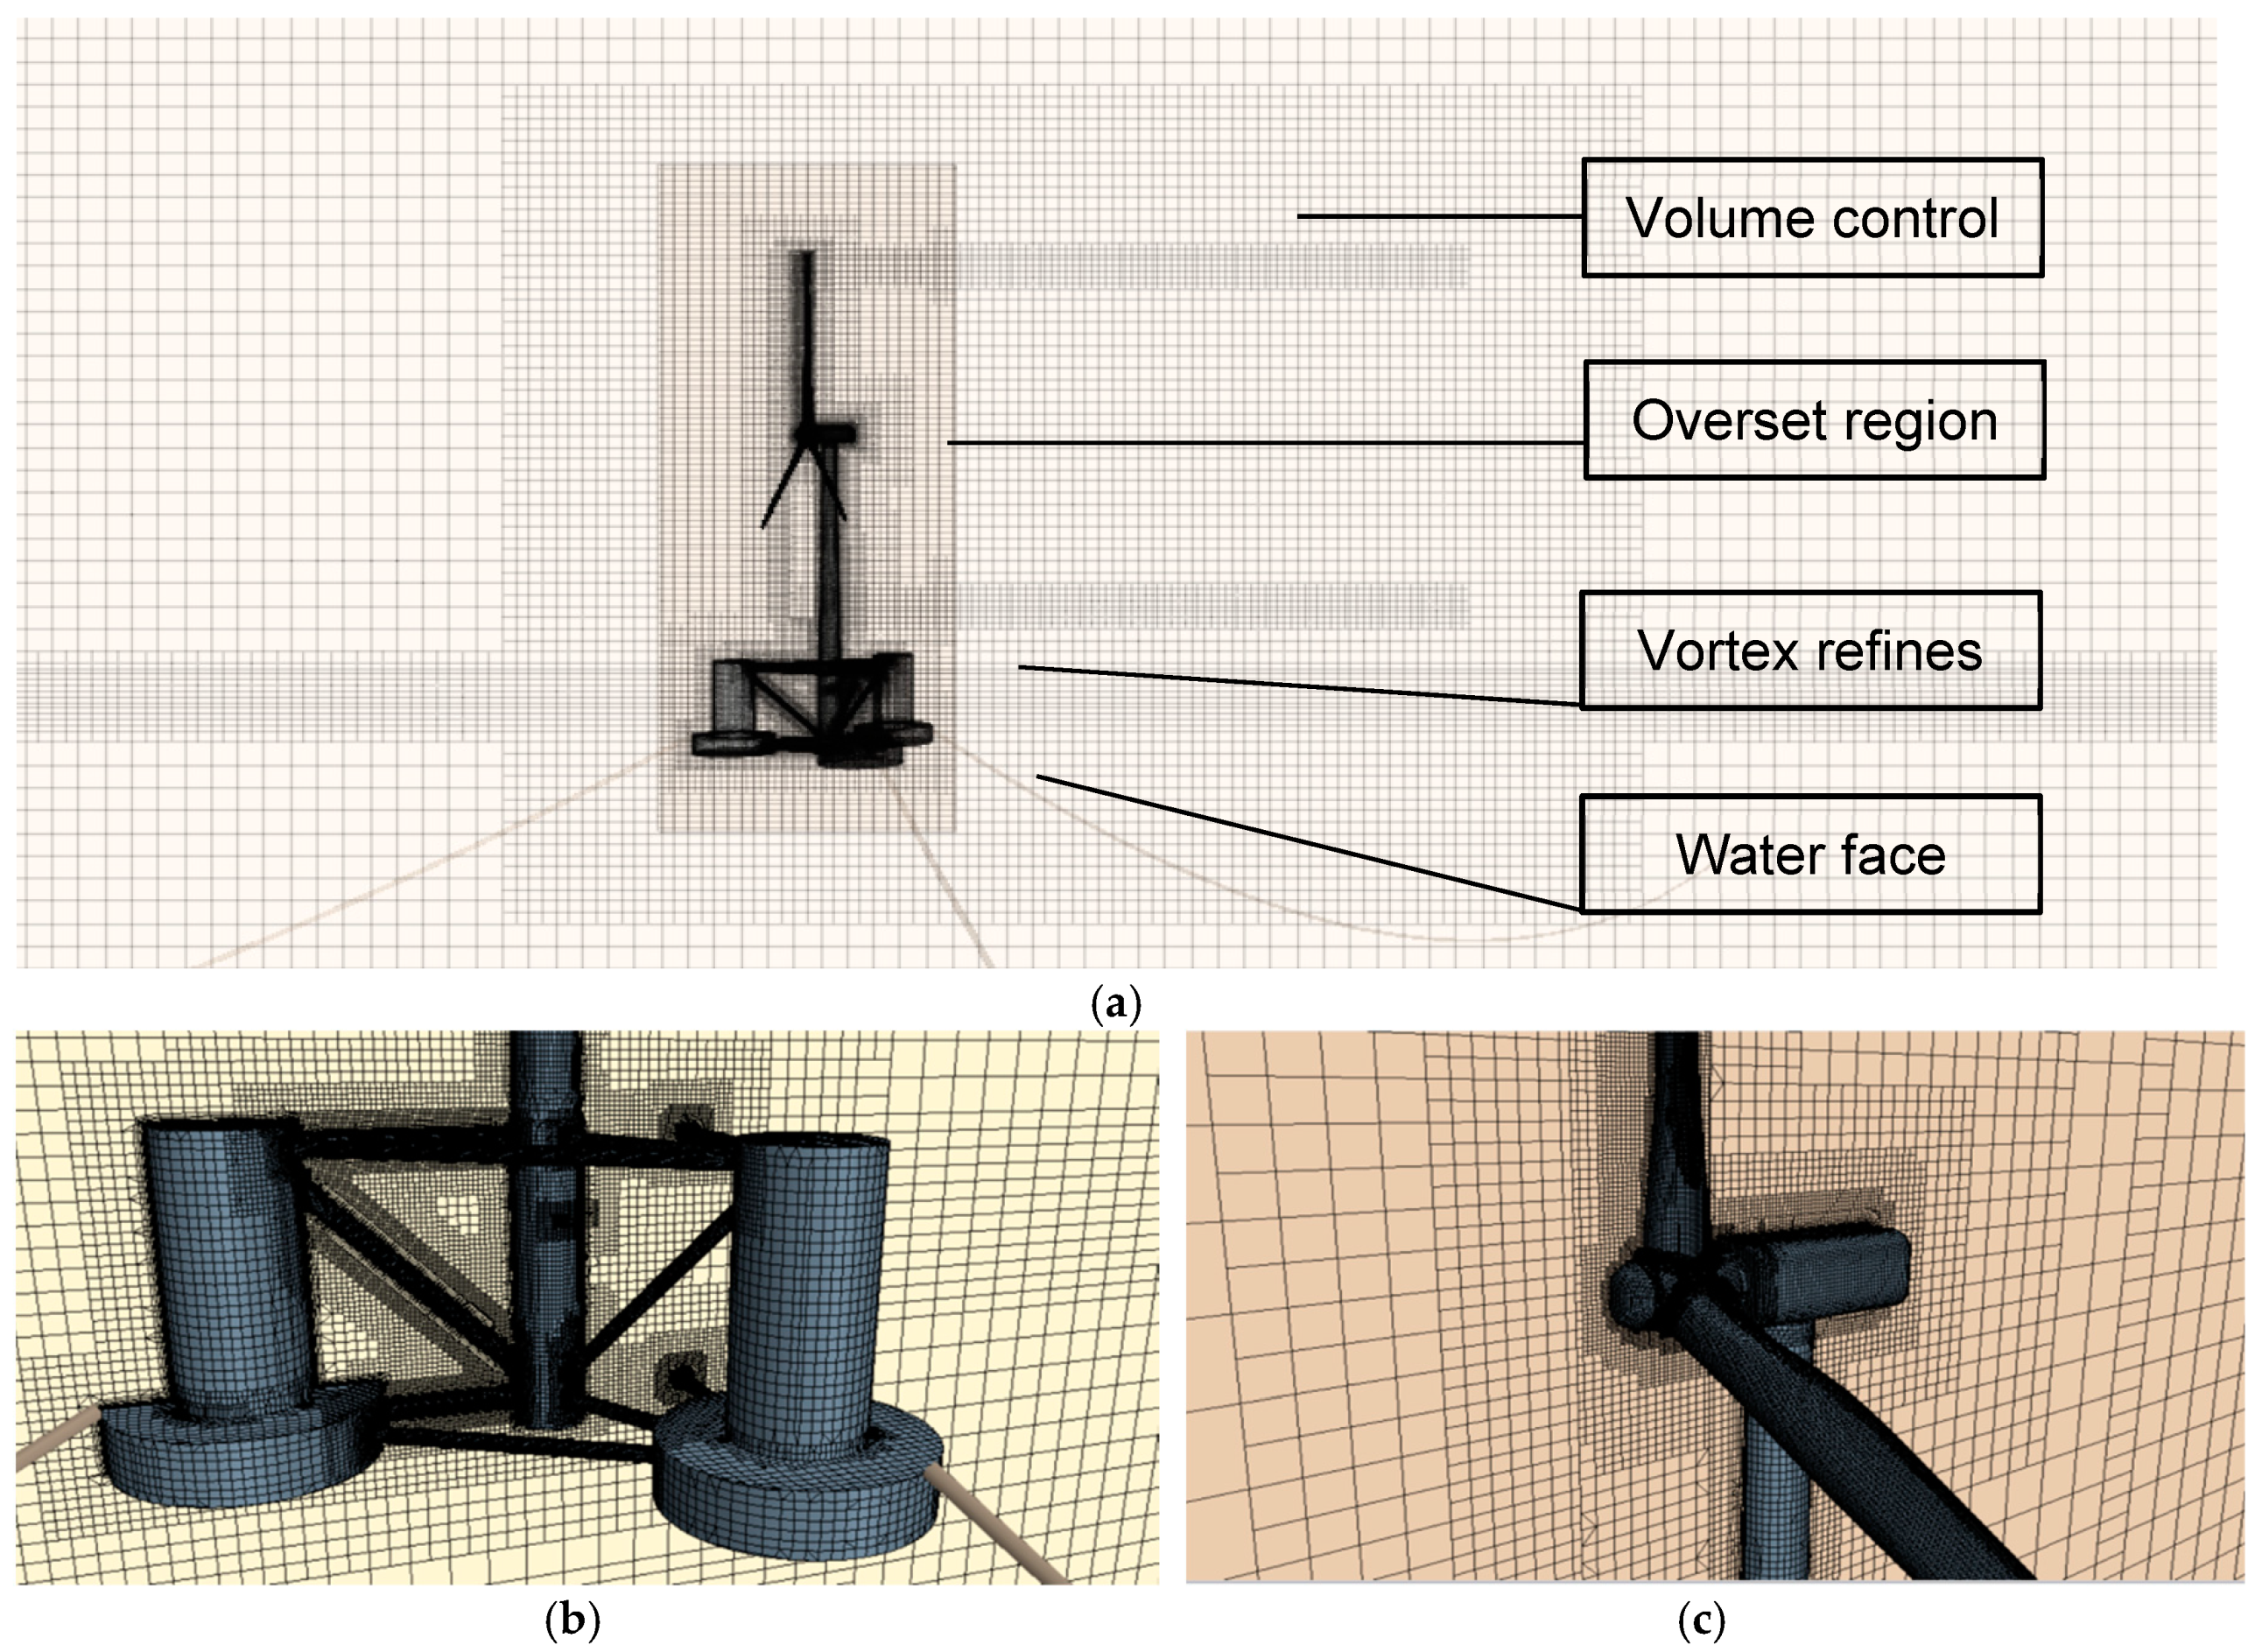
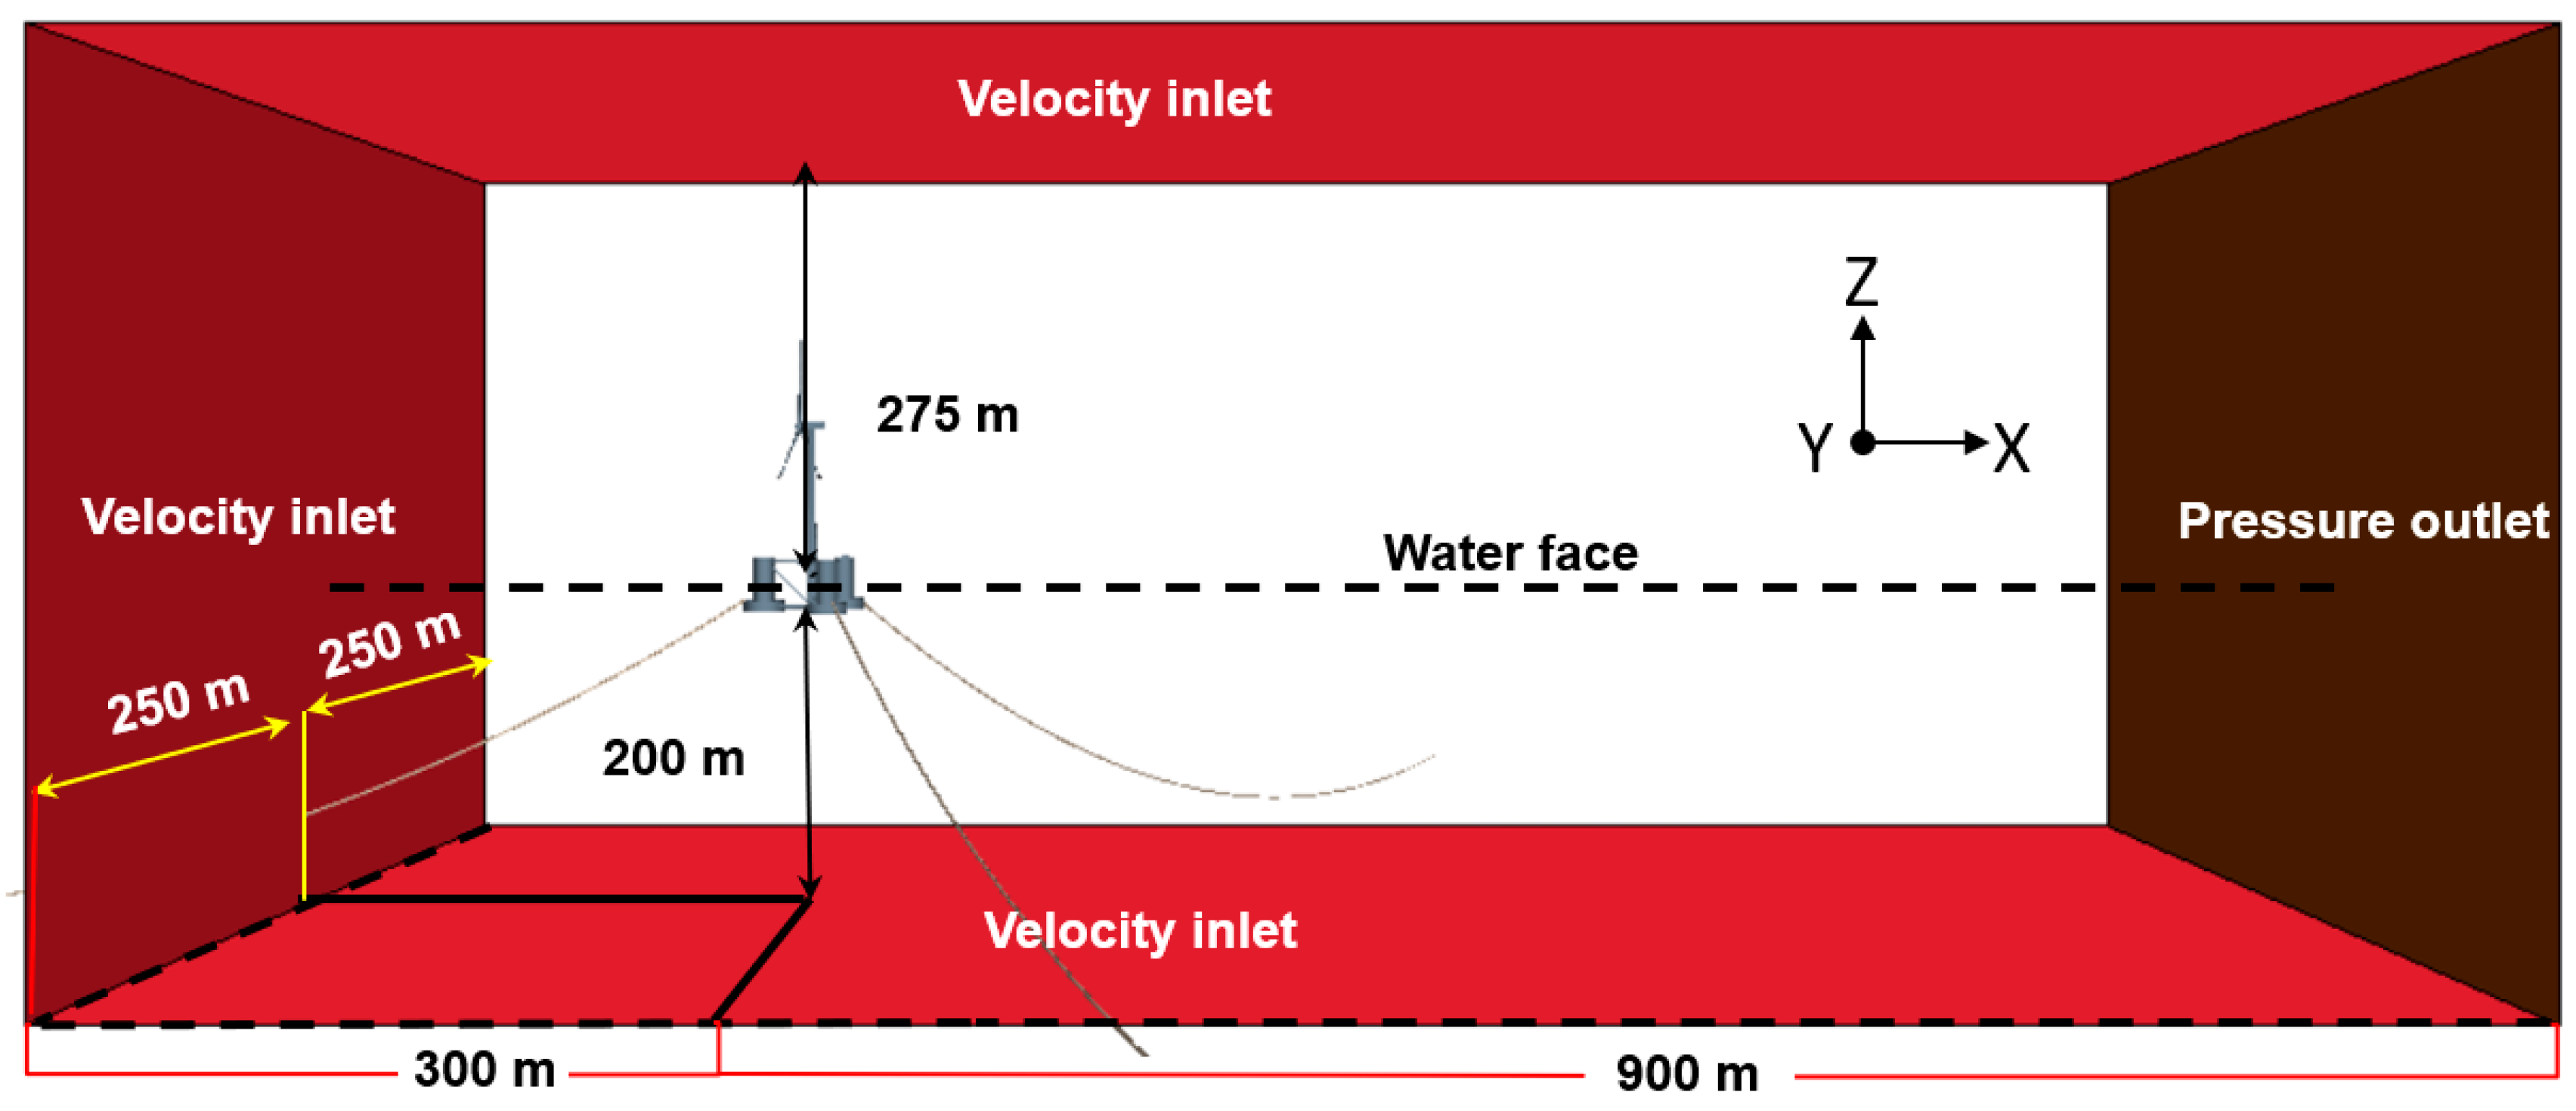
Figure 10 shows the fluid domain, together with an xz-plane section of the mesh distribution in the whole fluid domain. To obtain the fluid details near the free surface, as well as those near the turbine blade tip and vortex regions after the tower, mesh refinement was performed around the blades and platform, as shown in Figure 11. Nearly 27 million cells were generated using the built-in trim mesh feature in STAR-CCM+. The wind speed, V, was assumed to be the rated wind speed (11.4 m/s); the wave height and wave period were assumed to be 7.58 m and 12.1 s, respectively, similar to the MARIN wave basin.
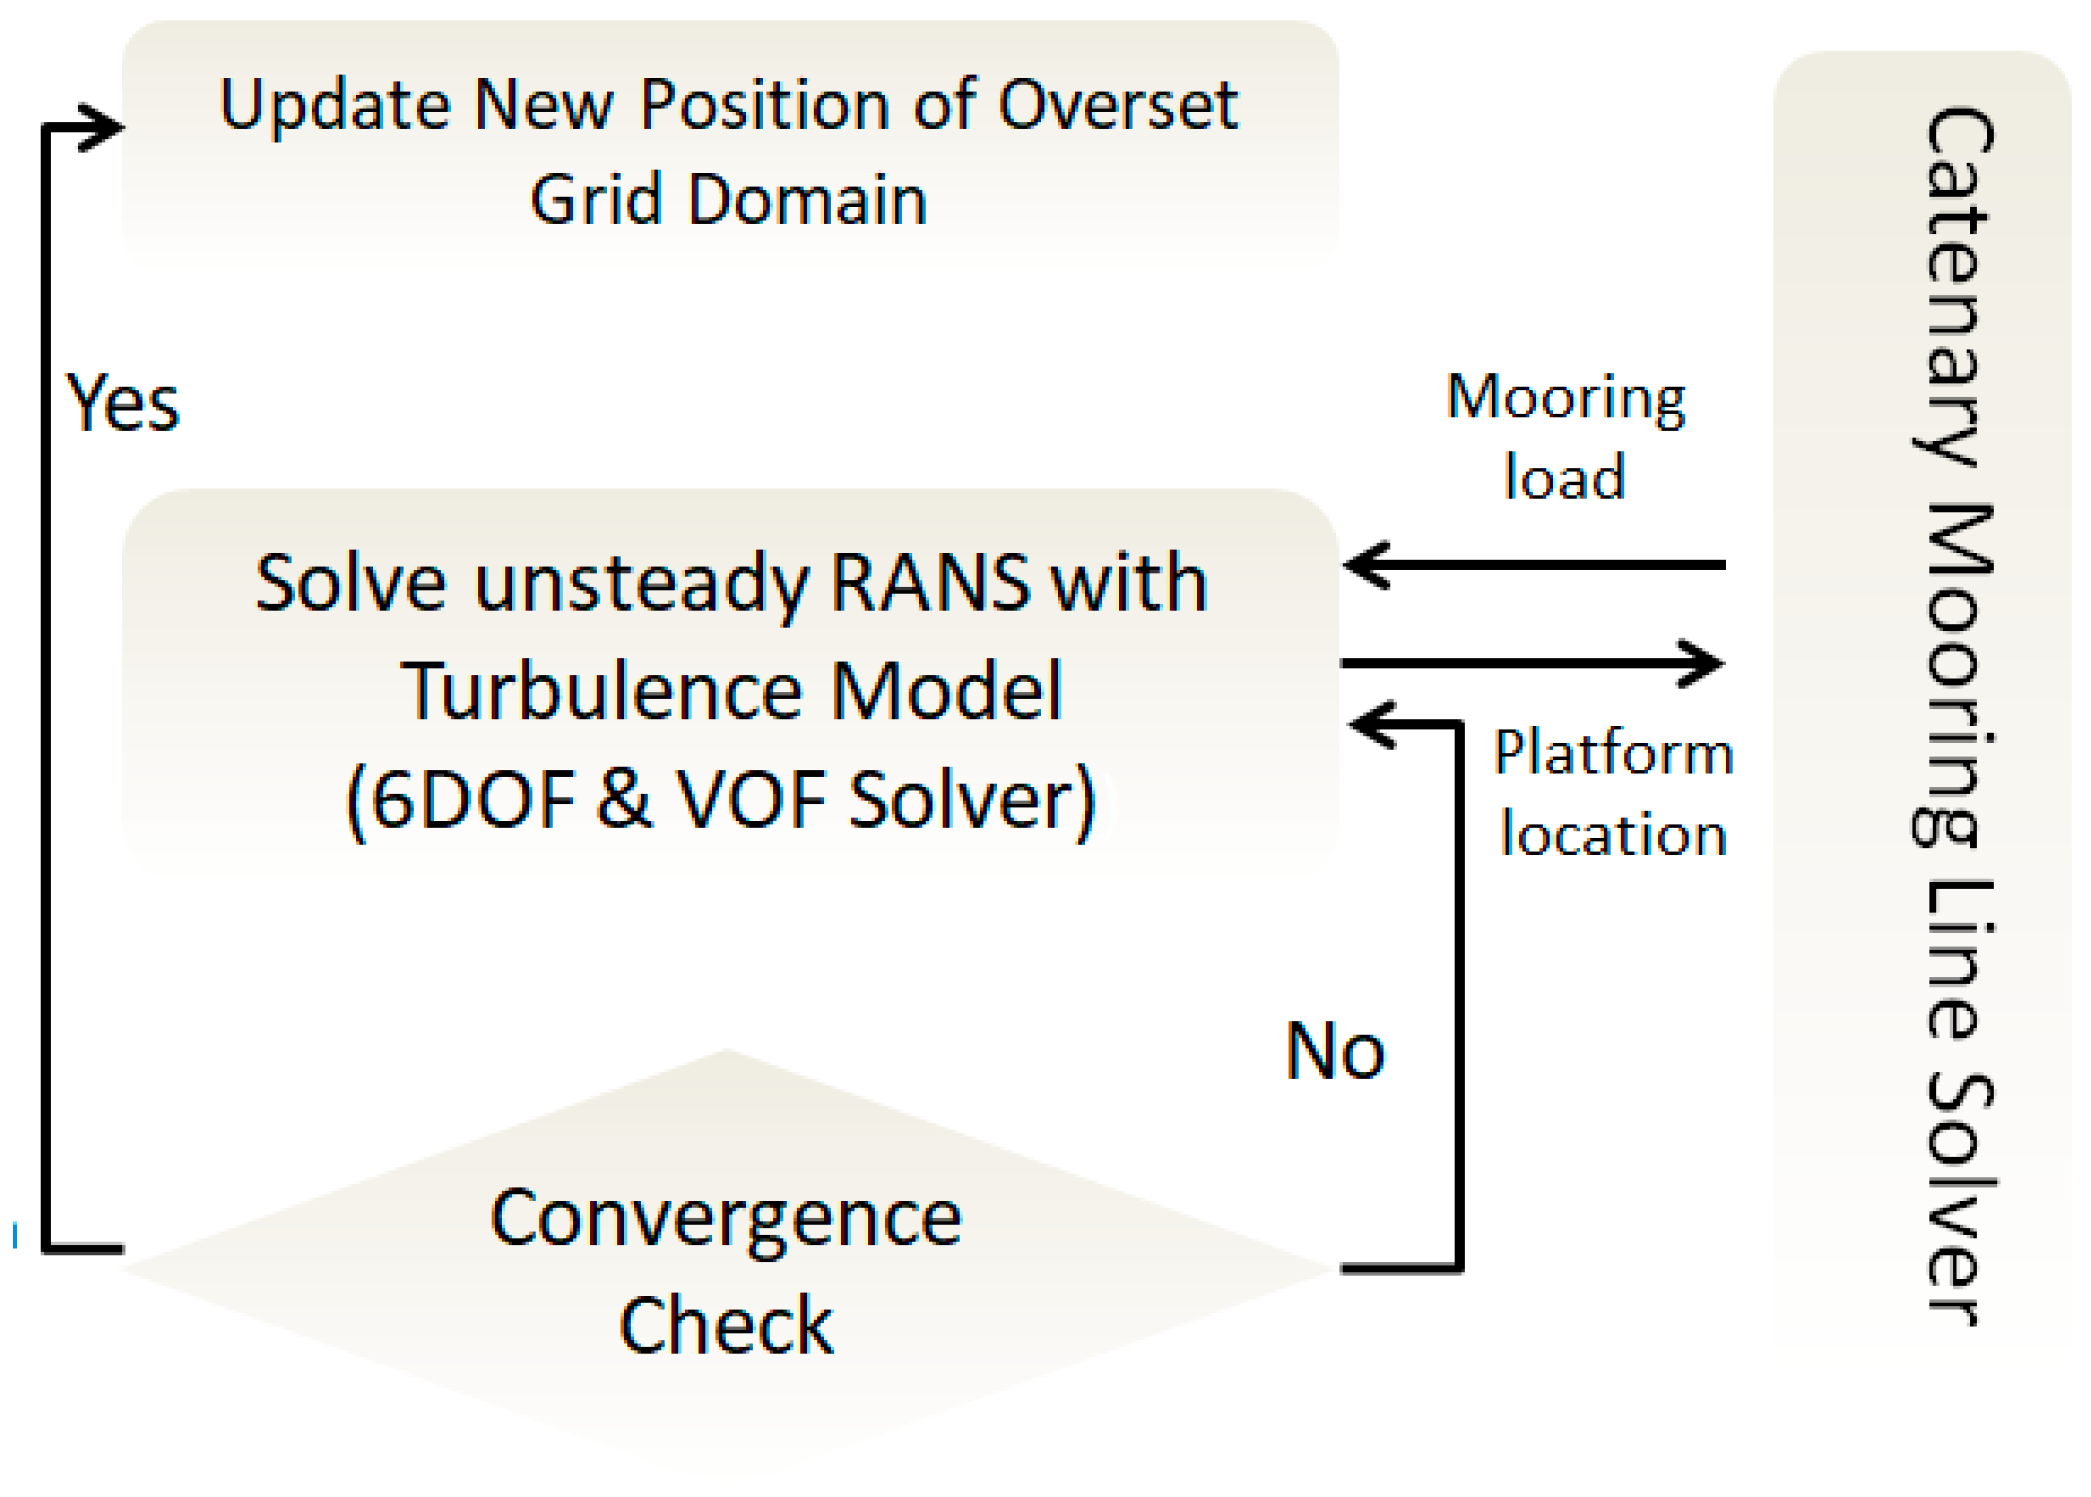
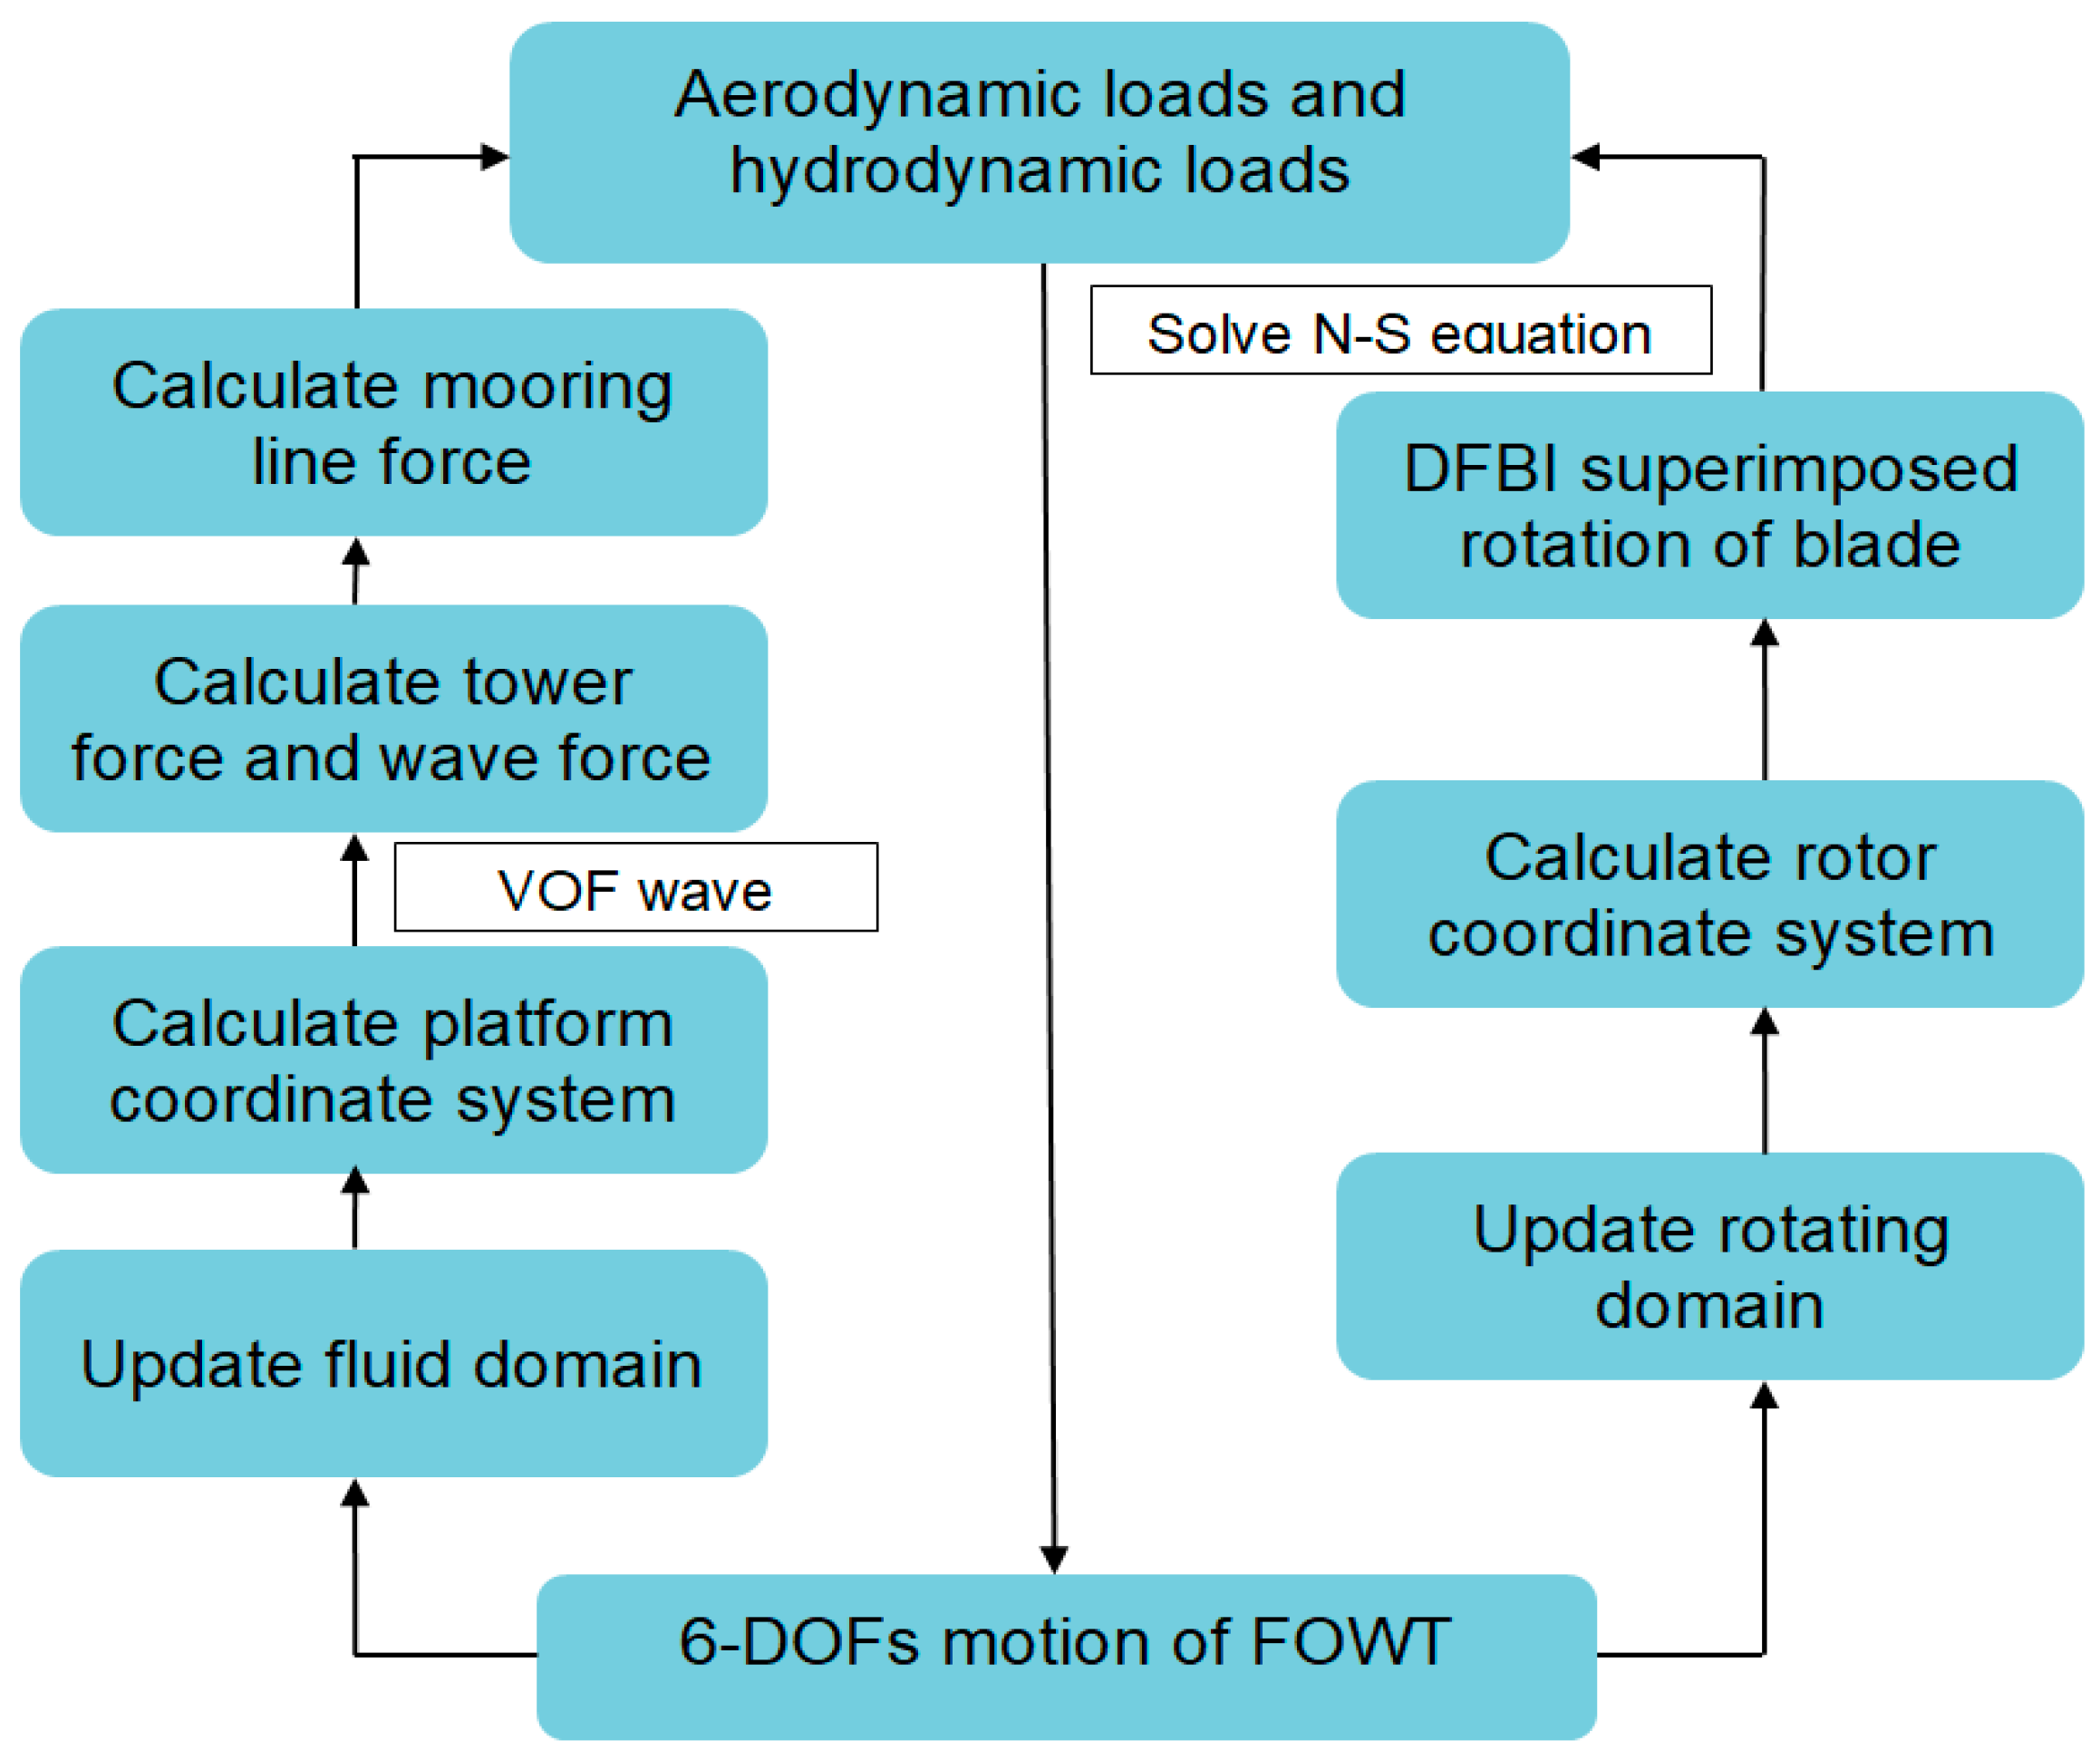
After a 10 s start-up time, the aerodynamic output for the wind turbine was stabilized and the platform was released to move. A computational flow chart for the FOWT is presented in Figure 12.
The time for one revolution of the blades with a rotation speed of 12.1 rpm is 4.96 s. The time-step size (dt) of 0.07009 s utilized here corresponds to a 5° increment in the azimuth angle of the blade for each time-step. The wave heading angle is 0° and the wave is parallel to the direction of mooring line 2, which is also parallel to the platform surge direction.
All computations of the FOWT considering the wind–wave coupling were performed using a 4U multi D500 server. The elapsed real central processing unit (CPU) time for parallel processing per time-step with 15 sub-iterations was 6 min when using 66 CPUs. The total number of iterations for a simulation runtime of 300 s was approximately 30,000. The total simulation time taken to obtain the results using 66 CPUs was 20 days.
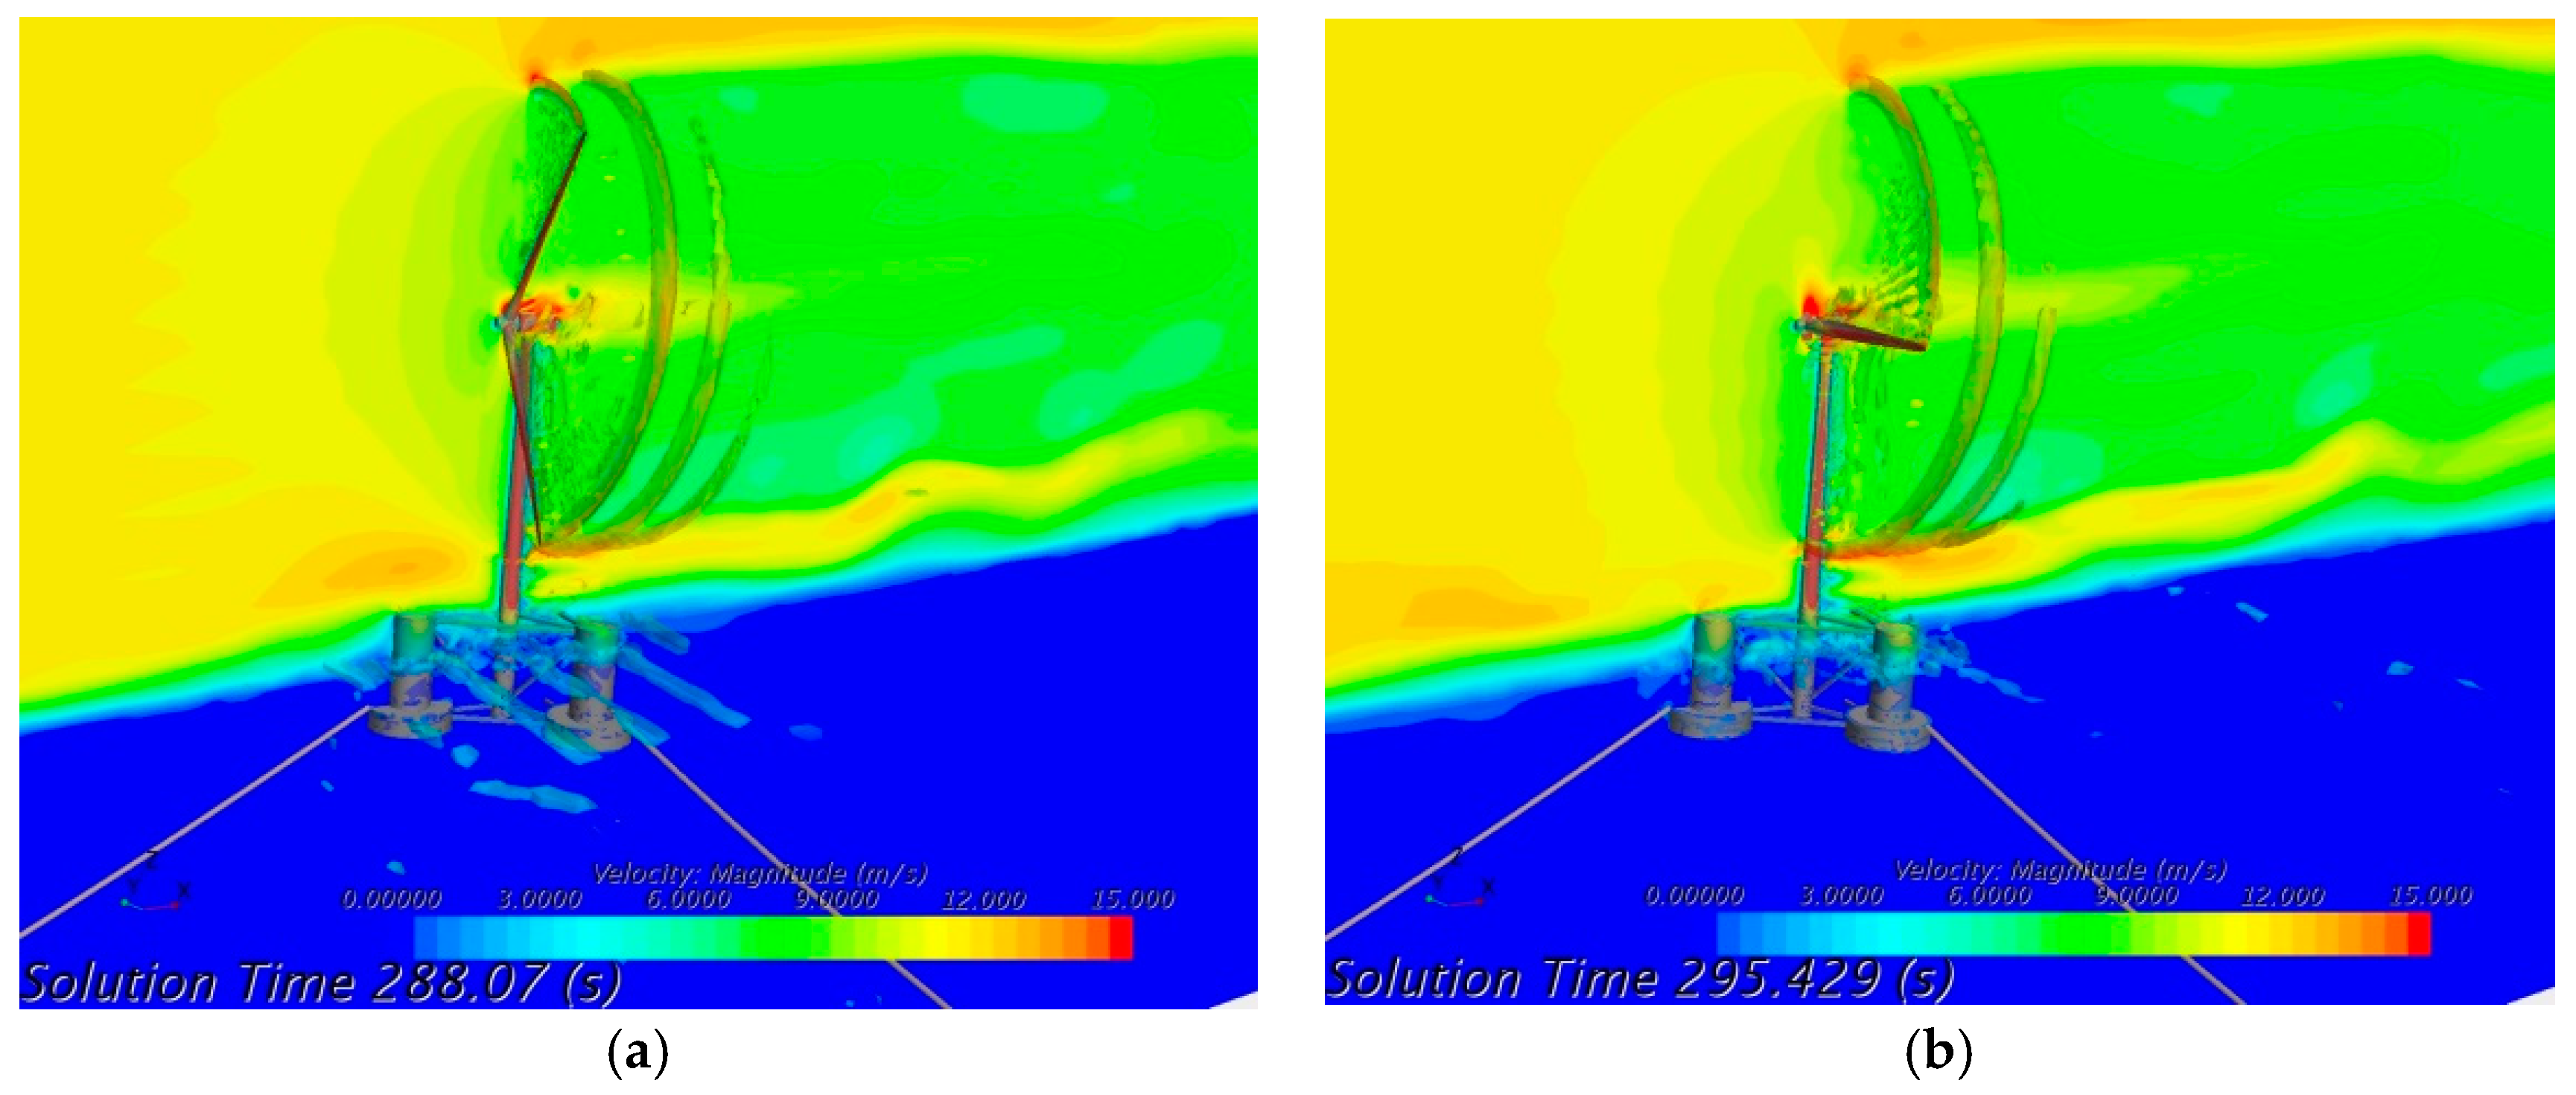
Figure 13 demonstrates the vortex contours with 0.5 Q-criteria, colored according to the velocity magnitude component, where the free surface is colored according to the surface elevation. After post-processing, as easily observed in the figure, strong vortices appear near the blade tips and roots. The presence of the tower caused a complex flow wake because of the interaction between the tower and flow. Such a detailed flow map is useful to identify the means for improving the wind turbine power output in the design stage.
This is an advantage of the CFD method, which is not present in other codes such as FAST. The size of the vortex tubes gradually decreases with time, and the patterns can be described by an iso-vorticity value. Herein, one wave period is separated into eight steps, i.e., T1 to T8; the duration from T1 to T8 represents one period of the platform surge motion. When the wind turbine moves backward, the number of vortex tubes increases, and the gaps between the blade tip vortices tend to continuously decrease at the same time. 
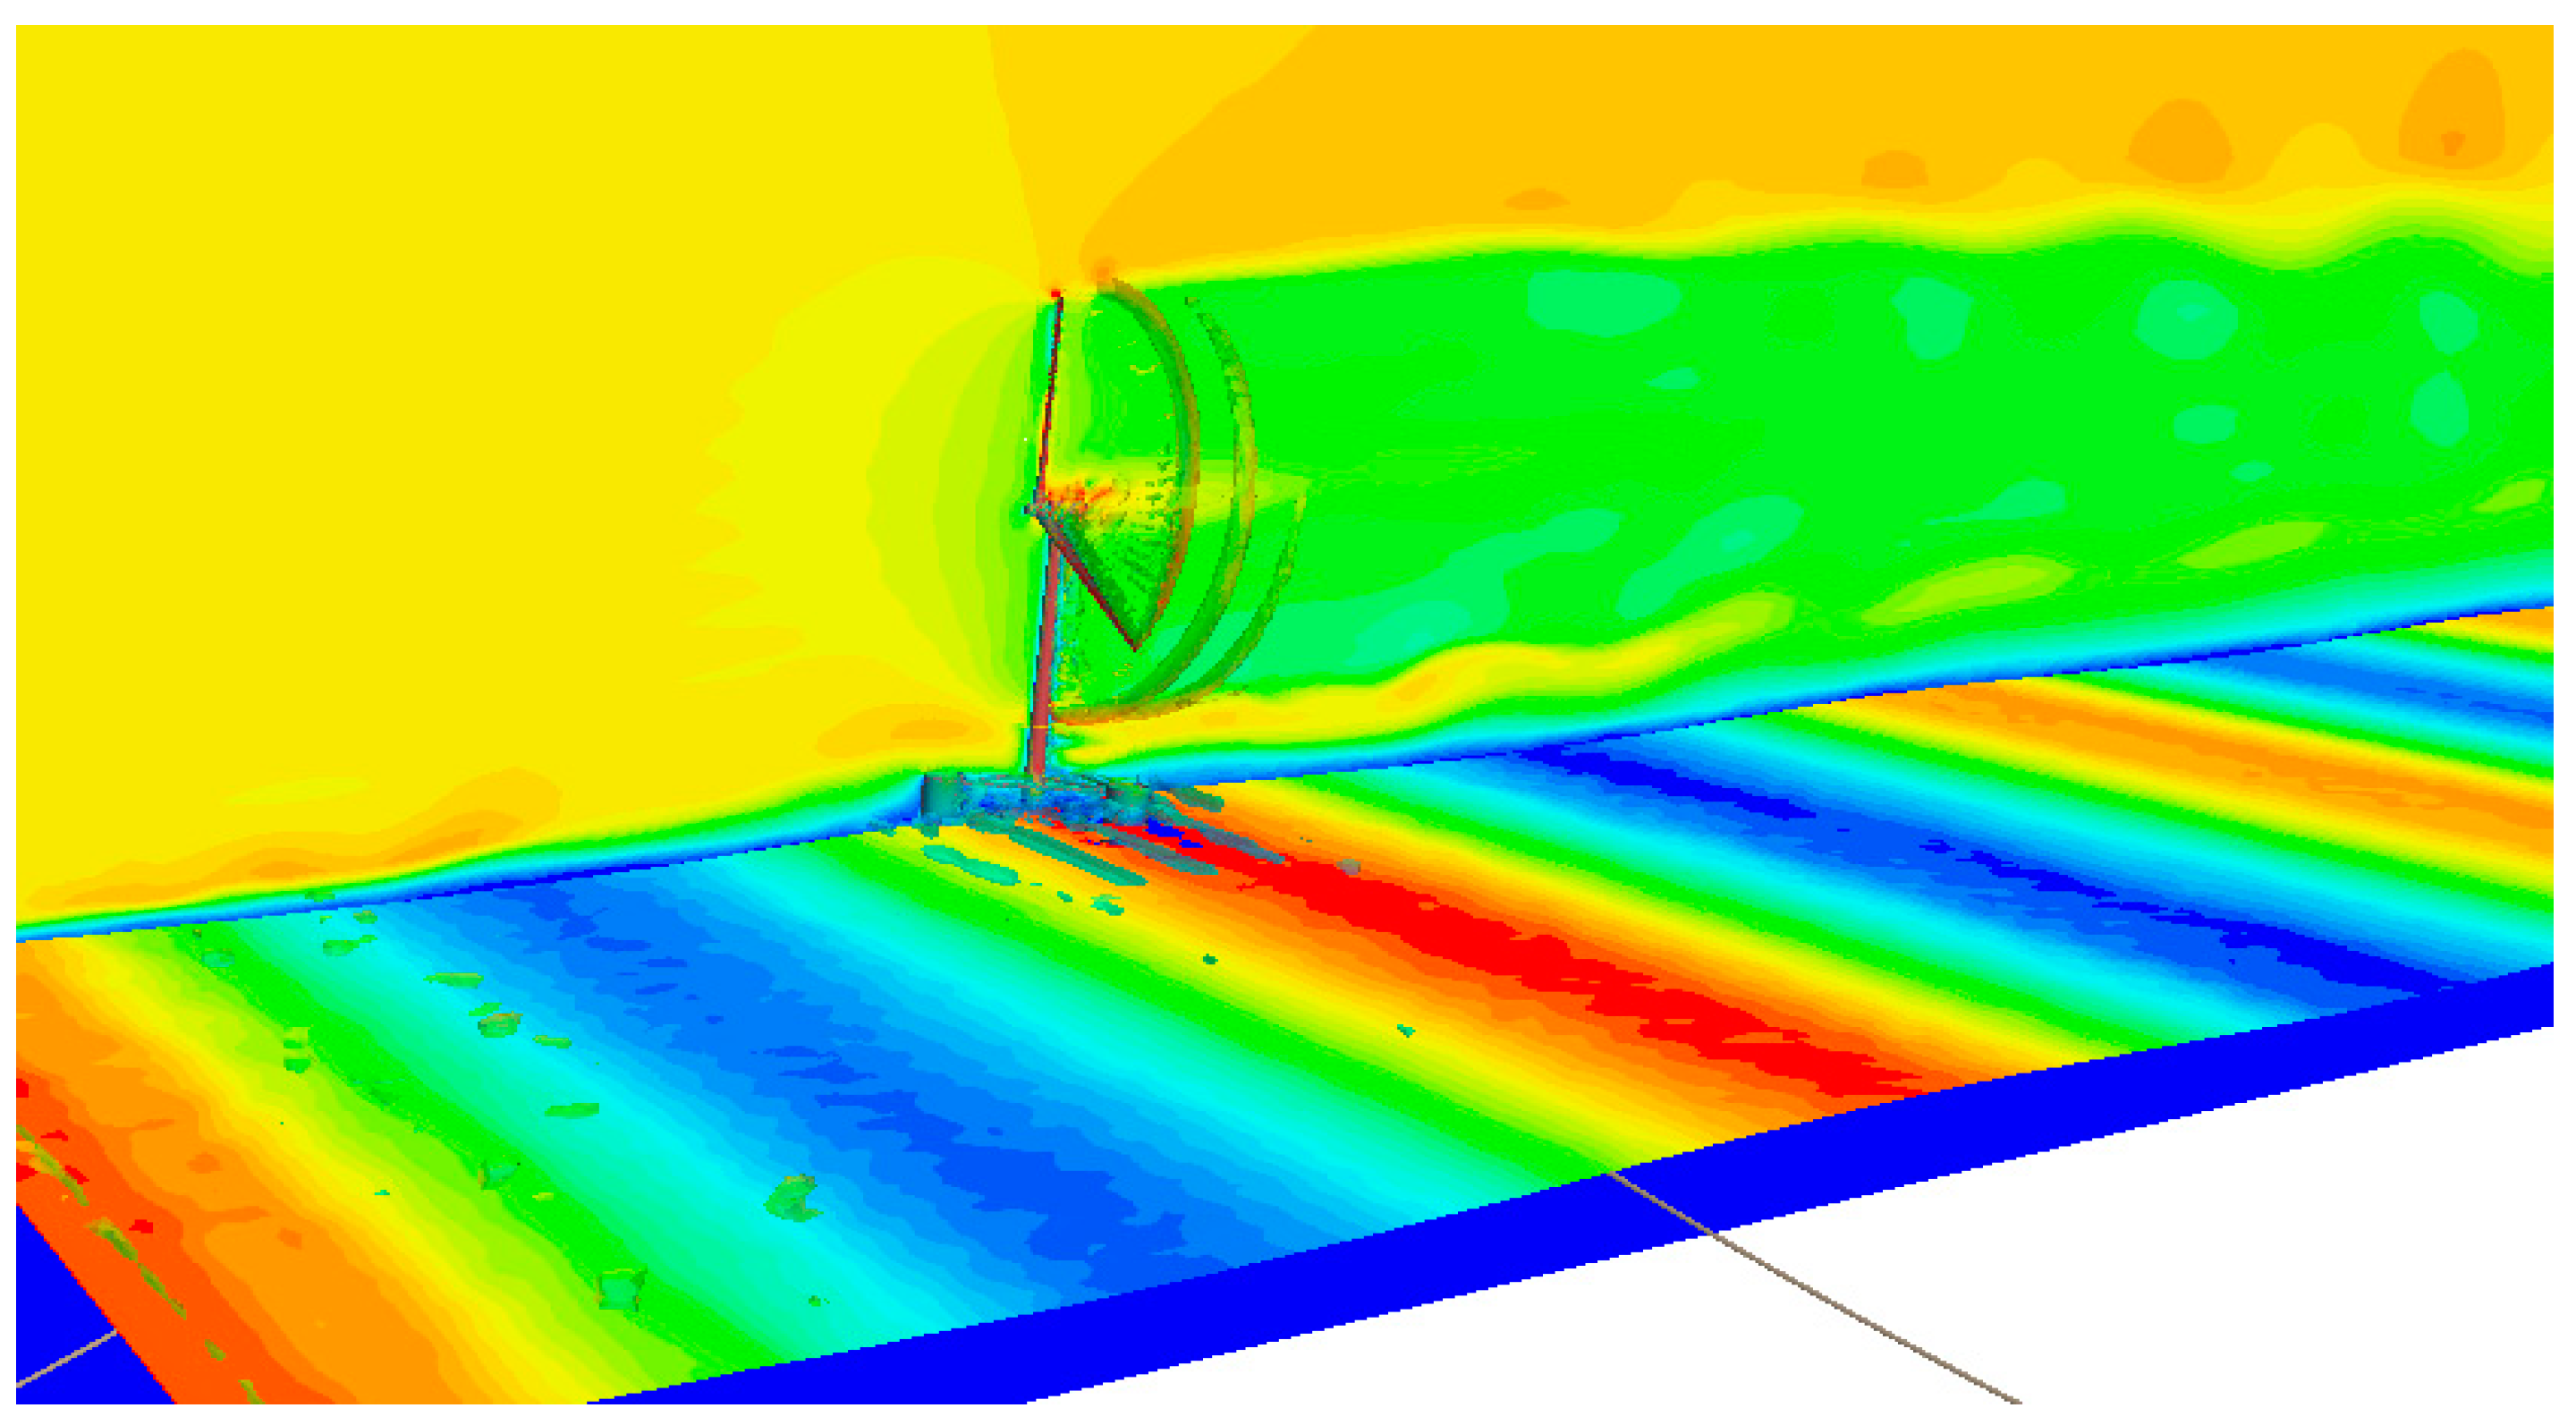
Figure 14 shows the fluid field and turbulence wakes between the fluid and tower and nacelle during the platform surge motion at different times. It shows that the generated vortexes near the tower and nacelle configurations diffuse outward as the platform moves backward, and vice versa.
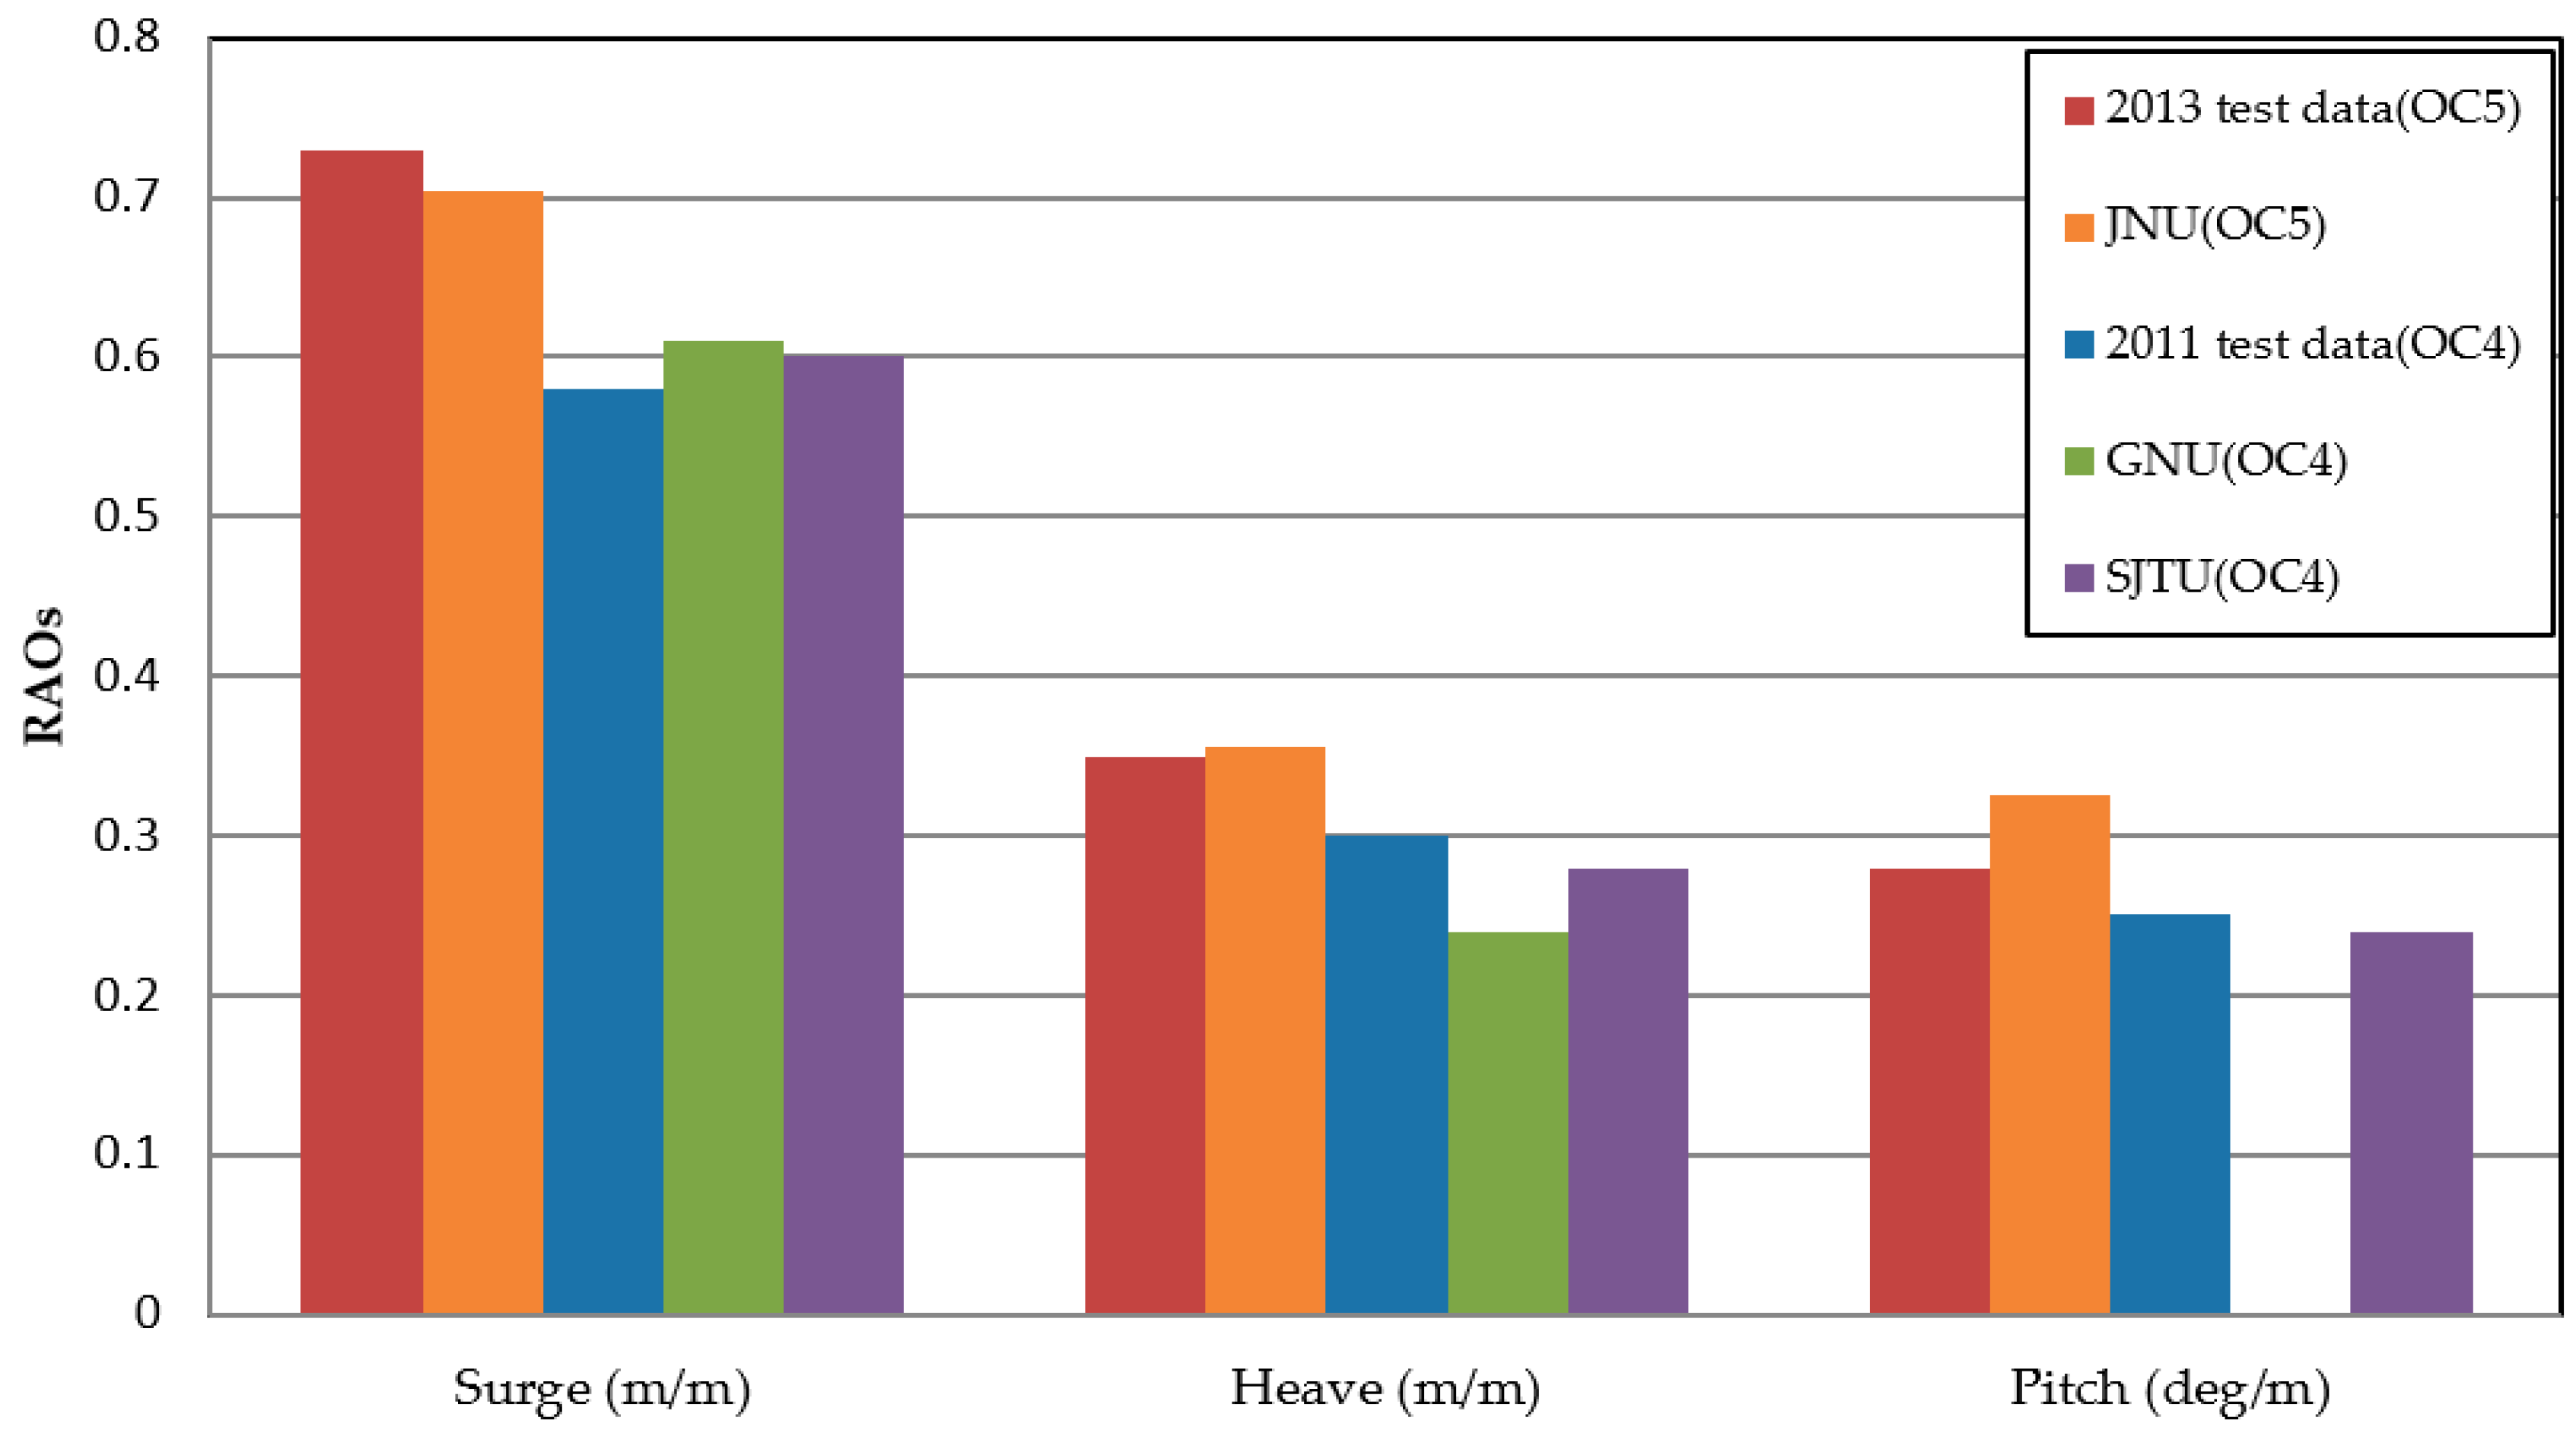
The RAOs of surge, heave, and pitch in the fully coupled configuration under wind–wave excitation conditions are given in Table 7. Compared to the result of the regular wave test, where only regular waves exist, under a no-wind condition some discrepancies can be observed. The motion RAOs and the time-average values over the last four wave periods for 3-DOF were compared. Due to the unavailability of MARIN test data for the wind and wave conditions simulated herein, the comparison was only performed with the result from a previous study. All the 3-DOFs, i.e., heave, surge, and pitch showed small amplitudes compared to the results of the regular wave test without wind conditions. The incoming wind from the x-direction obviously has a significant effect on the restoring force of the mooring line; hence, the FOWT system cannot be restored to the equilibrium position as in the regular wave test. The incoming wind increased the aerodynamic thrust towards the floating system and pushed the platform further away in the backward direction, also leading to an increase in the mean surge. Nevertheless, the close agreement between the results for the 3-DOFs demonstrates the capability of this method.
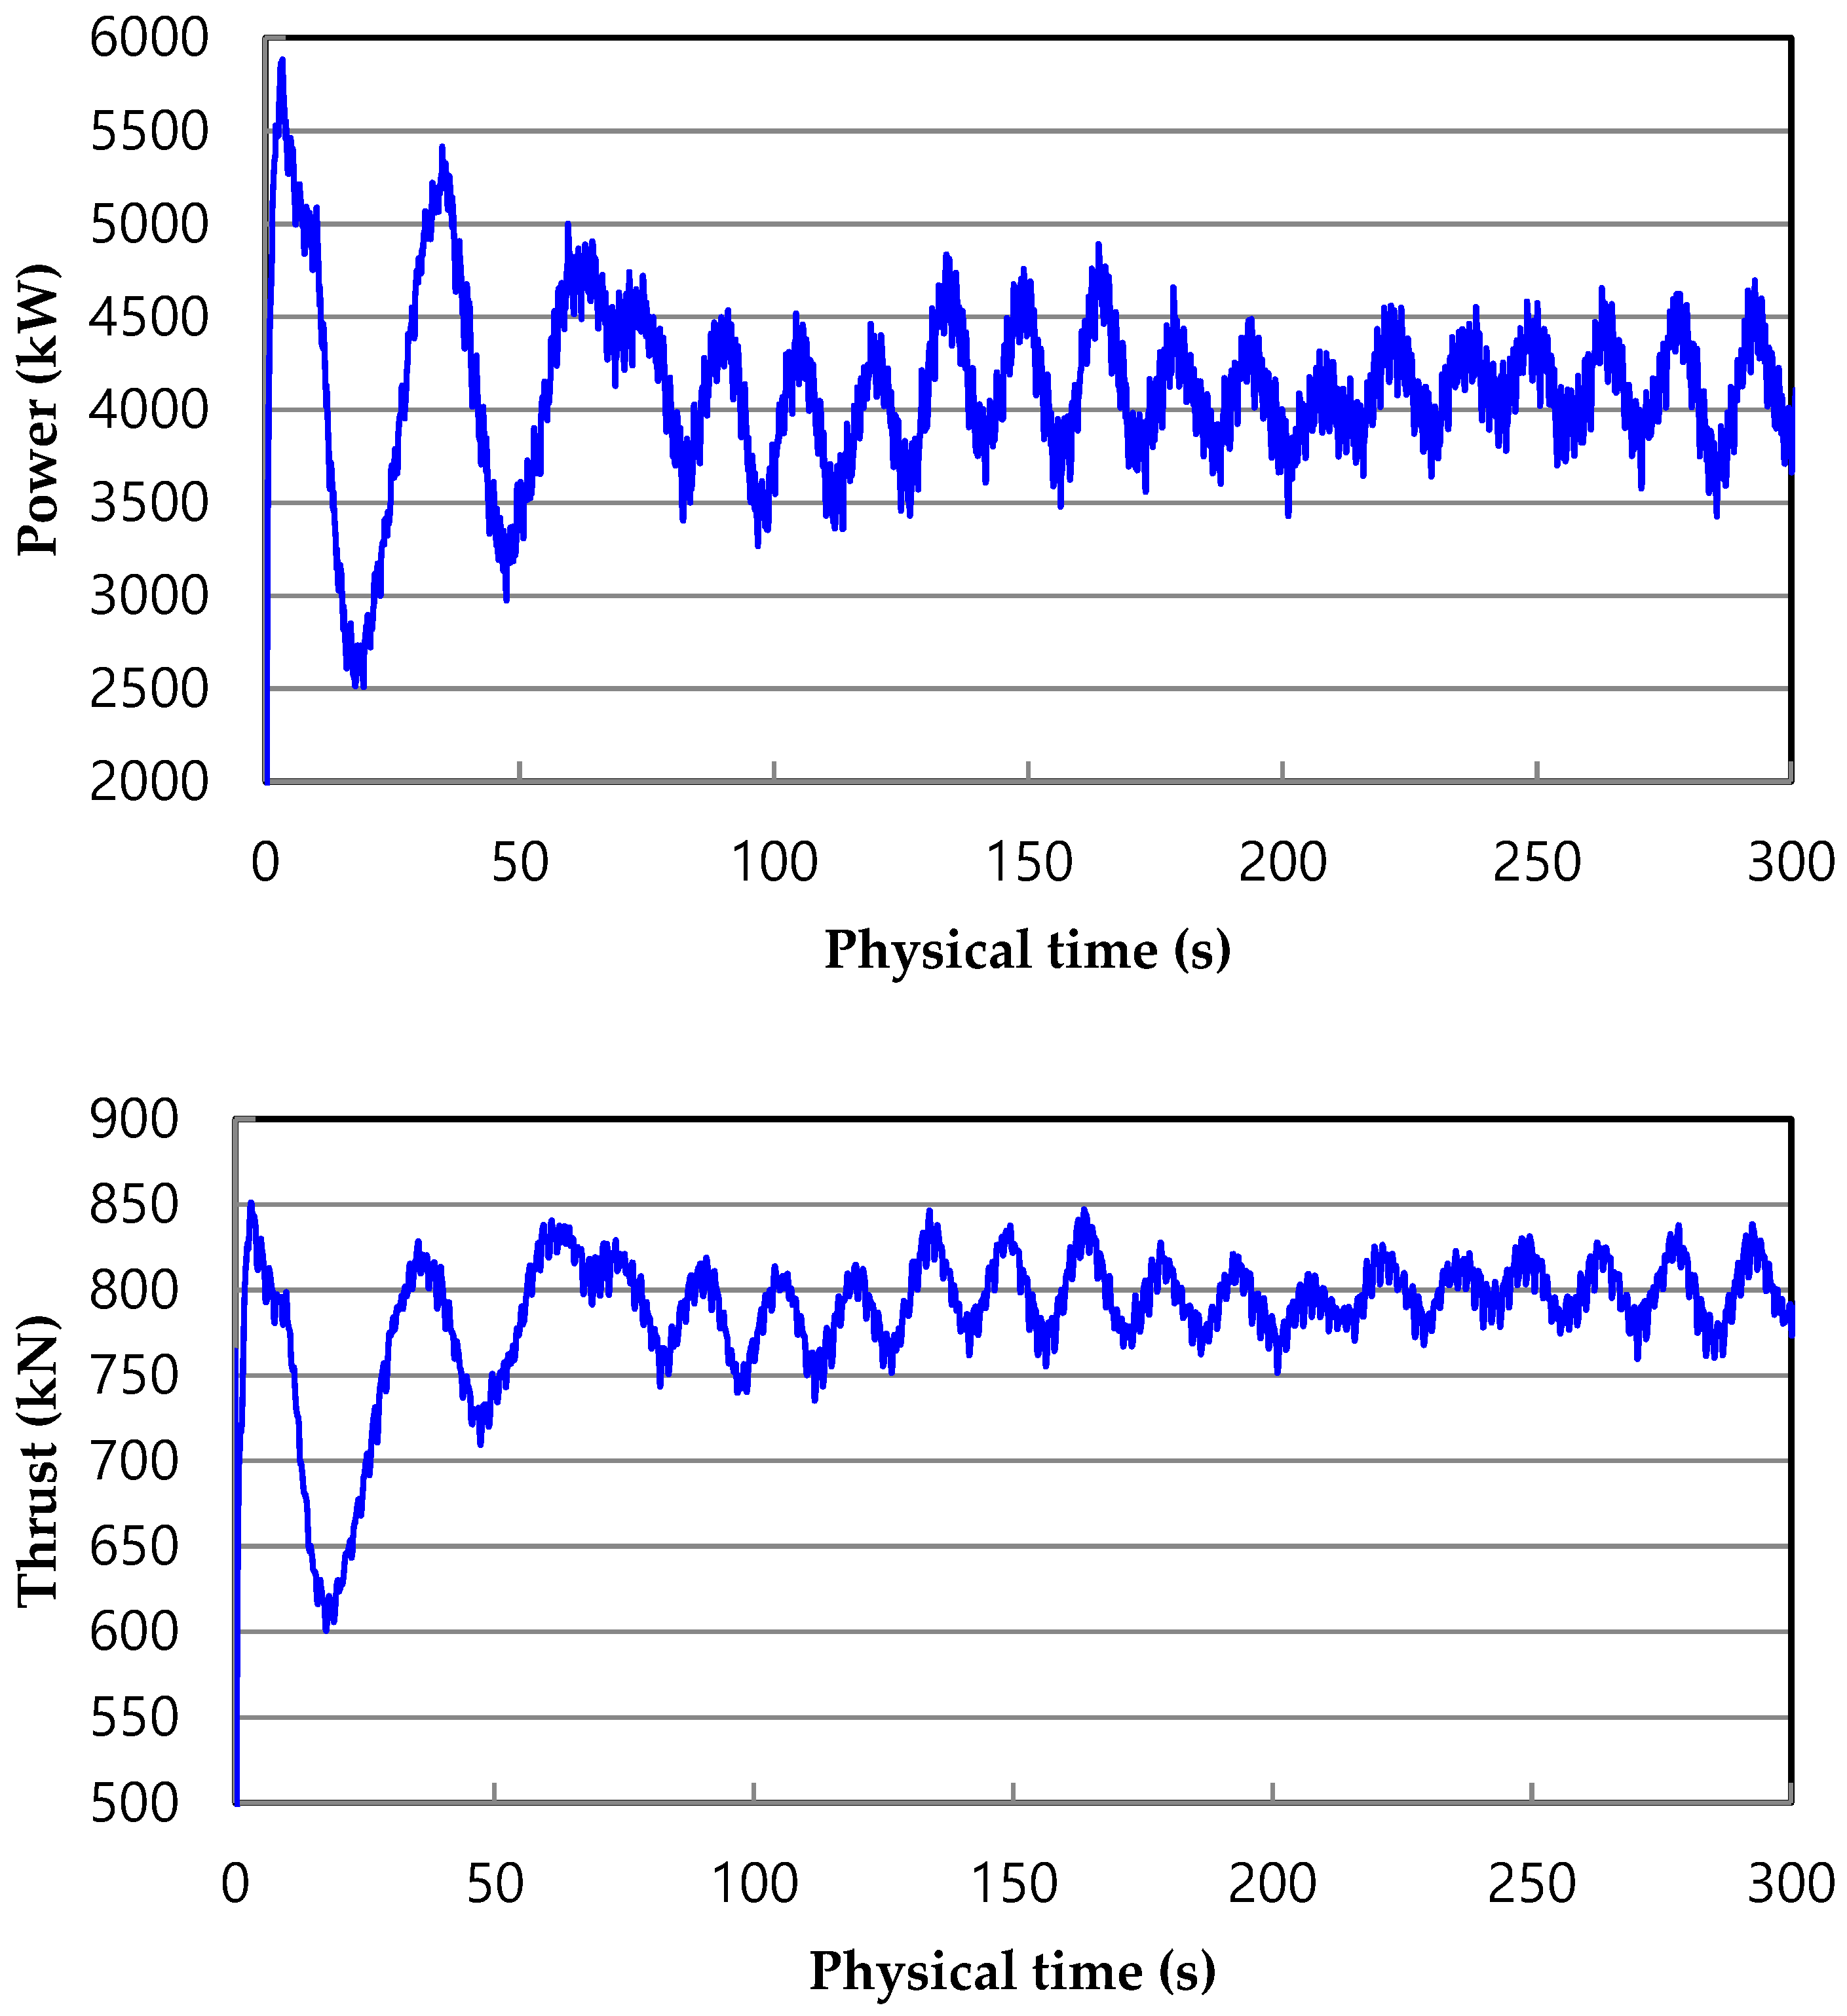
Thrust and power are two critical aerodynamic performance factors for evaluating a wind turbine. Thrust is defined as the integrated force component normal to the rotor plane. The power output and thrust force time-histories for the coupled simulation are presented in Figure 15 along with the dynamic responses of the pitch motion rate of the platform.
The response curves of power and thrust act at the same frequency as the incident wave. Due to the tower shade effect, the curves of power and thrust force exhibit periodical fluctuations with a period of 120° for the blade rotation. However, the effect of tower dam effects on the power output of the wind turbine is less than 5%. The variation of pitch motion also acts at the same frequency as the inlet wave. When the platform moves in the upwind direction, the power output and thrust force both increase, while the aerodynamic load decreases as the sign of the pitch motion changes. This is because the upwind pitch motion of the FOWT increases the relative velocity between the wind turbine and the inlet wind, and the angle of attack for each blade section increases correspondingly.
The dynamic responses of the wind turbine performance and typical platform motions after 300 s of the simulation are presented in 
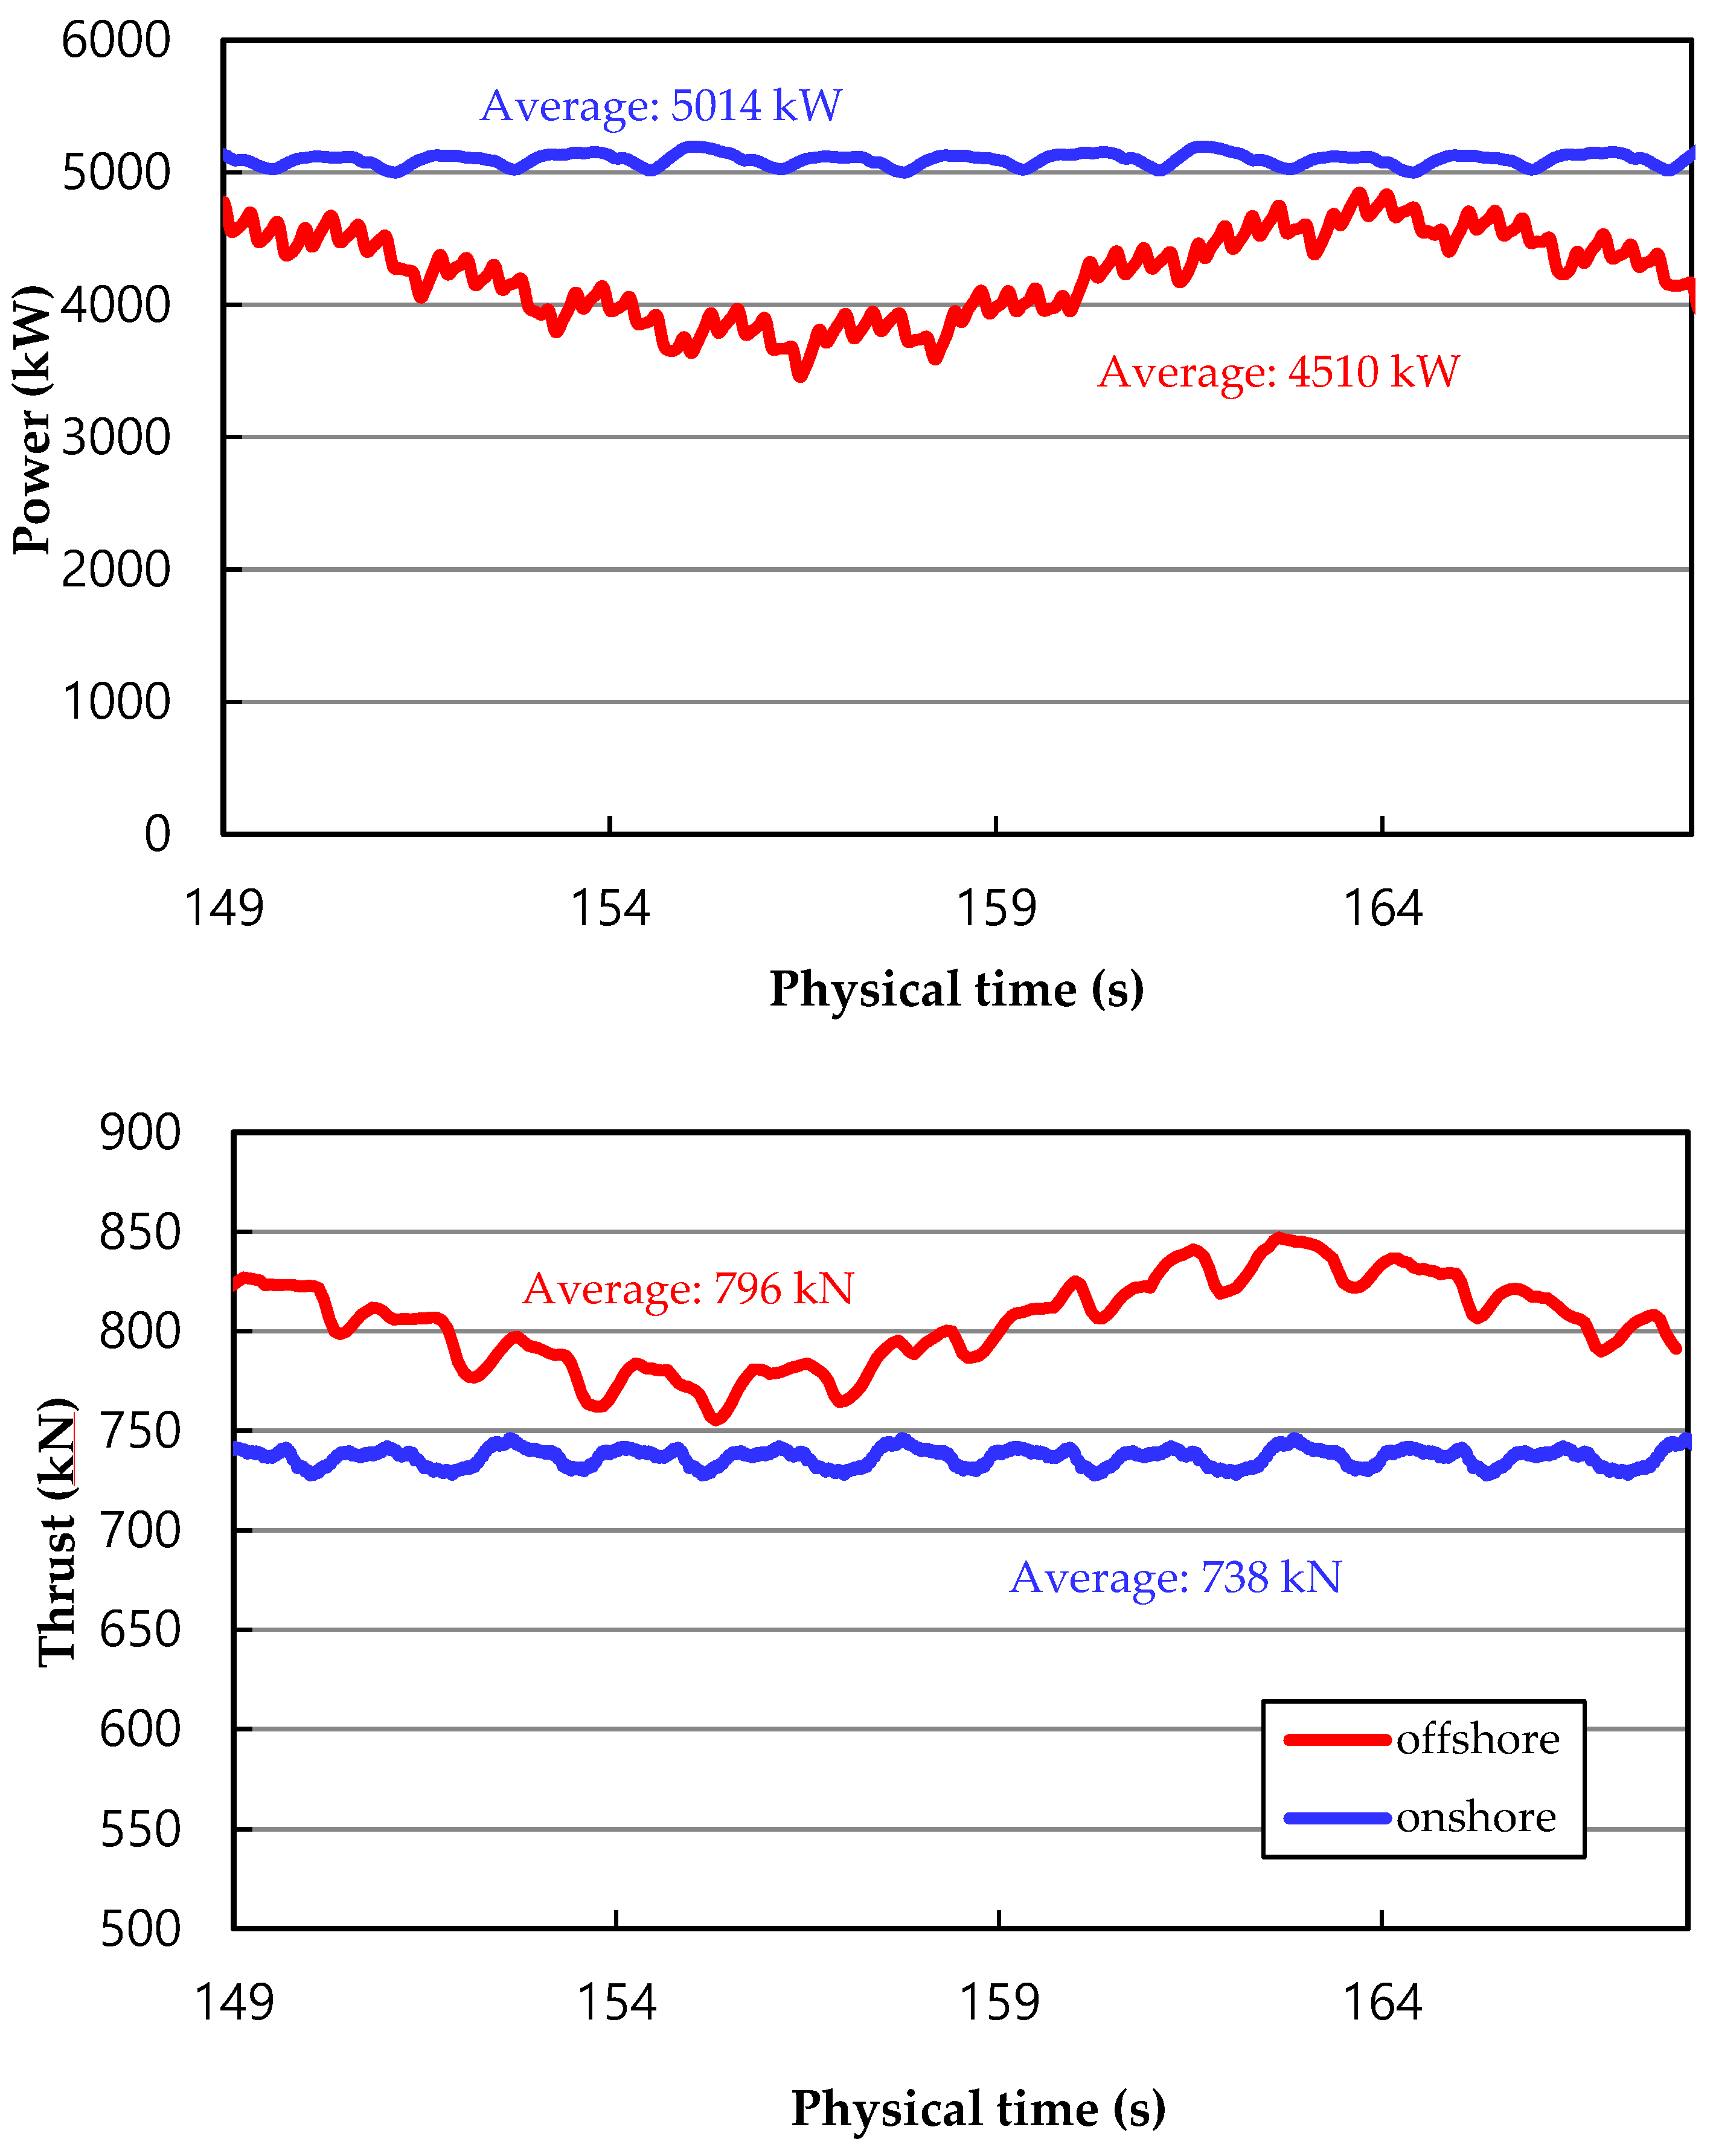
Table 8. The power output varies from 3446 kW to 4698 kW at a rated wind speed. The variation in power is larger than that in the thrust force, that is, the power output is more sensitive than the thrust force to platform motion. Then, aerodynamic performances of the onshore fixed wind turbine and offshore floating wind turbine were compared and the average thrust value was calculated over the last four periods. In the case of thrust, a 7.8% increase was observed in a floating offshore turbine, the floating offshore wind turbine had an average thrust around 796 kN and the onshore wind turbine had an average thrust of 738 kN, which indicated a relatively small load on the hub and blades. This is because of the thrust force acting on the top of the tower, meaning the platform always moves in the upwind direction to offset the capsizing moment induced by the thrust force. In the case of the power curve, the average power value was calculated over the last four periods. A 10% decrease was observed in the floating offshore wind turbine, which is likely due to the smaller project area and relative income wind speed when the platform pitches, as shown in Figure 16. Accordingly, the platform surges from 7.9 to 9.8 m, which is also due to the thrust force that must be offset by the mooring line tension.

7. Conclusions

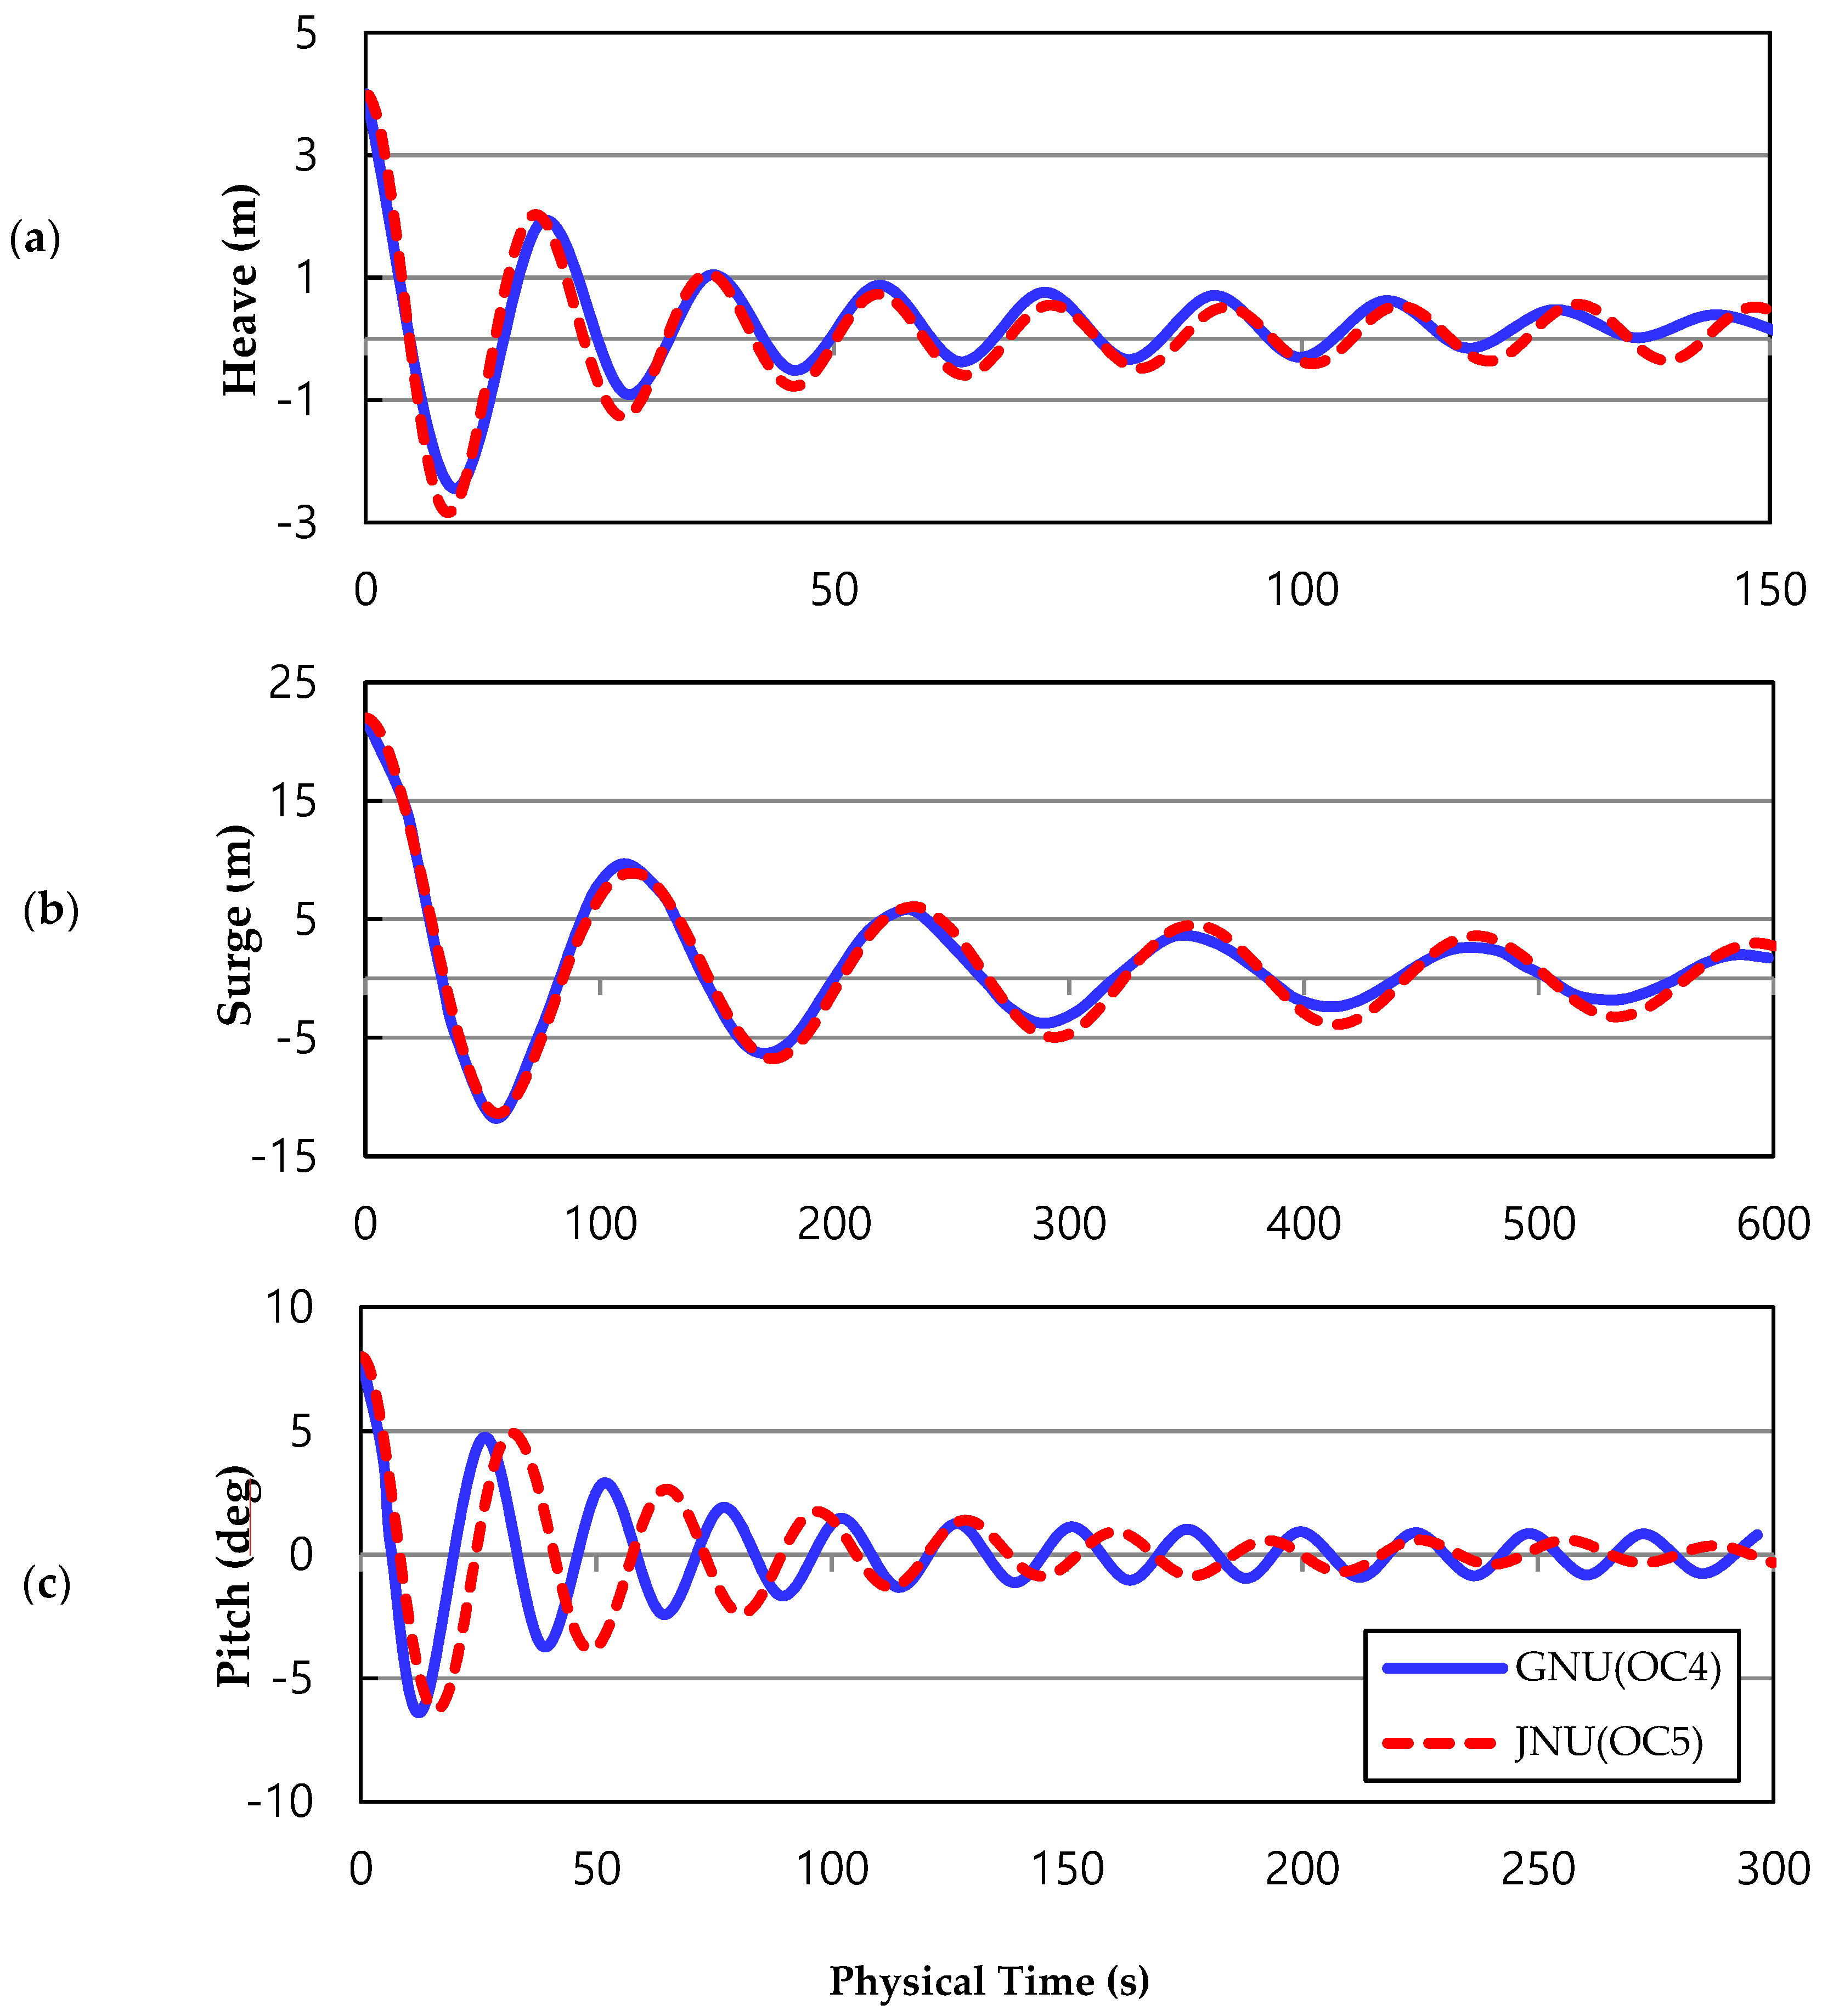
This investigation performed a CFD numerical analysis for a semi-submersible-type FOWT used in Phase II of the OC5 project, by advanced DFEI method and overlap mesh techno ledge. The full-configuration FOWT in a wind–wave excitation condition has been successfully performed, with simultaneous consideration of the wind turbine movement due to 6-DOF platform dynamics. The RAOs of the surge, heave, and pitch were compared to MARIN test data and data reported in previous studies when only the wave condition was considered. A slight discrepancy was observed between the CFD studies with regard to the pitch, possibly because of the different physical properties of the platform and mooring lines in the OC4 and OC5 projects. There was a relatively large discrepancy in the hydrodynamic response, which can induce large deviations in the prediction procedure. Particularly, pitch natural period showed a 21% discrepancy between OC4 and OC5 projects, as indicated by the results of the free decay test of the pitch and the numerical discrepancy in the RAOs in the regular wave test.
Besides, unsteady blade-tip vortices and strong flow interactions with the turbulent wakes of the tower due to the surge motion of the platform were successfully simulated and visualized using the advanced DFBI and VOF methods. The power and thrust force of the FOWT increased when the floating platform moved in the upwind direction, while the aerodynamic loads decreased as the pitch motion reversed direction. This can be explained by the variation in the angle of attack for each blade section when the FOWT system experiences pitch motion. All the 3-DOFs, including heave, surge, and pitch had smaller amplitudes compared with the results in the regular wave test without wind conditions. Incoming wind from the x-direction obviously has a large effect on the restoring force in the mooring line, and, as a result, the whole FOWT system cannot be restored back to the equilibrium position as in the regular wave test.
In addition, a relatively heavy load on the hub and blades was observed for the FOWT compared with the onshore wind turbine. This is because of the thrust force acting on the top of the tower, due to which the platform moves in the upwind direction to offset the capsizing moment induced by the thrust force. With regard to the power curve, a 10% decrease was observed for the floating offshore wind turbine, which is likely due to the smaller project area and relative income wind speed when the platform experiences pitch motion. Overall, there is a greater variation in the power than in the thrust force, that is, the power output is more sensitive than the thrust force to platform motions.
Until now, all published papers based on an OC4 project which was carried out in 2013 (this was code-to-code comparison project 5 years ago), which found a large discrepancy from the experimental test data of the OC5 project. This study could be a good insight for future studies, as there has not been any specific CFD research based on OC5 test data until now. Examination of the OC5 Phase II project, with a computational fluid dynamics code (which has a higher-fidelity model of the underlying physics), could help determine if there are some deficiencies in the hydrodynamic models being employed by participants in an OC5 code-to-test project [18].

Author Contributions

This research was supervised by B.K. All laboratory work was down by Y.Z.

Funding

This works was supported by “Development of multi-class large capacity wind power generator system specialized in Korea wind site” and “Human Resources in Energy Technology” of KETEP (Grant Nos 20173010024930 and 20184030202200) granted financial resource from the Ministry of Trade, Industry & Energy (MOTIE), Korea.

Conflicts of Interest

The authors declare no conflict of interest.

References

  1. Jonkman, J.M. Dynamics Modeling and Loads Analysis of an Offshore Floating Wind Turbine. Ph.D. Thesis, University of Colorado, Denver, CO, USA, 2007. [Google Scholar] [Green Version]
  2. Sebastian, T.; Lackner, M.A. Development of a free vortex wake method code for offshore floating wind turbines. Renew. Energy 2012, 46, 269–275. [Google Scholar] [CrossRef]
  3. Fernandez-Gamiz, U.; Zulueta, E.; Boyano, A.; Ansoategui, I.; Uriarte, I. Five Megawatt Wind Turbine Power Output Improvements by Passive Flow Control Devices. Energies 2017, 10, 742. [Google Scholar] [CrossRef]
  4. Fernandez-Gamiz, U.; Errasti, I.; Gutierrez-Amo, R.; Boyano, A.; Barambones, O. Computational Modelling of Rectangular Sub-Boundary Layer Vortex Generators. Appl. Sci. 2018, 8, 138. [Google Scholar] [CrossRef]
  5. Nematbakhsh, A.; Bachynski, E.E.; Gao, Z.; Moan, T. Comparison of wave load effects on a TLP wind turbine by using computational fluid dynamics and potential flow theory approaches. Appl. Ocean Res. 2015, 53, 142–154. [Google Scholar] [CrossRef] [Green Version]
  6. De Vaal, J.B.; Hansen, M.O.L.; Moan, T. Effect of wind turbine surge motion on rotor thrust and induced velocity. Wind Energy 2014, 17, 105–121. [Google Scholar] [CrossRef]
  7. Zhao, W.; Wan, D. Numerical study of interactions between phase II of OC4 wind turbine and its semi-submersible floating support system. J. Ocean Wind Energy 2015, 2, 45–53. [Google Scholar]
  8. Tran, T.T.; Kim, D.H.; Song, J. Computational fluid dynamic analysis of a floating offshore wind turbine experiencing platform pitching motion. Energies 2014, 7, 5011–5026. [Google Scholar] [CrossRef]
  9. Tran, T.T.; Kim, D.H. The coupled dynamic response computation for a semi-submersible platform of floating offshore wind turbine. J. Wind Eng. Ind. Aerodyn. 2015, 147, 104–119. [Google Scholar] [CrossRef]
  10. Liu, Y.; Xiao, Q.; Incecik, A.; Wan, D.C. Investigation of the effects of platform motion on the aerodynamics of a floating offshore wind turbine. J. Hydrodyn. Ser. B 2016, 28, 95–101. [Google Scholar] [CrossRef] [Green Version]
  11. Ren, N.; Li, Y.; Ou, J. Coupled wind-wave time domain analysis of floating offshore wind turbine based on Computational Fluid Dynamics method. J. Renew. Sustain. Energy 2014, 6, 1–13. [Google Scholar] [CrossRef]
  12. Quallen, S.; Xing, T.; Carrica, P.; Li, Y.; Xu, J. CFD simulation of a floating offshore wind turbine system using a quasi-static crowfoot mooring-line model. In Proceedings of the Twenty-third International Offshore and Polar Engineering Conference, Anchorage, AK, USA, 30 June–5 July 2013; International Society of Offshore and Polar Engineers: Mountain View, CA, USA, 2013. [Google Scholar]
  13. Tran, T.T.; Kim, D.H. Fully coupled aero-hydrodynamic analysis of a semisubmersible FOWT using a dynamic fluid body interaction approach. Renew. Energy 2016, 92, 244–261. [Google Scholar] [CrossRef]
  14. Gueydon, S. Aerodynamic damping on a semisubmersible floating foundation for wind turbines. Energy Procedia 2016, 94, 367–378. [Google Scholar] [CrossRef]
  15. Chen, J.; Hu, Z.; Wan, D.; Xiao, Q. Comparisons of the dynamical charateristics of a semi-submersible floating offshore wind turbine based on two different blade concepts. Ocean Eng. 2018, 153, 305–318. [Google Scholar] [CrossRef]
  16. Dunbar, A.J.; Craven, B.A.; Paterson, E.G. Development and validation of a tightly coupled CFD/6-DOF solver for simulating floating offshore wind turbine platforms. Ocean Eng. 2015, 110, 98–105. [Google Scholar] [CrossRef] [Green Version]
  17. Coulling, A.J.; Goupee, A.J.; Robertson, A.N.; Jonkman, J.M.; Dagher, D.J. Validation of a FAST semi-submersible floating wind turbine numerical model with DeepCwind test data. J. Renew. Sustain. Energy 2013, 5, 16–23. [Google Scholar] [CrossRef]
  18. Robertson, A. OC5 Project Phase II: Validation of Global Loads of the DeepCwind Floating Semisubmersible Wind Turbine. Energy Procedia 2017, 137, 38–57. [Google Scholar] [CrossRef]
  19. Menter, F.R. Two-Equation Eddy-Viscosity Turbulence Models for Engineering Applications. AIAA J. 1994, 32, 1598–1605. [Google Scholar] [CrossRef]
  20. Tran, T.T.; Kim, D.H. A CFD study into the influence of unsteady aerodynamic interference on wind turbine surge motion. Renew. Energy 2016, 90, 204–228. [Google Scholar] [CrossRef]
  21. Sivalingam, K.; Narasimalu, S. Floating Offshore Wind Turbine Rotor Operating State-Modified Tip Loss Factor in BEM and Comparison with CFD. Int. J. Tech. Res. Appl. 2015, 3, 179–189. [Google Scholar]
  22. Hsu, M.C.; Bazilevs, Y. Fluid-Structure Interaction Modeling of Wind Turbines: Simulating the Full Machine. Ph.D. Thesis, Iowa State University, Ames, IA, USA, 2012. [Google Scholar]
  23. Siddiqui, M.S.; Rasheed, A.; Kvamsdal, T. Quasi-Static & Dynamic Numerical Modeling of Full Scale NREL 5MW Wind Turbine. Energy Procedia 2017, 137, 460–467. [Google Scholar]
  24. Liu, Y.; Xiao, Q.; Incecik, A.; Wan, D. Establishing a fully coupled CFD analysis tool for floating offshore wind turbines. Renew. Energy 2017, 112, 280–301. [Google Scholar] [CrossRef]
  25. Tezdogan, T.; Demirel, Y.K.; Kellett, P.; Khorasanchi, M.; Incecik, A.; Turan, O. Full-scale unsteady RANS CFD simulations of ship behavior and performance in head seas due to slow steaming. Ocean Eng. 2015, 97, 186–206. [Google Scholar] [CrossRef]
Figure 1. Airfoil construction of National Renewable Engineering Lab (NREL) 5 MW blade.
Applsci 08 02314 g001
Figure 2. Semi-submersible model: (a) Full-scale model; (b) The 1/50th scale model in maritime research institute Netherlands (MARIN) wave basin.
Applsci 08 02314 g002
Figure 3. Flowchart of Dynamic Fluid Body Interaction (DFBI) method.
Applsci 08 02314 g003
Figure 4. Trim cell detail: (a) Mesh section near 45 m spinwise airfoil; (b) Trim mesh around blade tip; (c) Blade surface mesh.
Applsci 08 02314 g004
Figure 5. Power and thrust in 8, 11, 15, 20, and 25 m/s uniform wind speeds.
Applsci 08 02314 g005
Figure 6. Onshore 5 MW wind turbine fluid domain and boundary conditions.
Applsci 08 02314 g006
Figure 7. Torque curve between fluid structure interaction (FSI) method and unsteady method in 11 m/s wind speed.
Applsci 08 02314 g007
Figure 8. 3-DOF movement of platform by time domain: (a) Heave movement; (b) Surge movement; (c) Pitch movement.
Applsci 08 02314 g008
Figure 9. Comparison of response amplitude operators (RAOs) for surge, heave, and pitch.
Applsci 08 02314 g009
Figure 10. Full-coupled floating offshore wind turbines (FOWT) domain: (a) Mesh distribution in xz-plane; (b) Close-up view of mesh around platform; (c) Close-up view of mesh around wind turbine.
Applsci 08 02314 g010
Figure 11. Fully coupled floating offshore wind turbines (FOWT) domain fluid, domain size, and boundary conditions.
Applsci 08 02314 g011
Figure 12. Flow chart of fully coupled simulation in the wind–wave condition.
Applsci 08 02314 g012
Figure 13. Velocity scene and water elevation.
Applsci 08 02314 g013
Figure 14. Instantaneous iso-velocity contours within one period: (a) upwind direction movement; (b) downwind direction movement.
Applsci 08 02314 g014
Figure 15. Fully coupled FOWT aerodynamic performance.
Applsci 08 02314 g015
Figure 16. Comparison between onshore and offshore.
Applsci 08 02314 g016
Table 1. Full system structural properties.
ParametersValue
Mass1.3958 × 107 kg
Draft20 m
Displacement1.3917 × 104 m3
Center of mass (CM) location below seawater level (SWL)8.07 m
Roll inertia about system CM1.3947 × 1010 kg/m2
Pitch inertia about system CM1.5552 × 1010 kg/m2
Yaw inertia about system CM1.3692 × 1010 kg/m2
Table 2. Blade structural properties.
ParametersValue
Length (w.r.t. root along axis)61.5 m
Overall (integrated) mass2.2333 × 104 kg
Second mass moment of inertia1.48248 × 107 kg/m2
First mass moment of inertia4.5727 × 105 kg/m
CM location20.475 m
Table 3. Blade airfoil distribution of National Renewable Engineering Lab (NREL) 5 MW wind turbine.
Node Radius (m)Twist Angle (deg)Chord Length (m)Airfoil Designation
2.86713.3083.542Cylinder
5.60013.3083.854Cylinder
8.33313.3084.167Cylinder
11.75013.3084.557DU 40
15.85011.4804.652DU 35
19.95010.1624.458DU 35
24.0509.0114.249DU 30
28.1507.7954.007DU 25
32.2506.5443.748DU 25
36.3505.3613.502DU 21
40.4504.1883.256DU 21
44.5503.1253.010NACA 64-618
48.6502.3192.764NACA 64-618
52.7501.5262.518NACA 64-618
56.1670.8632.313NACA 64-618
58.9000.3702.086NACA 64-618
61.6330.1061.419NACA 64-618
Table 4. Comparison of OC4 and OC5 project.
Semisubmersible PlatformOC5 Phase IIOC4 Phase II
Mass12,919,000 kg13,444,000 kg
Draft20 m20 m
CM below SWL14.09 m14.4 m
Roll inertia7.5534 × 109 kg/m28.011 × 109 kg/m2
Pitch inertia8.2236 × 109 kg/m28.011 × 109 kg/m2
Yaw inertia1.3612 × 1010 kg/m21.391 × 1010 kg/m2
Buoyancy center below SWL13.15 m-
Mooringline anchors from center837.6 m837.6 m
Mooringline fairlead from center40.868 m40.868 m
Unstretched mooringline length835.5 m835.5 m
Mooringline mass densityLine 1: 125.6 kg/m113.35 kg/m
Line 2: 125.8 kg/m
Line 3: 125.4 kg/m
Mooringline extensional stiffnessLine 1: 7.520 E8 N7.536 E8 N
Line 2: 7.461 E8 N
Line 3: 7.478 E8 N
6 degrees of freedom (DOF) Natural PeriodsSurge: 107 sSurge: 107 s
Sway: 112 sSway: 113 s
Heave: 17.5 sHeave: 17.5 s
Roll: 32.8 sRoll: 26.9 s
Pitch: 32.5 sPitch: 26.8 s
Yaw: 80.8 sYaw: 82.3 s
Table 5. Mesh convergence test.
MeshThrust (kN)Power (kW)Power Variation
14 millions7264980−5.0%
20 millions7284990−4.8%
22 millions7315080−3.0%
30 millions7305120−2.3%
38 millions73452400%
Table 6. Natural period in OC4 and OC5 project.
DOFOC5 Natural PeriodOC4 Natural Period
Surge107 s107 s
Sway112 s112 s
Heave17.5 s17.5 s
Roll32.8 s26.9 s
Pitch32.5 s26.8 s
Yaw80.8 s82.3 s
Table 7. Motion response amplitude operators (RAOs) in different environment conditions.
MotionWave OnlyWind-Wave Coupled
Surge (m/m)0.700.12
Heave (m/m)0.360.13
Pitch (deg/m)0.330.07
Table 8. Dynamic response of floating offshore wind turbines (FOWT) in the wind–wave condition.
ParametersValue
Power outputRange (kW)3446–4689
Mean value (kW)4181
Thrust forceRange (kN)759–838
Mean value (kN)801
Pitch angleRange (deg)4.5–5.3
Mean value (deg)4.9
Surge motionRange (m)7.9–9.8
Mean value (m)9.1
Heave motionRange (m)−0.7–0.7
Mean value (m)0.1

