Estimation of Suspended Matter, Organic Carbon, and Chlorophyll-a Concentrations from Particle Size and Refractive Index Distributions


Abstract
:
1. Introduction
2. Materials and Methods
2.1. Theory
2.1.1. Particle Mass Modelling from Apparent Density of Hydrated Matter
2.1.2. Particulate Organic Carbon and Chlorophyll-a Cell Volume Scaling
2.1.3. Refractive Index-Based Estimation of Particulate Organic Carbon and Chlorophyll-a
2.2. Methods
2.2.1. UK Coastal Waters (UKCW) Dataset
2.2.2. Depth Profiling
2.2.3. Flow Cytometry Measurement Protocol
2.2.4. PSD Extrapolations
2.2.5. Suspended Particulate Matter and Inorganic/Organic Suspended Matter
2.2.6. Particulate Organic Carbon
2.2.7. Chlorophyll-a
3. Results
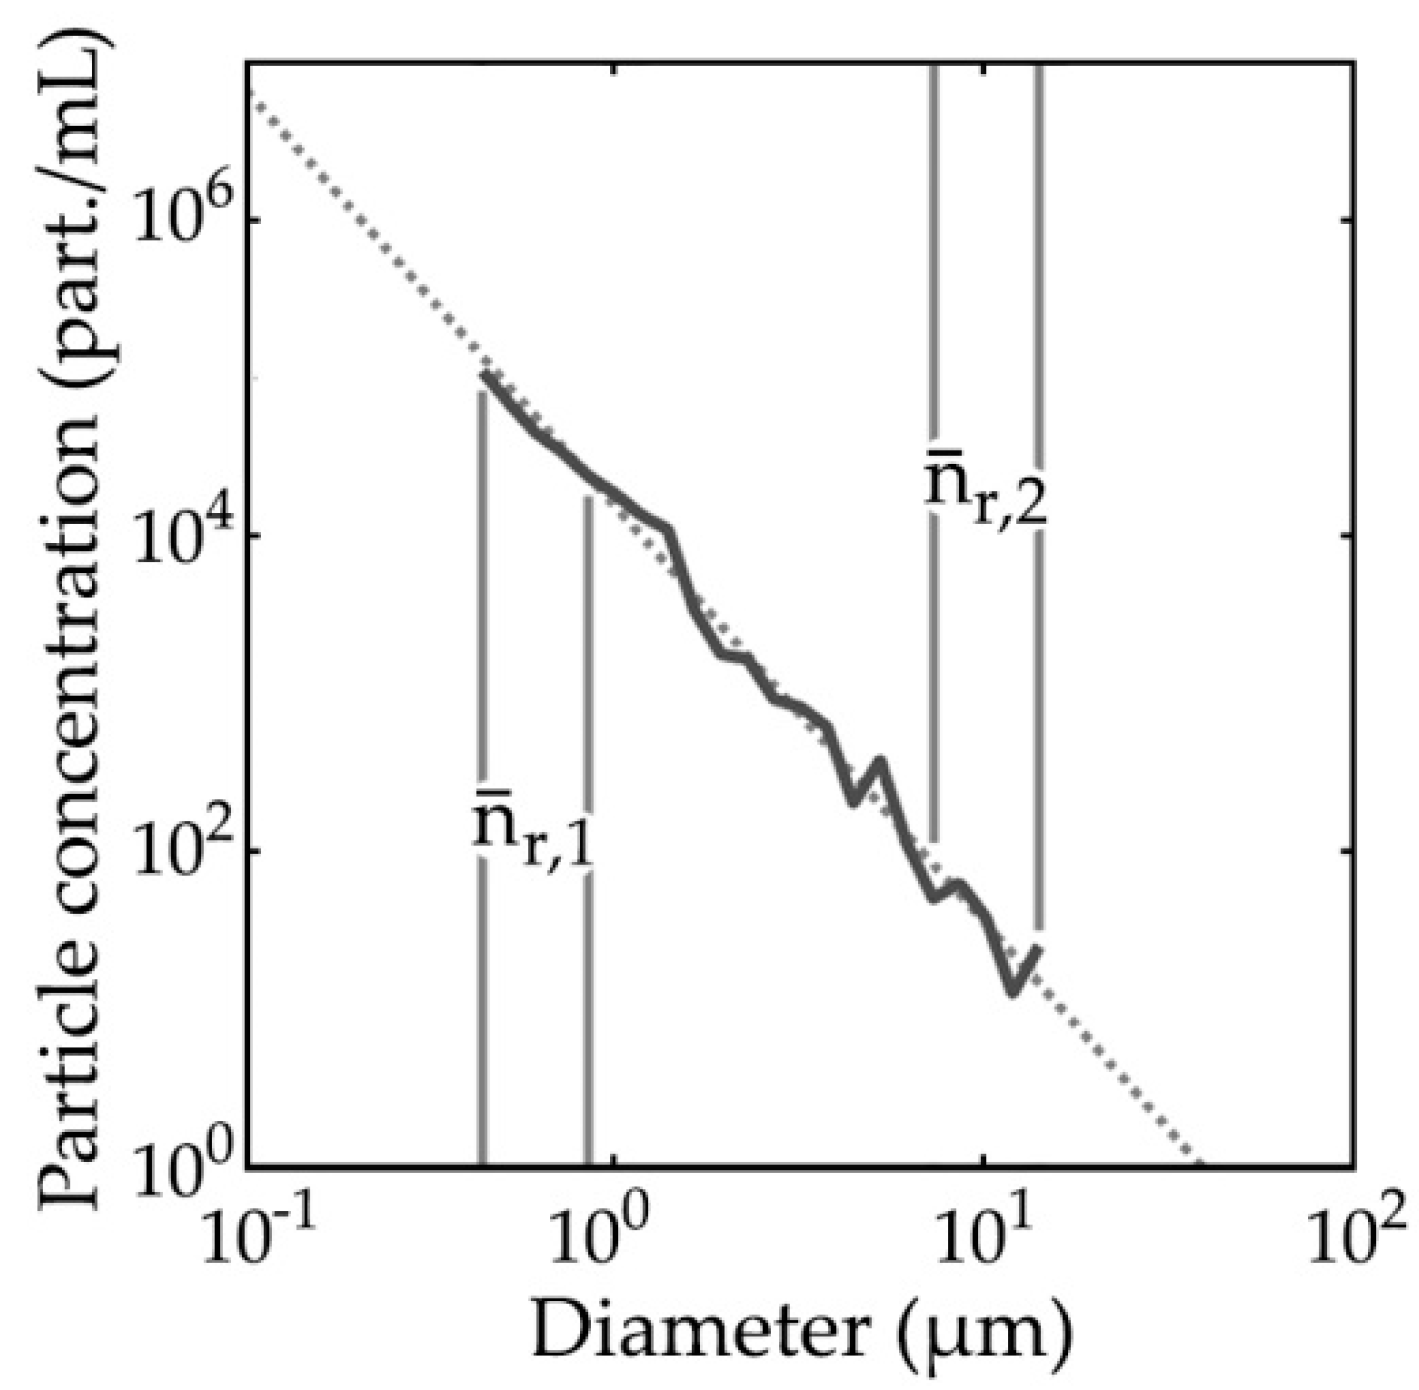
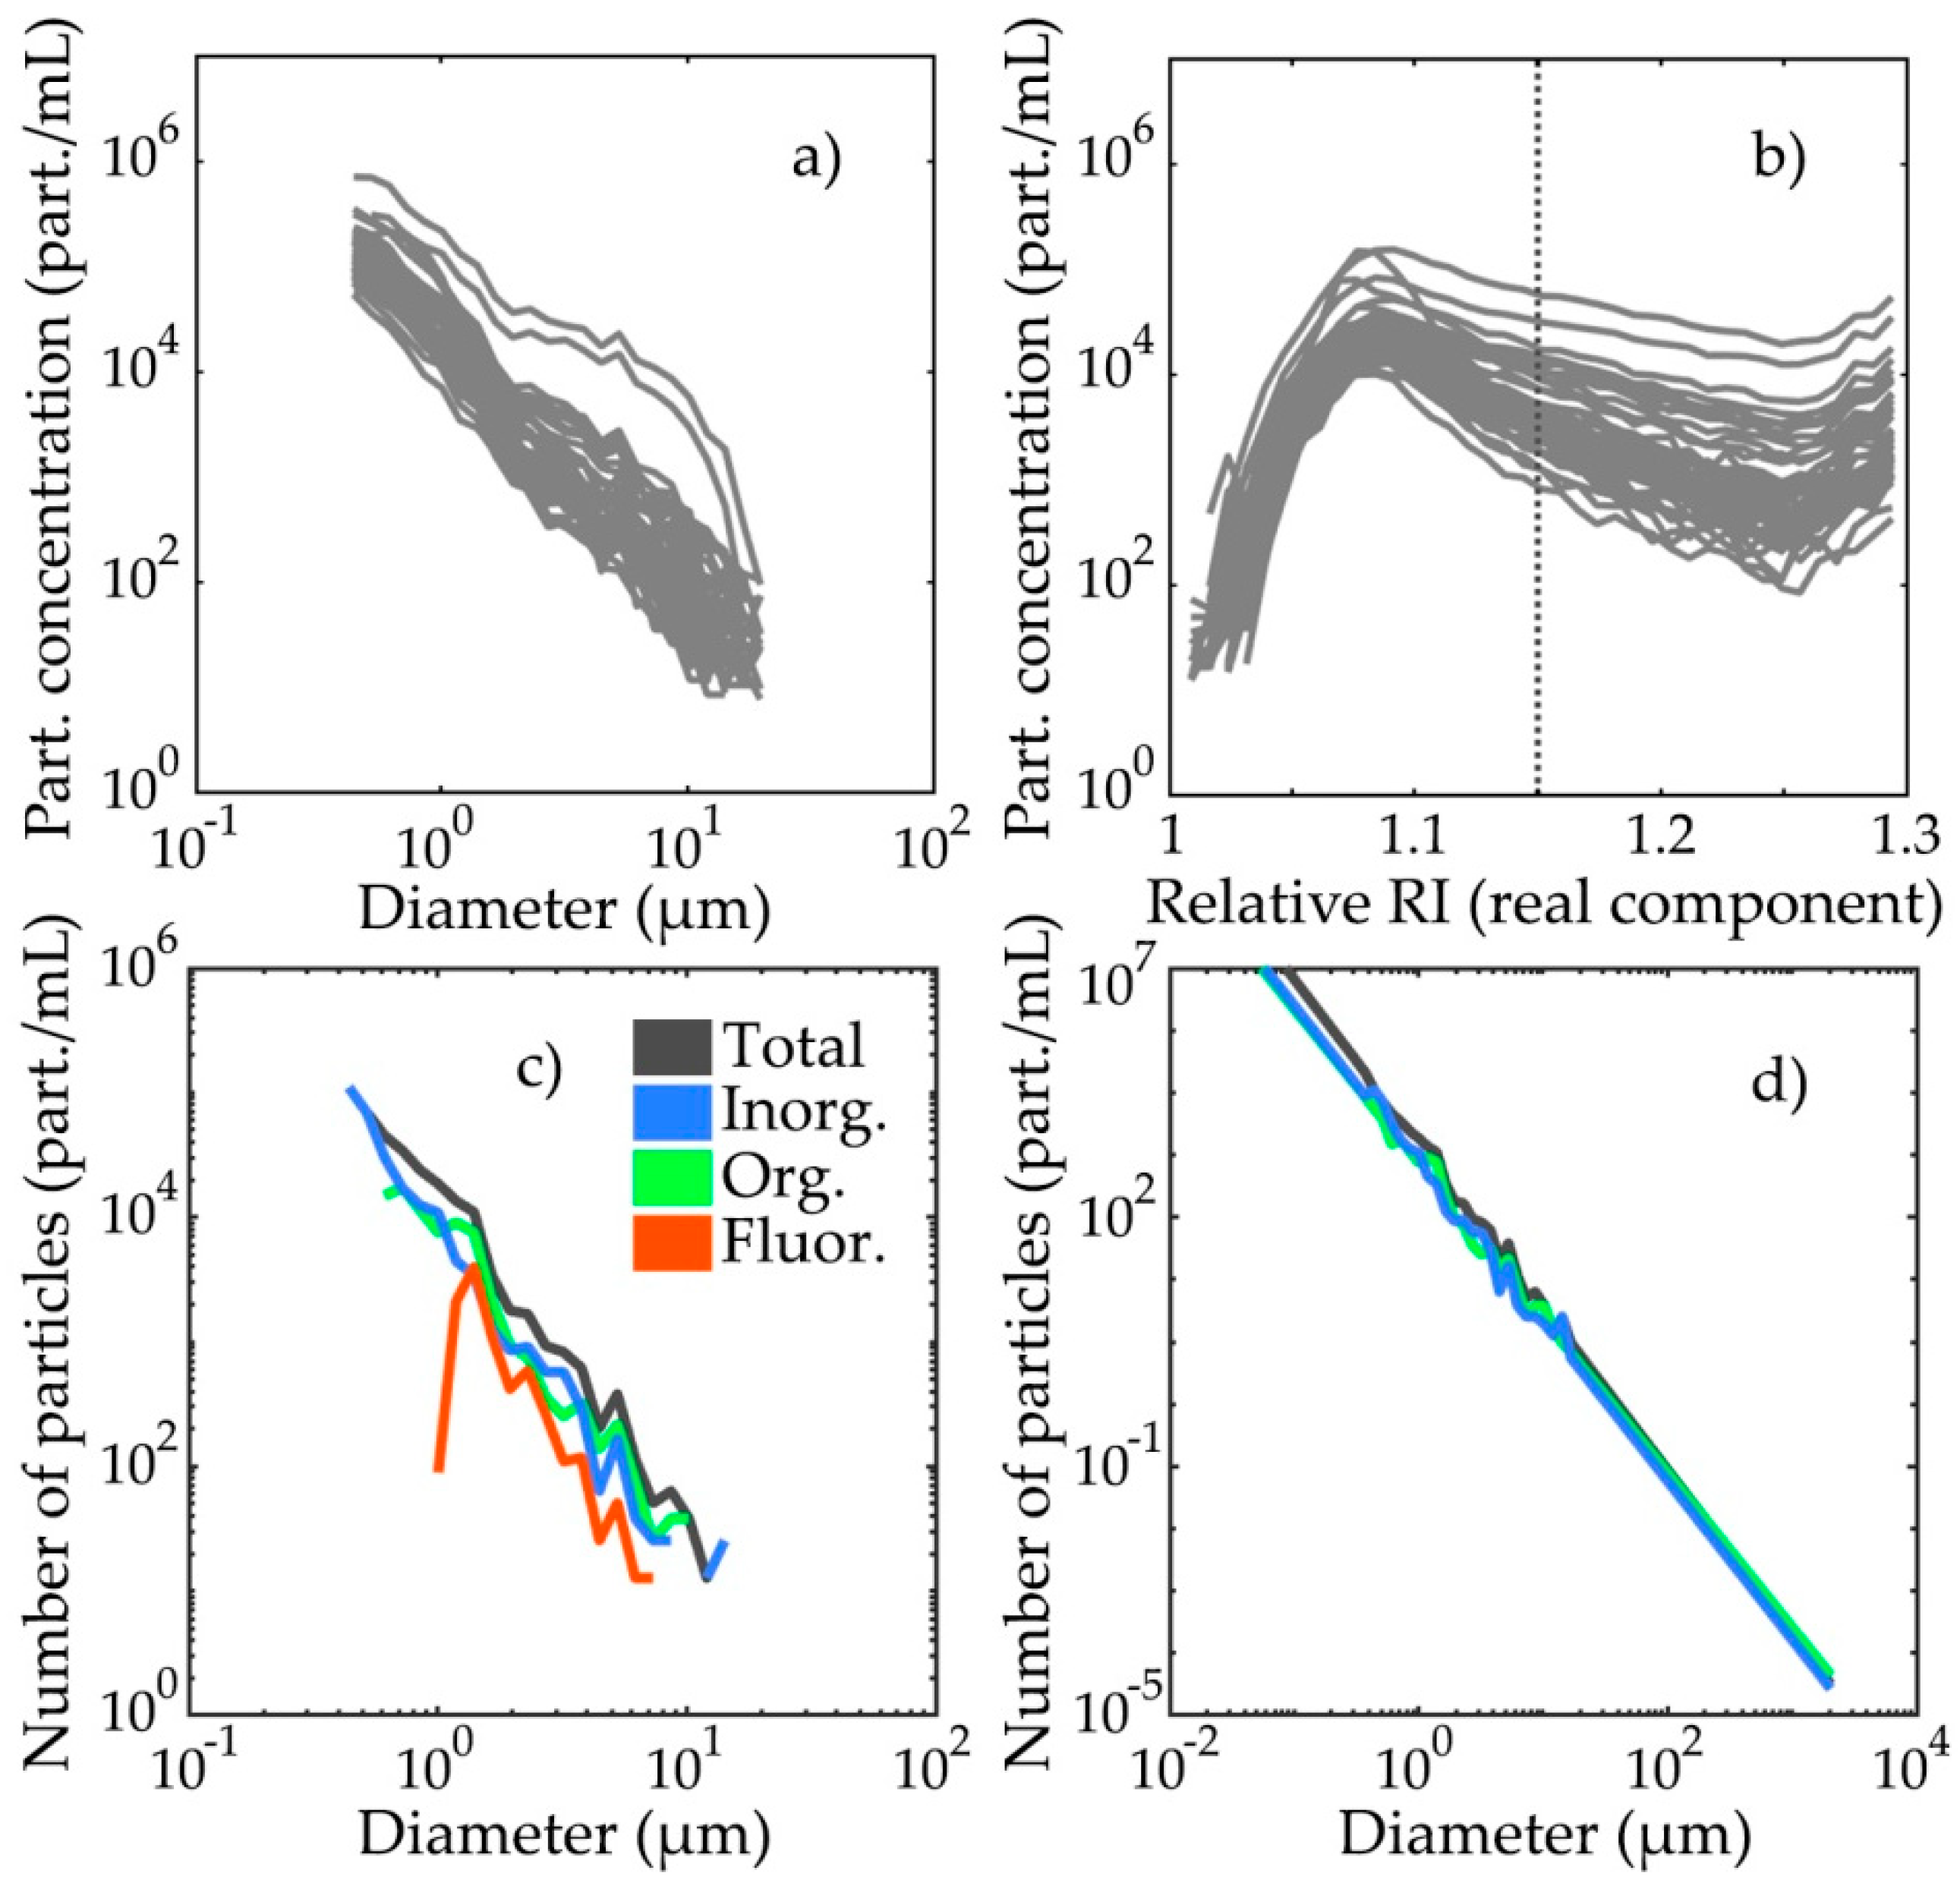
3.1. PSDs and PRIDs
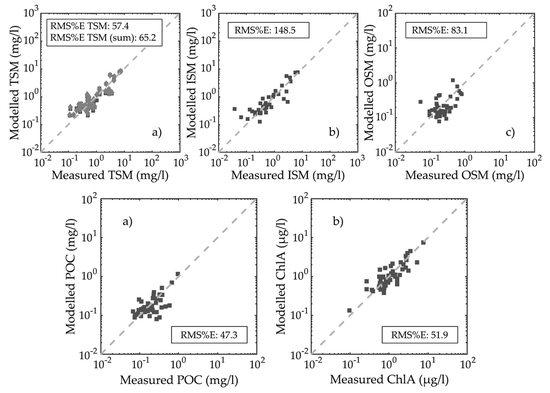
3.2. Particle Mass Modelling
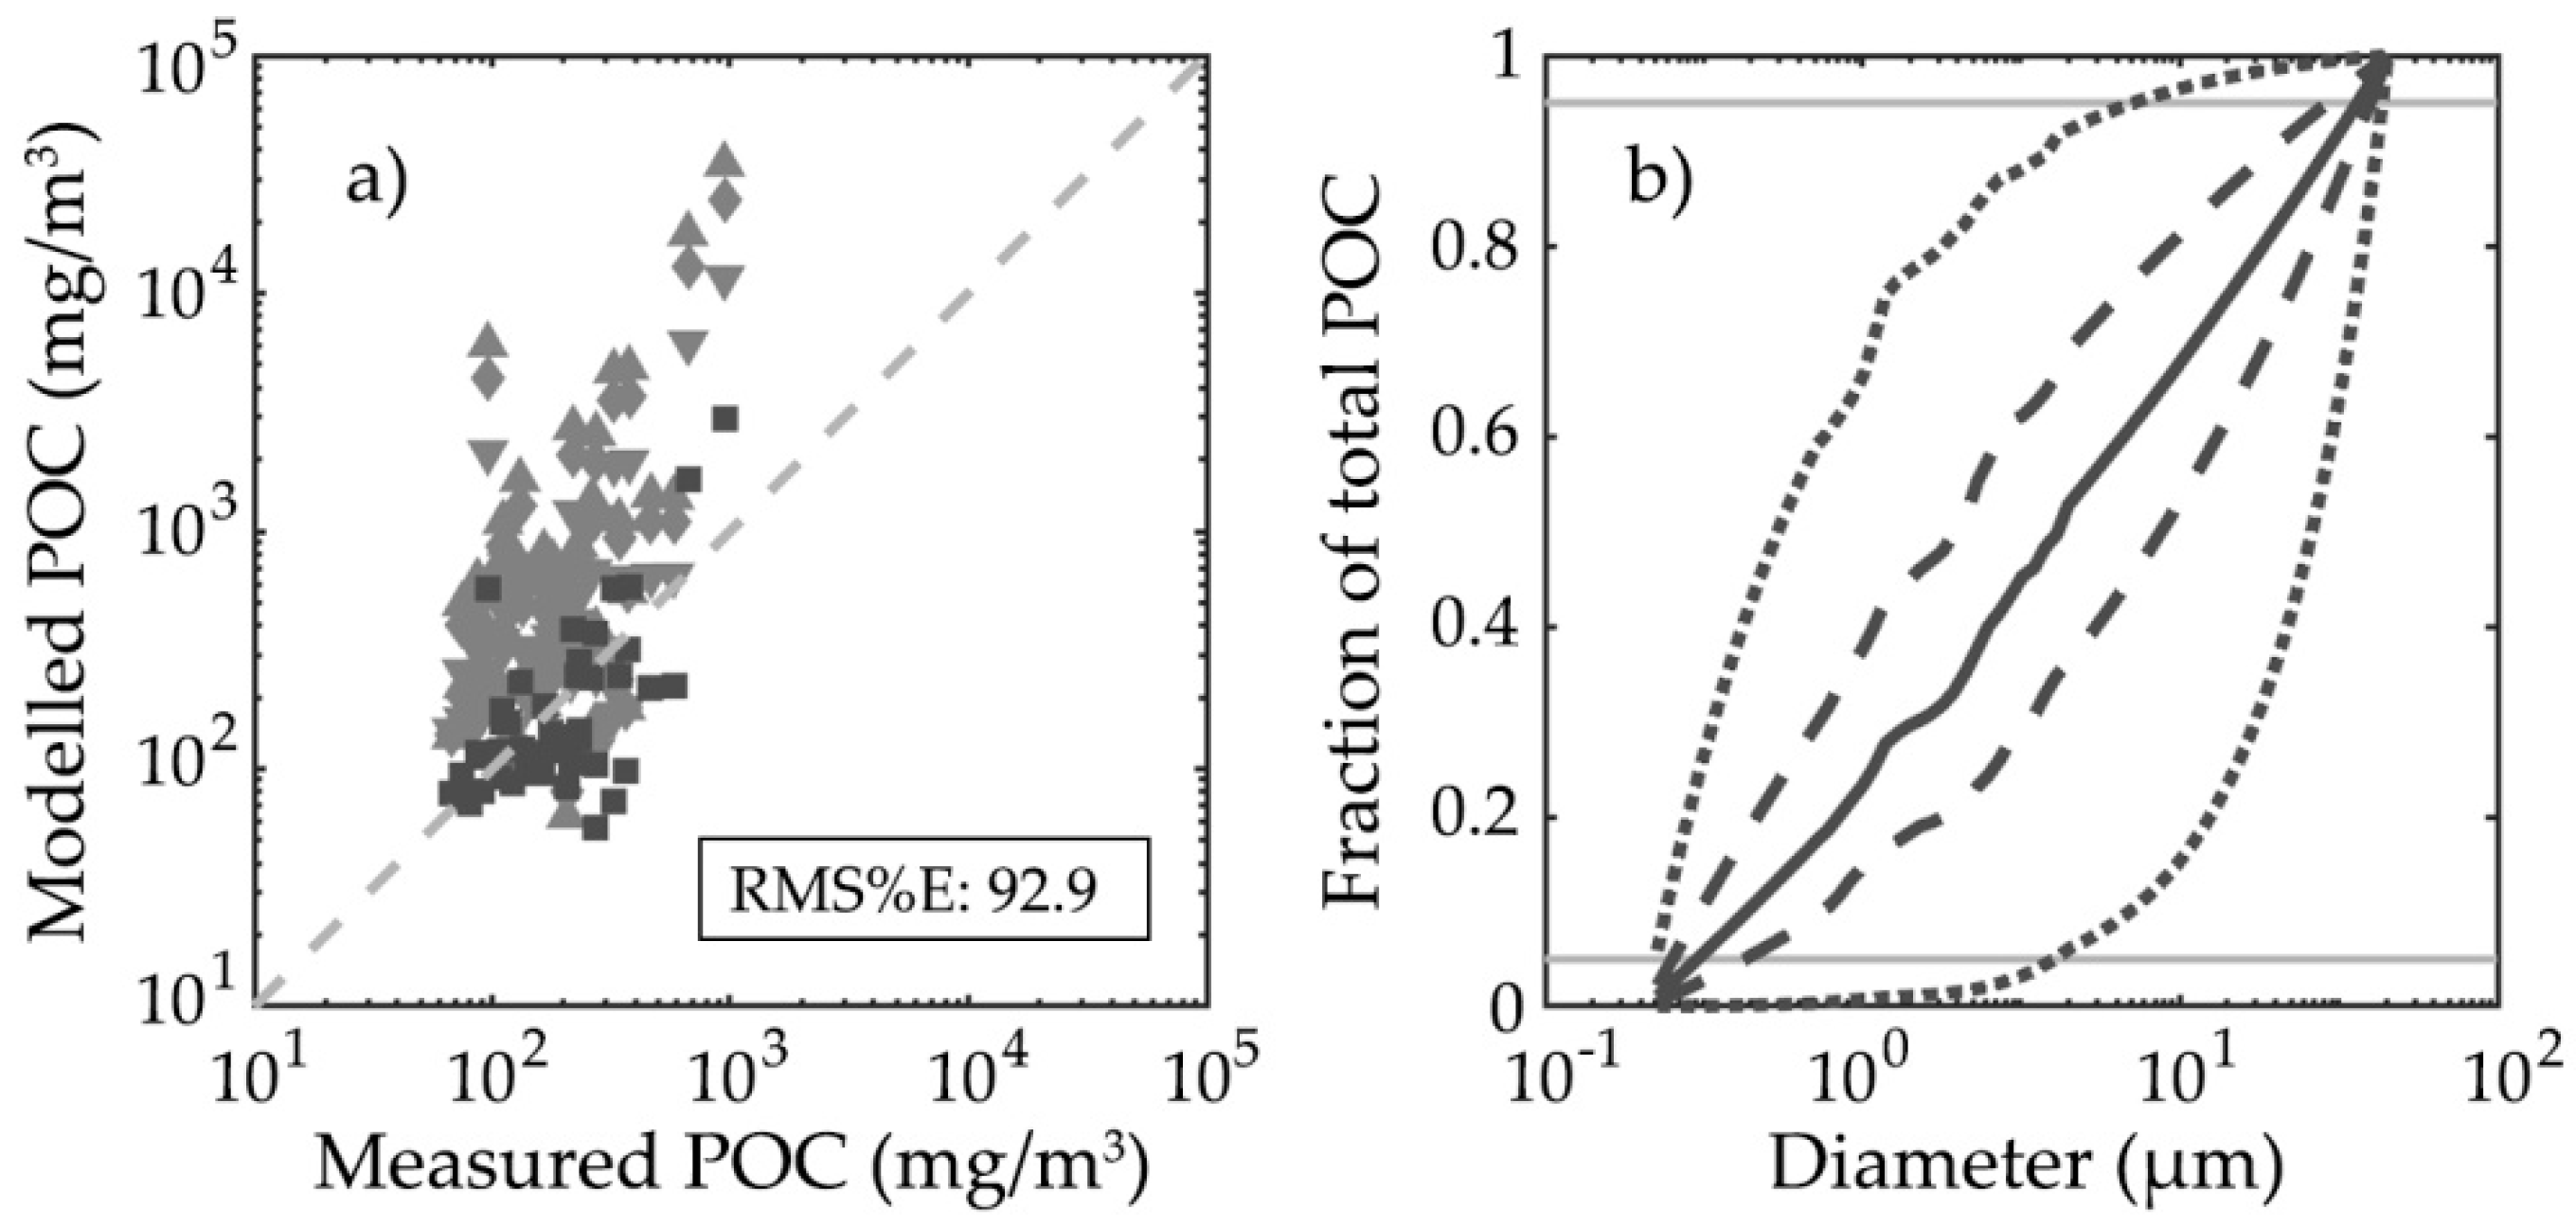
3.3. Particulate Organic Carbon and Chlorophyll-a Concentration Modelling
3.4. Particulate Organic Carbon and Chlorophyll-a Concentration Modelling Optimization
4. Discussion
5. Conclusions
Author Contributions
Funding
Acknowledgments
Conflicts of Interest
References
- Agagliate, J.; Röttgers, R.; Twardowski, M.S.; McKee, D. Evaluation of a flow cytometry method to determine size and real refractive index distributions in natural marine particle populations. Appl. Opt. 2018, 57, 1705–1716. [Google Scholar] [CrossRef] [PubMed]
- Agagliate, J.; Lefering, I.; McKee, D. Forward modelling of inherent optical properties from flow cytometry estimates of particle size and refractive index. Appl. Opt. 2018, 57, 1777–1788. [Google Scholar] [CrossRef] [PubMed]
- Ackleson, S.G.; Spinrad, R.W. Size and refractive index of individual marine particulates: A flow cytometric approach. Appl. Opt. 1988, 27, 1270–1277. [Google Scholar] [CrossRef] [PubMed]
- Green, R.E.; Sosik, H.M.; Olson, R.J.; DuRand, M.D. Flow cytometric determination of size and complex refractive index for marine particles: Comparison with independent and bulk estimates. Appl. Opt. 2003, 42, 526–541. [Google Scholar] [CrossRef] [PubMed]
- Green, R.E.; Sosik, H.M.; Olson, R.J. Contributions of phytoplankton and other particles to inherent optical properties in New England continental shelf waters. Limnol. Oceanogr. 2003, 48, 2377–2391. [Google Scholar] [CrossRef] [Green Version]
- Zhang, X.; Stavn, R.H.; Falster, A.U.; Gray, D.; Gould, R.W., Jr. New insight into particulate mineral and organic matter in coastal ocean waters through optical inversion. Estuar. Coast. Shelf Sci. 2014, 149, 1–12. [Google Scholar] [CrossRef]
- Morel, A.; Ahn, Y.-H. Optical efficiency factors of free-living marine bacteria: Influence of bacterioplankton upon the optical properties and particulate organic carbon in oceanic waters. J. Mar. Res. 1990, 48, 145–175. [Google Scholar] [CrossRef]
- Babin, M.; Morel, A.; Fournier-Sicre, V.; Fell, F.; Stramski, D. Light scattering properties of marine particles in coastal and open ocean waters as related to the particle mass concentration. Limnol. Oceanogr. 2003, 48, 843–859. [Google Scholar] [CrossRef] [Green Version]
- Aas, E. Refractive index of phytoplankton derived from its metabolite composition. J. Plankton Res. 1996, 18, 2223–2249. [Google Scholar] [CrossRef] [Green Version]
- Verity, P.G.; Robertson, C.Y.; Tronzo, C.R.; Andrews, M.G.; Nelson, J.R.; Sieracki, M.E. Relationships between cell volume and the carbon and nitrogen content of marine photosynthetic nanoplankton. Limnol. Oceanogr. 1992, 37, 1434–1446. [Google Scholar] [CrossRef] [Green Version]
- Montagnes, D.J.S.; Berges, J.A.; Harrison, P.J.; Taylor, F.J.R. Estimating carbon, nitrogen, protein, and chlorophyll a from volume in marine phytoplankton. Limnol. Oceanogr. 1994, 39, 1044–1060. [Google Scholar] [CrossRef]
- Menden-Deuer, S.; Lessard, E.J. Carbon to volume relationships for dinoflagellates, diatoms, and other protist plankton. Limnol. Oceanogr. 2000, 45, 569–579. [Google Scholar] [CrossRef] [Green Version]
- Álvarez, E.; Nogueira, E.; López-Urrutia, Á. In Vivo Single-Cell Fluorescence and Size Scaling of Phytoplankton Chlorophyll Content. Appl. Environ. Microbiol. 2017, 83, e03317-16. [Google Scholar] [CrossRef] [PubMed]
- Stramski, D.; Morel, A. Optical properties of photosynthetic picoplankton in different physiological states as affected by growth irradiance. Deep Sea Res. Part A Oceanogr. Res. Pap. 1990, 37, 245–266. [Google Scholar] [CrossRef]
- Stramski, D.; Reynolds, R.A. Diel variations in the optical properties of a marine diatom. Limnol. Oceanogr. 1993, 38, 1347–1364. [Google Scholar] [CrossRef] [Green Version]
- Stramski, D.; Shalapyonok, A.; Reynolds, R.A. Optical characterization of the oceanic unicellular cyanobacterium Synechococcus grown under a day-night cycle in natural irradiance. J. Geophys. Res. 1995, 100, 13295–13307. [Google Scholar] [CrossRef]
- Reynolds, R.A.; Stramski, D.; Kiefer, D.A. The effect of nitrogen limitation on the absorption and scattering properties of the marine diatom Thalassiosira pseudonana. Limnol. Oceanogr. 1997, 42, 881–892. [Google Scholar] [CrossRef]
- Durand, M.D.; Olson, R.J. Diel patterns in optical properties of the chlorophyte Nannochloris sp.: Relating individual-cell to bulk measurements. Limnol. Oceanogr. 1998, 43, 1107–1118. [Google Scholar] [CrossRef]
- Stramski, D. Refractive index of planktonic cells as a measure of cellular carbon and chlorophyll a content. Deep Sea Res. Part I Oceanogr. Res. Pap. 1999, 46, 335–351. [Google Scholar] [CrossRef]
- Durand, M.D.; Green, R.E.; Sosik, H.M.; Olson, R.J. Diel Variations in Optical Properties of Micromonas Pusilla (Prasinophyceae). J. Phycol. 2002, 38, 1132–1142. [Google Scholar] [CrossRef]
- Stramski, D.; Morel, A.; Bricaud, A. Modeling the light attenuation and scattering by spherical phytoplanktonic cells: A retrieval of the bulk refractive index. Appl. Opt. 1988, 27, 3954–3956. [Google Scholar] [CrossRef] [PubMed]
- Reynolds, R.A.; Stramski, D.; Wright, V.M.; Woźniak, S.B. Measurements and characterization of particle size distributions in coastal waters. J. Geophys. Res. 2010, 115. [Google Scholar] [CrossRef]
- Davies, E.J.; McKee, D.; Bowers, D.; Graham, G.W.; Nimmo-Smith, W.A.M. Optically significant particle sizes in seawater. Appl. Opt. 2014, 53, 1067. [Google Scholar] [CrossRef] [PubMed] [Green Version]
- Bader, H. The hyperbolic distribution of particle sizes. J. Geophys. Res. 1970, 75, 2822–2830. [Google Scholar] [CrossRef]
- Sheldon, R.W.; Prakash, A.; Sutcliffe, W.H., Jr. The size distribution of particles in the ocean. Limnol. Oceanogr. 1972, 17, 327–340. [Google Scholar] [CrossRef] [Green Version]
- Junge, C.E. Air Chemistry and Radioactivity; Academic Press: New York, NY, USA, 1963; ISBN-13 9780123921505. [Google Scholar]
- Stramski, D.; Kiefer, D.A. Light scattering by microorganisms in the open ocean. Prog. Oceanogr. 1991, 28, 343–383. [Google Scholar] [CrossRef]
- Ulloa, O.; Sathyendranath, S.; Platt, T. Effect of the particle-size distribution on the backscattering ratio in seawater. Appl. Opt. 1994, 33, 7070. [Google Scholar] [CrossRef] [PubMed]
- Röttgers, R.; Heymann, K.; Krasemann, H. Suspended matter concentrations in coastal waters: Methodological improvements to quantify individual measurement uncertainty. Estuar. Coast. Shelf Sci. 2014, 151, 148–155. [Google Scholar] [CrossRef] [Green Version]
- Zapata, M.; Rodríguez, F.; Garrido, J.L. Separation of chlorophylls and carotenoids from marine phytoplankton: A new HPLC method using a reversed phase C8 column and pyridine-containing mobile phases. Mar. Ecol. Prog. Ser. 2000, 195, 29–45. [Google Scholar] [CrossRef]
- Risović, D. Two-component model of sea particle size distribution. Deep Sea Res. Part I Oceanogr. Res. Pap. 1993, 40, 1459–1473. [Google Scholar] [CrossRef]
- Twardowski, M.S.; Boss, E.; Macdonald, J.B.; Pegau, W.S.; Barnard, A.H.; Zaneveld, J.R.V. A model for estimating bulk refractive index from the optical backscattering ratio and the implications for understanding particle composition in case I and case II waters. J. Geophys. Res. 2001, 106, 14129–14142. [Google Scholar] [CrossRef] [Green Version]
- Khelifa, A.; Hill, P.S. Models for effective density and settling velocity of flocs. J. Hydraul. Res. 2006, 44, 390–401. [Google Scholar] [CrossRef]
- Morel, A.; Bricaud, A. Theoretical results concerning light absorption in a discrete medium, and application to specific absorption by phytoplankton. Deep Sea Res. Part A Oceanogr. Res. Pap. 1981, 28, 1375–1393. [Google Scholar] [CrossRef]
- Marañón, E.; Cermeño, P.; Rodríguez, J.; Zubkov, M.V.; Harris, R.P. Scaling of phytoplankton photosynthesis and cell size in the ocean. Limnol. Oceanogr. 2007, 52, 2190–2198. [Google Scholar] [CrossRef] [Green Version]
- Stramski, D.; Bricaud, A.; Morel, A. Modeling the inherent optical properties of the ocean based on the detailed composition of the planktonic community. Appl. Opt. 2001, 40, 2929–2945. [Google Scholar] [CrossRef] [PubMed]
- Finkel, Z.V.; Irwin, A.J.; Schofield, O. Resource limitation alters the 3/4 size scaling of metabolic rates in phytoplankton. Mar. Ecol. Prog. Ser. 2004, 273, 269–279. [Google Scholar] [CrossRef] [Green Version]
- Mei, Z.P.; Finkel, Z.V.; Irwin, A.J. Light and nutrient availability affect the size-scaling of growth in phytoplankton. J. Theor. Biol. 2009, 259, 582–588. [Google Scholar] [CrossRef] [PubMed]


| Notation | Definition |
|---|---|
| ChlA | Chlorophyll-a concentration, mg m−3 |
| FC | Flow cytometer; flow cytometry |
| IOP | Inherent optical property |
| ISM | Inorganic suspended matter, g m−3 |
| OSM | Organic suspended matter, g m−3 |
| SPM | Suspended particulate matter, g m−3 |
| POC | Particulate organic carbon, mg m−3 |
| PRID | Particle real refractive index distribution |
| PSD | Particle size distribution |
| RMS%E | Root-mean-square percentage error |
| RMSE | Root-mean-square error |
| UKCW | UK coastal waters (dataset) |
| a, aC, achl | Slopes of the refractive index-based models and of the of the Ci and Chli optimized refractive index-based models respectively, kg m−3 |
| b | y-intercepts of the refractive index-based models, kg m−3 |
| F(r) | Fractal dimension, dimensionless |
| h1, h2 | Power law exponents of the optimized POC and ChlA volume scaling functions respectively, dimensionless |
| k | Particle size distribution scaling coefficient, mL−1 |
| k1, k2 | Scaling coefficients of the optimized POC and ChlA volume scaling functions respectively, pg µm−3 |
| mtot | Total particle mass, mg |
| Ci | Intraparticle carbon concentration, kg m−3 |
| Chli | Intraparticle chlorophyll-a concentration, kg m−3 |
| N(D) | Number concentration of particles within particle size bin corresponding to particle diameter D, mL−1 |
| N’(D) | Density function of the particle size distribution, mL−1 µm−1 |
| Nr | Number of particles within particle size bin corresponding to particle radius r, dimensionless |
| ND,nr | Number of particles within particle bin corresponding to particle diameter D and real refractive index nr, dimensionless |
| no | Real refractive index of the dry matter fraction of the particle, dimensionless |
| nr | Real refractive index of the particle, dimensionless |
| ni | Imaginary refractive index of the particle, dimensionless |
| Average real refractive indices at the upper and lower extremes of the particle size distribution respectively, dimensionless | |
| r, D | Particle radius and particle diameter, µm |
| ro | Primary particle radius, µm |
| VD | Particle volume, µm3 |
| Vo | Volume of the dry matter fraction of the particle, µm3 |
| y(r) | Volume scaling function |
| B | Fractal dimension exponent, dimensionless |
| γ | Power law slope, dimensionless |
| P | Particle density, g/m3 |
| ρnr | Density of a particle with real refractive index nr, g/m3 |
| ρo | Density of the dry matter fraction of the particle, g/m3 |
© 2018 by the authors. Licensee MDPI, Basel, Switzerland. This article is an open access article distributed under the terms and conditions of the Creative Commons Attribution (CC BY) license (http://creativecommons.org/licenses/by/4.0/).
Share and Cite
Agagliate, J.; Röttgers, R.; Heymann, K.; McKee, D. Estimation of Suspended Matter, Organic Carbon, and Chlorophyll-a Concentrations from Particle Size and Refractive Index Distributions. Appl. Sci. 2018, 8, 2676. https://0-doi-org.brum.beds.ac.uk/10.3390/app8122676
Agagliate J, Röttgers R, Heymann K, McKee D. Estimation of Suspended Matter, Organic Carbon, and Chlorophyll-a Concentrations from Particle Size and Refractive Index Distributions. Applied Sciences. 2018; 8(12):2676. https://0-doi-org.brum.beds.ac.uk/10.3390/app8122676
Chicago/Turabian StyleAgagliate, Jacopo, Rüdiger Röttgers, Kerstin Heymann, and David McKee. 2018. "Estimation of Suspended Matter, Organic Carbon, and Chlorophyll-a Concentrations from Particle Size and Refractive Index Distributions" Applied Sciences 8, no. 12: 2676. https://0-doi-org.brum.beds.ac.uk/10.3390/app8122676