1. Introduction
Natural gas hydrates (NGHs) are white crystalline compounds formed by the interaction of light hydrocarbons, carbon dioxide, and hydrogen sulfide with water under low-temperature and high-pressure coexisting conditions [
1]. NGH is regarded as having the most potential as alternative energy in the 21st century because of its numerous potential resources [
2,
3]. In recent decades, there has been a worldwide upsurge in the exploration, production, and development of NGH. However, the safe, efficient, and environmentally friendly exploitation of NGH resources has become a worldwide focus [
4,
5,
6,
7].
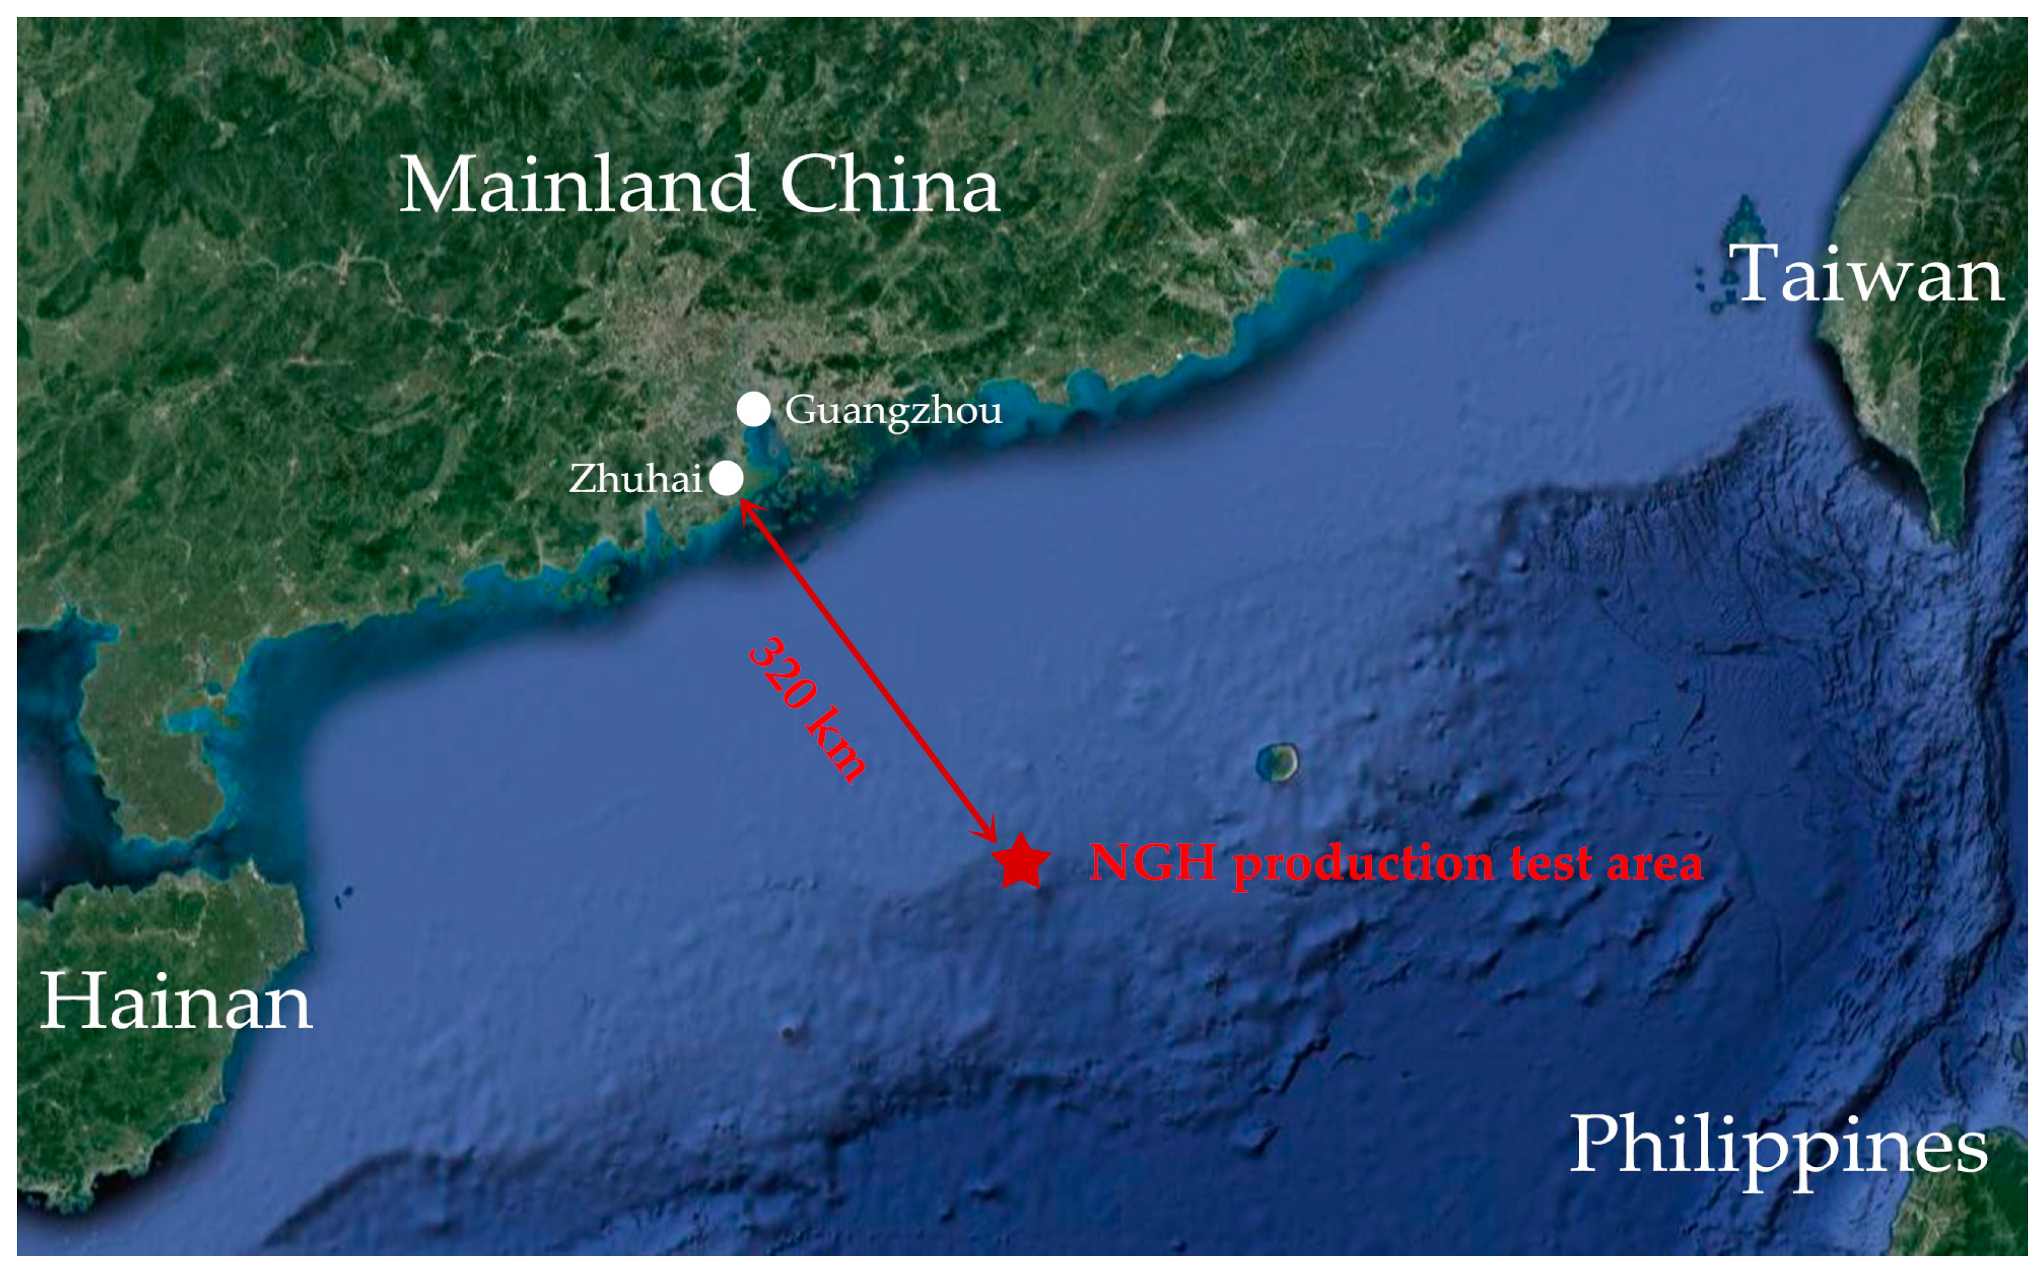
In 2017, China succeeded in exploiting NGH; the total methane output in 60 days was 3.0 × 10
5 m
3 [
8].
Figure 1 shows the location of this NGH production test in the Shenhu area of the South China Sea. This result indicates that the South China Sea has great potential for NGH resource exploitation. At present, common methods of NGH exploitation include depressurization, thermal stimulation, inhibitor injection, and carbon dioxide (CO
2) replacement [
9,
10,
11,
12]. However, these NGH exploitation methods have some limitations for NGH reservoirs in the South China Sea, which are characterized by shallow burial depth, non-trap structure, low consolidation strength, non-diagenesis, and low permeability [
13,
14]. Hydrate secondary formation and ice formation are easily caused by depressurization [
15,
16], which may block the permeability path of the non-diagenetic NGH reservoirs and be unfavorable for long-term exploitation. The main disadvantage of the thermal stimulation method is that the heat utilization efficiency is not high [
10,
17]. For the inhibitor injection method, injection of the chemical reagents for NGH recovery is not feasible and economical [
4,
18], and the low permeability of the NGH reservoirs will lead to the slow action of chemical reagents on NGH formation. In addition, owing to the weak cementation of the hydrate reservoirs, the above three exploitation methods are based on the principle of direct decomposition of NGH, which easily causes instability of the formation. With respect to the CO
2 replacement method, the production period is long [
12,
19], and similarly, the low permeability of the NGH reservoirs has a great impact on mining efficiency. Therefore, the above common methods cannot meet the requirements for safe, long-term, and efficient exploitation of NGH reservoirs in the South China Sea.
On the basis of this, an innovative exploitation method, namely, the solid fluidization mining method, which is suitable for exploiting non-diagenesis and weakly cemented marine NGH reservoirs, was proposed by Zhou [
13,
20].
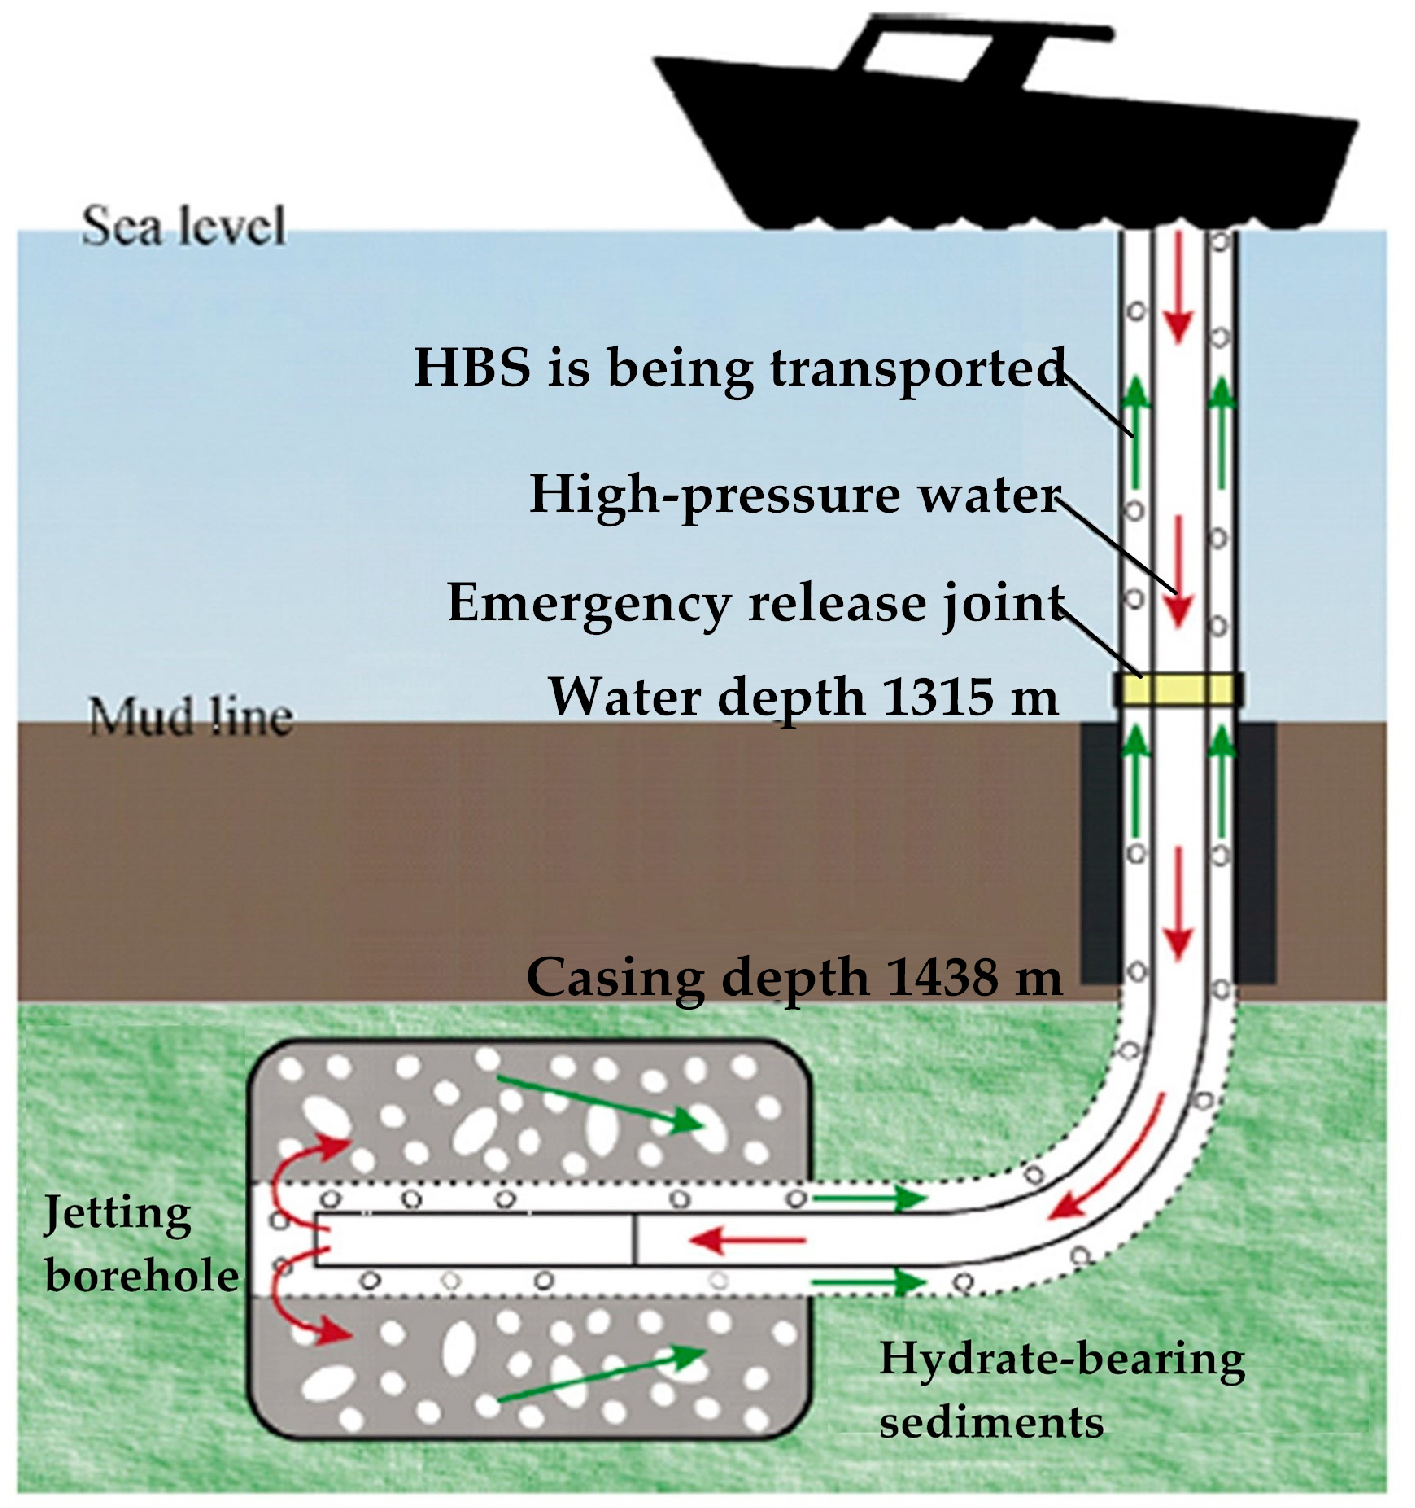
Figure 2 illustrates the schematic diagram of this method [
20]. The hydrate-bearing sediment (HBS) is crushed into fine solid particles by a high-pressure water jet at the bottom of the well, and then the fine particles are transported upward along the drilling fluid to the offshore platform. Finally, methane gas is obtained by decomposition, separation, and other postprocessing operations. Furthermore, the solid fluidization method was successfully applied to the trial production of NGH in the Shenhu sea area of the South China Sea [
13,
14]. The successful application of the solid-fluidization method shows that it is feasible to exploit NGH with a high-pressure water jet.
The water jet erosion of HBS is one of the core technologies of the solid fluidization method [
13,
14]. However, there are few studies dealing with the water jet erosion of HBS, described as follows. Zhou [
13] carried out experiments to research the solid fluidization exploitation mechanism of hydrates. In the experiments, the pipeline transport efficiency and the water jet erosion efficiency of HBS were obtained, but they were not discussed in detail. Wang [
14] designed nozzle tools for HBS jet erosion and the relationship between the borehole diameter and the breaking rate of NGH were investigated, however, the water jet erosion efficiency of HBS under different operation parameters was not researched. In addition, what these investigations have in common is that the samples synthesized by mimicking HBS were used for water impingement, such as the sand soil model, the pure ice model, and the cement model. The primary reason is that it is difficult to carry out water jet erosion of HBS test under high-pressure and low-temperature coexisting conditions (hydrate stable existence), and the test requires high operation capacity of the device. Compared with the experimental method, numerical simulation is a common research method which is not susceptible to the limitation of experimental conditions [
21,
22,
23]. Furthermore, the stress distribution of HBS and the flow situations can be obtained through numerical simulation [
22,
24], which is conducive to revealing the water jet erosion mechanism. Therefore, by using the numerical simulation method, this paper attempts to study the water jet erosion performance of HBS under different operation parameters.
The high-pressure water jet erosion of HBS is a fluid-solid coupling problem and simulations of fluid-solid coupling is complicated. Fortunately, LS-DYNA software has been developed specifically for such complex and intricate analyses [
25]. The Arbitrary Lagrangian–Eulerian (ALE) method is available in this software and is considered by many scholars to be an effective method for analyzing the fluid–solid coupling problem [
21,
22,
23,
24,
26]. Therefore, based on LS-DYNA software, this paper adopted the ALE method to establish numerical models for the water jet erosion of HBS in the Shenhu area of the South China Sea. However, it should be noted that the material model selection for HBS is crucial to establishing the numerical models.
The hydrates of the Shenhu area of the South China Sea are hosted in unconsolidated clay or sandy clay in a dispersion state and it is cemented together with marine sediments [
27,
28,
29,
30]. Compared with original marine sediments, HBSs have greater cohesion and internal friction angle, as well as higher consolidating strength [
31,
32,
33]. As a consequence, this paper simplified the HBS as the soil body with improved mechanical properties, and the material model of *MAT_FHWA_SOIL [
34] was adopted to describe the HBS.
Within this framework, based on an orthogonal experimental design of a numerical simulation, the sensitivity of work parameters (jet velocity, standoff distance, and nozzle diameter) on the water jet erosion of HBS was analyzed through range analysis. Meanwhile, for the erosion depth and erosion volume of HBS, the corresponding optimal work parameter combination was obtained. In addition, through the establishment of different numerical models, the influence of the work parameters on the efficiency of HBS erosion by a water jet was studied, in which the mechanism by which the water jet eroded HBS was shown through analyzing the erosion depth, erosion volume, and effective stress distribution of HBS.
3. Results and Discussion
In the theoretical and experimental research of water jets, there are a number of work parameters that need to be considered, such as jet velocity, nozzle diameter, jet angle, and standoff distance. Mabrouki [
21], Liu [
24], and Momber [
41] investigated the mechanism of water jet erosion of targets. The results indicate that the jet velocity, the standoff distance, and the nozzle diameter have an important influence on the water jet erosion of targets. Therefore, the influence of these three work parameters on the water jet erosion of HBS was investigated. In addition, it should be noted that the erosion depth is defined as the distance from the HBS surface to the bottom of the crater formed by the water jet. The HBS-eroded element number, namely, the erosion volume, can be obtained in the file “MESSAG” produced by the LS-DYNA software.
3.1. Analysis of the Orthogonal Experiment Results
In this section, the orthogonal experiment including three factors (the work parameters) and three levels was designed.
Table 2 presents the factors and levels. Moreover, the erosion volume and erosion depth of HBS were taken as evaluation indexes and were analyzed by the range analysis method. The orthogonal experiment results are shown in
Table 3.
3.1.1. Range Analysis of the Erosion Depth
Table 4 shows the range analysis of the erosion depth. In the table,
is the sum of the test values corresponding to the
level of the
factor, and
is the average value of
. An example is as follows,
is the range, which reflects the variation amplitude of the evaluation index. The greater the variation amplitude, the more significant the influence of the factors on the evaluation index. The value of
is calculated by subtracting the minimum
from the maximum
, with the following expression,
For example, the range of the jet velocity (Factor A) is calculated as follows,
As shown in
Table 4,
>
>
. Therefore, as for the erosion depth, the jet velocity is the most significant factor, followed by the standoff distance and then the nozzle diameter. Meanwhile, the erosion depth of the seventh test in
Table 3 is the largest at 4.976 cm. Therefore, the work parameter combination of the seventh test, namely,
3
1
3, is optimal, and the corresponding jet velocity, standoff distance and nozzle diameter are 150 m·s
−1, 0.5 cm and 2.5 mm, respectively.
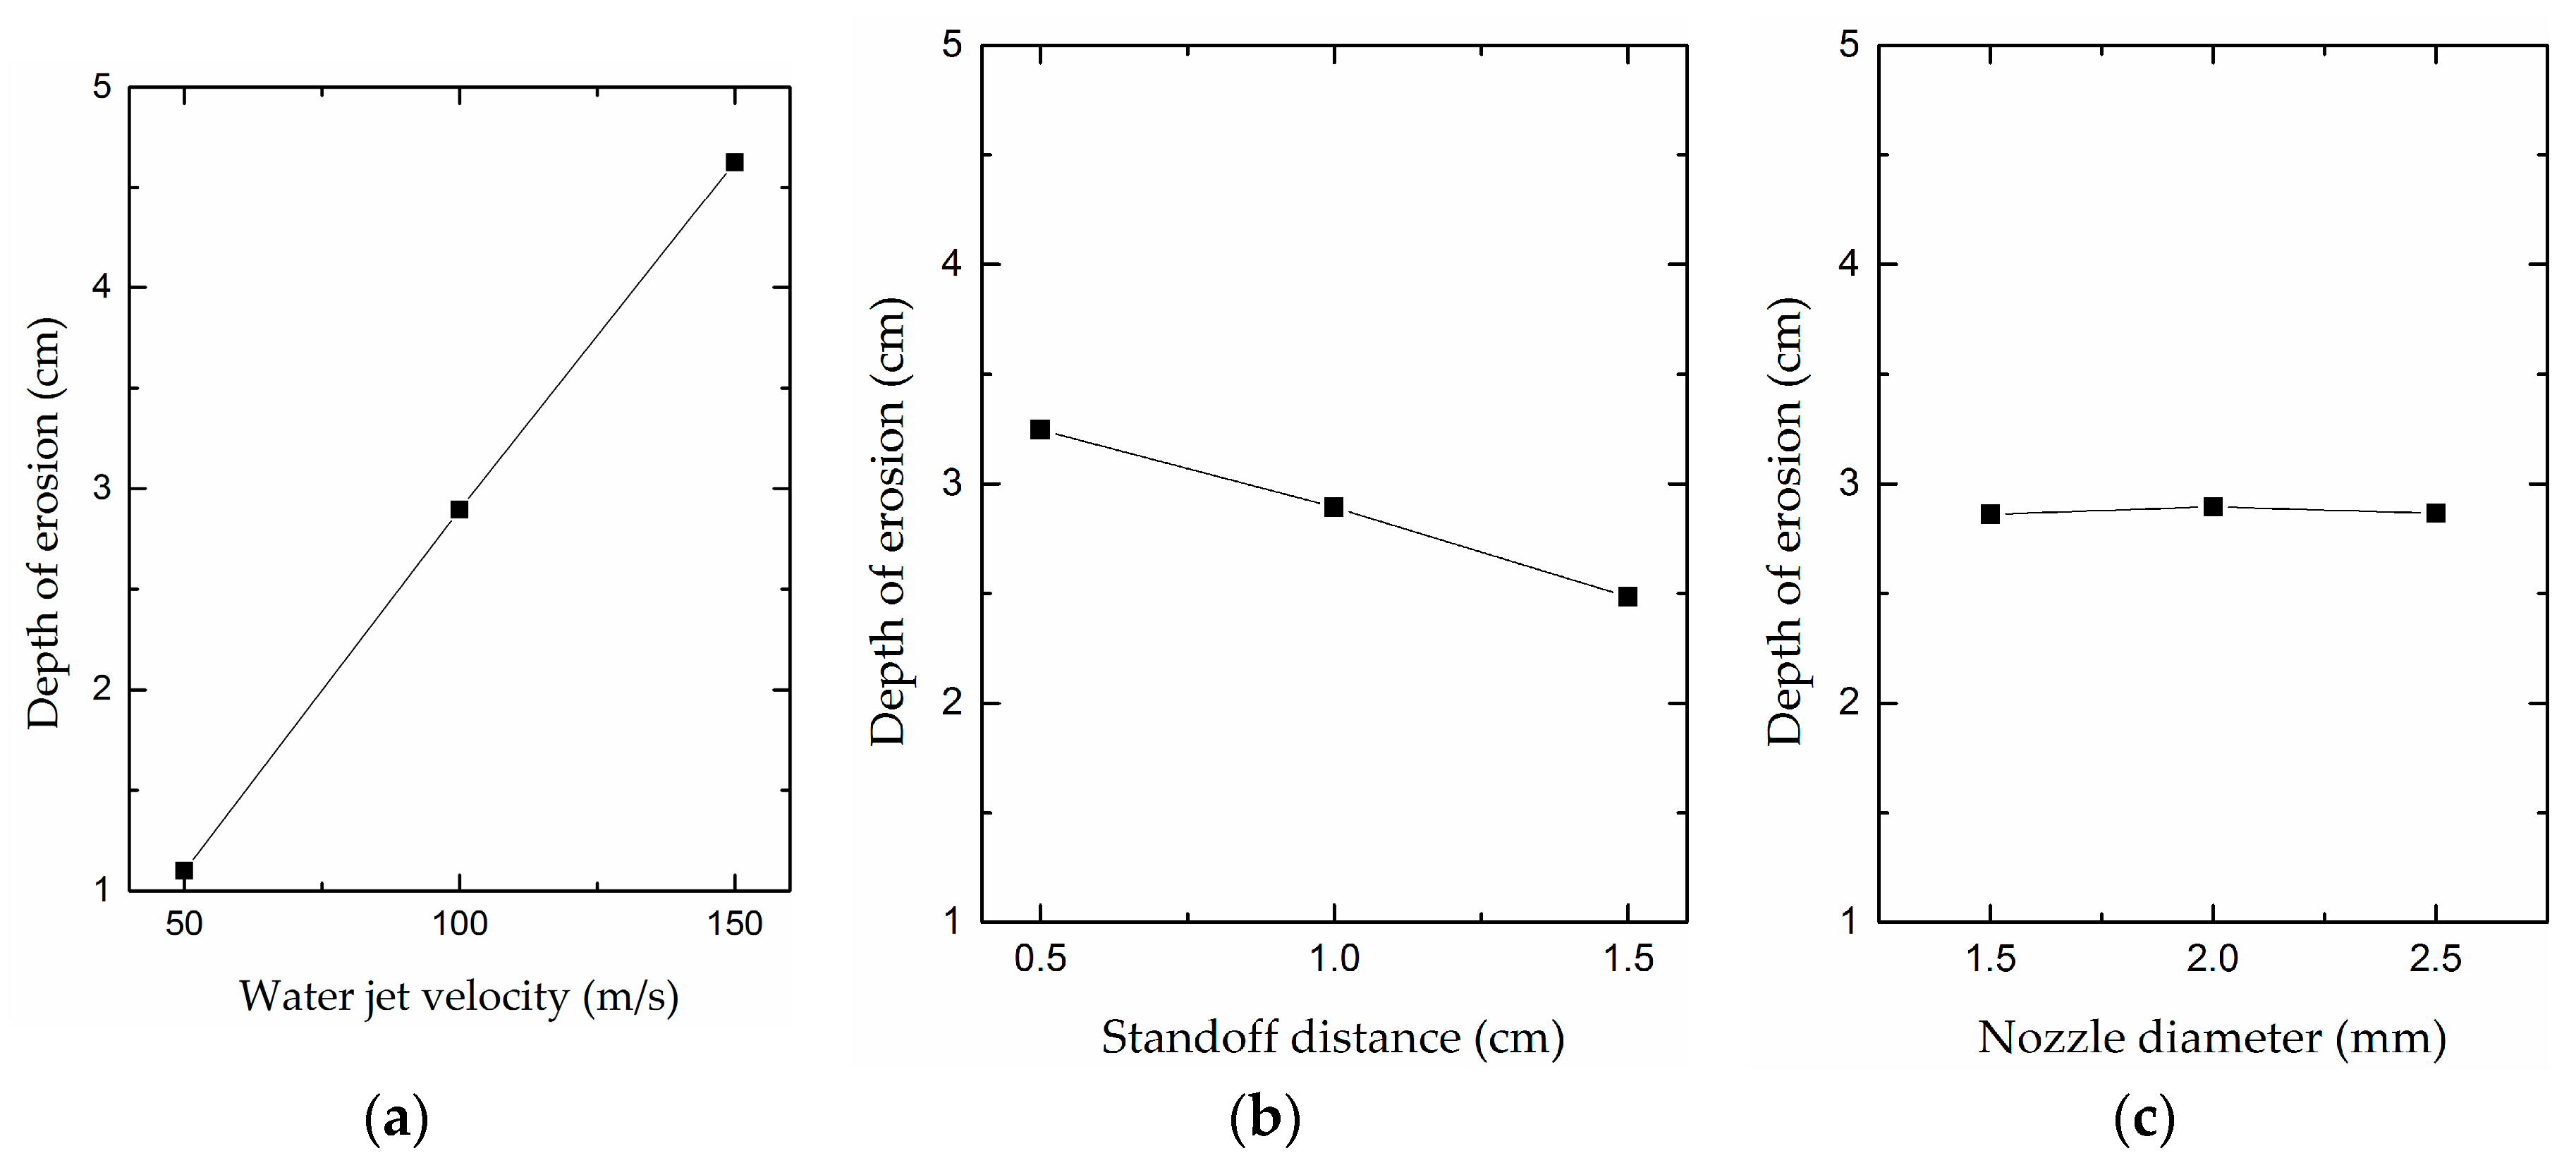
To verify the appropriateness of the selected factors and levels for the design of the orthogonal experiment and to check whether a better design scheme exists, the factors and levels of the orthogonal experiment were used as the abscissa. Meanwhile,
was used as the ordinate to draw a trend chart of the erosion depth variation of HBS.
Figure 5 shows the trend chart. From
Figure 5, the erosion depth of HBS reaches the maximum when the jet velocity, standoff distance, and nozzle diameter are 150 m·s
−1, 0.5 cm and 2.0 mm, respectively, and the corresponding work parameter combination is
3
1
2. However, the parameter combination of
3
1
2 did not exist in the design of the orthogonal experiment. Thus, additional numerical simulation is needed to determine the erosion depth of the
3
1
2. Through numerical computation, the erosion depth of 4.998 cm is obtained, which is larger than that of 4.976 cm in the seventh tests of
Table 3. As a consequence, it can be concluded that, with respects to erosion depth, the
3
1
2 is the optimal work parameter combination, which is better than the work parameter combination of
3
1
3. Additionally,
Figure 5 shows three main points. First, the erosion depth of HBS increases rapidly as the jet velocity increases. Second, an increase in standoff distance corresponds to a decrease in erosion depth. Third, when the nozzle diameter increases, the erosion depth initially increases and then decreases with no significant variation.
3.1.2. Range Analysis of the Erosion Volume
The range analysis of erosion volume is illustrated in
Table 5. As shown in the table,
>
>
. Therefore, with regard to the erosion volume, the factors are arranged as follows from primary to secondary: Jet velocity, nozzle diameter, and standoff distance. Meanwhile, the erosion volume of the seventh test of
Table 3 is the largest, which is 6.0329 cm
3, and thus the work parameter combination of the seventh test is optimal, namely,
3
1
3. The corresponding jet velocity, standoff distance and nozzle diameter are 150 m·s
−1, 0.5 cm and 2.5 mm, respectively.
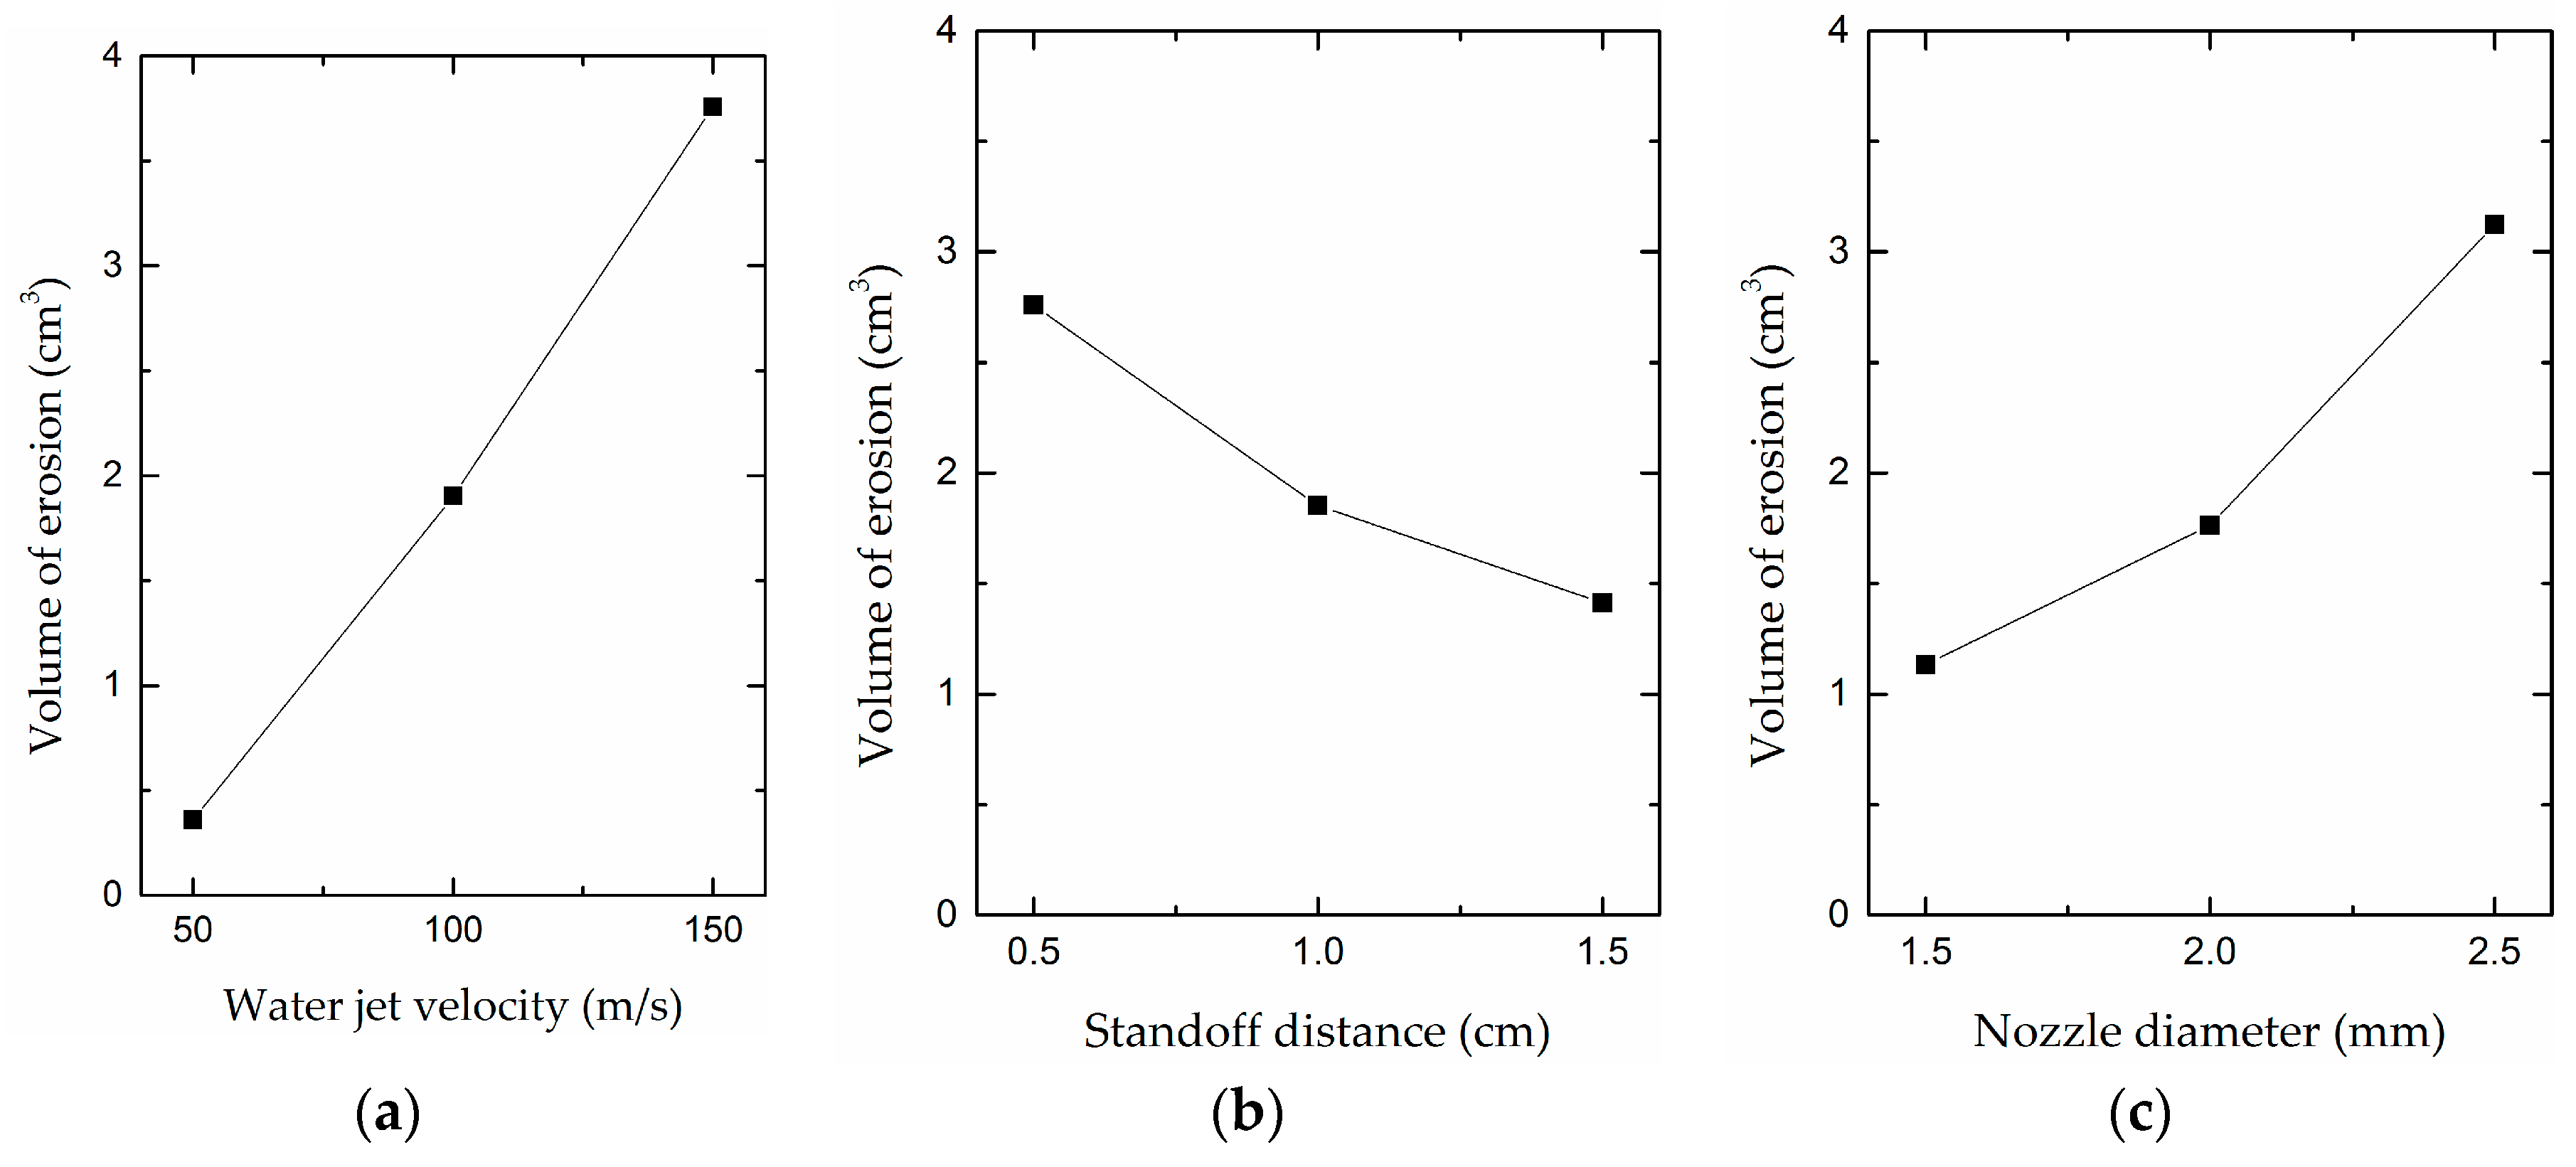
Similarly, the factors and levels of the orthogonal experiment were used as the abscissa, while
was used as the ordinate to draw a trend chart of the erosion volume variation of HBS.
Figure 6 presents the trend chart. As shown in
Figure 6, the erosion volume of HBS reaches the maximum when jet velocity, standoff distance, and nozzle diameter are 150 m·s
−1, 0.5 cm and 2.5 mm, respectively, thus the optimal work parameter combination is still
3
1
3. Moreover, the three main points are shown in
Figure 6. First, the erosion volume increases rapidly as the jet velocity increases. Second, an increase in standoff distance corresponds to a decrease in the erosion volume of HBS. Third, when the nozzle diameter increases, the erosion volume initially increases slowly and then increases rapidly.
3.2. Influence of Jet Velocity on the Erosion Performance of HBS
In this work, to study the influence of jet velocity on water jet erosion performance, different numerical models for the water jet erosion of HBS were established with different jet velocity and standoff distance. The jet velocities used were in the range of 20 to 150 m·s−1. The standoff distances of 0.5 cm, 1.5 cm, and 2.5 cm were used. The nozzle diameter was set to 1.5 mm.
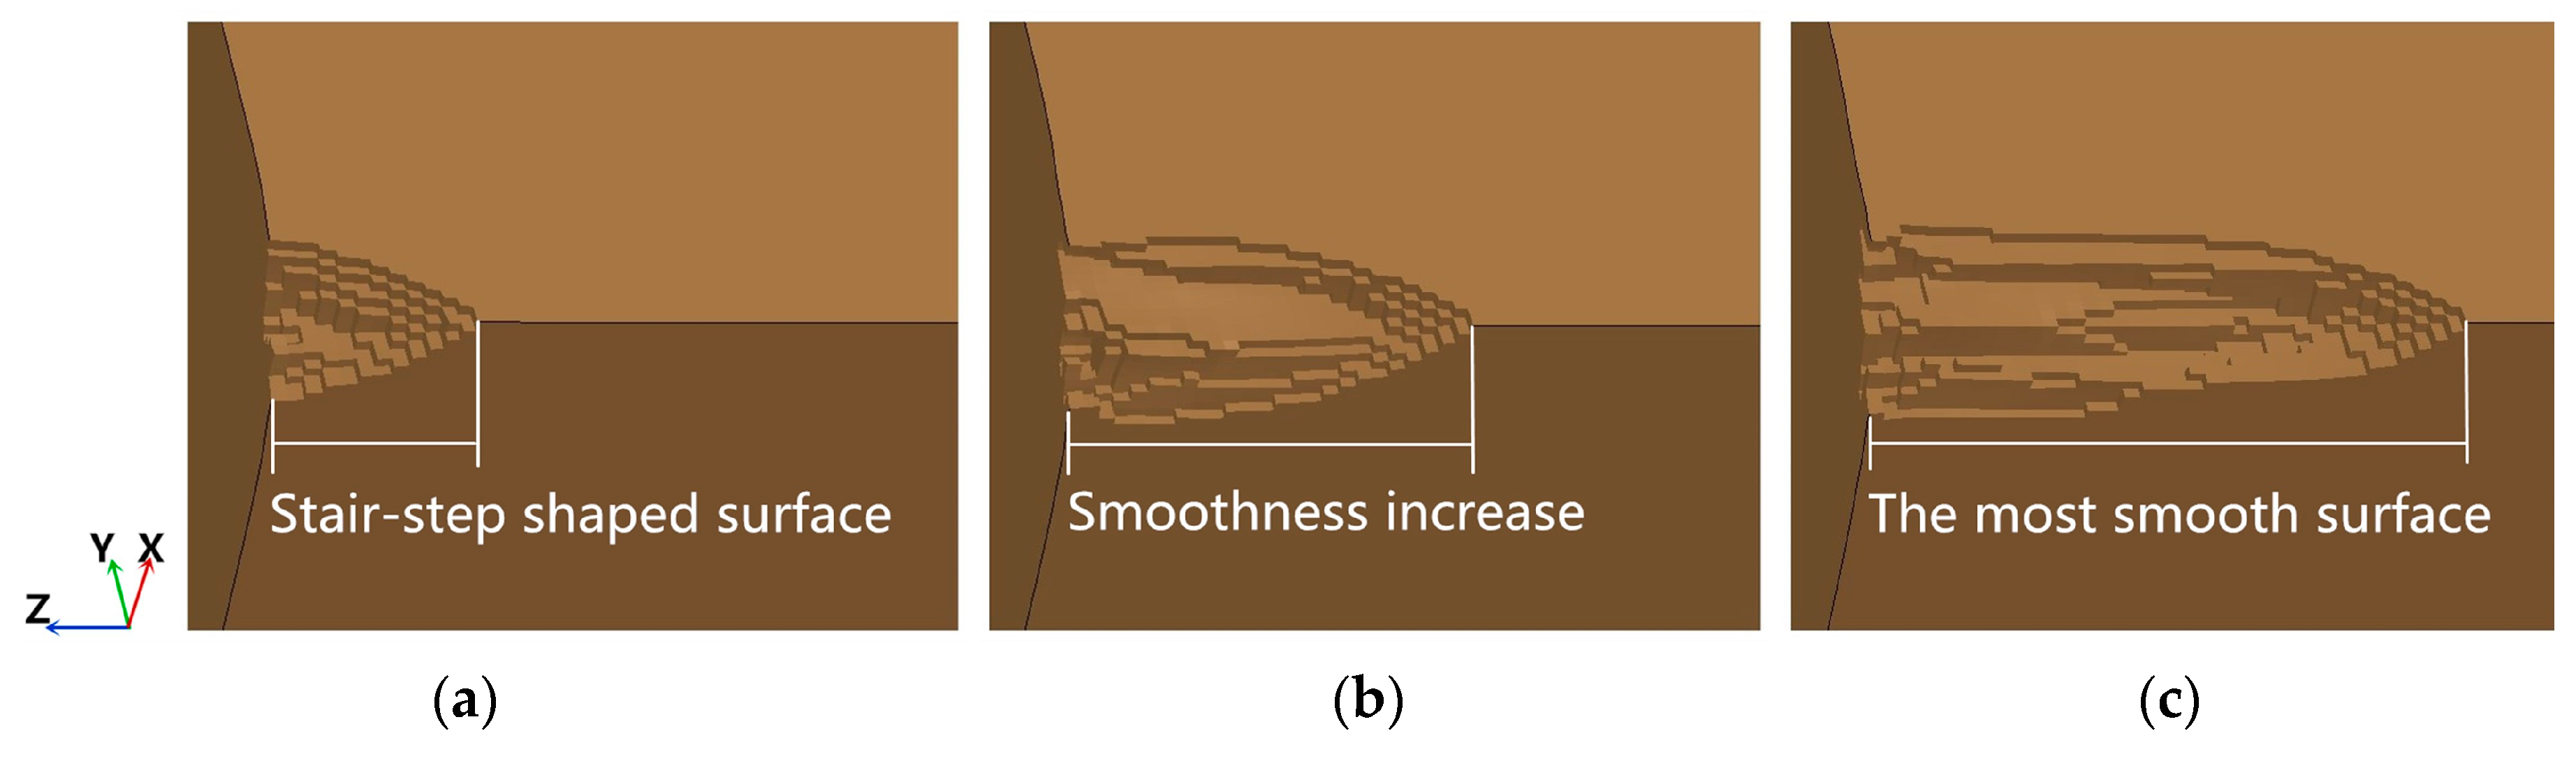
The shape of the erosion hole of HBS at different jet velocities with a standoff distance of 1.5 cm is shown in
Figure 7. The erosion depth of HBS increases when the jet velocity increases. The surface of the erosion hole is rough, and stair-step shaped when HBS is eroded at a low jet velocity, and an increase in jet velocity increases the smoothness of the crater. The analysis considers that, under the submerged condition, the momentum exchange between the water jet and the surrounding water occurs, and the jet velocity decreases gradually. When the velocity at the edge of the jet decreases to a certain extent, the HBS cannot be eroded. The higher the jet velocity, the longer the cutting ability of the water jet is maintained, and the smoother the surface of the erosion crater.
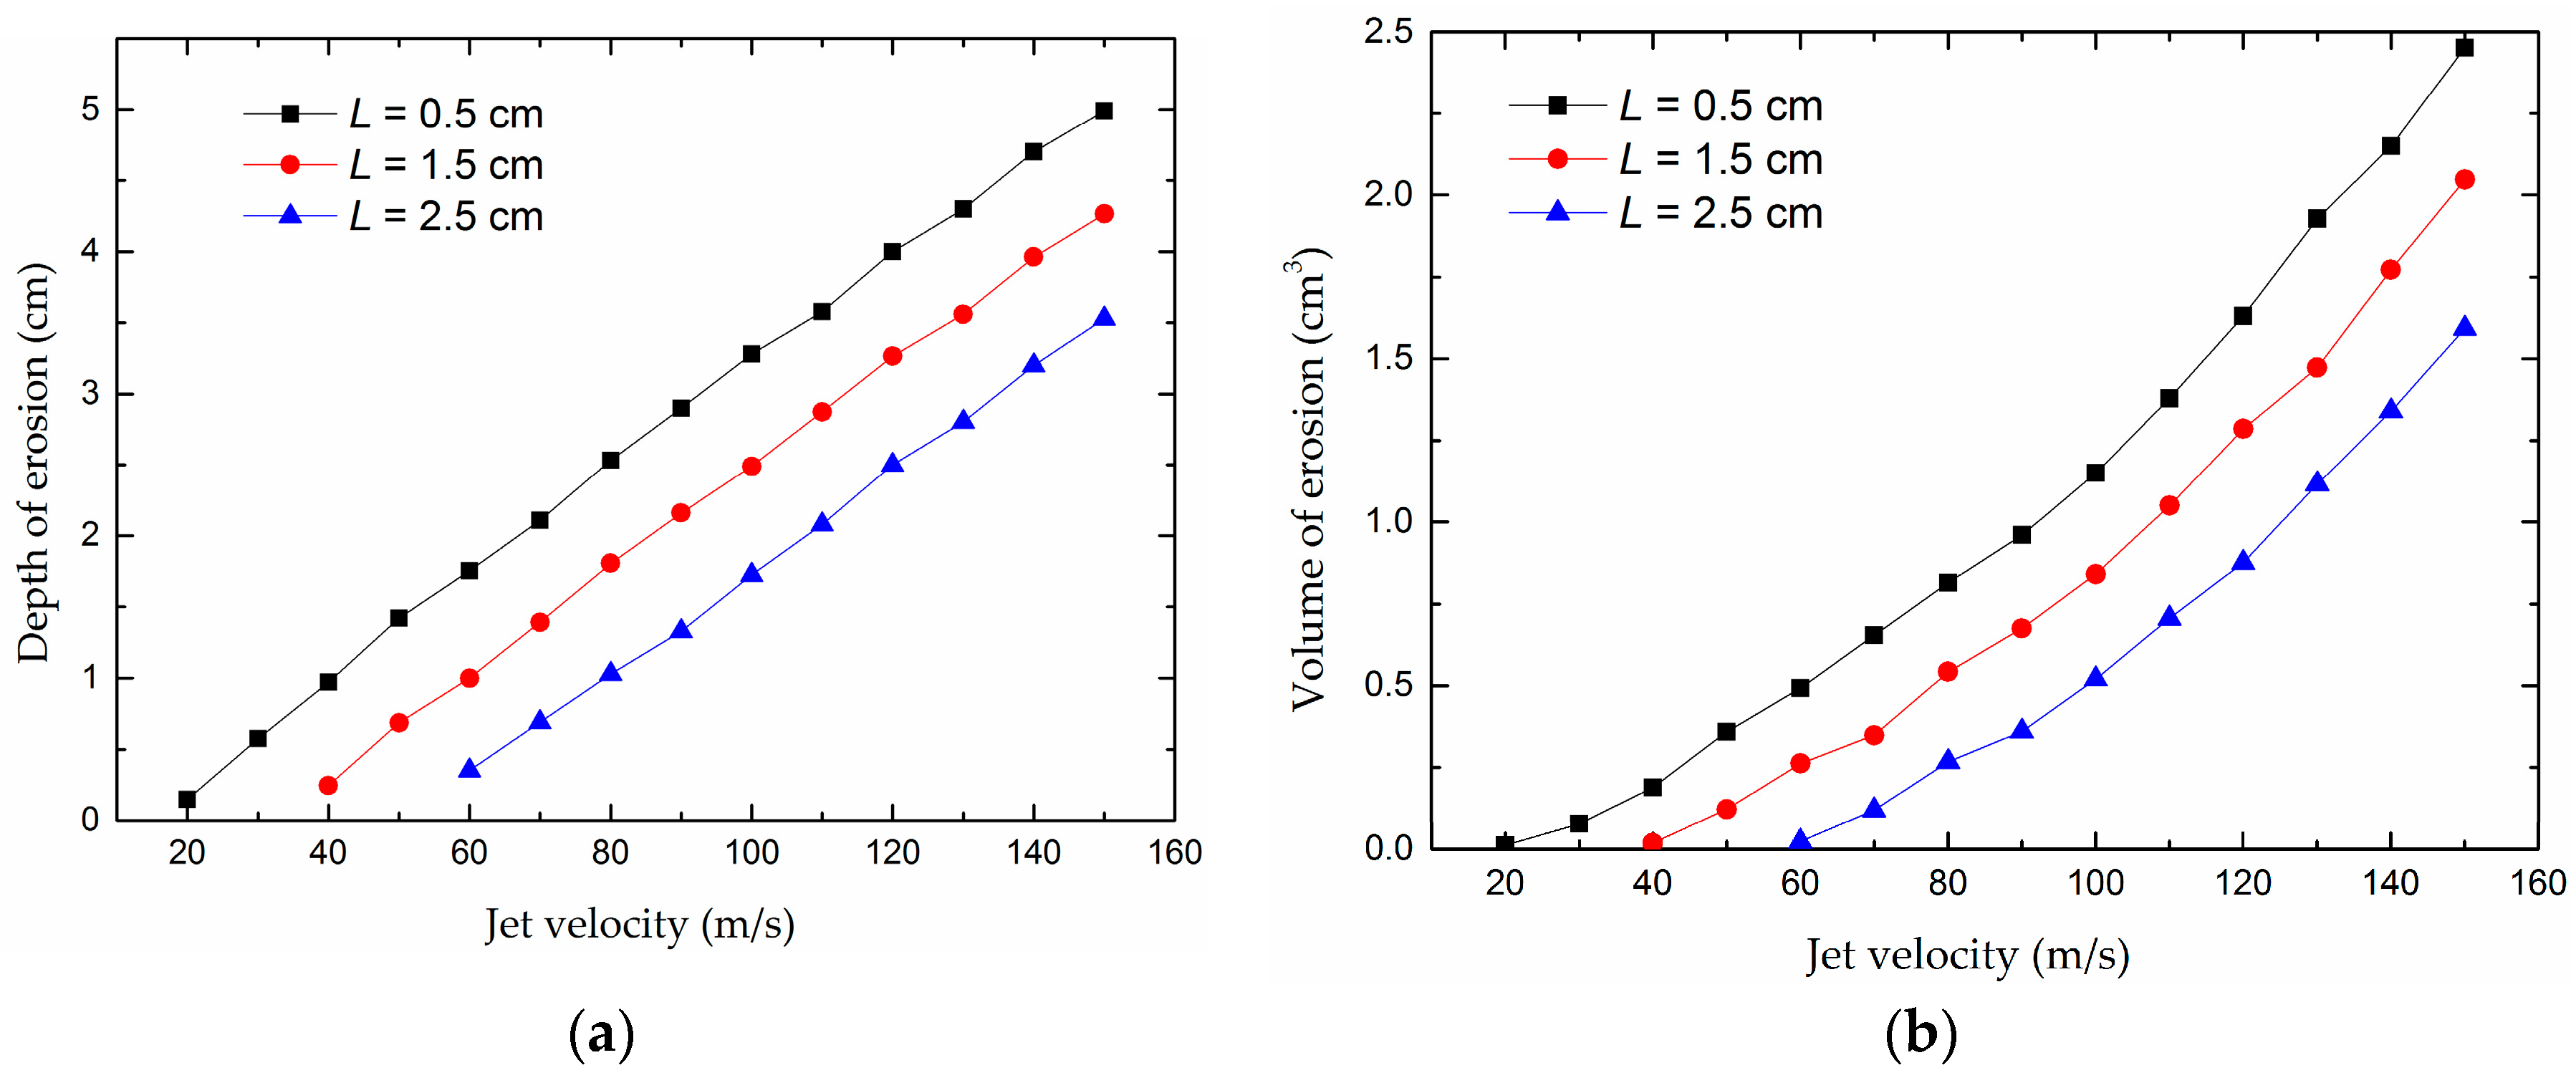
The jet velocity influence on the depth of erosion and the volume of erosion is illustrated in
Figure 8. In
Figure 8a, the erosion depth increases linearly with the jet velocity, which is consistent with the test results of rock breaking by a jet of Momber [
41,
42] and Lu [
43]. Moreover, when the jet velocity is constant, a smaller standoff distance leads to greater depth erosion. This indicates that the increase in jet velocity is beneficial to the erosion of HBS, and the smaller the standoff distance, the better.
Figure 8b shows the change in erosion volume. An increase in jet velocity corresponds to an increase in erosion volume, and the erosion volume increases rapidly at high speed, which is consistent with the test results of rock breaking by a water jet of Momber [
41,
42]. This result indicates that the larger the jet velocity, the higher the efficiency of the jet erosion of HBS. The analysis considers the rebounding water jets that were generated in the process of jet erosion of HBS, which would entrain the surrounding water when it flowed to both sides. Then, the rebounding water jets scoured the side of the erosion hole continuously, namely, the reaming hole process; the water jet energy increased with the increase in jet velocity, which not only enhanced the vertical erosion of HBS by the jet but also enhanced the erosion of the side of the crater by the rebounding water. Thus, under jet erosion, the erosion crater expanded in the vertical and radial directions. In addition, two commonalities between
Figure 8a,b can be found. In the analysis of the relation between jet velocity and erosion depth, Momber [
41,
42] divides the erosion depth and jet velocity curve into the incubation period and erosion period. The threshold velocity separates the two periods and only when the jet velocity is greater than the threshold velocity can the rock be eroded. Similarly, from
Figure 8a,b, a critical jet velocity could be noticed at the intersection of the velocity axis and the erosion depth and the erosion volume function, which describes the minimum impact velocity required to erode the HBS. The critical velocity is considered the HBS threshold velocity. As another commonality, when the jet velocity is constant, a smaller standoff distance leads to greater depth erosion and volume erosion, and the trend of the curve does not change under different standoff distances.
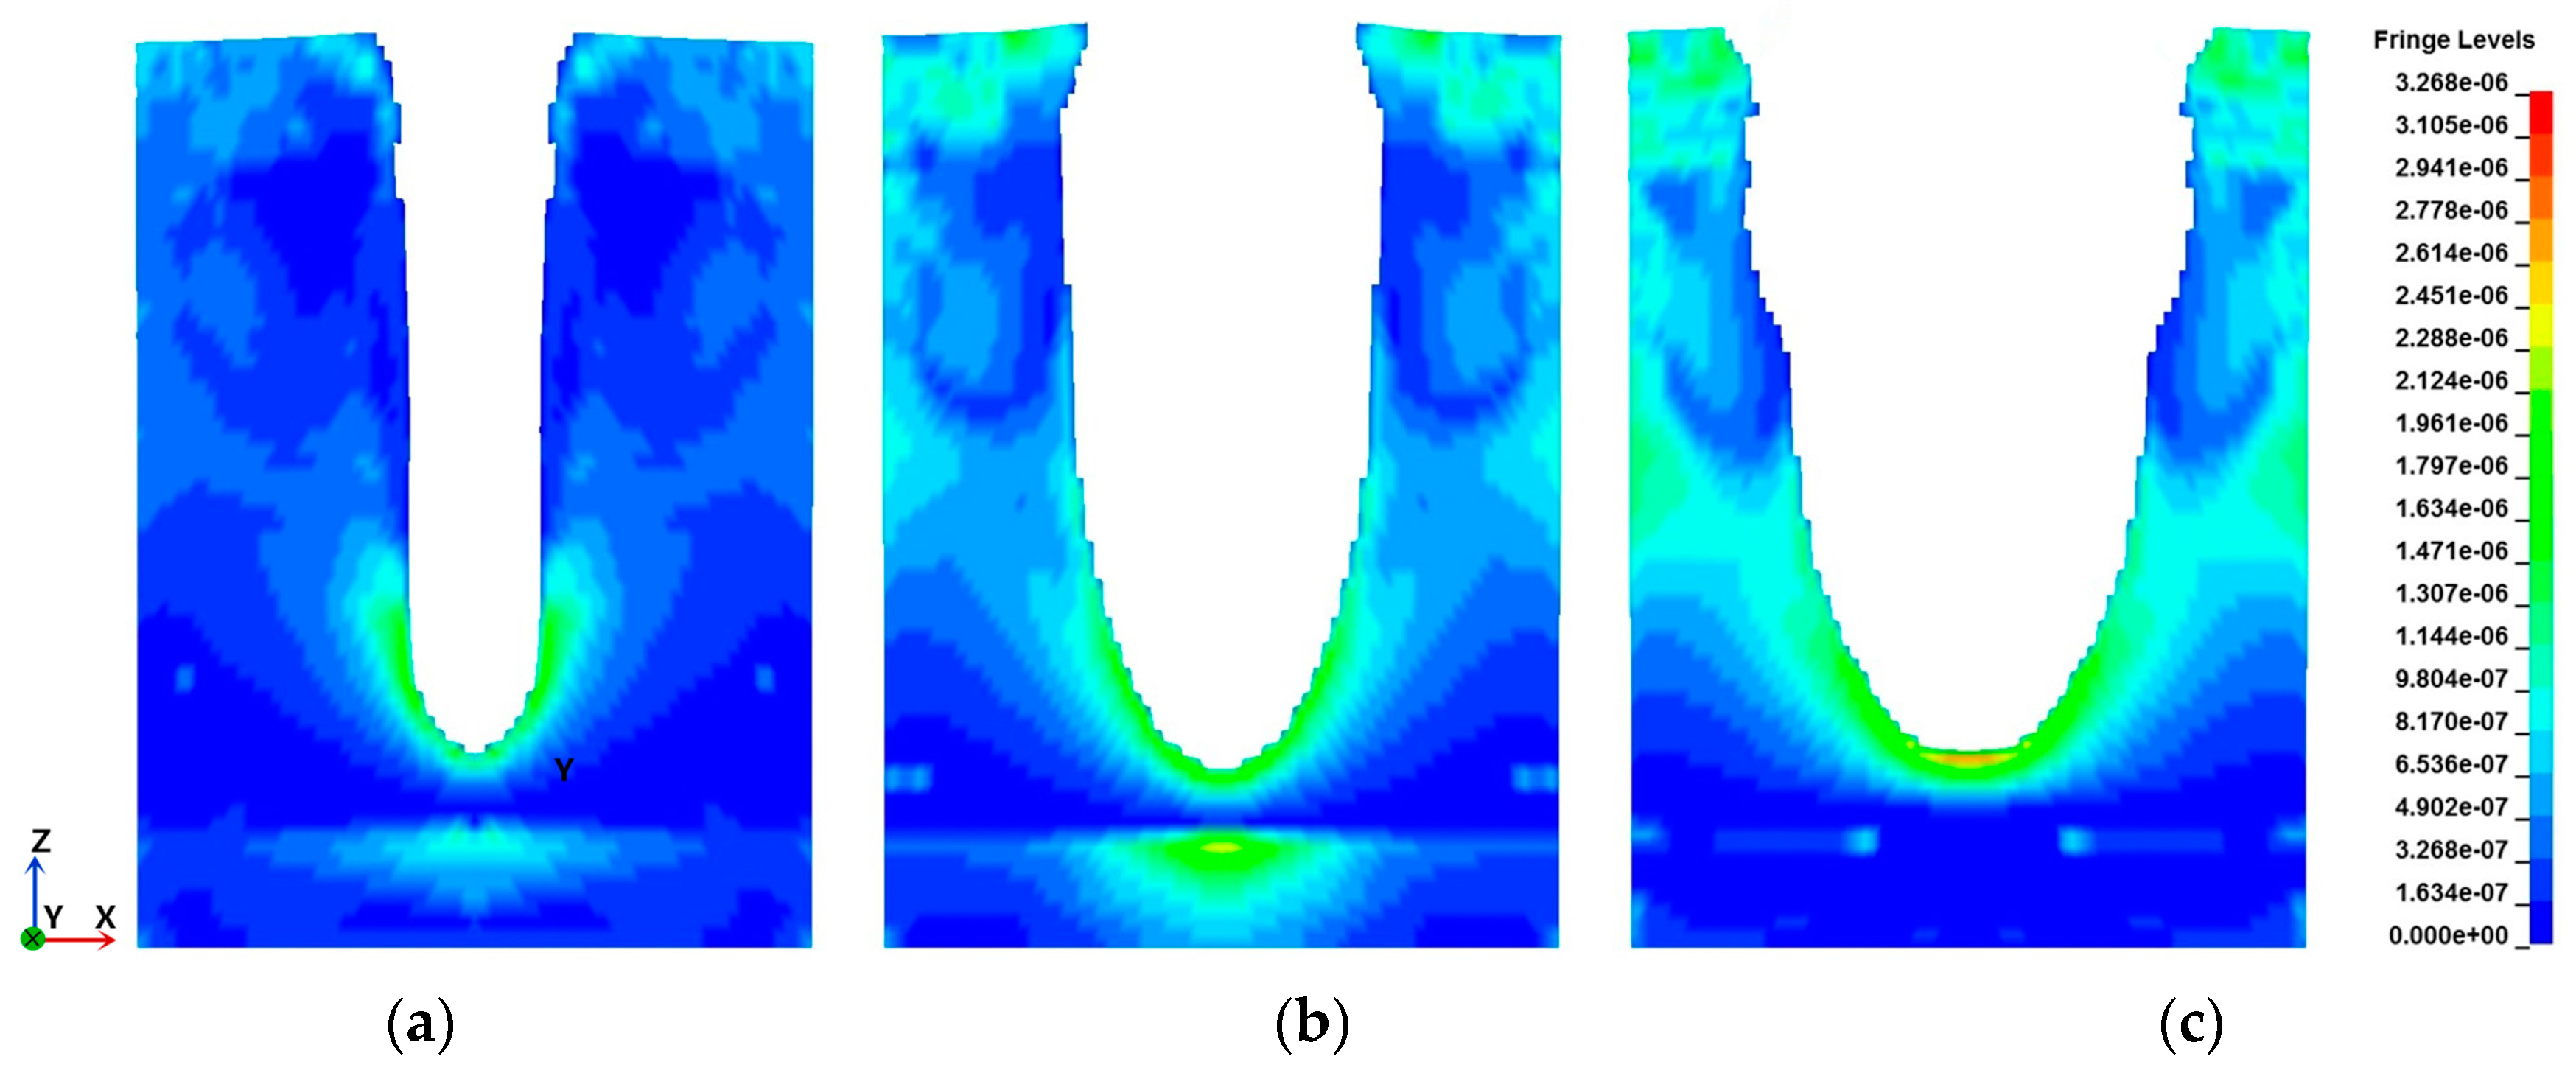
The stress distributions of HBS at different jet velocities, with a standoff distance of 1.5 cm and a nozzle diameter of 1.5 mm, are illustrated in
Figure 9. It can be seen that the erosion width of the crater orifice and the erosion depth increase with the increase in jet velocity, and the stress concentration zone at the bottom of the pit at a jet velocity of 140 m·s
−1 is significantly larger than that of the former two. This result indicates that the increase in jet velocity truly enhances the vertical erosion and the erosion of the side of the crater by the rebounding water.
In conclusion, an increase in jet velocity corresponds to an increase in erosion depth and erosion volume, which is consistent with the conclusions of
Section 3.1.1 and
Section 3.1.2, respectively. Furthermore, the increase in jet velocity enhances the efficiency of the jet erosion of HBS. Therefore, it is suggested that, in the process of using a high-pressure water jet to exploit marine NGH, the jet velocity should be increased as far as possible given equipment capacity to improve the mining efficiency.
3.3. Influence of Standoff Distance on the Erosion Performance of HBS
In this work, in order to study the influence of the standoff distance on water jet erosion performance, different numerical models for the water jet erosion of HBS were established with different standoff distances and nozzle diameters. The standoff distance in the range of 1 to 13 mm was used. The nozzle diameters of 1.2 mm, 1.5 mm, and 1.8 mm were used. The jet velocity was set to 100 m·s−1.
Figure 10 illustrates the erosion depth and the erosion volume with change in standoff distance under different nozzle diameters. From
Figure 10a, two features could be noticed. On one hand, the erosion depth of HBS shows a linearly decreasing trend with increasing standoff distance because the jet energy dissipation increases due to the increase in standoff distance. On the other hand, it can be seen that the effect of different nozzle diameters on the erosion depth is small, which is consistent with the sensitivity analysis in
Section 3.1.1.
The erosion volume with change in standoff distance is shown in
Figure 10b. The erosion volume of HBS decreases with the increase in standoff distance, however, the trend of the curve is quite different from that of
Figure 10a. The erosion process is very sensitive in the range of 3 mm standoff distance. Within this range, just a small variation in the standoff distance yields significant changes in the erosion volume. Moreover, the variation trend of the curve does not change under different nozzle diameters. The results indicate that the short standoff distance is more effective for the jet erosion of HBS. The analysis shows that, in a submerged state, the jet diffuses due to water entrainment after ejection from the nozzle, and the velocity of the jet decreases when HBS is eroded, which results in a rapid increase in the amount of water entrained by the jet and a large increase in the diffusion range. Meanwhile, because HBS has the characteristics of low cementation strength and easy fragmentation, the diffused jet can still cause strong erosion. Therefore, the shorter the standoff distance, the earlier the jet erosion of HBS occurs, the wider the jet diffusion range, and the stronger the jet erosion of HBS.
The above conclusions can be validated by
Figure 11. It shows the flow situations of the water jet erosion of HBS at different standoff distances, with a jet velocity of 100 m·s
−1 and a nozzle diameter of 1.2 mm. As shown in
Figure 11, the jet diffuses in the process of eroding HBS, and the diffusion range of the jet is largest when the standoff distance is 1 mm, which is significantly larger than that when the standoff distance is 3 mm or 9 mm. Meanwhile, the erosion is strongest at the standoff distance of 1 mm, and there is no significant difference in the erosion hole morphology between the two farther distances.
In general, a decrease in standoff distance corresponds to an increase in erosion depth and erosion volume, which is consistent with the conclusions of
Section 3.1.1 and
Section 3.1.2, respectively. Furthermore, the decrease in standoff distance enhances the efficiency of jet erosion of HBS. Thus, in the process of using a high-pressure water jet to exploit marine NGH, it is suggested that the standoff distance be less than 3 mm to obtain a higher mining efficiency.
3.4. Influence of Nozzle Diameter on the Erosion Performance of HBS
In this work, in order to study the influence of the nozzle diameter on water jet erosion performance, different numerical models for the water jet erosion of HBS were established with different nozzle diameters and standoff distances. The nozzle diameters used were in the range of 0.6 to 3.0 mm. The standoff distances of 0.5 cm, 1.0 cm, and 1.5 cm were used, and the jet velocity was set to 100 m·s−1.
The erosion depth and the erosion volume versus nozzle diameter at different standoff distances are illustrated in
Figure 12.
Figure 12a shows the erosion depth versus nozzle diameter. With the increase in nozzle diameter, the erosion depth of HBS increases rapidly, however, the increment rate decreases gradually, and the erosion depth reaches a maximum value. The critical line 2 in
Figure 12a illustrates the maximum erosion depth and the corresponding nozzle diameter, which is 1.8 mm. Then, the erosion depth decreases slowly and finally plateaus. Furthermore, the variation trend of the curve does not change under different standoff distances. All the results show that, for the erosion depth, the optimal nozzle diameter is 1.8 mm in the process of jet erosion of HBS. The analysis considers that, within a certain range, the jet energy increases with the increase in nozzle diameter, thus the impact force of the jet on HBS increases and the erosion depth increases. However, as the nozzle diameter continues to increase, the amount of water entrained by the jet increases greatly during the HBS erosion process, resulting in water accumulation at the bottom of the erosion hole. Meanwhile, the water accumulation effect is enhanced by rebounding water, which is generated by the jet. Thus, for the erosion depth, there is an optimal nozzle diameter in jet erosion process of HBS.
Figure 12b shows the erosion volume versus nozzle diameter at different standoff distances. On one hand, it can be seen that, with the increase in nozzle diameter, when the nozzle diameter is under 1.2 mm, the erosion volume increases slowly while the erosion depth increases rapidly. The critical line 3 (located at a nozzle diameter of 1.2 mm in
Figure 12b) indicates the end of the slowly increasing stage of erosion volume and the beginning of a rapid increase stage, while the critical line 1 (located at a nozzle diameter of 1.2 mm in
Figure 12a) separates the rapid increase stage of erosion depth and the slowly increasing stage. Thus, within the range of 1.2 mm nozzle diameter, the erosion volume of HBS in the vertical direction plays a leading role in the total erosion volume. On the other hand, when the nozzle diameter is larger than 1.2 mm, the erosion volume increases rapidly but the erosion depth increases slowly (from critical line 1) with the increase in nozzle diameter. This result indicates that the erosion volume of HBS in the radial direction plays a leading role in the total erosion volume, and the increase in the radial direction is much larger than that in the vertical direction. Moreover, it can be seen that the difference between the curves is very small when the nozzle diameter is under 1.2 mm, and the difference increases with the further increase in nozzle diameter. The above results occurred because, the jet has less energy when the nozzle diameter is small, and the energy of the rebounding water jet decays rapidly after entraining the surrounding water, resulting in the weak erosion of the side of the crater. With the increase in nozzle diameter, the energy of the rebounding water jet increases, and the amount of water entrained by the rebounding water jet increases greatly, which enhances the erosion of the side of the crater. It can be concluded that, for the erosion volume, the jet erosion efficiency of HBS can be significantly improved due to the increase in nozzle diameter.
To verify the conclusions above, the stress distribution of HBS at different nozzle diameters was obtained, as shown in
Figure 13, with a standoff distance of 0.5 cm and a jet velocity of 100 m·s
−1. On one hand, observing the shape of the erosion hole, it can be seen that the change in the side erosion of the crater from the use of a 2.4 mm nozzle diameter is the most significant, followed by that of a 1.8 mm nozzle diameter, and a 1.2 mm nozzle diameter shows the weakest change. On the other hand, the stress concentration zone of the erosion hole at a nozzle diameter of 2.4 mm is significantly larger than that of the two with smaller diameters. All the results indicate that the erosion of the side of the crater is significantly enhanced with the increase in nozzle diameter.
In brief, for the erosion depth, the optimal nozzle diameter is 1.8 mm for the jet erosion of HBS. An increase in nozzle diameter corresponds to an increase in erosion volume, which is consistent with the conclusions in
Section 3.1.1. Therefore, when using a high-pressure water jet to exploit marine NGH, it is suggested that the nozzle diameter be greater than 1.8 mm to obtain higher mining efficiency.
5. Conclusions
The present work deals with the water jet erosion efficiency of HBS under various work parameters, such as jet velocity, standoff distance, and nozzle diameter, and the work parameters were optimized through orthogonal experiments. Numerical models were established based on the ALE method and numerical computation was carried out using LS-DYNA software. The increase in jet velocity enhances the efficiency of the jet erosion of HBS, and there exists a critical jet velocity, namely, the threshold velocity, which describes the minimum jet velocity required to erode HBS. With respect to the standoff distance, when the standoff distance is less than 3 mm, the water jet erosion is stronger since the HBS of the South China Sea is characterized by low cementation strength and easy fragmentation. Moreover, the erosion efficiency of HBS decreases with the increase in standoff distance. For the nozzle diameter, with the increase in nozzle diameter, the erosion efficiency of HBS increases, however, when the nozzle diameter is larger than 1.8 mm, the erosion depth decreases due to the influence of water accumulation. Comprehensive analysis of the results of the orthogonal experiments demonstrates that, when the jet velocity is 150 m·s−1, the standoff distance is 0.5 cm, and the nozzle diameter is 2.0 mm, the maximum erosion depth of 4.998 cm is obtained. Moreover, when the jet velocity is 150 m·s−1, the standoff distance is 0.5 cm, and the nozzle diameter is 2.5 mm, the maximum erosion volume can be obtained, which is 6.0329 cm3.
Nevertheless, it should be noted that only the jet velocity, the standoff distance, and the nozzle diameter were analyzed in this paper. Subsequent investigations need to consider the effects of jet angle and nozzle traverse speed.


