Article

Acoustic Emission Characteristics During Rock Fragmentation Processes Induced by Disc Cutter under Different Water Content Conditions

1
School of Resources and Safety Engineering, Central South University, Changsha 410083, China
2
Key Laboratory of Road Structure and Material of Ministry of Transport (Changsha), Changsha University of Science and Technology, Changsha 410114, China
3
School of Highway, Chang’an University, Xi’an 710064, China
*
Author to whom correspondence should be addressed.
Submission received: 11 November 2018 / Revised: 5 December 2018 / Accepted: 3 January 2019 / Published: 7 January 2019
(This article belongs to the Special Issue Application of Acoustic Emission (AE) on Rock Samples)

Abstract

:
Based on a properly modified testing platform and Physical Acoustics Corporation (PAC) Micro-II acoustic emission (AE) system, a series of sequential indentation tests on granite samples with five different water contents was conducted to investigate the effect of the water content on the rock fragmentation process induced by a tunnel boring machine (TBM) disc cutter. During these tests, the effects of the water content on the characteristics of the peak penetration force, AE events, consumed energy, rock chip volume, and specific energy were analyzed. The results showed that the AE events were associated with the whole second indentation process of the granite. Under conditions with the same water content, the peak penetration forces and the consumed energy were smaller than those in the first indentation force. Additionally, subsequent chips were formed more frequently than the first indentation chips. The specific energy was lower, which meant that the rock breaking efficiency was higher. With the increase in the water content, the acoustic emission events reduced. The peak penetration force and consumed energy decreased with the increase in the water content. The volume of the chips increased significantly as the water content increased. The specific energy was promoted by the increase of the water content and then by the increase in the rock-breaking efficiency of the TBM disc cutter.

1. Introduction

Compared with traditional techniques, such as drilling and the blasting methods, the full-face rock tunnel boring machine (TBM) has certain merits such as high construction quality, high efficiency, environmental friendliness, and lower disturbance to the surrounding rock, so it has been widely used in underground construction and has gradually become the first choice for tunnel construction [1,2]. However, from the current TBM construction cases, it can be seen that the strata encountered in TBM excavations are becoming increasingly complex. Many construction projects face complex strata such as high ground stress, fault fracture zones, and rich groundwater [3]. Due to these geological conditions, a TBM incident can delay the construction schedule for months or even years. In the Jinping II hydropower station project, the in situ stress in the TBM-excavated rock mass was as high as 30 MPa, leading to a strong rock burst and serious distortion and fractures of the steel arch frame, which affected the TBM penetration efficiency and the overall construction progress [4]. In the Alborz Service Tunnel project in Iran, groundwater directly affected the normal excavation of the TBM [5]. For rock breakage, the TBM typically utilizes a disc cutter on its cutterhead, and the disc cutter is the core tool that comes directly in contact with the surrounding rock. The effect of rock breakage caused by the disc cutter directly affects the efficiency of TBM construction [6,7,8].
As the basis for and key to the TBM design and construction phase, the rock breakage mechanism and penetration efficiency of the disc cutter have received extensive attention from researchers [9]. To study the rock breakage mechanism and principles of the cutter, an indoor indentation test has been widely applied, as it requires only small-sized specimens and has low equipment demands. It is also simple and convenient. Cook et al. [10] studied the derivation and expansion of microcracks when a circular, flat-bottomed indenter penetrated rock, clarifying the whole process of macroscopic failure. Lindqvist et al. [11] observed the crack propagation law of limestone, marble, and granite when using a flat-headed wedge cutter, and they reported on the relationship between its contact stress and the uniaxial compressive strength and tensile strength during cracking. Chen and Labuz [12] studied the rock failure process from brittle failure to plastic failure with the increase of the confining stress through the indentation test, and they found that when the confining stress increases to a critical value, the rock failure process stops. With the help of acoustic emission technology, Lin et al. [13] found that the failure process can be divided into four stages: microcrack closure, elastic deformation, crack propagation, and final fracture. Through the cutter head indentation test, Liu et al. [14,15] investigated the effect of confining stress on the granite breakage process through sequential indentation tests in a biaxial state. Liu et al. [16] and Innaurato et al. [17] used numerical simulation software to establish a two-dimensional cutter rock breakage model and studied the effect of confining stress on the indentation and rock breakage performance of the TBM cutter. They believed that as the confining stress increases, the crack tends to develop along the free surface. Bejari et al. [18] and Lin et al. [19] studied rock failure characteristics under different joint angles through disc cutter indentation tests and found that the existing joint planes have obvious control effects on the crack propagation mode.
Previous studies have shown that geological conditions are the decisive factor affecting the performance of TBM cutters. Both the cutter design and the excavation parameters depend on the geological conditions to some extent. However, groundwater is also one of the important factors affecting the stability of rock masses in underground engineering. It has both complex physical and chemical effects on the strength, deformation, and failure features of rocks [20,21]. Numerous studies on mining, boring, and mechanical tunnel design and performance predictions are based on dry rocks without considering the effects of water on the rocks, leaving economic and environmental hazards in these mechanical designs and performance predictions [22,23,24,25,26]. Little has been reported on the effect of excavation equipment on rocks under different water conditions, especially on the mechanical properties during excavation. Therefore, studying the interactive relationship between the cutter, rock, and water is of important theoretical, research significance and practical value in engineering applications.
Based on previous studies, with the help of acoustic emission monitoring technology, this paper conducts a series of indentation tests under different water content conditions, obtains the load–penetration curve and acoustic emission characteristics during the disc cutter indentation process, and analyzes the relationship between crack development and the rock failure process under different water content conditions. The results help better understand the mechanical responses of rocks under different water conditions during the TBM cutter indentation process and provide the basis and references for studies on the TBM cutter rock breakage mechanism.

2. Experimental Work

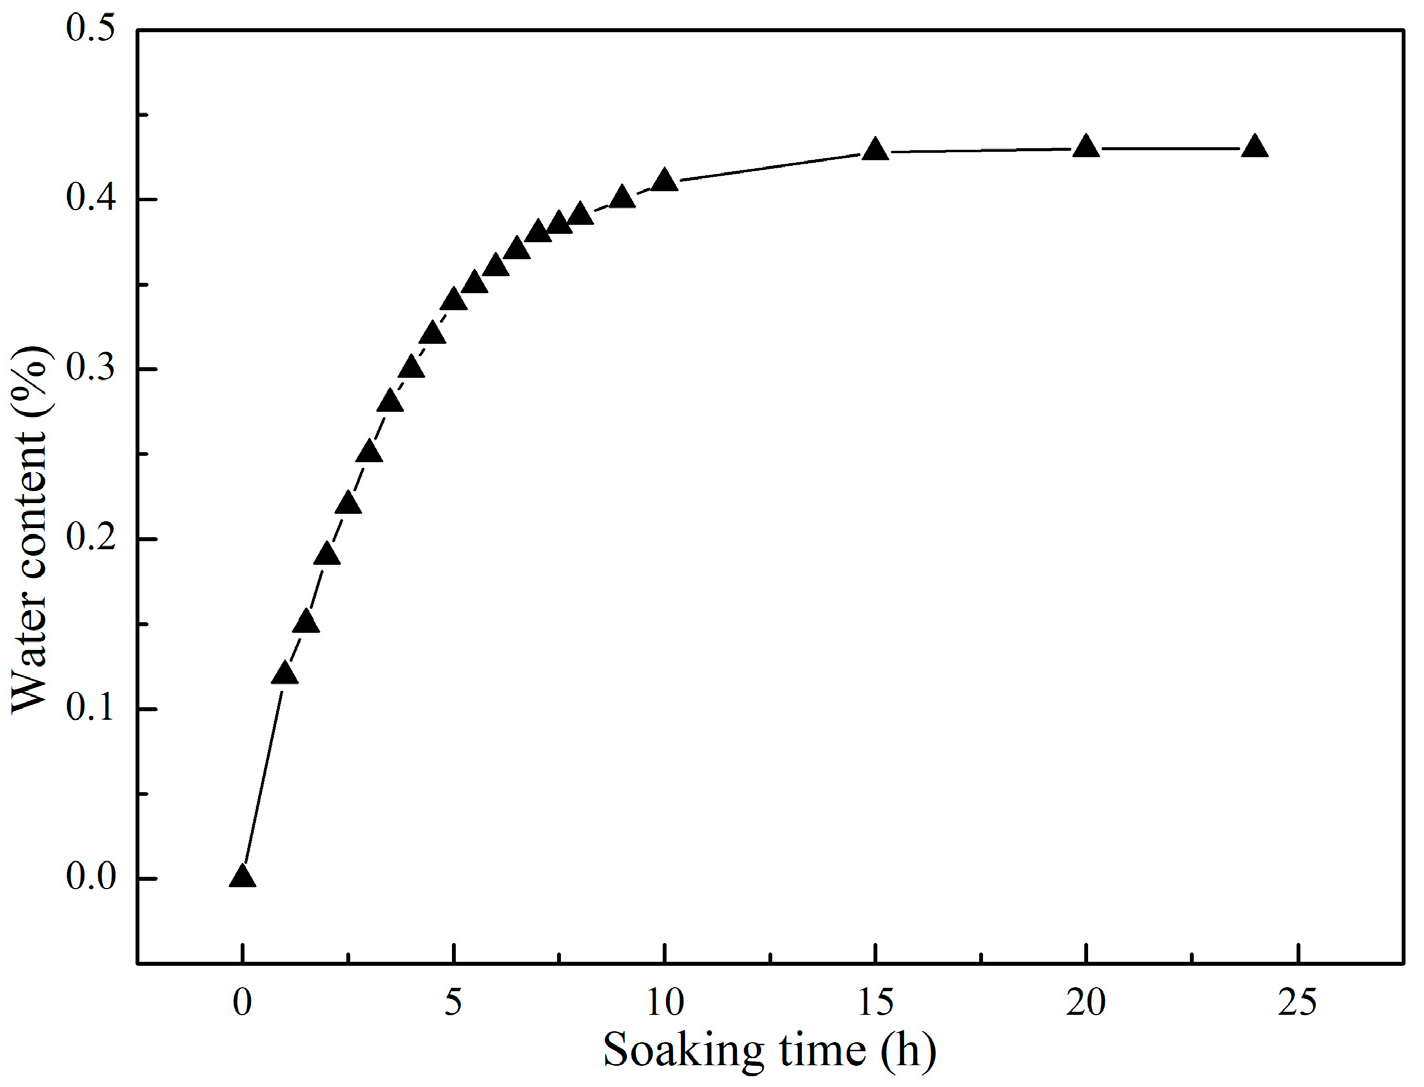
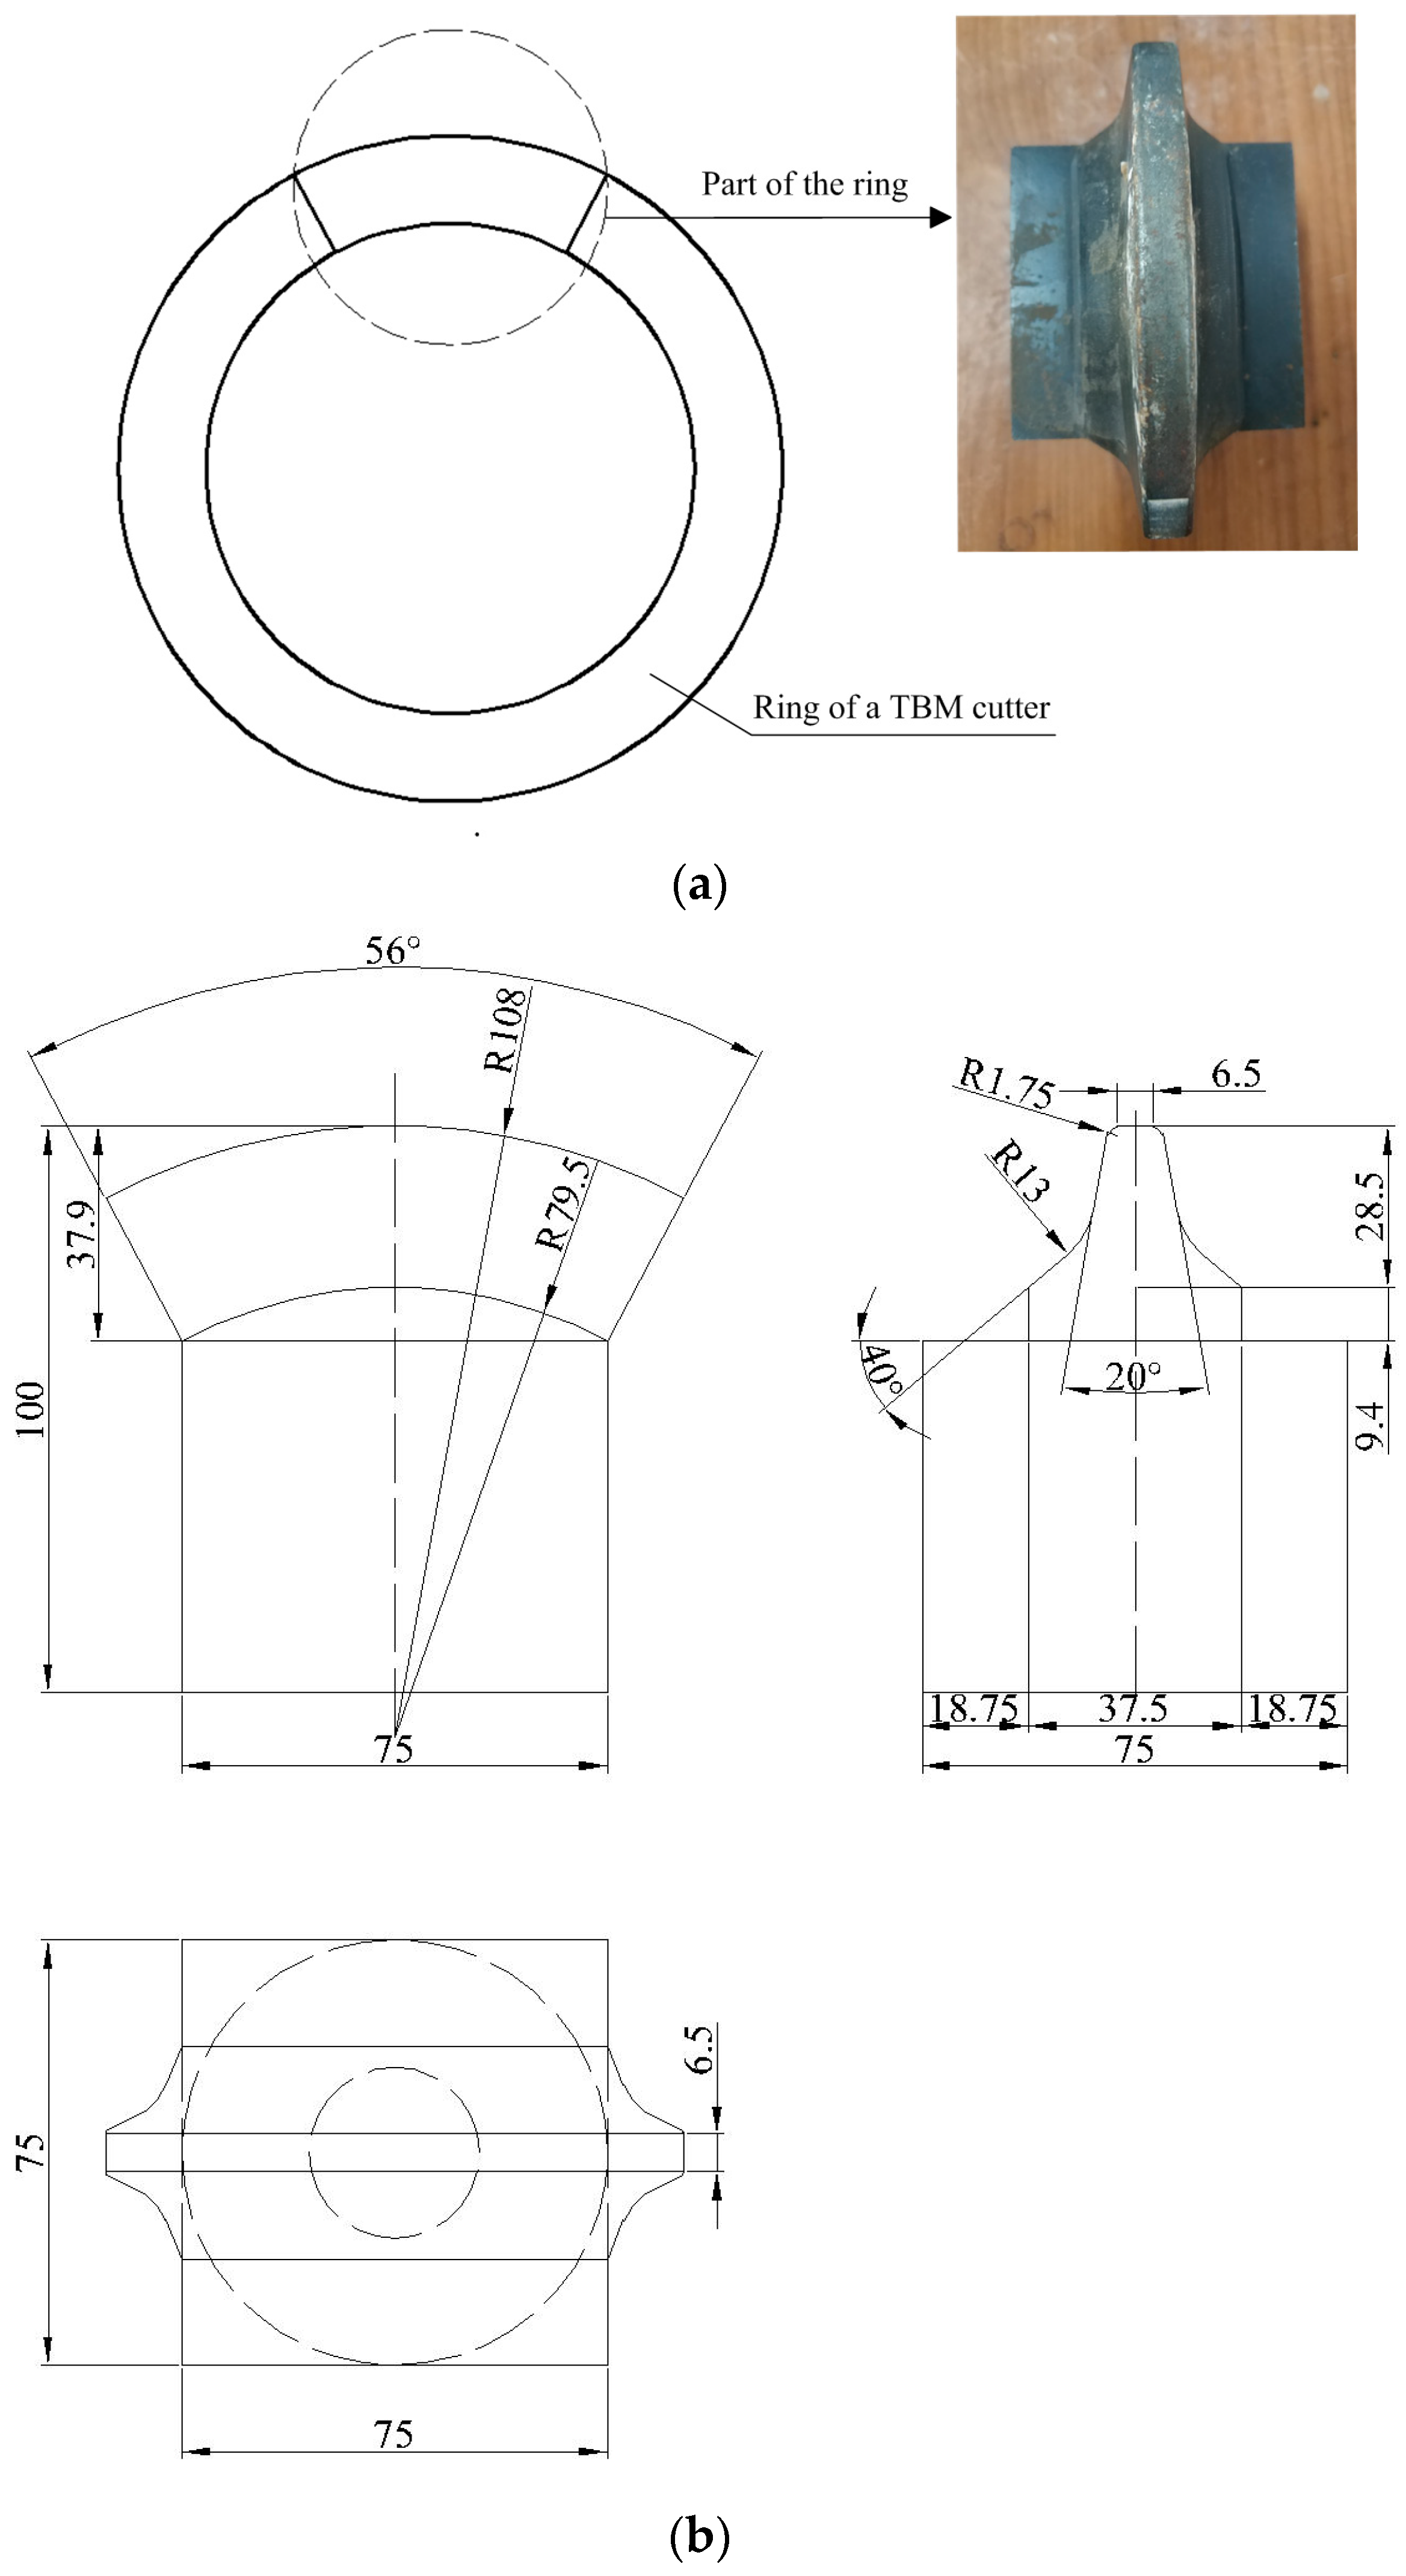
2.1. Sample Collection and Preparation

The granite specimens used in this test were cut from natural stones by a cutting machine and then processed by a sander to make their edges smooth enough to meet the mechanical test specifications for such rocks. In order to reduce the dispersion of the experimental results caused by individual differences in rock specimens and improve the comparability of the test, the granite samples were all taken from one intact rock mass, so the lithologic parameters of the samples can be considered to be approximately the same.
Based on the recommendations of the International Society of Rock Mechanics, the main mechanical parameters in Table 1 were obtained by the uniaxial compression test, Brazilian tensile test, and shear test.
According to previous research [27,28,29], when the ratio of the depth of the plastic zone to the width of the sample is less than 1/6, the size effect can be ignored. Therefore, according to the cavity expansion model [30], the relevant parameters are expressed by the following equations:
( 1 + μ ) ξ ( 1 + K d ) / K d μ ξ ( K p 1 ) / K p = γ
K d = 1 + sin ϕ 1 sin ϕ ; K p = 1 + sin ψ 1 sin ψ
μ = λ K p K d + K p
λ = ( K p 1 ) ( K d 1 ) + ( 1 2 v ) ( K p + 1 ) ( K d + 1 ) 2 K p
ξ = r t
where γ is a characteristic parameter for the shape of the disc cutter, for the blunt cutter used in this test γ = 0, r is the critical radius of the plastic zone, t is the penetration depth, and ϕ and ψ are the rock friction angle and dilatancy angle, respectively, the dilatancy angle is equal to the friction angle in this test.
Based on the analysis above, the samples used in this test were tabular specimens with a size of 250 mm × 200 mm × 100 mm (length × height × width). By substituting the rock mechanics parameters in Equation (1) into Equation (5), it has been determined that the ratio of the radius of the plastic deformation zone to the minimum size of the specimen is far less than 1/6. So, the rock sample size is reasonable.
All the samples were placed in an oven at 115 °C, and the mass was weighed at predetermined intervals until the mass reduced to a constant value. At that time, the sample was considered to be in a “completely” dry state. Then, the dry samples were immersed in pure water for different times to achieve different water contents. Figure 1 shows the water content of the specimens during the saturation processes. It can be seen that a dry granite specimen reached its saturated state after about 24 h, and the maximum water content of the specimen could be 0.43%. Therefore, five sets of water content levels (i.e., 0, 0.11, 0.22, 0.32, and 0.43%) were designed for the tests. The water absorption of a rock specimen could be calculated by the weight variation:
w w = m w m d m d × 100 %
where w w (%) is the water content of the specimen and m w (g) and m d (g) are the wet and dry masses of the specimen, respectively.

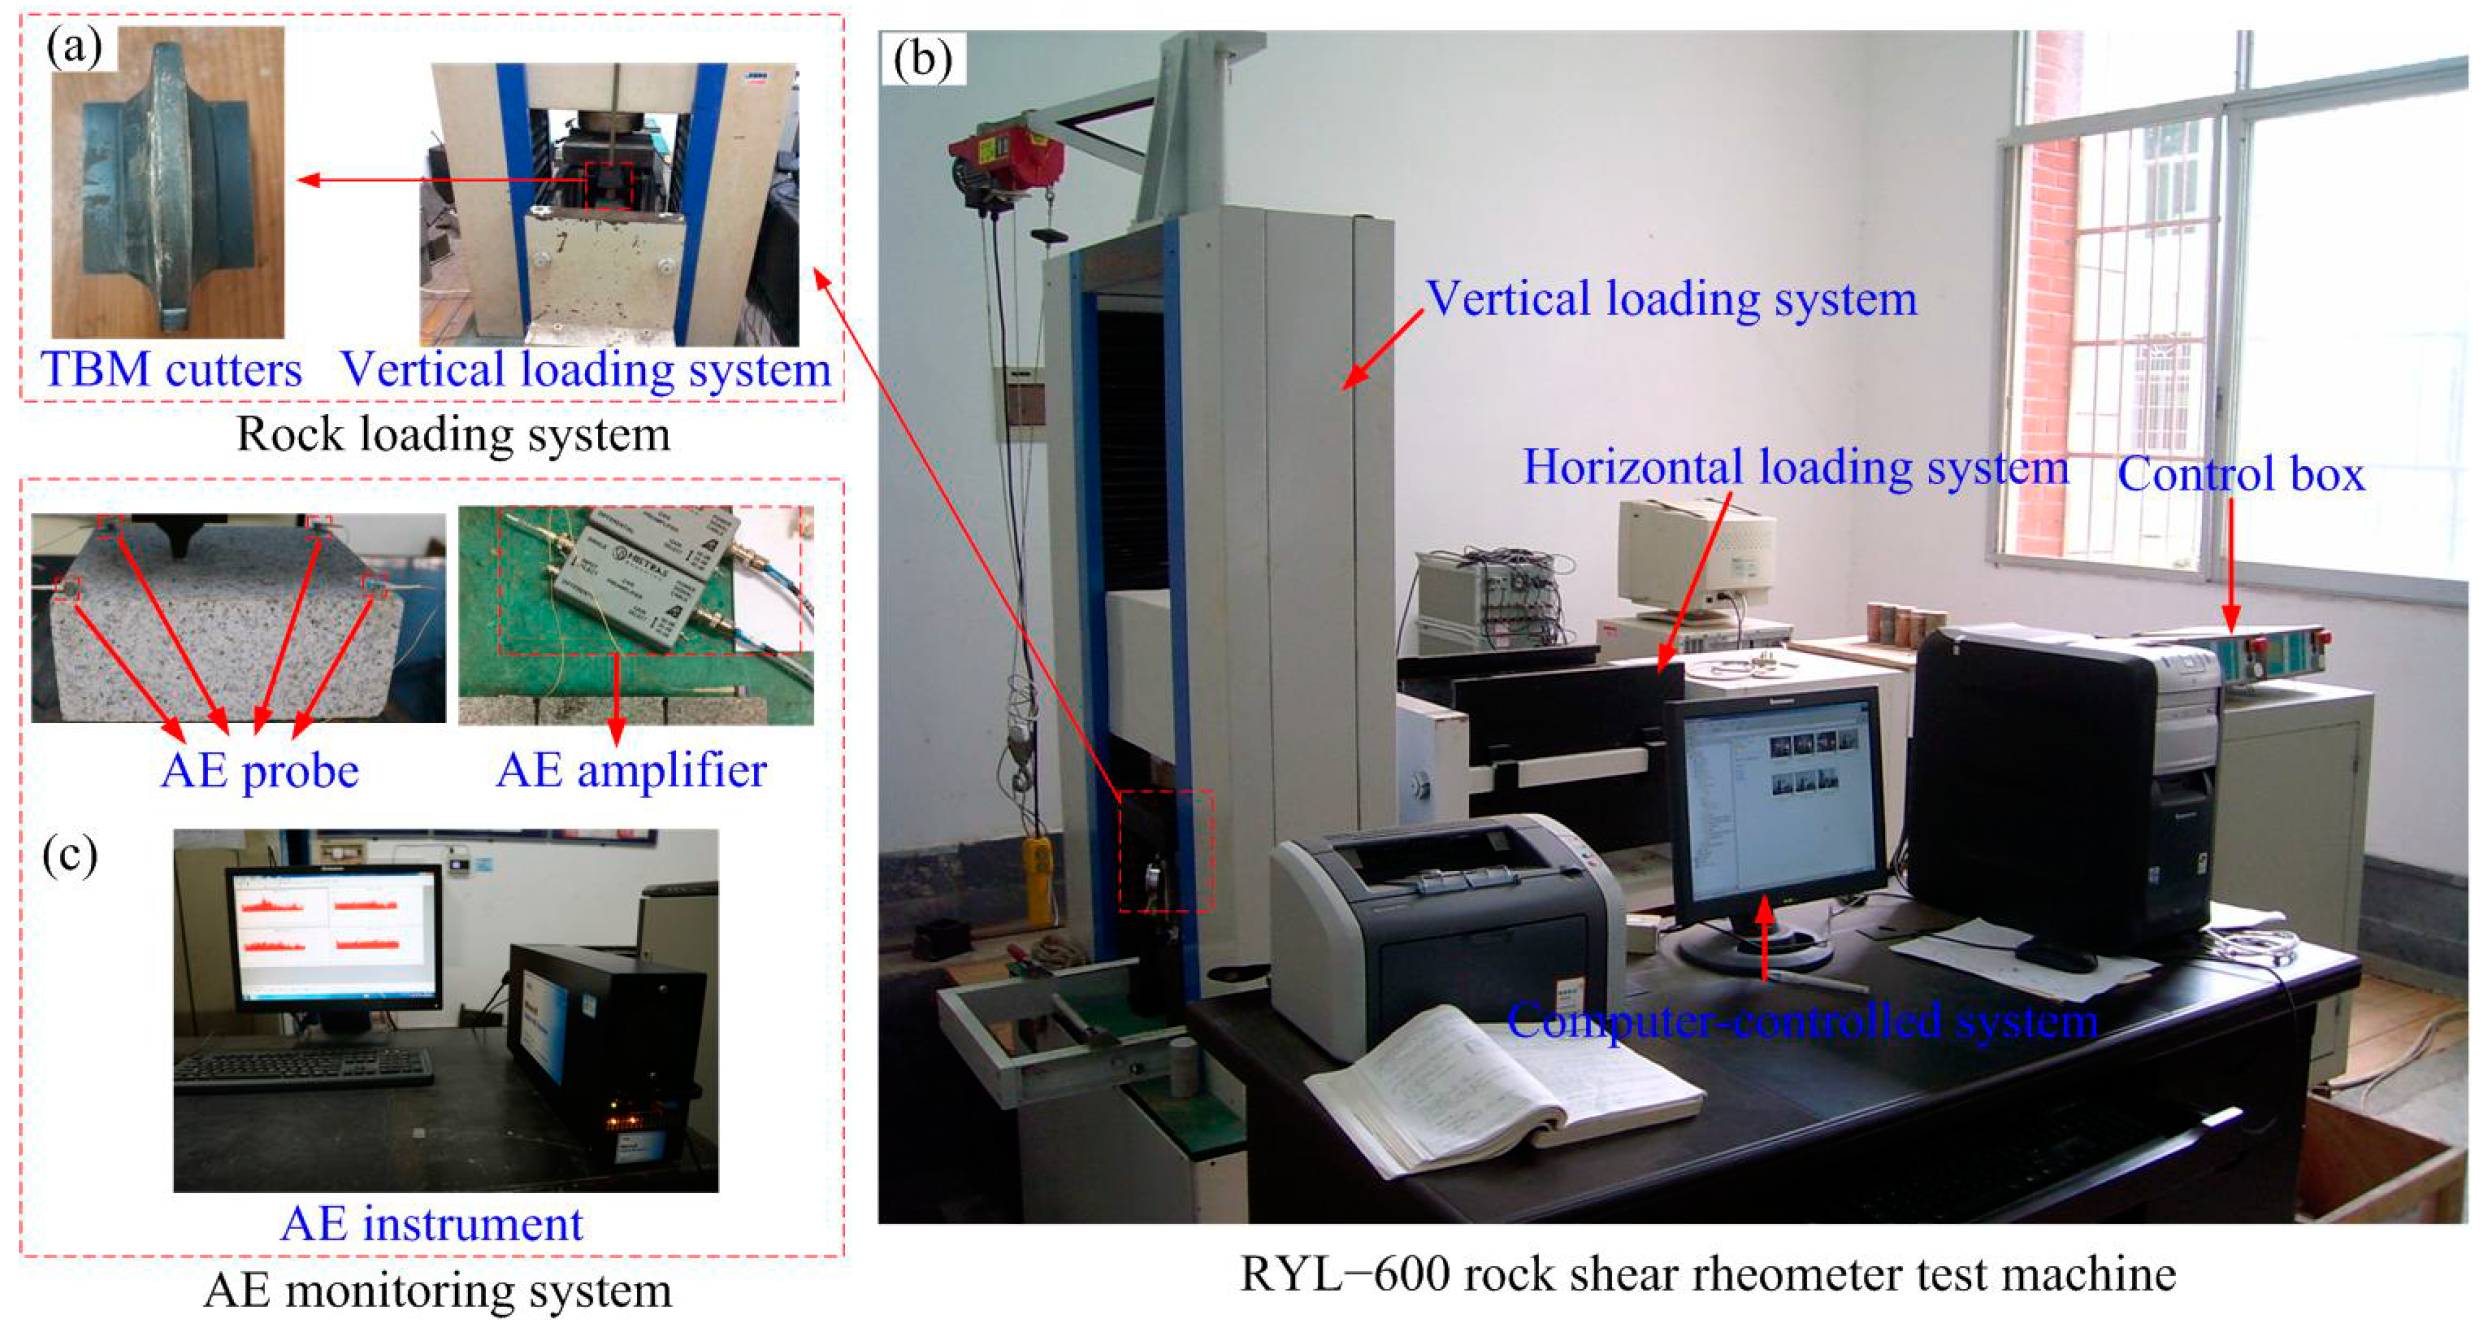
2.2. Experimental Equipment

The test system mainly consisted of a rock indentation test loading system and an acoustic emission monitoring system. The former, as shown in Figure 2b, modified based on the RYL-600 rock shear rheometer test machine, consisted of a vertical loading system, horizontal loading system, control box, and computer-controlled system. It was capable of providing the maximum normal load of 600 kN and the maximum shear load of 200 kN. The loading rates in both directions were between 0.001 and 50 mm/min. In the loading test, the penetration force and penetration depth were measured and transmitted by the built-in sensor of the vertical loading system, and the relevant test data, such as force and displacement, could be recorded during the loading process, with the test curve drawn in real time. The horizontal loading system was used to apply confining stress to the specimens to simulate the lateral constraint on the lateral displacements of the specimens. Figure 2c shows the acoustic emission monitoring (AE) system, that is a Micro-II 6-channel rock mechanics test system manufactured by Physical Acoustics Corporation (PAC), consisting of a system host (6 high-performance channel AE cards PCI-2 and 4 external parameter acquisition channels), 4 AE probes, 4 pre-filter amplifiers, and the corresponding signal transmission lines. In accordance with previous studies [29,31], the AE data acquisition threshold was set to 40 dB, and the sampling frequency was 1 MSPS. The rock loading system and AE monitoring system for the rock indentation test are shown in Figure 2.
The rock breakage caused by the TBM cutter is actually a process in which rocks are broken by the rolling cutter under a penetration force, tangential force, and rolling force. Considering the limitations of the experimental equipment, the rock breakage platform, which was modified based on a RYL-600 rock shear rheometer test machine, only considers the cutter’s penetration force, which is, in fact, the main component that leads to rock breakage, and the core part of the cutter that penetrates and breaks the rocks is only the part of the TBM that is in contact with the rocks. Therefore, the modified rock breakage test platform does not have a complete disc cutter, but only a part of the cutter, as shown in Figure 3a. The geometric parameters of the disc cutter are shown in Figure 3b. The cutter has a width of 13mm, a cutting edge of 3.5 mm, and a phase angle of 20°. The cutter is made of high-hardness steel and has been heat treated to ensure a small deformation of the cutter during the test so as to reduce the impact on the test result.

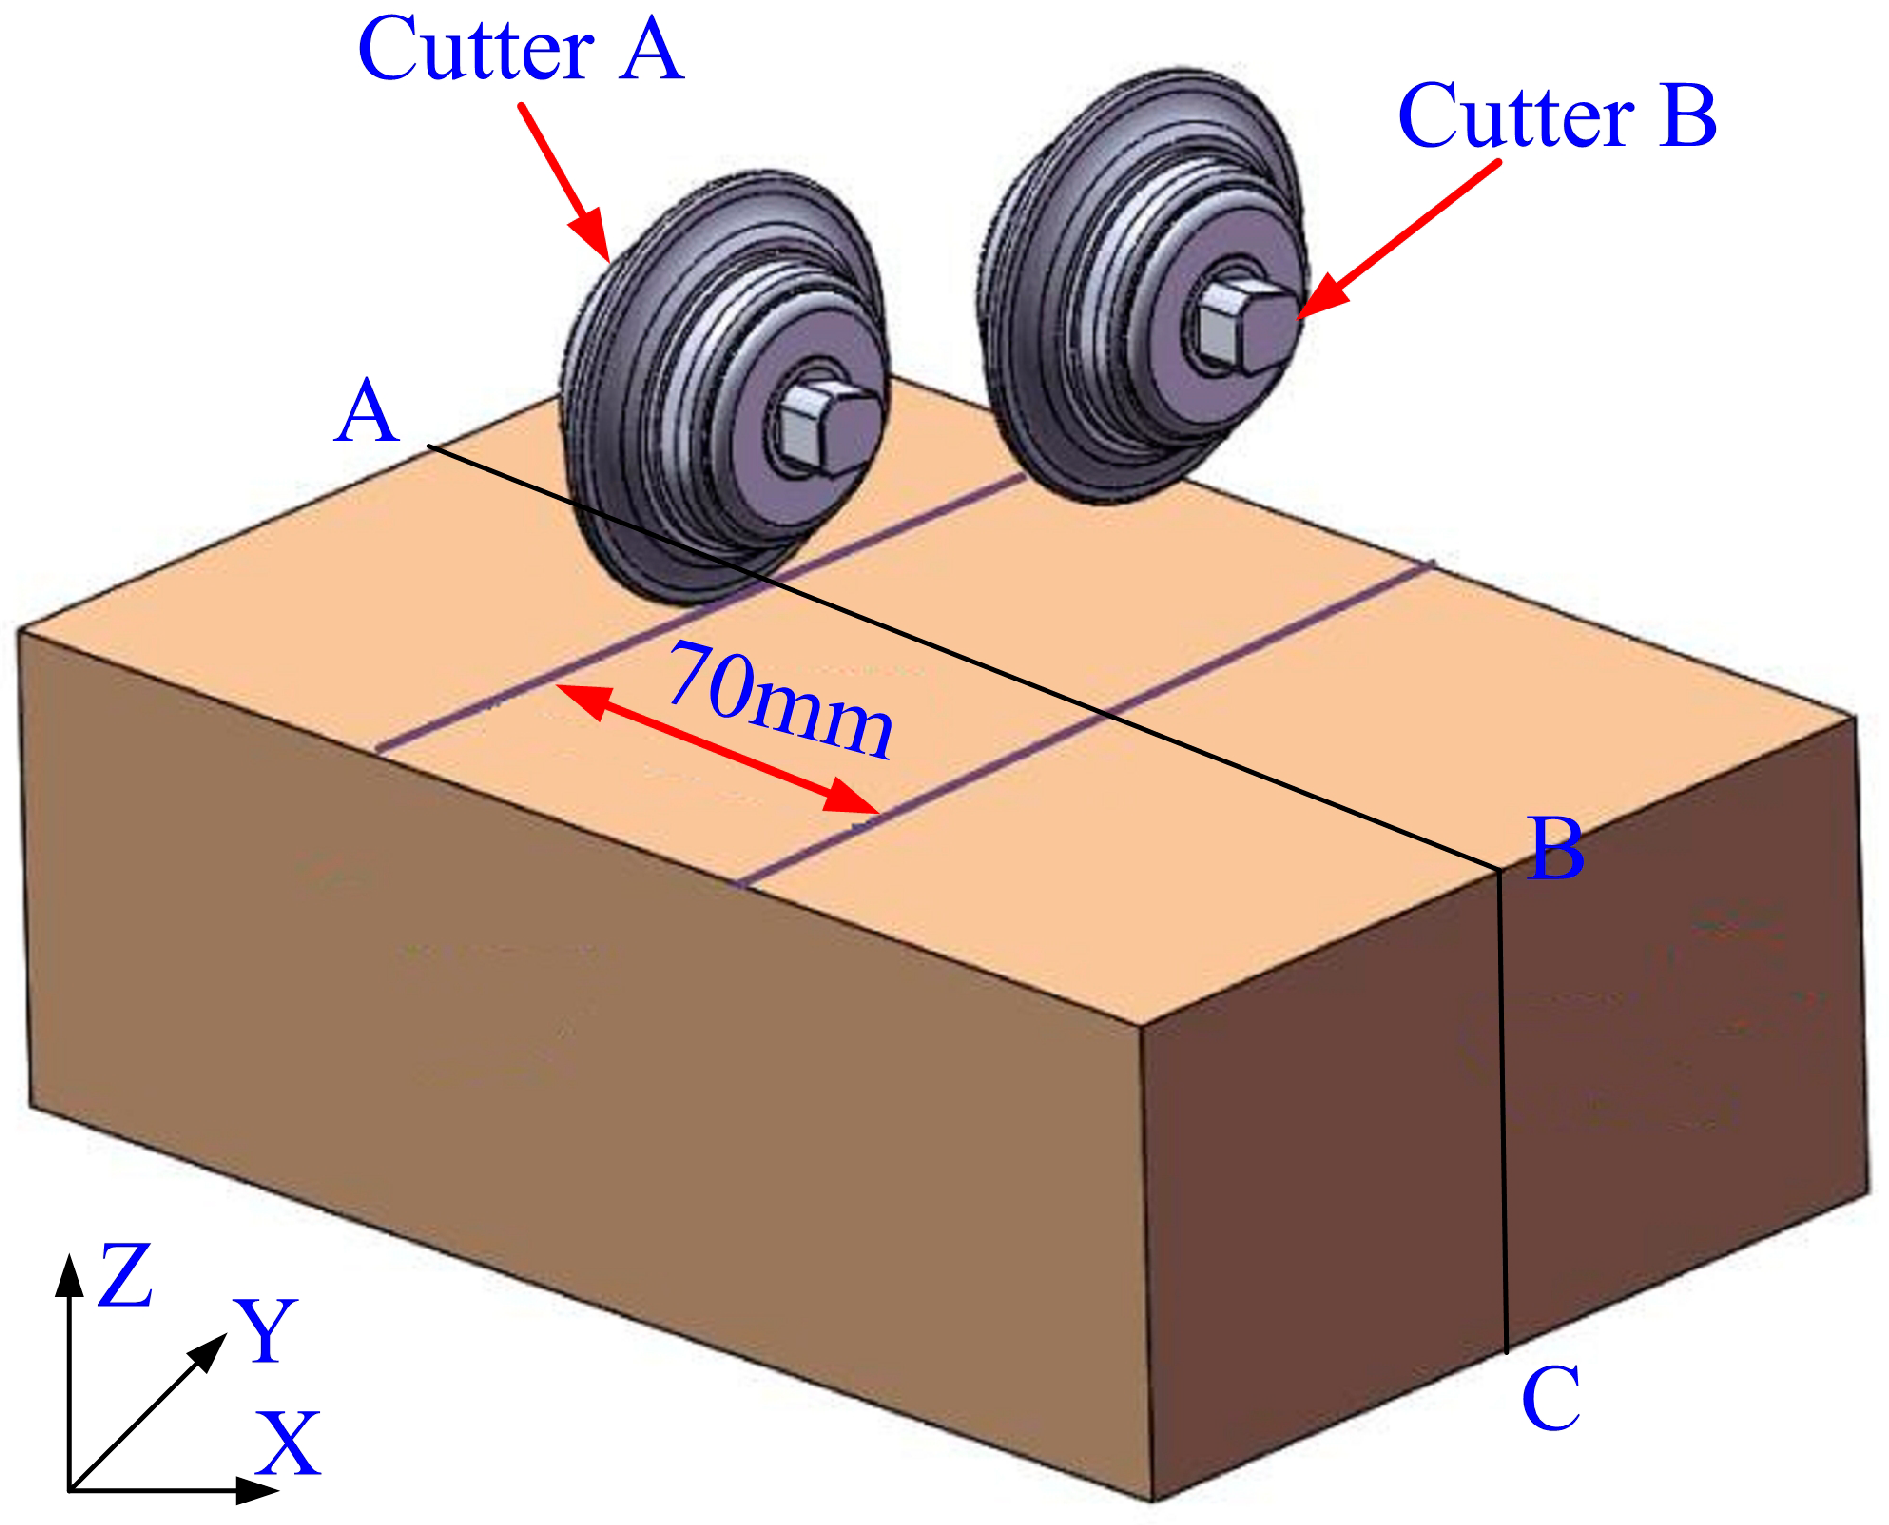
2.3. Experimental Design

The test was carried out on the rock indentation test loading system. The specimen was placed in the loading area. The acoustic emission probe was installed on the surface of the specimen, and at the same time, the cutter was placed in the designated position, and the acoustic emission software was debugged. An initial lateral pressure of 0.1 MPa was applied to the left and right surfaces of the specimen, and this pressure was maintained during the subsequent loading process to simulate the lateral restraint on the lateral displacement of the specimen. After the confining stress was loaded, the force control was used to load the vertical load to 100 N to ensure that the vertical loading unit was in full contact with the top of the cutter. Then, the vertical direction was loaded to 100 N. The displacement control was used to control the penetration speed, with the loading being performed at a rate of 0.5 mm/min. The variation curves of the penetration depth and the penetration force were recorded, and at the same time, the acoustic emission was recorded in the indentation process. After the penetration depth reached the target value, the penetration and recording were stopped and unloaded in the vertical direction. When the load in the vertical direction was reduced to 0, unloading was started in the horizontal direction. Next, the cutter was removed and adjusted to perform the second indentation test. The distribution of surface cracks was observed and recorded, and the rock chips were collected. After the test was completed, the specimen was cut along the vertical loading section to study the internal crack development, as shown in Figure 4.

3. Results and Analysis

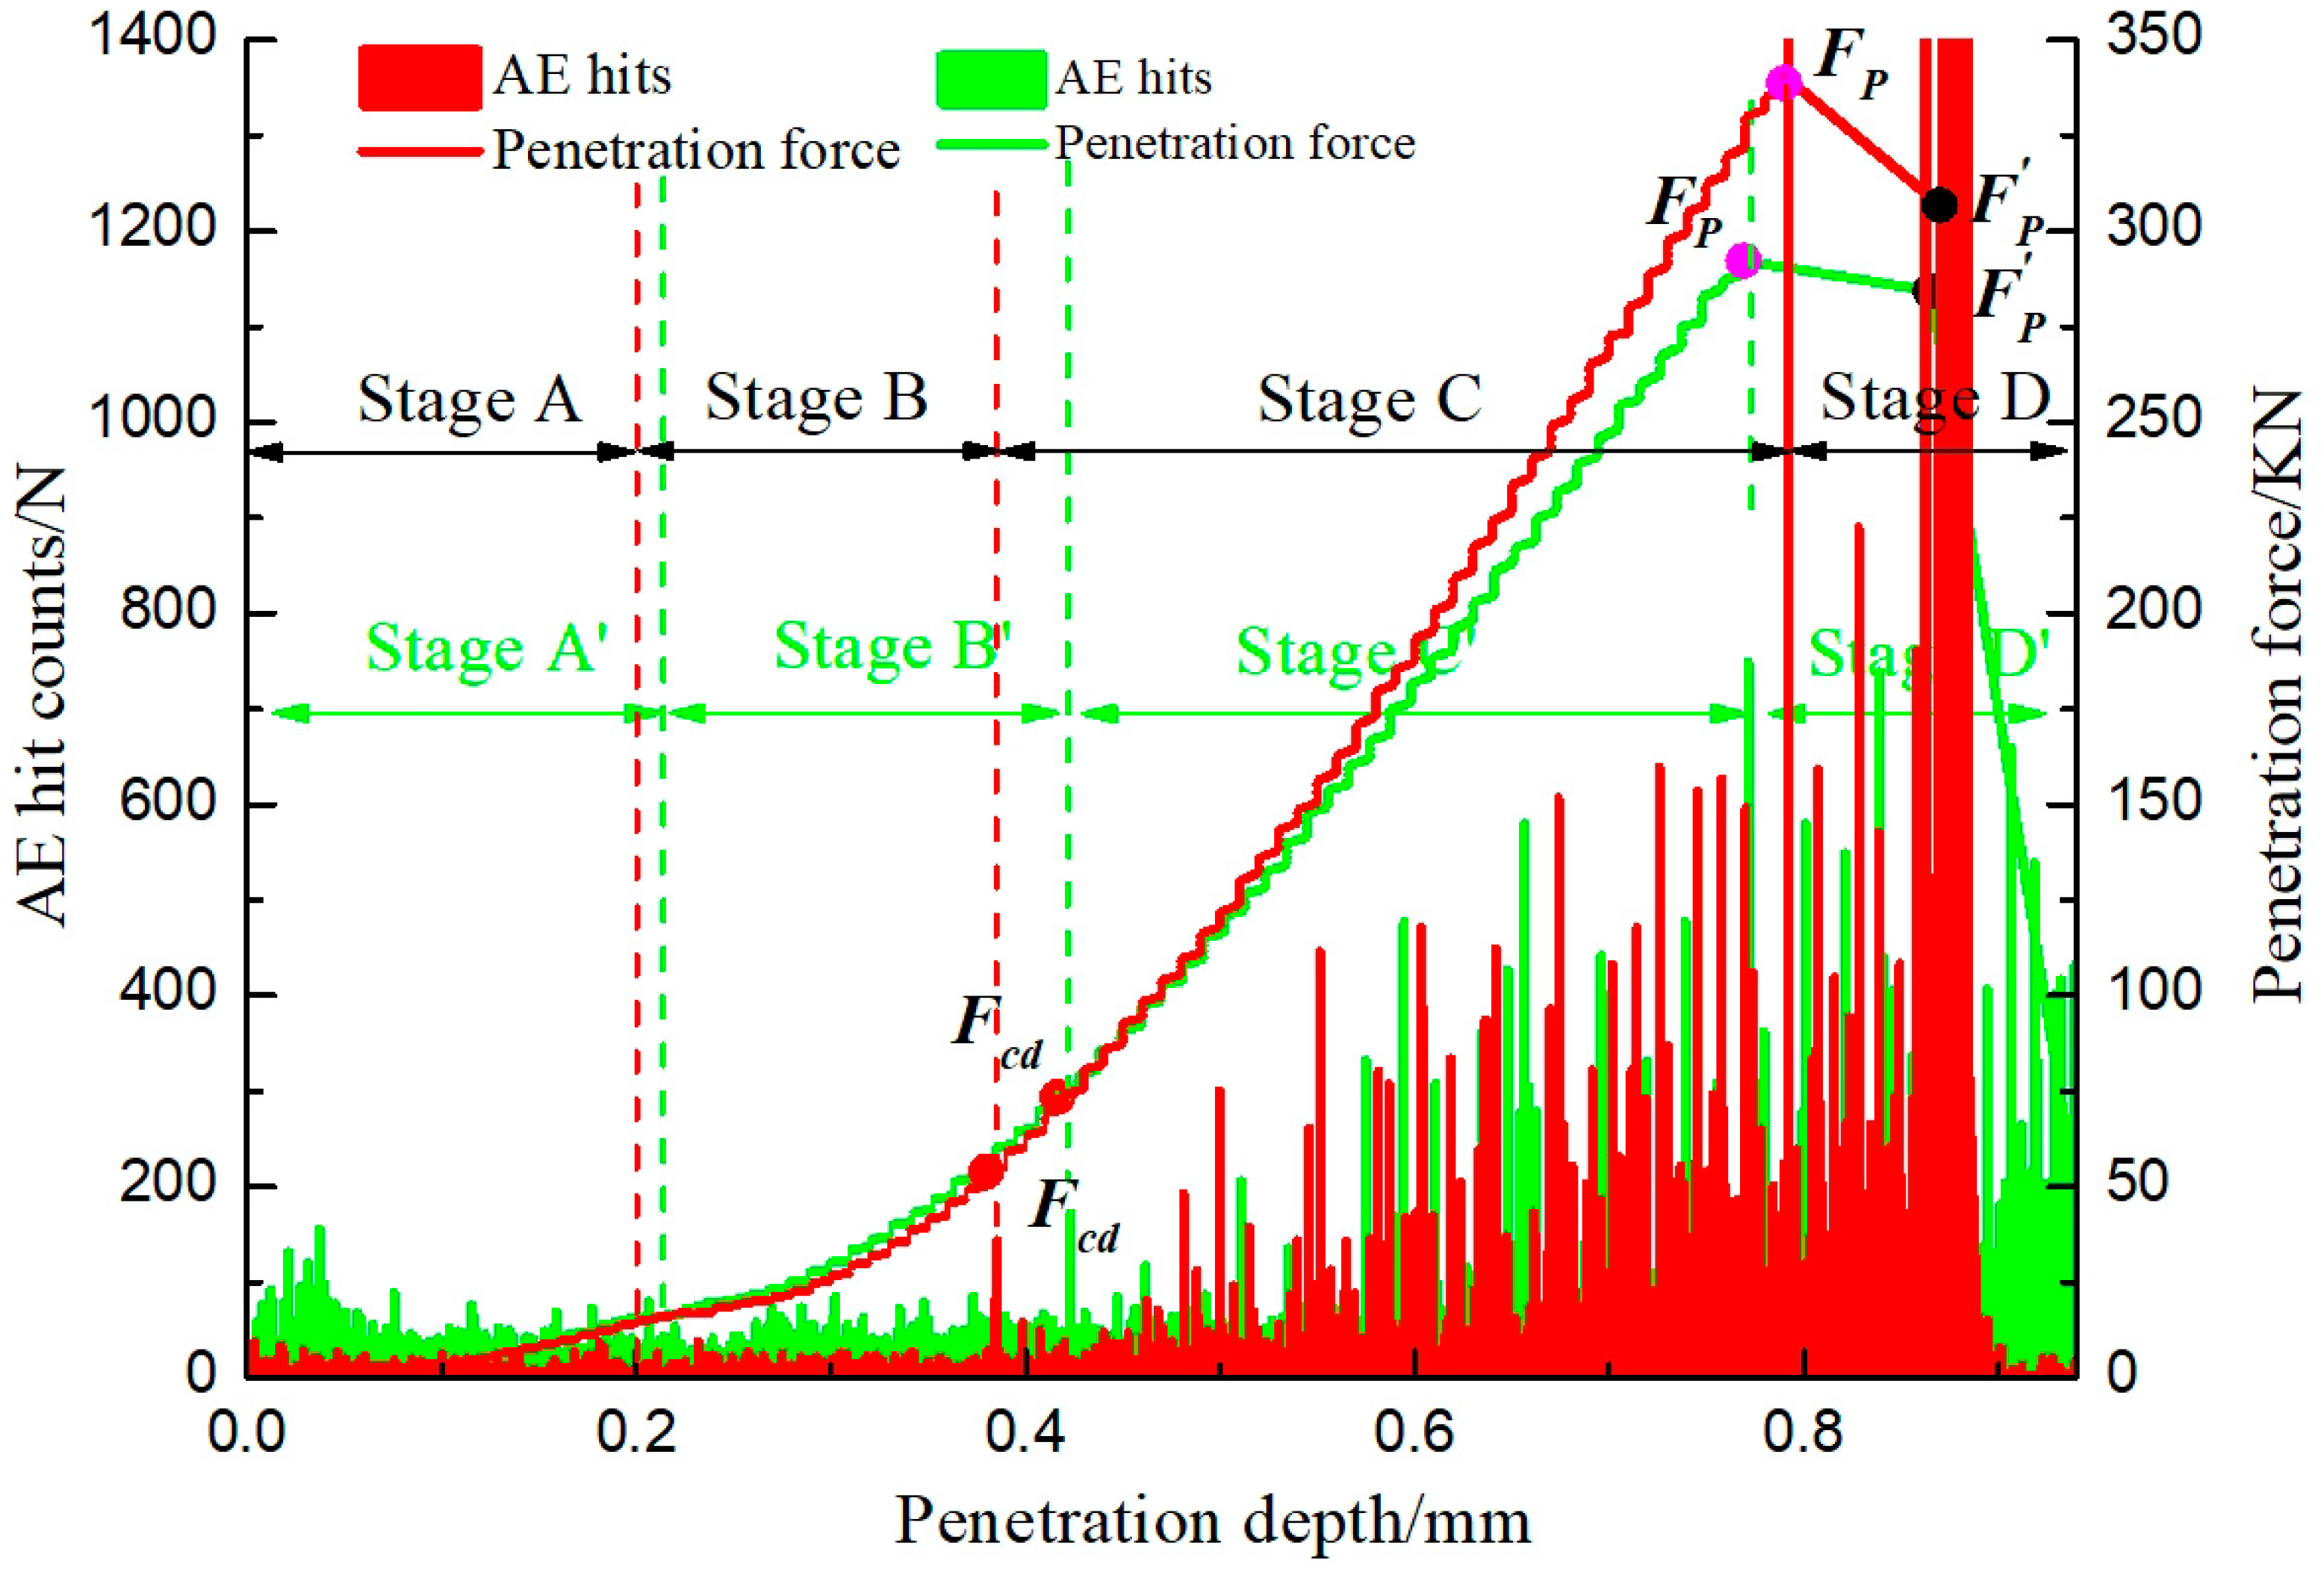
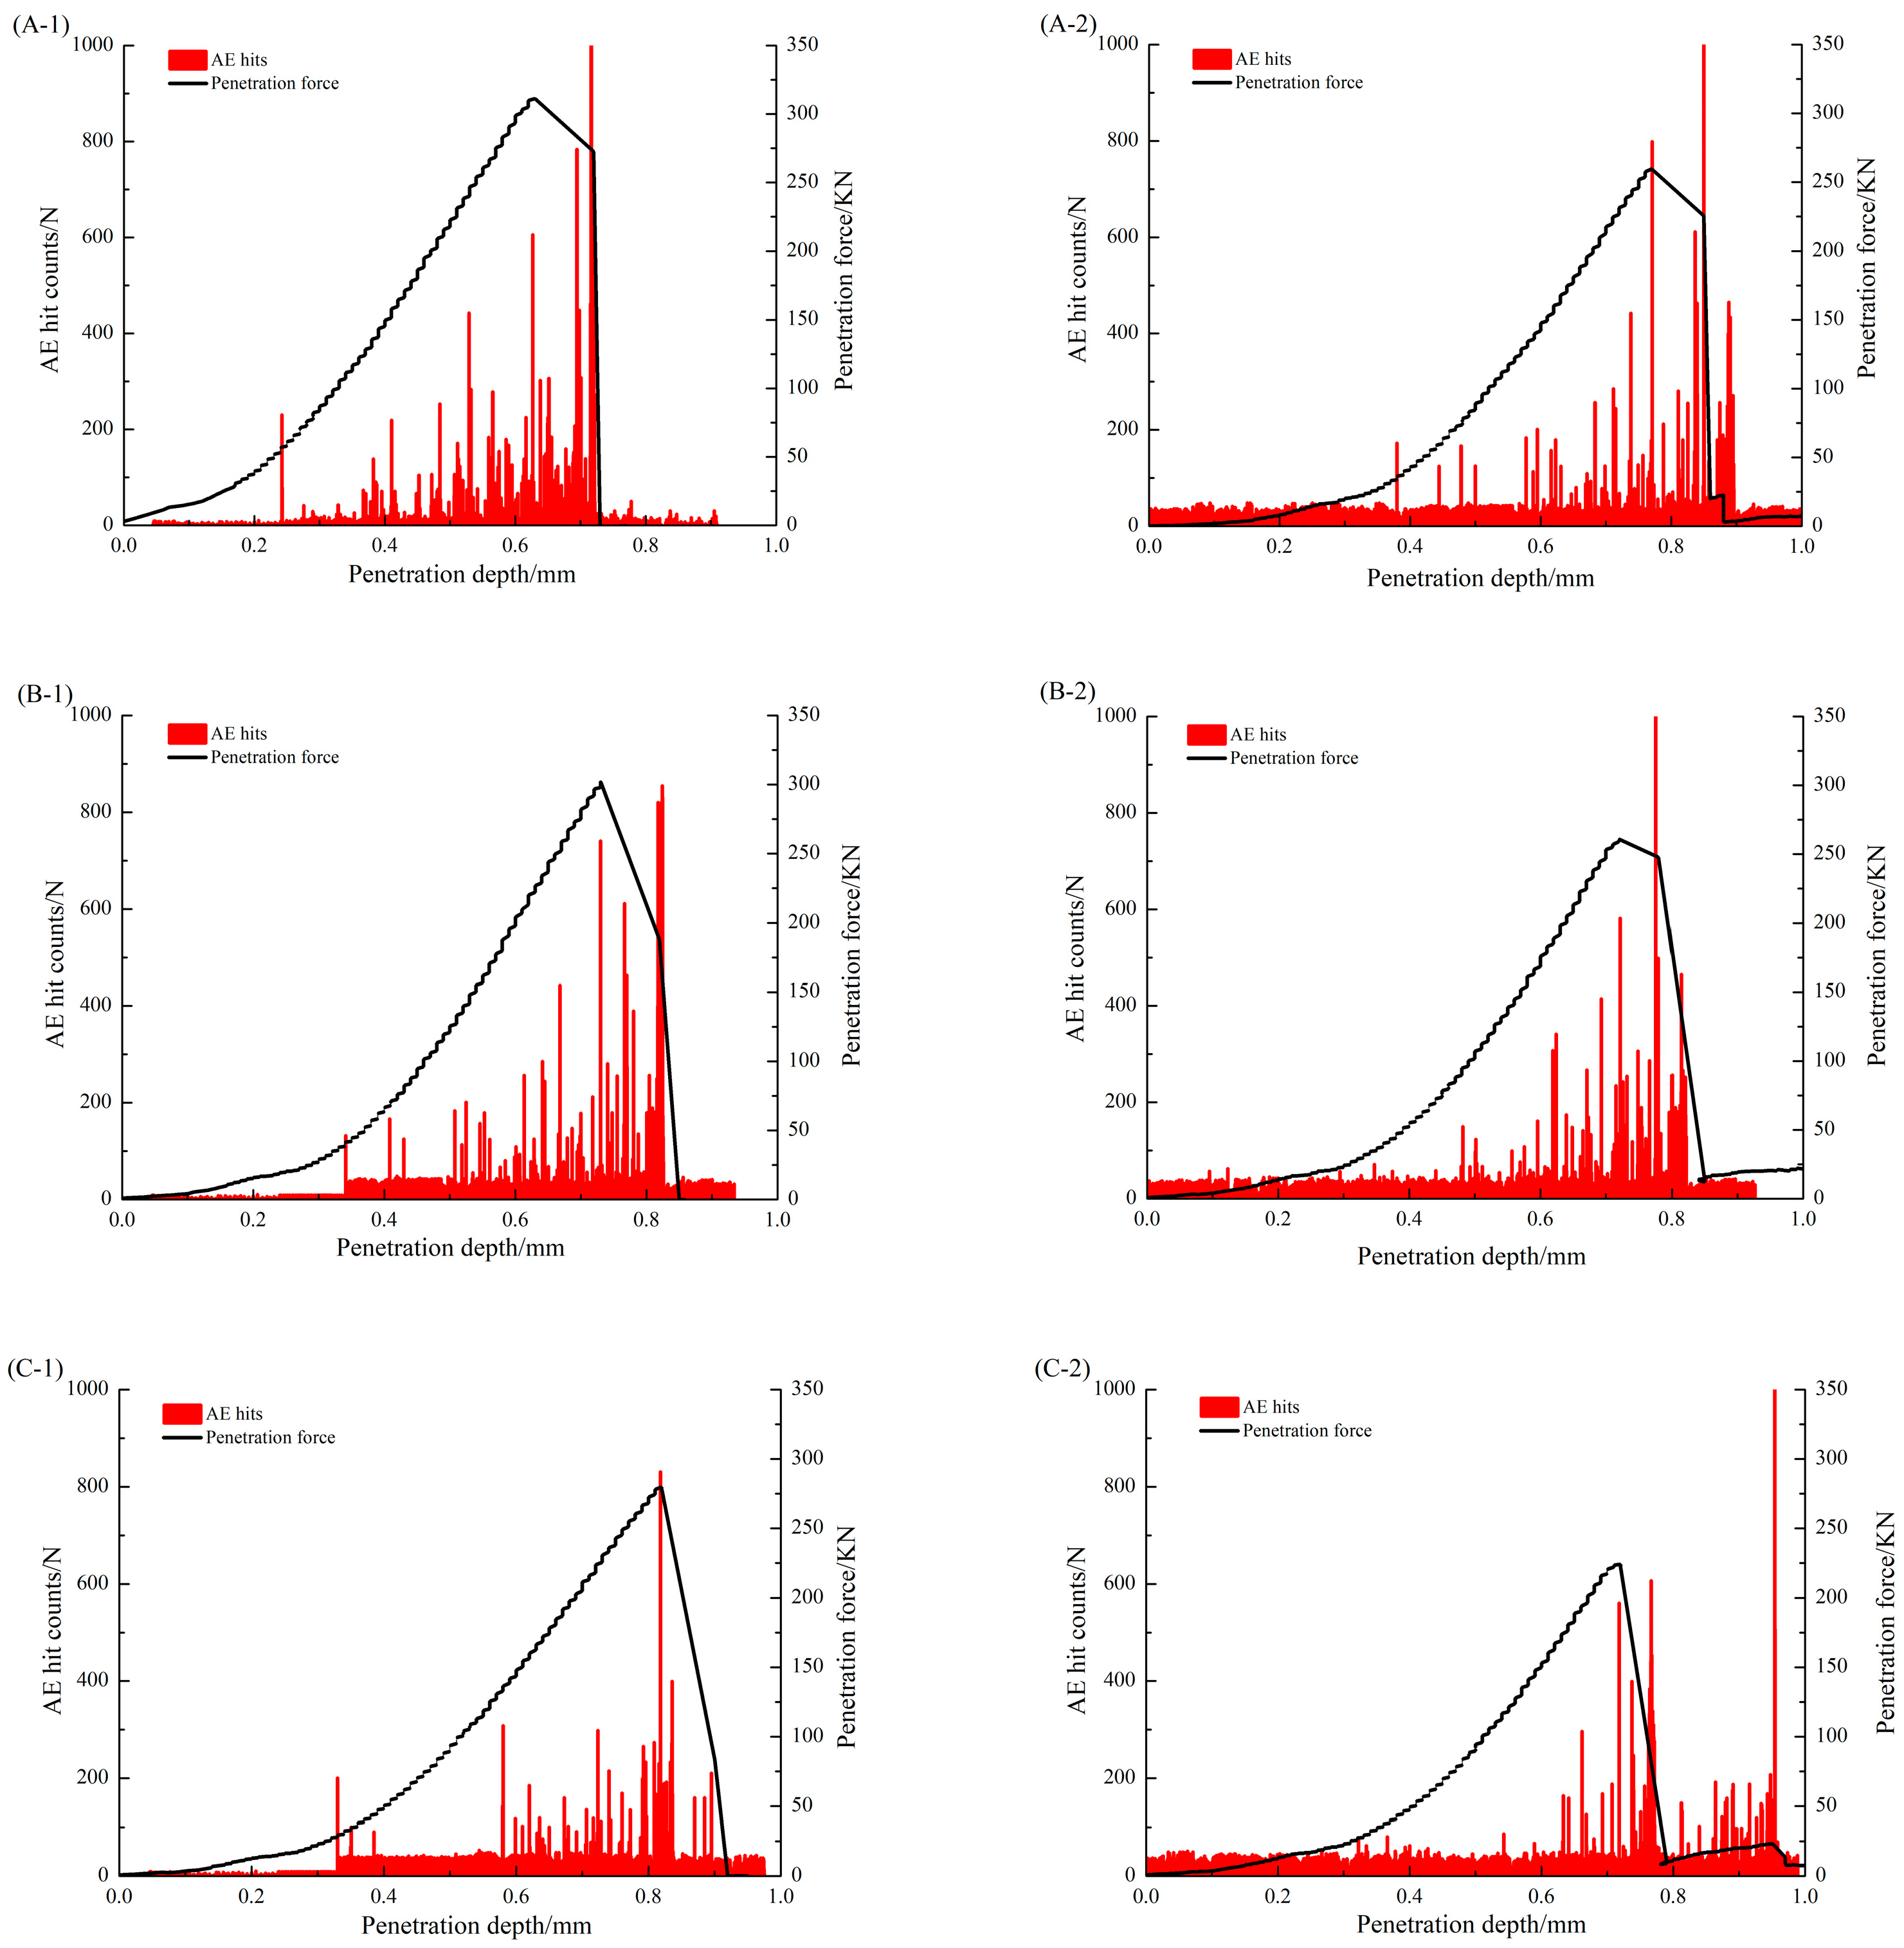
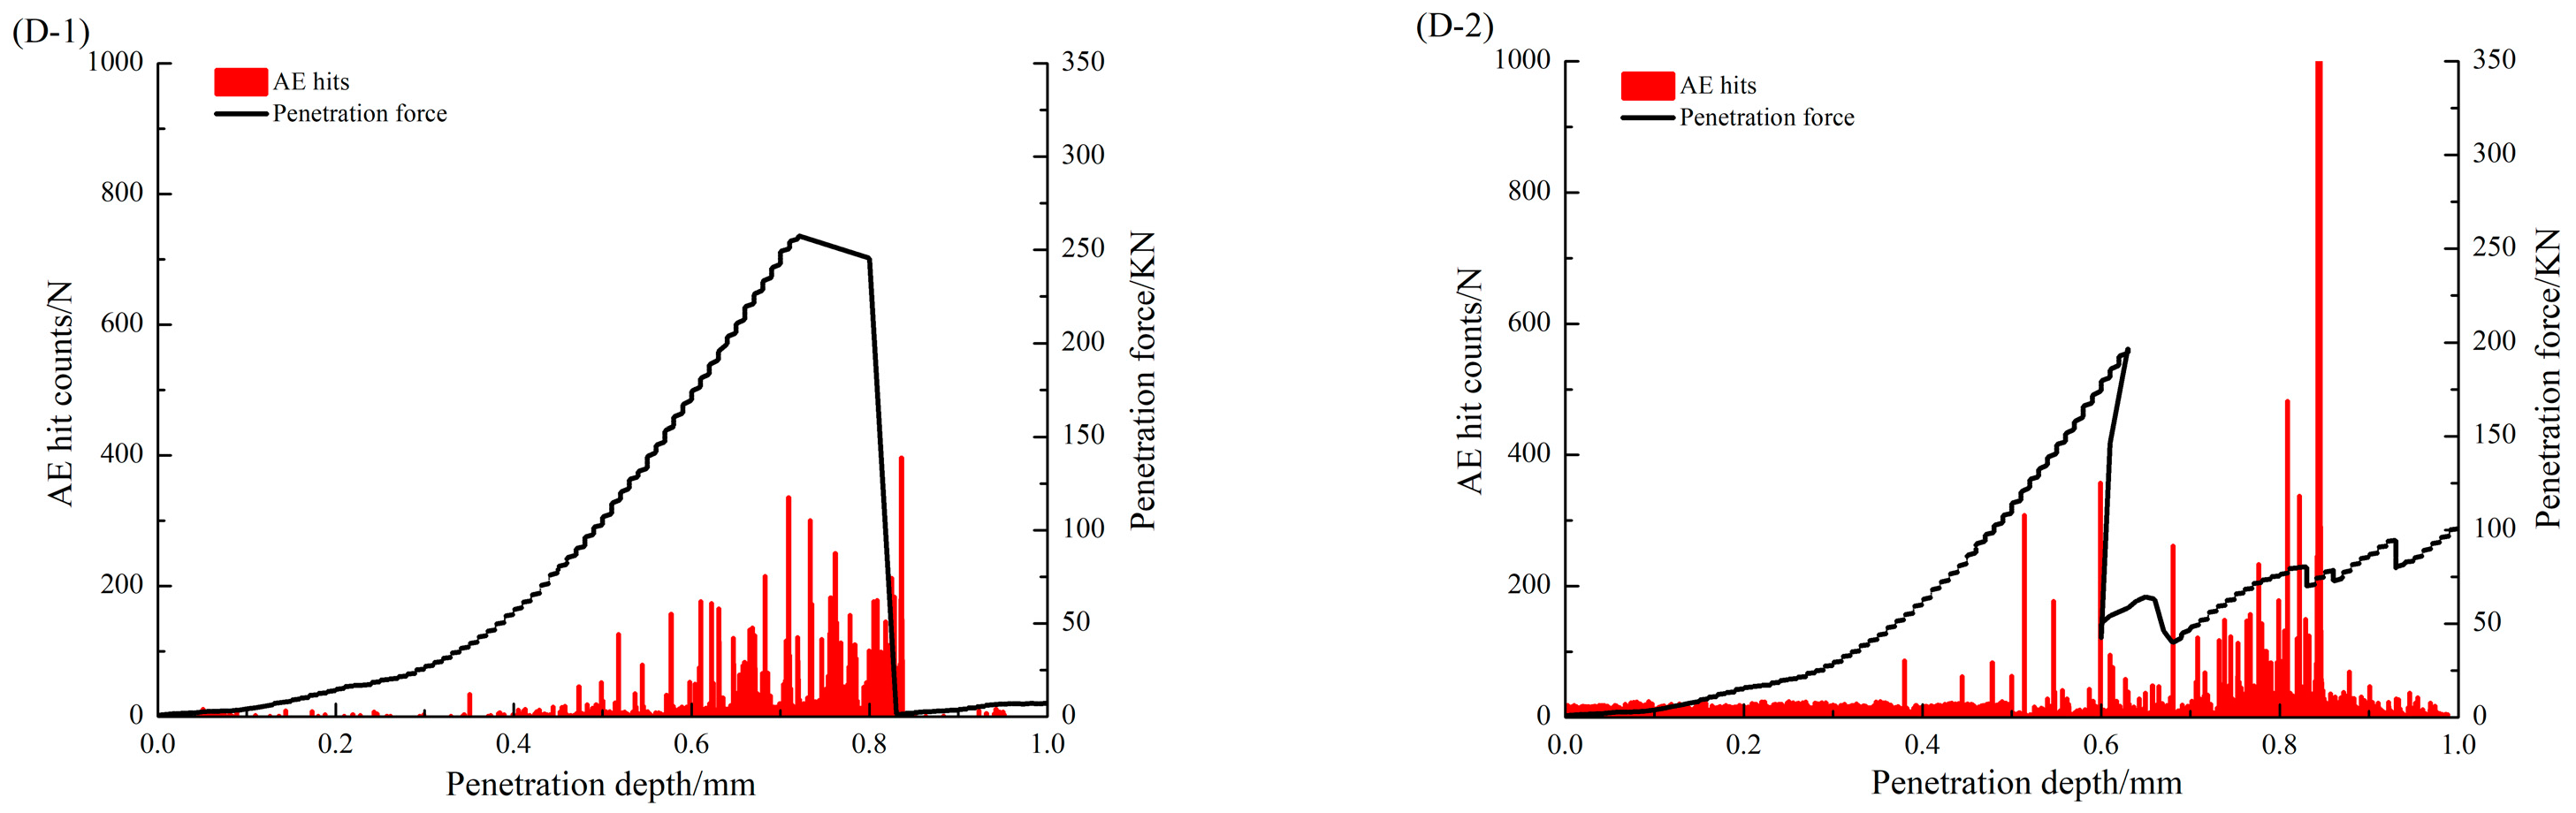
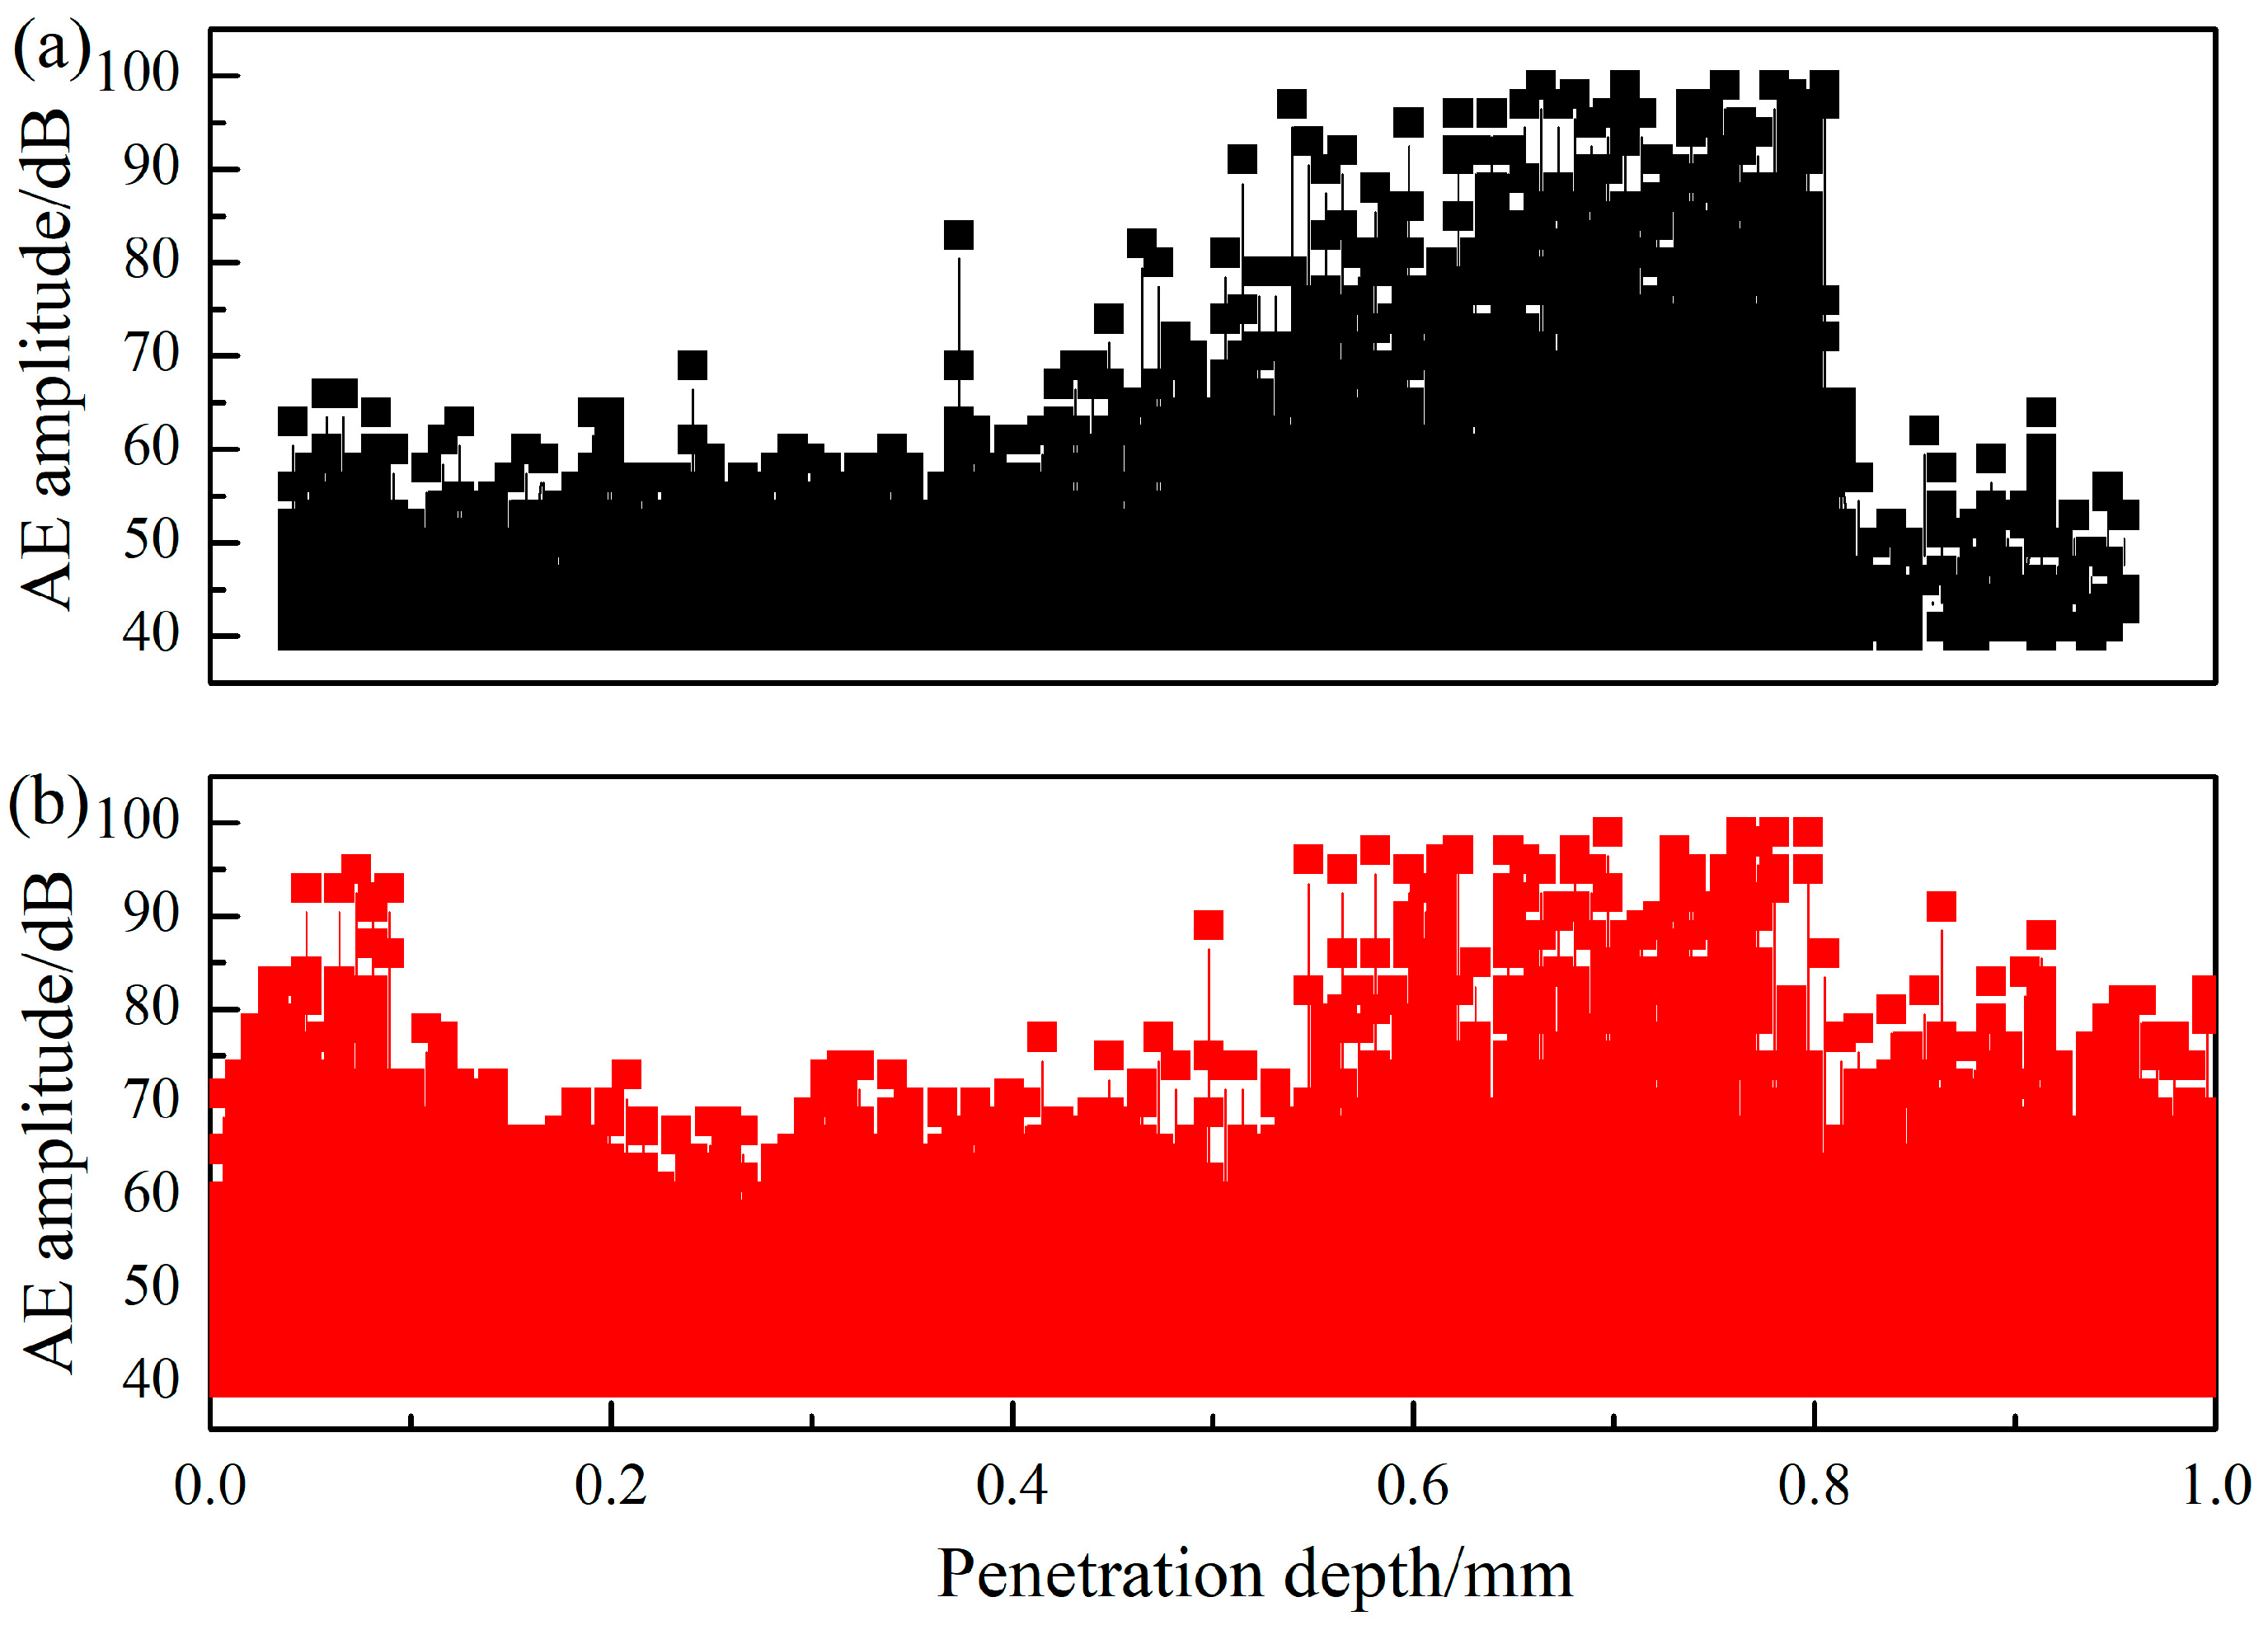
3.1. Indentation Force and AE Events in the Indentation Process

With respect to the dry specimen, the typical penetration forces and AE events are shown in Figure 5 (red represents the first indentation process, green represents the second indentation process). The variation curve of the penetration force with the penetration depth can be divided into four stages, namely A, B, C, and D, as shown in Figure 5 as the areas divided by the red dotted lines: (1) Micro-crack closure stage (Stage A): at this stage, the rock specimen was in compaction under the action of the cutter. The micro-crack was closed under pressure, and the specimen was gradually compacted, forming an early nonlinear deformation. At this time, no brittle fracture failure occurred, so the number of AE events per unit of time was small, and basically no AE events occurred. (2) Elastic deformation stage (Stage B): once a large number of existing micro-fractures and micro-pores were closed, the specimen entered the elastic deformation stage, and the original cracks in the specimen continued to be compacted. At this stage, the penetration force–penetration depth curve was a concave curve, with the occurrence of a few AE events. (3) Crack propagation stage (Stage C): this stage consisted of stable and unstable crack initiation and propagation periods. At this stage, cracks were continuously generated, rapidly propagated, and coalesced. At the same time, the penetration force increased rapidly at this stage, with the further penetration of the cutter. The penetration force Fcd, corresponding to the red dot in Figure 5 reached 55 kN, which was the critical penetration force that turned the rock mass from elastic deformation to brittle fracture. At this stage, the acoustic emission energy increased rapidly, indicating that the AE events were mainly caused by crack propagation. (4) The post-failure to the residual strength (Stage D): when the penetration force reached a certain value (i.e., the peak penetration force Fp in purple-red shown in Figure 4 (340 kN)) the penetration force rapidly dropped to the vertical penetration force F p (in black in Figure 5 (305 kN)), and then, it dropped even more sharply, accompanied by more obvious acoustic emissions.
Unlike in the first indentation, the acoustic emission was maintained at a high level in the early stage of the second indentation, because the first indentation already caused some damage to the specimen, and in the early stage of the second indentation, the cutter was likely to cause further damage, resulting in severe acoustic emissions. Therefore, the variation curve of the penetration force with the penetration depth in the second indentation process can be divided into four stages, namely A′, B′, C′, and D′ with the penetration depth curve shown in Figure 5 as the areas divided by the green dotted lines. In Stage A′, as the indentation increased, the penetration force increased slowly. When the penetration depth increased to 0.18 mm, the penetration force increased with the penetration depth. In Stage B′, when the penetration depth increased to 0.38 mm, the penetration force reached Fcd, as shown in Figure 5, which was close to 75 kN. In Stage C′, the penetration force increased greatly with the increase of the penetration depth. When the penetration depth increased to about 0.78 mm, the penetration force reached a peak (i.e., Fp in Figure 5), which was 292 kN. During this process, the number of acoustic emissions per unit of time was consistently maintained at a high level, indicating that the crack development in the specimen was maintained at a high level in this stage. In early Stage D′, the penetration force slowly decreased until the penetration depth reached 0.87 mm. After that, with the further increase of the penetration depth, the penetration force dropped sharply until the specimen failed. During the decrease of the penetration force, the acoustic emission phenomenon still remained at a high level.
Figure 6 summarizes the set of tests in various conditions. This phenomenon was most obvious at the time when the penetration force reached the peak and was consistent with the penetration force–penetration depth curve. Unlike in the first indentation, the acoustic emission phenomenon was maintained at a high level even in the early stage of the second indentation, mainly because there was already some damage inside the specimen after the first indentation, and on this basis, the cutter was extremely likely to cause further damage during the second indentation. This conclusion is basically consistent with the results obtained by other researchers [29]. However, there are still many differences between the test results of the granite specimens with different water contents and those of the specimens in the dry condition. At the micro-crack closure and elastic deformation stages in the first indentation process, granite specimens with different water contents showed almost no acoustic emission, and those in the dry state showed only a small number of acoustic emissions and basically no change. In the crack propagation stage, the penetration force increased approximately linearly with the penetration depth. This stage was accompanied by leaps in the number of acoustic emissions, indicating that the internal crack developed significantly at this stage. However, due to the water contained in the specimens with different water contents, the rocks had lower strengths. The number of AE events was concentrated before and after the failure, and the moisture-bearing specimens saw fewer AE events than those in the dry condition. In the second indentation process, the number of AE events in the dry state was maintained at a relatively high level before the elastic deformation stage, but with the increase of the water content, the number of AE events decreased. During the crack propagation stage, the acoustic emission of different water content specimens was maintained at a high level. At the post-failure stage, the average number of AE events in the moisture-bearing specimens was smaller than that in the dry specimens. The main reason was that the moisture-bearing specimens were softened after being exposed to water, resulting in smaller deformation and failure. This is consistent with the conclusion that water can reduce rock strength. During the rock saturation process, the internal, mineral particles expand in volume, making the cementation looser, which softens the rock and reduces its strength.
The energy release rate reflects the energy release of AE per unit time. However, it is difficult to reflect the cumulative effect of cutter intrusion on rock. In order to study the cumulative effect of cutter penetration on rock fracture, the AE parameter of cumulative energy was analyzed. Due to space limitations, only dry specimens were selected for AE energy analysis. The typical relationship between the AE cumulative energy and the penetration depth is shown in Figure 7. Cumulative energy is the accumulation of energy in the process of cutter penetration, which indicates the total strength of AE energy. As shown in Figure 7, the cumulative energy increases little at the initial stage, this shows that the specimen has a small amount of damage, and the damage to energy is very low at the beginning of the load. With the increase of load increasing, AE cumulative energy increases sharply after a large number of cracks emanated and propagated, this phenomenon can be used as the precursor information of rock specimen damage and imminent failure. It also can be observed that, a lot of energy was generated at the second indentation process. The AE accumulative energy of the second indentation process was higher than that of the first indentation process. Combining with Figure 5 and Figure 7, it can be seen that the step formation of AE cumulative energy curve corresponds to the penetration force drop, and the rock sample can be damaged greatly in the test. Therefore, the relationship between AE cumulative energy and penetration force can be used to predict rock failure. The variation law of cumulative energy corresponds to that of penetration force.
AE amplitude is an important parameter of acoustic emission, which is related to the strength of the event. Its value is not limited by the AE threshold and can truly reflect the AE source signal, so it can roughly reflect the real situation of micro-crack activity in rock. Figure 8 shows the relationship between AE amplitude and penetration depth. It can be seen that the AE amplitude increases with the increase of penetration depth in the early stage, and then becomes stable gradually, but there are also some sudden signals, and the amplitude value of acoustic emission is at a high level. When the specimen is destroyed, the value of AE amplitude is at the maximum value of the whole stage, which indicates that there are a lot of cracks in the rock during this stage, and the main fracture surface is gradually connected and merged until the specimen is destroyed.

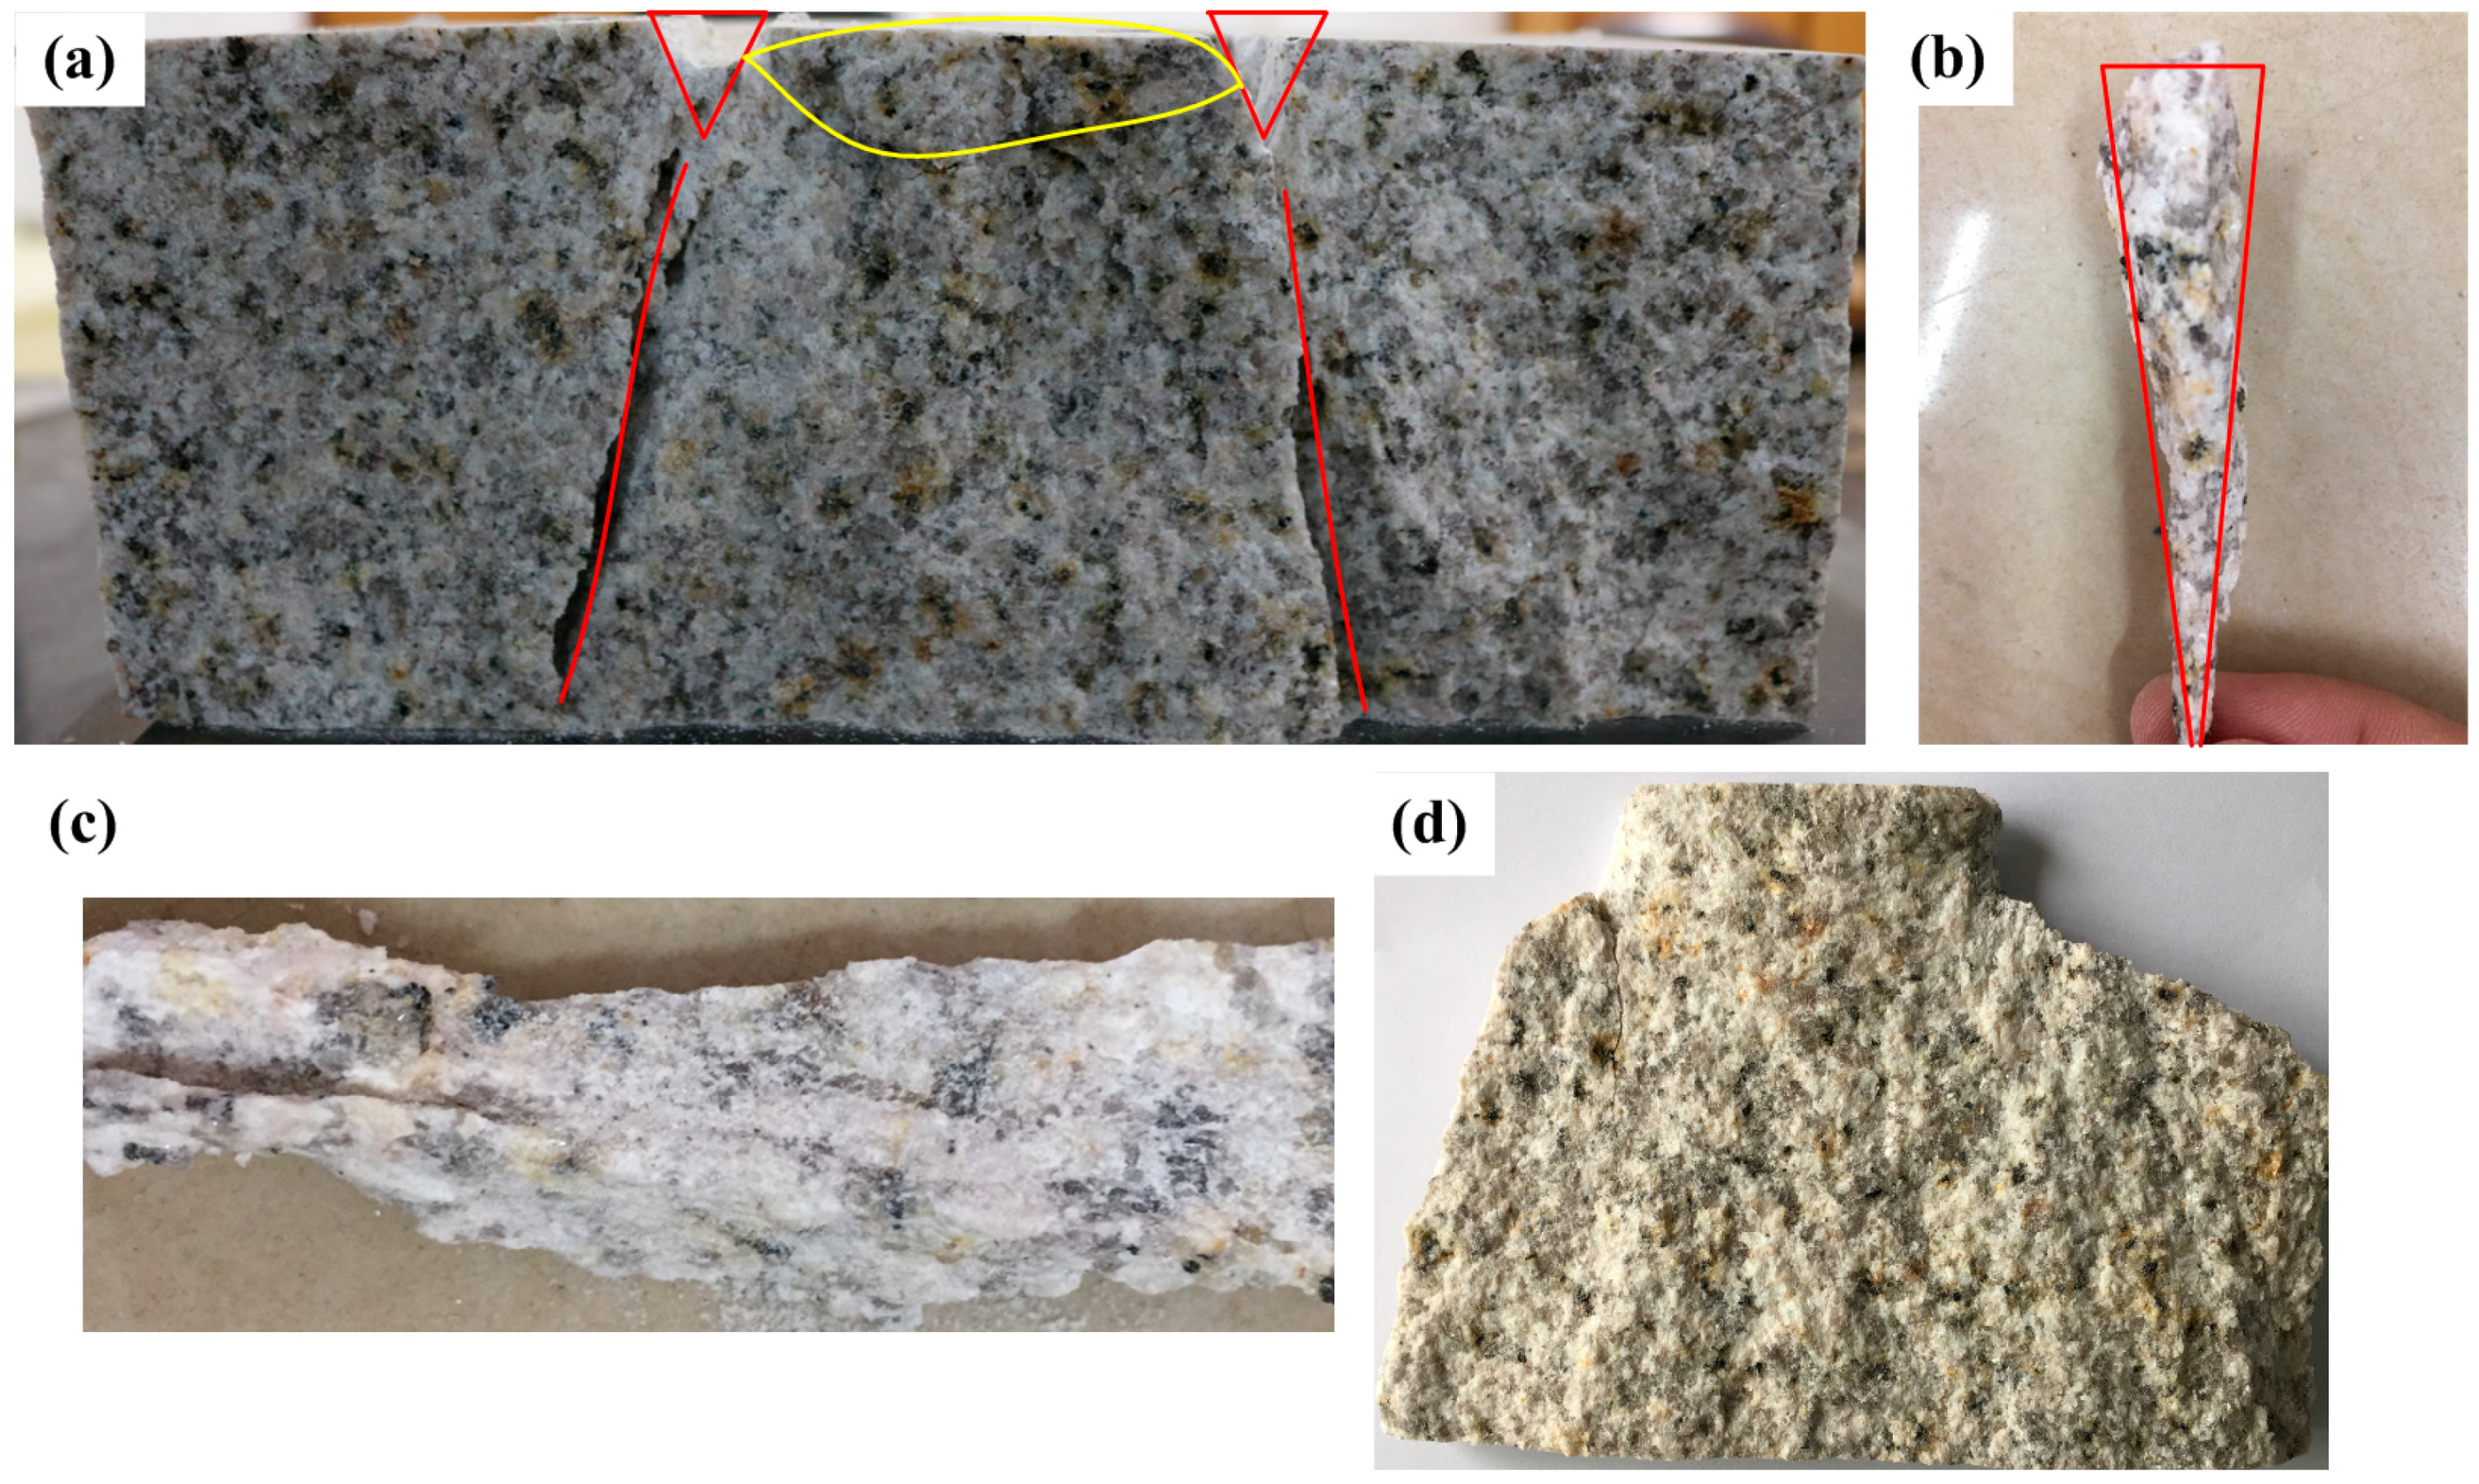
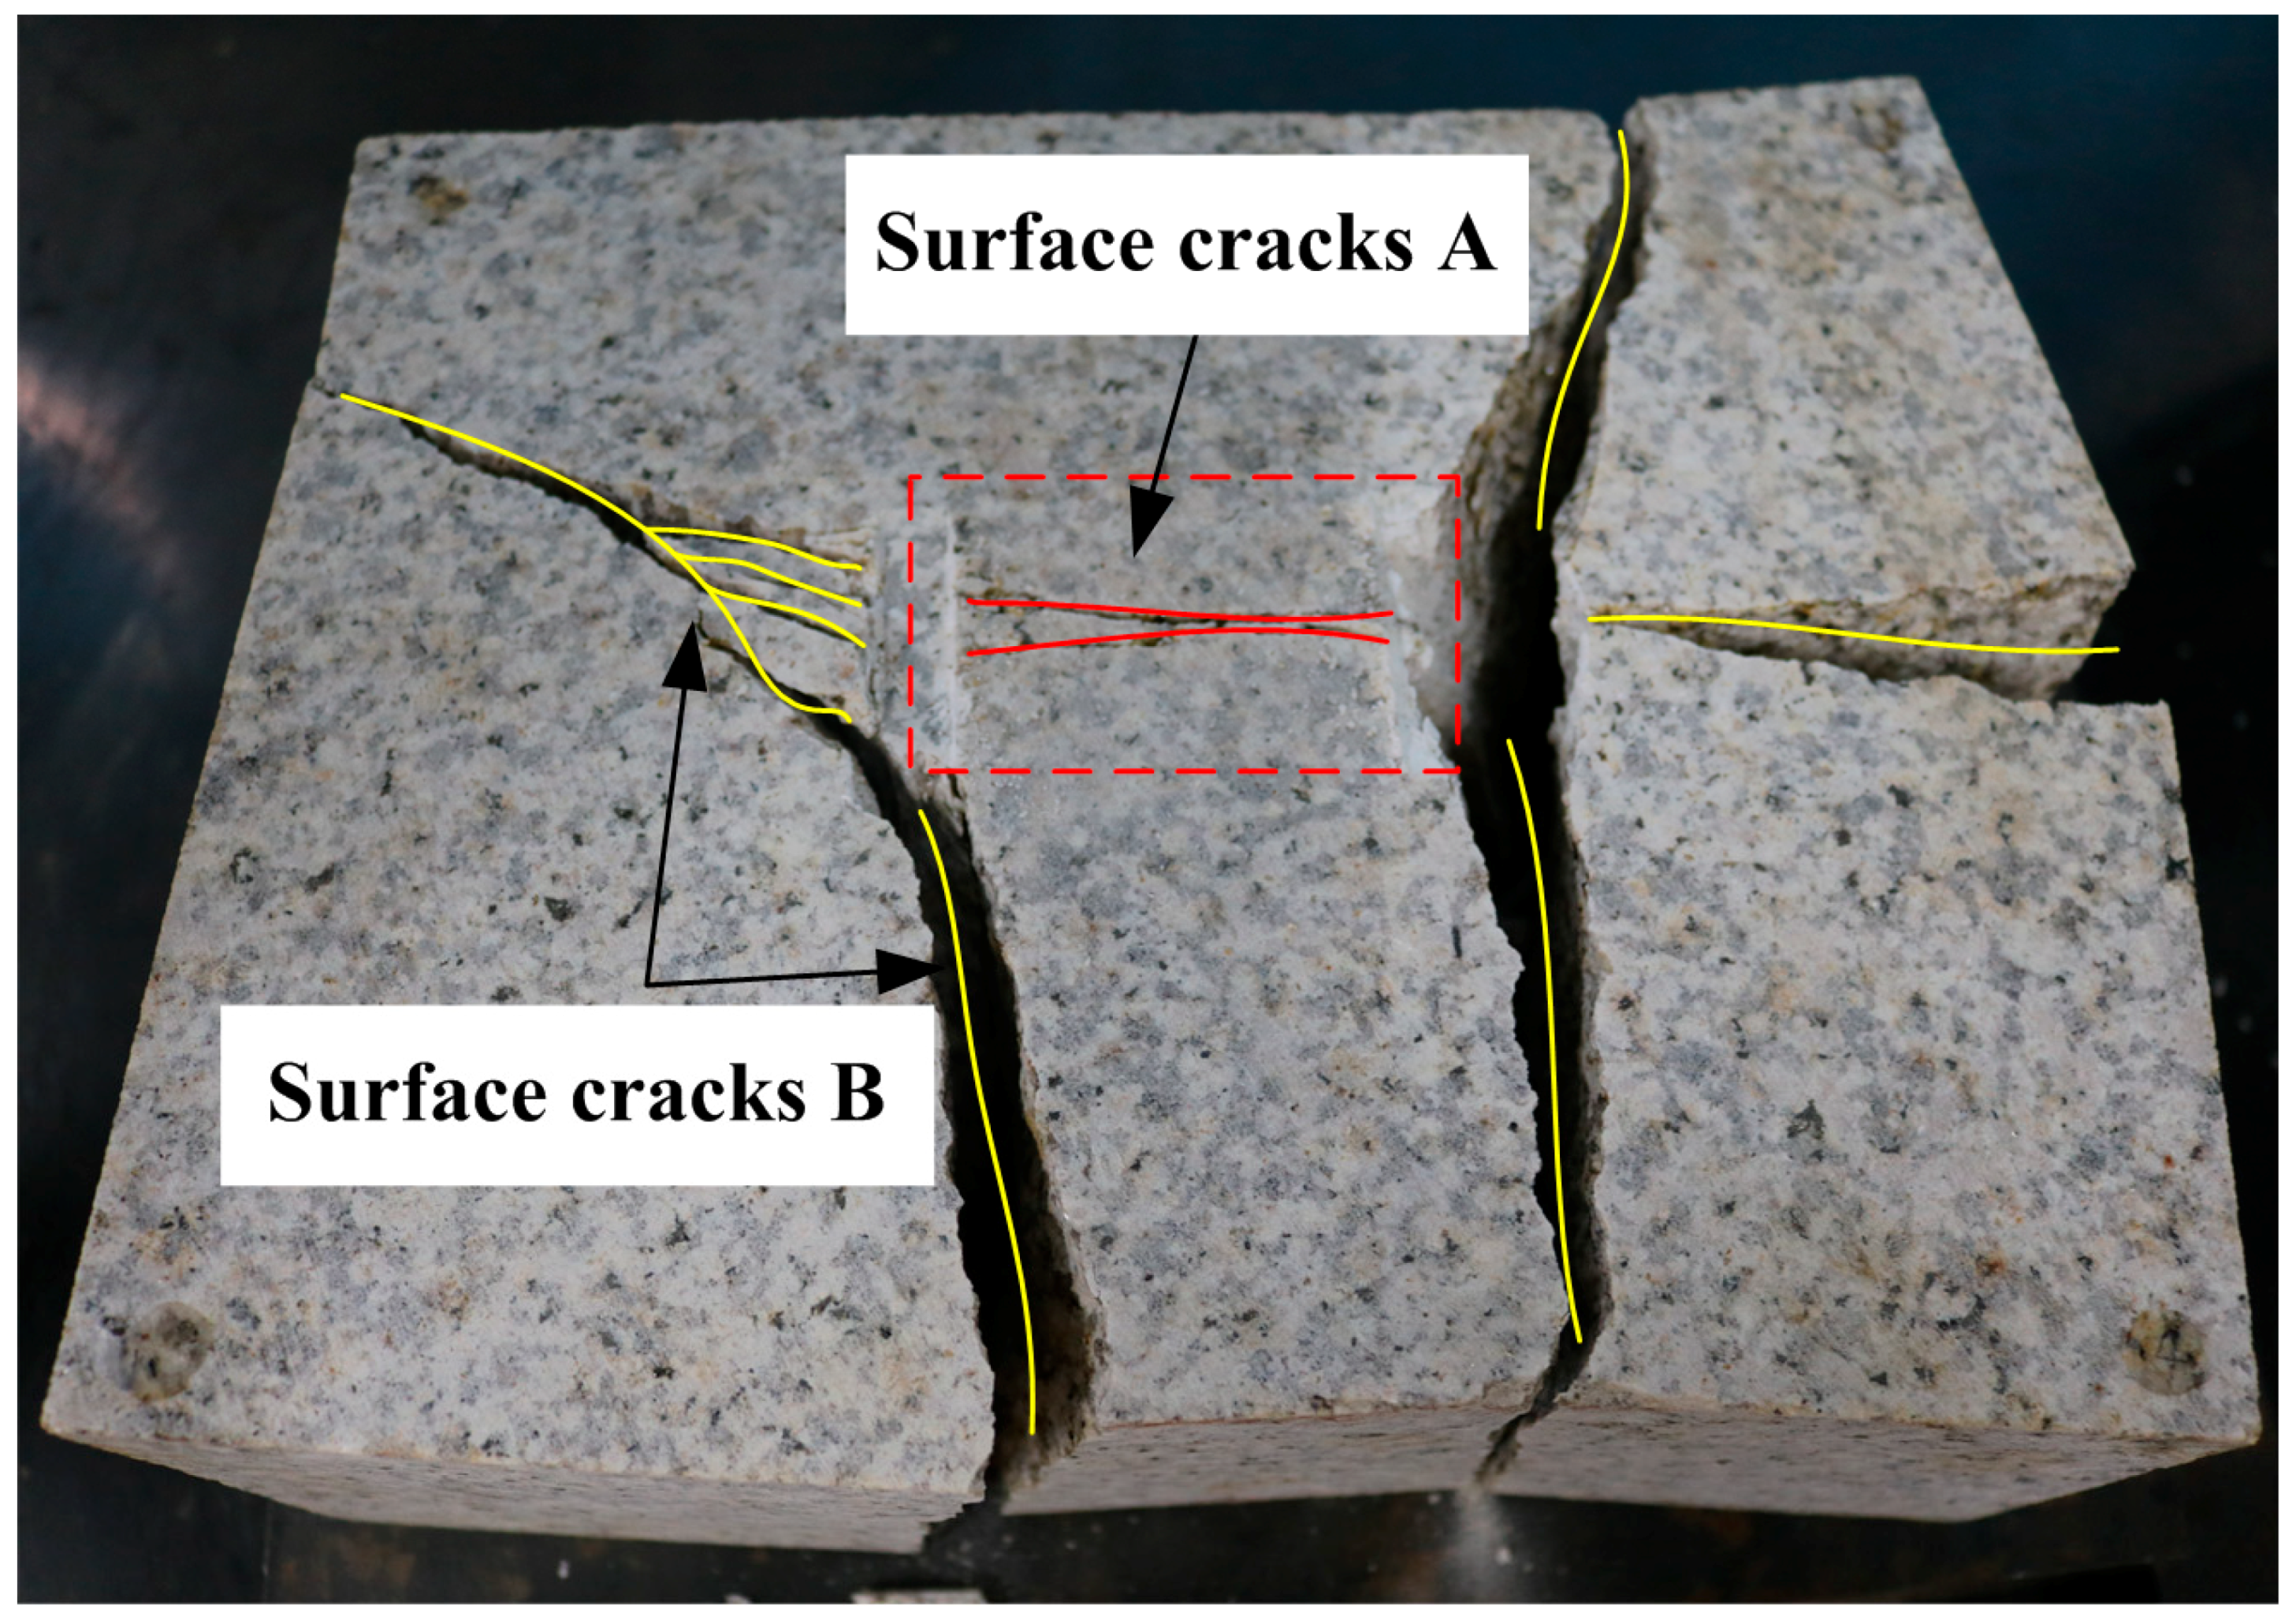
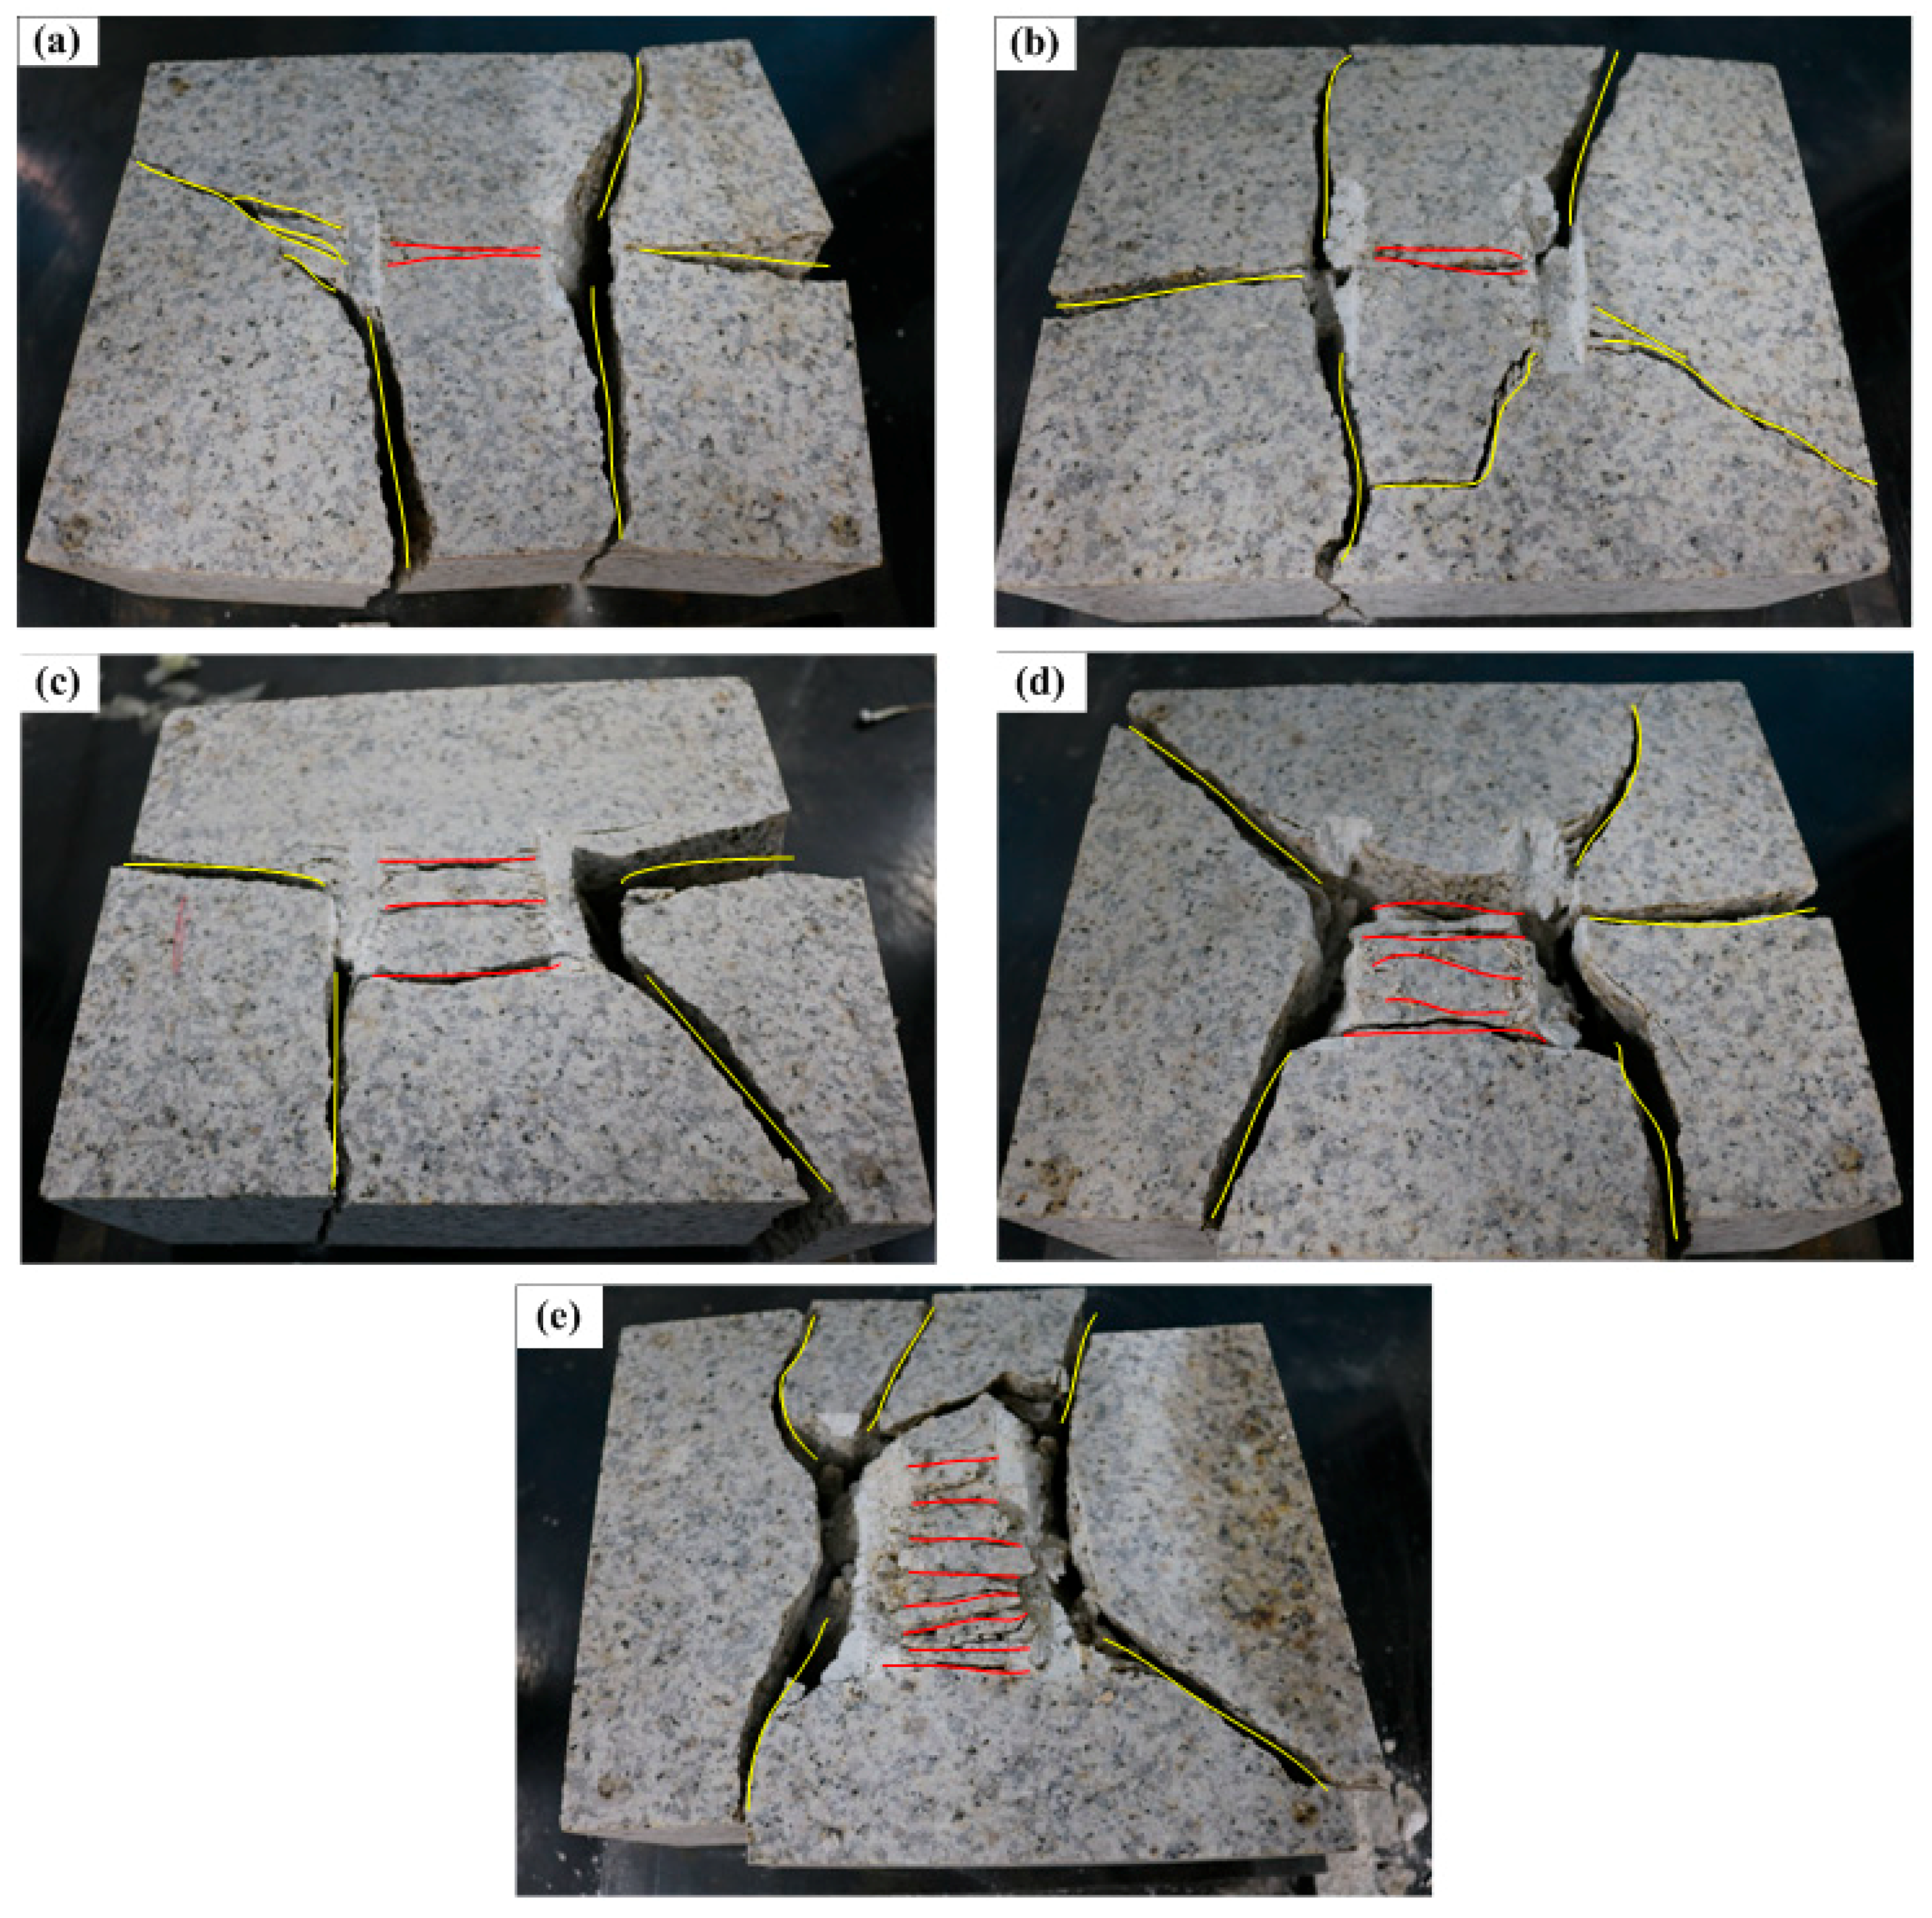
3.2. Crack Propagation

The typical fracture conditions in the internal rock are shown in Figure 9a, which consists mainly of three parts. The first part is the plastic zone below the cutter, whose typical shape, which is essentially an inverted triangle, is shown in Figure 9b. The second part is the crushing zone (the yellow outlines in Figure 9a formed between the two plastic zones, as shown in Figure 9c. The third part is the relatively intact rock mass formed by the internal cracks, as shown in Figure 9d.
Figure 10 shows the typical development of surface cracks. As can be seen, surface cracks can be divided into two types, depending on the locations of the surface cracks. The first type is the surface crack between the two cutting grooves, named surface crack A. It is generated after two indentations, usually starting from the edge of one groove and developing to the other, and its development is directly related to the fragmentation of the rock between the cutters. Therefore, the research on its development degree and path is very important. As shown in Figure 10, apart from surface crack A, there is another type of surface crack on the surface of the specimen, which is named surface crack B. Normally, surface crack B starts from the edge of one groove and develops toward the edges of the specimen.
As shown in Figure 11, when the water content was 0, there were two cracks between the grooves, but they were not completely coalesced. The rock mass between the two cutting grooves was not highly fragmented. When the water content was 0.11%, two cracks appeared between the grooves, one of which was connected to the two grooves by mutual coalescence. When the water content increased to 0.22%, there were three cracks between the grooves, all of which were coalesced with the two grooves but relatively dispersed. When the water content was 0.32%, there were five cracks between the grooves, all of which were coalesced with the two grooves, and the rock mass between the grooves was highly fragmented. When the rock specimen was saturated, the rock mass was severely broken between the grooves, forming eight cracks that coalesced with the grooves. Due to the sufficient development of the cracks between the grooves, the rock mass between the grooves was fully broken. Therefore, with the increase of the water content, the fragmentation of the rock mass between the grooves gradually increased after the indentation.
Based on the development of the internal cracks mentioned above, it can be seen from the typical failure and crack development profile that the internal cracks of the inter-groove rock mass start from the adjacent plastic zones and coalesce with each other, and then, the surface cracks segment the rock mass, forming a complete rock chip. Thus, the contour of the crushing zone between the cutters is determined jointly by the surface cracks and the internal cracks of the rock mass.

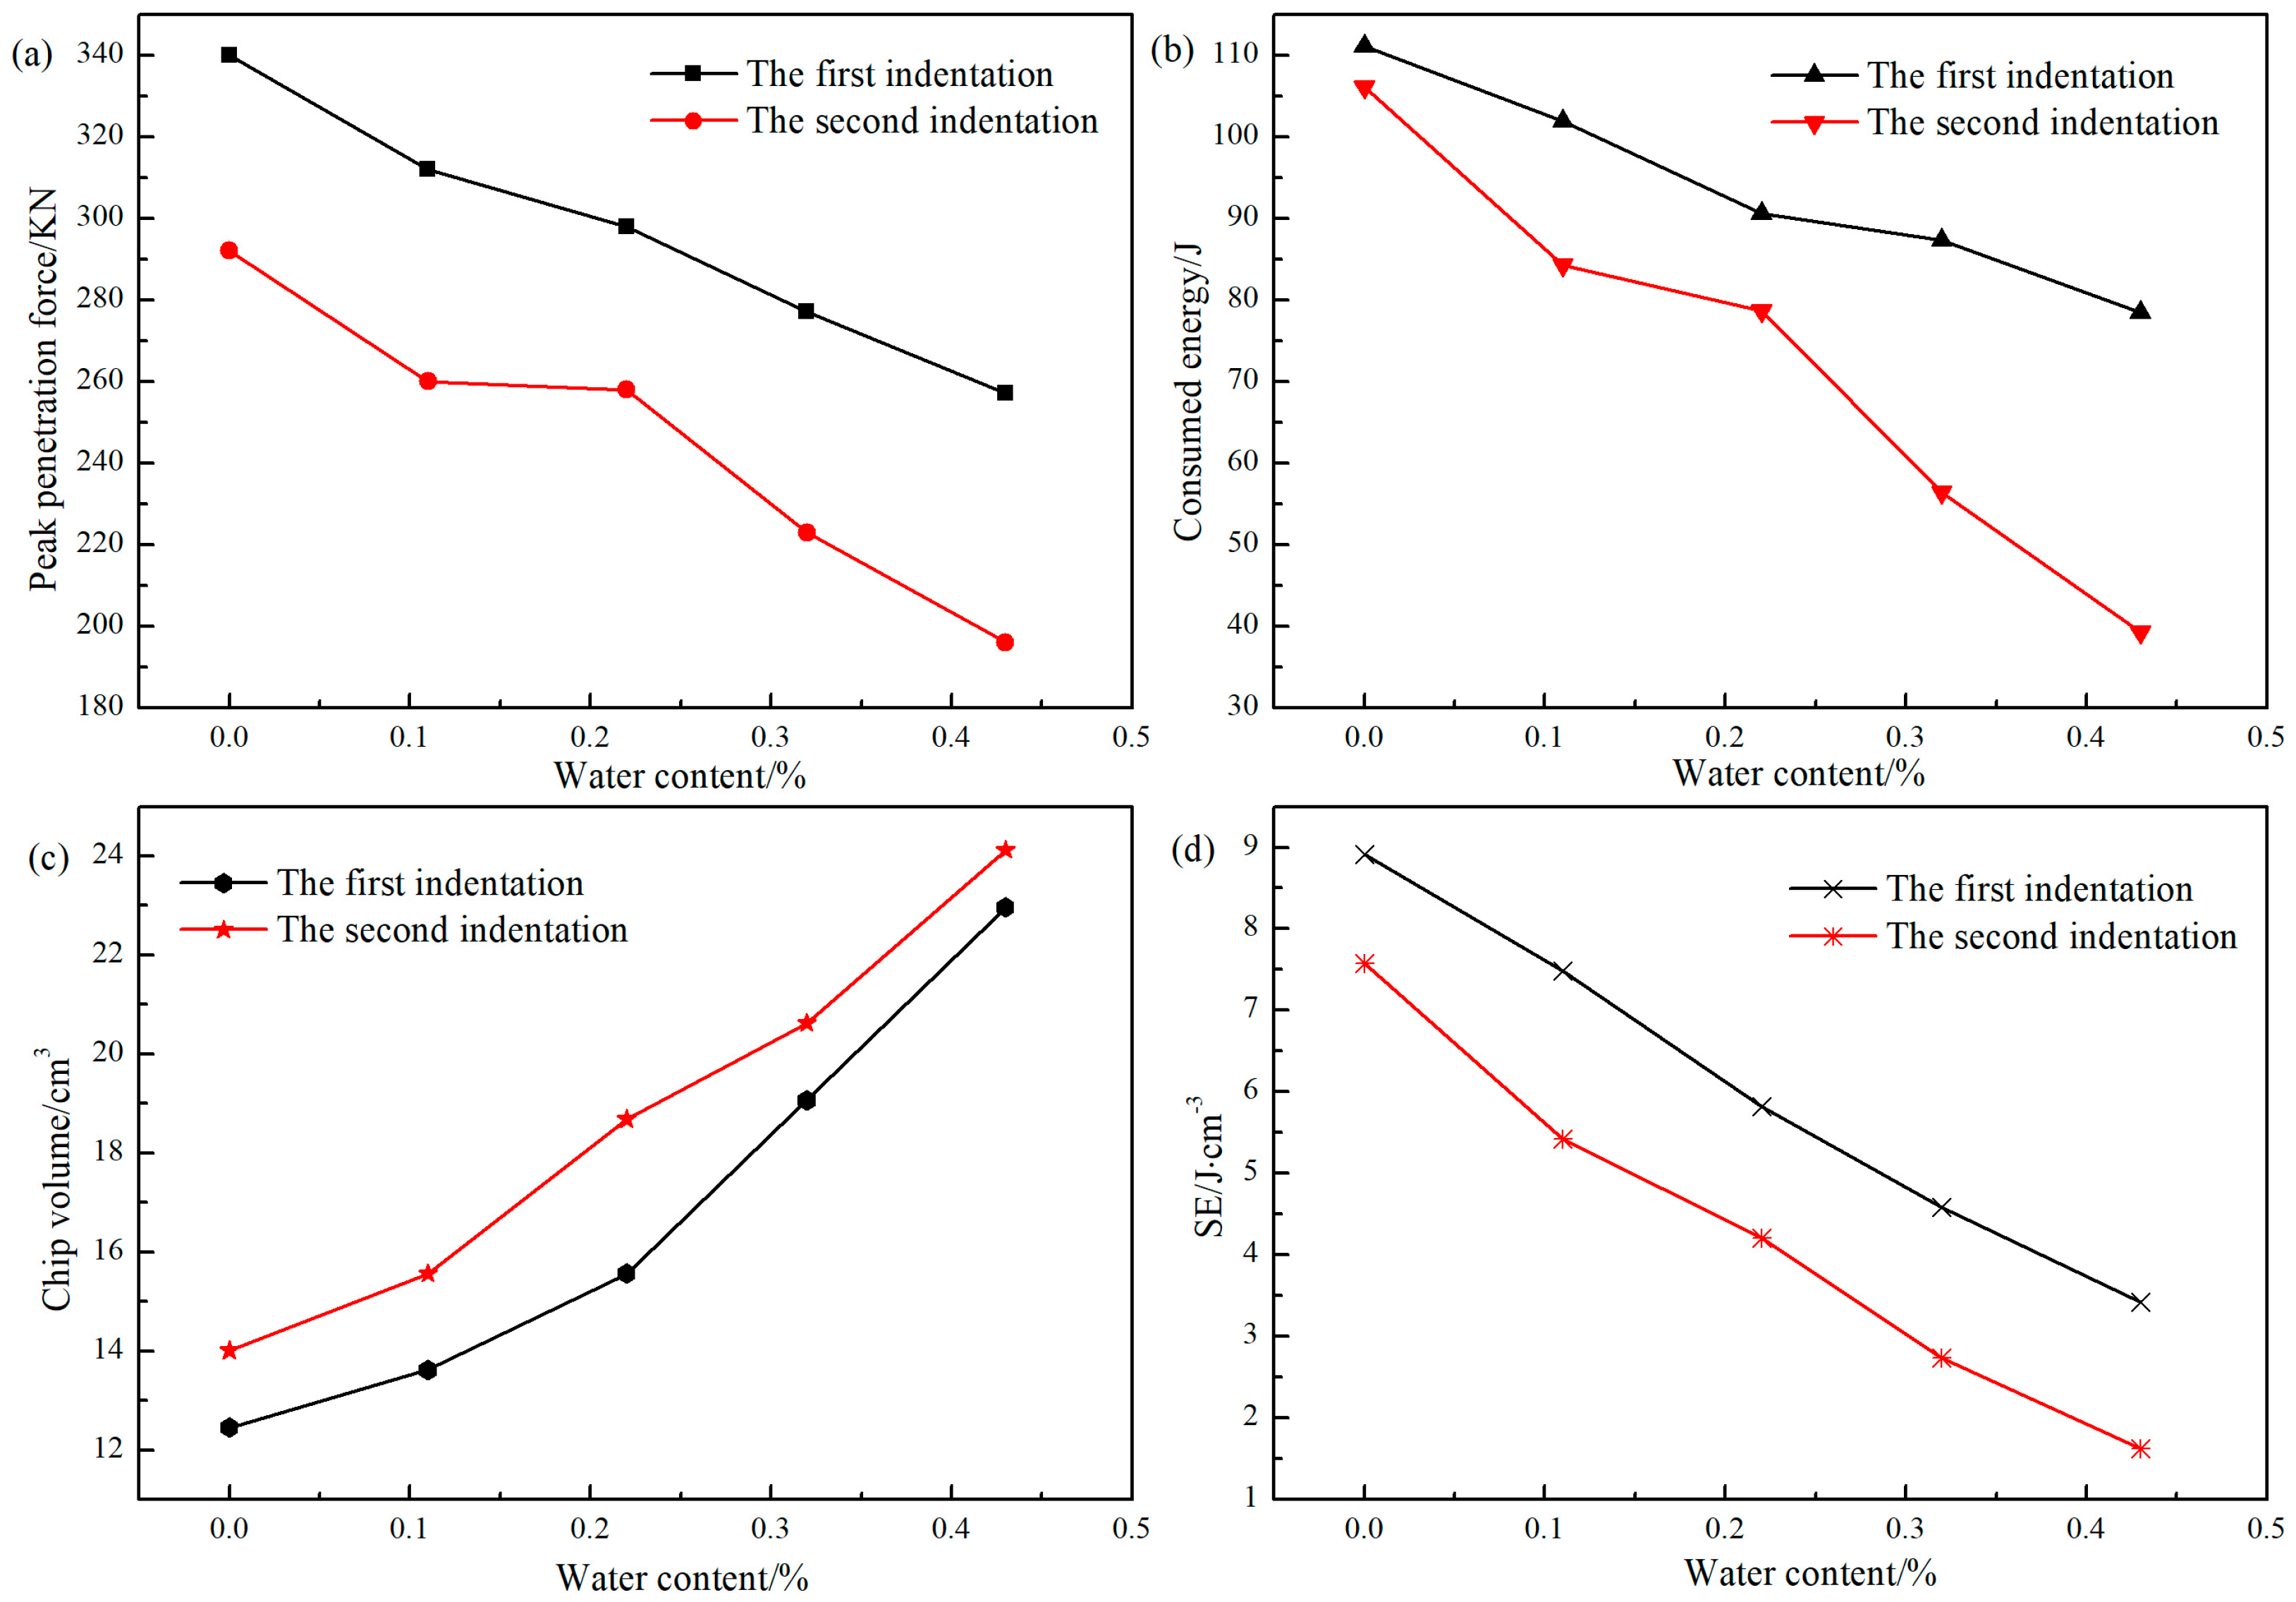
3.3. Effect of Water Content on Peak Penetration Force

As shown in Figure 12a, when the water content was 0, the peak penetration force was 340 kN during the first indentation into the granite specimen. As the water content increased, the peak penetration force decreased gradually. When the water content increased to 0.11%, the corresponding peak penetration force was 312 kN. Under other water content conditions, the peak penetration forces in the first indentation process also showed a decreasing trend. When the water content increased to 0.43%, the peak penetration force was only 257 kN. In the second indentation process, the variation trend of the peak penetration force with the water content was similar to that of the peak penetration force in the first indentation process. When the water content was 0, the corresponding peak penetration force was 292 kN, and when the water content was increased to 0.43%, the peak penetration force was only 196 kN. At the same time, it can be seen from Figure 6 that under the same water content conditions, the peak penetration force in the second indentation was smaller than that in the first indentation. For example, when the water content was 0, the peak penetration force in the first indentation was 340 kN; when the water content was 0.43%, the peak penetration force in the second indentation was only 200 kN. As the water content gradually increased, the peak penetration force gradually decreased. This was because the water content increase reduced the fracture toughness and the strength of the rock, making the rock more susceptible to breakage.

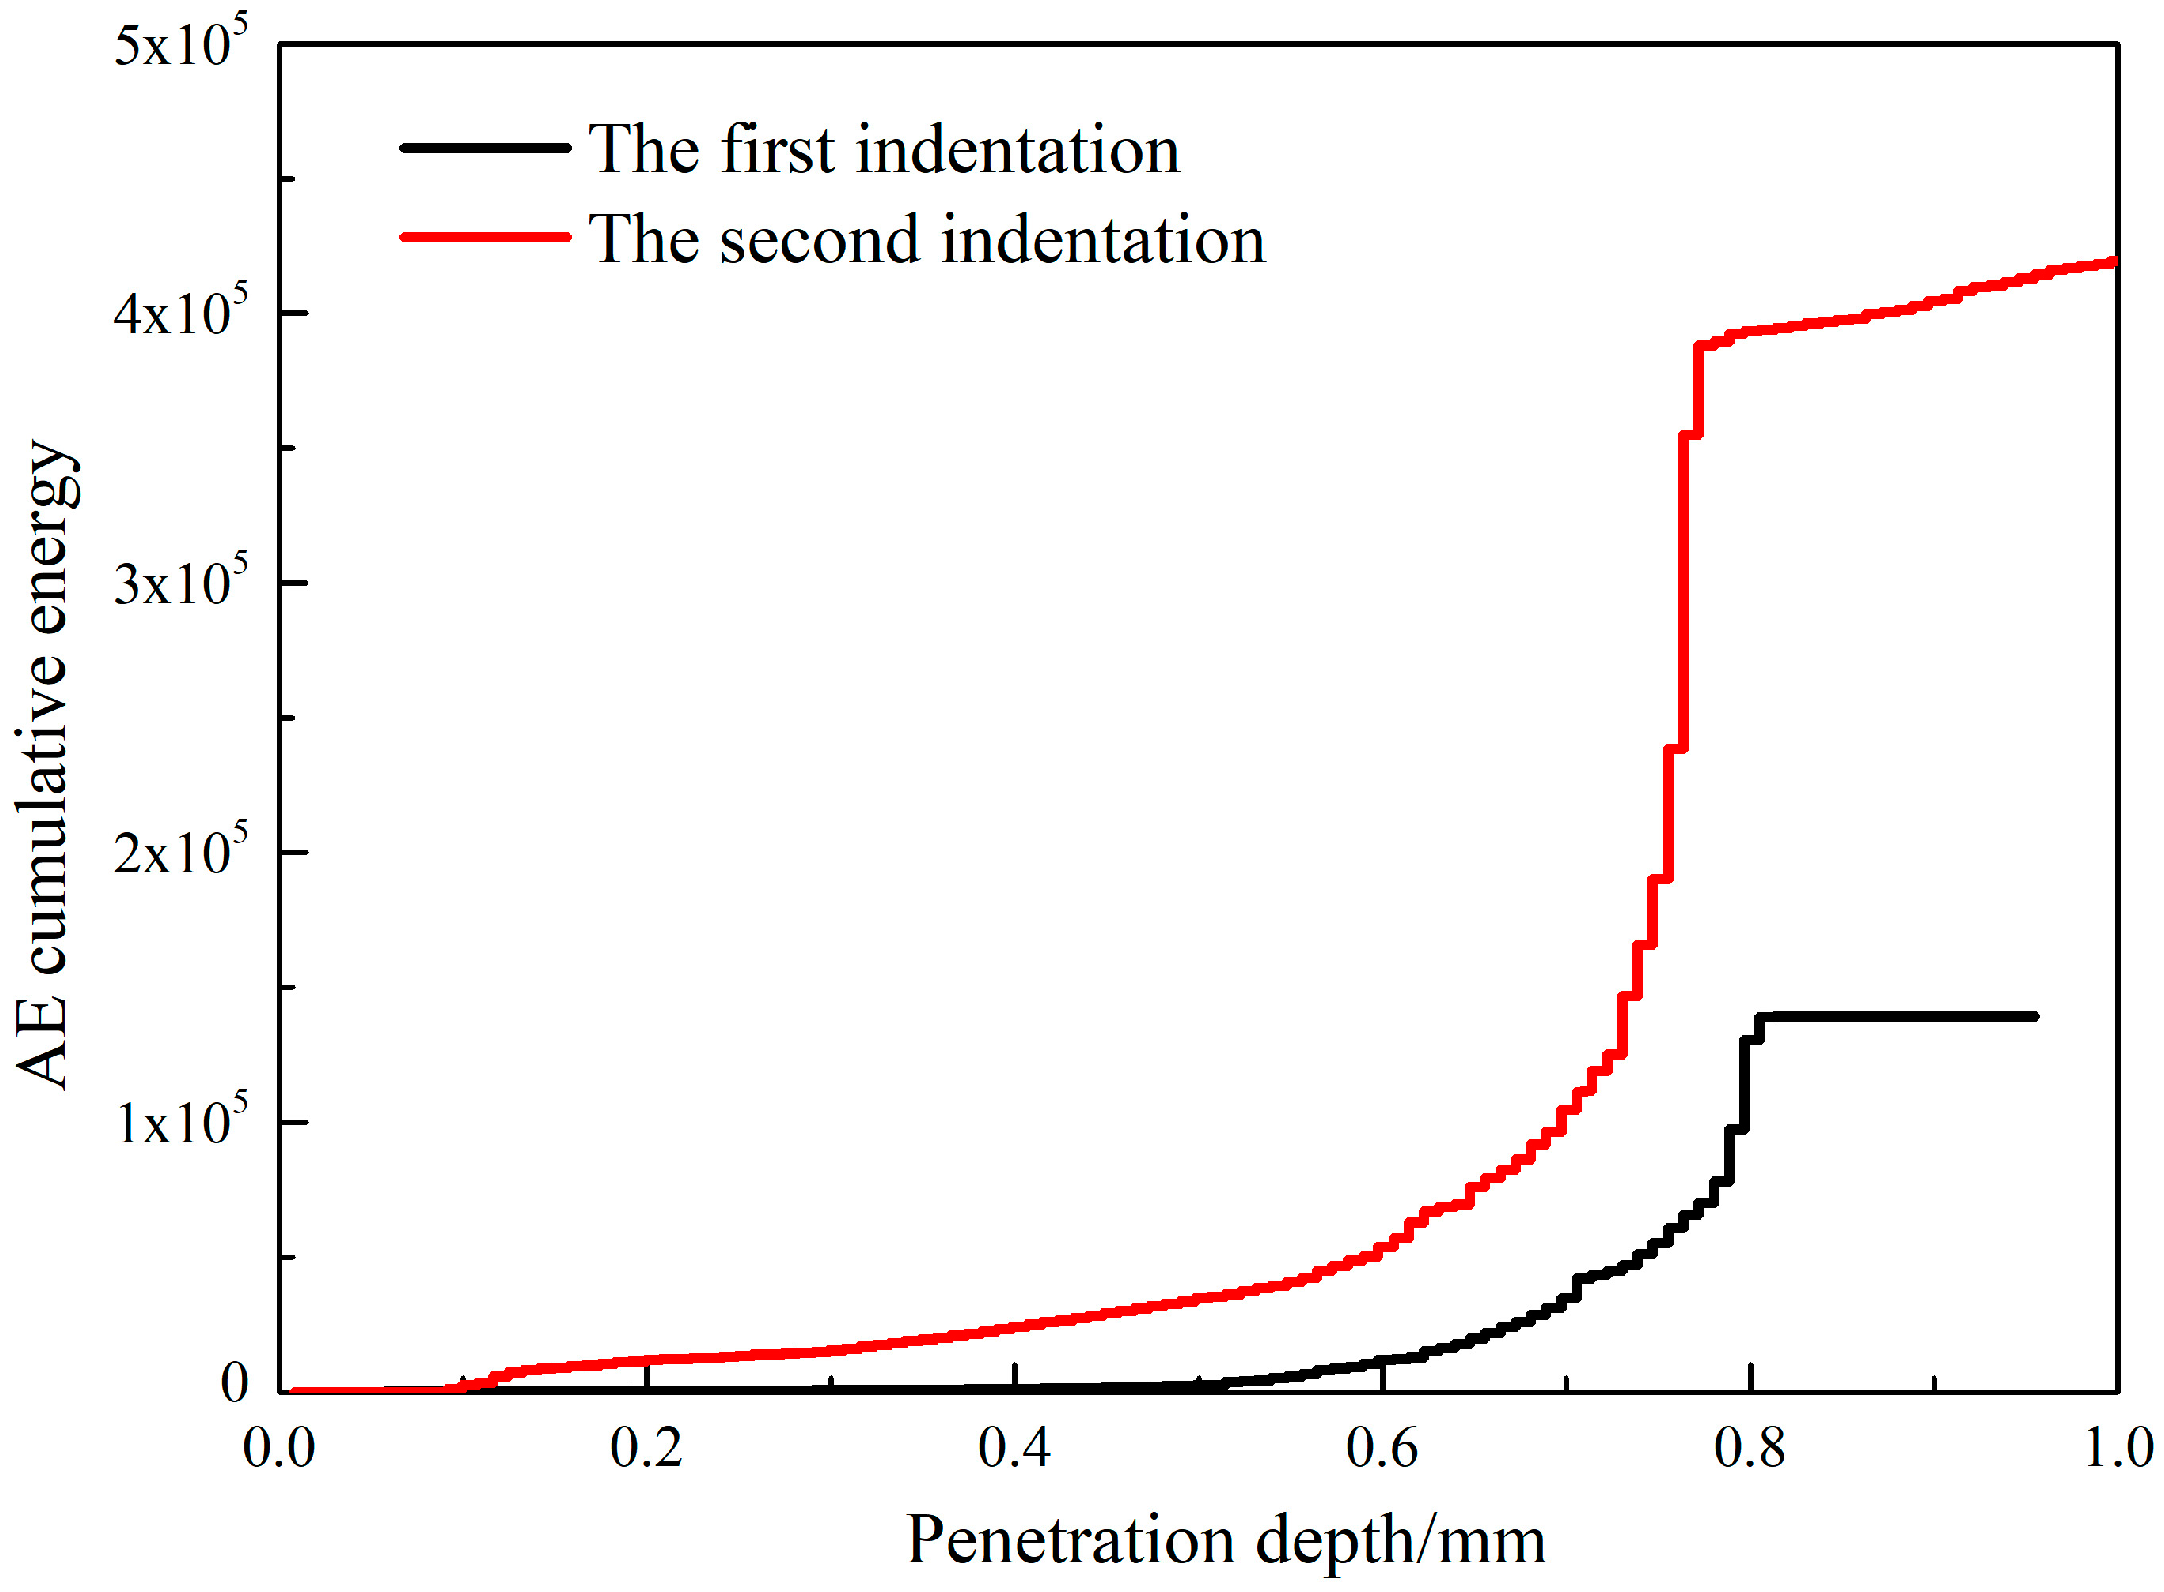
3.4. Effect of Water Content on Consumed Energy

As the rapid drop of the penetration force must be related to the propagation of the main crack, it is necessary to establish the relationship between the energy release and the crack propagation. The consumed energy is introduced here, which, in the physical sense, is the energy consumed by the crack propagation and is calculated as follows:
W = F ( u ) d u i = 1 n F i Δ u i
where Fi is the indentation load of the ith step, and ui is the penetration depth of ith step.
The variation of the consumed energy with the water content as the cutter penetrated the granite specimen is shown in Figure 12b. As the water content increased, the consumed energy generally decreased. Through the comparison of the two indentations, it can be found that when the water content was 0, the energy required for the first indentation was 111.13 J and that required for the second indentation was 106.06 J. When the water content was increased to 0.43%, the required energy for the first indentation was 78.43 J and that required for the second indentation was only 39.26 J. This indicates that water can reduce the energy required to break a granite specimen, which is good for rock breakage. This phenomenon can be attributed to the softening effect of water on rocks, which reduces the effective stress in the rocks and weakens the reinforcing effect brought by the stress concentration in the rocks.

3.5. Effect of Water Content on Rock Chip Volume

The rock chip volume can directly reflect the quantity of the rocks broken by the cutter after indentation. By collecting the rock chips generated by the cutter after indentation, the mass of the rock chips can be weighed by an electronic scale, and the rock chip volume can be calculated according to the following formula:
V = m / ρ
where m is the mass of the rock chips (g), and ρ is the rock density (g/cm3).
It can be seen from Figure 12c that the higher the water content, the greater the volume of the rock chips and that the volume of the rock chips generated in the second indentation is always greater than that generated in the first indentation. The main reason is that when the cutter is sequentially loaded, the specimen shows cracks to different extents inside and on the surface in the first indentation, and a second indentation at this time can facilitate the coalescence of the cracks.

3.6. Effect of Water Content on Penetration Efficiency

Regarding the energy consumption and utilization during the rock breakage process of the cutter, the specific energy (SE) used in previous works was also adopted in this paper to evaluate the penetration efficiency [6,18,27,32]. Specific energy is defined as follows:
S E = W V
where W is the consumed energy that can be calculated by Equation (7), and V is the rock chip volume.
From the above formula, it can be found that the key indicators determining the specific energy are the consumed energy and the rock chip volume. Below is the analysis of the variation trend of the specific energy with the water content based on the aforementioned analysis of the consumed energy and rock chip volume. The trend of the specific energy was analyzed based on the water content. As shown in Figure 12d, when the water content was 0, the specific energy decreased from 8.92 in the first indentation to 7.57 in the second indentation, for a total reduction of 15.13%. As the water content increased, the specific energy was generally on a decreasing trend. When the water content was increased to 0.43%, the specific energy was only 3.42 in the first indentation and 1.63 in the second indentation, which were significantly lower than the corresponding values in the dry state. As the water content increased, the specific energy generally decreased. When the water content remained the same, the specific energy in the second indentation was always smaller than that in the first indentation. In other words, judging from the specific energy, which was used as the indicator to measure the penetration efficiency, the granite specimen with water content could be more easily broken. This indicates that the water content of rocks is a factor affecting the penetration efficiency of the cutter. The increase in the water content causes the rock breakage load of the cutter to decrease and promotes the propagation of rock cracks. The corresponding volume of rocks broken also increased, indicating that as the water content increases, rocks are more easily broken.

4. Conclusions

Based on a modified experimental platform, a series of laboratory tests under different water content conditions were performed, and at the same time, the acoustic emission phenomenon during the rock breakage process was monitored. Moreover, the effects of the water content on the penetration force, AE events, crack development, rock chip form, and penetration efficiency were investigated. The following conclusions were obtained.
(1)
Acoustic emission events are associated with the whole indentation process of granite with different water content conditions. This phenomenon was most obvious at the time when the penetration force reached the peak and was consistent with the force–penetration depth curve. The average number of AE events in the wet specimens was smaller than that in the dry specimens.
(2)
The relationship between the formation of rock chips between surface cracks and internal cracks was studied, and the results showed that the increase in the water content facilitated the development of surface cracks between the grooves, thus resulting in larger rock chips.
(3)
The increase in the water content can reduce the strength of the rock and the energy required to break the rock. Thus, the rock can be more easily broken, increasing the penetration efficiency of the cutter. This indicates that water content is one of the most important factors affecting the rock breakage performance of the cutter. This research studies the effects of different water contents on the rock breakage features of the cutter, which has certain practical value in the field of engineering.
This paper only explores the granite rock breakage process using a disc cutter under different water content conditions. However, in the actual excavation process, tunnels will cross strata with very complex geological conditions. How to improve the efficiency of penetration into different types of rocks containing different water conditions still remains to be further studied.

Author Contributions

Q.L., P.C., and R.C. conceived and designed the experiments; Q.L. and R.C. performed the experiments; Q.L. and W.F analyzed the data; P.C. contributed laboratory equipment; Q.L. and R.C. wrote the paper.

Funding

This research was funded by the National Natural Science Foundation of China (grant numbers 51174228, 11772358), the National Basic Research Program of China (grant number 2013CB035401), the Open Fund of Key Laboratory of Road Structure and Material of Ministry of Transport (Changsha University of Science & Technology) (grant number kfj170305, kfj170603) and the Fundamental Research Funds for the Central Universities, China (grant number 2018zzts211). The authors are also very grateful to the anonymous reviewers for their valuable comments that have significantly improved the paper.

Conflicts of Interest

The authors declare no conflict of interest.

References

  1. Acaroglu, O.; Ozdemir, L.; Asbury, B. A fuzzy logic model to predict specific energy requirement for TBM performance prediction. Tunn. Undergr. Space Technol. 2008, 23, 600–608. [Google Scholar] [CrossRef]
  2. Cho, J.W.; Jeon, S.; Yu, S.H.; Chang, S.H. Optimum spacing of TBM disc cutters: A numerical simulation using the three-dimensional dynamic fracturing method. Tunn. Undergr. Space Technol. 2010, 25, 230–244. [Google Scholar] [CrossRef]
  3. Shahriar, K.; Sharifzadeh, M.; Hamidi, J.K. Geotechnical risk assessment based approach for rock TBM selection in difficult ground conditions. Tunn. Undergr. Space Technol. 2008, 23, 318–325. [Google Scholar] [CrossRef]
  4. Gong, Q.M.; Yin, L.J.; Wu, S.Y.; Zhao, J.; Ting, Y. Rock burst and slabbing failure and its influence on TBM excavation at headrace tunnels in Jinping II hydropower station. Eng. Geol. 2012, 124, 98–108. [Google Scholar] [CrossRef]
  5. Wenner, D.; Wannenmacher, H. Alborz Service Tunnel in Iran: TBM Tunnelling in Difficult Ground Conditions and its Solutions. In Proceedings of the 1st Regional and 8th Iranian Tunneling Conference, Tehran, Iran, 19–21 May 2009. [Google Scholar]
  6. Gertsch, R.; Gertsch, L.; Rostami, J. Disc cutting tests in colorado red granite: Implications for TBM performance prediction. Int. J. Rock Mech. Min. Sci. 2007, 44, 238–246. [Google Scholar] [CrossRef]
  7. Bruland, A. Hard Rock Tunnel Boring. Ph.D. Thesis, Norwegian University of Science and Technology, Trondheim, Norway, 2000. [Google Scholar]
  8. Rostami, J. Study of pressure distribution within the crushed zone in the contact area between rock and disc cutters. Int. J. Rock Mech. Min. Sci. 2013, 57, 172–186. [Google Scholar] [CrossRef]
  9. Macias, F.J. Hard Rock Tunnel Boring, Performance Predictions and Cutter Life Assessments. Ph.D. Thesis, Norwegian University of Science and Technology, Trondheim, Norway, 2016. [Google Scholar]
  10. Cook, N.G.W.; Hood, M.; Tsai, F. Observations of crack growth in hard rock loaded by an indenter. Int. J. Rock Mech. Min. Sci. 1984, 21, 97–107. [Google Scholar] [CrossRef]
  11. Lindqvist, P.A.; Lai, H.H.; Alm, O. Indentation fracture development in rock continuously observed with a scanning electron microscope. Int. J. Rock Mech. Min. Sci. 1984, 21, 165–182. [Google Scholar] [CrossRef]
  12. Chen, L.H.; Labuz, J.F. Indentation of rock by wedge-shaped tools. Int. J. Rock Mech. Min. Sci. 2006, 43, 1023–1033. [Google Scholar] [CrossRef]
  13. Lin, Q.B.; Cao, P.; Li, K.H.; Cao, R.H.; Zhou, K.P.; Deng, H.W. Experimental study on acoustic emission characteristics of jointed rock mass by double disc cutter. J. Cent. South Univ. 2018, 25, 357–367. [Google Scholar] [CrossRef]
  14. Liu, J.; Chen, Y.; Wan, W.; Wang, J.; Fan, X. The influence of bedding plane orientation on rock breakages in biaxial states. Theor. Appl. Fract. Mech. 2018, 95, 186–193. [Google Scholar] [CrossRef]
  15. Liu, J.; Wang, J.; Wan, W. Numerical study of crack propagation in an indented rock specimen. Comput. Geotech. 2018, 96, 1–11. [Google Scholar] [CrossRef]
  16. Liu, H.Y.; Kou, S.Q.; Lindqvist, P.A.; Tang, C.A. Numerical simulation of the rock fragmentation process induced by indenters. Int. J. Rock Mech. Min. Sci. 2002, 39, 491–505. [Google Scholar] [CrossRef]
  17. Innaurato, N.; Oggeri, C.; Oreste, P.P.; Vinai, R. Experimental and numerical studies on rock breaking with TBM tools under high stress confinement. Rock Mech. Rock Eng. 2007, 40, 429–451. [Google Scholar] [CrossRef]
  18. Bejari, H.; Hamidi, J.K. Simultaneous effects of joint spacing and orientation on TBM cutting efficiency in jointed rock masses. Rock Mech. Rock Eng. 2013, 46, 897–907. [Google Scholar] [CrossRef]
  19. Lin, Q.B.; Cao, P.; Cao, R.H. Experimental investigation of jointed rock breaking under a disc cutter with different confining stresses. C. R. Mec. 2018, 346, 833–843. [Google Scholar] [CrossRef]
  20. Wong, L.N.Y.; Maruvanchery, V.; Liu, G. Water effects on rock strength and stiffness degradation. Acta Geotech. 2016, 11, 713–737. [Google Scholar] [CrossRef]
  21. Vásárhelyi, B.; Ván, P. Influence of water content on the strength of rock. Eng. Geol. 2006, 84, 70–74. [Google Scholar] [CrossRef]
  22. Fan, X.; Lin, H.; Lai, H.P.; Cao, R.H.; Liu, J. Numerical analysis of the compressive and shear failure behavior of rock containing multi-intermittent joints. C. R. Mec. 2018. [Google Scholar] [CrossRef]
  23. Wang, H.; Lin, H.; Cao, P. Correlation of UCS rating with Schmidt hammer surface hardness for rock mass classification. Rock Mech. Rock Eng. 2017, 50, 195–203. [Google Scholar] [CrossRef]
  24. Chen, B.; Liu, J. Damage in carbon fiber-reinforced concrete, monitored by both electrical resistance measurement and acoustic emission analysis. Constr. Build. Mater. 2008, 22, 2196–2201. [Google Scholar] [CrossRef]
  25. Niccolini, G.; Borla, O.; Accornero, F.; Lacidogna, G.; Carpinteri, A. Scaling in damage by electrical resistance measurements: An application to the terracotta statues of the sacred mountain of varallo renaissance complex (italy). Rend. Lincei 2015, 26, 203–209. [Google Scholar] [CrossRef]
  26. Iturrioz, I.; Lacidogna, G.; Carpinteri, A. Acoustic emission detection in concrete specimens: Experimental analysis and simulations by a lattice model. Int. J. Damage Mech. 2013, 23, 327–358. [Google Scholar] [CrossRef]
  27. Yin, L.J.; Gong, Q.M.; Ma, H.S.; Zhao, J.; Zhao, X.B. Use of indentation tests to study the influence of confining stress on rock fragmentation by a TBM cutter. Int. J. Rock Mech. Min. Sci. 2014, 72, 261–276. [Google Scholar] [CrossRef]
  28. Liu, J.; Cao, P.; Han, D.Y. The influence of confining stress on optimum spacing of TBM cutters for cutting granite. Int. J. Rock Mech. Min. Sci. 2016, 88, 165–174. [Google Scholar] [CrossRef]
  29. Liu, J.; Cao, P.; Han, D.Y. Sequential indentation tests to investigate the influence of confining stress on rock breakage by tunnel boring machine cutter in a biaxial state. Rock Mech. Rock Eng. 2016, 49, 1479–1495. [Google Scholar] [CrossRef]
  30. Alehossein, H.; Detournay, E.; Huang, H. An analytical model for the indentation of rocks by blunt tools. Rock Mech. Rock Eng. 2000, 33, 267–284. [Google Scholar] [CrossRef]
  31. Lebedkina, T.A.; Zhemchuzhnikova, D.A.; Lebyodkin, M.A. Correlation versus randomization of jerky flow in an almgsczr alloy using acoustic emission. Phys. Rev. 2018, 97, 013001. [Google Scholar] [CrossRef]
  32. Cho, J.W.; Jeon, S.; Jeong, H.Y.; Chang, S.H. Evaluation of cutting efficiency during TBM disc cutter excavation within a Korean granitic rock using linear-cutting-machine testing and photogrammetric measurement. Tunn. Undergr. Space Technol. 2013, 35, 37–54. [Google Scholar] [CrossRef]
Figure 1. The saturation process.
Applsci 09 00194 g001
Figure 2. Rock loading system and acoustic emission (AE) monitoring system for the rock indentation test. TBM: tunnel boring machine.
Applsci 09 00194 g002
Figure 3. Sketch of the TBM indentation cutter: (a) a photograph of the cutter; (b) geometric parameters of the cutter (unit: mm).
Applsci 09 00194 g003
Figure 4. Schematic diagram of indentation test.
Applsci 09 00194 g004
Figure 5. Typical penetration forces and AE events (red represents the first indentation process, green represents the second indentation process).
Applsci 09 00194 g005
Figure 6. Penetration forces and AE events with different water contents: (a) 0.11%; (b) 0.22%; (c) 0.32%; and (d) 0.43%. One is the first indentation process; and two is the second indentation process.
Applsci 09 00194 g006aApplsci 09 00194 g006b
Figure 7. Typical AE cumulative energy–penetration depth curve.
Applsci 09 00194 g007
Figure 8. The distribution of AE amplitude in a range of 40–100 dB: (a) the first indentation process, (b) the second indentation process.
Applsci 09 00194 g008
Figure 9. Typical fracture conditions. (a) fracture condition; (b) typical plastic zones; (c) crushed zone; (d) intact rock mass.
Applsci 09 00194 g009
Figure 10. Typical surface cracks.
Applsci 09 00194 g010
Figure 11. Surface crack distributions of the granite specimens at different water contents: (a) 0; (b) 0.11%; (c) 0.22%; (d) 0.32%; and (e) 0.43%.
Applsci 09 00194 g011
Figure 12. Characteristics of rock breaking with different water contents: (a) peak penetration force, (b) consumed energy, (c) chip volume, (d) specific energy.
Applsci 09 00194 g012
Table 1. Main mechanical parameters of the granite specimens.
Density (g·cm−3)Water Content (%)Compressive Strength (MPa)Tensile Strength (MPa)Elastic Modulus (GPa)Friction Angle (°)Poisson Ratio
2.970105.18.420.149.50.21
0.1196.67.618.545.20.23
0.2292.96.917.741.10.26
0.3281.96.015.738.20.24
0.4376.15.114.535.60.22

