Comparison between OCl−-Injection and In Situ Electrochlorination in the Formation of Chlorate and Perchlorate in Seawater

 ,
,
Abstract
:1. Introduction
2. Materials and Methods
2.1. Materials
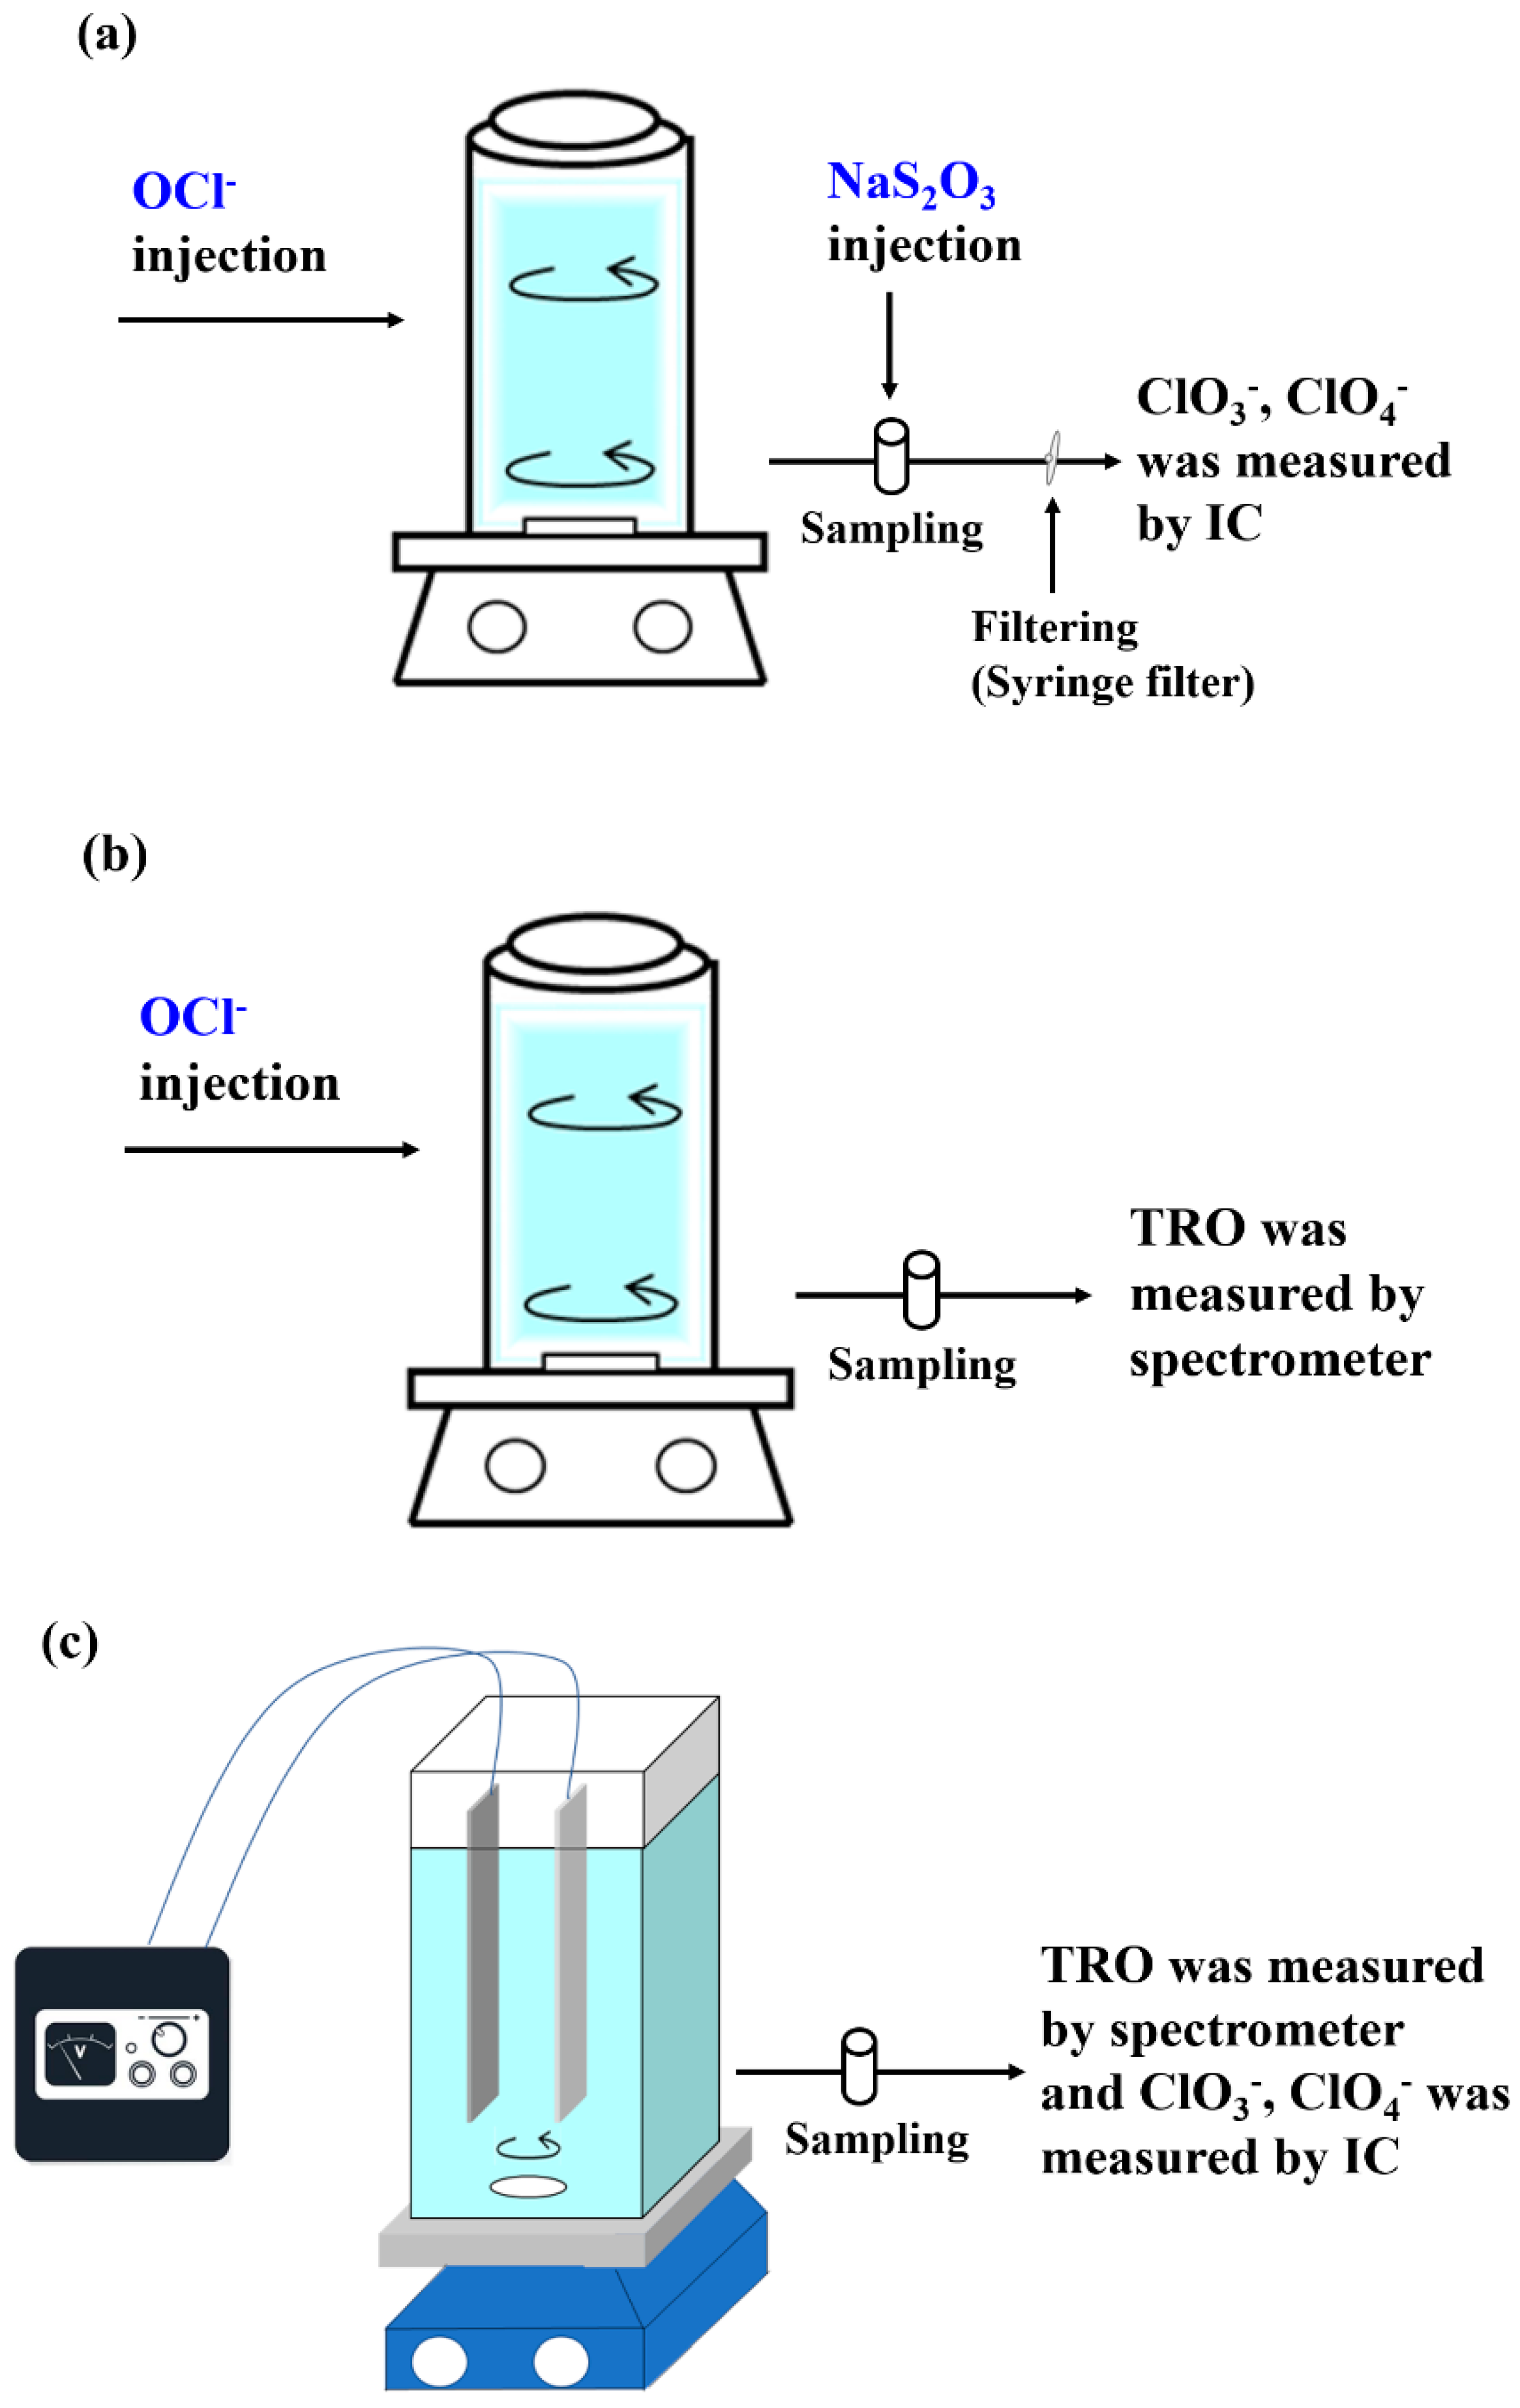
2.2. Experimental Procedure
2.3. Analysis Methods
3. Results and Discussion
3.1. Total Residual Oxidant in Direct OCl−-Injection and Electrolysis
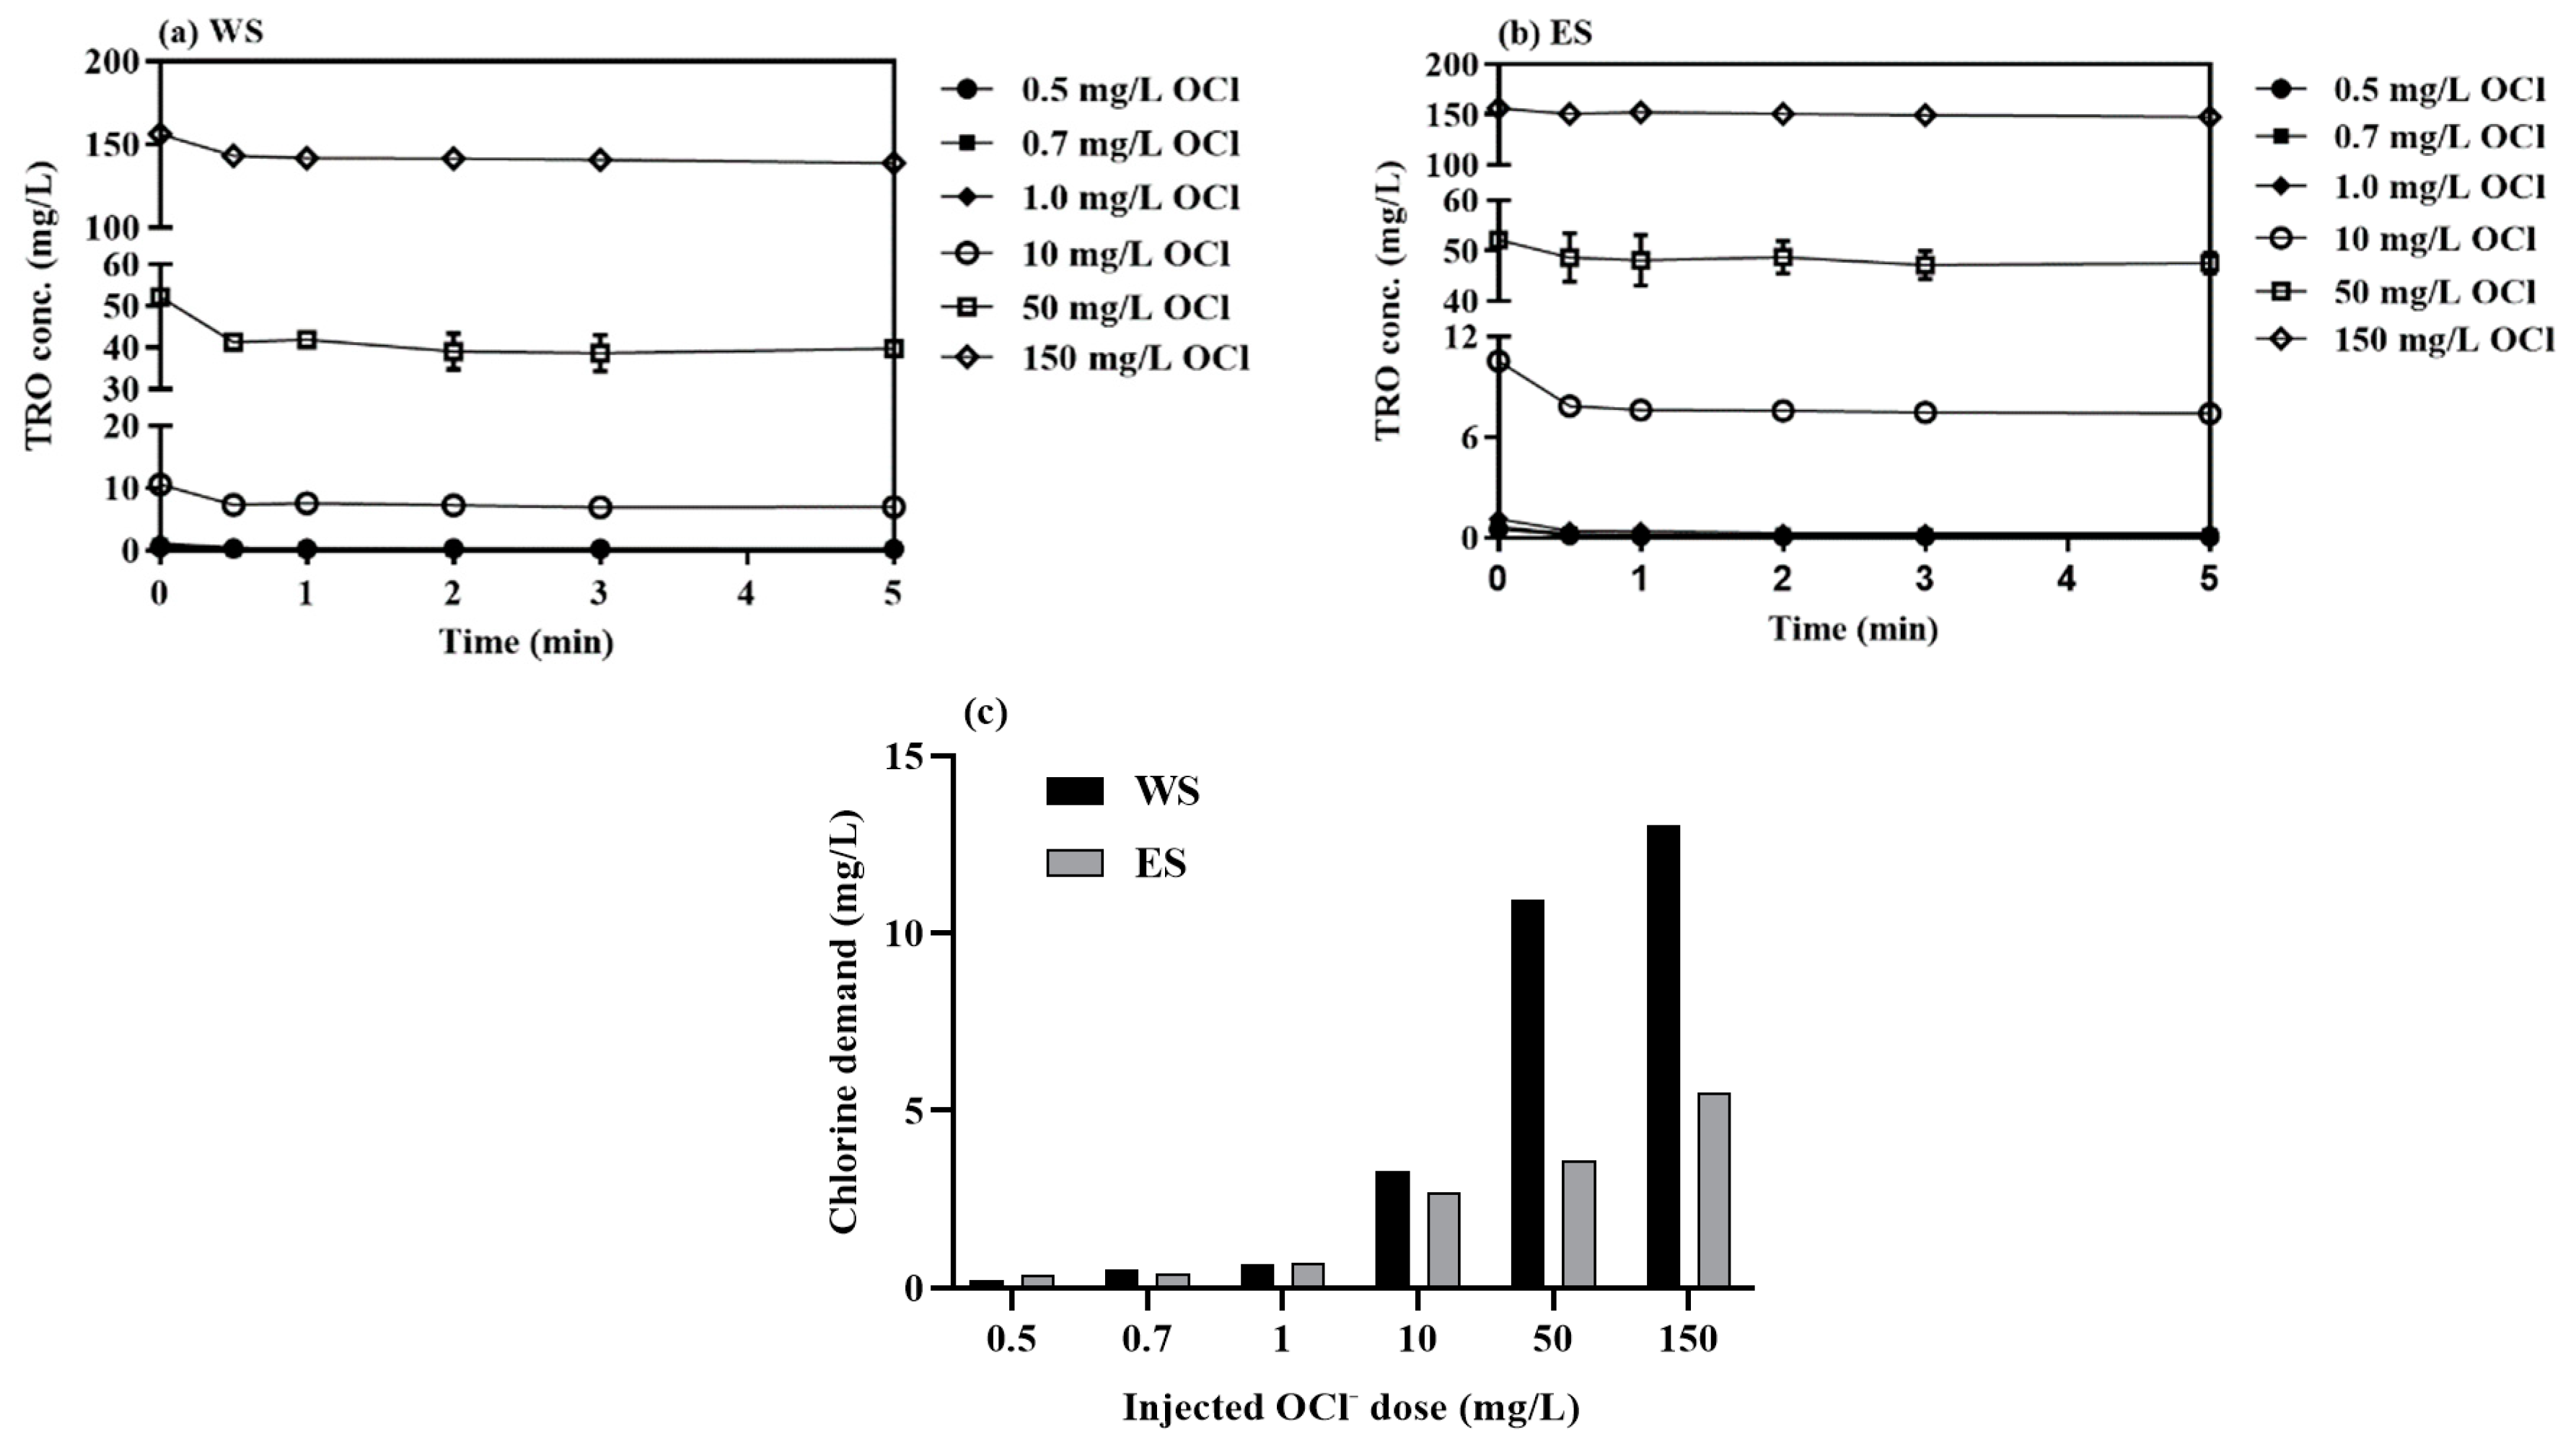
3.1.1. Direct OCl−-Injection
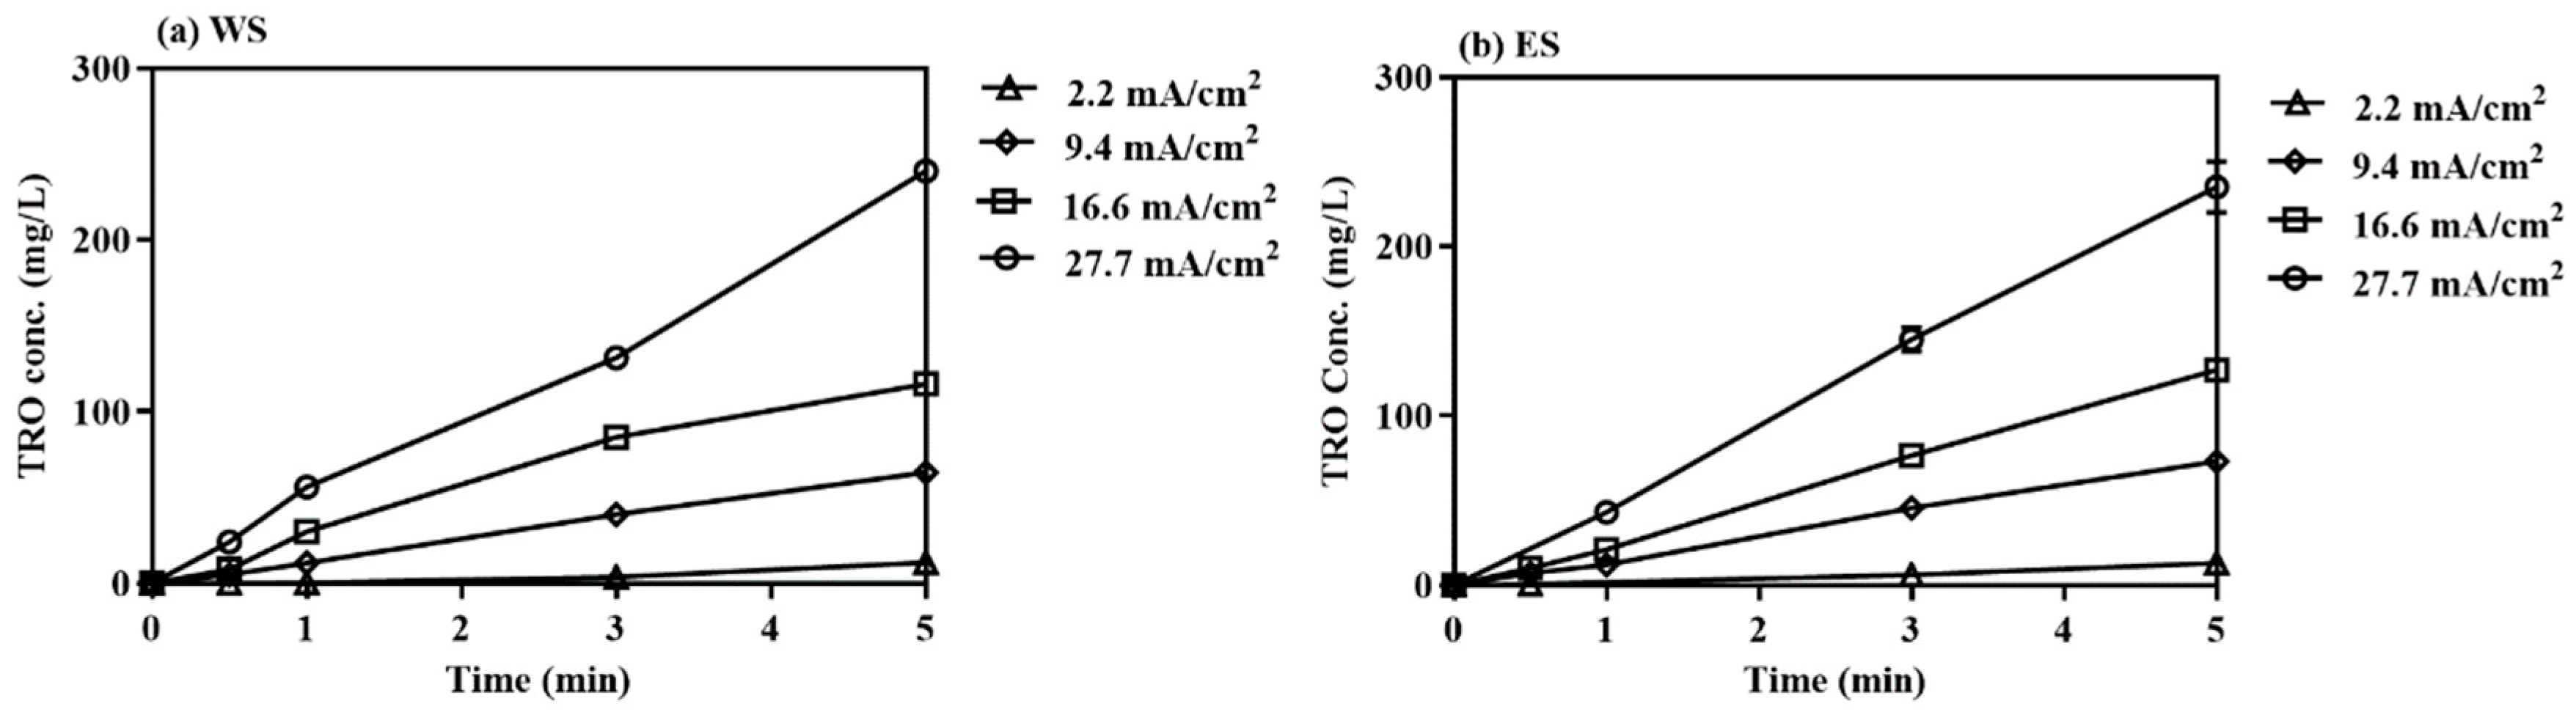
3.1.2. Effects of Current Density during Electrolysis
3.2. Formation of ClO3− and ClO4− in Electrolysis and Direct OCl−-Injection
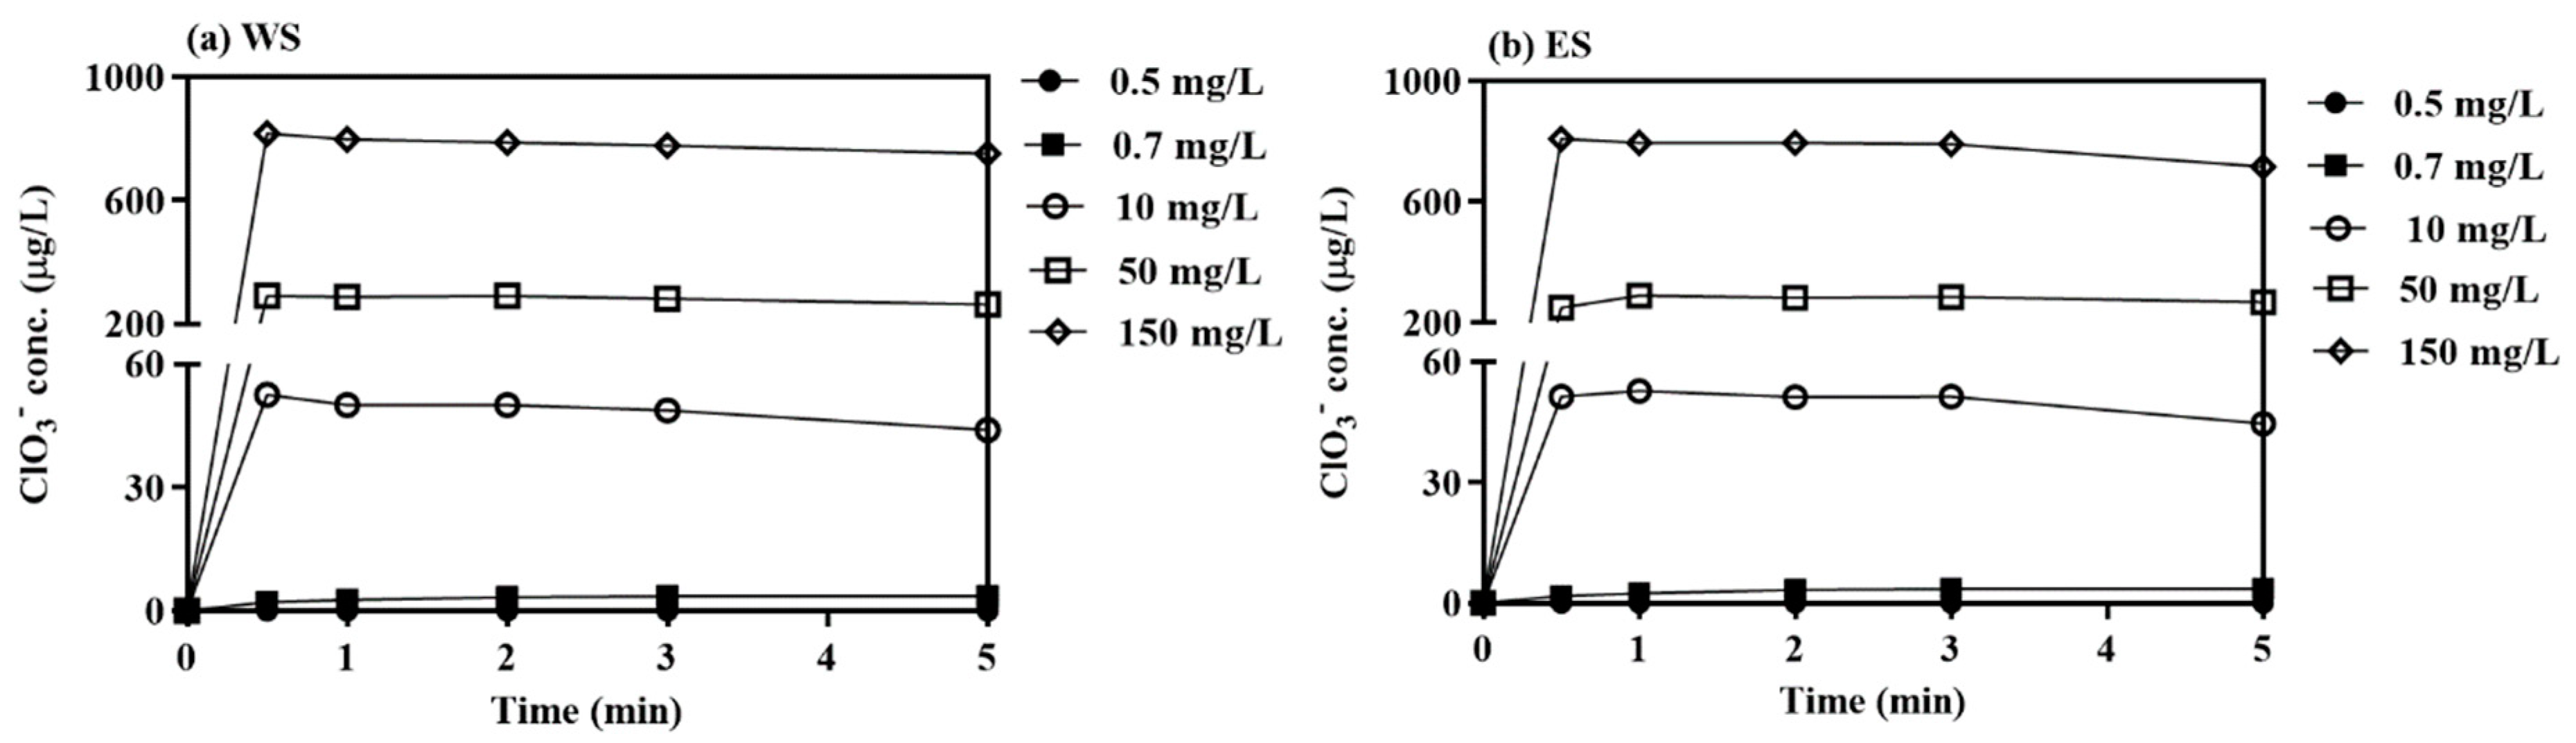
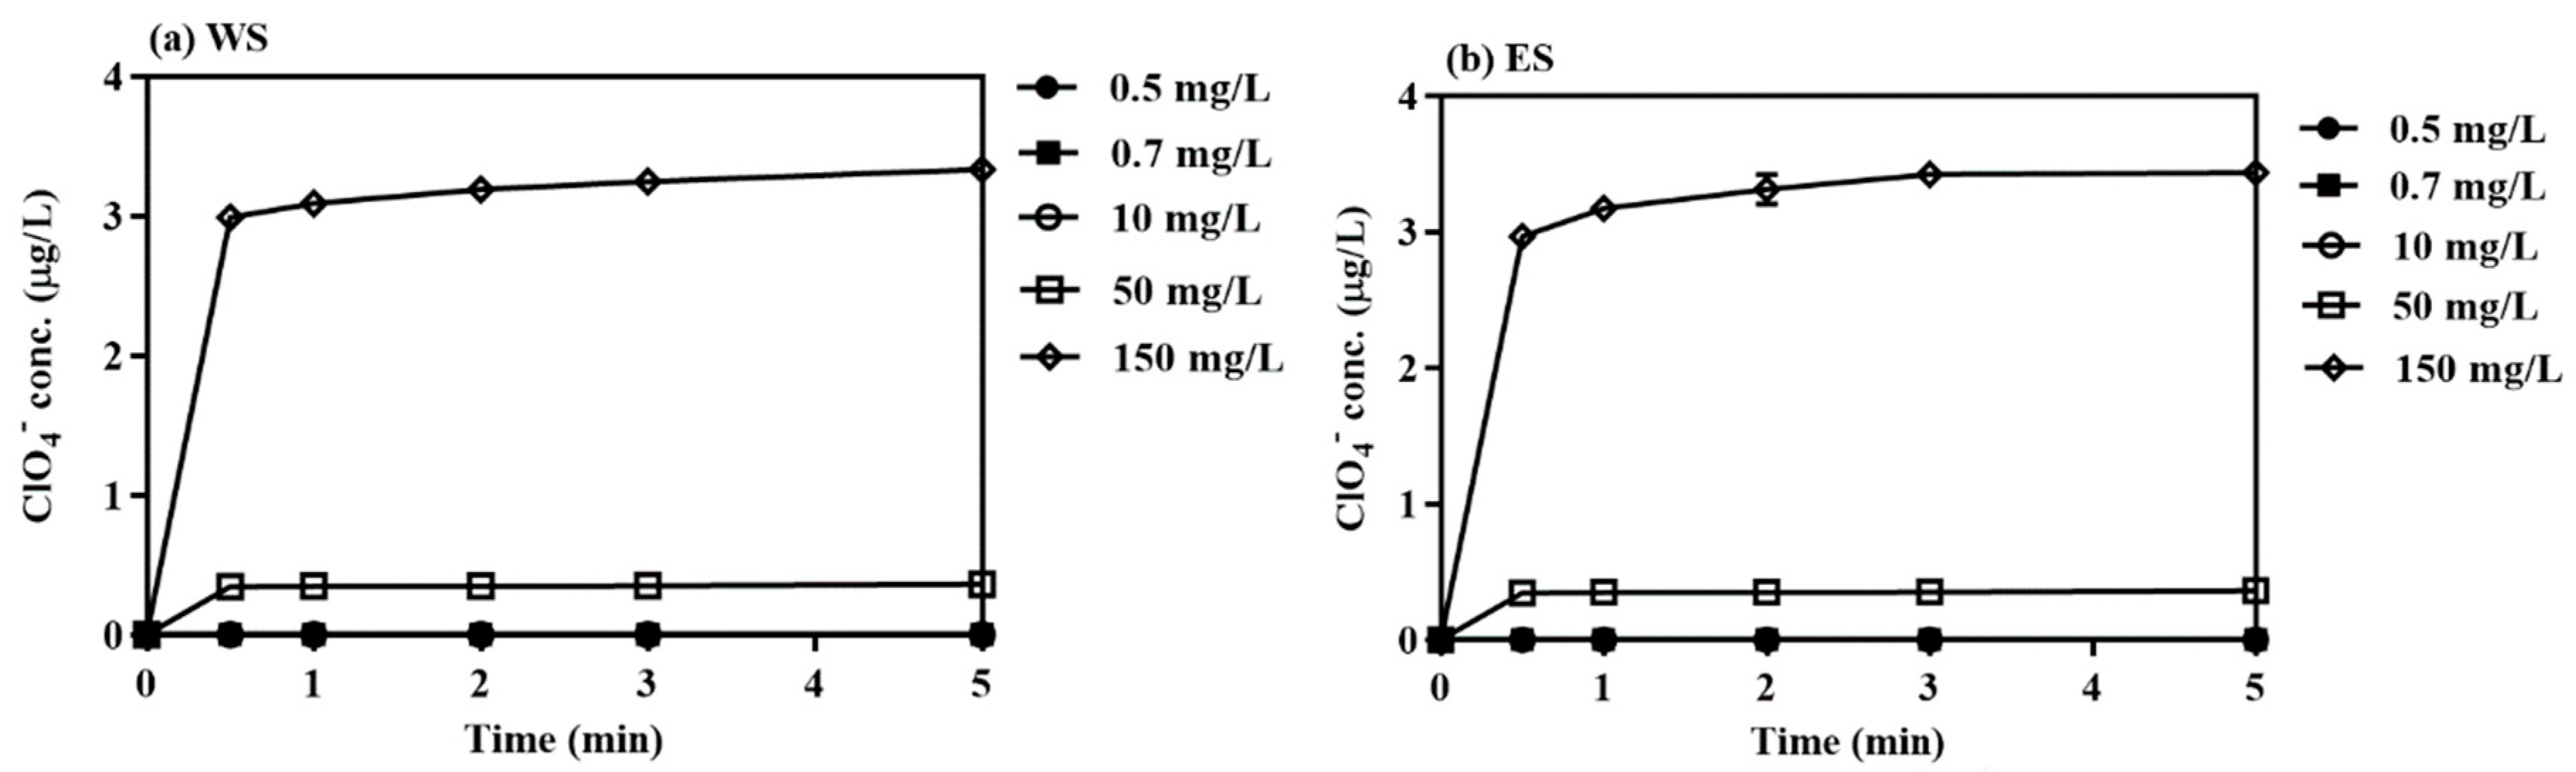
3.2.1. Direct OCl−-Injection
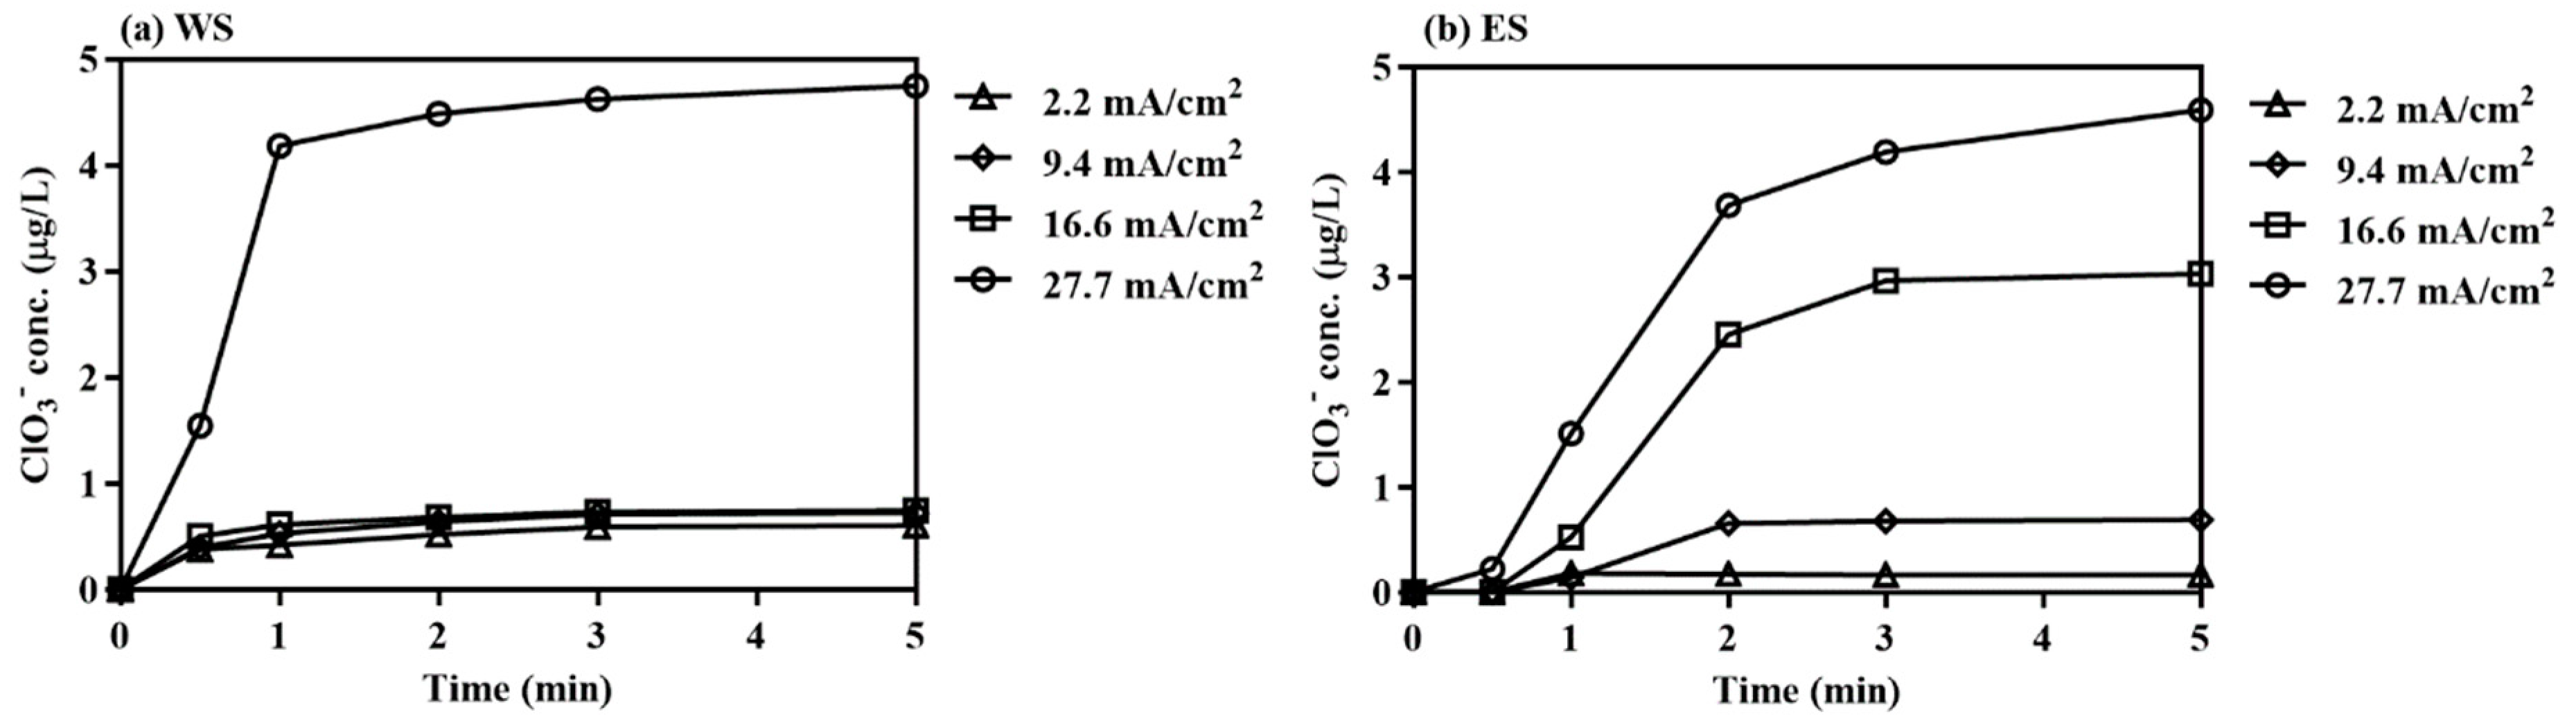
3.2.2. Electrochlorination
4. Conclusions
Supplementary Materials
Author Contributions
Acknowledgments
Conflicts of Interest
References
- Pan, S.Y.; Snyder, S.W.; Packman, A.I.; Lin, Y.J.; Chiang, P.C. Cooling water use in thermoelectric power generation and its associated challenges for addressing water-energy nexus. Water-Energy Nexus 2018, 1, 26–41. [Google Scholar] [CrossRef]
- International Energy Agency (IEA). World Energy Outlook; OECD/IEA: Paris, France, 2016; p. 13. [Google Scholar]
- Pugh, S.J.; Hewitt, G.F.; Müller-Steinhagen, H. Fouling during the use of seawater as coolant—The development of a ‘User Guide’. In Proceedings of the Engineering Conferences International, Heat Exchanger Fouling and Cleaning: Fundamentals and Applications, Santa Fe, NM, USA, 18–22 May 2003. [Google Scholar]
- Satpathy, K.K.; Mohanty, A.K.; Sahu, G.; Biswas, S.; Prasad, M.V.R.; Slvanayagam, M. Biofouling and Its Control in Seawater Cooled Power Plant Cooling Water System—A Review. In Nuclear Power; Tsvetkov, P., Ed.; IntechOpen: London, UK, 2010. [Google Scholar]
- Nanny, M.A. Handbook of chlorination and alternative disinfectants. Fourth edition by George Clifford White. John Wiley and Sons, Inc.: New York, Chichester, Weinheim, Brisbane, Singapore, and Toronto. 1999. xxi + 1569 pp. $195.00. ISBN 0-471-29297-9. J. Am. Chem. Soc. 1999, 121, 8678–8679. [Google Scholar] [CrossRef]
- Masilamoni, G.; Jesudoss, K.S.; Nandakumar, K.; Satapathy, K.K.; Azariah, J.; Nair, K.V.K. Lethal and sub-lethal effects of chlorination on green mussel Perna viridis in the context of biofouling control in a power plant cooling water system. Mar. Environ. Res. 2002, 53, 65–76. [Google Scholar] [CrossRef]
- Russell, L.B. Modelling for cost-effectiveness analysis. Stat. Med. 1999, 18, 3235–3244. [Google Scholar] [CrossRef]
- White, G.C. Handbook of Chlorination and Alternative Disinfectants; John Wiley and Sons, Inc.: New York, NY, USA, 2009. [Google Scholar]
- Asokan, K.; Subramanian, K. Design of a tank electrolyser for in-situ generation of NaClO. In Proceedings of the World Congress on Engineering and Computer Science 2009, San Francisco, CA, USA, 20–22 October 2009. [Google Scholar]
- Berl, E. A new cathodic process for the production of H2O2. J. Electrochem. Soc. 1939, 76, 359–369. [Google Scholar] [CrossRef]
- Viswanathan, K.; Tilak, B.V. Chemical, electrochemical, and technological aspects of sodium chlorate manufacture. J. Electrochem. Soc. 1984, 131, 1551–1559. [Google Scholar] [CrossRef]
- Munichandraiah, N.; Sathyanarayana, S. Kinetics and mechanism of anodic oxidation of chlorate ion to perchlorate ion on lead dioxide electrodes. J. Appl. Electrochem. 1987, 17, 33–48. [Google Scholar] [CrossRef]
- Tasaka, A.; Tojo, T. Anodic oxidation mechanism of hypochlorite ion on platinum electrode in alkaline solution. J. Electrochem. Soc. 1985, 132, 1855–1859. [Google Scholar] [CrossRef]
- Allonier, A.-S.; Khalanski, M.; Camel, V.; Bermond, A. Characterization of chlorination by-products in cooling effluents of coastal nuclear power stations. Mar. Pollut. Bull. 1999, 31, 1232–1241. [Google Scholar] [CrossRef]
- Poornima, E.H.; Rajadurai, M.; Rao, T.S.; Anupkumar, B.; Rajamohan, R.; Narasimhan, S.V.; Rao, V.N.R.; Venugopalan, V.P. Impact of thermal discharge from a tropical coastal power plant on phytoplankton. J. Therm. Biol. 2005, 30, 307–316. [Google Scholar] [CrossRef]
- Nebot, E.; Casanueva, J.F.; Casanueva, T.; Fernández-Bastón, M.M.; Sales, D. In situ experimental study for the optimization of chlorine dosage in seawater cooling systems. Appl. Therm. Eng. 2006, 26, 1893–1900. [Google Scholar] [CrossRef]
- Kim, D.; Amy, G.L.; Karanfil, T. Disinfection by-product formation during seawater desalination: A review. Water Res. 2015, 81, 343–355. [Google Scholar] [CrossRef] [PubMed] [Green Version]
- Kohil, A.; Frenken, K. Cooling Water for Energy Generation and Its Impact on National-Level Water Statistics; Food and Agriculture Organization of the United Nations: Rome, Italy, 2011. [Google Scholar]
- Goleman, W.L.; Carr, J.A.; Anderson, T.A. Environmentally relevant concentrations of ammonium perchlorate inhibit thyroid function and alter sex ratios in developing Xenopus laevis. Environ. Toxicol. Chem. 2002, 21, 590–597. [Google Scholar] [CrossRef] [PubMed]
- World Health Organization (WHO). Chlorite and Chlorate in Drinking-Water; WHO: Geneva, Switzerland, 2005. [Google Scholar]
- United States Environmental Protection Agency (EPA). Chlorine, Total Residual (Spectrophotometric, DPD); EPA-NERL: 330.5; EPA: Cincinnati, OH, USA, 1978.
- Beggs, K.M.H.; Summers, R.S. Character and chlorine reactivity of dissolved organic matter from a mountain pine beetle impacted watershed. Environ. Sci. Technol. 2011, 45, 5717–5724. [Google Scholar] [CrossRef] [PubMed]
- Boccelli, D.L.; Tryby, M.E.; Uber, J.G.; Summers, R.S. A reactive species model for chlorine decay and THM formation under rechlorination conditions. Water Res. 2003, 37, 2654–2666. [Google Scholar] [CrossRef]
- Abarnou, A.; Miossec, L. Chlorinated waters discharged to the marine environment chemistry and environmental impact. An overview. Sci. Total Environ. 1992, 126, 173–197. [Google Scholar] [CrossRef]
- Zeng, J.; Jiang, Z.; Chen, Q.; Zheng, P.; Huang, Y. The decay kinetic of residual chlorine in cooling seawater simulation experiments. Acta Oceanol. Sin. 2009, 28, 54–59. [Google Scholar]
- Venkatnarayanan, S.; Murthy, P.S.; Kirubagaran, R.; Venugopalan, V.P. Effect of chlorination on barnacle larval stages: Implications for biofouling control and environmental impact. Int. Biodeterior. Biodegrad. 2016, 109, 141–149. [Google Scholar] [CrossRef]
- Saidan, M.; Rawajfeh, K.; Nasrallah, S.; Meric, S.; Mashal, A. Evaluation of factors affecting bulk chlorine decay kinetics for Zai water supply system in Jordan: Case Study. Environ. Prot. Eng. 2017, 43, 223–231. [Google Scholar]
- Abdel-Wahab, A.; Khodary, A.; Bensalah, N. Formation of trihalomethanes during seawater chlorination. J. Environ. Prot. 2010, 1, 456–465. [Google Scholar] [CrossRef]
- Yu, H.-W.; Oh, S.-G.; Kim, I.S.; Pepper, I.; Snyder, S.; Jang, A. Formation and speciation of haloacetic acids in seawater desalination using chlorine dioxide as disinfectant. J. Ind. Eng. Chem. 2015, 26, 193–201. [Google Scholar] [CrossRef]
- Brookman, R.M.; Lamsal, R.; Gagnon, G.A. Comparing the formation of bromate and bromoform due to ozonation and UV-TiO2 oxidation in seawater. J. Adv. Oxid. Technol. 2011, 14, 23–30. [Google Scholar] [CrossRef]
- Agus, E.; Sedlak, D.L. Formation and fate of chlorination by-products in reverse osmosis desalination systems. Water Res. 2010, 44, 1616–1626. [Google Scholar] [CrossRef] [PubMed]
- Yang, X.; Guo, W.; Lee, W. Formation of disinfection byproducts upon chlorine dioxide preoxidation followed by chlorination or chloramination of natural organic matter. Chemosphere 2013, 91, 1477–1485. [Google Scholar] [CrossRef] [PubMed]
- Milazzo, G.; Caroli, S.; Braun, R.D. Tables of standard electrode potentials. J. Electrochem. Soc. 1978, 125, 261C. [Google Scholar] [CrossRef]
- Czarnetzki, L.R.; Janssen, L.J.J. Formation of hypochlorite, chlorate and oxygen during NaCl electrolysis from alkaline solutions at an RuO2/TiO2 anode. J. Appl. Electrochem. 1992, 22, 315–324. [Google Scholar] [CrossRef]
- Jung, Y.J.; Baek, K.W.; Oh, B.S.; Kang, J.-W. An investigation of the formation of chlorate and perchlorate during electrolysis using Pt/Ti electrodes: The effects of pH and reactive oxygen species and the results of kinetic studies. Water Res. 2010, 44, 5345–5355. [Google Scholar] [CrossRef] [PubMed]
- Sant’Anna, R.T.P.; Santos, C.M.P.; Silva, G.P.; Ferreira, R.J.R.; Oliveira, A.P.; Côrtes, C.E.S.; Faria, R.B. Kinetics and mechanism of chlorate-chloride reaction. J. Braz. Chem. Soc. 2012, 23, 1543–1550. [Google Scholar] [CrossRef] [Green Version]
- Jung, Y.; Hong, E.; Yoon, Y.; Kwon, M.; Kang, J.-W. Formation of bromate and chlorate during ozonation and electrolysis in seawater for ballast water treatment. Ozone Sci. Eng. 2014, 36, 515–525. [Google Scholar] [CrossRef]
- Oh, B.S.; Oh, S.G.; Hwang, Y.Y.; Yu, H.W.; Kang, J.-W.; Kim, I.S. Formation of hazardous inorganic by-products during electrolysis of seawater as a disinfection process for desalination. Sci. Total Environ. 2010, 408, 5958–5965. [Google Scholar] [CrossRef]


| Parameter | West Seawater (WS) | East Seawater (ES) |
|---|---|---|
| pH | 8.3 | 8.0 |
| Conductivity(ms/cm) | 44.37 | 44.67 |
| Salinity (PSU) | 28.66 | 28.88 |
| TOC (mg/L) | 2.2 | 1.9 |
| TN (mg/L) | 1.3 | 0.5 |
| TP (mg/L) | 0.1 | 0.1 |
| Equation | Equivalent | Equations No. |
|---|---|---|
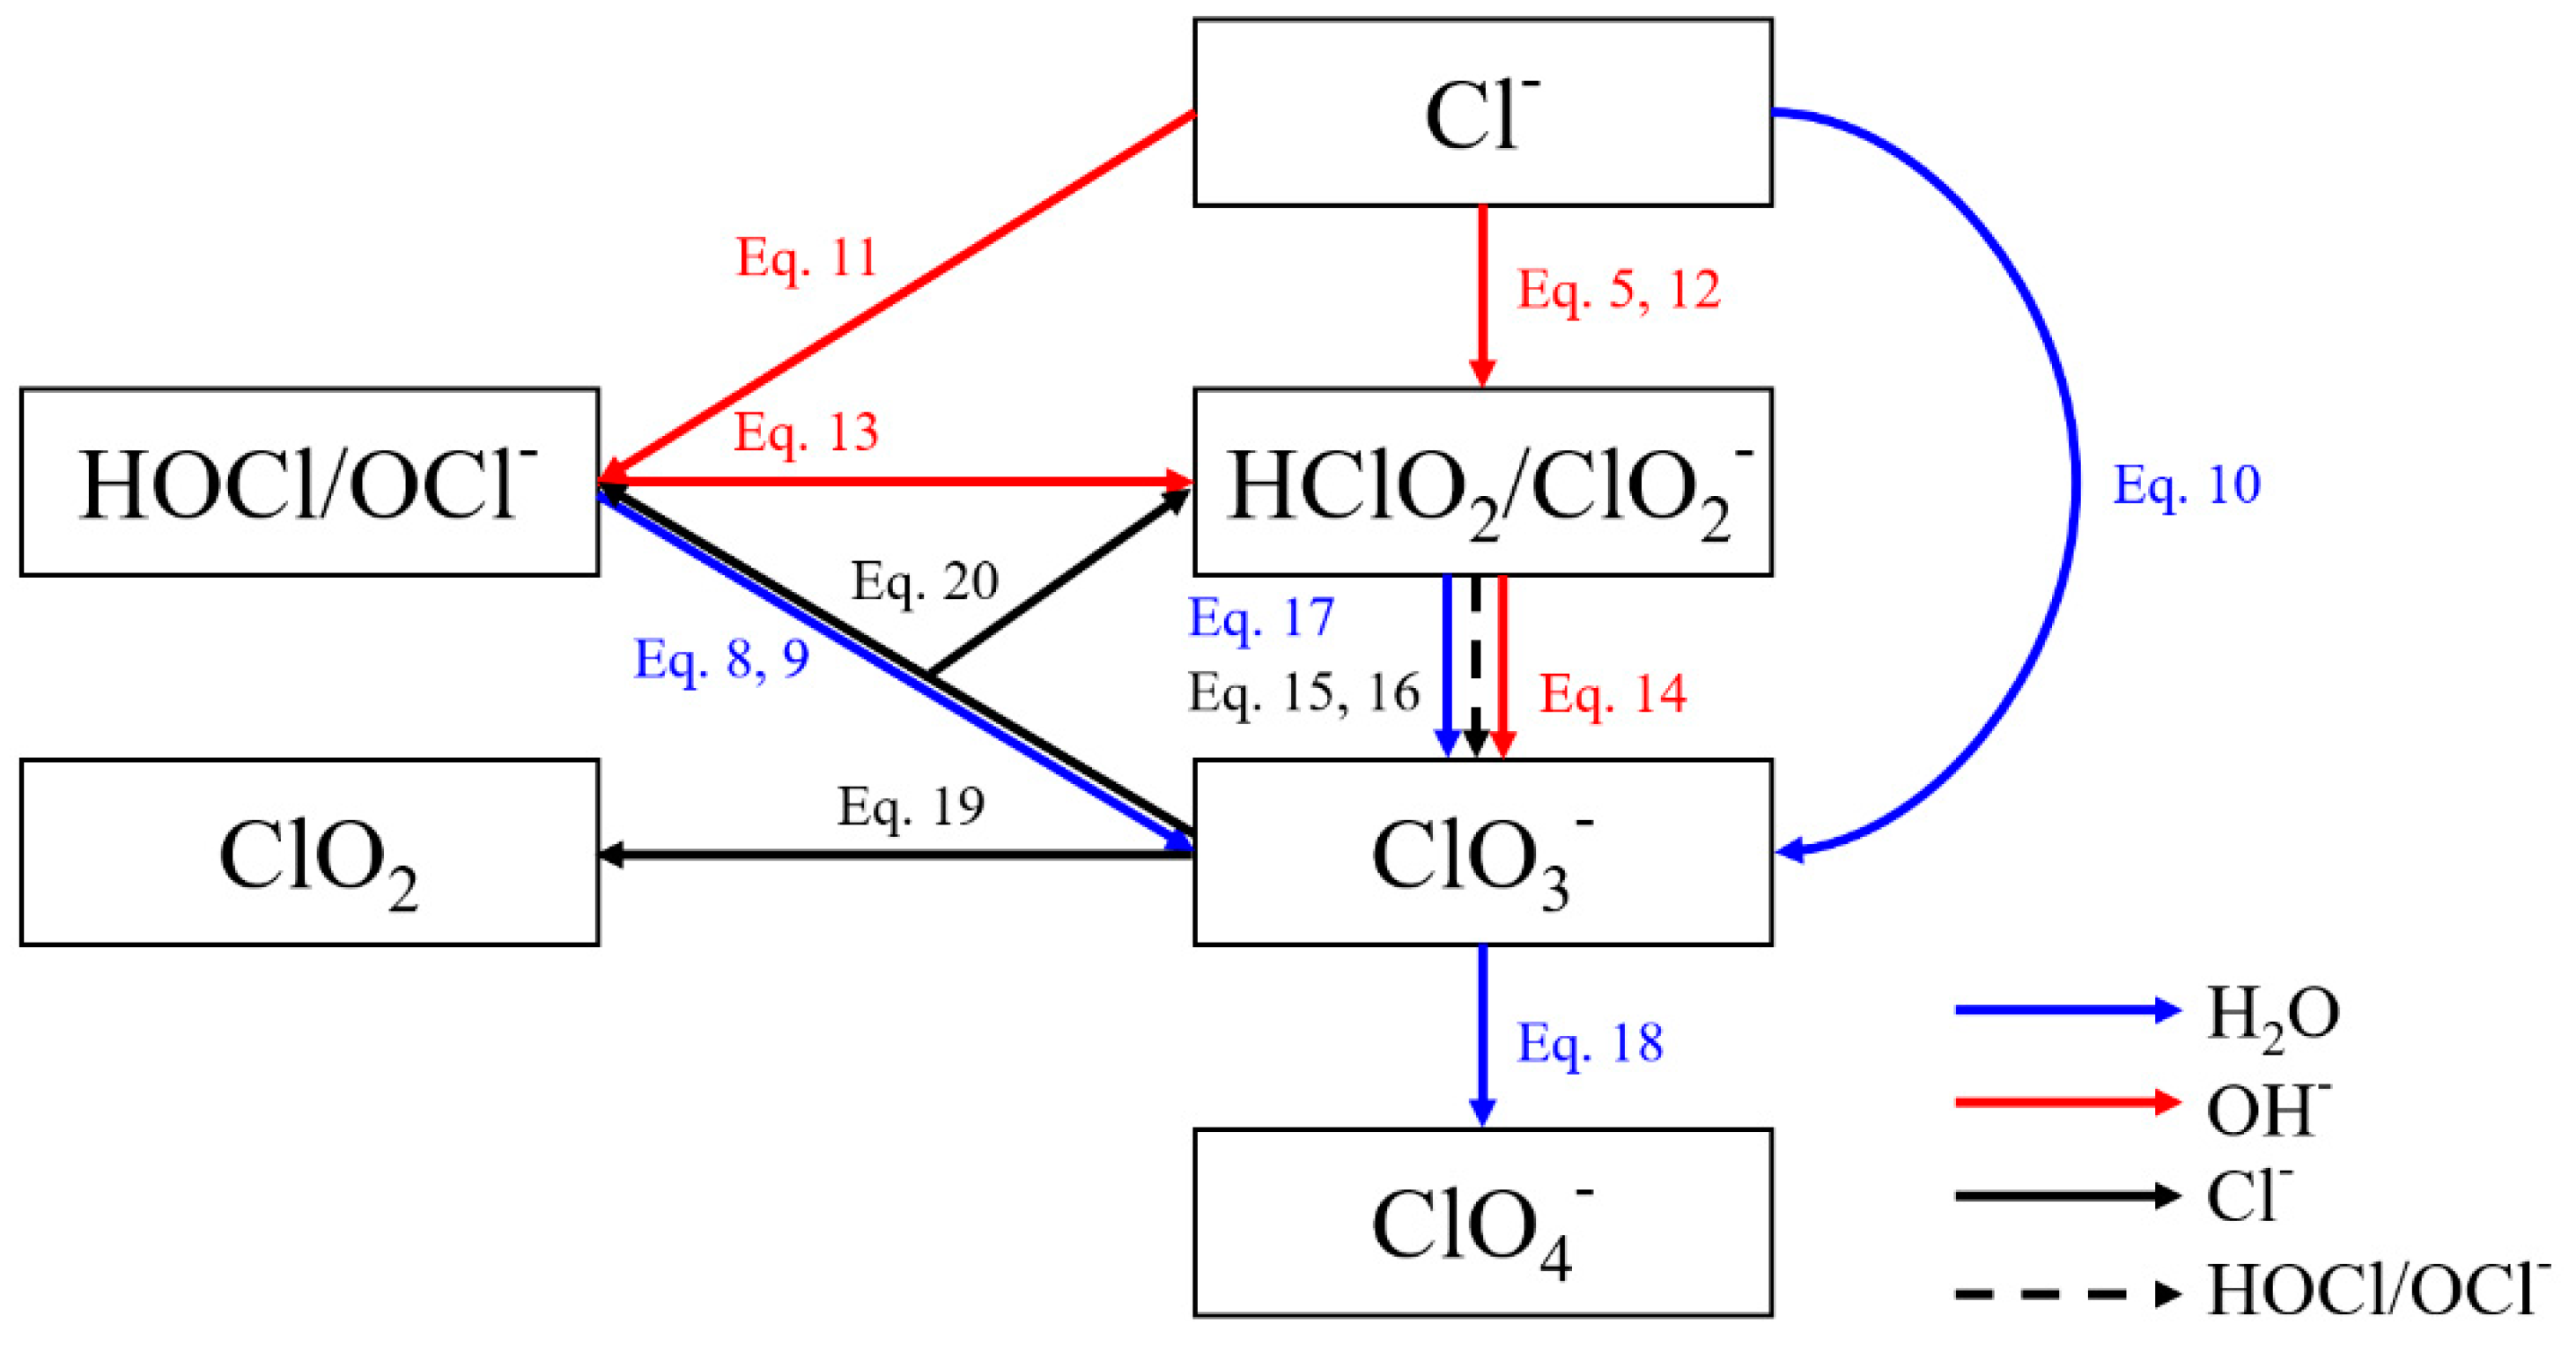
| 6 OCl− + 3 H2O → 2 ClO3− + 4 Cl− + 6 H+ + 3/2 O2 + 6 e− | 0.46 V | (8) |
| 6 HOCl + 3 H2O → 2 ClO3− + 4 Cl− + 12 H+ + 3/2 O2 + 6 e− | 0.46 V | (9) |
| Cl− + 3 H2O → ClO3− + 6 H+ + 6 e− | −1.45 V | (10) |
| Cl− + 2 OH− → OCl− + H2O + 2 e− | −0.94 V | (11) |
| Cl− + 4 OH− → ClO2− + H2O + 4 e− | −0.76 V | (12) |
| OCl− + 2 OH− → ClO2− + H2O + 2 e− | −0.59 V | (13) |
| ClO2− + 2 OH− → ClO3− + H2O + 2 e− | −0.35 V | (14) |
| ClO2− + OCl− → Cl− + ClO3− | (15) | |
| ClO2− + HOCl → ClO3− + H+ + Cl− | (16) | |
| HClO2 + H2O → ClO3− + 3 H+ +2 e− | (17) | |
| ClO3− + H2O → ClO4− + 2 H+ + 2e− | 0.95 V | (18) |
| 2 ClO3− + 2 Cl− + 4 H+ → Cl2 + 2 ClO2 + 2 H2O | (19) | |
| ClO3− + Cl− + 2 H+ → HClO2 + HOCl | (20) |
© 2019 by the authors. Licensee MDPI, Basel, Switzerland. This article is an open access article distributed under the terms and conditions of the Creative Commons Attribution (CC BY) license (http://creativecommons.org/licenses/by/4.0/).
Share and Cite
Yi, J.; Ahn, Y.; Hong, M.; Kim, G.-H.; Shabnam, N.; Jeon, B.; Sang, B.-I.; Kim, H. Comparison between OCl−-Injection and In Situ Electrochlorination in the Formation of Chlorate and Perchlorate in Seawater. Appl. Sci. 2019, 9, 229. https://0-doi-org.brum.beds.ac.uk/10.3390/app9020229
Yi J, Ahn Y, Hong M, Kim G-H, Shabnam N, Jeon B, Sang B-I, Kim H. Comparison between OCl−-Injection and In Situ Electrochlorination in the Formation of Chlorate and Perchlorate in Seawater. Applied Sciences. 2019; 9(2):229. https://0-doi-org.brum.beds.ac.uk/10.3390/app9020229
Chicago/Turabian StyleYi, Jongchan, Yongtae Ahn, Moongi Hong, Gi-Hyeon Kim, Nisha Shabnam, Byongsueng Jeon, Byoung-In Sang, and Hyunook Kim. 2019. "Comparison between OCl−-Injection and In Situ Electrochlorination in the Formation of Chlorate and Perchlorate in Seawater" Applied Sciences 9, no. 2: 229. https://0-doi-org.brum.beds.ac.uk/10.3390/app9020229