Article

Interpretive Structural Modeling and MICMAC Analysis for Identifying and Benchmarking Significant Factors of Seismic Soil Liquefaction

1
State Key Laboratory of Coastal and Offshore Engineering, Dalian University of Technology, Dalian 116024, China
2
Department of Civil Engineering, University of Engineering and Technology Peshawar (Bannu Campus), Bannu 28100, Pakistan
3
Faculty of Management and Economics, Dalian University of Technology, Dalian 116024, China
4
China–Pakistan Economic Corridor Project, LIMAK–JV–ZKB, Pindigheb, Attock 43260, Pakistan
*
Author to whom correspondence should be addressed.
Submission received: 19 November 2018 / Revised: 21 December 2018 / Accepted: 4 January 2019 / Published: 10 January 2019
(This article belongs to the Section Environmental Sciences)

Abstract

:
Seismic soil liquefaction is considered as one of the most complex geotechnical earthquake engineering problems owing to the uncertainty and complexity involved in soil parameters, seismic parameters, and site condition factors. Each one of these parameters contains a variety of factors that trigger liquefaction and have varying degrees of importance. However, estimating accurate and reliable liquefaction-induced hazards requires identification and benchmarking of the most influential factors that control soil liquefaction. Seismic soil liquefaction factors were identified by Systematic Literature Review (SLR) approach and analyzed through Interpretive Structural Modeling (ISM) and the Cross-Impact Matrix Multiplication Applied to Classification (MICMAC) methodologies. The ISM model presented the relationships between fifteen seismic soil liquefaction factors and their benchmarking position from higher to lower-level significant factors in hierarchy. MICMAC is used to examine the strength of the relationship between seismic soil liquefaction significant factors based on their driving and dependence power. This research characterizes the identification and benchmarking of the seismic soil liquefaction factors and their relationships. The results show that the factors—duration of earthquake, peak ground acceleration, drainage condition, and standard penetration test (SPT) blow counts—influence seismic soil liquefaction directly and soil type is the governing factor that forms the base of the ISM hierarchy and consequently triggers seismic soil liquefaction. The results provide a more accurate way of selecting significant factors for establishment of seismic soil liquefaction potential and liquefaction-induced hazards risk assessment models.

1. Introduction

Seismic soil liquefaction has been one of the most complex phenomena in geotechnical earthquake engineering over the past several decades and was brought to the notice of engineers after substantial damage from earthquakes in Niigata, Japan (1964) and Alaska, United States (1964), which had magnitudes of 7.5 and 9.2 on the Richter scale, respectively. Soil liquefaction is defined as “the transformation of granular material from solid to a liquefied state due to increased pore-water pressure and reduced effective vertical stress” [
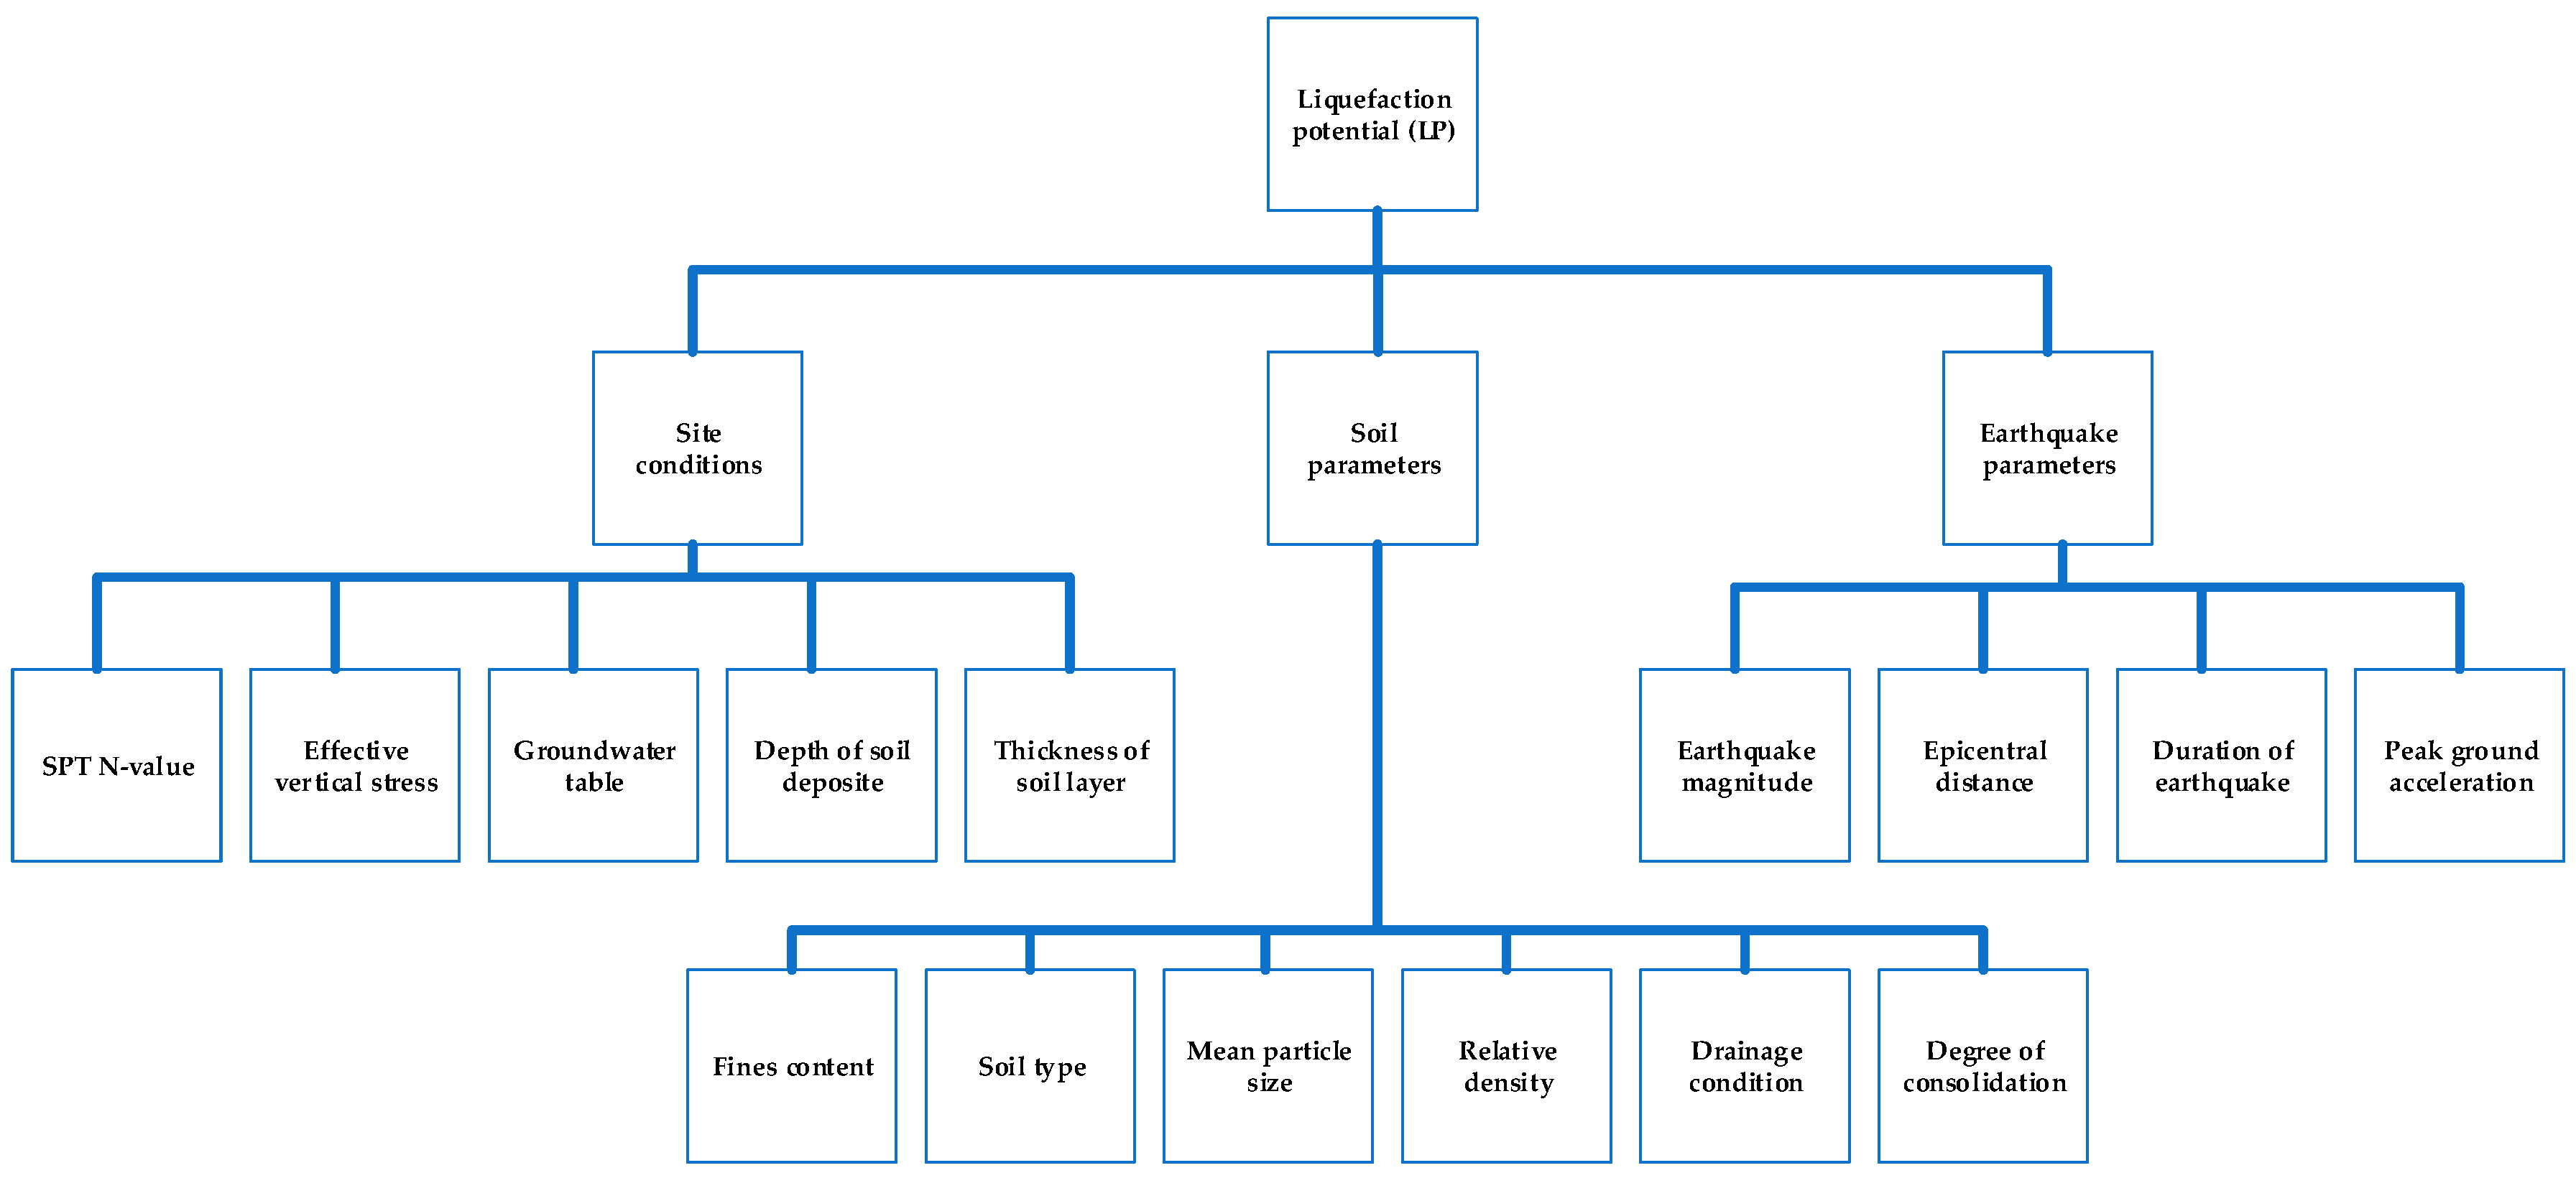
1]. Soil liquefaction depends on a diverse set of physical parameters with highly non-linear interconnections. The factors controlling the seismic soil liquefaction can be broadly divided into seismic parameters, site conditions, and soil parameters. Each of these factors contains a variety of parameters that characterize liquefaction with varying degrees of importance, such as: earthquake magnitude, epicentral distance, seismic duration, peak ground acceleration, fines content, soil type, particle size, relative density standard penetration test blow counts, and groundwater level. The liquefaction potential (LP) and liquefaction-induced hazards assessment are closely related problems. The former aims to determine whether the soil becomes liquefied after an earthquake, whereas the latter needs to not only assess whether liquefaction-induced hazards occur after soil liquefaction but also assess the severity of different hazards induced by liquefaction.
There are numerous assessment methods that are commonly employed in-situ. Tests include standard penetration test (SPT), cone penetration test (CPT), and shear wave velocity test (Vs) data to ascertain seismic soil liquefaction potential factors. Boulanger and Idriss [2] derived a probabilistic cone penetration test (CPT)-based liquefaction triggering procedure for cohesionless soils using a maximum likelihood method with an updated case history database. CPT-based and SPT-based liquefaction triggering procedures for cohesionless soils was reexamined by Boulanger and Idriss [3] and the primary focus of this work is on the CPT-based procedure coupled with an examination of the effects of a change in the magnitude scaling factor relationship on the SPT-based procedure. Comprehensive experimental results on saturated sands have been examined to assess the influence of fundamental factors on their susceptibility to liquefaction [4].
To evaluate seismic soil liquefaction potential, Zhang [5] selected five soil liquefaction factors—standard penetration test blow counts, Epicentral distance, groundwater table depth, earthquake magnitude, and depth of the sand deposit—using optimum seeking method and concluded that the most effective parameters are standard penetration test blow counts and magnitude of earthquake for evaluating soil liquefaction. Baziara and Nilipour [6] selected earthquake magnitude, mean grain size, peak ground acceleration, effective vertical stress, and CPT tip resistance using the artificial neural network (ANN) method to evaluate liquefaction potential (LP). Samui et al. [7] selected earthquake magnitude, soil type, shear wave velocity, and effective vertical stress using the support vector machine (SVM) method to assess LP. Bagheripour et al. [8] chose effective vertical stress, standard penetration test blow counts, earthquake magnitude, and peak ground acceleration using a genetic algorithm technique to predict LP. Xue and Yang [9] selected five significant factors: standard penetration test blow counts, mean grain size, groundwater table, and earthquake magnitude, using the fuzzy comprehensive evaluation method to evaluate LP. Most of the assessment methods include few factors affecting soil liquefaction, regardless of important factors or selection of indirect parameters, which may deviate from the actual situation of soil liquefaction assessment results. Limited research has been conducted in the past to identify important parameters for soil liquefaction. Dalvi et al. [10] used the Analytic Hierarchy Process (AHP) and entropy methods to identify important parameters among 16 factors of soil liquefaction. Sheng [11] used rough set theory and AHP to find the subjective and objective weights of soil liquefaction factors by comparing the comprehensive weighting factors, and it was concluded that seismic parameters are more important than other factors. Zhu [12] analyzed fifteen influencing factors of soil liquefaction by mathematical statistics. Tang et al. [13] identified twelve significant soil liquefaction factors by a bibliometric method and analyzed their structural relationship through an interpretive structural modeling (ISM) approach and these factors are earthquake magnitude, epicentral distance, duration of earthquake, fines content, particle size, grain composition, relative density, drainage condition, degree of consolidation, thickness of sand layer, depth of sand layer, and groundwater table. The soil liquefaction susceptibility mechanism has been understood well, however, estimating accurate and reliable liquefaction-induced hazards requires identification and benchmarking of the most important factors controlling liquefaction. Most of these studies considered the quantification rather than the qualitative information of soil liquefaction factors from scientific publications, without considering the underlying relationships among the important influencing parameters or the indirect parameters, resulting in deviations from the actual situation. Therefore, to accurately and reliably determine soil liquefaction susceptibility, it is necessary to identify and benchmark the important factors from the literature using a systematic literature review (SLR) approach, as described in Okoli and Schabram, 2010 and Tranfield et al., 2003 [14,15], and to clarify the relationships among them. ISM plays an essential role in such conditions and is a well-known methodology for understanding interactions between definite factors that describe a problem. The ISM method was developed by John N. Warfield, between 1971 and 1974 [16] and is based on the principle of pair-wise comparison. Over the years, ISM has received some development in its applications and techniques [17].
The MICMAC method was developed by Michel Godet and François Bourse [18]. Matrice d’impacts croisés multiplication appliquée á un classment (MICMAC) a cross-impact matrix multiplication applied to classification is a structural prospective analysis used to study indirect relationships [19]. In an indirect relationship, one can observe three variables and their direct effects: variable X affects Y, variable Y affects Z, X and Z have no direct effect, but their relationship with Y is a cross-correlation, where any change in X will affect Z. This analysis is also known as gray area exploration [20]. This analysis complements the ISM approach by exploring constraints that usually refer to the ISM method: it explores the relationship “yes” or “no” and ignores the so-called gray area between 0 and 1 [
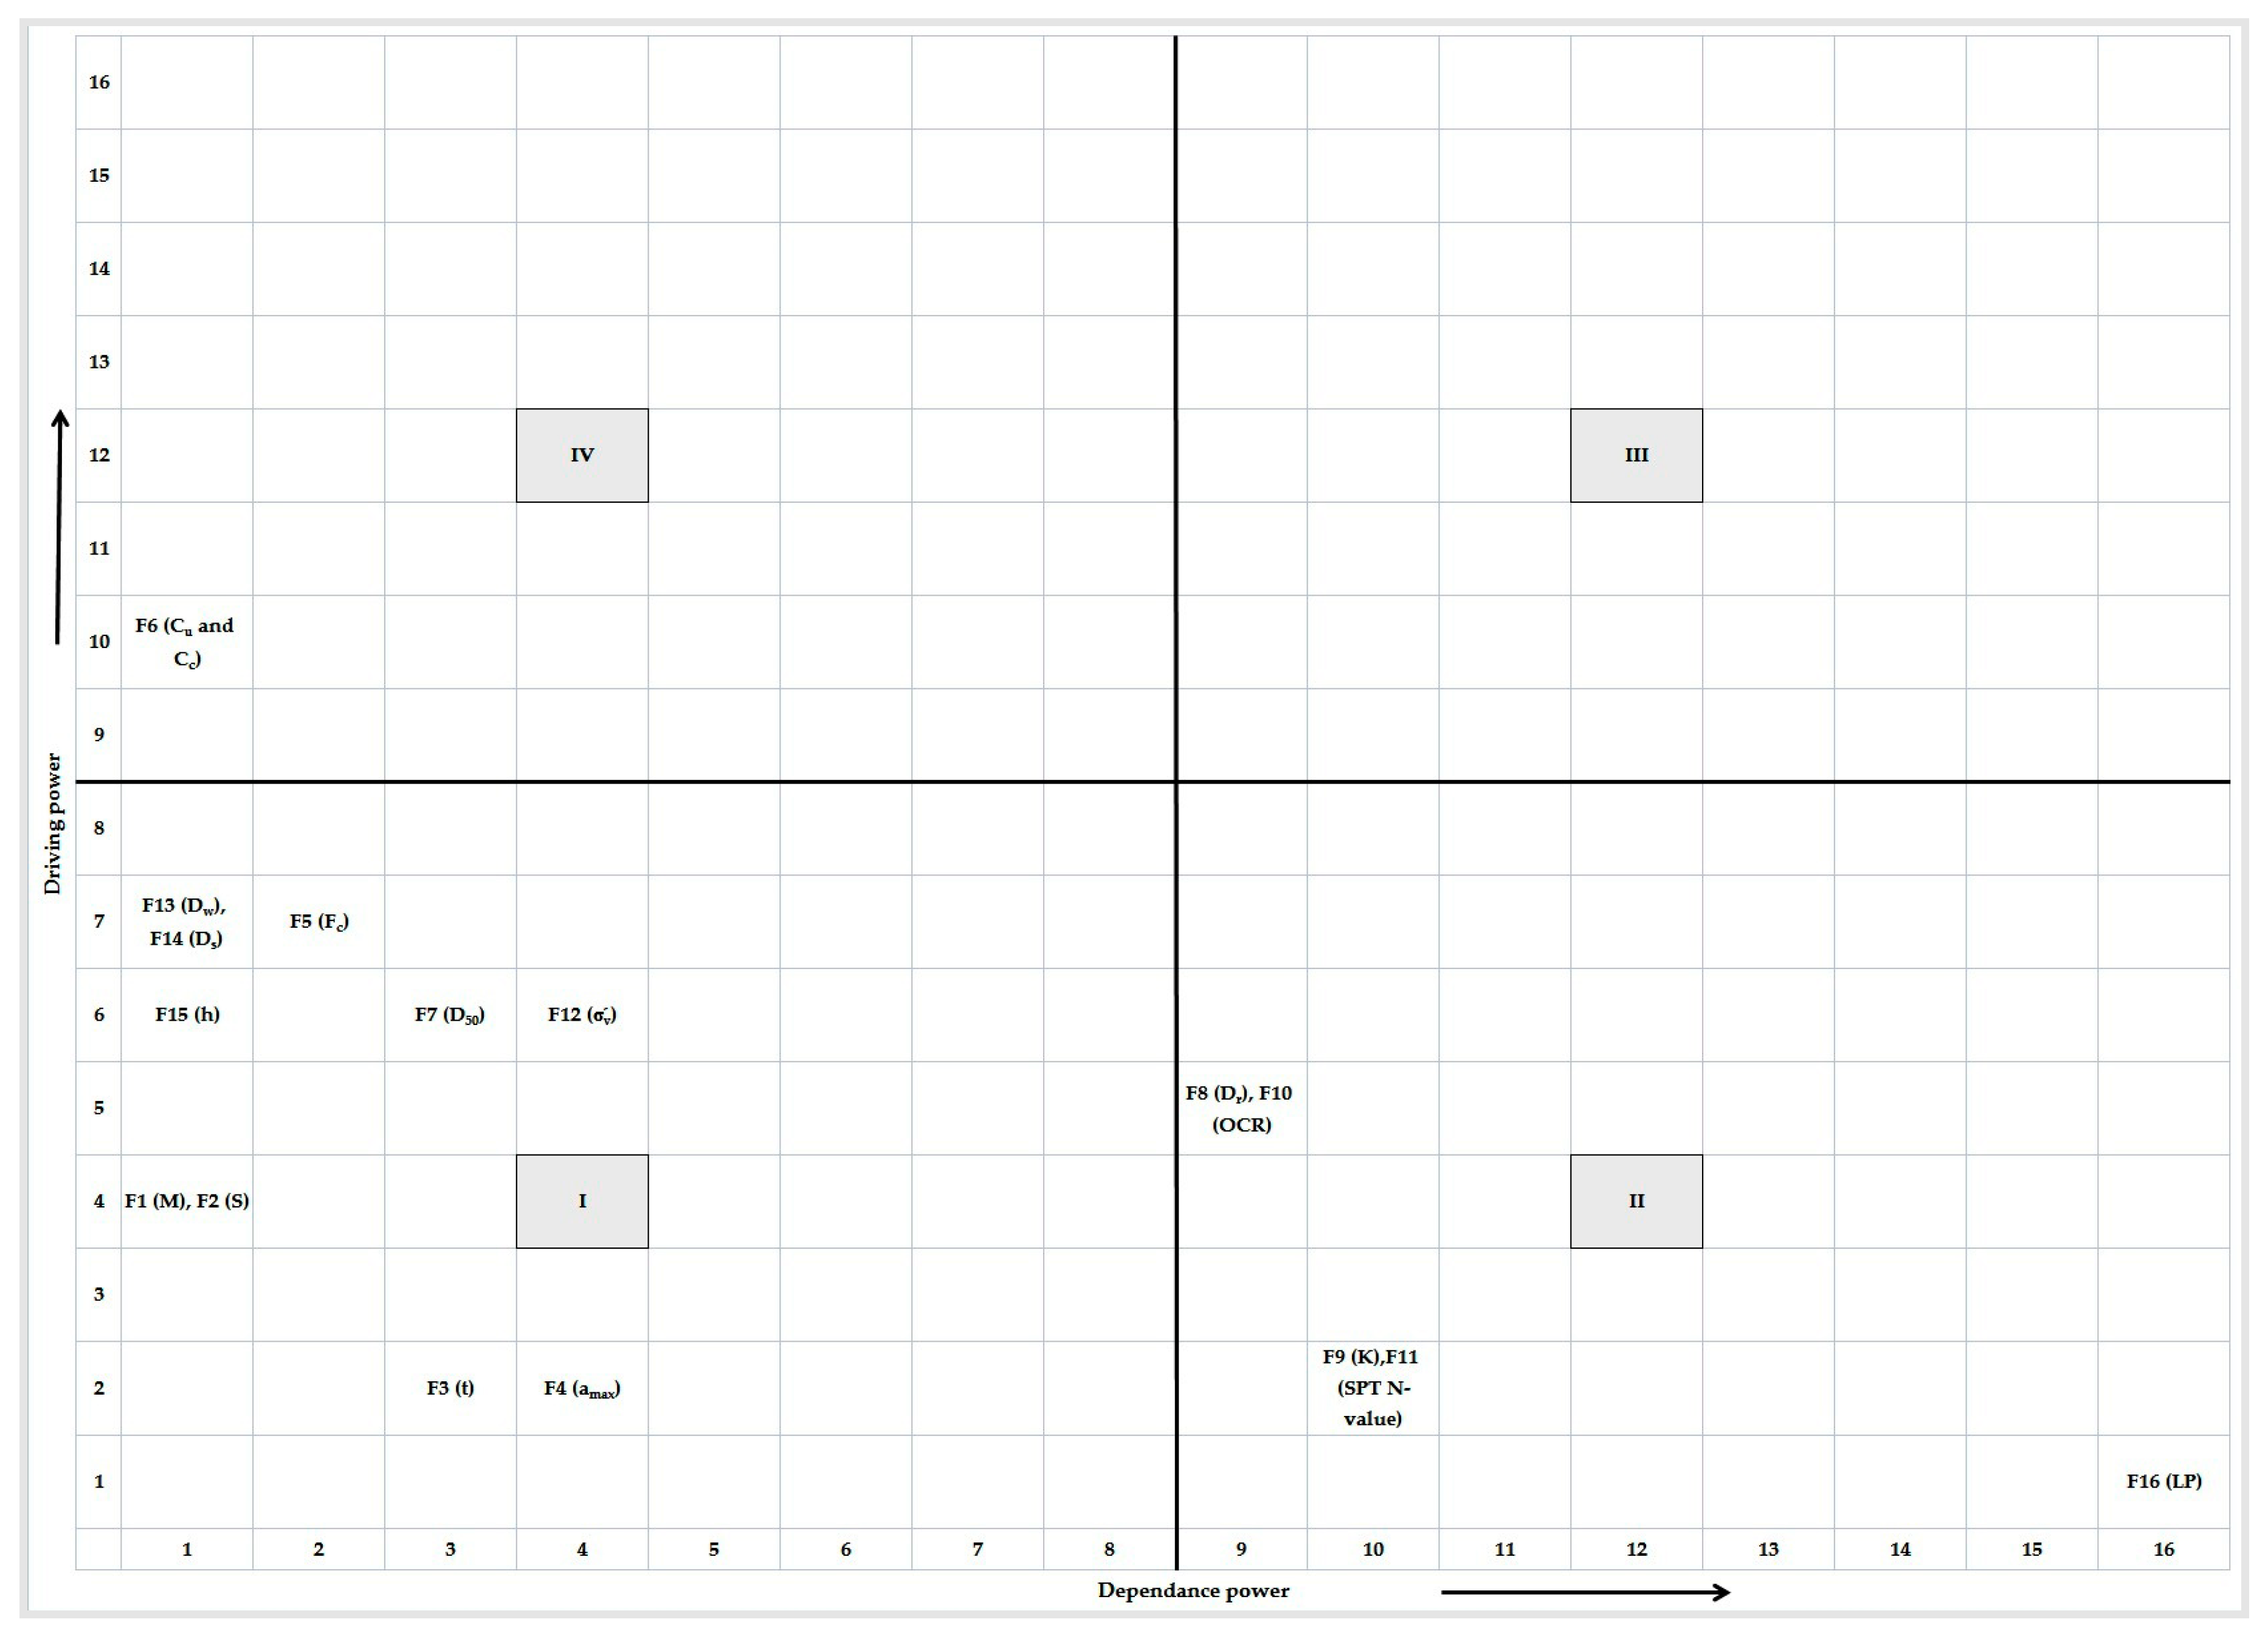
17]. MICMAC analysis involves the development of a graph that classifies factors based on driving power and dependence power. MICMAC analysis is used to classify the factors and validate the interpretive structural model factors in the study to reach their results and conclusions.
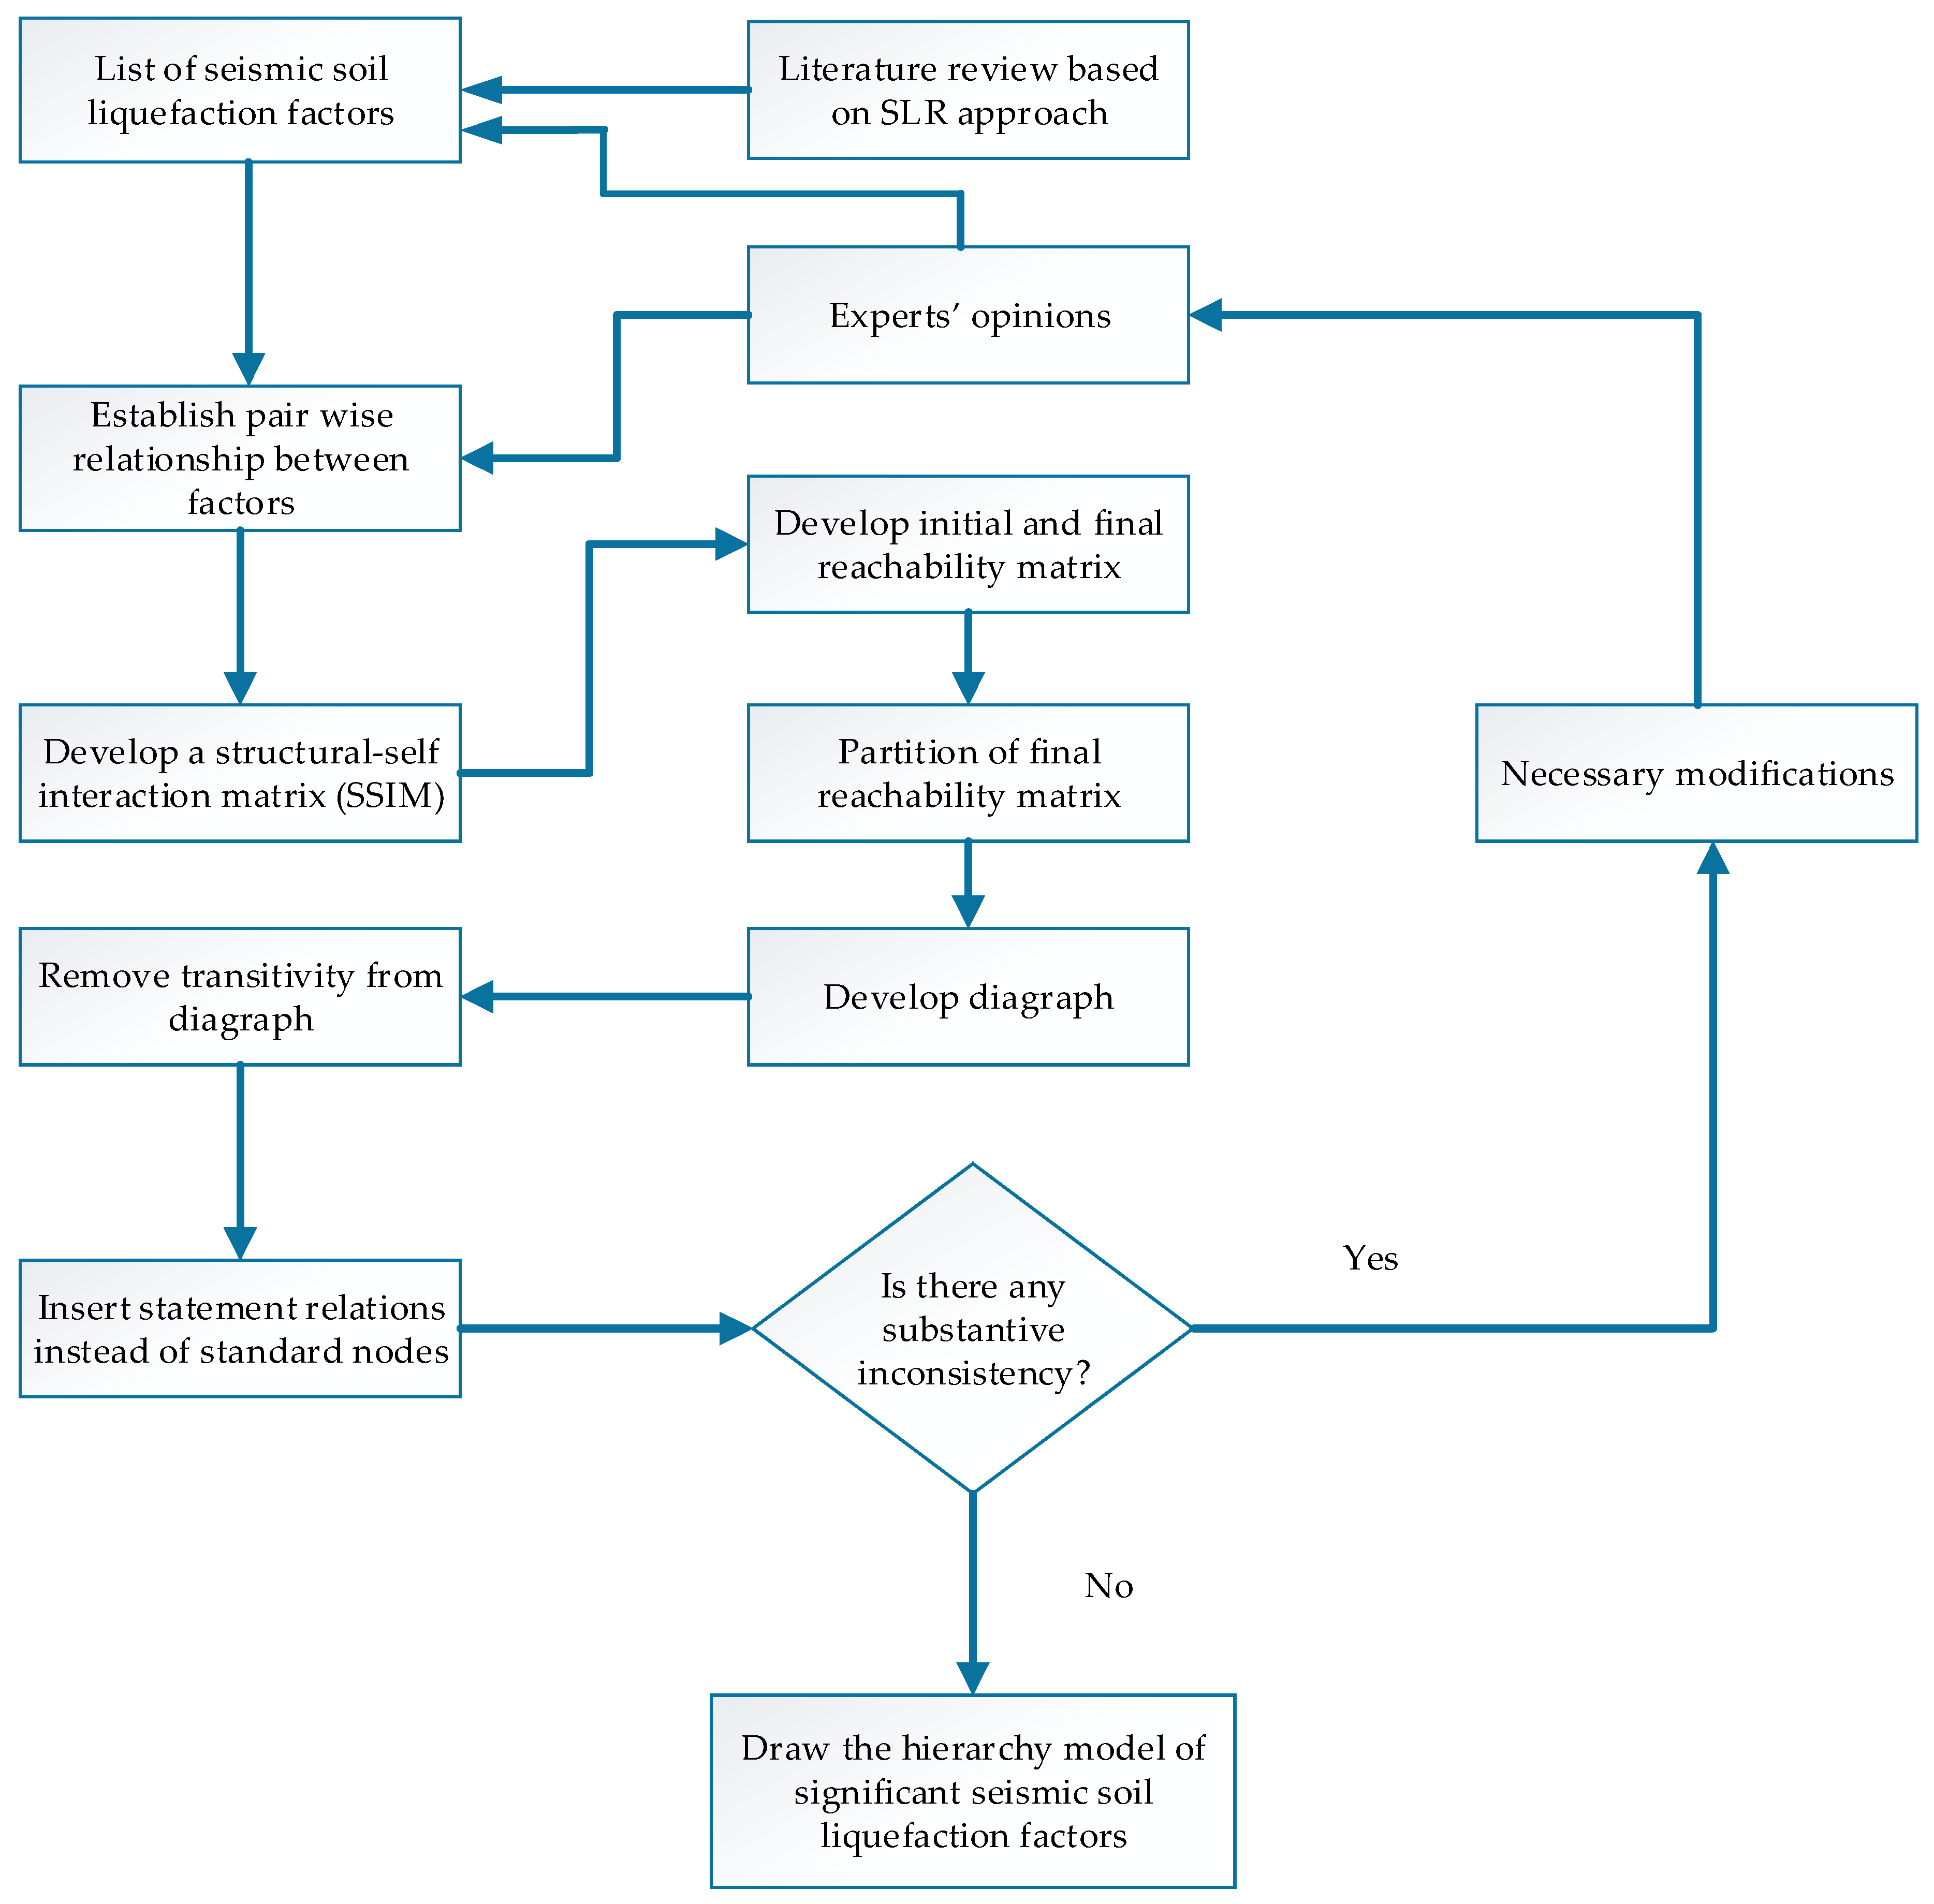
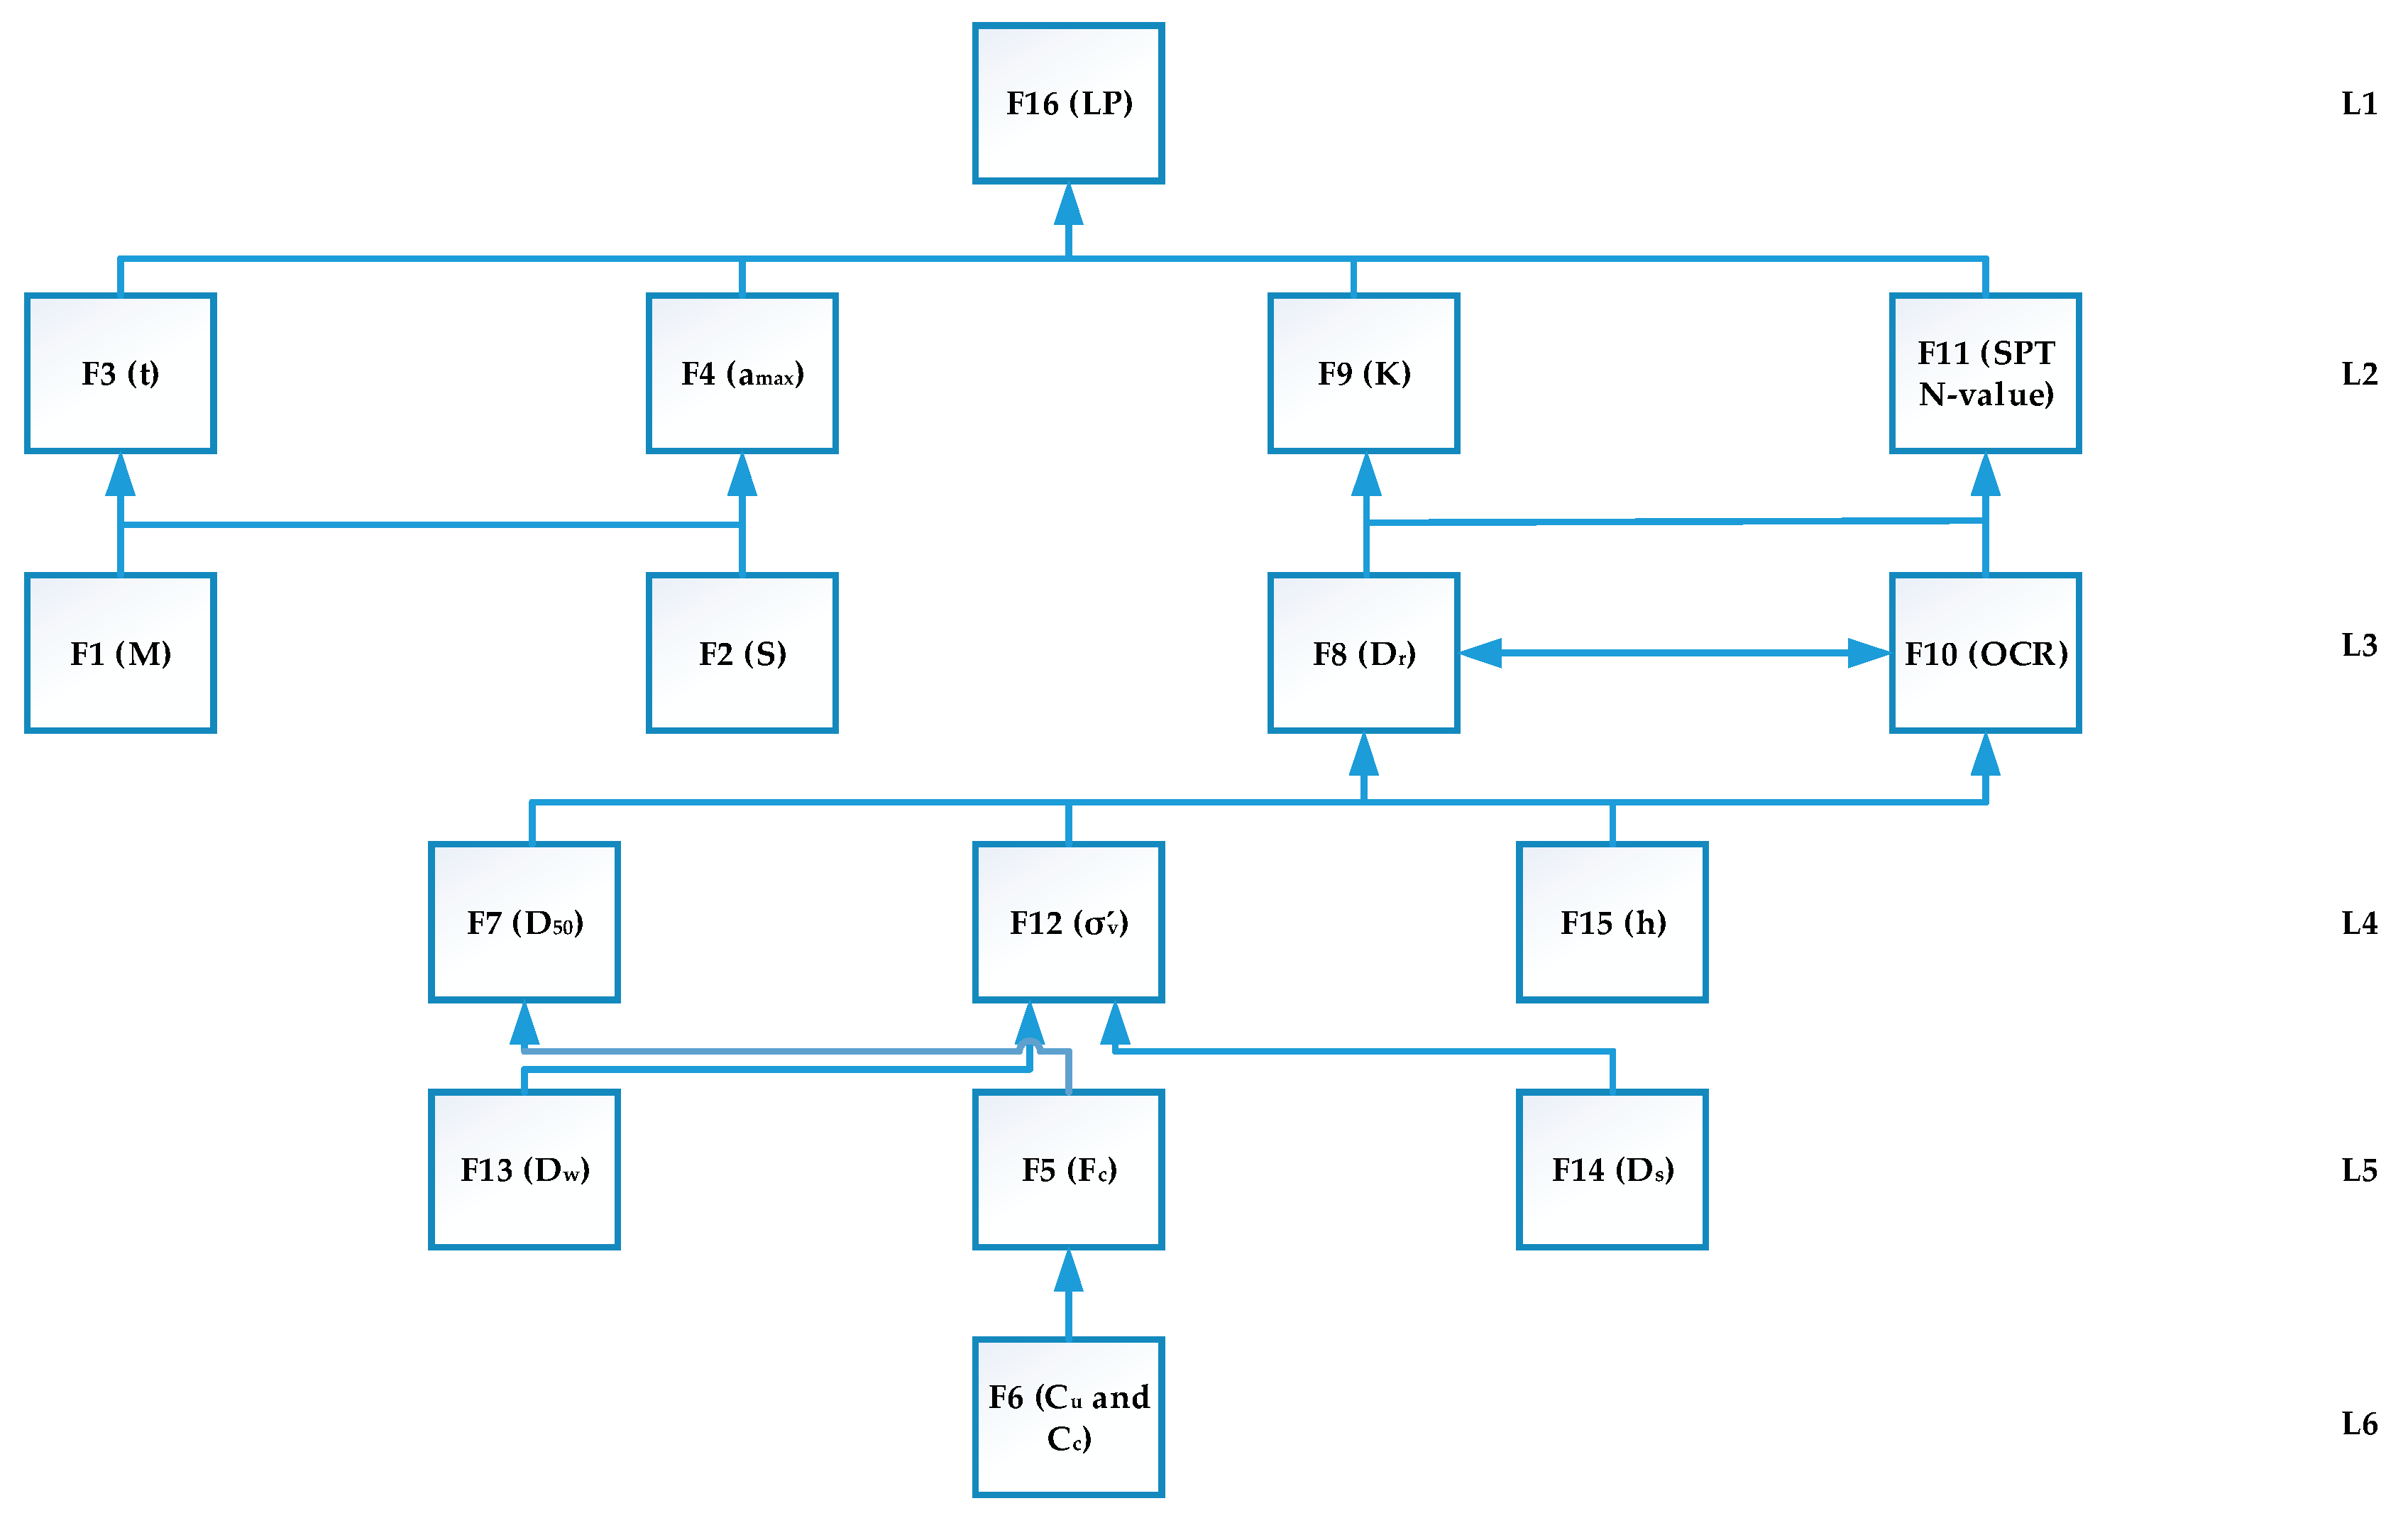
In recent years, no comprehensive study covering the most important factors of seismic soil liquefaction has been published using the SLR approach in the development of ISM-based soil liquefaction model and this study is the first step in this direction. In this paper, two structural analysis methods, i.e., ISM and MICMAC analysis, were used to develop a comprehensive ISM model to provide a more accurate way of selecting significant factors for the establishment of seismic soil liquefaction potential and liquefaction-induced hazards risk assessment models. The significant seismic soil liquefaction factors were extracted from a literature review based on the SLR approach [14,15]. The purpose of the SLR approach is to obtain qualitative information from scientific publications rather than to quantify research on the subject. Structural analysis reduces the system complexity of direct and indirect relationships between factors. The methodology combines two structural analysis techniques, interpretive structural modeling and a matrix-based multiplication applied to a classification analysis. ISM is a qualitative analysis method which can only act as a tool for imposing order and directions on the complexity of relationships among the factors. The significance and importance of this research work’s results can provide guidelines for the selection of quantitative methods such as Bayesian Belief Networks (BBN) based on ISM for seismic soil liquefaction potential determination and liquefaction-induced hazards risk assessment models according to the soil liquefaction data.
The paper is organized into five sections. The significant seismic soil liquefaction factors from the literature review are presented in Section 2. Section 3 presents the structural analysis methodological procedure to model the seismic soil liquefaction factor interaction systems. Section 4 discusses the main results, and Section 5 presents the conclusions of the study. Some tables are shown in Appendix A and Appendix B, owing to their extension and to make easy for reading and interpretation of their respective content.

2. Literature Review

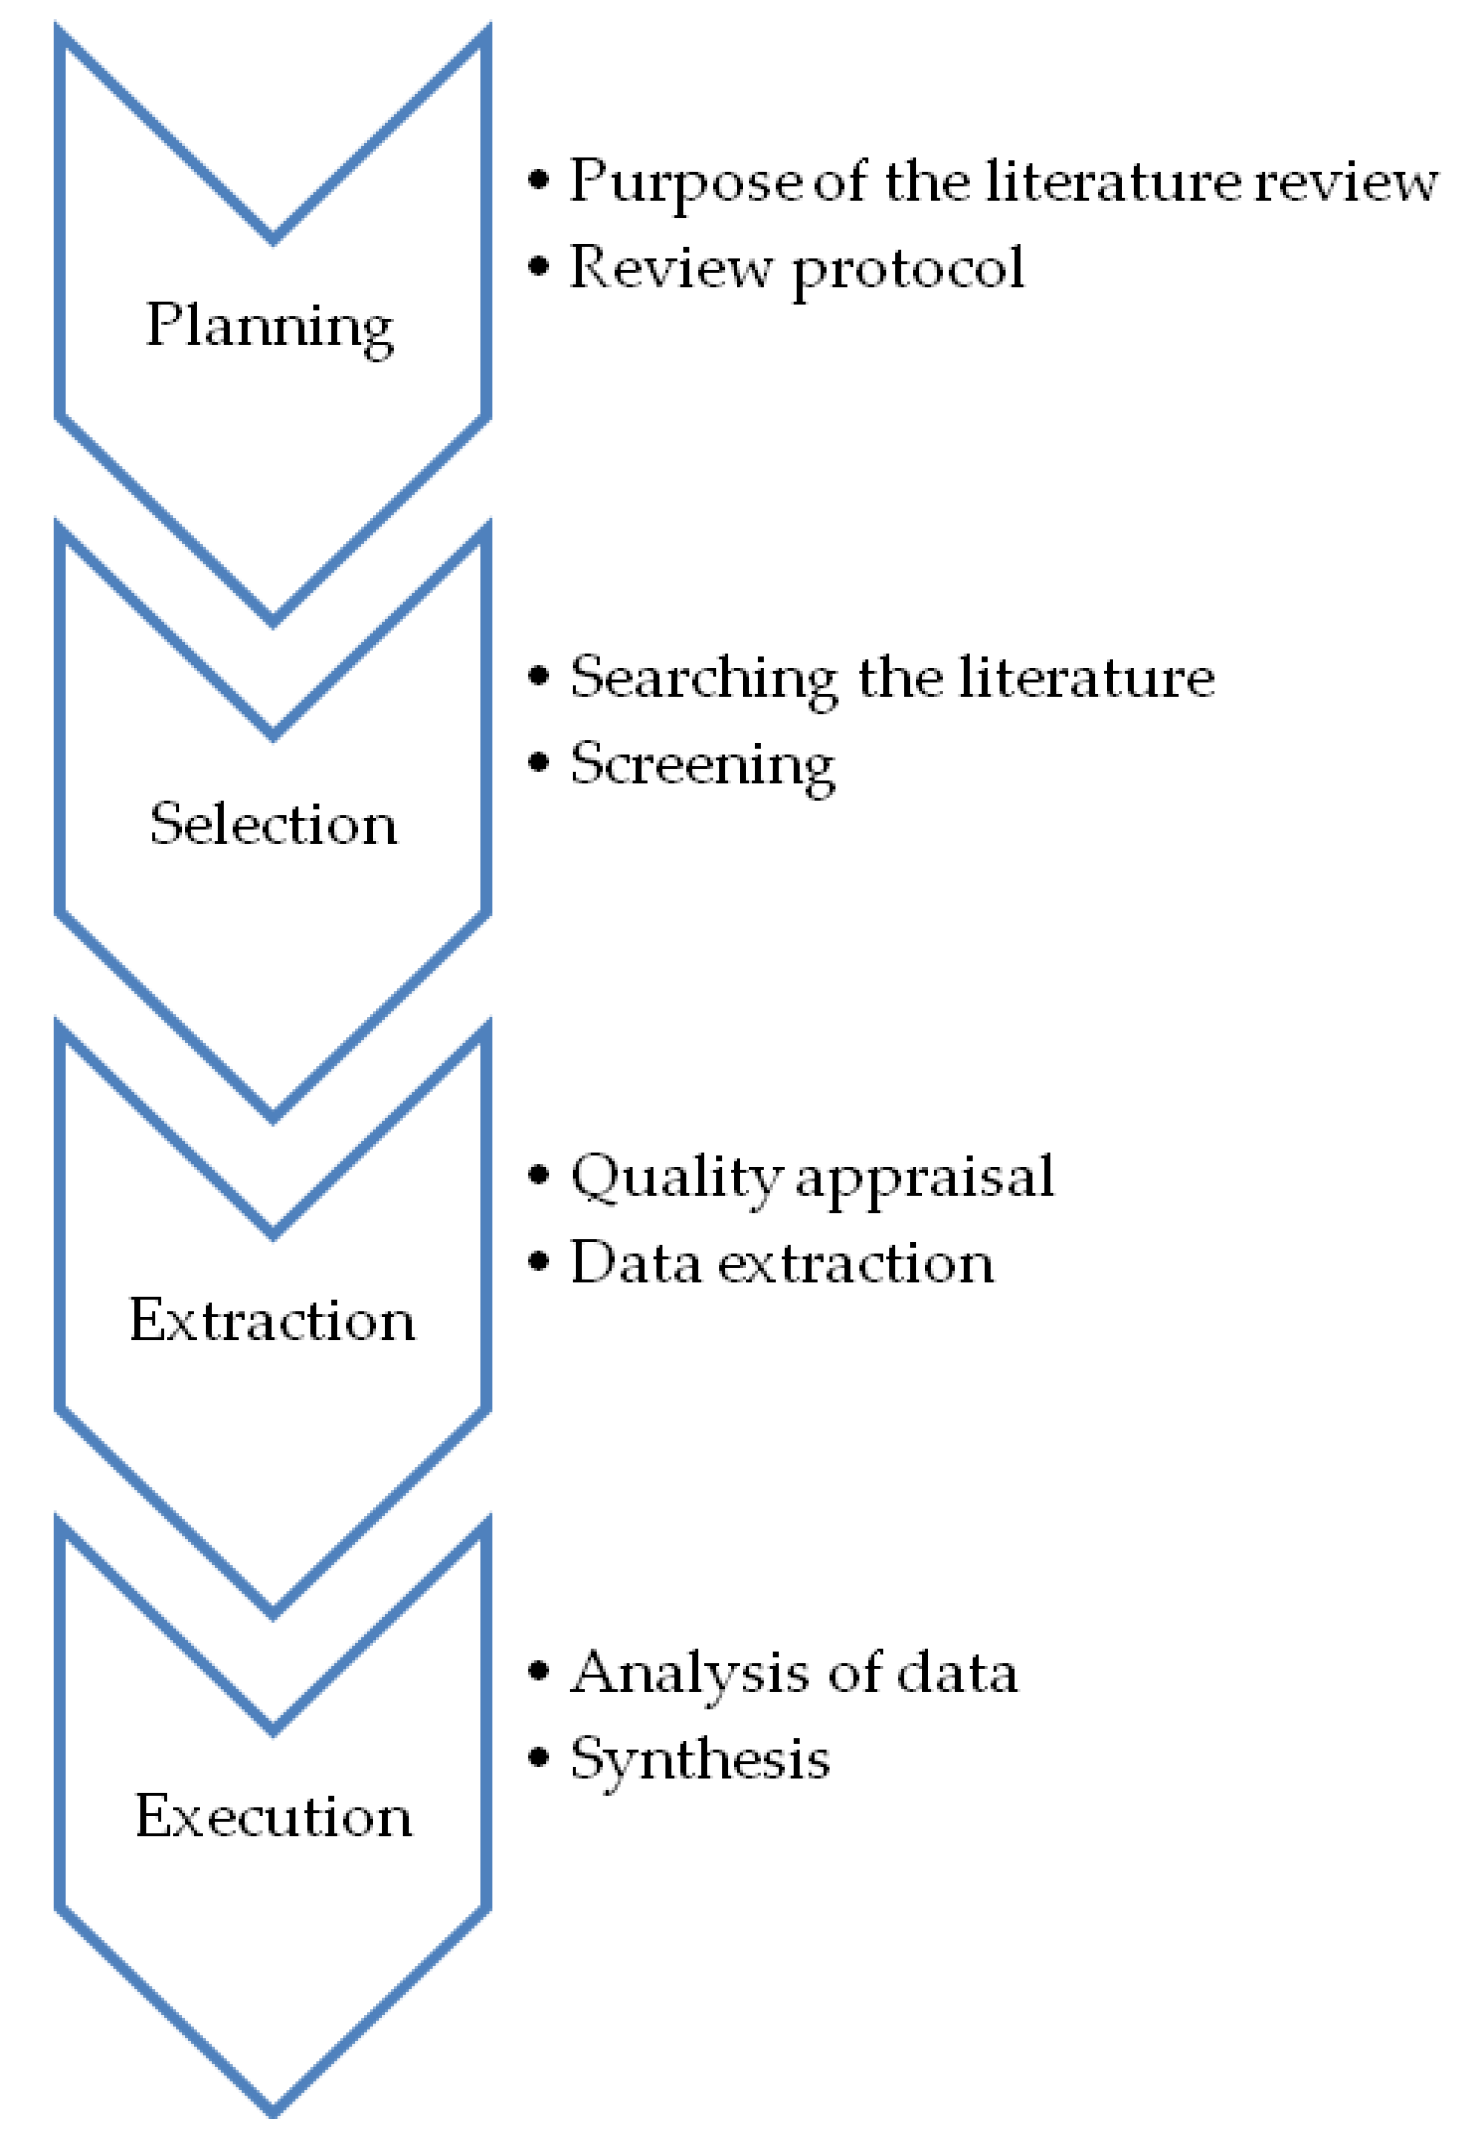
Systematic literature review (SLR) is a systematic, explicit, and reproducible method for identifying, evaluating, and synthesizing the existing body of completed and recorded work produced by researchers, scholars, and practitioners [21]. The rigorous Systematic Literature Review (SLR) approach is used in this study to ascertain the significant seismic soil liquefaction factors from the literature and consists of planning, selection, extraction, and execution phases (see Figure 1).
The systemic literature review approach removes the potential bottlenecks associated with the application of accurate methodology and simply helps to expand the subsequent sections on the paper. Readers can refer to the literature [14,15] for the detailed systematic literature review process.
The purpose and scope of a systematic literature review in this study was the identification of the significant seismic soil liquefaction factors and their relationships. A protocol is a plan that describes the conduct of a proposed systematic literature review [22]. As published literature is interlinked to a considerable degree, one paper leads to others. So, picking up one thread eventually leads to others. As references accumulated, some of them were more vital and useful and some references, such as seminal papers, were found to be generally referenced a number of times in the relevant literature.
The literature review search was strengthened by online scientific databases such as Science Direct, Bing, Taylor and Francis, Google Scholar, Emerald, etc. using the primary keywords soil liquefaction, interpretive structural modeling, and MICMAC analysis and the secondary keywords soil type, fines content, magnitude of earthquake, groundwater table.
Research articles published in reputed scholarly journals, doctoral theses, master theses, working papers, and survey reports published on soil liquefaction influencing factors by professional individuals and agencies were incorporated in this study. Several studies were found that clearly did not meet the requirements or were of insufficient quality to be included in the review synthesis and were excluded.
The main purpose was to obtain qualitative information from scientific publications rather than to quantify the research on the subject. Published research papers have concluded that there are three groups of parameters i.e., seismic parameters, site conditions, and soil parameters that control the soil liquefaction phenomenon. Seed and Idriss [23] pointed out that seismic parameters, site conditions, and soil parameters should be taken into consideration at the same time in assessing soil liquefaction potential, and can be subdivided into more parameters.
Field experts examined and analyzed the preliminary list and they believed that the soil liquefaction factors retrieved from the literature were important for expanding exploratory research by developing a structural self-interaction matrix for interpretive structural modeling. Based on the synthesis of the systematic literature review and field experts’ opinions, significant seismic soil liquefaction factors (see Table 1) have been identified. The descriptions of these significant factors are as follows:
1 Earthquake magnitude
Soil liquefaction potential increases with the magnitude of the earthquake, thus causing more damage. There is no past record of soil liquefaction occurring with earthquakes of magnitude below 5 [13]. Russell Green and Julian Bommer [24] proposed that in liquefaction hazard assessments for engineering applications, magnitude 5.0 should be adopted as the minimum earthquake size to be considered. Boulanger and Idriss revised the magnitude scaling factor relationship for SPT-based liquefaction triggering analyses, incorporating functional dependency on earthquake magnitude [25]. S. Tesfamariam and Z. Liu [26] considered the Stark and Olson [27] earthquake liquefaction datasets and concluded that the likelihood of soil liquefaction increases with increased earthquake magnitude i.e., 7 or more than 7, and consequently decreasing with earthquake magnitude below 6. The study conducted by Ahmad et al. [28] also revealed that the susceptibility of sand increases with earthquakes of magnitude 7.5 to 8.0.
2 Epicentral distance
Soil liquefaction usually occurs in the epicentral area of earthquakes and also varies with epicentral distance. Papadopoulos [29] proposed an empirical relationship between the maximum epicentral distance and the magnitude of the earthquake in the liquefaction case, as the distance limit of the soil liquefaction site was predicted based on regional or worldwide data.
3 Duration of earthquake
Previous earthquake records, such as the Empire Valley in 1979, Armenia in 1988, Loma Prieta in 1989, Northridge in 1994, and Kobe in 1995, indicate that the relationship between duration and magnitude is quite uncertain, and factors other than magnitude also affect duration [30]. In the case of reciprocating seismic loads, the liquefaction potential is more likely to occur, and the longer the duration, the higher the pore water pressure that accumulates [13]. Several methods of soil liquefaction assessment consider that the duration of an earthquake is usually proportional to the magnitude of the earthquake.
4 Peak ground acceleration
Peak ground acceleration is used to classify the intensity of ground motion. The preferred method for estimating peak ground acceleration is the empirical correlation between peak ground acceleration and earthquake magnitude, seismic energy source, and local site conditions. Several correlations have been published to estimate peak ground acceleration for sites on bedrock or rigid to medium-stiffness soils [30]. A preliminary attenuation relationship has also been developed for a limited range of soft soil sites [31]. S. Tesfamariam and Z. Liu [26] considered the Stark and Olson [27] earthquake liquefaction datasets and concluded that the probability of soil liquefaction increases with an increase in the peak ground acceleration value. When the peak ground acceleration is 0.23 g or more, the soil liquefaction susceptibility increases, and consequently, the soil liquefaction susceptibility decrease with peak ground acceleration below 0.15 g. The existing liquefaction assessment methods were used to back-calculate the magnitude and peak ground accelerations which produced the liquefaction that occurred in the Charleston earthquake and the results suggest that the ground motions of the earthquake were significantly less than those currently proposed by the seismological community [32].
5 Fines content
The soil liquefaction strength may also vary with the fines content. Numerous studies concluded that anti-liquefaction of soil susceptibility is greatly affected by fines content [33,34,35]. As fines content exceeds 30%, soil liquefaction potential increases. However, when the fines content exceeds 50%, the soil liquefaction potential decreases [36]. In addition, the fines content value determines the soil type.
6 Soil type
Liquefaction susceptibility also depends on the type of soil. The coefficient of uniformity (Cu) and coefficient of curvature (Cc) are generally used to explain the grain size composition. Kishida [37] concluded that the uniformity coefficient may also play an important role in controlling soil liquefaction resistance, i.e., the higher the uniformity coefficient, the greater the soil liquefaction resistance will be. In addition, according to the performance of the site during the Niigata earthquake, Ohsaki [38] preliminary stated that if the value of Cu is lesser, the soil liquefaction resistance is worse. According to statistical data, when the Cu value is greater than 10, the soil is less likely to become liquefied [13].
7 Mean particle size
In the case of larger average size particle (D50), the likelihood of soil liquefaction is lower because excess pore water pressure of soil is less likely to accumulate in larger particle gaps. Hakam [39] analyzed the data from [40] and concluded that the average particle size of 78% of liquefaction cases was between 0.1125 and 0.3375 mm. Liquefaction history demonstrates that soil liquefaction is related to the average particle size (D50) of the soil. A large number of experiments were carried out on sand samples of varying particle size in well graded and gap graded distributions and showed that soil liquefaction had greater and less resistance to monotonic loads, respectively [41].
8 Relative density
Liquefaction resistance of soil increases with relative density. Hakam [39] used tri-axial equipment in the laboratory for a number of liquefaction tests and the results showed that soil with relatively high density had a large cyclic stress ratio (CSR), indicating resistance to soil liquefaction. The conclusion can be made from the results of the laboratory tests and the history of the field cases indicating that the initial void ratio or the relative density of a particular soil is one of the most important factors controlling soil liquefaction. The limit of relative density beyond which liquefaction will not occur is about 0.75 [42].
9 Drainage condition
The better soil drainage conditions are, the less likely soil liquefaction is. In addition, if the drainage conditions of the overlying soil are also good, the water in the sand layer can easily drain from the overlaying soil, and thus excessive pore water pressure is less likely to accumulate. The slight drainage during cyclic shear applications significantly affects the rate of accumulation of pore water pressure [43].
10 Degree of consolidation
The degree of consolidation plays a significant role in soil liquefaction. If the degree of consolidation is greater, the cohesion between the soil particles is stronger than the accumulation of the excess pore water pressure, and the soil requires more pore water pressure for liquefaction to occur. Korhan Adalier and Ahmed Elgamal [44] conducted a centrifuge test to investigate the effect of over-consolidation on liquefaction in clean, saturated sand. Test data indicates that the likelihood of liquefaction decreases with increasing consolidation ratio (OCR), relative density, and prior shaking.
11 Standard penetration test blow counts
Standard penetration test has been employed as a convenient factor to express the resistance of sandy soils to liquefaction. There is a fairly well-defined relation in which standard penetration test blow counts for the liquefied soils decreases with either an increase in fines content or a decrease in mean particle size [45].
12 Effective vertical stress
A proper assessment of the soil effective stress state is critical in many cases to identify a potential geotechnical hazard. Preliminary validation of a novel method for the assessment of effective stress state in partially saturated soils was proposed by Lo Presti et al. in 2018 based on the interpretation of piezocone tests [46]. Loose soils are more susceptible to liquefaction than dense soils under the same effective stress. At the same density, soil under high effective stress is more susceptible to liquefaction than soil under low effective stress. S. Tesfamariam and Z. Liu [26] considered the Stark and Olson [27] earthquake liquefaction datasets and, intuitively, with a decrease in effective vertical stress, (σ́v) the likelihood of soil liquefaction increases.
13 Groundwater table
A rise in the groundwater level weakens the soil’s resistance to liquefaction. When the groundwater level rises from 2 m, the impact on soil liquefaction potential is greater [47]. The design criteria against seismic soil liquefaction must be in minimizing the modification of the water table regime [48].
14 Depth of soil deposition
The depth of soil deposition is closely related to the effective vertical stress. If the depth of soil deposition is greater, the effective vertical stress is greater. Increased vertical stress is known to increase the soil’s bearing capacity and shear strength, thereby reducing the likelihood of soil liquefaction. Florin and Ivanov [49] concluded that even liquefaction from very loose sand is almost impossible for over 15 m of overburden, and the same soil depth was also concluded by Satyam [50] for the preliminary assessment of the soil liquefaction potential in a seismically active region.
15 Thickness of soil layer
Acacio et al. [51] analyzed the city of Dagupan after the 1990 Luzon event and revealed that the observed damage to the building was very small or absent in the presence of a sufficiently thick un-liquefied surface layer; especially in the case where the thickness exceeded 3 m. According to a survey conducted by the Japanese Society of Civil Engineers, when the thickness of the soil layer-sand exceeds 3 m, liquefaction should only occur with larger earthquake magnitude. However, when the thickness is between 1.0 m and 3.0 m, the soil is susceptible to liquefaction.
The hierarchy structure in the present study of the significant seismic soil liquefaction susceptibility factors is shown in Figure 2.

3. Methodology

First, an interpretive structural model was developed, resulting in a strong concept of the relationships of the different soil liquefaction factors. Next, MICMAC analysis was used to determine indirect relations between the seismic soil liquefaction factors.

3.1. Interpretive Structural Modeling (ISM)

In this section, the step-by-step process for developing the ISM model is described. Sushil [17] described the steps involved in the current research ISM methodology (see Figure 3) is as follows:

3.1.1. Identification of Factors

Seismic soil liquefaction significant factors are identified by using a SLR approach [14,15] and examined by field experts who approved the preliminary list of seismic soil liquefaction factors.

3.1.2. Structural Self-Interaction Matrix (SSIM)

The contextual relationship between each pair of factors was established according to domain knowledge, representing whether or not one factor leads to another. Four symbols are used to determine the relationship between two factors (i and j):
  • V: means factor i leads to factor j (factor i will influence factor j).
  • A: means factor j leads to factor i (factor i will be influenced by factor j).
  • X: represents a bidirectional relationship (factors i and j will influence each other).
  • O: no relation between the factors.

3.1.3. Reachability Matrix

SSIM is converted to a binary matrix, called the initial reachability matrix, by replacing with 1 or 0 as per rules for transformation (see Table 2).
After obtaining the initial reachability matrix, the property of transitivity must be checked to obtain the final reachability matrix. This means that if (i, j) = 1 and (j, k) = 1, then (i, k) = 1.

3.1.4. Level Partitions

The reachability and antecedent sets of factors are developed from the final reachability matrix.
The “reachability set” for a particular factor includes the factor itself and other factors it might help to achieve, and the “antecedent set” consists of the factor itself and other factors that may help in achieving it. Subsequently, the intersection of these sets is derived for all factors. The factor for which the reachability and the intersection sets are the same is given as a first level. Then, this factor is separated out from the other factors for the next level-iteration process. The same level-iteration process is repeated until all level of each factor are established.

3.1.5. Diagraph

According to the levels of each factor and the final reachability matrix, an initial model of ISM, with regard to the transitivity, is drawn. Then, the final version of ISM is computed by removing the transitivity of nodes. The conceptual inconsistency of the model is tested and improved.

3.2. MICMAC Analysis

In MICMAC analysis, factors are divided into four clusters with respect to the driving power and dependence power. These clusters are: Cluster I: Autonomous Factors—factors that are relatively cut off from the system and have weak or no dependence on other factors; Cluster II: Dependent Factors—cluster II factors are primarily dependent of other factors; Cluster III: Linkage factors—the connecting factors that are unstable and most influence others; and Cluster IV: Independent Factors—these factors have weak influence from others factors and have to be paid maximum attention owing to the strong key factors.

4. Results and Discussion

4.1. Interpretive Structural Modeling

The set of liquefaction factors identified in Table 1 for soil liquefaction potential was used to develop the model which represented the correlation between fifteen soil liquefaction parameters. In the ISM model, the initial step was the development of the structure self-interaction matrix (SSIM) where the soil liquefaction factors of each pair were compared by the correlation criteria and four symbols V, A, X, or O were used (see Table 3). For example, relative density F8 (Dr) influences the standard penetration test blow counts, F11 (SPT N-value) so the symbol used is V. Depth of soil deposit F14 (Ds) influences the degree of consolidation, F10 (OCR) so the symbol used is A. Relative density F8 (Dr) and degree of consolidation, F10 (OCR) influence each other so the symbol used is X. Earthquake magnitude F1 (M) has no relation with the thickness of soil layer F15 (h) so the symbol used is O. SSIM is converted to a binary matrix called the initial reachability matrix by replacing the original symbols V, A, X, and O with 1 or 0 (Table A1) as per the rule illustrated in methodology Section 3.1. When pair of the same factor, i.e., F1 (M) with F1 (M) is formed, it is represented by 1. The concept of transitivity is introduced in Table A1 when the initial reachability matrix has been obtained and is presented in final reachability matrix (Table A2), wherein entries marked * show the transitivity. For example, in Table A1, the initial reachability matrix shows that F15 (h) is interrelated to F8 (Dr), and F8 (Dr) is interrelated to F11 (SPT N-value), then the interaction F15 (h) and F11 (SPT N-value) having 0 value is transformed into 1* in Table A2. The reachability sets are determined from the factor itself and other factors which have influence in the horizontal direction, while the antecedent sets consist of the factor itself and other factors which have influence in the vertical direction for each significant soil liquefaction factor. For example, in the case of F1 (M) in the final reachability matrix (Table A2), the reachability set will be all factors with values of 1 or 1* in the row intersections with F1 (M): F1 (M), F3 (t), F4 (amax), and F16 (LP). The antecedent set will be all factors with values of 1 or 1* in the column intersections with F1 (M): F1 (M) only. When the intersection set and reachability set appear in the same intersection and reachability columns, then the corresponding soil liquefaction factors are confirmed at a level (e.g., F16 (LP) as level 1) and the soil liquefaction factors in that level are separated out, e.g., F16 (LP) from the other factors for the next level-iteration process.
The same level-iteration process is repeated until the level of each seismic soil liquefaction factor is established. Level partitioning of the soil liquefaction factors is accomplished in six iterations and shown in Table A3, Table A4, Table A5, Table A6, Table A7 and Table A8 (Appendix B). The ISM model is developed on the level partitions basis from Table A3, Table A4, Table A5, Table A6, Table A7 and Table A8. Each seismic soil liquefaction factor is positioned as per the consequent level and the relationships of the soil liquefaction factors are fixed from the bottom (level 6) to the top of the model (level 1). The multilevel hierarchy model developed with identified relations between the significant factors of seismic soil liquefaction potential (LP) is shown in Figure 4.
The seismic soil liquefaction factors are connected by arrows from the bottom of the model (higher-level) to the top of model (lower-level). Seismic soil liquefaction factors on top of the Figure 4 are greatly influenced by the interconnection of left-over factors. It is evident from the ISM model that the most significant factor that triggers soil liquefaction is soil type, F6 (Cu and Cc) at level 6, which forms the base of the ISM hierarchy and has high driving power and low dependence power, whereas duration of earthquake F3 (t), peak ground acceleration F4 (amax), drainage condition F9 (K), and standard penetration test blow counts (SPT N-value) in the second level directly influence liquefaction potential. The other soil liquefaction susceptibility factors are groundwater table F13 (Dw), fines content F5 (Fc), and depth of soil deposit F14 (Ds) at level 5, mean particle size F7 (D50), effective vertical stress F12 (σ́v) and thickness of the soil layer F15 (h) at level 4, Earthquake magnitude F1 (M), Epicentral distance F2 (S), relative density F8 (Dr), and Degree of consolidation F10 (OCR) at level 3, as per the outcomes of the hierarchical ISM model and are classified as indirect factors that affect soil liquefaction.

4.2. MICMAC Analysis—Classification of Seismic Soil Liquefaction Factors

MICMAC is used to examine the strength of the relationship between driving power and dependence power of seismic soil liquefaction factors. The soil liquefaction factors have been categorized into four clusters based on their driving and dependence power, as shown in Figure 5 (see Table A2 in Appendix A).
The four clusters of soil liquefaction factors are:
◾ Cluster I: Autonomous factors
Cluster I represents autonomous factors and consists of soil liquefaction factors which have weak driving and dependence power. This cluster has ten seismic soil liquefaction factors (62.5%). Cluster I factors are relatively disconnected from the system. Autonomous factors in cluster I are earthquake magnitude F1 (M), epicentral distance F2 (S), duration of earthquake F3 (t), peak ground acceleration F4 (amax), fines content F5 (Fc), mean particle size F7 (D50), effective vertical stress F12 (σ́v), groundwater table F13 (Dw), depth of soil deposit F14 (Ds), and thickness of soil layer F15 (h).
◾ Cluster II: Dependence factors
Dependence factors have a strong dependence power and weak driving power. This dependence cluster has five seismic soil liquefaction factors (31.25%), including relative density F8 (Dr), drainage condition F9 (K), degree of consolidation F10 (OCR), standard penetration test blow counts F11 (SPT N-value), and liquefaction potential F16 (LP). In the ISM model, these factors form the top levels which need other soil liquefaction factors that collectively act to influence soil liquefaction.
◾ Cluster III: Linkage factors
Linkage factors have a strong driving power as well as strong dependence power. No factors fell in this cluster.
◾ Cluster IV: Independent/Driving factors
Cluster IV consists of driving factors that have strong driving power but weak dependence power. In this cluster, only one seismic soil liquefaction factor (around 6.25%), i.e., soil type F6 (Cu and Cc), was found, which plays a governing role in soil liquefaction susceptibility.

5. Conclusions

In this paper, fifteen significant factors for seismic soil liquefaction potential (LP) were identified with the systematic literature review approach, including earthquake magnitude F1 (M), epicentral distance F2 (S), duration of earthquake F3 (t), peak ground acceleration F4 (amax), fines content F5 (Fc), soil type F6 (Cu and Cc), mean particle size F7 (D50), relative density F8 (Dr), drainage condition F9 (K), degree of consolidation F10 (OCR), standard penetration test blow counts F11 (SPT N-value), effective vertical stress F12 (σ́v), groundwater table F13 (Dw), depth of soil deposit F14 (Ds), and thickness of soil layer F15 (h). These factors are compared pairwise to create the data for structural analysis by using interpretative structural modeling (ISM) and MICMAC analysis. Seismic soil liquefaction is a complex problem and contains many factors, whereas structural analysis allows a precise way of selecting significant factors for establishment of soil liquefaction potential and liquefaction-induced hazards risk assessment models. Since seismic soil liquefaction is influenced by various factors, considering all these factors in soil liquefaction evaluation will be extremely complex as even few seismic soil liquefaction factors are not simple to deal with. Two important characteristics of seismic soil liquefaction factors were illustrated in this paper. First, the levels of the seismic soil liquefaction significant factors were determined by the ISM model. In the ISM model, the seismic soil liquefaction factors of duration of earthquake F3 (t), peak ground acceleration F4 (amax), drainage condition F9 (K), and standard penetration test blow counts F11 (SPT N-value) influenced soil liquefaction directly and were located at level 5 (top level) in the interpretive structural model, meaning they require additional seismic soil liquefaction factors to collaboratively impact on soil liquefaction potential. The multilevel hierarchy revealed that soil type F6 (Cu and Cc) is the most governing factor that triggers soil liquefaction. Driving power was the second characteristic of soil liquefaction factors. Factors with higher driving power should receive extra attention. Autonomous soil liquefaction factors have weak dependence on other soil liquefaction factors and have less interaction. The model developed in this study clearly illustrates the complex relationships between factors and demonstrates the direct and indirect relationships in order to identify the key significant factors that influence soil liquefaction susceptibility. Our results can provide guidelines for the selection of factors and establishment of models for risk evaluation of soil liquefaction.
In the future, based on ISM, a quantitative method such as Bayesian Belief Network (BBN) will be utilized to establish the seismic soil liquefaction potential and liquefaction-induced hazards risk assessment. CPT tip resistance can also be used as an alternative to SPT N-value in the future to establish Bayesian Belief Networks (BBN) models for seismic soil liquefaction potential and liquefaction-induced hazards risk assessment according to the soil liquefaction CPT historic data.

Author Contributions

This paper received the individual contribution of each author as specified: X.-W.T., M.A. and J.-N.Q. conceived of and designed the research; M.A. developed the research, led data collection and analysis, and wrote the paper. F.A. prepared the figures and made corrections to improve the paper. All authors read the full paper and agreed with its publication.

Funding

The work presented in this paper was part of the research sponsored by the National Key Research and Development Plan of China under Grant No. 2018YFC1505305 and 2016YFE0200100 and Key Program of National Natural Science Foundation of China under Grant No. 51639002.

Acknowledgments

The authors would like to thank Ji-Lei Hu, Wu-Gang Li, and Xue Zhijia for experts’ opinions. We also gratefully acknowledge the anonymous reviewers for their valuable comments and suggestions to improve the quality of the paper.

Conflicts of Interest

The authors declare no conflict of interest.

Appendix A

Table A1. Initial reachability matrix.
Factors (Fi)F1 (M)F2 (S)F3 (t)F4 (amax)F5 (Fc)F6 (Cu and Cc)F7 (D50)F8 (Dr)F9 (K)F10 (OCR)F11 (SPT N-Value)F12 (σ́v)F13 (Dw)F14 (Ds)F15 (h)F16 (LP)
F1 (M)1011000000000001
F2 (S)0111000000000001
F3 (t)0010000000000001
F4 (amax)0001000000000001
F5 (Fc)0000101111100001
F6 (Cu and Cc)0001111111110001
F7 (D50)0000001111100001
F8 (Dr)0000000111100001
F9 (K)0000000010000001
F10 (OCR)0000000111100001
F11 (SPT N-value)0000000000100001
F12 (σ́v)0000000101110001
F13 (Dw)0000000111111001
F14 (Ds)0000000111110101
F15 (h)0000000111000011
F16 (LP)0000000000000001
Table A2. Final reachability matrix.
Factors (Fi)F1 (M)F2 (S)F3 (t)F4 (amax)F5 (Fc)F6 (Cu and Cc)F7 (D50)F8 (Dr)F9 (K)F10 (OCR)F11 (SPT N-Value)F12 (σ́v)F13 (Dw)F14 (Ds)F15 (h)F16 (LP)Driving PowerRank
F1 (M)10110000000000014I
F2 (S)01110000000000014I
F3 (t)00100000000000012II
F4 (amax)00010000000000012II
F5 (Fc)00001011111000017III
F6 (Cu and Cc)000111111111000110IV
F7 (D50)00000011111000016V
F8 (Dr)00000001111000015VI
F9 (K)00000000100000012II
F10 (OCR)00000001111000015VI
F11 (SPT N-value)00000000001000012II
F12 (σ́v)000000011*11100016V
F13 (Dw)00000001111110017III
F14 (Ds)00000001111101017III
F15 (h)00000001111*000116V
F16 (LP)00000000000000011VII
Dependence power113421391091041111676/76
RankIIIIVIIIIVIIIIVIVIVVIVIIIIIIIIIIVII/VII
Note: 1* indicates the values after applying transitivity.

Appendix B

Table A3. Level partition—Iteration 1.
Factors (Fi)Reachability Set R(Fi)Antecedent Set A(Fi)Intersection Set R(Fi) ∩ A(Fi)Level
F1 (M)1,3,4,1611
F2 (S)2,3,4,1622
F3 (t)3,161,2,33
F4 (amax)4,161,2,4,64
F5 (Fc)5,7,8,9,10,11,165,65
F6 (Cu and Cc)4,5,6,7,8,9,10,11,12,1666
F7 (D50)7,8,9,10,11,165,6,77
F8 (Dr)8,9,10,11,165,6,7,8,10,12,13,14,158,10
F9 (K)9,165,6,7,8,9,10,12,13,14,159
F10 (OCR)8,9,10,11,165,6,7,8,10,12,13,14,158,10
F11 (SPT N-value)11,165,6,7,8,10,11,12,13,14,1511
F12 (σ́v)8,9,10,11,12,166,12,13,1412
F13 (Dw)8,9,10,11,12,13,161313
F14 (Ds)8,9,10,11,12,14,161414
F15 (h)8,9,10,11,15,161515
F16 (LP)161,2,3,4,5,6,7,8,9,10,11,12,13,14,15,1616L1
Table A4. Level partition—Iteration 2.
Factors (Fi)Reachability Set R(Fi)Antecedent Set A(Fi)Intersection Set R(Fi) ∩ A(Fi)Level
F1 (M)1,3,411
F2 (S)2,3,422
F3 (t)31,2,33L2
F4 (amax)41,2,4,64L2
F5 (Fc)5,7,8,9,10,115,65
F6 (Cu and Cc)4,5,6,7,8,9,10,11,1266
F7 (D50)7,8,9,10,115,6,77
F8 (Dr)8,9,10,115,6,7,8,10,12,13,14,158,10
F9 (K)95,6,7,8,9,10,12,13,14,159L2
F10 (OCR)8,9,10,115,6,7,8,10,12,13,14,158,10
F11 (SPT N-value)115,6,7,8,10,11,12,13,14,1511L2
F12 (σ́v)8,9,10,11,126,12,13,1412
F13 (Dw)8,9,10,11,12,131313
F14 (Ds)8,9,10,11,12,141414
F15 (h)8,9,10,11,151515
Table A5. Level partition—Iteration 3.
Factors (Fi)Reachability Set R(Fi)Antecedent Set A(Fi)Intersection Set R(Fi) ∩ A(Fi)Level
F1 (M)111L3
F2 (S)222L3
F5 (Fc)5,7,8,105,65
F6 (Cu and Cc)5,6,7,8,10,1266
F7 (D50)7,8,105,6,77
F8 (Dr)8,105,6,7,8,10,12,13,14,158,10L3
F10 (OCR)8,105,6,7,8,10,12,13,14,158,10L3
F12 (σ́v)8,10,126,12,13,1412
F13 (Dw)8,10,12,131313
F14 (Ds)8,10,12,141414
F15 (h)8,10,151515
Table A6. Level partition—Iteration 4.
Factors (Fi)Reachability Set R(Fi)Antecedent Set A(Fi)Intersection Set R(Fi) ∩ A(Fi)Level
F5 (Fc)5,75,65
F6 (Cu and Cc)5,6,7,1266
F7 (D50)75,6,77L4
F12 (σ́v)126,12,13,1412L4
F13 (Dw)12,131313
F14 (Ds)12,141414
F15 (h)151515L4
Table A7. Level partition—Iteration 5.
Factors (Fi)Reachability Set R(Fi)Antecedent Set A(Fi)Intersection Set R(Fi) ∩ A(Fi)Level
F5 (Fc)55,65L5
F6 (Cu and Cc)5,666
F13 (Dw)131313L5
F14 (Ds)141414L5
Table A8. Level partition—Iteration 6.
Factors (Fі)Reachability Set R(Fі)Antecedent Set A(Fi)Intersection Set R(Fi) ∩ A(Fi)Level
F6 (Cu and Cc)666L6

References

  1. Marcuson, W.F. Definitions of Terms Related to Liquefaction. J. Geotech. Eng. Div. 1978, 104, 1197–1200. [Google Scholar]
  2. Boulanger, R.W.; Idriss, I.M. CPT-Based Liquefaction Triggering Procedure. J. Geotech. Geoenviron. Eng. 2016, 142, 04015065. [Google Scholar] [CrossRef]
  3. Boulanger, R.W.; Idriss, I.M. CPT and SPT Based Liquefaction Triggering; Report No. UCD/CGM-14/01; Center for Geotechnical Modeling, Department of Civil and Environmental Engineering, University of California Davis: Davis, CA, USA, 2014. [Google Scholar]
  4. Vaid, Y.P.; Sivathayalan, S. Fundamental Factors Affecting Liquefaction Susceptibility of Sands. Can. Geotech. J. 2000, 37, 592–606. [Google Scholar] [CrossRef]
  5. Zhang, L.Y. Predicting Seismic Liquefaction Potentialof Sands by Optimum Seeking Method. Soil Dyn. Earthq. Eng. 1998, 17, 219–226. [Google Scholar] [CrossRef]
  6. Baziara, M.H.; Nilipour, N. Evaluation of Liquefaction Potential Using Neural-Networks and CPT Results. Soil Dyn. Earthq. Eng. 2003, 23, 631–636. [Google Scholar] [CrossRef]
  7. Samui, P.; Kim, D.; Sitharam, T.G. Support Vector Machine for Evaluating Seismic-Liquefaction Potential Using Shear Wave Velocity. J. Appl. Geophys. 2011, 73, 8–15. [Google Scholar] [CrossRef]
  8. Bagheripour, M.H.; Shooshpasha, I.; Afzalirad, A. A Genetic Algorithm Approach for Assessing Soil Liquefaction Potential Based on Reliability Method. J. Earth Syst. Sci. 2012, 121, 45–62. [Google Scholar] [CrossRef]
  9. Xue, X.H.; Yang, X.G. Seismic Liquefaction Potential Assessed by Fuzzy Comprehensive Evaluation Method. Nat. Hazards 2014, 71, 2101–2112. [Google Scholar] [CrossRef]
  10. Dalvi, A.N.; Pathak, S.R.; Rajhans, N.R. Entropy Analysis for Identifying Significant Parameters for Seismic Soil Liquefaction. Geomech. Geoeng. 2014, 9, 1–8. [Google Scholar] [CrossRef]
  11. Sheng, J.; Yuan, X.M.; Wang, Y.M.; Liu, H.S. Influence Factor Weights Analysis of Rock and Soil Earthquake Damages: A Case Study from Sand Liquefaction. J. Nat. Disasters 2012, 21, 76–82. [Google Scholar]
  12. Zhu, S. Statistical Analysis of Factors Causing Liquefaction of Sand during Tangshan Earthquake. Seismol. Geol. 1980, 2, 79–80. [Google Scholar]
  13. Tang, X.; Hu, J.; Qiu, J. Identifying Significant Influence Factors of Seismic Soil Liquefaction and Analyzing Their Structural Relationship. KSCE J. Civ. Eng. 2016, 20, 2655–2663. [Google Scholar] [CrossRef]
  14. Okoli, C.; Schabram, K. A Guide to Conducting a Systematic Literature Review of Information Systems Research. Sprouts: Working Papers on Information Systems. 2010, Volume 10. Available online: http://sprouts.aisnet.org/10-26 (accessed on 11 November 2018).
  15. Tranfield, D.; Denyer, D.; Smart, P. Towards a Methodology for Developing Evidence-Informed Management Knowledge by Means of Systematic Review. Br. J. Manag. 2003, 14, 207–222. [Google Scholar] [CrossRef] [Green Version]
  16. Olsen, S.A. Interpretive Structural Modeling. In Group Planning and Problem Solving Methods in Engineering Management; John Wiley and Sons, Inc.: New York, NY, USA, 1982. [Google Scholar]
  17. Sushil, S. Interpreting the Interpretive Structural Model. Glob. J. Flex. Syst. Manag. 2012, 13, 87–106. [Google Scholar] [CrossRef]
  18. Chandramowli, S.; Transue, M.; Felder, F. Analysis of Barriers to Development in Landfill Communities Using Interpretive Structural Modeling. Habitat Int. 2011, 35, 246–253. [Google Scholar] [CrossRef]
  19. Saxena, J.P.; Vrat, P. Impact of Indirect Relationships in Classification of Variables—A MICMAC Analysis for Energy Conservation. Syst. Res. 1990, 7, 245–253. [Google Scholar] [CrossRef]
  20. Dubey, R.; Ali, S. Identification of Flexible Manufacturing System Dimensions and Their Interrelationship Using Total Interpretive Structural Modelling and Fuzzy MICMAC Analysis. Glob. J. Flex. Syst. Manag. 2014, 15, 131–143. [Google Scholar] [CrossRef]
  21. Fink, A. Conducting Research Literature Reviews: From the Internet to Paper, 2nd ed.; Sage Publications: Thousand Oaks, CA, USA, 2005. [Google Scholar]
  22. Kitchenham, B.; Charters, S. Guidelines for Performing Systematic Literature Reviews in Software Engineering; Technical Report No. EBSE-2007-01; Evidence-Based Software Engineering; Keele University: Keele, UK, 2007. [Google Scholar]
  23. Seed, H.B.; Idriss, I.M. Ground Motions and Soil Liquefaction during Earthquakes; Earthquake Engineering Research Institute, Monograph: Oakland, CA, USA, 1982. [Google Scholar]
  24. Green, R.; Bommer, J. Smallest Earthquake Magnitude That Can Trigger Liquefaction; CGPR # 92; Virginia Tech Center for Geotechnical Practice and Research 200 Patton Hall Blacksburg: Blacksburg, VA, USA, 2018. [Google Scholar]
  25. Boulanger, R.W.; Idriss, I.M. Magnitude scaling factors in liquefaction triggering procedures. Soil Dyn. Earthq. Eng. 2015, 79, 296–303. [Google Scholar] [CrossRef] [Green Version]
  26. Tesfamariam, S.; Liu, Z. Seismic Risk Analysis Using Bayesian Belief Networks. In Handbook of Seismic Risk Analysis; Woodhead Publishing Limited: Sawston, UK, 2013; pp. 175–208. [Google Scholar] [CrossRef]
  27. Stark, T.D.; Olson, S. Liquefaction Resistance using CPT and Field Case Histories. ASCE J. Geotech. Eng. 1995, 121, 856–869. [Google Scholar] [CrossRef]
  28. Ahmad, M.; Tang, X.-W.; Ahmad, F.; Jamal, A. Assessment of Soil Liquefaction Potential in Kamra, Pakistan. Sustainability 2018, 10, 4223. [Google Scholar] [CrossRef]
  29. Papadopoulos, G.A.; Lefkopoulos, G. Magnitude-Distance Relations for Liquefaction in Soil from Earthquakes. Bull. Seismol. Soc. Am. 1993, 83, 925–938. [Google Scholar]
  30. Youd, B.T.L.; Idriss, I.M. Liquefaction Resistance of Soils: Summary Report from the 1996 NCEER and 1998 NCEER/NSF Workshops on Evaluation. J. Geotech. Geoenviron. Eng. 2001, 127, 817–833. [Google Scholar] [CrossRef]
  31. Idriss, I.M. Earthquake Ground Motions at Soft Soil Sites. In Proceedings of the 2nd International Conference on Recent Advances in Geotechnical Earthquake Engineering and Soil Dynamics, Rolla, MO, USA, 11–15 March 1991; pp. 2265–2271. [Google Scholar]
  32. Martin, J.R.; Clough, G.W. Seismic parameters from liquefaction evidence. J. Geotech. Eng. 1994, 120, 1345–1361. [Google Scholar] [CrossRef]
  33. Monkul, M.M. On some of the factors influencing the fines’ role on liquefaction of silty sands. In GeoCongress 2012: State of the Art and Practice in Geotechnical Engineering; ASCE: Oakland, CA, USA, 2012; pp. 799–808. [Google Scholar] [CrossRef]
  34. Park, S.S.; Kim, Y.S. Liquefaction resistance of sands containing plastic fines with different plasticity. J. Geotech. Geoenviron. Eng. 2013, 139, 825–830. [Google Scholar] [CrossRef]
  35. Ni, S.H.; Fan, E.S. Fines content effects on liquefaction potential evaluation for sites liquefied during Chi-Chi earthquake, 1999. J. Chin. Inst. Eng. 2002, 25, 533–542. [Google Scholar] [CrossRef]
  36. Tang, X.W.; Bai, X.; Hu, J.L.; Qiu, J.N. Assessment of Liquefaction-Induced Hazards Using Bayesian Networks Based on Standard Penetration Test Data. Nat. Hazards Earth Syst. Sci. 2018, 18, 1451–1468. [Google Scholar] [CrossRef]
  37. Kishida, H. Charactersitics of Liquefied Sands during Mino-Owari, Tohnankai and Fukui Earthquakes. Soils Found. 1969, 9, 75–92. [Google Scholar] [CrossRef]
  38. Ohsaki, Y. Effects of Sand Compaction on Liquefaction during Tokachioki Earthquake. Soils Found. 1970, 10, 112–128. [Google Scholar] [CrossRef]
  39. Hakam, A. Laboratory Liquefaction Test of Sand Based on Grain Size and Relative Density. J. Eng. Technol. Sci. 2016, 48, 334–344. [Google Scholar] [CrossRef] [Green Version]
  40. Cetin, K.O.; Seed, R.B.; Moss, R.E.S.; Der, K.A.; Tokimatsu, K.; Harder, L.F., Jr.; Kayen, R.E. Field Case Histories for SPT-Based In Situ Liquefaction Potential Evaluation; Geotechnical Engineering Research Report No. UCB/GT-2000109; Department of Civil and Environmental Engineering, California University: Berkeley, CA, USA, 2000. [Google Scholar]
  41. Igwe, O.; Sassa, K.; Fukuoka, H. Liquefaction Potential of Granular Materials Using Differently Graded Sandy Soils. In Annuals of Disaster Prevention Research Institute, Kyoto University, No. 47 B; Kyoto University: Kyoto, Japan, 2004. [Google Scholar]
  42. Geotechnical Design Procedure, Liquefaction Potential of Cohesionless Soils; DP-9, Revision#2; Department of Transportation, Geotechnical Engineering Bureau: New York, NY, USA, 2007.
  43. Umehara, Y.; Zen, K.; Hamada, K. Evaluation of Soil Liquefaction Potentials in Partially Drained Conditions. Soils Found. 1985, 25, 57–72. [Google Scholar] [CrossRef]
  44. Adalier, K.; Elgamal, A. Liquefaction of over-Consolidated Sand: A Centrifuge Investigation. J. Earthq. Eng. 2005, 9, 127–150. [Google Scholar] [CrossRef]
  45. Kohji, T.; Yoshiaki, Y. Emprical Correlation of Soil Liquefaction Based on SPT N-Value and Fines Content. Soils Found. 1983, 23, 56–74. [Google Scholar]
  46. Lo Presti, D.; Stacul, S.; Meisina, C.; Bordoni, M.; Bittelli, M. Preliminary Validation of a Novel Method for the Assessment of Effective Stress State in Partially Saturated Soils by Cone Penetration Tests. Geosciences 2018, 8, 30. [Google Scholar] [CrossRef]
  47. Hannich, D.; Hoetzl, H.; Ehret, D. Liquefaction Probability in Bucharest and Influencing Factors. In Proceedings of the International Symposium on Strong Vrancea Earthquake and Risk Mitigation, Bucharest, Romania, 4–6 October 2007; pp. 205–222. [Google Scholar]
  48. Fioravante, V.; Giretti, D.; Abate, G.; Aversa, S.; Boldini, D.; Capilleri, P.P.; Cavallaro, A.; Chamlagain, D.; Crespellani, T.; Dezi, F.; et al. Earthquake Geotechnical Engineering Aspects: The 2012 Emilia Romagna Earthquake (Italy). In Proceedings of the 7th International Conference on Case Histories in Geotechnical Engineering, Wheeling, IL, USA, 29 April–4 May 2013; pp. 1–34. [Google Scholar]
  49. Florin, V.A.; Ivanov, P.L. Liquefaction of Saturated Sandy Soils. In Proceedings of the 5th International Conference on Soil Mechanics and Foundation Engineering, Paris, France, 17–22 July 1961; pp. 291–311. [Google Scholar]
  50. Satyam, N. Review on liquefaction hazard assessment. In Advances in Geotechnical Earthquake Engineering—Soil Liquefaction and Seismic Safety of Dams and Monuments; Moustafa, A., Ed.; InTech: Hyderabad, India, 2012; pp. 63–82. ISBN 978-953-51-0025-6. [Google Scholar]
  51. Acacio, A.; Kobayashi, Y.; Towhata, I.; Bautista, R.T.; Ishihara, K. Subsidence of Building Foundation Resting upon Liquefied Subsoil: Case Studies and Assessment. Soils Found. 2001, 41, 111–128. [Google Scholar] [CrossRef]
Figure 1. A systematic literature review guide [14].
Applsci 09 00233 g001
Figure 2. Hierarchy structure for significant factors of seismic soil liquefaction.
Applsci 09 00233 g002
Figure 3. Interpretive structural modeling (ISM) methodology for analyzing soil liquefaction factors.
Applsci 09 00233 g003
Figure 4. Model depicting the relationships between soil liquefaction factors based on ISM.
Applsci 09 00233 g004
Figure 5. Cross-impact matrix multiplication applied to classification (MICMAC) analysis of soil liquefaction factors.
Applsci 09 00233 g005
Table 1. List of significant factors identified from literature review.
Factors (Fi) CodeSignificant FactorsSource(s)
F1Earthquake magnitude, (M)[13,24,25,26,27,28]
F2Epicentral distance, (S)[29]
F3Duration of earthquake, (t)[13,30]
F4Peak ground acceleration, (amax)[26,27,30,31,32]
F5Fines content, (Fc)[33,34,35,36]
F6Soil type, (Cu and Cc)[13,37,38]
F7Mean particle size, (D50)[39,40,41]
F8Relative density, (Dr)[39,42]
F9Drainage condition, (K)[43]
F10Degree of consolidation, (OCR)[44]
F11Standard penetration test blow counts, (SPT N-value)[45]
F12Effective vertical stress, (σ́v)[26,27,46]
F13Groundwater table, (Dw)[47,48]
F14Depth of soil deposit, (Ds)[49,50]
F15Thickness of soil layer, (h)[51]
Table 2. Rules for transformation.
If the (i, j) Entry in the SSIM IsEntry in the Initial Reachability Matrix
(i, j)(j, i)
V10
A01
X11
O00
Table 3. Structural self-interaction matrix for soil liquefaction factors.
F1 (M)F2 (S)F3 (t)F4 (amax)F5 (Fc)F6 (Cu and Cc)F7 (D50)F8 (Dr)F9 (K)F10 (OCR)F11 (SPT N-Value)F12 (σ́v)F13 (Dw)F14 (Ds)F15 (h)F16 (LP)No
OVVOOOOOOOOOOOVF1 (M)
VVOOOOOOOOOOOVF2 (S)
OOOOOOOOOOOOVF3 (t)
OAOOOOOOOOOVF4 (amax)
AVVVVVOOOOVF5 (Fc)
VVVVVVOOOVF6 (Cu and Cc)
VVVVOOOOVF7 (D50)
VXVAAAAVF8 (Dr)
AOOAAAVF9 (K)
VAAAAVF10 (OCR)
AAAOVF11 (SPT N-value)
AAOVF12 (σ́v)
OOVF13 (Dw)
OVF14 (Ds)
VF15 (h)
F16 (LP)
V denotes that the row factor influences the column factor. A denotes that the column factor influences the row factor. X denotes that the row factor and column factor influence each other. O denotes that there is no relationship between the row factor and column factor.

