Article

A Systematic Performance History Analysis of a Chlor-Alkali Membrane Electrolyser under Industrial Operating Conditions

1
LEPABE, Chemical Engineering Dpt., Faculdade de Engenharia da Universidade do Porto, 4200-465 Porto, Portugal
2
Bondalti Chemicals, 3860-680 Estarreja, Portugal
3
LAQV-REQUIMTE, Chemistry Dpt., Faculdade de Ciências e Tecnologia, Universidade Nova de Lisboa, 2829-516 Caparica, Portugal
*
Author to whom correspondence should be addressed.
Submission received: 20 December 2018 / Revised: 13 January 2019 / Accepted: 14 January 2019 / Published: 15 January 2019
(This article belongs to the Special Issue Electro-membrane Processes for Clean Water and Sustainable Energy)

Abstract

:
The history of the potential and electrical current evolution of an industrial chlor-alkali membrane electrolyser is a powerful tool to track its operational efficiency progress over time and for deciding the required maintenance instants. For this reason, the performance of a dedicated industrial NaCl electrolyser was systematically analysed as a function of its service time for about 8 years, recording the cell potential versus current density. The documented potential values were normalized taking into account the initial current density, which allowed to reduce data scattering due to small fluctuations of the current density values. The ohmic overpotential contribution, associated to the ion-exchange membranes, showed an average relative error smaller than 3% and the activation overpotential, related to the electrodes’ performance, displayed an average relative error of 6%. Thus, the proposed approach enables rigorous assessing of the performance of industrial chlor-alkali membrane electrolysers for adequate scheduling of their maintenance, which leads to significant operational and economic improvements of the chlor-alkali process.

1. Introduction

Chlorine gas is an important chemical commodity in the modern industry, mainly produced via electrolysis of a concentrated aqueous solution of sodium chloride, which demands high-energy consumption. In 2016, the European chlorine production represented nearly 9.7 million tons and the membrane electrolyser technology corresponded to ca. 64% of the chlorine production capacity [1]. It should be stressed that the electrolysis units installed during the last decades are almost exclusively based on membrane technology, which is considered the best available technique in the chlor-alkali industry. Membrane technology presents numerous advantages over older technologies, such as higher energy efficiency, lower environmental impact and higher purity of the produced caustic soda that the mercury-based method. Developments in the membrane and electrodes fields are further driving this process to improved energy efficiency levels [2].
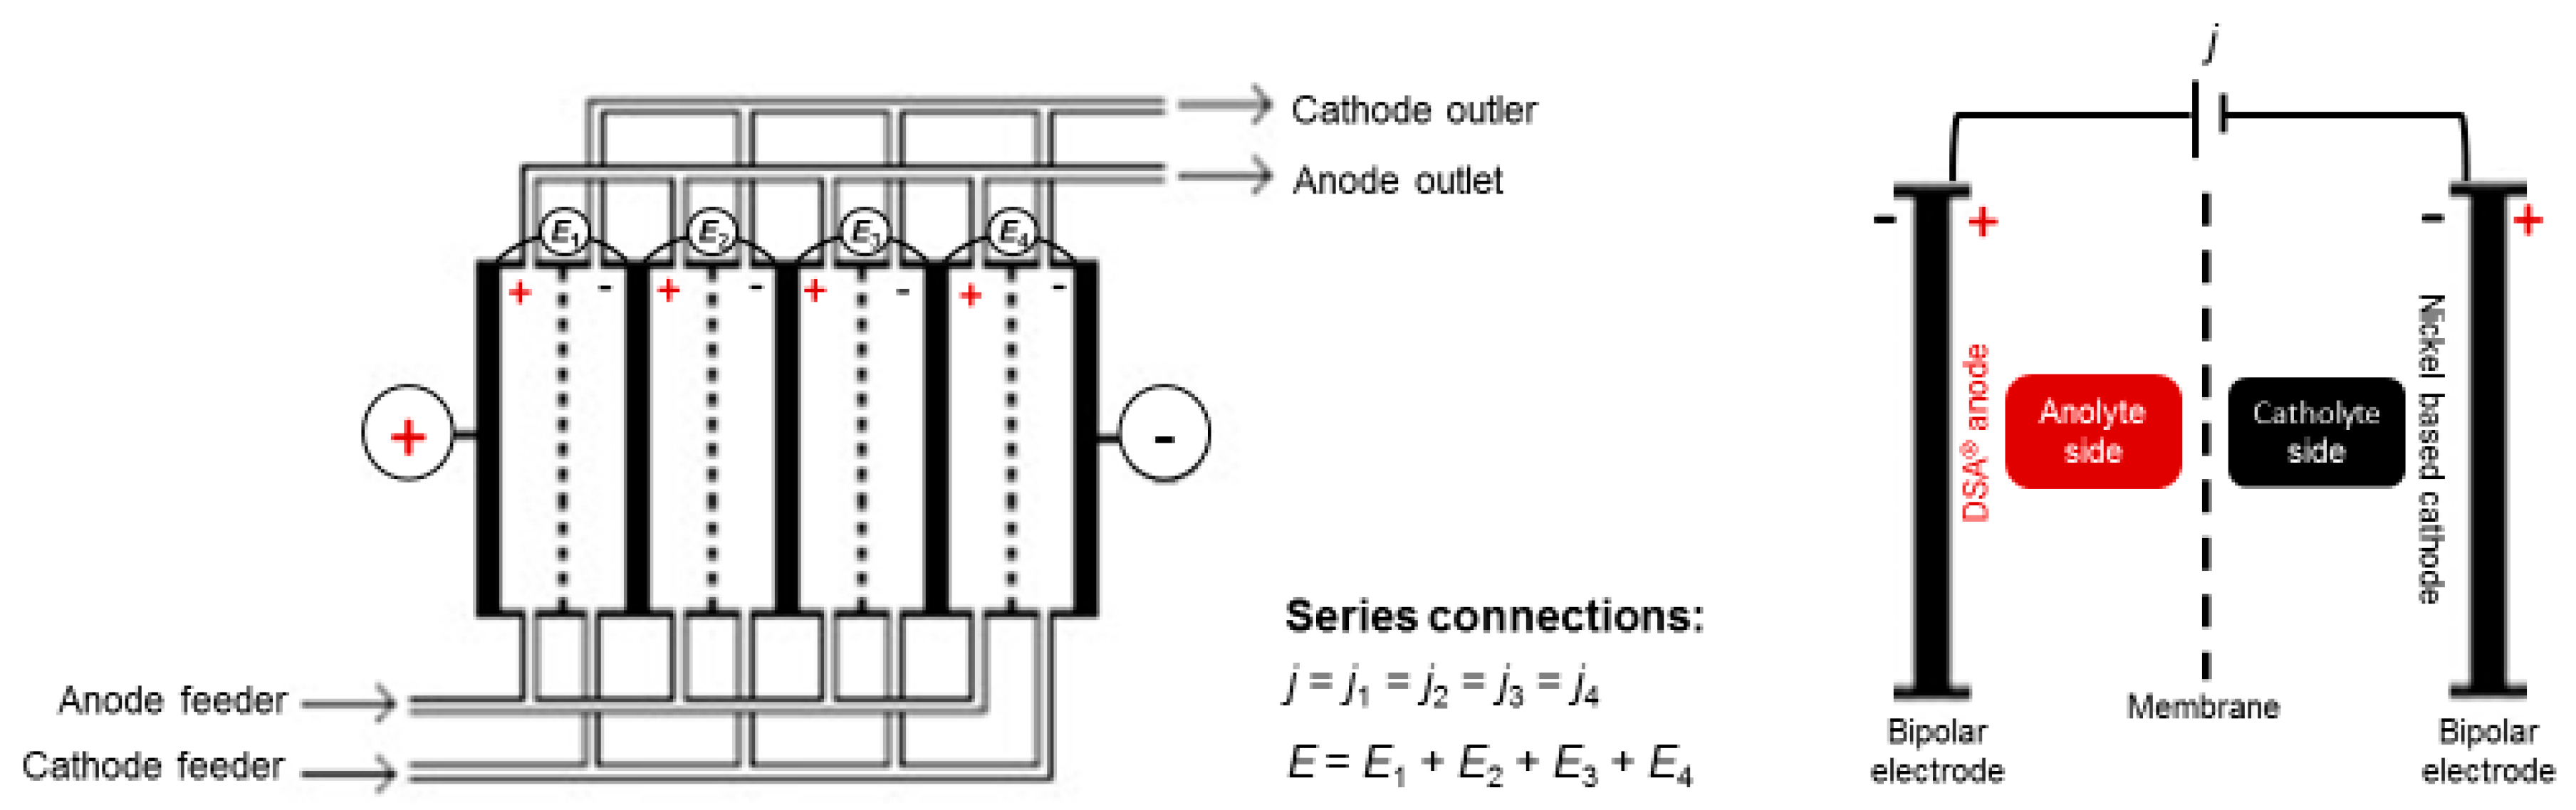
A membrane electrolyser module consists in a set of single cells. In the case study, considered in the present work, the investigated membrane electrolyser was connected in parallel and its membrane cell elements were disposed in series electrolyser in a stack arrangement, where the electrodes have two different coating surfaces corresponding to the anode and to the cathode, respectively. This configuration is the most common in the modern chlor-alkali industry, therefore it is the one considered in this study [3].
Its three major components are: a cation-exchange membrane, a dimensionally stable anode (DSA®) and a nickel-based cathode. At the anode, chloride oxidation to chlorine occurs releasing electrons to the cathode half-reaction, where hydrogen and hydroxyl ions are produced from the water reduction; the sodium ions migrate across the membrane to the cathode compartment and combine with the hydroxyl ions produced at the cathode, thus originating sodium hydroxide [4]. The thermodynamic redox potential for the operating conditions applied (temperature and composition) is 2.23 V [5], corresponding to a value of 2.19 V at 25 °C.
2 NaCl ( aq )   +   2 H 2 O ( l ) Cl 2 ( g ) + H 2 ( g ) + 2 NaOH ( aq )
The growth of the electromembrane processes and the availability of the selective and stable ionically conductive materials has opened a very promising field for the chlor-alkali industry [2]. Nowadays, the bilayer cation-exchange membrane is usually made of perfluorinated sulfonated materials with a low ohmic resistance and high sodium selectivity. The membrane configuration allows the movement of Na+ cations and water molecules while preventing the back migration of Cl and OH anions, even under high current densities and ionic concentration gradients [6]. The membrane is made by a thick layer of tetrafluoroethylene functionalized with sulfonic acid groups at the anode side and a thinner layer of tetrafluoroethylene functionalized with carboxylic groups facing the cathode side. The sulfonic functionalized layer assures proton conductivity, while the carboxylic functionalized layer plays a major role for electrostatic repulsion of OH anions. The electrodes should be in a close contact with the cation-exchange membrane, to minimize the ohmic overpotentials on the electrolyte phase. A reduced spacing between the electrode and the membrane allows also for reducing the mass transport overpotential related to the removal of the gaseous products from the inter electrode phase [2].
As for the electrodes, the development of dimensionally stable anodes, DSA®, contributed to energy savings in the chlorine industry due to their low activation overpotentials and stability [7,8,9]. DSA® anodes were developed and commercialized back in the 1970’s; they are made of a mixture of ruthenium and titanium oxides applied on a titanium substrate. Ruthenium oxides have excellent electrocatalytic properties, but other transition metal oxides are also used to increase the coating stability during the chlorine evolution reaction, of which iridium oxides present the best mechanical properties [7,8]. Therefore, nowadays, the composition of the electrodes used in industrial chlor-alkali processes is based on TiO2-RuO2-IrO2 applied on a Ti-support [10]. Traditionally, the ruthenium-titanium based oxides exhibit chlorine overpotentials between 40 and 60 mV, for current densities of 0.20–0.25 kA·m−2 with 5 M NaCl solutions and temperatures of around 85 °C. However, after a prolonged operation, the electrocatalytic activity decreases and the anode overpotential can reach 300–400 mV at the final stage with an exponential evolution, a point, at which the anode is considered ‘deactivated’ [10].
Previous research works showed that the anode deactivation contributes significantly to increasing the electricity consumption. The deactivation mechanisms of the electrodes are dependent on the operating conditions, where pH of the brine and the electrolysis temperature are the most important parameters [11,12,13]. One of the best practices in the chlor-alkali industry is an anolyte acidification that helps to reduce the oxygen content in the cell gas products. The pH of the brine is most commonly lowered by adding HCl for neutralizing the back-migrated OH into the anolyte, which leads to the formation of oxygen at the anode [12,13].
The main anodic reaction is the chlorine evolution reaction, CER, which requires a thermodynamic potential of 1.36 V at 25 °C vs. SHE (Standard Hydrogen Electrode) [6].
2 Cl ( aq ) Cl 2 ( g ) + 2 e
In addition to the chlorine evolution, the undesired oxygen evolution, mainly by water oxidation:
2 H 2 O ( l ) 4 H + ( aq ) + O 2 ( g ) + 2 e
in which the electrode potential is 1.23 V vs. SHE at 25 °C [6] also occurs, especially outside the optimum process operational pH “window” of 2 to 4 [12]. This reaction is thermodynamically favourable, but the DSA® electrode strongly favours the CER. Industrially, the ratio of the chloride ions in the anolyte inlet to the total amount of electric current used by the anode, so-called anodic current efficiency, is monitored to assess the relevance of parasitic reactions as water oxidation. Typically, DSA® anodes have an anodic current efficiency between 95% and 97% [14].
Carbon steel electrodes were first used in diaphragm cells for the hydrogen evolution reaction, HER, at the cathode compartment. In the 1990s, after the successful commercialization of ion-exchange membrane-based cells, cathodes with new compositions (such as nickel or nickel with ruthenium oxide coated, so-called Raney nickel cathodes, Ni-Al) and greater surface areas became available and displaying higher corrosion stability and catalytic activity for the HER. In the chlor-alkali typical operating conditions, nickel is a competitive material, because it combines a good electrocatalytic activity with stability under alkaline conditions and supports higher temperatures (up to ca. 80 °C) [15]. Raney nickel cathodes exhibit an overpotential up to ca. 120 mV in the high current density region [6].
The cathode promotes the half-reaction of water decomposition to produce hydroxide ions and hydrogen and the associated thermodynamic potential is −0.83 V at 25 °C vs. SHE [6].
2 H 2 O ( l )   +   2 e H 2 ( g ) + 2 OH ( aq )
Consequently, sodium hydroxide is formed from the hydroxide and sodium ions. If hydroxide ions migrate into the anode side, in addition of losing cathodic product, it would combine with dissolved chlorine gas to produce hypochlorite ions, which is an unwanted side reaction:
Cl 2 ( g ) +   4   OH ( aq ) 2   ClO   ( aq ) + 2   H 2 O   ( l ) +   2 e
The energy efficiency of the chlor-alkali process depends on the overpotentials associated with each component, namely the membrane, the electrodes and the concentration polarization. The overall cell potential is the sum of cathode, anode, membrane, electrolyte and hardware [6]:
E = E therm +   η a + ( η c )   + (   R mem + R hw + R sol ) · j
where Etherm represents the redox thermodynamic potential for the operating conditions (temperature and composition), the ηact = ηa + (−ηc) represents the anodic and cathodic activation overpotentials. The membrane, hardware and electrolyte-related overpotentials can be calculated using the Ohm’s law, ηΩ = RΩ · j = (Rmem + Rhw + Rsol) · j [5]. However, Equation (6) does not consider the concentration overpotential term because the concentration of NaCl and NaOH in the anode and the cathode are high, therefore, the electrolyte resistance can be considered negligible.
Most of the maintenance of a membrane electrolyser is related to the membrane, which affects the ohmic resistance proportionally to the extent of the affecting area. A preventive maintenance strategy is usually followed based on the potential of the cell, replacing the membrane before electrolyte exchange between the cathode and anode compartments destroys the electrodes.
The DSA® activation overpotential grows exponentially at the final stage of its service time due to the deactivation of the electrode [10]. This overpotential increase is a result of the coating erosion, selective electrochemical dissolution of ruthenium, blockage of the active surface site due to insoluble species and the formation of an insulating TiO2 layer at the coating-substrate interface [10,16]. The overpotential associated with the cathode surface corrosion grows smoothly making possible, until a certain extent, to keep the current density by increasing the cell’s potential [11].
For the reasons given above the deactivation of the electrode, an excessive electrode service time contributes to increase of the energy operating costs of NaCl electrolysis. However, the recoating or replacing of the electrodes is very expensive due to the use of noble metal oxides on the electrode surface. Therefore, scheduling the maintenance instants of an electrolyser should be carefully made, balancing the increase of energy costs over time, based on the evolution of the potential as a function of time for a specific current density, and the obtained productivity with the replacement costs and the substantial catalyst losses increase that happens during the shutdowns and start-ups of the electrolyser [10]. Therefore, it is essential to have a rigorous criterion to decide when to perform the preventive maintenance of the electrodes and membranes. It should be emphasized, for instance, that the under current performance of a cell compromises the whole stack for cells associated in series.

2. Materials and Methods

Bondalti uses electrolyser modules with bipolar cell configuration. Each bipolar electrode has an effective area of around 3 m2 equipped with DSA® anodes and Raney nickel cathodes [6]. The performance history of one of the industrial bipolar electrolysers was recorded and analysed for eight years. A bipolar electrolyser is a stack of cells connected in series; the cathode of one cell is connected directly to the anode of the adjacent cell, receiving then the same electrical current—Figure 1. The potential was measured for each cell and used to assess the performance of the electrolyser.
During the period of analysis, the membranes of the electrolyser were replaced every four to five years of service time, whereas the electrodes were replaced or recoated after the eight years of operation. It was, therefore, decided to record the current density for the electrolyser and the potential of each cell every 15 min for ca. eight years.
The electrolyser was operated under mostly constant operating conditions, specifically the feed was always a 5 M NaCl aqueous solution, the temperature was ca. 85 °C and pH close to the membrane between 4 and 4.5 [17].

Model

The loss of energy efficiency in a chlor-alkali process is mostly related to the activation overpotentials and ohmic overpotentials associated with the membrane, hardware and electrolyte. At each electrode, the activation overpotential, ηact, is related to the electrochemical kinetics and affects the total current density, j, which according to the Butler Volmer equation, relates to the activation overpotential as follows [18]:
j = j 0 [ e ( α · n · F · η R · T ) e ( ( 1 α ) · n · F · η R · T ) ]
where η represents a potential loss due to activation, j0 is the exchange current density of the reaction, α is the transfer coefficient, n is the number of the electrons exchanged in the reaction, F is the Faraday constant, T is the absolute temperature and R is the gas constant. At high current densities, the second term in Equation (7) can be neglected and the overpotential is given by the Tafel equation [18]:
η = R · T α · n · F   ln j 0 + R · T α · n · F   ln j
Parameters α and j0 depend on the composition and pH of the electrolyte and on nature and surface characteristics of the coatings of the electrodes. The overpotential can, thus, be obtained by a linear regression:
η = b · ( ln j 0 +   ln j )
where the parameter b is called Tafel slope. Under Tafel conditions, normally for η > 50 mV [6], Equation (9) can be introduced into Equation (6):
E = [ E therm   ( b a · ln j 0 , a ) + ( b c · ln j 0 , c ) ] + [ ( b a   b c ) · ln j j + (   R mem + R hw + R sol ) ] · j
E as a function of j, as described by Equation (10), is not linear but experimentally it follows a mostly linear relationship over the current density range of 2 kA·m−2 to 5 kA·m−2, corresponding to the Tafel region. In this way, E vs. j values can be fitted using Equation (11), where k-factor corresponds to the slope of the E vs. j curve and E0 is the interception or the open circuit potential [6]:
E = E 0 + k · j
where:
E 0 = E therm ( b a · ln j 0 , a ) + ( b c · ln j 0 , c )
k = ( b a b c ) · ln j j + ( R mem + R hw + R sol )
This linear approach is usually called k-factor analysis. Since the overall ohmic resistance is normally dominant, it is usually considered that the k-factor depends mostly on the ohmic overpotential, where the membrane has the major contribution [6].
Blair [19] proposed to record the potential of small groups of cells connected in series and to compare it with a reference potential. An alarm would be activated, and the supply of energy to the cell disconnected, whenever the measured potential varies from the reference potential by more than a preset potential [19]. In a day to day operation, the imposed current density fluctuations result in a potential change. Consequently, it is important to remove these fluctuations from the overpotential analysis. Themblay [20] proposed an improvement to the previous approach by Blair correcting the real potential for a reference constant current density, according to the Equation (14).
E j , ref = E 0 + ( E E 0 ) · j ref j
where Ej,ref is the corrected potential for a reference current density (jref). Here, it is assumed again that the ohmic overpotentials dominate within the Tafel region.
This work aims at estimating the overpotentials related to the membrane and to the activation of the anode and the cathode. Therefore, the experimental values of E vs. j were analysed, removing the values outside of the Tafel region and calculating a monthly average for producing a pair of values per month. These values outside of the Tafel region are mostly related to shut-down and start-up occurrences; consequently, it was only considered the pair of values with a potential higher than 2.3 V and current densities of higher than 2 kA·m−2. Industrially, a set of cells or even the whole membrane electrolyser is normally considered for the potential versus current analysis. For this reason, E values considered are the average of all cells corrected for a reference current density value using Equation (14). In this equation, the reference current density was set to the average current density of the first operating month and E0 was obtained based on Equation (11), upon fitting to the experimental results for each month. Consequently, Equation (14) can thus be written for each operating month as:
E j i , 0 = E 0 + ( E E 0 ) · j i , 0 j
where E0 was estimated based on Equation (11) for each month of a membranes and electrodes set i, ji,0 is the average current density of the first operating month, and j is the average current density of the actual month. For each month, the corrected potential outlier values, Eji,0, were removed based on the “box-and-whisker” statistical analysis [21]. From Equation (15) fitting it becomes possible to associate the increase of the corrected potential to the activation and ohmic overpotentials:
η act = E 0 E therm
η Ω , i = ( E E 0 ) · j i , 0 j
where ηact′ is the activation overpotential for each set of electrodes operating month and ηΩ,I′ the ohmic overpotential associated for each set of membranes and electrodes i.

3. Results and Discussion

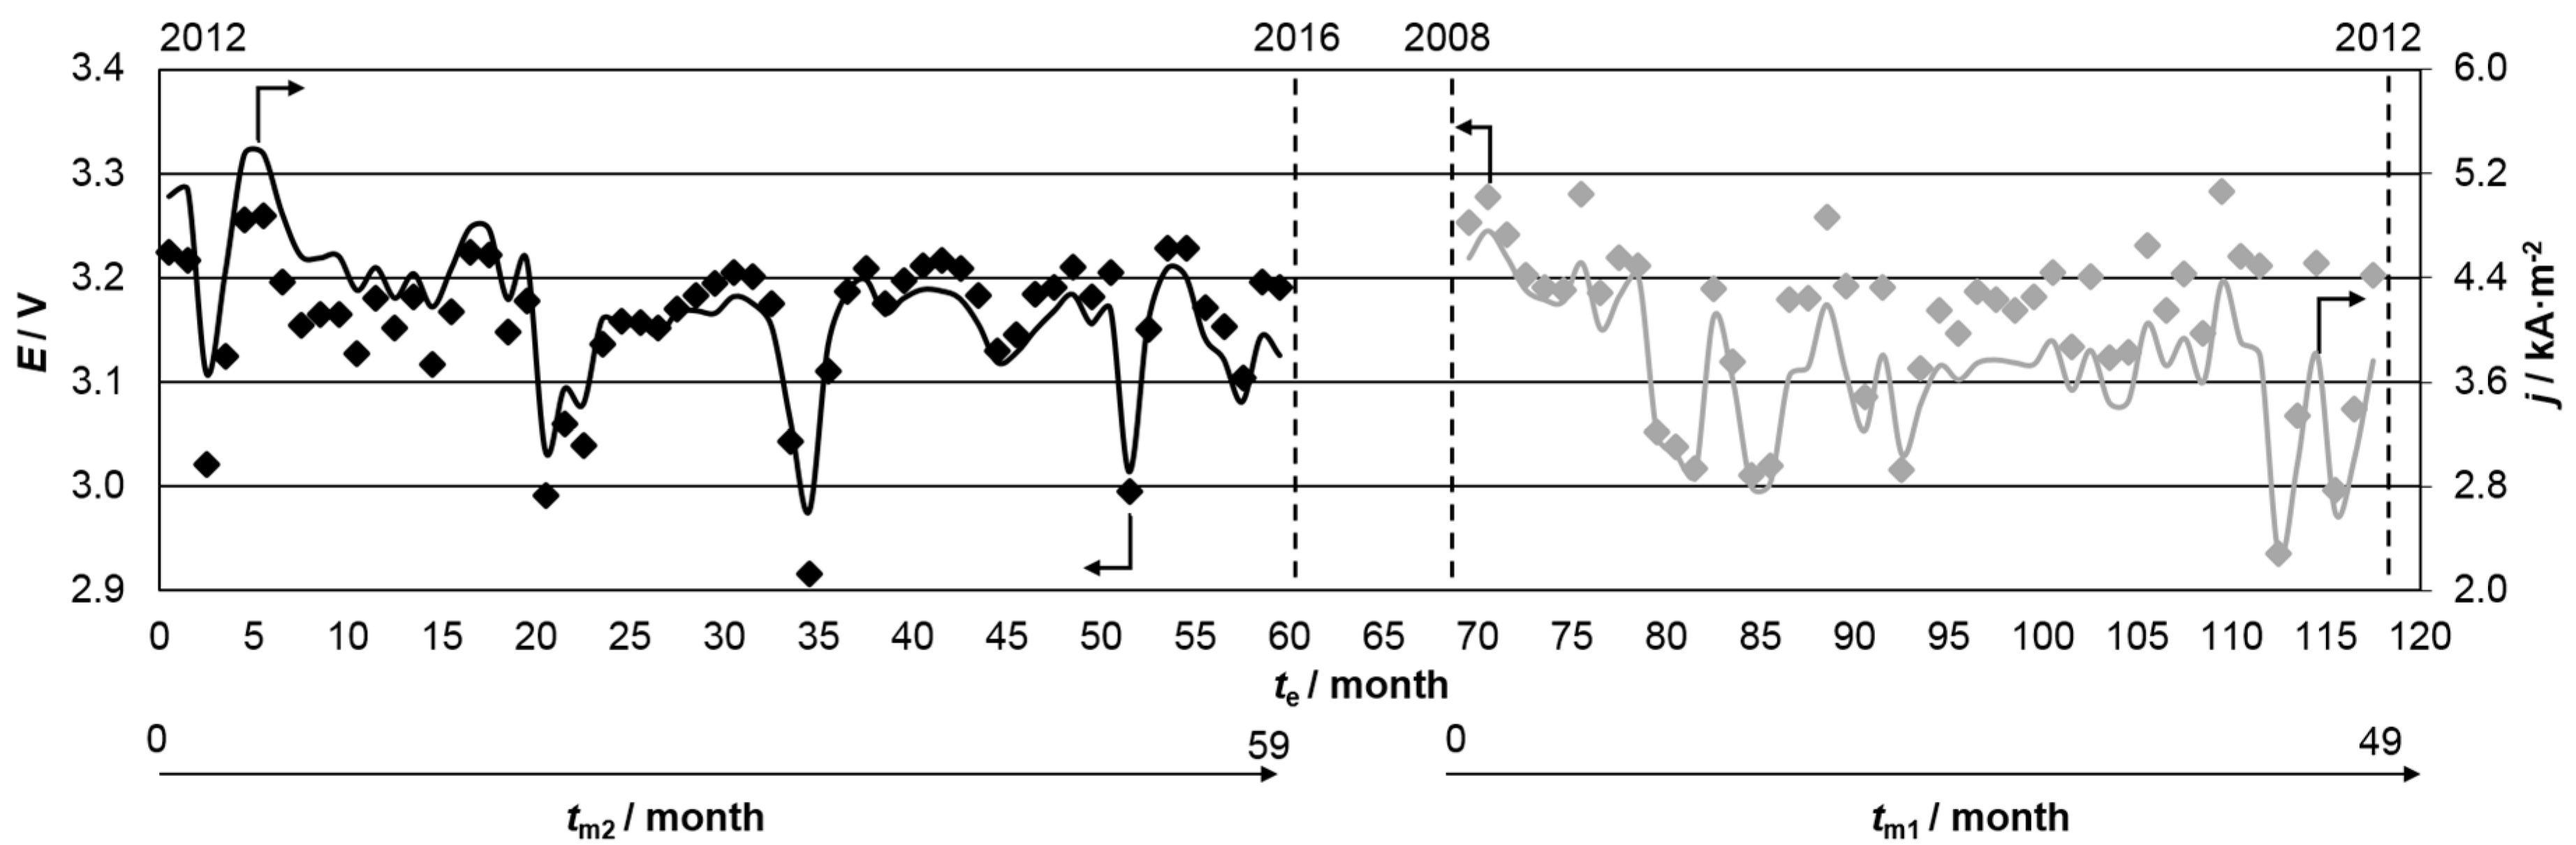
The monthly potential, E, and current density, j, histories of an industrial electrolyser between 2008 and 2016 are shown in Figure 2.
During the studied period, two sets of membranes and two sets of electrodes were inserted in the electrolyser. Chronologically, the data collection began in 2008, at the middle age of the electrodes (69 months) and with fresh membranes. At instant corresponding to an age equal to 117 months of the electrodes and equal to 48 months of the membranes, both electrodes and membranes were replaced and the time counting of the electrodes and membranes, respectively te and tmi, was reset to 0—cf. Figure 2. The first set of membranes was named #m1 and the second #m2; likewise, the first and second set of electrodes were named #e1 and #e2, respectively—cf. Figure 2. For each month in Figure 2, parameters E0 and k-factor were calculated by the Equation (11), which are plotted in
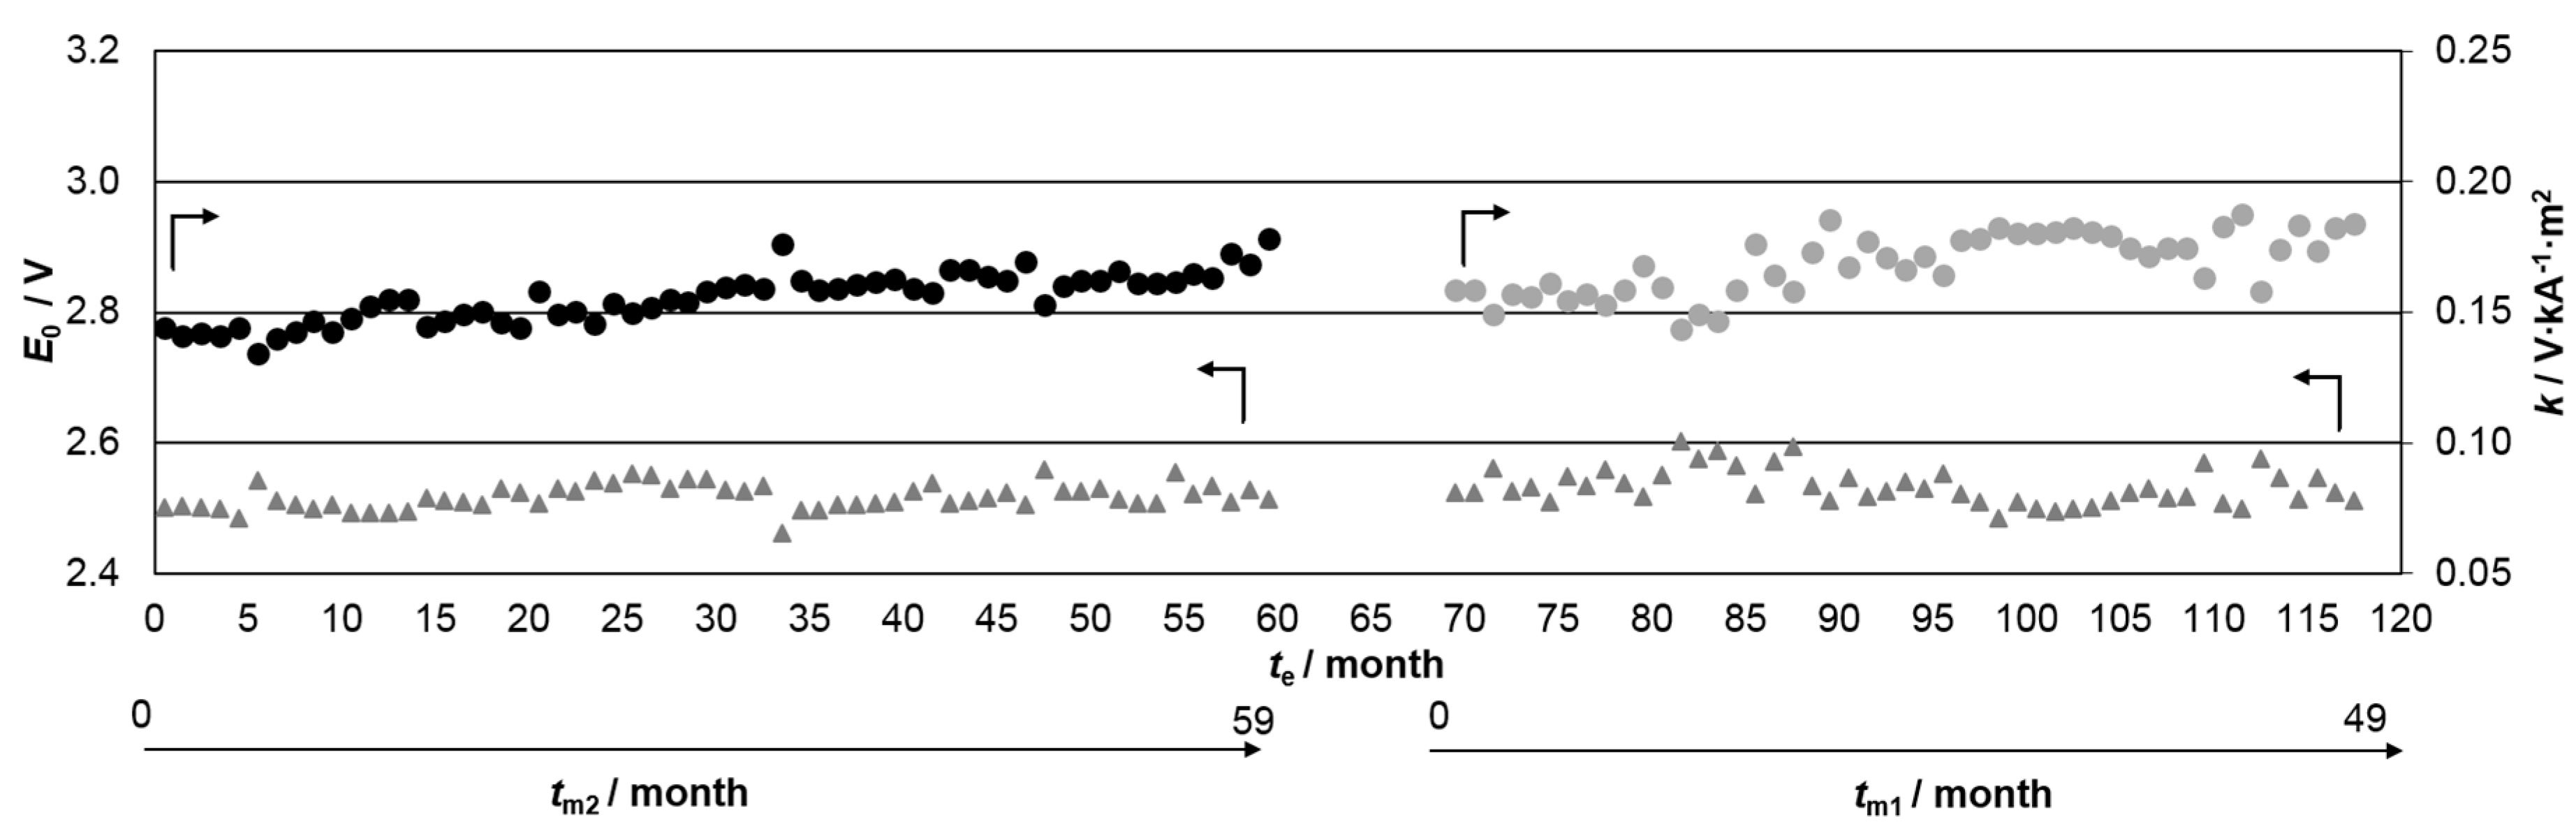
 Figure 3.
Typically, E0 takes a value between 2.20 and 2.60 V and k-factor between 0.05 and 0.15 V·kA−1·m2, when the membrane surface area is equal to 1.5 m2, according to good operating principals for the chlor-alkali industry [22]. For a membrane area of 5.4 m2, E0 should be between 2.40 and 2.80 V and the k-factor between 0.15 and 0.25 V·kA−1·m2. For the investigated bipolar membrane electrolyser, electrodes display a surface area around 3 m2. The first sets of electrodes and membranes (#e1 and #m1) display E0 values between 2.49 and 2.60 V and k-factor between 0.14 and 0.19 V·kA−1·m2—cf. Figure 3. After their replacement (corresponded to #e2 and #m2 period), E0 values are between 2.46 and 2.56 V and k-factor between 0.13 and 0.18 V·kA−1·m2—cf. Figure 3. These results are within the reported normal range of k-factor. In this period, the k-factor values are smaller, which indicates a smaller ohmic resistance related to the use of different type of membranes.
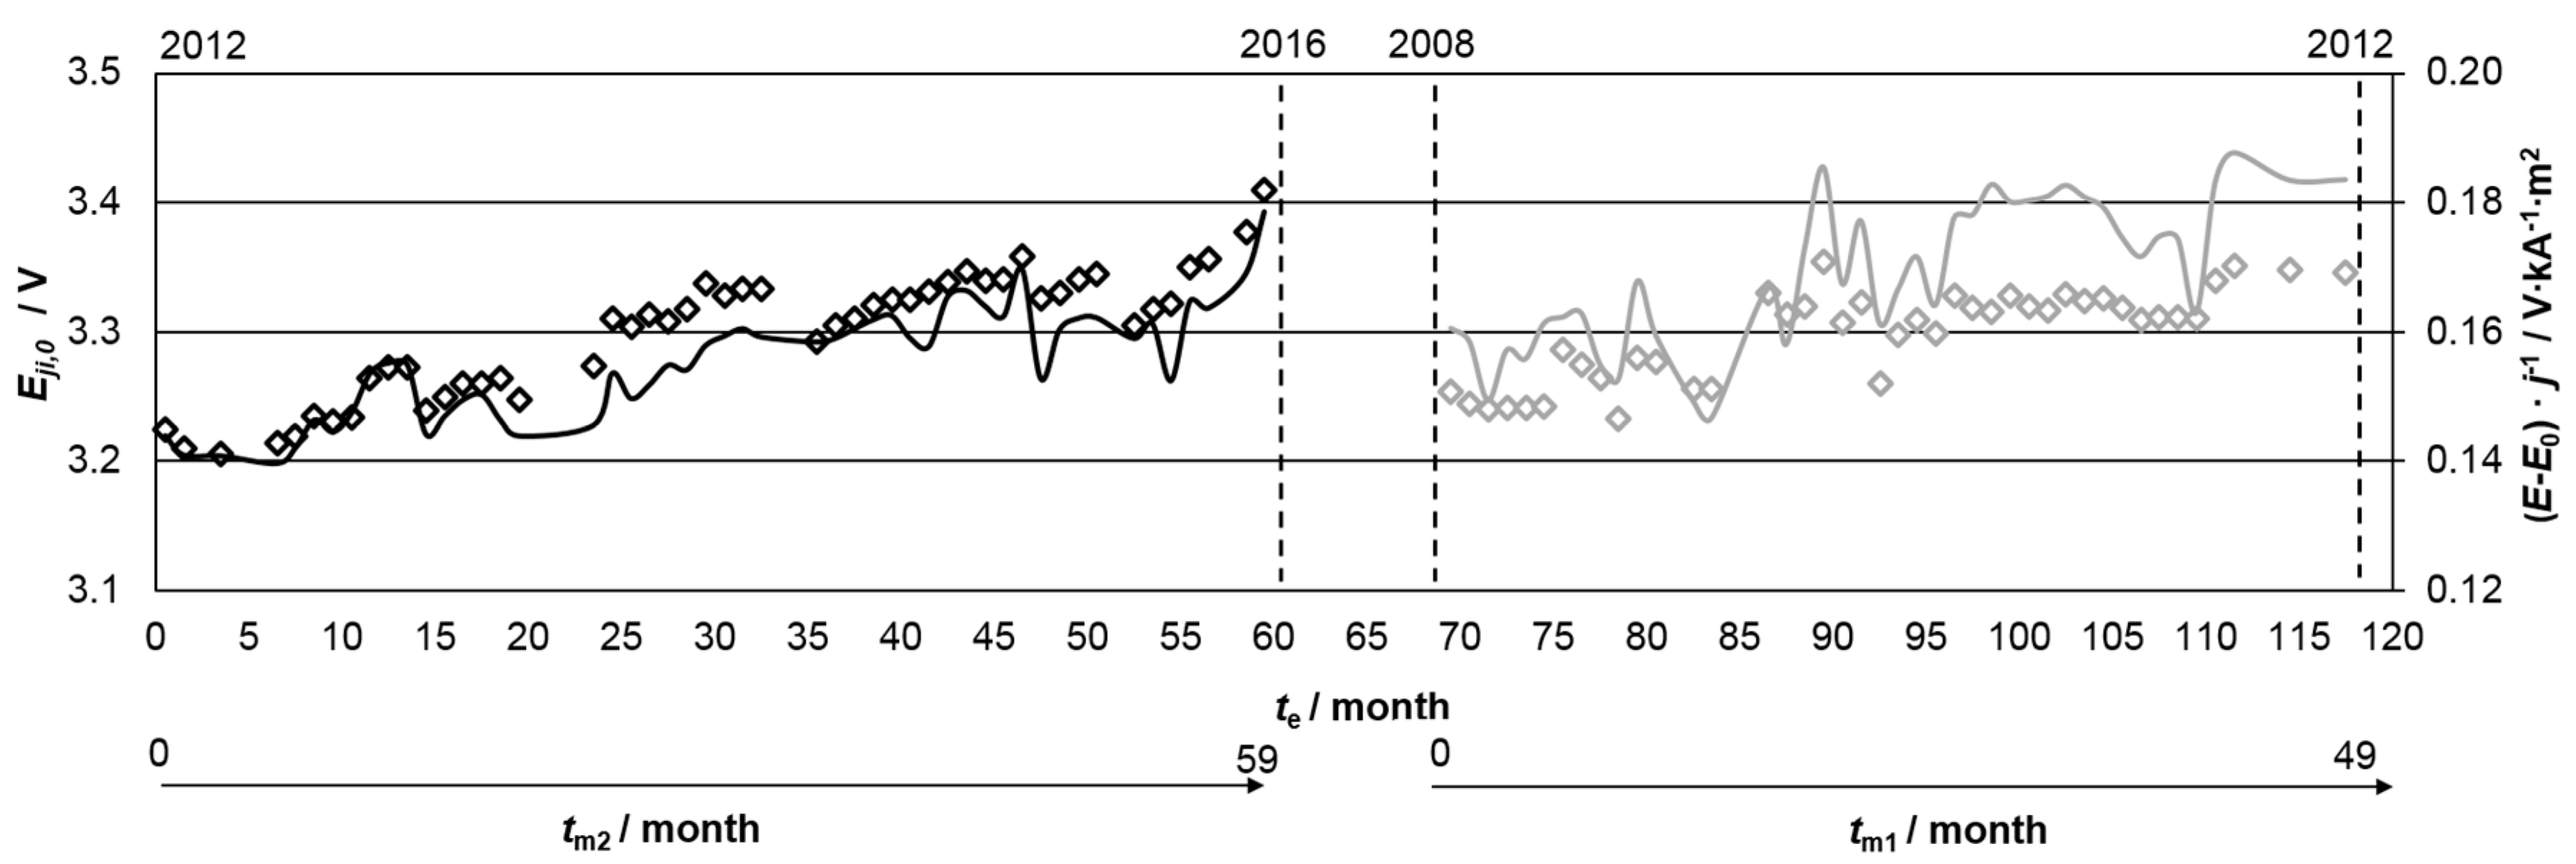
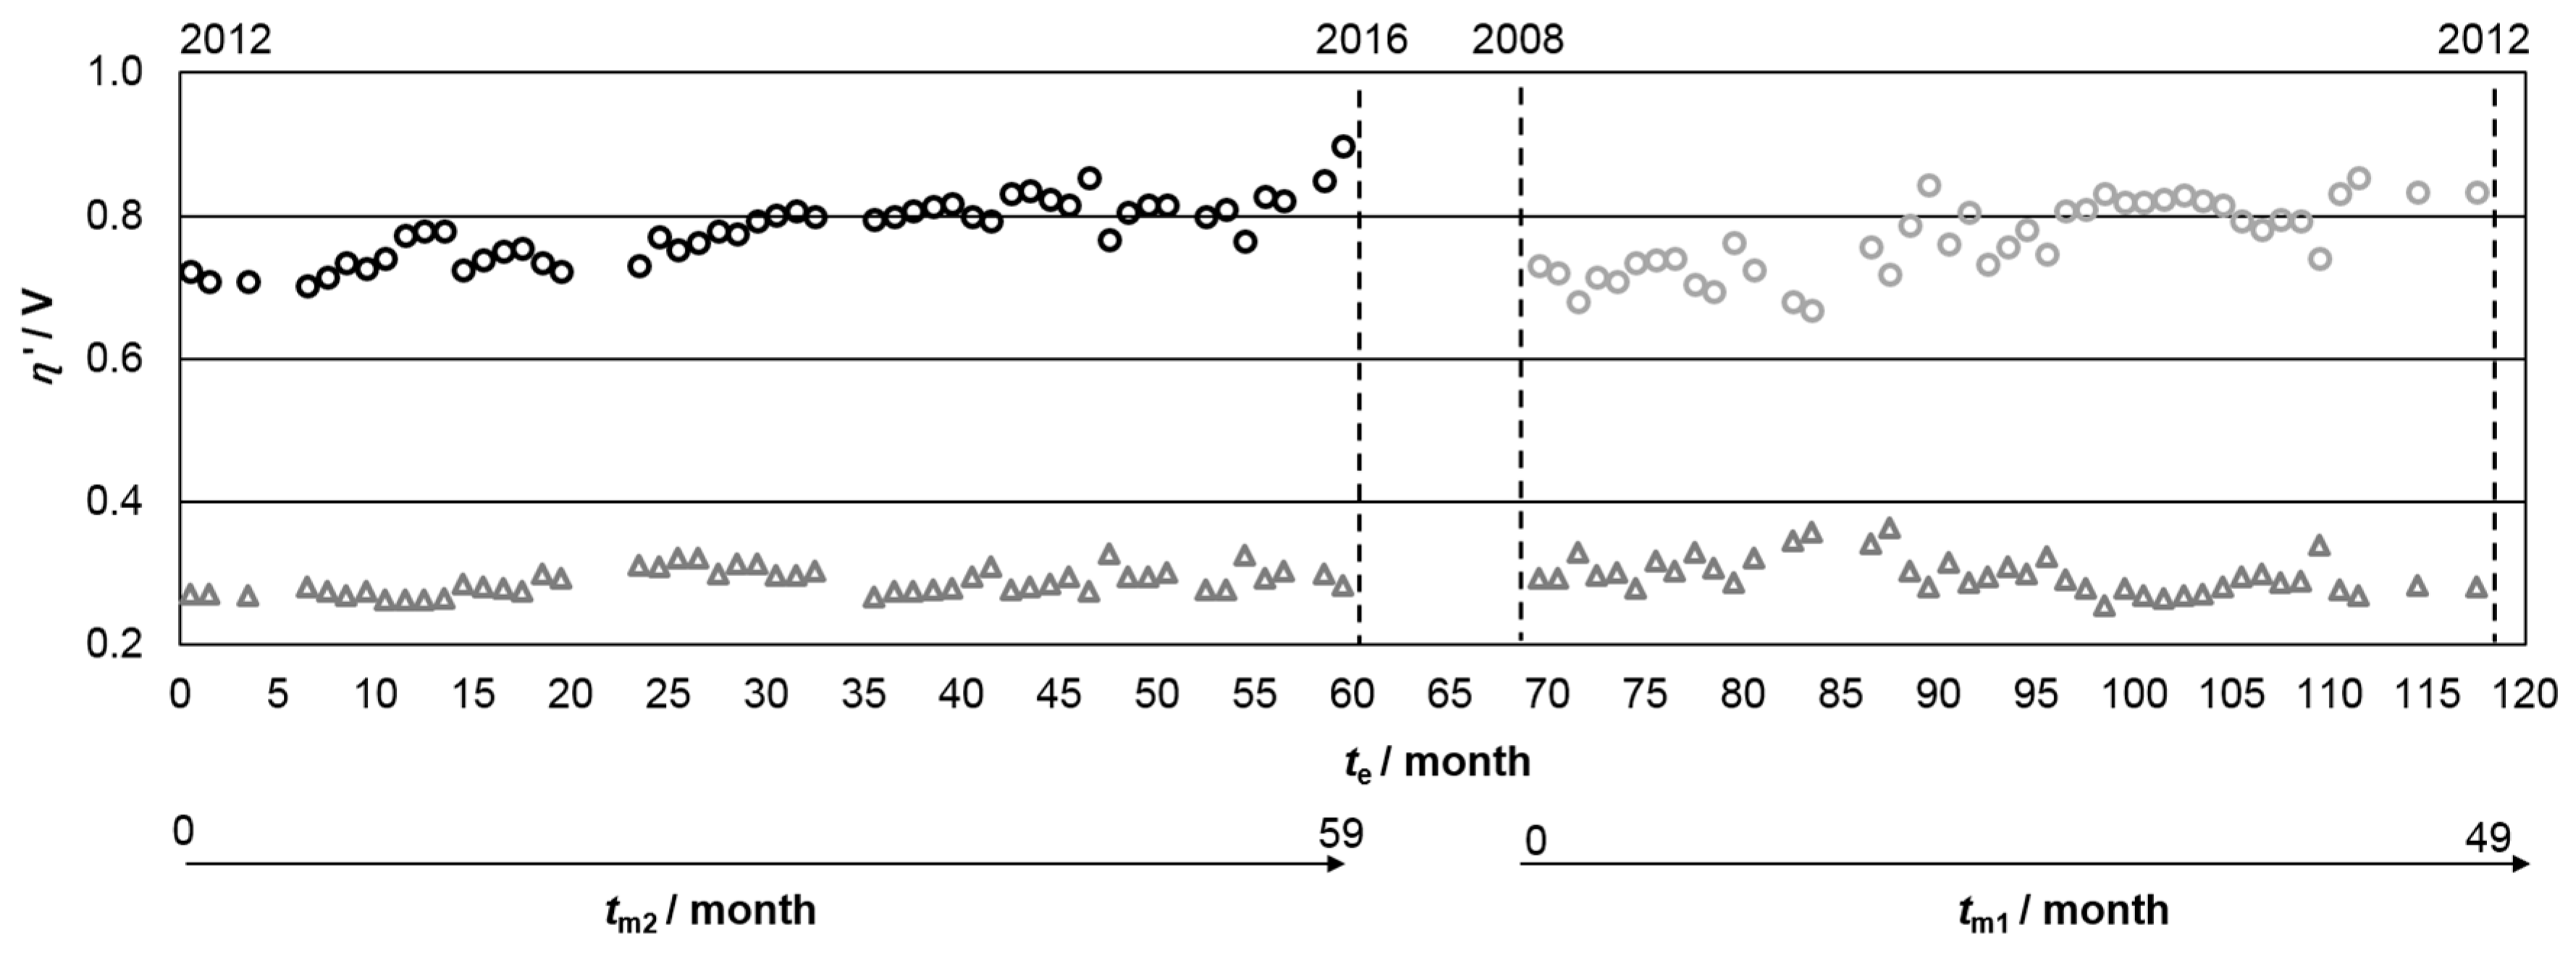
Figure 4 shows the normalized potential, Eji,0 and the correspondent ohmic resistance, equal to (E-E0) · j−1, as a function of the respective electrode service time, te, and membrane service time, tmi.
Figure 4 shows that Ej2,0 starts at 3.22 V and increases ca. 200 mV over the 2012–2016 period, for the set #e2 and #m2 and for the set#e1 and #m1, over the 2008–2012 period, the initial value of the normalized potential is about the same (Ej1,0 = 3.25 V) but, the potential increase is smaller, approximately 100 mV. Comparing Figure 2 and Figure 4, it can be observed that the potential normalization methodology allows for smoothing the production peaks and determining the effective progression of the potential over time due degradation of the elements of the electrolyser. Between the 79 and 95 months of the electrode service time, the ohmic resistance displays various peaks. These peaks are related to an experimental period to the maintenance of the membrane procedure that was discontinued, and no other peaks are observed afterwards. After the 95 months of the electrode service time, the normalized potential remains to increase slowly but, the ohmic resistances sharp growth. In this case, the electrodes contribution for the ohmic resistance was not negligible due to a significant deactivation, as assigned in Equation (13); the timely replacement or recoating of the electrodes prevented an expectable exponential growth of the potential [6,9].
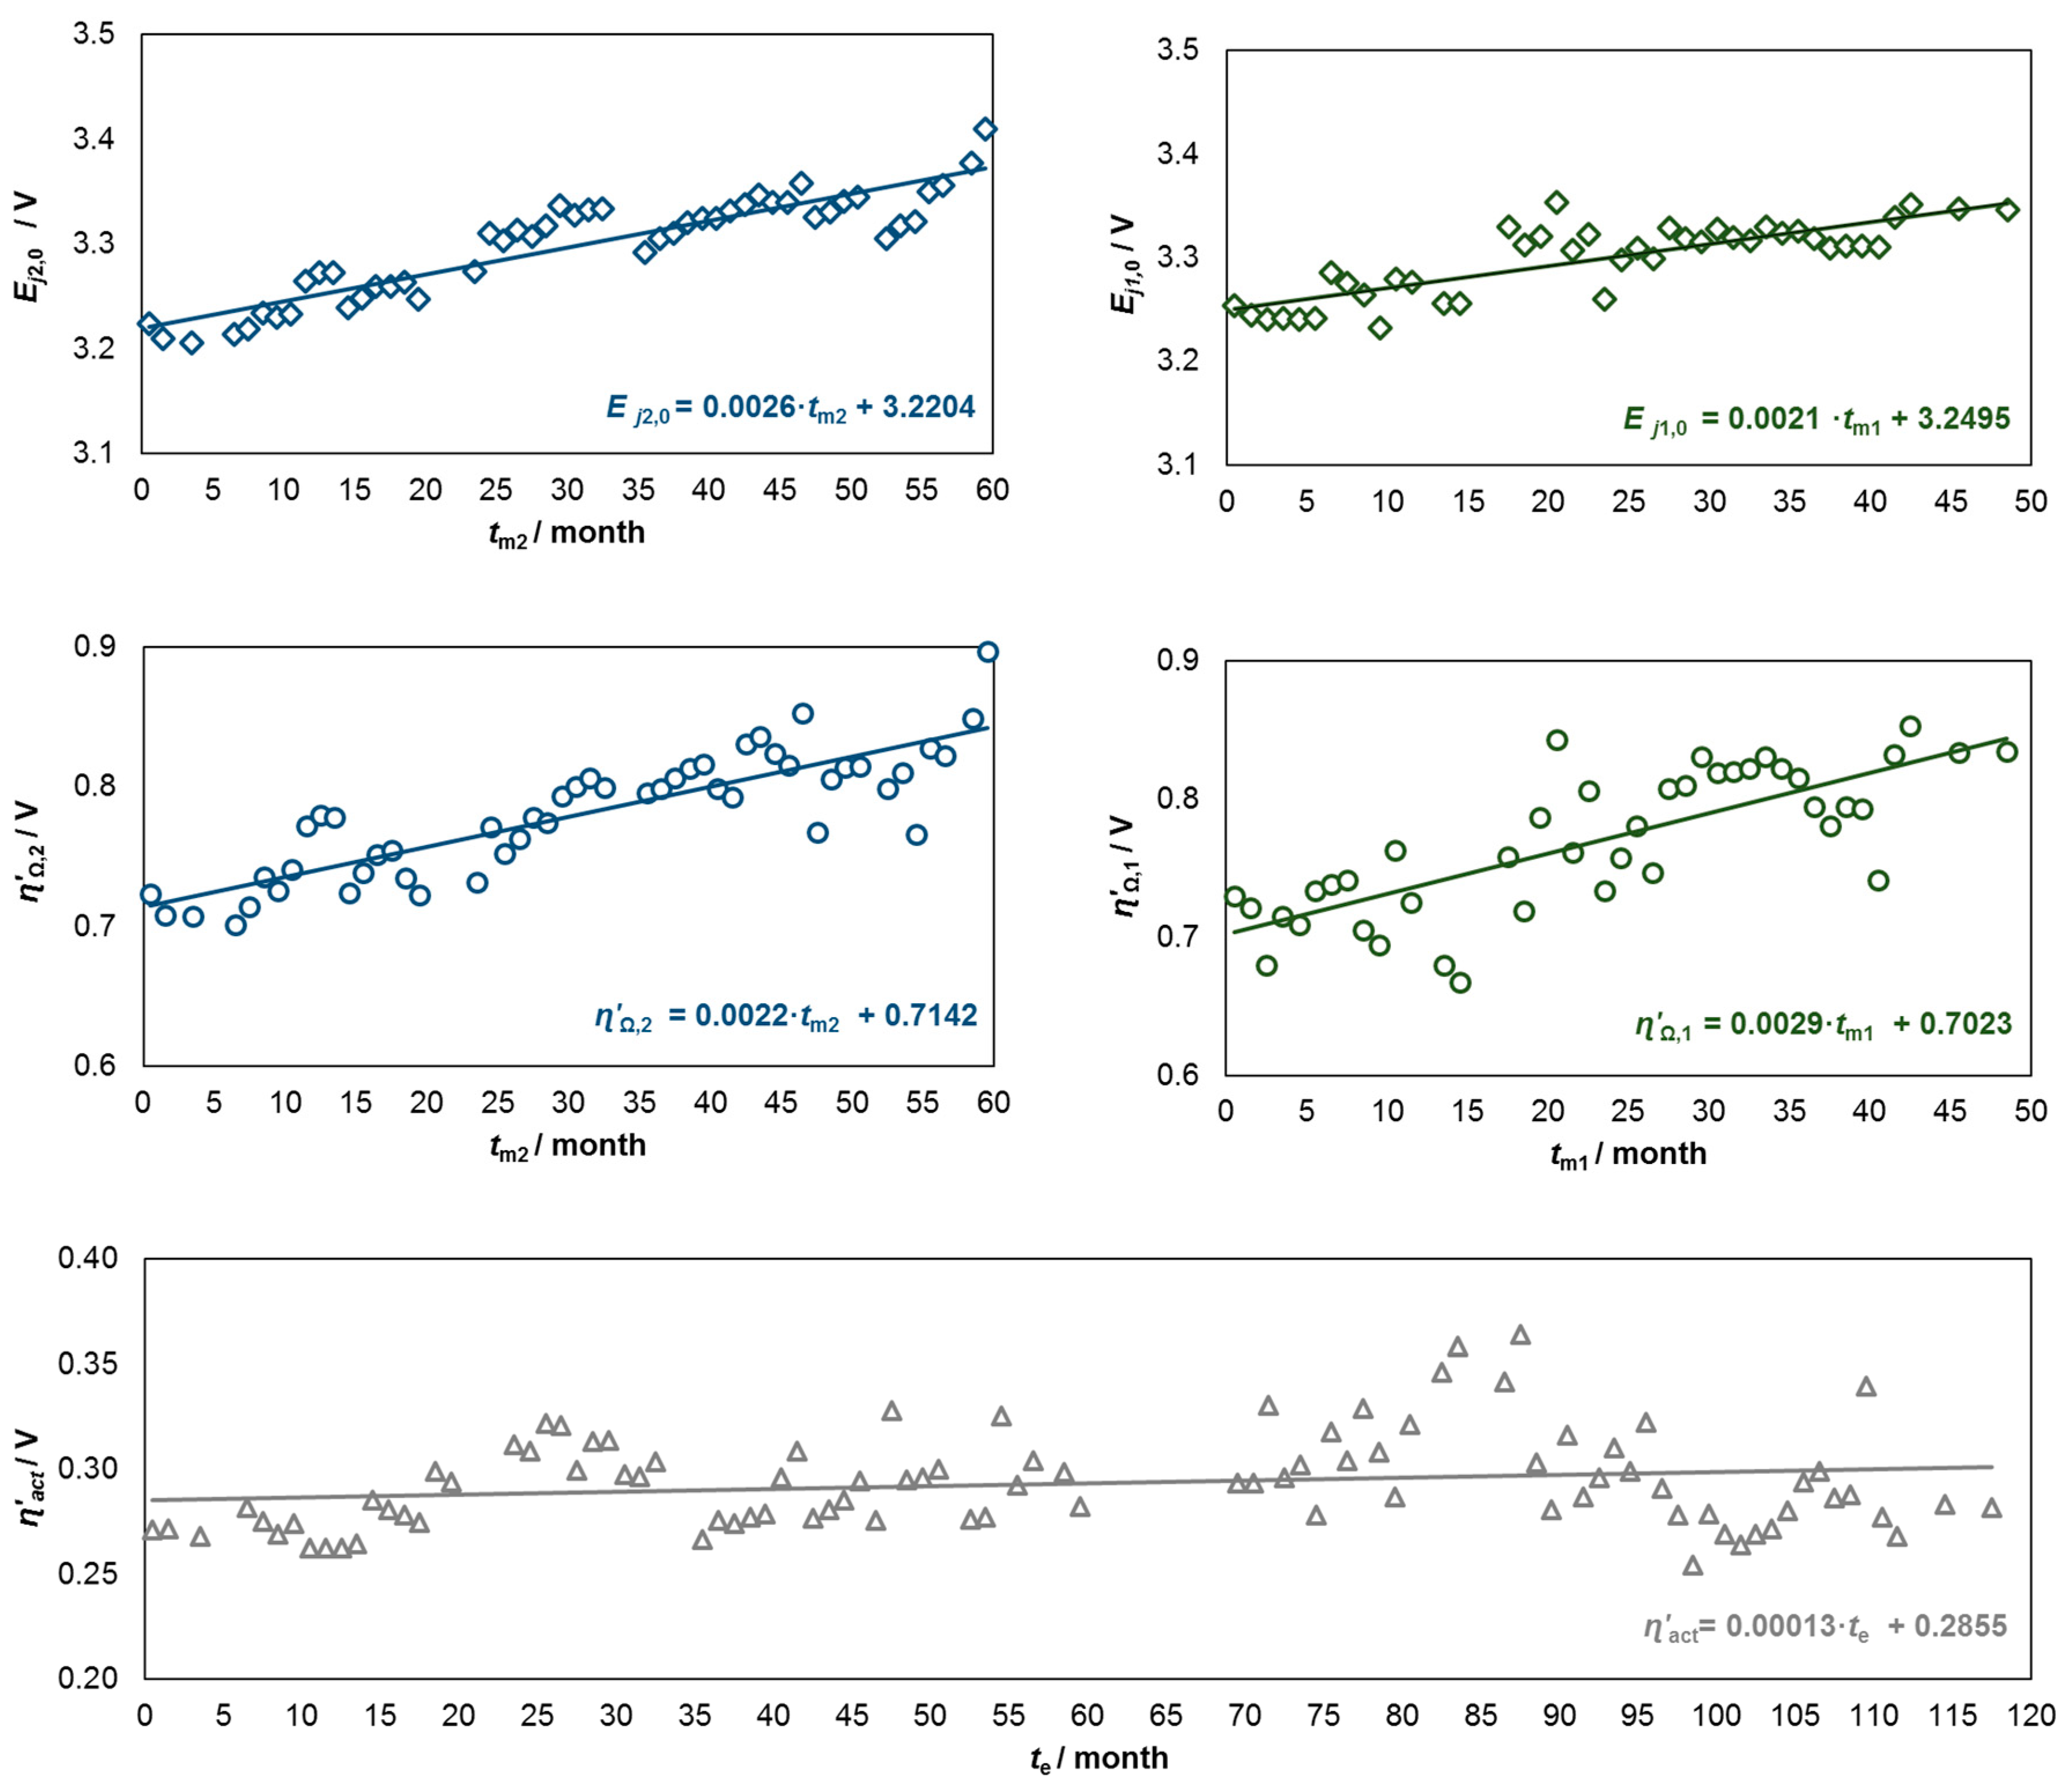
Figure 5 plots the activation and ohmic overpotentials (ηact′ and ηΩ,I′) obtained from Equations (16) and (17). It shows that the ohmic overpotential increases by about 170 mV between 2012 and 2016 and 100 mV during the period from 2008 to 2012, which are within the same order of the normalized potential increase, Eji,0. However, it is difficult to identify a trend for the activation overpotential, since it remains mostly constant.
Figure 6 shows Ej2,0 and Ej1,0 (Figure 6a), ηΩ,2′ and ηΩ,1′ (Figure 6b), and ηact′ (Figure 6c) as a function of the respective service time and the respective regression analyses in Table 1.
From Figure 6 and Table 1, a linear trend with time of the normalized potential and ohmic overpotentials, when the analysis is applied to each stage of the electrolyser history, is clearly observable. The observed trends show a small increase of the activation overpotential over time, which is related to the electrode catalytic activity, and of the ohmic overpotential, mostly related to the performance of the membranes.
The average of the relative error, ε, between the actual values of Eji,0, ηΩ,I′, and ηact′ and the corresponding linear regression are given in Table 2, together with the actual values for each instants.
The average relative error of the activation overpotential is 6% and of the ohmic overpotential is 3%. Concerning the average of the relative error of the normalized potential, it is quite small, <0.5%. It can, therefore, be concluded that the methodology presented allows for discriminating the performance over operation time of the most critical elements in an electrolyser: electrodes and membranes, which can be therefore used for scheduling their preventive maintenances.
The developed methodology allows to estimate the energy cost of a given set of membranes/electrodes over its period of operation based on the overpotentials increase. Moreover, if the costs of acquisition and replacement of all elements and their respective amortization period are known, the average value of the maintenance costs can be calculated. Thus, the intersection between the maintenance cost and operating cost can be considered as the ideal replacement time for each set of membranes/electrodes.

4. Conclusions

A methodology was proposed to follow the ageing of electrodes and membranes of a chlor-alkali membrane electrolyser. The developed methodology is based on the potential difference and current density histories of an industrial bipolar electrolyser data collected every 15-min for about approximately eight years.
The NaCl electrolysis data was organized monthly and the values outside of the Tafel region were removed, which permitted to calculate the average of all cells’ potential and the current density. The monthly open circuit cell potential was obtained from potential and current density curves of the electrolyser. The cell potential was then normalized taking into account the initial current density (when occurs the membranes or membranes and electrodes replacements) and depending on the type of elements used; this procedure allows removing from the experimental data the potential variations associated to small current fluctuations. The normalization made possible to associate the increase in ohmic and activation overpotentials with the electrodes and membranes service time. In the considered case study, the calculated average relative error of the activation overpotential was 6% and of the ohmic overpotential was 3%. The overpotential histories associated to the membrane (ohmic overpotential) and to the electrodes (activation overpotentials) allow for deciding the best instant for servicing actions. This decision, therefore, balances the maintenance costs with the over-energy consumption and the risks of a complete failure of the membranes/electrodes.

Author Contributions

Conceptualization, A.M. and S.V.; Methodology, A.M and J.P.; Investigation, F.F.; Resources, J.P. and A.M.; Writing-Original Draft Preparation, F.F.; Writing-Review & Editing, S.V and A.M; Supervision, A.M., S.V. and J.P.; Funding Acquisition, A.M.

Funding

This work was supported by the (i) POCI-01-0145-FEDER-006939 (Laboratório de Engenharia de Processos, Ambiente, Biotecnologia e Energia, UID/EQU/00511/2013)—funded by FEDER through COMPETE2020—Programa Operacional Competitividade e Internacionalização (POCI)—and by national funds through FCT—Fundação para a Ciência e a Tecnologia and (ii) NORTE-01-0145-FEDER-000005—LEPABE-2-ECO-INNOVATION, funded by FEDER—Fundo Europeu de Desenvolvimento Regional, through COMPETE2020—Programa Operacional Competitividade e Internacionalização (POCI) and Programa Operacional Regional do Norte (NORTE2020). This work was also supported by the Associate Laboratory for Green Chemistry- LAQV, which is financed by national funds from FCT/MCTES (UID/QUI/50006/2019).

Acknowledgments

Filipa Franco acknowledges FCT—Fundação para a Ciência e Tecnologia and Bondalti Chemicals, S.A. for the co-financed PhD grant, PD/BDE/114351/2016.

Conflicts of Interest

The authors declare no conflict of interest.

References

  1. Euro Chlor. The Chlor-Alkali Industry in Europe. Available online: http://www.eurochlor.org/the-chlorine-universe/the-chlor-alkali-industry-in-europe.aspx (accessed on 14 December 2018).
  2. Paidar, M.; Fateev, V.; Bouzek, K. Membrane electrolysis—History, current status and perspective. Electrochim. Acta 2016, 209, 737–756. [Google Scholar] [CrossRef] [Green Version]
  3. O’Brien, T.; Bommaraju, T.; Hine, F. Chlor-Alkali Technologies. In Handbook of Chlor-Alkali Technology; Springer: New York, NY, USA, 2005; Volume II, pp. 387–442. [Google Scholar]
  4. O’Brien, T.; Bommaraju, T.; Hine, F. Introduction. In Handbook of Chlor-Alkali Technology; Springer: New York, NY, USA, 2005; Volume I, pp. 1–16. [Google Scholar]
  5. Dias, A. Chlor-Alkali Membrane Cell Process: Study and Characterization. Ph.D. Thesis, University of Porto, Porto, Portugal, 2010. [Google Scholar]
  6. O’Brien, T.; Bommaraju, T.; Hine, F. Chemistry and Electrochemistry of the Chlor-Alkali Process. In Handbook of Chlor-Alkali Technology; Springer: New York, NY, USA, 2005; Volume I, pp. 75–386. [Google Scholar]
  7. Beer, H. The invention and industrial development of metal anodes. J. Electrochem. Soc. 1980, 127, 303–307. [Google Scholar] [CrossRef]
  8. Trasatti, S. Electrocatalysis: Understanding the Success of DSA®. Electrochim. Acta 2000, 45, 2377–2385. [Google Scholar] [CrossRef]
  9. DeNora DSA® Anodes for Chlorine Evolution. Available online: http://www.eurochlor.org/the-chlorine-universe/the-chlor-alkali-industry-in-europe.aspx (accessed on 14 December 2018).
  10. Bommaraju, T.; Chen, C.; Birss, V. Deactivation of thermally formed RuO2 + TiO2 coatings during chlorine evolution: Mechanisms and reactivation measures. In Modern Chlor-Alkali Technology; International Chlorine Symposium—Blackwell Science: Oxford, UK, 2000; Volume 8. [Google Scholar]
  11. Sohrabnejad-Eskan, I.; Goryachev, A.; Exner, K.; Kibler, L.; Hensen, E.; Hofmann, J.; Over, H. Temperature-Dependent Kinetic Studies of the Chlorine Evolution Reaction over RuO2(110) Model Electrodes. ACS Catal. 2017, 7, 2403–2411. [Google Scholar] [CrossRef]
  12. Karlsson, R.; Cornell, A. Selectivity between oxygen and chlorine evolution in the chlor-alkali and chlorate processes. Chem. Rev. 2016, 116, 2982–3028. [Google Scholar] [CrossRef] [PubMed]
  13. Sandin, S.; Karlsson, R.; Cornell, A. Catalyzed and Uncatalyzed Decomposition of Hypochlorite in Dilute Solutions. Ind. Eng. Chem. Res. 2015, 54, 3767–3774. [Google Scholar] [CrossRef]
  14. Chlor-Alkali Simulation Using ESP. Available online: http://support.olisystems.com/ApplicationBriefs/Briefs%20-%20Chlor%20Alkali.pdf (accessed on 14 December 2018).
  15. Rausch, S.; Wend, H. Morphology and utilization of smooth hydrogen-evolving Raney-nickel cathode coatings and porous sintered-nickel cathodes. J. Electrochem. Soc. 1996, 143, 2852–2862. [Google Scholar] [CrossRef]
  16. Hoseinieh, S.; Ashrafizadeh, F.; Maddahia, M. A comparative investigation of the corrosion behavior of RuO2–IrO2–TiO2 coated titanium anodes in chloride solutions. J. Electrochem. Soc. 2010, 157, E50–E56. [Google Scholar] [CrossRef]
  17. Bondalti Chemicals, Manual Operatório: Eletrólise AGC-Processo; Bondalti Chemicals: Estarreja, Portugal, 2018.
  18. O’Hayre, R.; Cha, S.W.; Colella, W.; Prinz, F.B. Fuel cell reaction kinetics. In Fuel Cell Fundamentals; Wiley: New York, NY, USA, 2006; pp. 59–92. [Google Scholar]
  19. Blair, J.; Dircks, K. Method and Apparatus for Monitoring Fuel Cell Performance. U.S. Patent 5170124, 8 December 1992. [Google Scholar]
  20. Tremblay, G.; Berriah, S.; Brillon, D.; Guena, T. Method and System for Acquisition, Monitoring, Display and Diagnosis of Operational Parameters of Electrolysers. U.S. Patent 6591199B2, 8 July 2003. [Google Scholar]
  21. McClave, J.T.; Benson, P.G.; Sincich, T. Methods for Describing Sets of Data. In Statistics for Business and Economics; Pearson: London, UK, 2010. [Google Scholar]
  22. Tremblay, G.; Lademann, H.; Simard, G.; Veillette, M.; Berriah, S. Method for Ensuring and Monitoring Eletrolyzer Safety and Performances. U.S. Patent 20110240483A1, 27 November 2011. [Google Scholar]
Figure 1. Scheme of a bipolar electrolyser where the stack consists of four cells connected in series: the potential between the terminals, E, is the sum of the individual potential of the cells and the same current density, j, flows through the cells.
Applsci 09 00284 g001
Figure 2. Potential (♦), E, and current density (-), j, as a function of the electrode and membrane service times, respectively te and tmi.
Applsci 09 00284 g002
Figure 3. The monthly E0 (●) and k-factor (▲) values obtained from the polarization curves analysis.
Applsci 09 00284 g003
Figure 4. Normalized potential (◊), Eji,0, and the correspondent ohmic resistance (-), (E − E0) · j−1, as a function of the electrode and membrane service times, respectively te and tmi.
Applsci 09 00284 g004
Figure 5. Activation (Δ) and ohmic overpotentials (○) as a function of the electrode and membrane service times, respectively te and tmi.
Applsci 09 00284 g005
Figure 6. (a) Normalized potential, Eji,0, as a function of the respective membrane service time, tmi; (b) associated ohmic overpotential, ηΩ′, as a function of the respective membrane service time, tmi; and (c) associated activation overpotential, ηact′, as a function of the respective electrode time, te.
Applsci 09 00284 g006
Table 1. Regression analysis of the Eji,0, ηΩ,I′ and ηact′ as a function of the respective service times.
R2 Coefficientp-Value
Ej2,0 vs. tm20.82intercept3.2204<0.05
slope0.0026<0.05
Ej1,0 vs. tm10.67intercept3.2495<0.05
slope0.0021<0.05
η′Ω,2 vs. tm20.72intercept0.7142<0.05
slope0.0022<0.05
η′Ω,1 vs. tm10.60intercept0.7023<0.05
slope0.0029<0.05
η′act vs. te0.04intercept0.2855<0.05
slope0.00013<0.05
Table 2. Relative error between the actual values of Eji,0, ηΩ,I′ and ηact′ and the corresponding linear regression, for the first and second stages of the data analysis.
t e / Month t m / Month E j i , 0 / V ε ¯ E j i , 0 / % η act / V ε ¯ η act / % η Ω , i / V ε ¯ η Ω , i / %
#e2, #m20.50.53.230.50.27160.7232
29.529.53.340.3140.793
59.559.53.410.2820.897
#e1, #m169.50.53.250.40.2930.7303
89.520.53.300.2810.843
99.530.53.330.2790.819
117.548.53.350.2820.834

