Impact of the Operation of a Tri-Band Hydraulic Compactor on the Technical Condition of a Residential Building


Faculty of Civil and Environmental Engineering, Bialystok University of Technology, Wiejska 45E Street, 15-351 Bialystok, Poland
*
Author to whom correspondence should be addressed.
Appl. Sci. 2019, 9(2), 336; https://0-doi-org.brum.beds.ac.uk/10.3390/app9020336
Submission received: 10 December 2018
/
Revised: 10 January 2019
/
Accepted: 15 January 2019
/
Published: 18 January 2019
(This article belongs to the Special Issue Structural Damage Detection and Health Monitoring)
Abstract
:The study investigates the surface vibrations generated by a new generation, tri-band hydraulic compactor type V8 from Maschinentechnik Schrode AG (MTS), and a reversible plate compactor type DPU 6055 from Wacker Neuson in close proximity to a low-rise residential building. Compaction works were carried out in three stages, at distances: 15 m, 10 m, and 5 m from the building, and at three depths: 0.4 m, 1.2 m, and 1.8–2.0 m. The research was conducted at one measurement point, located on the outer foundation wall of the building, and at three measurement points located on the ground at distances of 1.25–7.5 m from the building. The study analyses the distribution of peak component particle accelerations at the ground, and peak component particle velocities at the foundation wall of the building as a function of the distance of compactors from the building and the depth of compaction works, as well as the mode of work of hydraulic compactor type V8 from MTS. The study contains the comparison of the permissible vibration levels that are recommended by selected European standards (DIN, BS, VSS, and PL) and an approximate assessment of the impact of vibrations on the technical condition of the residential building.
1. Introduction
The assessment of the impact of vibrations generated in the subsoil, and their transfer to building structures is an important problem of civil engineering. This issue is currently the subject of frequent studies and analyses concerning mainly urban areas. One of the main reasons for this assessment are excessive vibration levels (in the opinion of residents and users of various types of construction) caused by the movement of vehicles on roads [1,2,3], as well as on railways [4]. Articles regarding vibrations that are caused by the work of construction machines are also an important collection of materials on this matter. Vibrations of particularly high intensity are induced when driving foundation piles [5,6], which very often makes the use of this technology unacceptable in close vicinity to buildings. Significant values of acceleration or vibration velocities are also generated during driving and pulling out of sheet pilings [7,8]. The influence of vibrations spreading in the environment can be very important, which is why methods for their reduction are sought out so often [9,10,11,12].
A specific group of construction equipment causing vibrations in the subsoil are machines and devices that are used for compaction of the ground. They are used almost always on every construction site—regardless of whether the investment is related to the construction and modernization of buildings, communication infrastructure facilities, water supply, sewage, gas, or electrical and telecommunications networks. In construction practice, vibrations caused by soil compaction occur much more frequently than with other sources of vibrations. In the literature on the subject, the situation is the opposite. Work on the assessment of the impact of vibrations on the environment caused by the work of machines during soil compaction seems to be scarce. This is most probably connected with the fact that the level of vibrations generated in this case is generally considered to be insignificant. As a rule, it is much smaller than the level of vibrations that are generated and propagated in the ground during driving piles or sheet pilings. Available studies mainly concern vibrations that are generated during the operation of vibration rollers [13], and much less often, vibrating plate compactors [14]. In the literature on the subject, however, there is a lack of reliable research and scientific articles on the work of hydraulic compactors integrated with excavators and the impact of vibrations generated by them on the surroundings. The few works dealing with the subject of vibrations generated by the work of hydraulic compactors were related to the effectiveness of soil compaction in trenches in which pipes are installed, and the risk assessment related to their damages [15]. Such compactors are characterized by much higher values of load amplitudes than vibrating plate compactors. Rather frequently, however, they are used in a very close, sometimes several-meter distance from the building. There are situations when compaction of the soil takes place next to the walls or foundations of the building, which in the case of this type of equipment, may turn out to be significant in terms of the possible impact of generated vibrations on the technical condition of the building and its users.
This work comprises an analysis of the results of field tests of ground surface vibrations caused by the work of a new generation, tri-band V8 hydraulic compactor by Maschinentechnik Schrode AG (MTS), and comparative vibration generated by the work of a standard plate compactor. The article describes the impact of ground-borne vibrations that are generated by the operation of both types of compactors and their impact on the environment—in particular, the assessment of the impact of recorded vibrations on a residential building in the immediate vicinity of the source of vibrations.
2. Materials and Methods—Measurement Site, Instruments, and Research Methodology
Field studies of propagation of surface vibrations that are generated during the compaction of ground were conducted in the immediate vicinity of a newly built detached family house located at Ksiezyno near Bialystok, in Poland. This one-floor brick building with a habitable attic of the dimensions in a horizontal section 24.6 m × 11.0 m and a height in a ridge of 8.9 m, was erected on a natural clay soil (sasiCl according to standard EN ISO 14668-1 [16] and EN ISO 14668-2 [17], plasticity index Ip = 16%, liquidity index IL = 0.15). In the immediate vicinity of the building (up to a depth of approx. 1.8 m) there were mixed sand and clay soils, constituting an uncontrolled embankment.
It was assumed that vibrations would be generated by using a new-generation hydraulic compactor type V8 from MTS integrated with an excavator, and a reversible plate compactor-type DPU 6055 from Wacker Neuson (operating frequency of 69 Hz, centrifugal force 60 kN) at three different locations spaced from the supporting wall of the building by 15 m (stage I), 10 m (stage II), and 5 m (stage III) and at three different depths of 1.8–2.0 m, 1.2 m, and 0.4 m. The compaction process was commenced with the excavation of a trench to a depth of about 2.3–2.4 m, and then the trench was partially filled up with sand and gravel mix, which was subsequently compacted. In this way, the depth of the trench decreased to approx. 1.8–2.0 m. After the completion of all planned series of measurements at a given depth, the trench was once more partially filled, and soil compaction continued on other analyzed depths. In the case of the MTS V8 hydraulic compactor, dynamic measurements were carried out for all three available modes of operation—i.e., X1 mode (so called “Standard”)—with an operating frequency of 38 Hz and a centrifugal force of 90 kN, X2 mode (“Compactor-jumper”)—at 45 Hz and 50 kN and X3 mode (“Power”) of 60 Hz and 90 kN. Each time, before changing a device generating vibrations or changing the mode of operation, the ground at the desired depth was skimmed and loosened in order to provide comparable conditions of compaction.
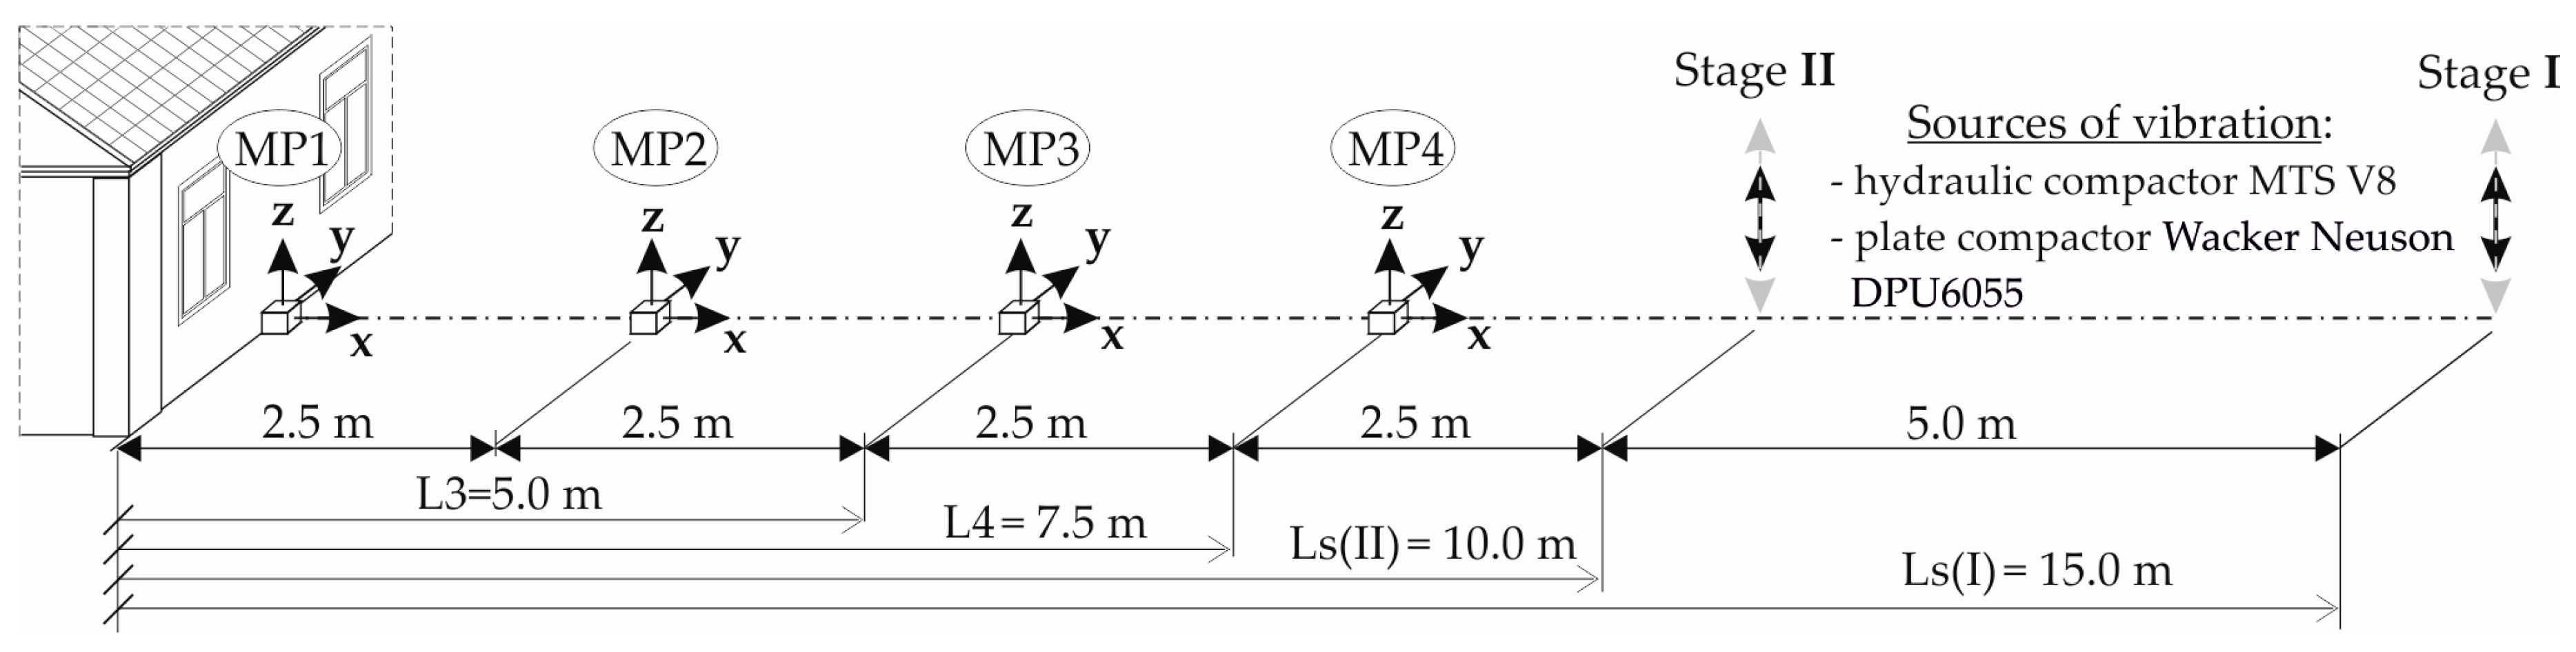
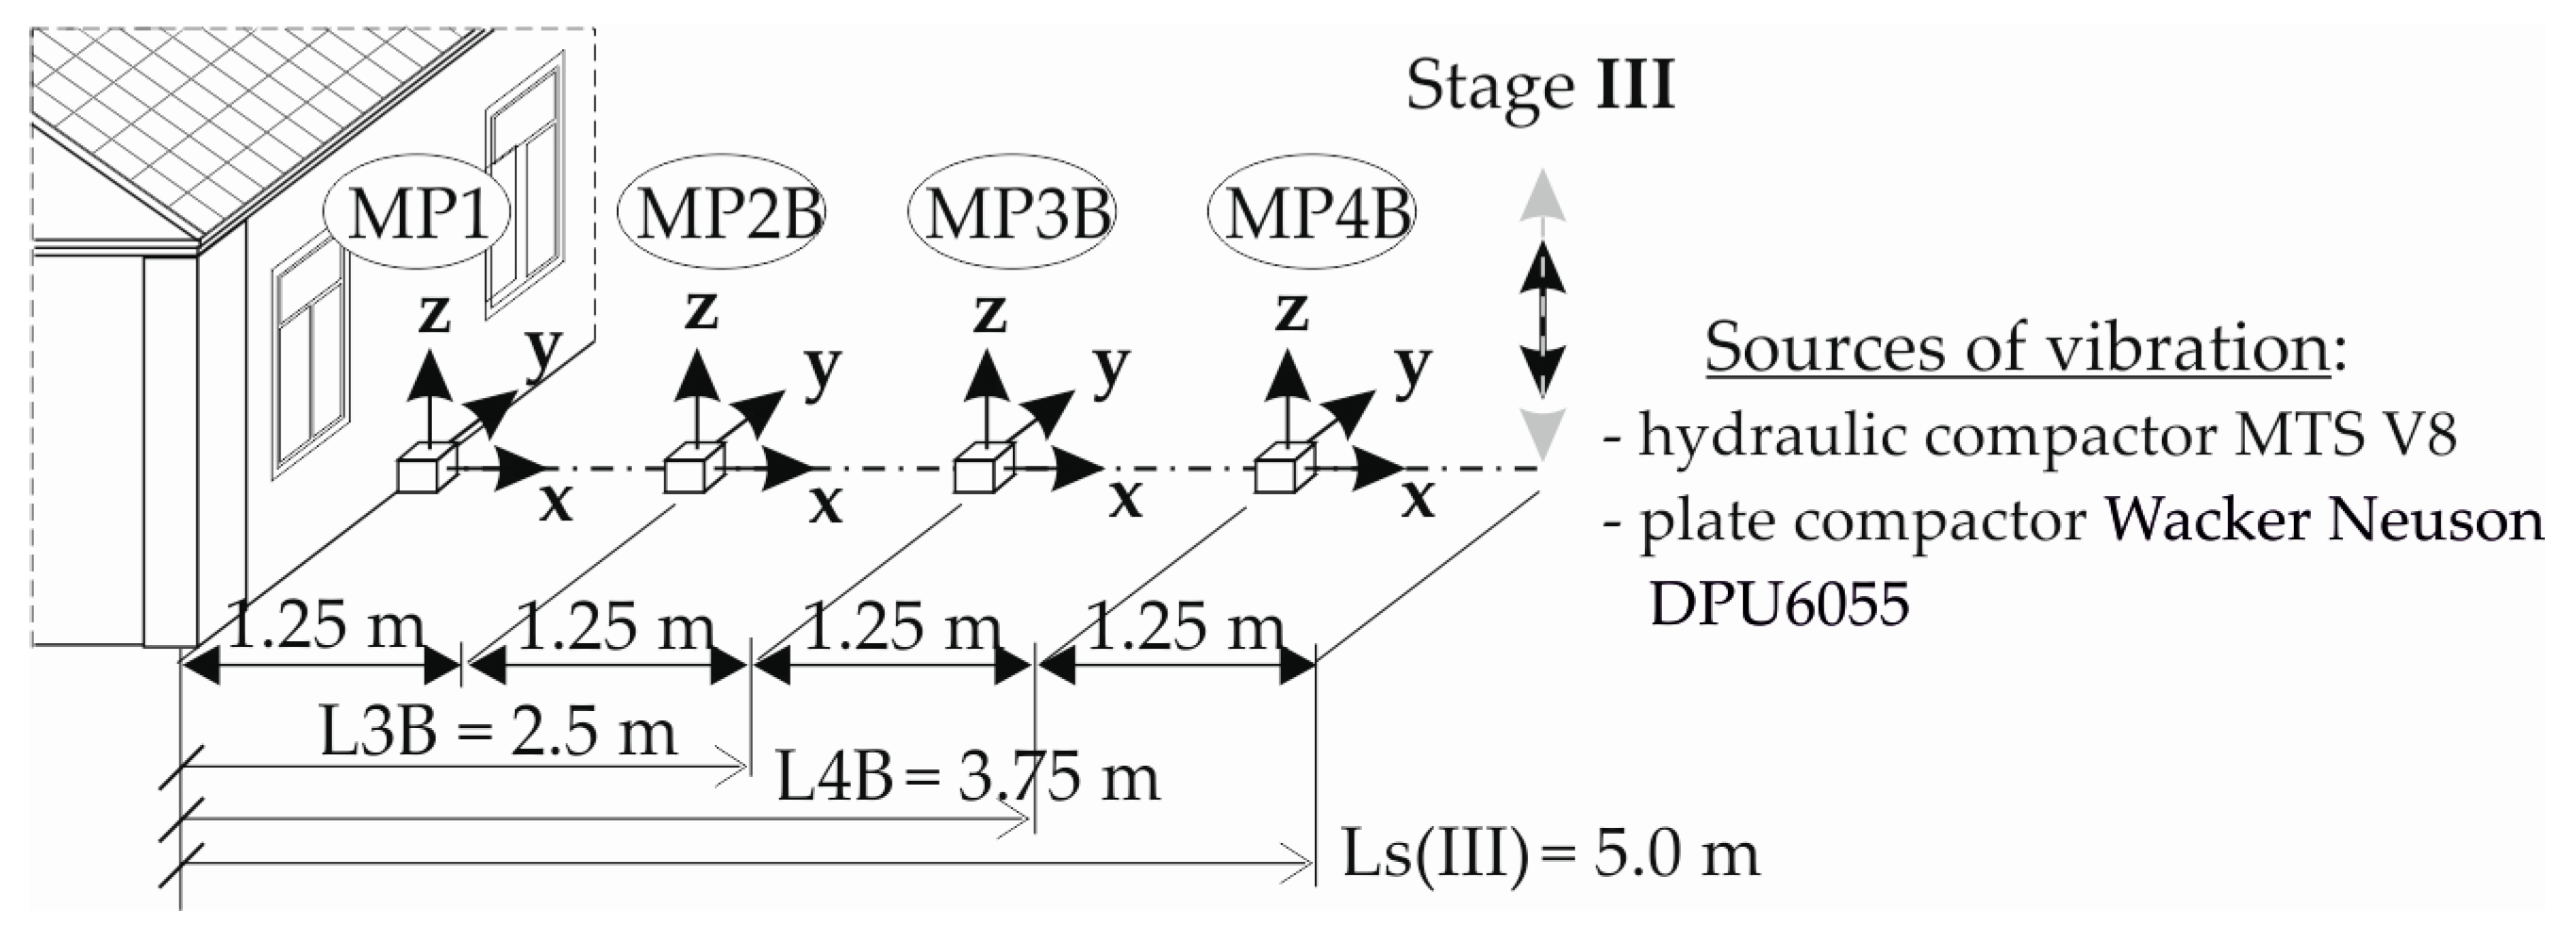
The research has been conducted at one measurement point located on the foundation wall of the residential building at the level of the surrounding terrain (measurement point No. 1—MP1) and at three measurement points located on the ground, at distances from the building: 2.5 m (MP2), 5.0 m (MP3), and 7.5 m (MP4)—in stages I and II, and consequently, at distances: 1.25 m (MP2B), 2.5 m (MP3B), and 3.75 m (MP4B)—in stage III.
Measurements of vibration accelerations were carried out using 12-channel and 24-bit LAN-XI data acquisition hardware from Brüel&Kjær, with analysis range exceeding 160 dB and dynamic signal range from 120 to 130 dB broadband and 160 dB narrowband, as well as with a set of three low-frequency, seismic piezoelectric accelerometers type 8340 manufactured by Brüel&Kjær (measuring ranges: ±0.5 g, 0.1–1000 Hz ±5%) and nine low-frequency piezoelectric accelerometers type 3187D from Dytran (measuring ranges: ±20 g, 0.48–1000 Hz ±5%).
In the course of measurements of the ground-borne vibrations, low-frequency uniaxial transducers type 3187D, were screwed to mounting devices (in a cubic shape) in three perpendicular directions: x, y, z, in measurement points MP2–MP4 (Figure 1) and MP2B–MP4B (Figure 2). Mounting devices were firmly attached to steel plates, placed on the ground surface, and secured in the ground by a three-point anchoring. A modal analyses carried out using a software based on the Finite Elements Method, showed that the natural frequency of mounting devices with accelerometers mounted to them was outside the frequency ranges relevant to the possible impact of vibrations on buildings.
Measurements of vibration accelerations in the first measuring point (MP1) were carried out using a set of three uniaxial seismic accelerometers type 8340, screwed to the foundation wall of the building (from the vibration source side and at the level of the adjacent terrain) through special mounting devices. In the immediate vicinity of seismic accelerometers, a triaxial accelerometer made in Micro-Electro-Mechanical Systems (MEMS) technology was screwed to the wall, dedicated by Sequoia (GEA model) to measure vibrations and to assess the impact of vibrations on different types of buildings and the comfort of living. In each measurement point data acquisition was carried out in three mutually perpendicular directions: x—longitudinal, y—transversal and z—vertical. Sources of vibration used in the study, and the positioning of the individual measurement points with respect to the building are shown in Figure 1, Figure 2 and Figure 3. The sampling frequency in both data acquisition hardware (LAN-XI from Brüel&Kjær and GEA by Sequoia) was equal to 1024 Hz.
3. Results
As a result of studies, from four to over a dozen, acceleration time histories have been recorded (at four measurement points and three mutually perpendicular directions: x, y, and z) for all the possible modes of operation of both devices, depending on the distance of the vibration source from the building and the depth of compaction. In the case of compactors operating in the closest distance from the building (stage III, Ls = 5 m) the number of recorded accelerograms, due to the intensity of vibrations and the risk of damage to the building, has been limited to four. Each accelerogram was appointed with maximum absolute value of the acceleration signals (PPAi—peak component particle acceleration).
The exemplary PPAi values determined for the nearest distance of the source of vibration from the building (Ls = 5 m) and the hydraulic compactor operating in X1 mode are summarized in Table 1 (file names contain information about the device, operating mode, compaction depth, and indicate the next accelerogram number in a given measurement series).
Peak component particle accelerations, summarized this way, were attributed to the maximum PPAi values from an individual series of measurements. From a detailed summary of the PPAi values, with respect of the source of vibration, the operating mode of MTS V8 hydraulic compactor, depth and direction of measurements are summarized in Table 2 (stage I), Table 3 (stage II), and Table 4 (stage III). In the tabular summaries presented below, the dominating PPAi values in individual columns have been introduced in bold and underlined, and the dominant values for particular modes of operation of the compactors used in the research have been underlined. Fragmentary results of research carried out in stages I and II were published in [18].
4. Discussion
4.1. Comparative Analysis of the PPAs
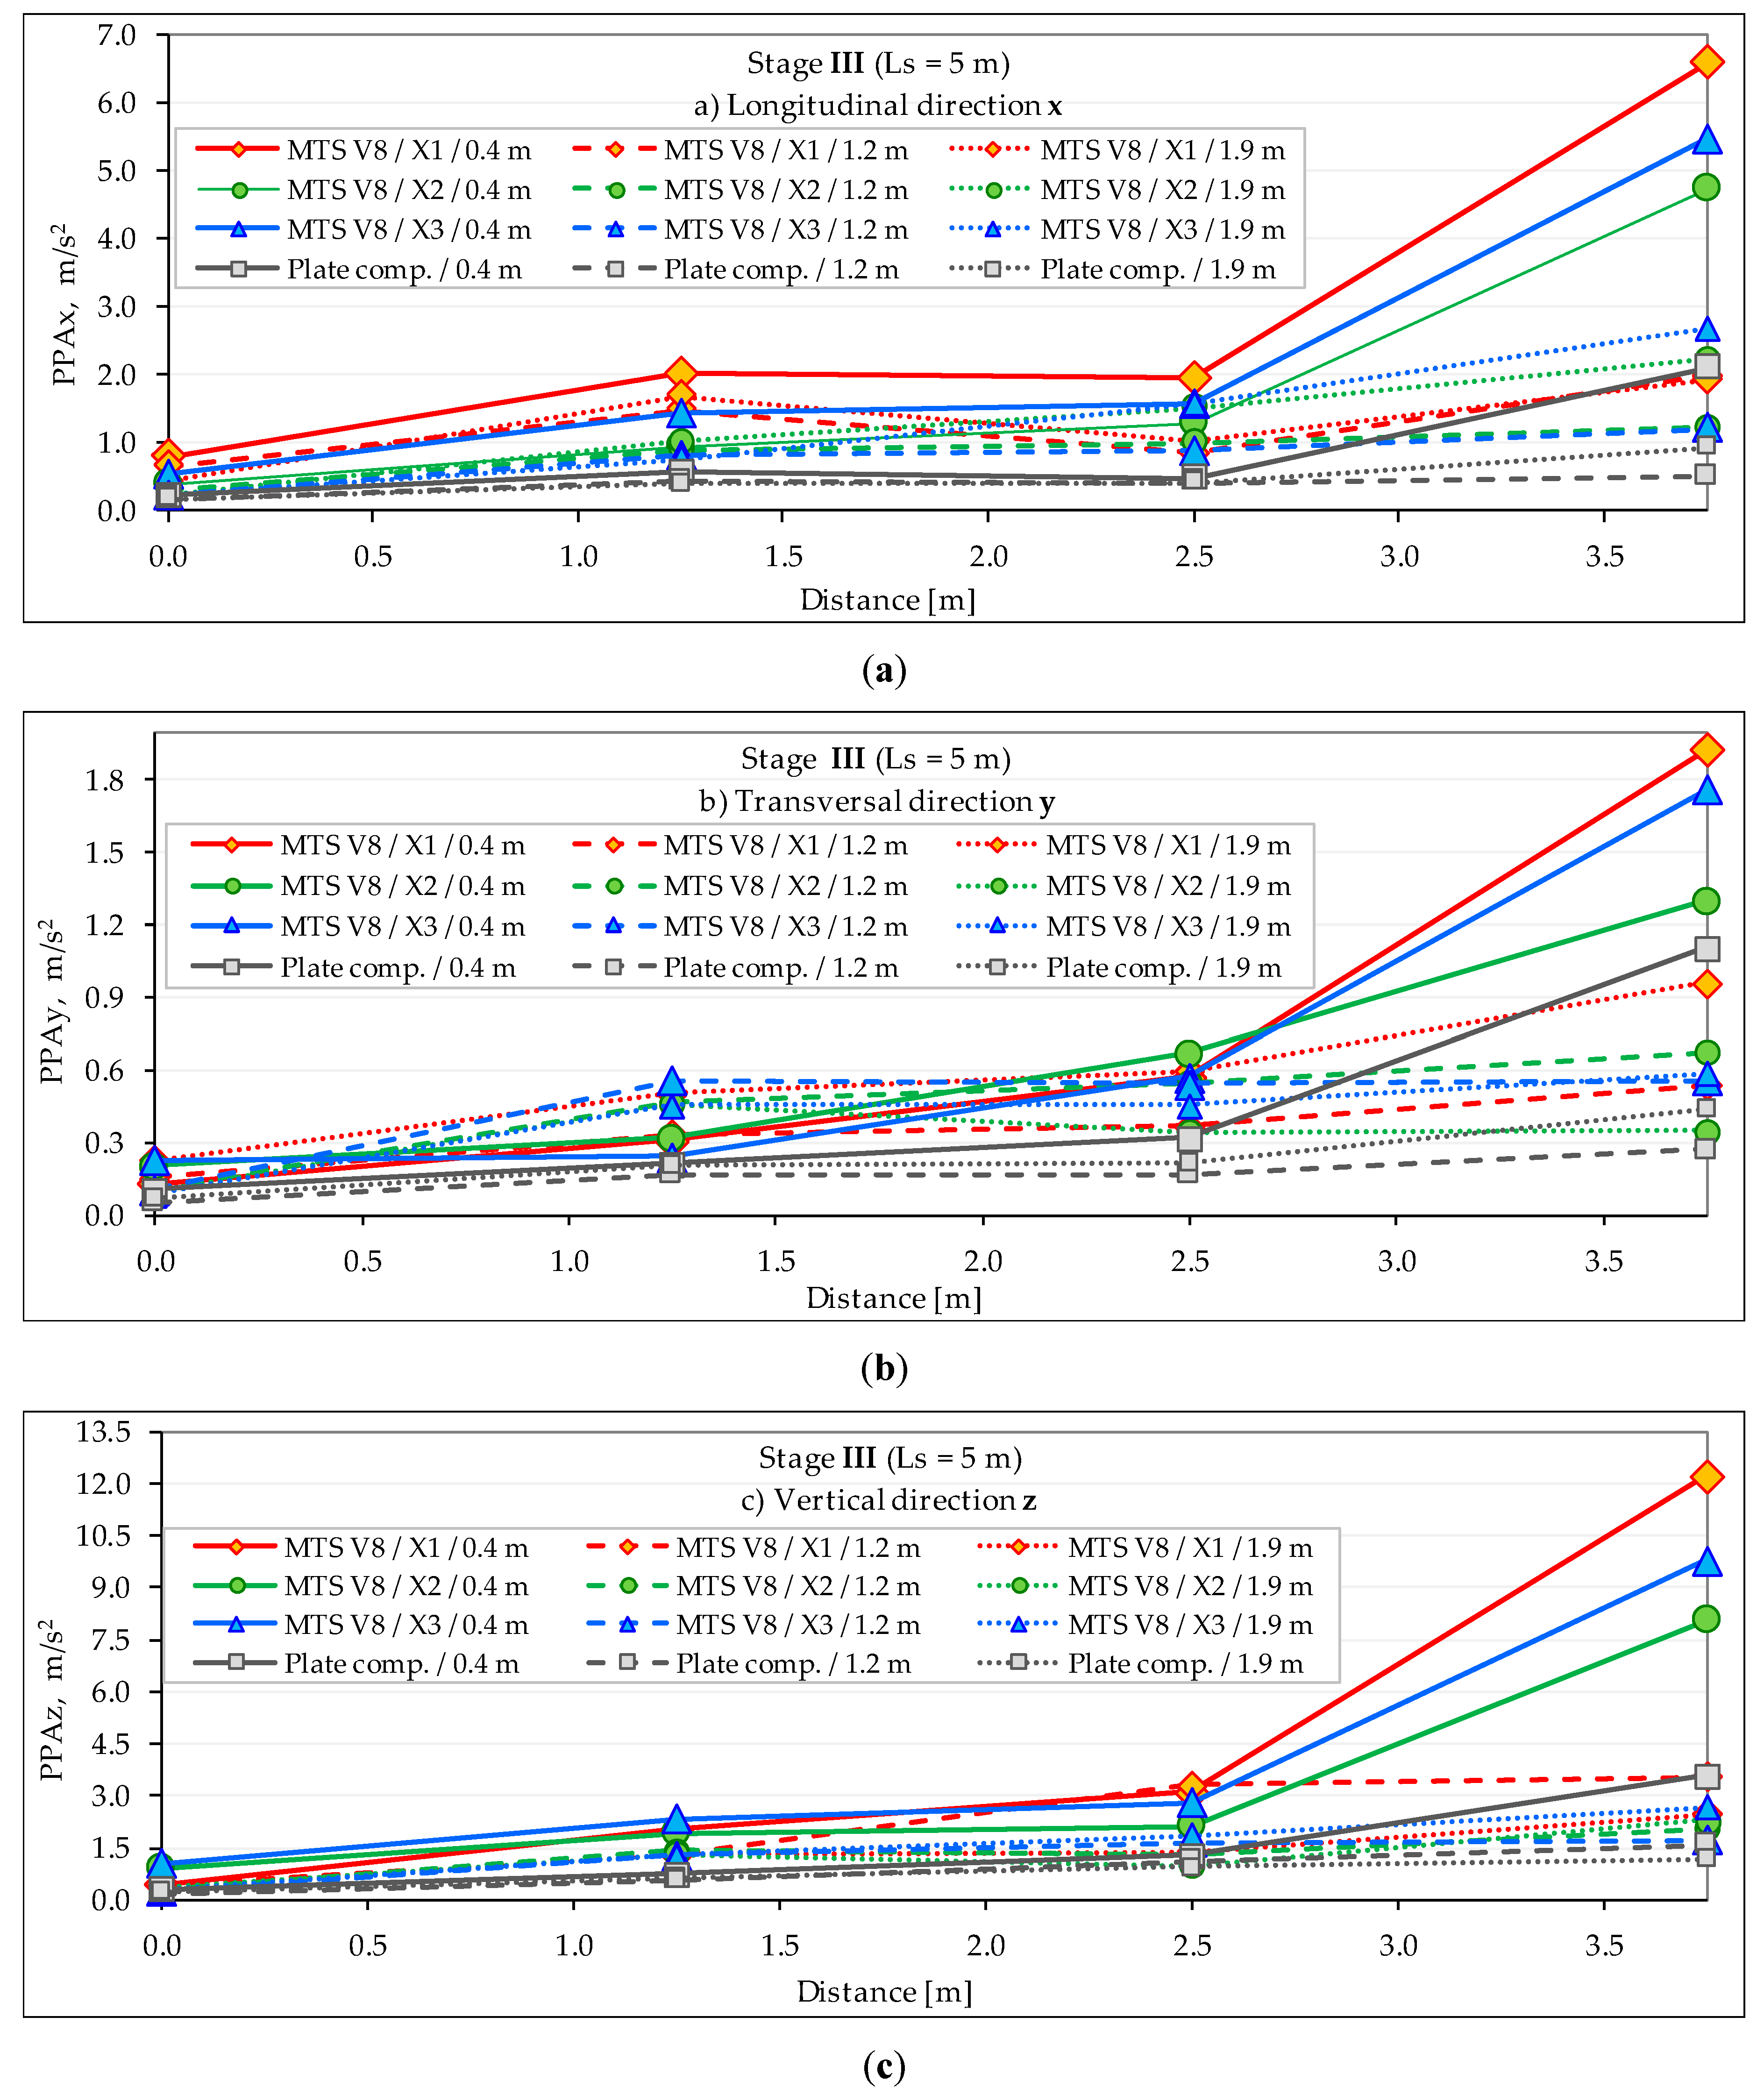
As it can be noticed in the above summaries (see Table 2, Table 3 and Table 4 and Figure 4), the most intense acceleration time histories occurred in the direction of generated vibrations—i.e., in vertical direction (z). The maximum values of vibration acceleration (PPAz), registered during the first stage of tests (the source of vibration in the distance Ls = 15 m from the building) in the measurement point No. 4 (MP4, L4 = 7.5 m)—outermost of the building, and the nearest to the source of vibrations did not exceed PPAz = 0.248 m/s2—in the case of Wacker Neuson DPU 6055 vibrating plate compactor, and 0.546 m/s2—in the case of the MTS V8 hydraulic compactor (mode X1). At the same measurement point, in the second stage of tests (the source of vibration in the distance of Ls = 10 m from the building) the PPAs reached respectively 1.291 m/s2 and 2.195 m/s2 (mode X1). Predominant vibration acceleration values in the vertical direction are also present in the third stage of research (stage III—source of vibrations at a distance of 5 m from the building), in which case the PPAz values registered at the measuring point closest to the working compactors (MP4B, L4B = 3.75 m) are respectively for the plate compactor and hydraulic compactor PPAz = 3.571 m/s2 and 12.215 m/s2 (mode X1).
In terms of the potentially harmful influence of vibrations on the building, vibrations transmitted to the ground medium in a horizontal plane are more significant. The maximum values of surface acceleration vibration propagated in the longitudinal direction x, and were recorded at a measurement point that was located at a distance of 7.5 m from the building (MP4) are less intense than in the vertical direction, and in the first stage of the study (Ls = 15 m), they do not exceed PPAx = 0.178 m/s2 (plate compactor) and 0.461 m/s2 (MTS V8 compactor, mode X1), and respectively, 0.967 m/s2 and 1.984 m/s2 in the second stage of the study (Ls = 10 m). In the third stage of research, at the measurement point that was most distant from the building (MP4B, L4B = 3.75 m), the maximum PPAx values were, respectively, 2.094 m/s2 and 6.580 m/s2.
In the case of vibrations recorded in a transverse direction (y), in relation to the assumed measurement profile, PPAy values are usually two–three times lower than in the longitudinal direction x. At the measuring points located closest to the vibration source, they were presented respectively for the plate and hydraulic compactor: 0.059 m/s2 and 0.335 m/s2 (stage I), 0.395 m/s2 and 0.698 m/s2 (stage II) and 1.108 m/s2 and 1.928 m/s2 (stage III). It follows that in the furthest measurement points (MP4 and MP4B), the vibration levels that are generated by the hydraulic compactor MTS V8 were almost twice as high as those generated by the reversible plate compactor.
While the acceleration values recorded along the adopted measurement profile decreased with the distance from the source of vibration, unfortunately, damping and absorption of vibrations did not proceed, as it was due to the known theoretical dependence of the geometrical attenuation, and the absorption of vibrations, as in continuous and homogeneous types of ground [17], which points to the exponential nature of fading of vibrations along with distance covered by the waves. This problem is further highlighted in earlier works by the authors [7].
where:
- Ar—peak acceleration attenuation of the recorded motions in the “r” point, mm/s2,
- A0—peak ground acceleration value [mm/s2] at a distance r0, mm/s2,
- r, r0—distances of points “r” and “0” respectively, from the source of vibration, m,
- α—coefficient related to material damping, 1/m.
The present case concerns (and not only in the direction z) a much lower attenuation and absorption of the surface vibration acceleration propagated in the ground medium, which is more linear (in some cases with the local intensification of vibration acceleration) than exponential. For this reason, it must be concluded that the vibrations generated in heterogeneous-made grounds located in the immediate vicinity of various types of buildings, will propagate at greater distances than what would result from the theoretical relationships describing this phenomenon.
As an alternative to the simplified methodology based on dependence (1), it is possible to carry out numerical simulations using software based on the Finite Element Method (FEM)—similar to the works [19,20,21]. In this work, due to the considerable heterogeneity of the ground, no such numerical analyses have been carried out. The focus is on the analysis of the results of vibration acceleration measurements on a real object in a natural scale.
By comparing PPA distribution (see Table 2 and Table 3) at the second (MP2, L2 = 2.5 m), the third (MP3, L3 = 5.0 m), and the fourth (MP4, L4 = 7.5 m) measurement points in the first and second stages of the study, it can be observed that PPAs may be subject to a significant intensification with the increase of distance from the vibration source (see Table 2: direction x—MTS V8 compactor in X1 and X2 operating modes, direction y—X1, X2, and X3 operating modes, direction z—X3 operating mode, and also Table 3: direction y—practically all operating modes of MTS V8, direction z—plate compactor). To a slightly lesser extent, a similar effect can be observed also in the third stage of research (source of vibration at a distance Ls = 5 m from the building’s front wall)—especially in the case of surface vibrations of the ground propagated in the longitudinal direction (x) and the work of the hydraulic compactor in X1 mode and plate compactor (see Figure 4 and Table 4)—which is most probably related to the very complex wave process occurring in the ground medium, and as a result, to the amplification of vibration, due to the reflection and the refraction of waves from the boundary surfaces of made ground, natural ground, walls of excavation, a building, or other types of local inhomogeneities and inclusions in the ground medium. It is unlikely that the intensification of ground surface vibrations observed at the measuring points MP2 and MP3 has any relationship with the natural vibrations of the soil medium, because they are far below the operating frequencies of both devices.
Further analysis of PPAs indicates that in the case of direction x, the most essential, from the point of view of the possible influence of vibrations propagated from the ground to the structure (see Table 2, Table 3 and Table 4) and the vertical direction z (see Table 2, Table 3 and Table 4), the most intense vibrations recorded on the ground surface along the adopted measuring profile are generated during operation of hydraulic compactors in mode of operation X1 (operating frequency 38 Hz, centrifugal force of 90 kN). Significantly lower vibration level is generated by the MTS V8 hydraulic compactor in X2 mode (45 Hz, 50 kN)—except for the horizontal direction x in the second stage of study. The lowest vibration level is generated by the MTS compactor in X3 mode (60 Hz, 90 kN).
Considerably lower values of ground surface vibration acceleration are generated by a plate compactor (with the exception of direction y in the second stage of the test (see Table 3), where at measurement points MP2 and MP3 reported values were significantly higher than in the case of the MTS V8 compactor). However, this is the direction in which there are much lower vibration acceleration levels, compared to the horizontal direction x and the vertical direction z.
Regarding the effect of the depth of compaction on the level of recorded surface vibrations of the ground, it can generally be concluded that the closer to the source of the vibration, and the lower the depth of work with the use of the MTS V8 hydraulic compactor and the DPU 6055 vibratory plate compactor from Wacker Neuson—the higher the level of acceleration of surface vibrations recorded on the surface of the ground. Along with the increasing distance from the source of vibration, this tendency changes and the vibrations generated at greater depths and recorded on the ground are usually more intense. This is particularly evident if we compare the distribution of PPAx values recorded in the longitudinal direction x on the surface of the ground, listed in Table 2 (stage I—source of vibration at a distance of 15 m from the building and from 7.5 m to 12.5 m to the measurement points located on the ground) with the corresponding PPAx values in Table 4 and in Figure 4 (stage III—source of vibrations only 5 m from the front wall of the building and from 1.25 m to 3.75 m in the horizontal line to the measuring points on the ground). Thus, the maximum PPAx values presented in Figure 4 in the majority of cases related to the lowest compaction depth (0.4 m), while in Table 2, the predominant PPAx values corresponded to a depth of 1.2 m or 1.9 m.
When it comes to the PPAi values recorded at the outer foundation wall of residential building at the first measurement point (MP1) in the most important direction from the point of view of the possible impact of vibration on building (in the x direction), it can be seen that in the case of vibrations generated at a distance of Ls = 15 m from the outer wall of building (stage I, see Table 2), the PPAx values generated by the operation of the hydraulic compactors type V8 from MTS (0.235 m/s2—X2 mode at a depth of h = 0.4 m) were twice as high than in the case of the operation of a vibrating plate compactor (0.111 m/s2, h = 0.4 m). The same maximum level of vibration acceleration as in the standard plate compactor was obtained in the case of vibrations generated during the operation of the hydraulic compactor in X3 mode (0.111 m/s2, h = 1.2 m).
When the location of the compactors was closer to the building (stage II—Ls = 10 m, see Table 3), the highest levels of the PPAx values registered on the building were observed in the case of compactor MTS V8 operating in the mode X1 at a depth of 0.4 m (0.226 m/s2). The vibration accelerations generated by the vibratory plate compactor were, in this case, much more intense (0.195 m/s2, h = 1.2 m) than in a case of hydraulic compactor operating in mode X3 (0.170 m/s2, h = 1.2 m), and only slightly lower than in mode X2 (0.201 m/s2 when h = 0.4 m).
In stage III (Ls = 5 m, see Table 4 and Figure 4), with the smallest distance of sources of vibrations from the building (Ls = 5 m, see Table 4 and Figure 4) by far the highest PPAx values were recorded in the case of the MTS V8 device operating in X1 mode (0.790 m/s2, at h = 0.4 m). Even by several dozen percentage points, lower vibration acceleration peaks were recorded during the operation of the MTS V8 compactor in X3 and X2 modes (respectively: 0.531 m/s2 and 0.376 m/s2). The smallest PPAx values occurred during the operation of a vibratory plate compactor (0.225 m/s2, h = 0.4 m). In stage III, the intensity of vibration accelerations recorded on the foundation wall of the building decreased each time with increasing compaction depth.
4.2. Effect of Ground-Borne Vibrations on the Building
Vibrations generated as a result of human activity, as it is known, can propagate in the ground, and even over long distances—mainly in the form of Rayleigh waves. Depending on their intensity and the frequency of vibration, they may be imperceptible by the building, or cause more or less significant damage to it. At the junction of the ground and a building, a so-called dynamic soil–structure interaction takes place, and as a result, there is normally a significant reduction of vibrations that are transmitted to the structure. Theoretically, only very rigid buildings that are bound to the rigid ground (rocks) will be subjected to the same forces as the ground. There is virtually never infinite rigidity of the ground, and consequently, at the interface between the ground and the building structure, there will always be a certain radiation and dissipation of energy. The degree of vibration reduction depends on the dynamic parameters of the building and the ground. The main role in dynamic interaction is played by the natural frequency of the building and the shear stiffness of the ground. Besides, there are also very important factors, such as the geometry of the foundation, the method of foundation embedment, the impact of building load on the soil stiffness, soil stratification, shear stiffness with depth, shear strains on soil stiffness on the rigidity of the ground, the frequency of vibrations propagated in the ground, etc. [22].
In accordance with theoretical considerations, guidelines of ISO 4866:2010 [22], DIN 4150-1 [23], and other works, e.g., [24], it is assumed that for most of the vibrations are related to human activity, the ratio of vibration amplitudes recorded on the foundation of the building (uF) and amplitudes recorded on the surface of the ground in the immediate vicinity of the building (uN), should be unity or less (rN = uF/uN ≈ 1 or rN < 1) [22].
As it can be seen from data shown in Table 2; Table 4, a lower level of vibrations recorded in the building was not always the case—as exemplified by the vibrations recorded on the building at the first measurement point (MP1—located on the outer foundation wall of the building at the level of the adjacent terrain from the side of the source of vibrations) during the operation of the hydraulic compactor in the first stage of the research (source of vibrations at a distance of 15 m from the building)—in X2 mode and 0.4 m (see Table 2, direction x), in X3 mode at a depth of 2.0 (see Table 2, direction y), and vibrations generated by the work of the plate compactor at a depth of 0.4 m (see Table 2, direction x) and 1.2 m (see Table 3, stage II, direction x). In each of these cases, a resonant vibration of the building could have occurred.
Each building structure based on the ground is subject not only to loads resulting from the weight of the structure, service loads, and external loads associated with wind pressure and suction, snow load or other atmospheric influences—including loads resulting from variable temperatures and ambient humidity. There are also loads that are related to the uneven settlement of the ground under the foundations, thermal stresses in elements exposed to direct sun impact, or additional stresses in individual structural elements associated with executive or design errors. Long-lasting vibrations propagated in the ground may also contribute to accelerated consolidation or compaction of the soil in the immediate vicinity of buildings and directly under them—as a result of which, damage to structural elements (e.g., cracking of foundations and walls) may occur in buildings exposed to this type of dynamic impact as the effect of exceeding the permissible stresses, even if the level of vibrations propagated in the soil was relatively small, and as such, they could not cause this type of damage. Considering the variety of construction and material solutions used, varied ground conditions, depth of building foundations, etc., an extremely difficult task is to determine the acceptable vibration parameters that should be considered safe for various types of construction works. In some countries, however, an approximate assessment has been introduced for the impact of ground-borne vibrations on selected types of buildings, which are based on a comparative analysis of the actual vibration parameters registered on the building, with limit values being defined by relevant standards. They are based on the results of experimental research.
An approximate assessment of the impact of ground-borne vibrations on buildings should be carried out in accordance with the provisions contained in national standards. If applicable regulations do not apply in a given country, norms of neighboring countries or international standards are usually used for this purpose. A few of the best such standards that are applicable in the case of predicting and assessing the impact of vibrations generated by the work of soil compaction equipment on buildings are German Standard DIN 4150-3 [23], British Standards BS 7385-2 [25], and BS 5228-4 [26], as well as Swiss Standard VSS-SN640-312a [27]. A somewhat different method of approximate assessment of the impact of vibrations on buildings is introduced by the Polish Standard [28]. The first three standards are based on the registration of the time histories of three mutually perpendicular components (x, y, z) of vibration velocities at the base of the building on the side of the building facing the source of vibration [25], and if not possible—on the foundation wall or supporting wall of the building (usually at, or slightly above the level of adjacent terrain from the side of source of vibrations) [23], or on the ground, outside of the building—in the case of a predicted impact assessment of vibrations on the building (or in the case of an existing building, when for some reasons it cannot be implemented at the base of the building) [25]. The DIN [23] standard additionally recommends recording the time histories of velocity of horizontal vibrations (x, y) on the top floor of the building. The assessment itself is based on the comparison of the PPV (Peak Particle Velocity) independently for each of the three components of the unweighted velocity signals (expressed in peak component particle velocity PPVx, PPVy, PPVz) [23].
In the case of the Polish Standard PN-B-02170:2016-12 [28], an approximate method based on the so-called “dynamic impact scales” (in Polish “Skala Wpływów Dynamicznych”—SWD) developed for two types of the most common buildings has been introduced. According to the SWD scales, the time history of the accelerations or velocities of horizontal vibrations (x, y) on the foundation or supporting wall of the building from the side of the source of vibrations, and at the level of the adjacent terrain, are subject to recording. The assessment of the impact of ground-borne vibrations on the building consists of analyzing fragments of recorded signals (with amplitudes ≥ 0.2 PPA—separately for components x and y) in 1/3-octave bands, and applying the determined values of accelerations or vibration velocities on nomograms with marked damaging zones. The SWD scales introduce five such zones [28].
The standard VSS-SN640-312a [27] is applicable to both transient and continuous vibrations. The standard introduces the division of buildings into four classes (I–IV; class II—includes buildings with foundation walls and floors in concrete, and walls in concrete or masonry, and two types of vibration sources: machines, traffic, and blasting. Threshold values, above which building damage may occur, are set independently for the following frequency bands: 10–30 Hz and 30–60 Hz—in machines and traffic generated vibrations, 10–60 Hz and 60–90 Hz—in blasting. For vibrations generated by the operation of soil compactors and buildings class II, in which the building should be included, the standard indicates two threshold values above which building damage may occur: PPV = 7.6 mm/s (band 10–30 Hz) and PPV = 7.6–12.7 mm/s (30–60 Hz) [27].
The standard DIN 4150-3 [23] introduces one type of threshold values for short-term vibration and another for long-term vibration, dividing buildings into three groups (1, 2, and 3; where type 2—refers to dwellings and buildings of similar design and/or occupancy) and three frequency bands (1–10 Hz, 10–50 Hz and 50–100 Hz). In the case of short-term vibrations and a building classified as type 2, the recommended maximum absolute value of the velocity signals for the three components (so called “guideline values”), recorded on the building foundation, below which there should be no damage to the building, are respectively [23]: PPVx,y,z = 5 mm/s (1–10 Hz), 5–15 mm/s (10–50 Hz) and 15–20 mm/s (50–100 Hz) and regardless of the frequency PPVx,y = 15 mm/s in the case of vibrations recorded in the horizontal plane on the top floor of the building. In a situation when dealing with long-lasting vibrations threshold values (so called “guideline values”) recorded on the top floor of the building should not exceed 5 mm/s [23].
A much higher level of acceptable peak component particle velocities is recommended by the BS 7385-2 standard [25], which introduces a division of buildings into 2 types (1—reinforced or framed structures, industrial, and heavy commercial buildings, 2—unreinforced or light-framed structures, residential, or light commercial type buildings). According to the guidelines, minor damage in the type 2 building will not appear if the peak component particle velocities of transient vibration registered on the foundation of the building will not exceed the value of PPVi = 15 mm/s at 4 Hz—increasing to 20 mm/s at 15 Hz or 20 mm/s at 15 Hz—increasing to 50 mm/s at 40 Hz and above. In the case of continuous vibrations, which can cause resonance, the above values should be reduced by 50%—to the values accordingly: PPV = 7.5 mm/s at 4 Hz—increasing to 10 mm/s at 15 Hz or 10 mm/s at 15 Hz—increasing to 25 mm/s at 40 Hz and above [25].
The British standard BS 5228-4 [26] is more stringent, when it comes to vibration thresholds that can cause cosmetic damage to buildings. It represents a much more conservative approach and it meets the needs of owners and users of buildings exposed to excessive vibrations generated during construction works involving piling works, and which can also be used for assessing the probability of occurrence of structural damages arising from vibrations associated with construction. The standard introduces the division into four types of buildings, and makes the threshold values dependent on the duration of vibrations (intermittent vibrations and continuous vibrations). In residential buildings “in generally good repair” [26], recommended vibration limits, regardless of dominating frequencies, are PPV = 10 mm/s—in the case of intermittent vibration, and PPV = 5 mm/s—in the case of continuous vibrations. Residential buildings where preliminary survey reveals significant defects, PPV values shown above should be decreased by 50%, to a level equal to: PPV = 5 mm/s and 2.5 mm/s [26].
Analyzing the above, it should be assumed that cosmetic damage to a residential building (such as surface cracks in plaster or brickwork) in accordance with the most stringent standards [26] can occur when the level of vibrations recorded on the foundation or foundation wall of a building in any direction exceeds the level of 5 mm/s, in the case of a building in good technical condition, or 2.5 mm/s in the case of a building in poor technical condition.
The assessment of the impact of vibrations generated during the operation of the MTS V8 hydraulic compactor and the DPU 6055 plate compactor, and then it is transferred via the ground to the building in question in accordance with the above standards, is based on peak component particle velocities. The PPVi values required for evaluation may come from the numerical integration of recorded time history of vibration accelerations, but as is known, this type of digital signal processing can lead to large errors.
Therefore, the assessment of the impact of vibrations generated by the work of compactors and propagated via ground to the building was carried out for PPVi values registered with the MEMS transducer dedicated to this type of measurements and assessments (GEA type by Sequoia). PPVi values listed in Table 5, Table 6 and Table 7 are based on measurements carried out on the foundation wall of the building in the immediate vicinity of the first measurement point (MP1)—practically in the same time intervals for which the maximum absolute value of the acceleration signals (PPAi) were obtained using the Brüel&Kjær 8340 seismic accelerometers presented in Table 2, Table 3 and Table 4.
As demonstrated by the subsequent comparative analyses of PPVi values obtained from the numerical integration of the time history of vibration accelerations registered with seismic accelerometers, they do not differ significantly from the PPVi values registered with the GEA sensor. Examples of values that were obtained as a result of single integration of signals and the removal of the linear trend (using the Sigview software) are given in Table 8. By comparing the data from Table 7 and Table 8, it can be seen that in the case of a hydraulic compactor MTS V8 operating in X1 mode, by integrating signals, it was possible to achieve from −5.4% to +13.1% lower or higher values of PPVi in the direction of the dominant vibration component (x direction). In the vertical direction (z), the differences in relation to the signal from the GEA sensor were + 0.6%, to a maximum of +15.3%. The largest differences in PPVi values occurred in the transverse direction (y)—even up to −43.7%, in relation to the values determined by using the GEA transducer. Such significant differences in the transverse direction (y), and rather acceptable differences in the case of other measurement directions, most probably do not result from numerical integration errors, but only due to the lack of technical possibility to synchronize the start and end of measurements by using two completely different measurement systems (even several-second time shifts between individual files are possible).
The data compiled in Table 5 to Table 8 show, that in the most unfavorable case, on the foundation wall of a residential building subjected to the analyses, components of vibration velocities did not exceed PPVi = 2.4 mm/s in (see Table 7, stage III: direction x, hydraulic compactor in X1 mode compacting soil at a depth of 0.4 m).
In accordance with the guidelines of key European standards, regarding the assessment of the impact of ground-borne vibrations on buildings ([23,25,26,27]) such orders of magnitude of peak component particle velocities recorded at the foundation of the building should not cause any damage to buildings in good technical condition (even cosmetic damages), as the two most stringent standards in this matter: DIN 4150-3 [23] and BS 5228-4 [26] as thresholds (named respectively, as: “guideline value” or ”vibration limits”) for residential buildings indicate PPVi = 5 mm/s—in the case of short-term vibrations with dominating frequencies from 5 Hz to 10 Hz, and PPVi = 5 mm/s (recorded on the top floor of the building)—regardless of the frequency in the case of short-term vibrations [23], and PPV = 5 mm/s—regardless of the frequency in the case of BS 5228-4 standard [26]:
However, it should be taken into account that buildings near which construction works that are related to the compaction of soil may be carried out, do not necessarily have to be in a good technical condition. Then, according to [26], PPVi limit values should be reduced by 50%—up to PPV level = 5 mm/s in the case of intermittent vibration and 2.5 mm/s, in the case of continuous vibrations. Considering that during the compaction of the soil using the MTS V8 compactor, the building’s resonance vibrations have occurred at least several times and we have to deal with vibrations affecting the structure of the building in a continuous way. In this situation, the building in question would be on the verge of an appearance of minor or cosmetic damage to buildings.
PPVmax = 2.4 mm/s < 5 mm/s.
PPVmax = 2.4 mm/s ≈ 2.5 mm/s.
The same level of vibration expressed in peak component particle velocity PPVi = 2.5 mm/s (recorded on the top floor, or PPVi = 3 mm/s—in the case of vibrations recorded on the foundation in the frequency band from 1 to 10 Hz) recommended by DIN 4150-3 [23] in the case of vibrations propagated near buildings that are particularly sensitive to vibration or important from another point of view, e.g., listed buildings under preservation order.
The influence of vibrations generated by the work of compactors, and propagated to the ground is assessed differently in the case of evaluation based on the analysis of recorded time history of vibration accelerations in 1/3-octave bands in accordance with the Polish standard PN-B-02170: 2016-12 [28].
Dynamic impact scale (in Polish SWD) has been developed for the two most common types of residential buildings in Poland on the basis of conducted dynamic calculations, including, apart from various building constructions, also different types of subsoil. Due to the size of the building subjected to assessment according to [28], the building was qualified for the less stringent SWD-II scale—used in the case of masonry buildings or mixed structure up to four floors, whose height is smaller than the double smallest building width. Depending on the technical condition of the building, ground conditions and the time of impact of vibrations on the structure within each of the SWD scales, more or less strict classification criteria for particular damaging zones may be applied. In the case of undamaged buildings, without structural alterations, rigid subsoil and short-term vibrations, the analyzed vibrations can be attributed to the effects of the lower damaging zone. If the majority of the above conditions are fulfilled, as in the analyzed case (good technical condition of the building and the ground, long-term vibrations >3 min), less stringent zones of influence, zones should be applied. In the case of old buildings, damaged (in poor technical condition) and subsoil with low stiffness, more stringent criteria are applied.
Detailed assessments for each of the analyzed cases are summarized in Table 9.
The above comparison shows, that in the analyzed case, according to the guidelines of the Polish standard [28], a vibratory plate compactor type DPU 6055 from Wacker Neuson does not cause vibrations that would require taking into account dynamic impact on the building (damaging zone I according to SWD-II scale)—regardless of the distance of the compacting works from the building and the depth at which the compaction of the soil takes place (in the scope of the conducted research—it is: Ls = 5–15 m and depth h = 0.4 to 1.8–2.0 m).
As indicated by the assessments carried out according to the SWD scale for the MTS V8 hydraulic compactor, minor cosmetic building damage should be expected in virtually every mode of operation of the device in the range of the analyzed distance parameters of the source of vibrations from the building (0–15 m), and the depth at which works related to the compaction of soil were conducted (from 0 m to 1.8–2.0 m). If we assume that a building is in good technical condition (as it was in the analyzed case), then the maximum second damaging zone can be expected (marked as “II” in Table 9)—i.e., with vibrations that are harmless to the building structure, which may, however, cause accelerated building wear, first scratches in rendering and plaster, and scratches in wall corners and facades, etc. (so-called cosmetic damages). If, however, with the building being the subject of the assessment was in poor technical condition or set on a low rigidity subsoil, vibrations would have to be classified even within the third damaging zone (see in Table 9—designation “III”)—that is, vibrations that are harmful to the building, which may cause local cracks and scratches that weaken the structure of the building and that reduce its load-bearing capacity and resistance to further dynamic influences (there may also be falling off of rendering and plasters, scratches on the joints of structural elements, etc.). This type of harmfulness was found only in the case of the shortest distance from the building (Ls = 5 m), in which the hydraulic compactor operated in X1 mode and the poor technical condition of the building or low soil stiffness occurred. In X2 mode, the MTS V8 compactor generates slightly less intense vibrations, which are classified into the II damaging zone at a distance of 15 m of hydraulic compactor from the building, only in the case of the poor technical condition of the building, and the compaction of the ground at lower depths (0.4 m and 1.2 m). As can be seen from the assessments summarized in Table 9, the least often to exceed the lower limit of the necessity of taking into account the dynamic impact on the building occurs in X3 mode—when the compactor works at distances smaller than 10 m, and when we consider that the building is in poor technical condition, or is placed on a ground with low stiffness or a non-continuous foundation.
An example of the assessment of the impact of recorded vibrations on the building in question using Reflex software from Brüel&Kjær according to the SWD-II scale [28] is shown in Figure 5.
After the completion of all of works related to the compaction of the soil near the building, a detailed inspection was carried out, which showed that there was no damage in the building—even cosmetic. The inspection was repeated after three months—with the same effect.
Considering the above, it should be stated that in the analyzed case that the guidelines of the Polish standard [28] are most likely too restrictive as regards the possible assessment of the actual harmfulness of vibrations to buildings. On the other hand, such stringent standard guidelines aim to significantly reduce the level of vibrations that propagated to the environment during construction works in the immediate vicinity of residential and public buildings, which is the most intentional from the point of view of the least possible interference of the construction process with the comfort of living and using of this type of objects, as it is well known that humans have a significantly lower threshold of vibration perception than building structures.
5. Conclusions
On the basis of the in-situ tests conducted, the following conclusions are made.
- The peak component particle accelerations (PPAi) recorded on the ground in three mutually perpendicular directions (x, y, and z) along the adopted measurement profile were usually two to three times higher when a tri-band hydraulic compactor type V8 from MTS was used than in the case of working at the same distances and on the same depths of the vibratory plate compactor type DPU 6055 from Wacker Neuson. For example, in the case of compaction taking place in closest vicinity of the building (stage III, Ls = 5 m) and recording data on the ground at the measuring point 4B (L4B = 3.75 m), the maximum PPAi values designated for the MTS V8 compactor operating in X1 mode were: PPAx = 6.580 m/s2, PPAy = 1.928 m/s2, PPAz = 12.215 m/s2. The corresponding values obtained for the DPU 6055 compactor were: 2.094 m/s2, 1.108 m/s2, and 3.571 m/s2.
- In general, in the case of the MTS V8 hydraulic compactor, the highest level of PPA vibrations recorded on the ground was obtained while the device was in X1 mode (operating frequency 38 Hz, centrifugal force of 90 kN). Smaller values were obtained when the machine was in X2 mode (45 Hz, 50 kN), the smallest—in X3 mode (60 Hz, 90 kN).
- The results of the measurements showed that surface vibrations, the source of which were the reversible plate compactor and the hydraulic compactor MTS V8, spread over a much greater distances than would result from the known theoretical dependence on the geometrical attenuation and absorption of vibrations in the ground. This fact should be explained by a more complex than assumed nature of the wave process occurring in the ground soil, and a greater inhomogeneity of the ground.
- The level of vibration acceleration generated during the operation of a vibrating plate compactor type DPU 6055 and recorded on the building was generally lower than in the case of the hydraulic compactor MTS V8. However, only a few cases were observed in stages I and II, when the reversible plate compactor generated higher peak component particle accelerations (PPAi), as recorded on the foundation wall of the building. This is the case with the corresponding example of the PPAx values generated by the DPU 6055 compactor and the MTS V8 compactor operating in X3 mode, at a distance of 15 m from the building, and at a compaction depth of h = 0.4 m (stage I: 0.111 m/s2 > 0.079 m/s2, Table 2), and PPAz values in the case of compactors operating at a distance of 10 m from the building and at a depth of 1.2 m (stage II: 0.486 m/s2 > 0.079 m/s2—MTS V8 in X2 mode, Table 3).
- Despite the fact that the vibrations in the building were clearly felt, and the assessment of their impact on the building carried out according to Polish standard PN-B-02170:2016-12 [28] indicated the possibility of at least cosmetic damages, visual inspection of the building did not yield even the smallest defects. Therefore, it should be concluded that an approximate assessment of the impact of vibrations transmitted by the ground surface on buildings carried out using the dynamic impacts (SWD) in accordance with the guidelines of the Polish standard may lead to too much of a cautious evaluation in similar cases.
- An assessment of the impact of vibrations transmitted by the ground surface on the building, based on the German standards DIN 4150-3:1999 [23], British BS 7385-2:1993 [25] and BS 5228-4:1992 [26] and the Swiss VSS- SN640-312a:1992 [27], showed a practical lack of impact of the work of the MTS V8 hydraulic compactor and the vibrating plate compactor DPU 6055 to deteriorate the technical condition of the building—regardless of the distance between compactors from the building (in the range of 5 m to 15 m), and the depth at which work-related to compaction of soil was carried out (to a depth of 1.8–2.0 m). The fact that no damage was found in the building in question, suggests that the guidelines contained in them regarding the recommended peak component particle velocities (PPVi), at which the building should not be damaged, were more reliable in the analyzed case than in the guidelines included in the Polish standard [28].
- Despite the fact that on the foundation wall of the building, peak component particle velocities were recorded at a lower level than the threshold values indicated in the DIN, BS, and VSS standards as limit values (at which there is no damage to buildings)—in the case of the tri-band hydraulic compactor type V8 from MTS working in the immediate vicinity of buildings is recommended to carry out work that is related to soil compaction in X3 mode. This mode is characterized by the highest value of the operating frequency of the device (60 Hz), which is the most deviating from the dominant natural frequencies of most buildings in traditional low-rise buildings.
- In engineering practice, the degree of soil heterogeneity can be very diverse, and each case should be approached individually. Therefore, the presented research results related to the propagation of vibrations and the assessment of their impact on buildings should not be concluded to an excessive measure. It also seems advisable to continue this line of research.
Author Contributions
Conceptualization, K.R.C. and W.G.; methodology, K.R.C. and W.G.; software, K.R.C.; validation, K.R.C. and W.G.; formal analysis, K.R.C.; investigation, K.R.C. and W.G.; resources, K.R.C. and W.G.; data curation, K.R.C.; writing—original draft preparation, K.R.C. (except Introduction) and W.G. (except Section 4.2); writing—review and editing, K.R.C. and W.G.; visualization, K.R.C.; supervision, K.R.C. and W.G.; project administration, K.R.C.; funding acquisition, K.R.C. and W.G.
Funding
This work, carried out at Bialystok University of Technology, was supported by Polish financial resources on science under project nos. S/WBiIS/1/2018 and S/WBiIS/2/2018.
Acknowledgments
The research was carried out with the use of equipment purchased from EU funds as part of the “Center for Modern Education of BUT” and “INNO-EKO-TECH” projects.
Conflicts of Interest
The authors declare no conflict of interest. The funders had no role in the design of the study; in the collection, analyses, or interpretation of data; in the writing of the manuscript, or in the decision to publish the results.
References
- Lombaert, G.; Degrande, G. Experimental validation of a numerical prediction model for free field traffic induced vibrations by in situ experiments. Soil Dyn. Earthq. Eng. 2001, 21, 485–497. [Google Scholar] [CrossRef]
- Hunaidia, O.; Guana, W.; Nicks, J. Building vibrations and dynamic pavement loads induced by transit buses. Soil Dyn. Earthq. Eng. 2000, 19, 435–453. [Google Scholar] [CrossRef]
- Mhanna, M.; Sadek, M.; Shahrour, I. Numerical modeling of traffic-induced ground vibration. Comput. Geotechn. 2012, 39, 116–123. [Google Scholar] [CrossRef]
- Kouroussis, G.; Connolly, D.P.; Verlinden, O. Railway-induced ground vibrations—A review of vehicle effects. Int. J. Rail Transp. 2014, 2, 69–110. [Google Scholar] [CrossRef]
- Jongmans, D. Prediction of ground vibrations caused by pile driving: A new methodology. Eng. Geol. 1996, 42, 25–36. [Google Scholar] [CrossRef]
- Masoumi, H.R.; Degrande, G.; Lombaert, G. Prediction of free field vibrations due to pile driving using a dynamic soil–structure interaction formulation. Soil Dyn. Earthq. Eng. 2007, 27, 126–143. [Google Scholar] [CrossRef]
- Czech, K.; Gosk, W. Analysis of the Vibration Propagation Induced by Pulling out of Sheet Pile Wall in a Close Neighbourhood of Existing Buildings. Procedia Eng. 2016, 143, 1460–1467. [Google Scholar] [CrossRef] [Green Version]
- Athanasopoulos, G.A.; Pelekis, P.C. Ground vibrations from sheet pile driving in urban environment: Measurements, analysis and effects on buildings and occupants. Soil Dyn. Earthq. Eng. 2000, 19, 371–387. [Google Scholar] [CrossRef]
- Persson, P.; Persson, K.; Sandberg, G. Reduction in ground vibrations by using shaped landscapes. Soil Dyn. Earthq. Eng. 2014, 60, 31–43. [Google Scholar] [CrossRef]
- Liyanapathirana, D.S.; Ekanayake, S.D. Application of EPS geofoam in attenuating ground vibrations during vibratory pile driving. Geotext. Geomembr. 2016, 44, 59–69. [Google Scholar] [CrossRef]
- Herbut, A. A study of the reduction of ground vibrations by an active generator. Soil Dyn. Earthq. Eng. 2016, 88, 328–344. [Google Scholar] [CrossRef]
- Ulgen, D.; Toygar, O. Screening effectiveness of open and in-filled wave barriers: A full-scale experimental study. Constr. Build. Mater. 2015, 86, 12–20. [Google Scholar] [CrossRef]
- Hiller, D.M.; Crabb, G.I. Groundborne Vibration Caused by Mechanised Construction Works; Report 429; Transport Research Laboratory: Crowthorne, Berkshire, UK, 2000. [Google Scholar]
- Hao, H. Measurement of plate compaction-induced ground vibrations. In Proceedings of the 23rd Australian Conference on the Mechanics of Structures and Materials (ACMSM23), Byron Bay, NSW, Australia, 9–12 December 2014; Southern Cross University: Lismore, Australia, 2014; Volume II, pp. 727–732. [Google Scholar]
- Wang, C. Effect of Hydraulic Plate Compactor and Lift Thickness on Utility Trench Backfill Compaction. Master’s Thesis, Department of Civil and Environmental Engineering, The Pennsylvania State University, State College, PA, USA, 2015. [Google Scholar]
- EN ISO 14668-1:2002, Geotechnical Investigation and Testing—Identification and Classification of Soil—Part 1: Identification and Description; European Committee for Standardization: Brussels, Belgium, 2002.
- EN ISO 14668-2:2004, Geotechnical Investigation and Testing—Identification and Classification of Soil—Part 2: Principles for a Classification; European Committee for Standardization: Brussels, Belgium, 2004.
- Czech, K.; Gosk, W. The Impact of Work of Hydraulic Compactor Type V8 from MTS on the Level of Vibrations Propagated to the Environment. Transportation Geotechnics and Geoecology, TGG 2017, 17–19 May 2017, Saint Petersburg, Russia. Procedia Eng. 2017, 189, 478–483. [Google Scholar] [CrossRef]
- Hao, H.; Ang, T.C.; Shen, J. Building vibration to traffic-induced ground motion. Build. Environ. 2001, 36, 321–336. [Google Scholar] [CrossRef]
- Zoccali, P.; Cantisani, G.; Loprencipe, G. Ground-vibrations induced by trains: Filled trenches mitigation capacity and length influence. Constr. Build. Mater. 2015, 74, 1–8. [Google Scholar] [CrossRef]
- Connolly, D.; Giannopoulos, A.; Forde, M.C. Numerical modelling of ground borne vibrations from high speed rail lines on embankments. Soil Dyn. Earthq. Eng. 2013, 46, 13–19. [Google Scholar] [CrossRef] [Green Version]
- ISO 4866:2010, Mechanical Vibration and Shock—Vibration of Fixed Structures—Guidelines for the Measurement of Vibrations and Evaluation of Their Effects on Structures; International Organization for Standardization: Geneve, Switzerland, 2010.
- DIN 4150-3:1999, Structural Vibration. Part 3: Effects of Vibration on Structures; DIN Deutsches Institut für Normung: Berlin, Germany, 1999.
- Jakobsen, J. Transmission of ground-borne vibration in buildings. J. Low Freq. Noise Vib. 1989, 8, 75–80. [Google Scholar] [CrossRef]
- BS 7385-2:1993, Evaluation and Measurement for Vibration in Buildings—Part 2: Guide to Damage Levels from Groundborne Vibration; British Standard Institution: London, UK, 1993.
- BS 5228-4:1992, Code of Practice for Noise and Vibration Control Applicable to Piling Operations; British Standard Institution: London, UK, 1992.
- VSS-SN640-312a:1992, Effects of Vibration on Construction; Swiss Consultants for Road Construction Association: Zurich, Switzerland, 1992.
- PN-B-02170:2016-12, Evaluation of the Harmfulness of Building Vibrations due to Ground Motion; PKN: Warsaw, Poland, 2016. (In Polish)
Figure 1.
Positioning and the numbering of measurement points and directions in stages I and II.

Figure 2.
Positioning and numbering of measurement points and directions in stage III.

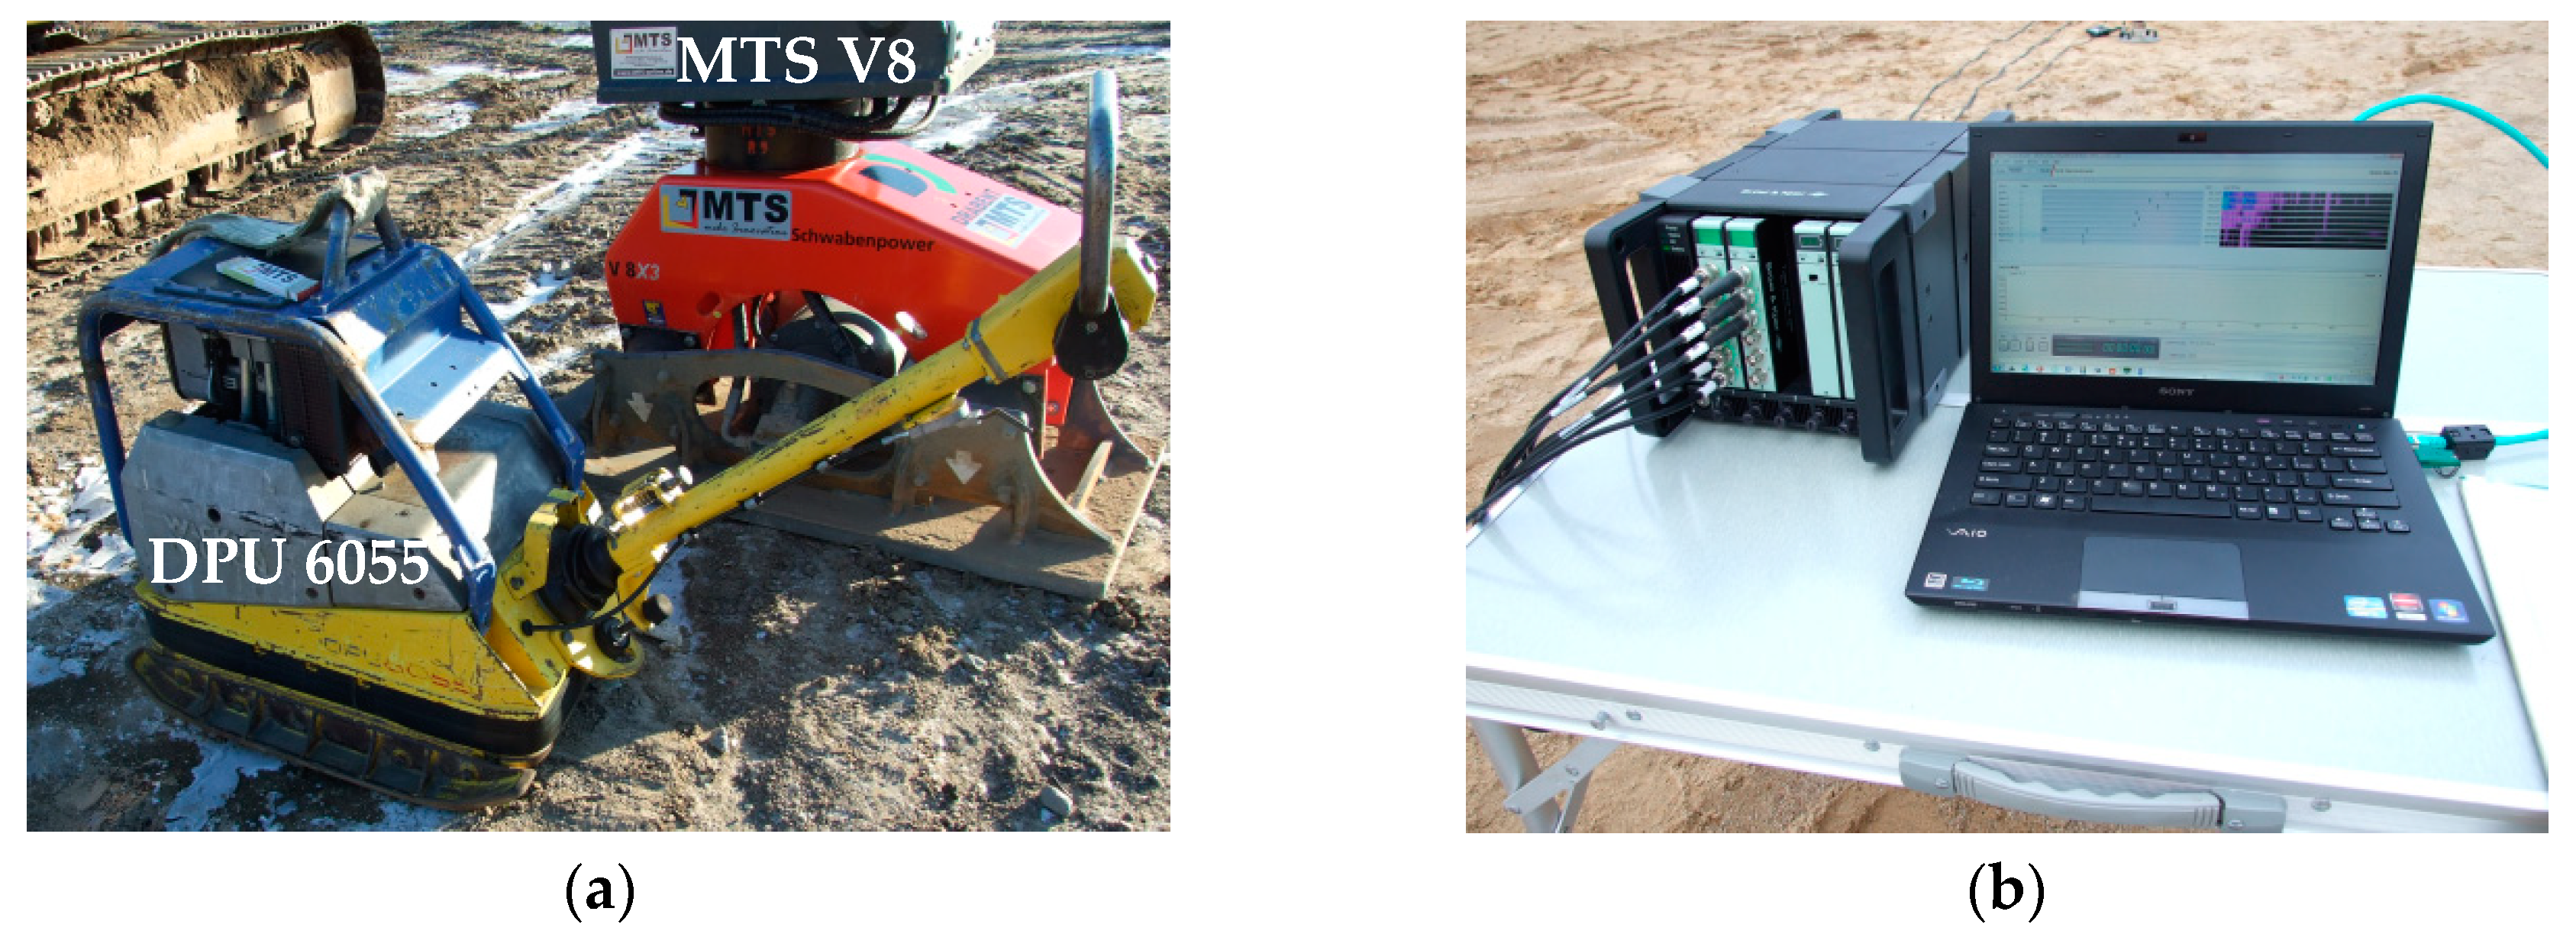
Figure 3.
A view of equipment used in the research: (a) Reversible plate compactor type DPU 6055 from Wacker Neuson and hydraulic compactor type V8 from MTS; (b) Test stand.
Figure 3.
A view of equipment used in the research: (a) Reversible plate compactor type DPU 6055 from Wacker Neuson and hydraulic compactor type V8 from MTS; (b) Test stand.

Figure 4.
The PPAs—stage III (source of vibration at the distance of 5 m from the building) in directions: (a)—x; (b)—y; (c)—z.
Figure 4.
The PPAs—stage III (source of vibration at the distance of 5 m from the building) in directions: (a)—x; (b)—y; (c)—z.

Figure 5.
An example of the assessment of vibration impact according to SWD-II scale—in directions, respectively: (a) x and (b) y (stage III, mode X1, h = 0.4 m).
Figure 5.
An example of the assessment of vibration impact according to SWD-II scale—in directions, respectively: (a) x and (b) y (stage III, mode X1, h = 0.4 m).


Table 1.
Fragmentary summary of the peak component particle acceleration (PPA) value set for the hydraulic compactor type V8 from MTS operating in mode X1 at a distance of Ls = 5 m from the building (stage III), m/s2.
Table 1.
Fragmentary summary of the peak component particle acceleration (PPA) value set for the hydraulic compactor type V8 from MTS operating in mode X1 at a distance of Ls = 5 m from the building (stage III), m/s2.
| Measurement Point | MP1 (building L1=0 m) | MP2B (L2B = 1.25 m) | MP3B (L3B = 2.50 m) | MP4B (L4B = 3.75 m) | ||||||||
|---|---|---|---|---|---|---|---|---|---|---|---|---|
| File Channel & Direction | 1x | 2y | 3z | 4x | 5y | 6z | 7x | 8y | 9z | 10x | 11y | 12z |
| MTS-V8_X1_40 cm-1 | 0.766 | 0.125 | 0.388 | 1.867 | 0.177 | 1.973 | 1.943 | 0.445 | 3.093 | 6.571 | 1.528 | 11.530 |
| MTS-V8_X1_40 cm-2 | 0.763 | 0.087 | 0.340 | 2.004 | 0.135 | 1.924 | 1.945 | 0.504 | 2.885 | 6.122 | 1.716 | 11.269 |
| MTS-V8_X1_40 cm-3 | 0.790 | 0.132 | 0.405 | 2.018 | 0.131 | 1.992 | 1.909 | 0.552 | 2.911 | 6.519 | 1.880 | 12.198 |
| MTS-V8_X1_40 cm-4 | 0.785 | 0.109 | 0.438 | 1.996 | 0.310 | 2.013 | 1.922 | 0.573 | 2.902 | 6.580 | 1.928 | 12.215 |
| MTS-V8_X1_120 cm-1 | 0.647 | 0.149 | 0.420 | 1.482 | 0.235 | 1.276 | 0.765 | 0.359 | 3.293 | 1.977 | 0.462 | 3.552 |
| MTS-V8_X1_120 cm-2 | 0.569 | 0.147 | 0.307 | 1.381 | 0.281 | 0.730 | 0.817 | 0.368 | 1.838 | 1.071 | 0.461 | 2.425 |
| MTS-V8_X1_120 cm-3 | 0.573 | 0.147 | 0.309 | 1.407 | 0.284 | 0.749 | 0.838 | 0.367 | 1.854 | 1.015 | 0.457 | 2.483 |
| MTS-V8_X1_120 cm-4 | 0.583 | 0.157 | 0.312 | 1.434 | 0.336 | 0.747 | 0.835 | 0.371 | 1.836 | 1.140 | 0.537 | 2.431 |
| MTS-V8_X1_190 cm-1 | 0.420 | 0.198 | 0.365 | 1.689 | 0.506 | 1.300 | 0.983 | 0.596 | 1.371 | 1.920 | 0.964 | 2.449 |
| MTS-V8_X1_190 cm-2 | 0.373 | 0.175 | 0.305 | 1.357 | 0.379 | 0.682 | 1.022 | 0.475 | 1.069 | 1.881 | 0.684 | 2.295 |
| MTS-V8_X1_190 cm-3 | 0.308 | 0.163 | 0.261 | 1.247 | 0.350 | 0.531 | 0.975 | 0.460 | 0.936 | 1.404 | 0.584 | 1.954 |
| MTS-V8_X1_190 cm-4 | 0.306 | 0.226 | 0.314 | 1.152 | 0.328 | 0.394 | 0.904 | 0.470 | 0.881 | 1.671 | 0.577 | 1.754 |
Table 2.
Summary of PPAs—stage I (source of vibration Ls = 15 m), m/s2.
| Stage/Mode/Depth of Compaction | x–Direction | y–Direction | z–Direction | |||||||||
|---|---|---|---|---|---|---|---|---|---|---|---|---|
| 0 m | 2.5 m | 5 m | 7.5 m | 0 m | 2.5 m | 5 m | 7.5 m | 0 m | 2.5 m | 5 m | 7.5 m | |
| MTS V8/X1/0.4 m | 0.166 | 0.294 | 0.175 | 0.421 | 0.029 | 0.132 | 0.154 | 0.178 | 0.100 | 0.293 | 0.569 | 0.546 |
| MTS V8/X1/1.2 m | 0.212 | 0.315 | 0.158 | 0.461 | 0.031 | 0.113 | 0.178 | 0.241 | 0.102 | 0.318 | 0.469 | 0.304 |
| MTS V8/X1/2.0 m | 0.230 | 0.240 | 0.189 | 0.351 | 0.024 | 0.281 | 0.194 | 0.335 | 0.098 | 0.277 | 0.482 | 0.460 |
| MTS V8/X2/0.4 m | 0.235 | 0.182 | 0.146 | 0.187 | 0.074 | 0.091 | 0.146 | 0.056 | 0.073 | 0.142 | 0.249 | 0.222 |
| MTS V8/X2/1.2 m | 0.136 | 0.192 | 0.187 | 0.195 | 0.028 | 0.081 | 0.107 | 0.115 | 0.099 | 0.157 | 0.302 | 0.298 |
| MTS V8/X2/2.0 m | 0.080 | 0.096 | 0.143 | 0.146 | 0.020 | 0.056 | 0.087 | 0.093 | 0.094 | 0.250 | 0.263 | 0.261 |
| MTS V8/X3/0.4 m | 0.079 | 0.098 | 0.149 | 0.209 | 0.028 | 0.058 | 0.041 | 0.100 | 0.096 | 0.403 | 0.251 | 0.444 |
| MTS V8/X3/1.2 m | 0.111 | 0.124 | 0.198 | 0.291 | 0.029 | 0.050 | 0.039 | 0.133 | 0.116 | 0.434 | 0.196 | 0.451 |
| MTS V8/X3/2.0 m | 0.106 | 0.147 | 0.152 | 0.220 | 0.074 | 0.055 | 0.065 | 0.070 | 0.097 | 0.329 | 0.307 | 0.281 |
| Plate comp./0.4 m | 0.111 | 0.066 | 0.078 | 0.130 | 0.047 | 0.040 | 0.037 | 0.047 | 0.052 | 0.135 | 0.188 | 0.248 |
| Plate comp./1.2 m | 0.047 | 0.074 | 0.084 | 0.169 | 0.019 | 0.042 | 0.046 | 0.057 | 0.057 | 0.132 | 0.201 | 0.234 |
| Plate comp./2.0 m | 0.042 | 0.045 | 0.061 | 0.178 | 0.013 | 0.031 | 0.037 | 0.059 | 0.036 | 0.067 | 0.157 | 0.155 |
Table 3.
Summary of PPAs—stage II (source of vibration Ls = 10 m), m/s2.
| Stage/Mode/Depth of Compaction | x–Direction | y–Direction | z–Direction | |||||||||
|---|---|---|---|---|---|---|---|---|---|---|---|---|
| 0 m | 2.5 m | 5 m | 7.5 m | 0 m | 2.5 m | 5 m | 7.5 m | 0 m | 2.5 m | 5 m | 7.5 m | |
| MTS V8/X1/0.4 m | 0.226 | 0.379 | 0.523 | 1.984 | 0.043 | 0.186 | 0.128 | 0.628 | 0.103 | 0.423 | 1.240 | 1.494 |
| MTS V8/X1/1.2 m | 0.188 | 0.438 | 0.641 | 0.967 | 0.055 | 0.230 | 0.181 | 0.698 | 0.135 | 0.612 | 1.417 | 1.840 |
| MTS V8/X1/1.8 m | 0.187 | 0.471 | 0.694 | 1.150 | 0.043 | 0.226 | 0.221 | 0.350 | 0.087 | 0.264 | 1.063 | 2.195 |
| MTS V8/X2/0.4 m | 0.201 | 0.335 | 0.813 | 1.711 | 0.081 | 0.198 | 0.169 | 0.440 | 0.092 | 0.596 | 1.231 | 1.429 |
| MTS V8/X2/1.2 m | 0.157 | 0.295 | 0.833 | 1.076 | 0.043 | 0.130 | 0.198 | 0.386 | 0.079 | 0.653 | 1.014 | 1.372 |
| MTS V8/X2/1.9 m | 0.094 | 0.149 | 0.503 | 0.507 | 0.029 | 0.104 | 0.167 | 0.387 | 0.099 | 0.259 | 0.801 | 1.544 |
| MTS V8/X3/0.4 m | 0.121 | 0.218 | 0.655 | 1.347 | 0.046 | 0.096 | 0.174 | 0.365 | 0.114 | 0.492 | 1.141 | 1.325 |
| MTS V8/X3/1.2 m | 0.170 | 0.321 | 0.749 | 0.703 | 0.041 | 0.182 | 0.163 | 0.277 | 0.148 | 0.627 | 1.304 | 1.752 |
| MTS V8/X3/1.9 m | 0.122 | 0.146 | 0.362 | 1.034 | 0.076 | 0.149 | 0.163 | 0.415 | 0.111 | 0.246 | 0.796 | 2.000 |
| Plate comp./0.4 m | 0.093 | 0.106 | 0.256 | 0.967 | 0.035 | 0.056 | 0.098 | 0.395 | 0.083 | 0.274 | 0.466 | 0.969 |
| Plate comp./1.2 m | 0.195 | 0.060 | 0.089 | 0.130 | 0.063 | 0.283 | 0.310 | 0.089 | 0.486 | 0.561 | 0.232 | 1.156 |
| Plate comp./1.8 m | 0.076 | 0.096 | 0.337 | 0.481 | 0.033 | 0.072 | 0.102 | 0.357 | 0.090 | 0.248 | 0.395 | 1.291 |
Table 4.
Summary of PPAs—stage III (source of vibration Ls = 5 m), m/s2.
| Stage/Mode/Depth of Compaction | x–Direction | y–Direction | z–Direction | |||||||||
|---|---|---|---|---|---|---|---|---|---|---|---|---|
| 0 m | 1.25 m | 2.5 m | 3.75 m | 0 m | 1.25 m | 2.5 m | 3.75 m | 0 m | 1.25 m | 2.5 m | 3.75 m | |
| MTS V8/X1/0.4 m | 0.790 | 2.018 | 1.945 | 6.580 | 0.132 | 0.310 | 0.573 | 1.928 | 0.438 | 2.013 | 3.093 | 12.215 |
| MTS V8/X1/1.2 m | 0.647 | 1.482 | 0.838 | 1.977 | 0.157 | 0.336 | 0.371 | 0.537 | 0.420 | 1.276 | 3.293 | 3.552 |
| MTS V8/X1/1.9 m | 0.420 | 1.689 | 1.022 | 1.920 | 0.226 | 0.506 | 0.596 | 0.964 | 0.365 | 1.300 | 1.371 | 2.449 |
| MTS V8/X2/0.4 m | 0.376 | 0.950 | 1.270 | 4.718 | 0.204 | 0.321 | 0.669 | 1.304 | 0.913 | 1.913 | 2.132 | 8.063 |
| MTS V8/X2/1.2 m | 0.294 | 0.890 | 0.995 | 1.228 | 0.104 | 0.467 | 0.549 | 0.673 | 0.284 | 1.430 | 1.333 | 2.047 |
| MTS V8/X2/1.9 m | 0.229 | 1.005 | 1.517 | 2.222 | 0.101 | 0.462 | 0.342 | 0.349 | 0.339 | 1.329 | 0.969 | 2.312 |
| MTS V8/X3/0.4 m | 0.531 | 1.425 | 1.565 | 5.464 | 0.230 | 0.242 | 0.571 | 1.764 | 1.051 | 2.343 | 2.817 | 9.774 |
| MTS V8/X3/1.2 m | 0.222 | 0.809 | 0.868 | 1.210 | 0.108 | 0.560 | 0.543 | 0.557 | 0.250 | 1.267 | 1.642 | 1.720 |
| MTS V8/X3/1.9 m | 0.213 | 0.748 | 1.570 | 2.664 | 0.086 | 0.455 | 0.454 | 0.585 | 0.267 | 1.282 | 1.858 | 2.676 |
| Plate comp./0.4 m | 0.225 | 0.559 | 0.476 | 2.094 | 0.108 | 0.211 | 0.318 | 1.108 | 0.316 | 0.735 | 1.300 | 3.571 |
| Plate comp./1.2 m | 0.175 | 0.435 | 0.412 | 0.503 | 0.054 | 0.168 | 0.168 | 0.273 | 0.163 | 0.590 | 1.127 | 1.591 |
| Plate comp./1.9 m | 0.163 | 0.401 | 0.416 | 0.926 | 0.071 | 0.209 | 0.218 | 0.440 | 0.241 | 0.596 | 0.937 | 1.178 |
Table 5.
Peak component particle velocities at the foundation wall of the building—stage I, mm/s.
| Device/Mode/Depth of Compaction | PPVx | PPVy | PPVz |
|---|---|---|---|
| MTS V8/X1/0.4 m | 0.615 | 0.268 | 0.523 |
| MTS V8/X1/1.2 m | 0.708 | 0.195 | 0.369 |
| MTS V8/X1/2.0 m | 0.550 | 0.205 | 0.388 |
| MTS V8/X2/0.4 m | 0.493 | 0.258 | 0.296 |
| MTS V8/X2/1.2 m | 0.577 | 0.217 | 0.334 |
| MTS V8/X2/2.0 m | 0.336 | 0.204 | 0.360 |
| MTS V8/X3/0.4 m | 0.329 | 0.226 | 0.318 |
| MTS V8/X3/1.2 m | 0.273 | 0.217 | 0.342 |
| MTS V8/X3/2.0 m | 0.222 | 0.174 | 0.300 |
| Plate compactor/0.4 m | 0.193 | 0.195 | 0.332 |
| Plate compactor/1.2 m | 0.230 | 0.220 | 0.325 |
| Plate compactor/2.0 m | 0.225 | 0.145 | 0.215 |
| Max PPVi = | 0.708 | 0.268 | 0.523 |
Table 6.
Peak component particle velocities at the foundation wall of the building—stage II, mm/s.
| Device/Mode/Depth of Compaction | PPVx | PPVy | PPVz |
|---|---|---|---|
| MTS V8/X1/0.4 m | 0.821 | 0.191 | 0.424 |
| MTS V8/X1/1.2 m | 0.671 | 0.254 | 0.428 |
| MTS V8/X1/1.8 m | 0.592 | 0.257 | 0.415 |
| MTS V8/X2/0.4 m | 0.786 | 0.273 | 0.329 |
| MTS V8/X2/1.2 m | 0.643 | 0.232 | 0.377 |
| MTS V8/X2/1.9 m | 0.437 | 0.217 | 0.402 |
| MTS V8/X3/0.4 m | 0.403 | 0.184 | 0.397 |
| MTS V8/X3/1.2 m | 0.530 | 0.216 | 0.444 |
| MTS V8/X3/1.9 m | 0.415 | 0.244 | 0.283 |
| Plate compactor/0.4 m | 0.821 | 0.191 | 0.424 |
| Plate compactor/1.2 m | 0.300 | 0.220 | 0.412 |
| Plate compactor/1.8 m | 0.260 | 0.242 | 0.268 |
| Max PPVi = | 0.821 | 0.273 | 0.444 |
Table 7.
Peak component particle velocities at the foundation wall of the building—stage III, mm/s.
| Device/Mode/Depth of Compaction | PPVx | PPVy | PPVz |
|---|---|---|---|
| MTS V8/X1/0.4 m | 2.355 | 0.328 | 0.775 |
| MTS V8/X1/1.2 m | 1.673 | 0.503 | 0.843 |
| MTS V8/X1/1.9 m | 1.281 | 0.653 | 1.158 |
| MTS V8/X2/0.4 m | 1.059 | 0.384 | 0.584 |
| MTS V8/X2/1.2 m | 0.978 | 0.435 | 0.613 |
| MTS V8/X2/1.9 m | 0.685 | 0.327 | 0.786 |
| MTS V8/X3/0.4 m | 0.936 | 0.297 | 0.606 |
| MTS V8/X3/1.2 m | 0.612 | 0.352 | 0.523 |
| MTS V8/X3/1.9 m | 0.491 | 0.249 | 0.489 |
| Plate compactor/0.4 m | 0.532 | 0.246 | 0.515 |
| Plate compactor/1.2 m | 0.380 | 0.202 | 0.406 |
| Plate compactor/1.9 m | 0.408 | 0.274 | 0.371 |
| Max PPVi = | 2.355 | 0.653 | 1.158 |
Table 8.
Peak component particle velocities at the foundation wall of the building (signal integration using Sigview software)—stage III, mm/s.
Table 8.
Peak component particle velocities at the foundation wall of the building (signal integration using Sigview software)—stage III, mm/s.
| Device/Mode/Depth of Compaction | PPVx | PPVy | PPVz |
|---|---|---|---|
| MTS V8/X1/0.4 m | 2.228 | 0.185 | 0.893 |
| MTS V8/X1/1.2 m | 1.892 | 0.343 | 0.860 |
| MTS V8/X1/1.9 m | 1.270 | 0.574 | 1.165 |
Table 9.
Impact of vibrations on a residential building according to the dynamic impact scale SWD-II (in Polish “Skala Wpływów Dynamicznych II”) [28].
Table 9.
Impact of vibrations on a residential building according to the dynamic impact scale SWD-II (in Polish “Skala Wpływów Dynamicznych II”) [28].
| Stage No. (Distance)/Technical Condition of Build. | I (Ls = 15 m) | II (Ls = 10 m) | III (Ls = 5 m) | |||||||||
|---|---|---|---|---|---|---|---|---|---|---|---|---|
| Good | Bad | Good | Bad | Good | Bad | |||||||
| Device/Mode/Depth of Comp. | 1x | 2y | 1x | 2y | 1x | 2y | 1x | 2y | 1x | 2y | 1x | 2y |
| MTS V8/X1/0.4 m | I | I | II | I | II | I | II | I | II | I | III | I |
| MTS V8/X1/1.2 m | I | I | II | I | I | I | II | I | II | I | III | I |
| MTS V8/X1/1.8–2.0 m | II | I | II | I | I | I | II | I | II | I | II | II |
| MTS V8/X2/0.4 m | I | I | II | I | II | I | II | I | II | I | II | I |
| MTS V8/X2/1.2 m | I | I | II | I | I | I | II | I | II | I | II | II |
| MTS V8/X2/1.9-2.0 m | I | I | I | I | I | I | II | I | I | I | II | I |
| MTS V8/X3/0.4 m | I | I | I | I | I | I | I | I | II | I | II | I |
| MTS V8/X3/1.2 m | I | I | I | I | I | I | II | I | I | I | II | I |
| MTS V8/X3/1.9–2.0 m | I | I | I | I | I | I | I | I | I | I | I | I |
| Plate compactor/0.4 m | I | I | I | I | I | I | I | I | I | I | I | I |
| Plate compactor/1.2 m | I | I | I | I | I | I | I | I | I | I | I | I |
| Plate compactor/1.8–2.0 m | I | I | I | I | I | I | I | I | I | I | I | I |
© 2019 by the authors. Licensee MDPI, Basel, Switzerland. This article is an open access article distributed under the terms and conditions of the Creative Commons Attribution (CC BY) license (http://creativecommons.org/licenses/by/4.0/).
Share and Cite
MDPI and ACS Style
Czech, K.R.; Gosk, W. Impact of the Operation of a Tri-Band Hydraulic Compactor on the Technical Condition of a Residential Building. Appl. Sci. 2019, 9, 336. https://0-doi-org.brum.beds.ac.uk/10.3390/app9020336
AMA Style
Czech KR, Gosk W. Impact of the Operation of a Tri-Band Hydraulic Compactor on the Technical Condition of a Residential Building. Applied Sciences. 2019; 9(2):336. https://0-doi-org.brum.beds.ac.uk/10.3390/app9020336
Chicago/Turabian StyleCzech, Krzysztof R., and Wojciech Gosk. 2019. "Impact of the Operation of a Tri-Band Hydraulic Compactor on the Technical Condition of a Residential Building" Applied Sciences 9, no. 2: 336. https://0-doi-org.brum.beds.ac.uk/10.3390/app9020336
Note that from the first issue of 2016, this journal uses article numbers instead of page numbers. See further details here.