Addressable Refraction and Curved Soliton Waveguides Using Electric Interfaces


Department of Fundamental and Applied Sciences for Engineering (SBAI), Sapienza Università di Roma, 00161 Roma, Italy
*
Author to whom correspondence should be addressed.
Appl. Sci. 2019, 9(2), 347; https://0-doi-org.brum.beds.ac.uk/10.3390/app9020347
Submission received: 13 December 2018
/
Revised: 11 January 2019
/
Accepted: 13 January 2019
/
Published: 21 January 2019
(This article belongs to the Special Issue Nonlinear Optical Materials and Phenomena)
Abstract
:Featured Application
Fully addressable complex 3D photonic circuits based on solitonic waveguides using straight and curved trajectories.
Abstract
A great deal of interest over the years has been directed to the optical space solitons for the possibility of realizing 3D waveguides with very low propagation losses. A great limitation in their use for writing complex circuits is represented by the impossibility of making curved structures. In the past, solitons in nematic liquid crystals, called nematicons, were reflected on electrical interfaces, and more recently photorefractive spatial solitons have been, as well. In the present work, we investigate refraction and total reflection of spatial solitons with saturable electro-optic nonlinearity, such as the photorefractive ones, on an electric wall acting as a reflector. Using a custom FDTD code, the propagation of a self-confined beam was analyzed as a function of the applied electric bias. The electrical reflector was simulated by applying different biases in two adjacent volumes. We observed both smaller and larger angles of refraction, up to the critical π/2-refraction condition, and then the total reflection. The radii of curvature of the associated guides can be varied from centimeters down to hundreds of microns. The straight guides showed losses as low as 0.07 dB/cm as previously observed, while the losses associated with single curves were estimated to be as low as 0.2 dB.
1. Introduction
A great deal of attention over the years has been given to the implications and technological applications that could develop from optical spatial solitons [1,2,3,4]. With the expression “spatial soliton”, we mean light beams that, by modifying the refractive index of the host material, self-confine themselves. That is, these light beams achieve a balance between natural diffraction and nonlinear self-focusing. The result is the writing of modified refractive index channels that behave like waveguides, both for the light that wrote them and for other signals that are injected inside them [5,6]. Being self-written, the solitonic waveguides exhibit very low propagation losses [7], and above all can be made anywhere in the volume of the host material (i.e., they are perfect 3D structures), in contrast to traditional waveguides, which are instead superficial [8,9]. Therefore, the use of solitonic guides opens up the possibility of realizing volume circuits with low losses, even if a great limitation to their development is represented by the impossibility of bending such guides and consequently creating complex configurations. In actuality, photorefractive spatial solitons show natural bending [10], the control of which, through the application of background illuminations, is not reliable. Writing complex circuits simply by exploiting natural bending seems like a titanic job. In the past, R. Jäger et al. [11,12] have made specular reflections of beams and solitonic guides from the physical edges of the crystals within which they were made, with propagation losses mainly linked to the quality of the surfaces’ polishing. This method was effective and expedient, but did not yet allow for the realizing of real complex integrated circuits.
Studies on liquid crystals, which have extremely high nonlinearities, have shown that it is possible to make nematicons [13] and reflect them on electric interfaces [14]. Such reflections and/or refractions are extremely interesting, because they are addressable, and therefore facilitate acute control of the direction of propagation of the beam. Under the total reflection regime, Giant Goos-Hänchen shifts of the self-confined beams were observed [15,16]. It was shown that self-confined beams do not behave like light rays, but as “massive” entities, and therefore show important inertia in the total reflection process, much more similar to an elastic bump than standard light reflection [17].
Recently, M. Alonzo et al. [18] observed for the first time the total reflection of a photorefractive spatial soliton in pyroliton configuration on an electric interface. In the present work, we investigate, from a numerical perspective, both the refraction and reflection of spatial solitonic waveguides obtained in materials with saturable electro-optic nonlinearity, i.e., those associated with the photorefractive screening solitons. The focus here is on the analysis of the waveguide properties, demonstrating how a fine-tuning of the interfaces would allow for increased control of the guides’ reflection and refraction, and therefore their active addressing.
2. Materials and Methods
We performed numerical experiments of propagation of soliton beams in biased media using a well-tested FDTD numerical code [19]. The experimental configuration considers a visible beam at 532 nm entering a material with saturable electro-optic nonlinearity, to which a static electric bias is applied. The experimental conditions are such that this beam is self-confined and eventually reaches the spatial soliton regime. In what follows, we will call this visible beam the writing beam, and we will indicate its electric field amplitude as AW. We consider it the writing beam because it is the one interacting with the nonlinear host and, as a consequence, writing the nonlinear modification of the refractive index (the solitonic waveguide). Overlapped with the writing beam, a second IR beam (at 800 nm) is injected in the experiment. This second beam will be called the signal beam, and its electric field amplitude AS is as follows: it represents any information or data that can be transported within the soliton waveguide. Its IR wavelength ensures that it is not able to interact with the host material and to modify or destroy the waveguide.
The nonlinear propagation of these two beams (AW and AS) is described by the following set of Helmholtz equations for an electro-optic saturable nonlinearity:
where Ai represents either AW or AS, while is the nonlinear electro-optic dielectric constant, Ebias is an external electrical bias (a static electric field induced along the sample thickness by an applied static voltage) necessary for photorefractive screening solitons [6] and |Asat|2 is the saturation intensity of the nonlinearity. Please note that only AW contributes to the nonlinear variation of the refractive index (the denominator of the last term in the equation). We have used the numerical data corresponding to an intrinsically pure z-cut Lithium Niobate single crystal. We have neglected the photovoltaic effect from the calculation. For this material and for e-polarized light, gets the form
where the extraordinary refractive index is equal to ne = 2.2332, and the electro-optic coefficient r33 = 32 pm/V. With respect to the beam amplitude, typical values of are between 1 and 10, i.e., in a regime of efficient saturation of the optical nonlinearity.
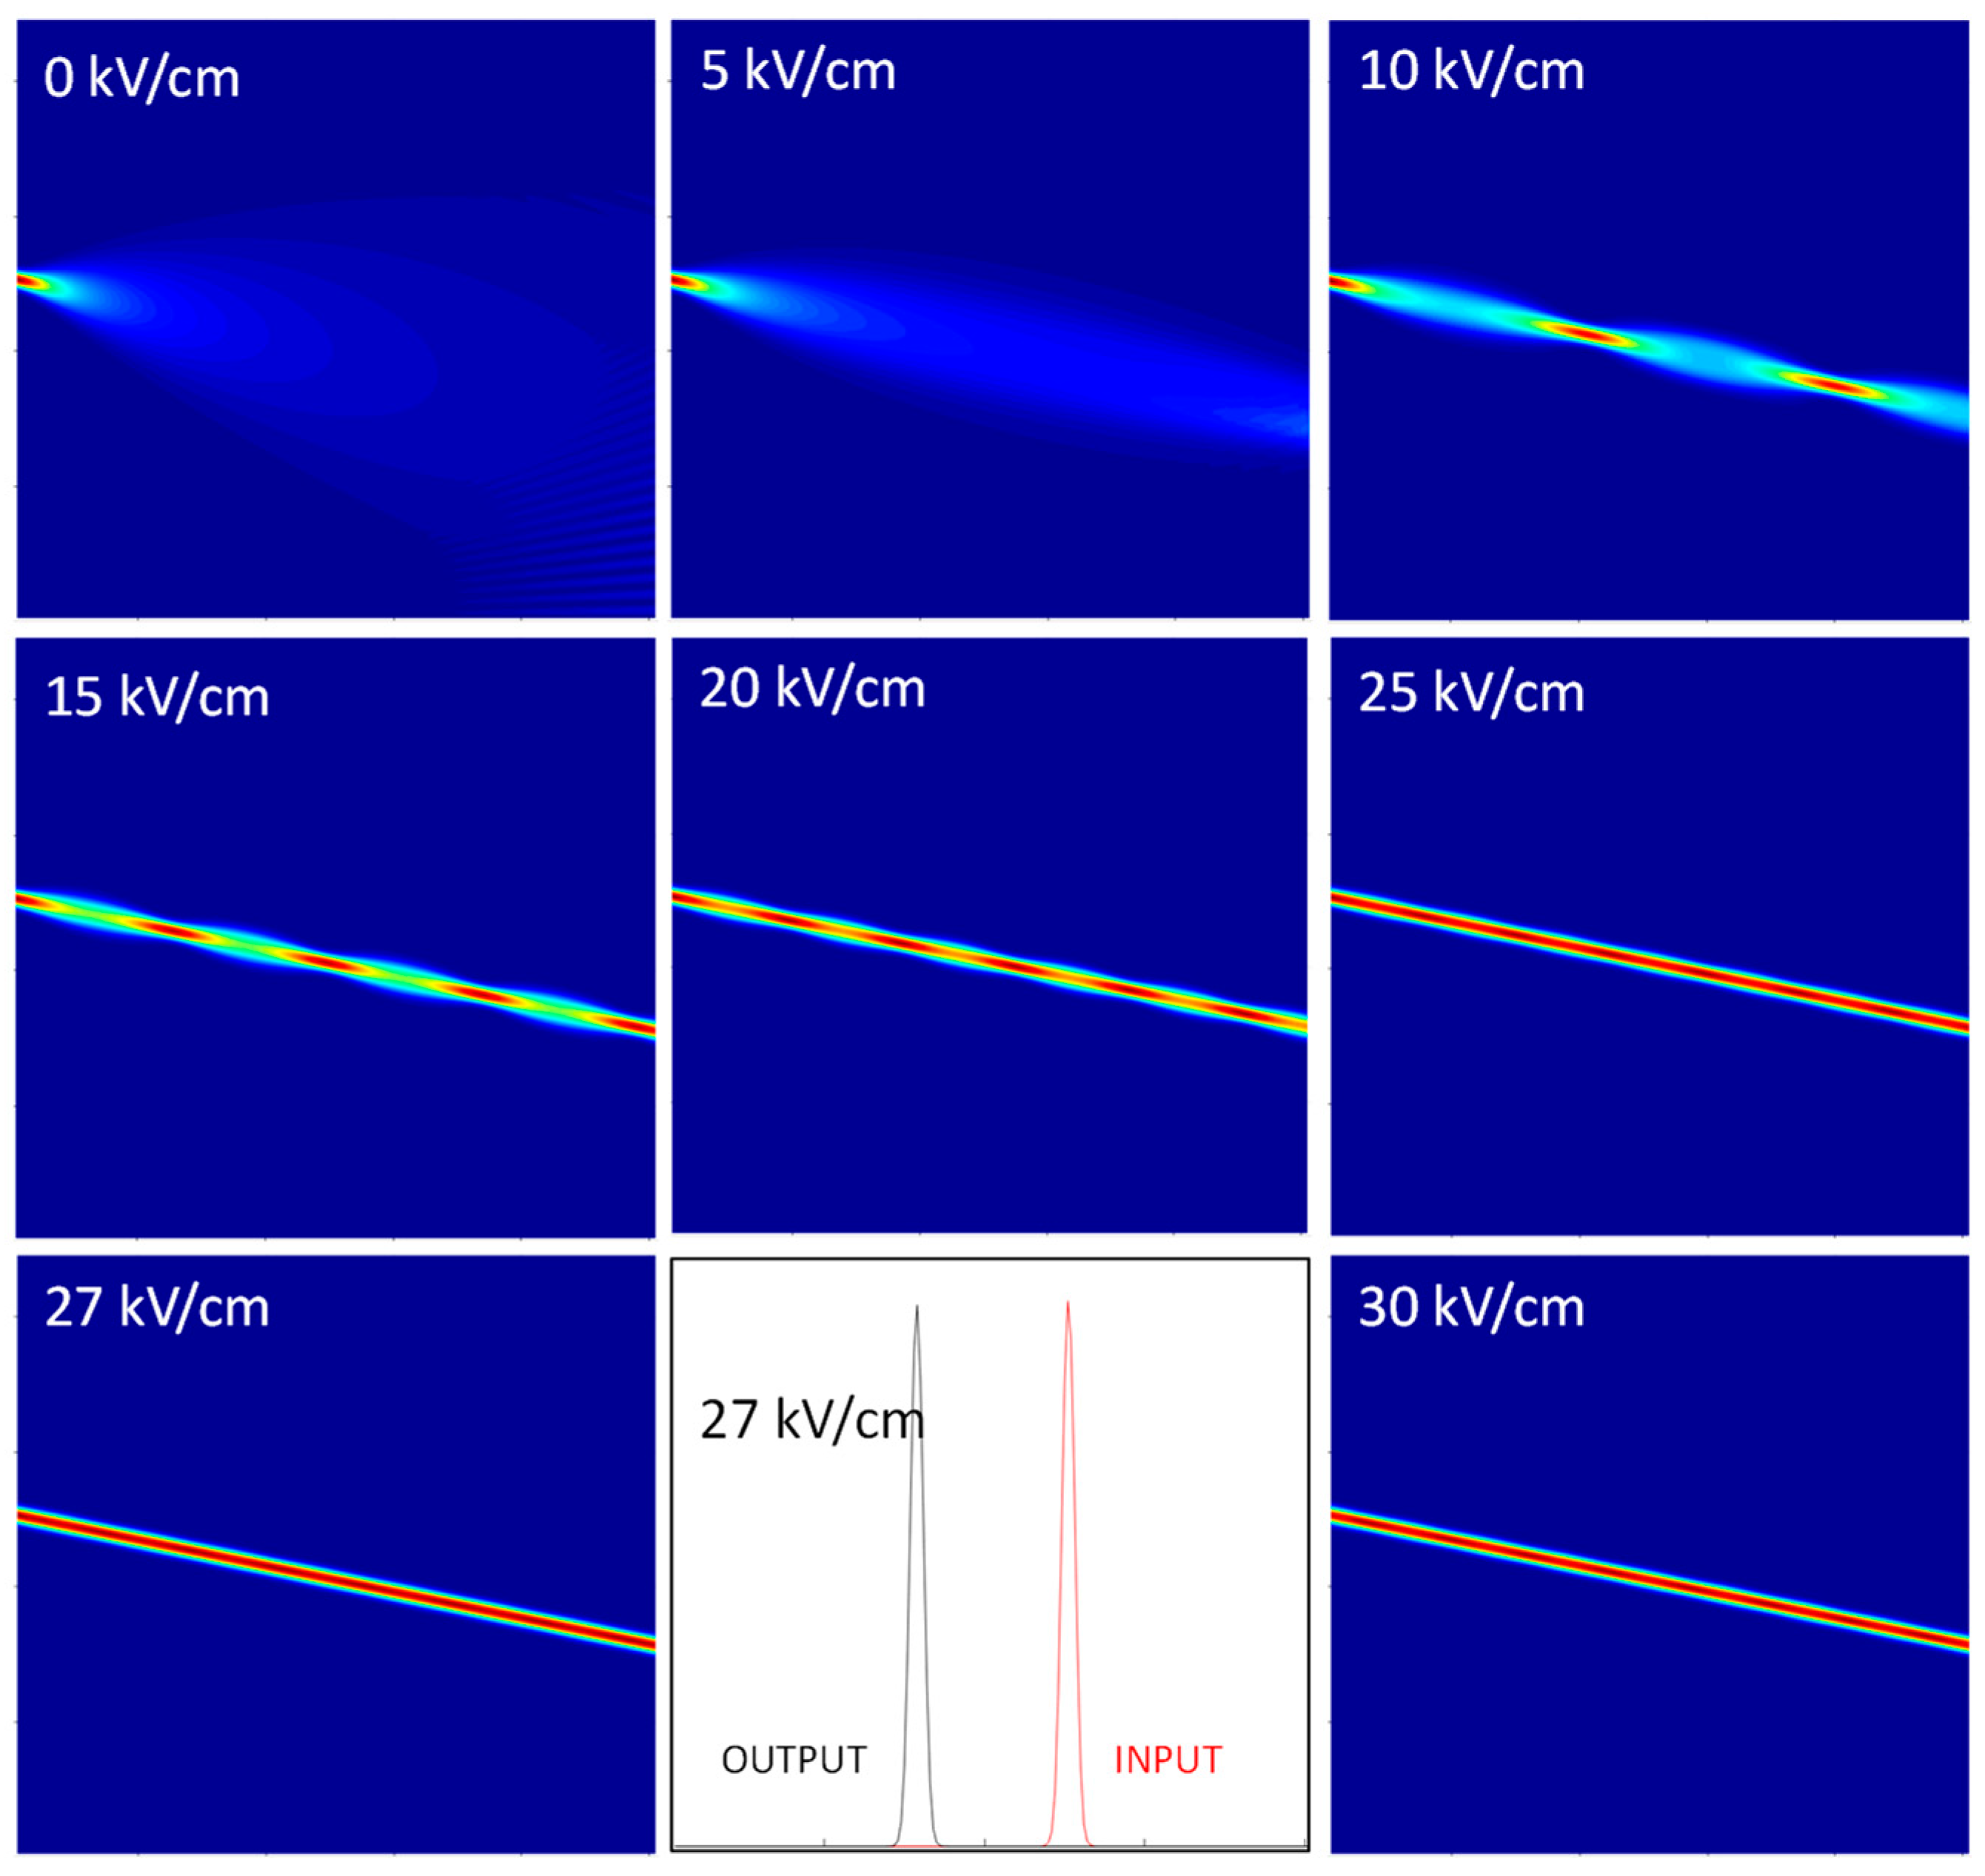
To begin with, self-focusing, self-confinement and solitonic regimes were identified, as shown in Figure 1.
Without bias, the light beam diffracts. Increasing the electric bias (5 kV/cm) causes self-focusing to occur, forcing the beam not to diverge. At about 10 kV/cm, the light becomes self-confined, even if a strong pulsing takes place as a consequence of continuous focusing and diffraction processes [20]. This pulsing regime continues for higher biases, up to 20–25 kV/cm; at these values, pulsing is so rapid that the oscillations almost disappear (the analysis of the signal beam shall reveal that pulsing is always present at every bias, with different oscillation period that depends on the value of the applied voltage). At 27 kV/cm the writing beam reaches the solitonic regime: input and output transverse profiles are similar, and no evident oscillations are detectable. At higher biases, the beam dynamics follows the solitonic regime.
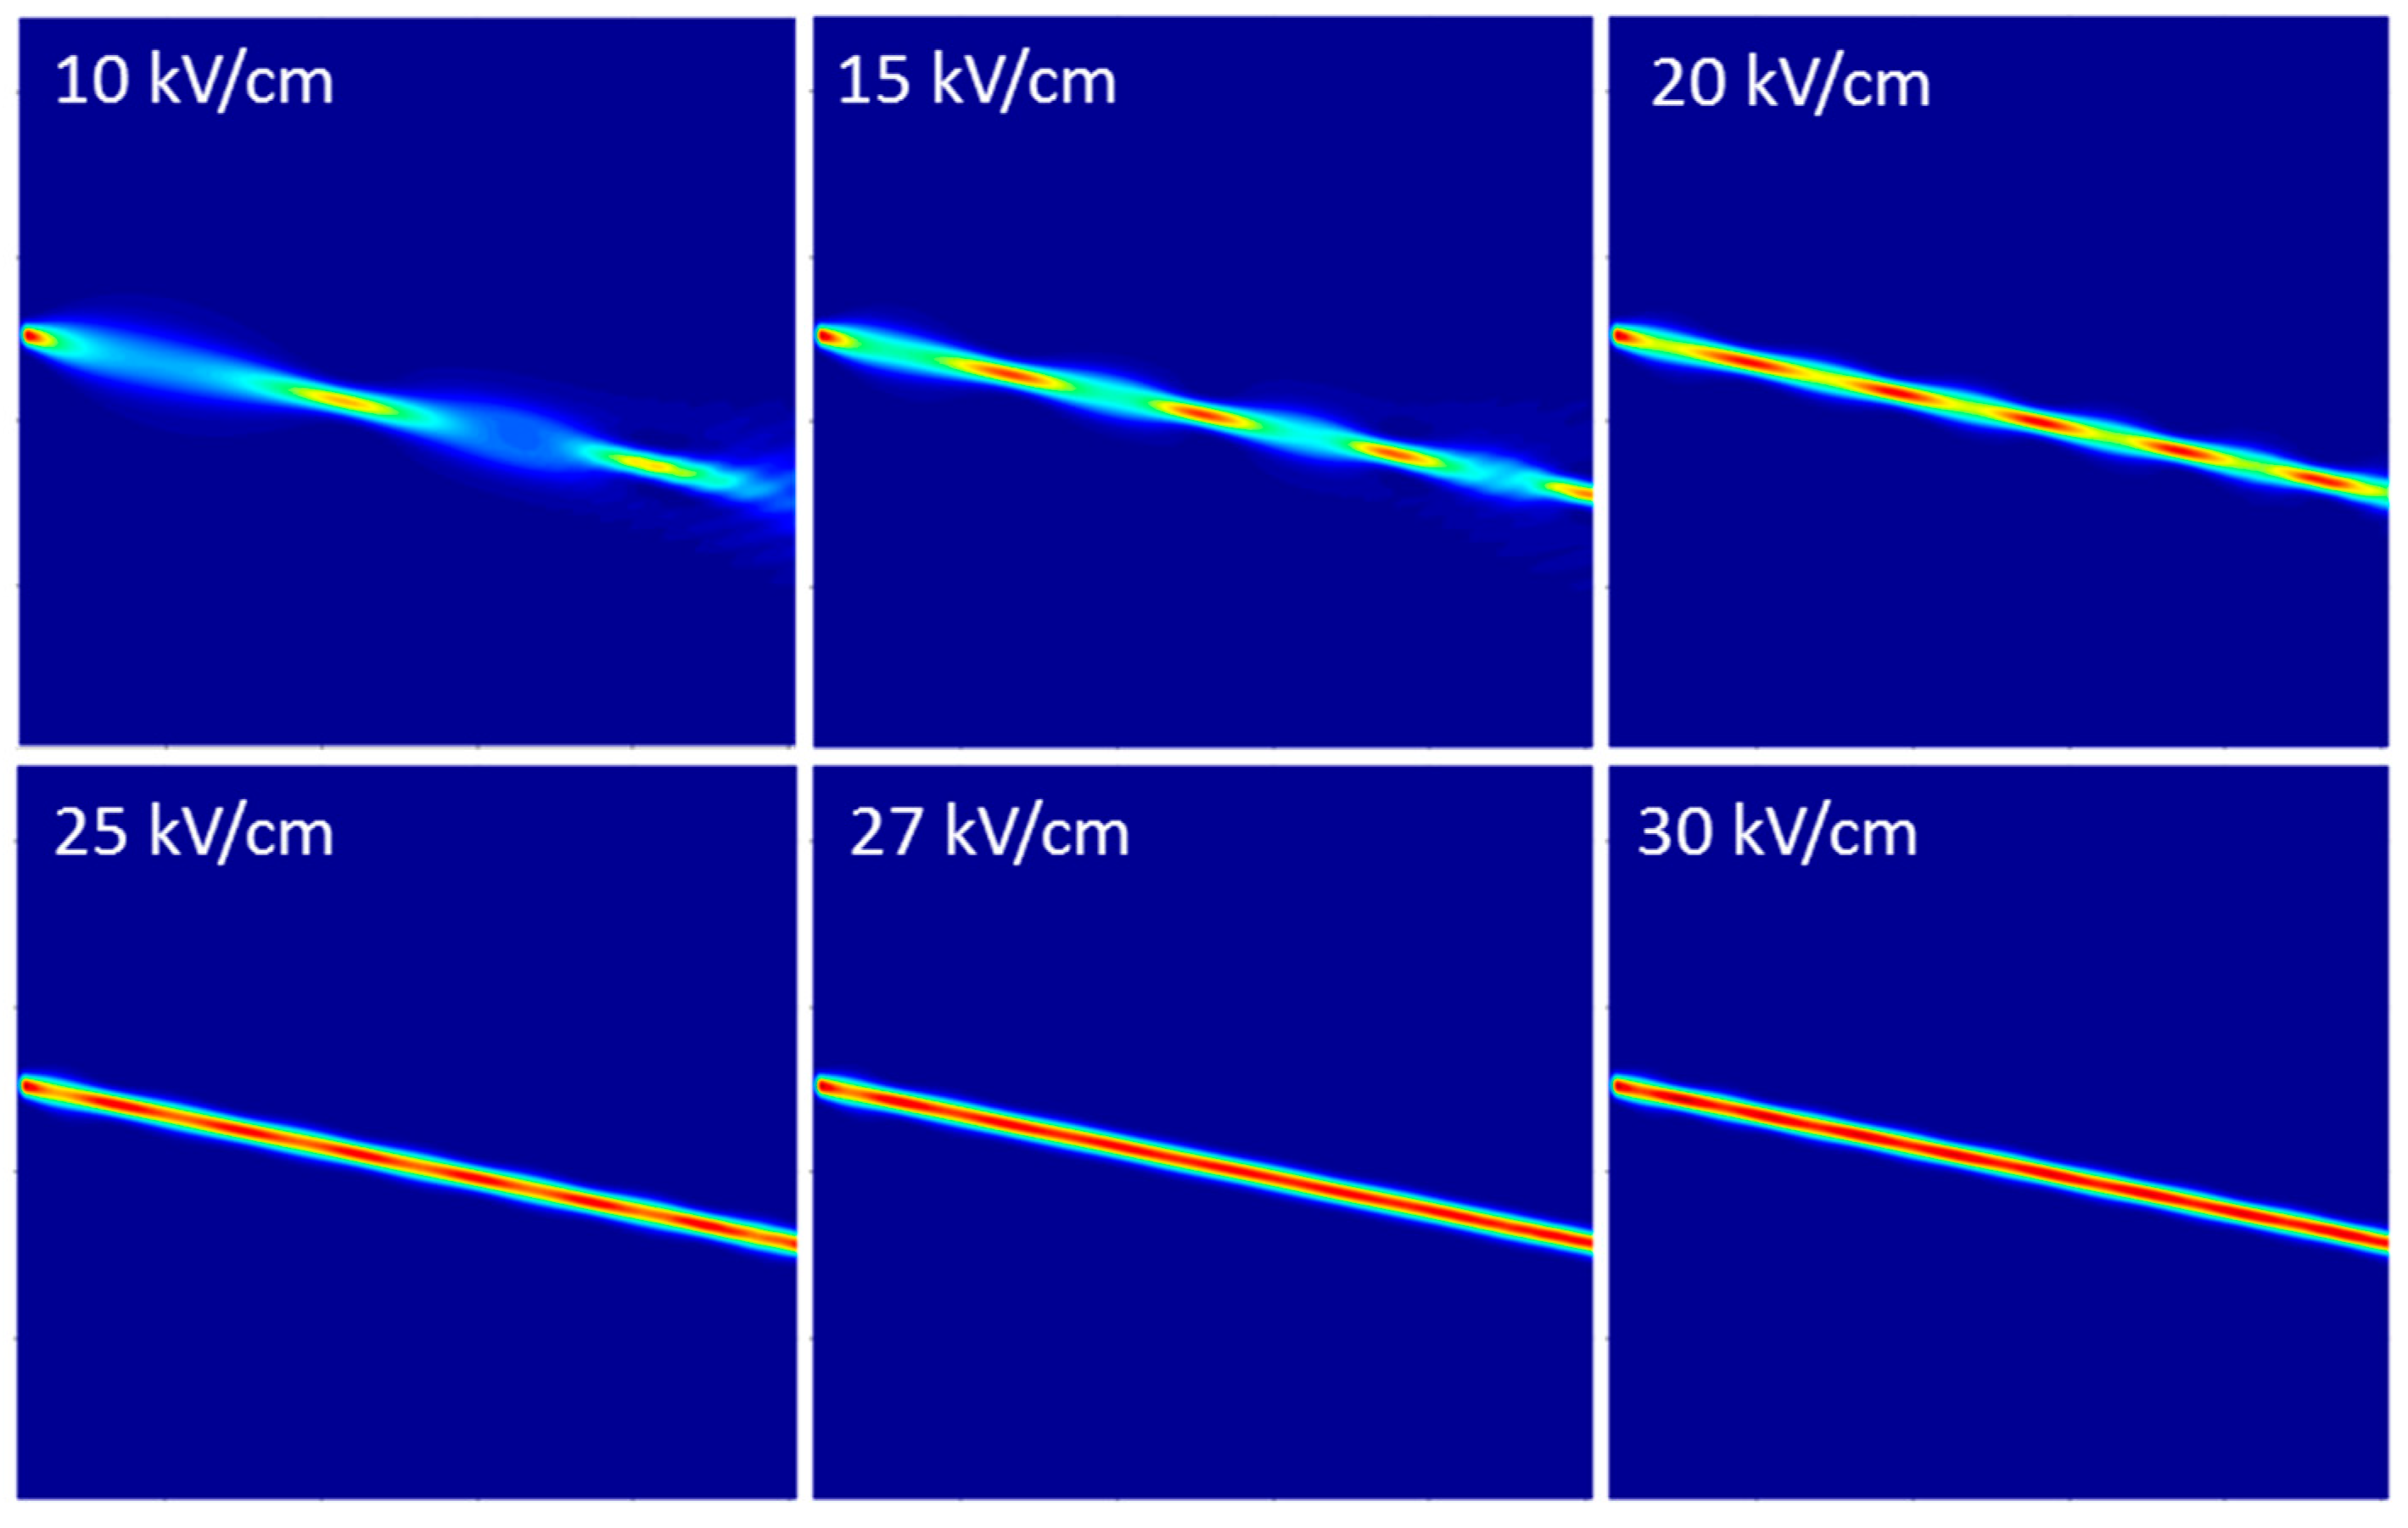
The soliton formation can be easy identified if the attention is moved towards the propagating signal AS instead of the writing beam AW. In fact, the linear propagation inside a nonlinear waveguide is much more sensitive to any non-uniform refractive distribution. In Figure 2, we have reported the signal propagation inside self-confined channels as a function of the applied electric bias. Below 20 kV/cm, the strong pulsation makes the confinement partial or inefficient. At 20 kV/cm, a clean waveguide is indeed formed, whose propagating modes still beat in a breathing propagation. At 27 kV/cm, the solitonic regime of the writing beam is reached and the propagating signal gets a homogeneous transverse profile along the entire length.
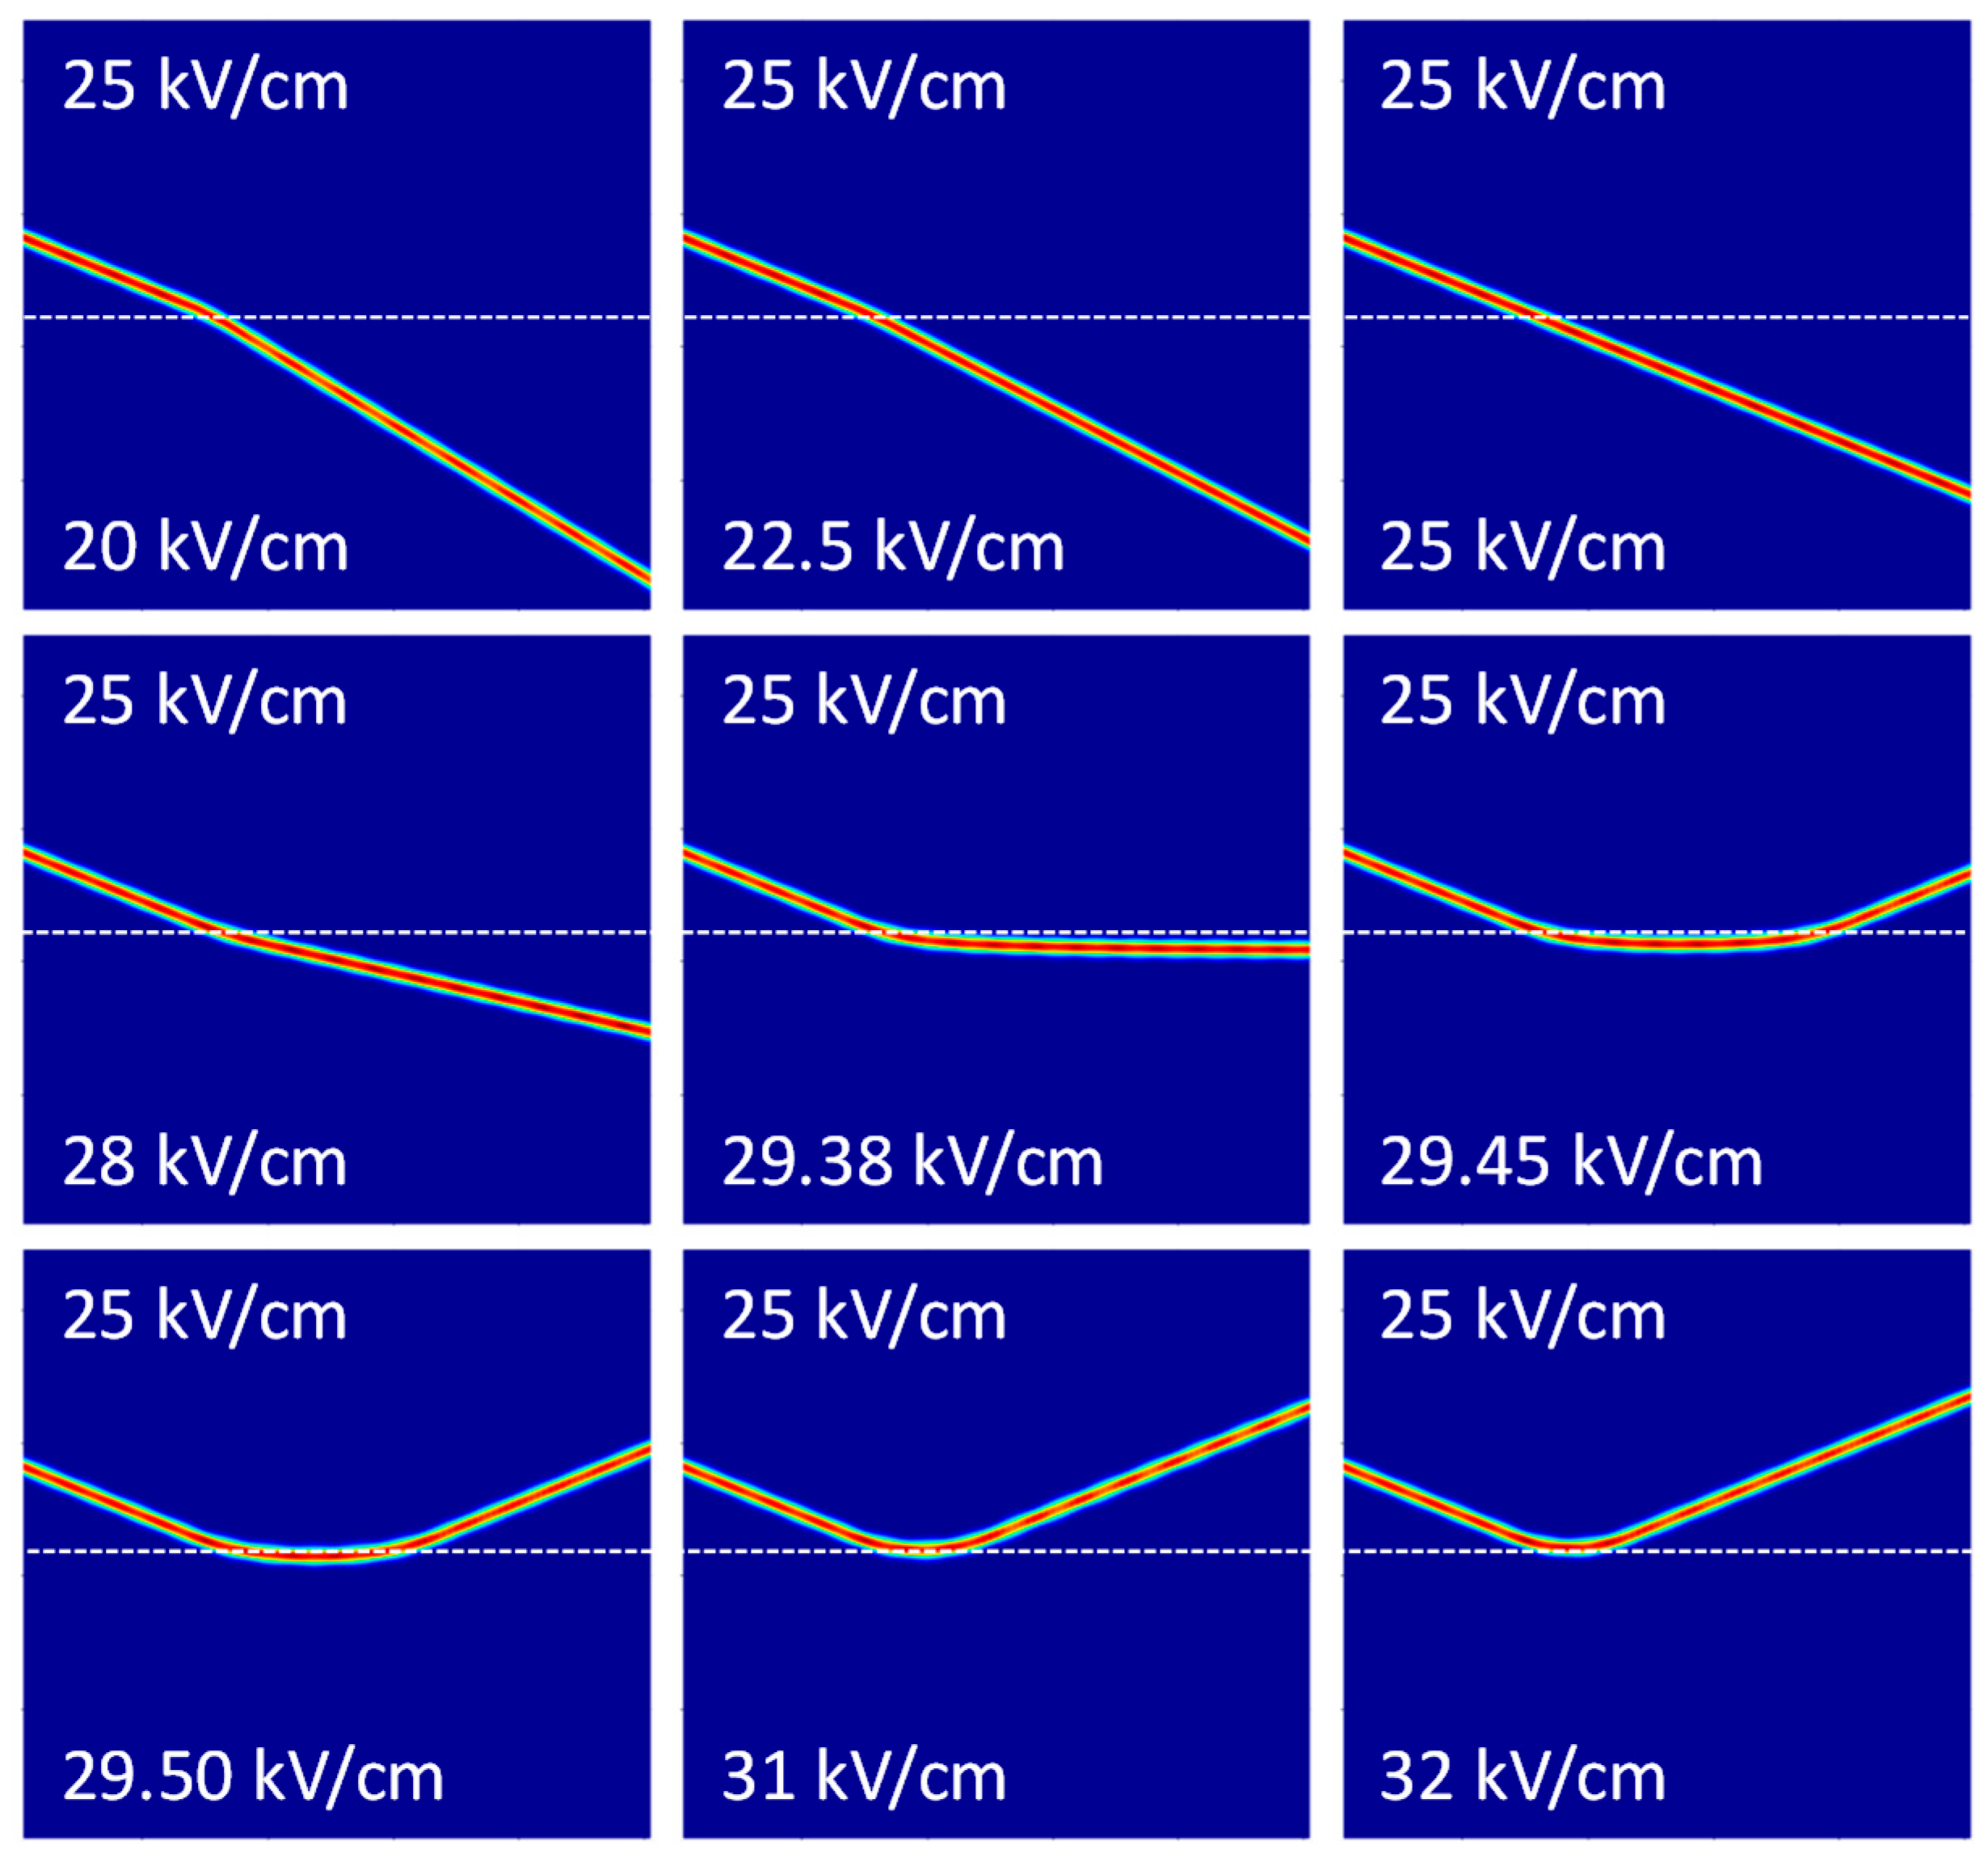
The electric reflector for the self-written waveguides was investigated by dividing the whole integration volume in two regions with different applied biases. The first zone before the interface, called volume 1, received Ebias = E1 while the second zone just after the interface, called volume 2, received Ebias = E2. In Figure 3 we have reported the results of the writing beam propagation through the electric interface for different biases. Here, we injected the AW at 0.6° with respect to the interface line direction, i.e., its complementary angle is the incidence one, and measures 89.4°.
Since the electro-optic effect decreases the refractive index, the condition E2 < E1 corresponds to a refraction angle smaller than the incidence one, as shown for the 25/20 and 25/22.5 interfaces. If E2 = E1, no interface occurs, and the soliton beam propagates straight without any modification. For E2 > E1, the refractive index of volume 2 becomes lower than the refractive index of volume 1 and consequently the transmission angle is larger than the incidence one, as for the 25/28 interface and higher. At about 25/29.38 kV/cm, the soliton receives a π/2 refraction, which means that the incidence angle corresponds to the critical one. Under such conditions, the beam travels along the interface; this is somehow unstable, in the sense that any slight variation of the interface electric gradient would cause a reflection or a refraction of the beam. In fact, for slightly higher interface gradients (see for example the 25/29.45 interface), after some propagation parallel to the interface, the beam will be reflected back towards volume 1. Consequently, above the critical voltage, very large lateral displacements (Giant Goos-Hänchen shift) might be experienced by the reflected beam just before being rejected back towards volume 1. Such displacement is very large close to the critical condition, decreasing as the electric contrast increases.
Please note that the total reflection regime requires the beam to penetrate into volume 2 before being reflected back, as a shock against an elastic wall. Even at the critical condition, the π/2 refracted beam travels below the interface, not on it. The radius of curvature of the total reflection curve becomes smaller and smaller as the electric gradient increases.
3. Results
3.1. Critical Angle and Generalized Snell Law
The Generalized Snell Law (GSL) [16] for soliton reflection has previously been introduced for high-order nonlinearities. In the critical angle regime, it can be written in terms of the complementary angle θ as:
where γ is a correction coefficient introduced to account for the refraction of beams instead of rays. Introducing the electro-optic interface, the GLS becomes:
which, solved by E2, takes the linear form of the equation of a line:
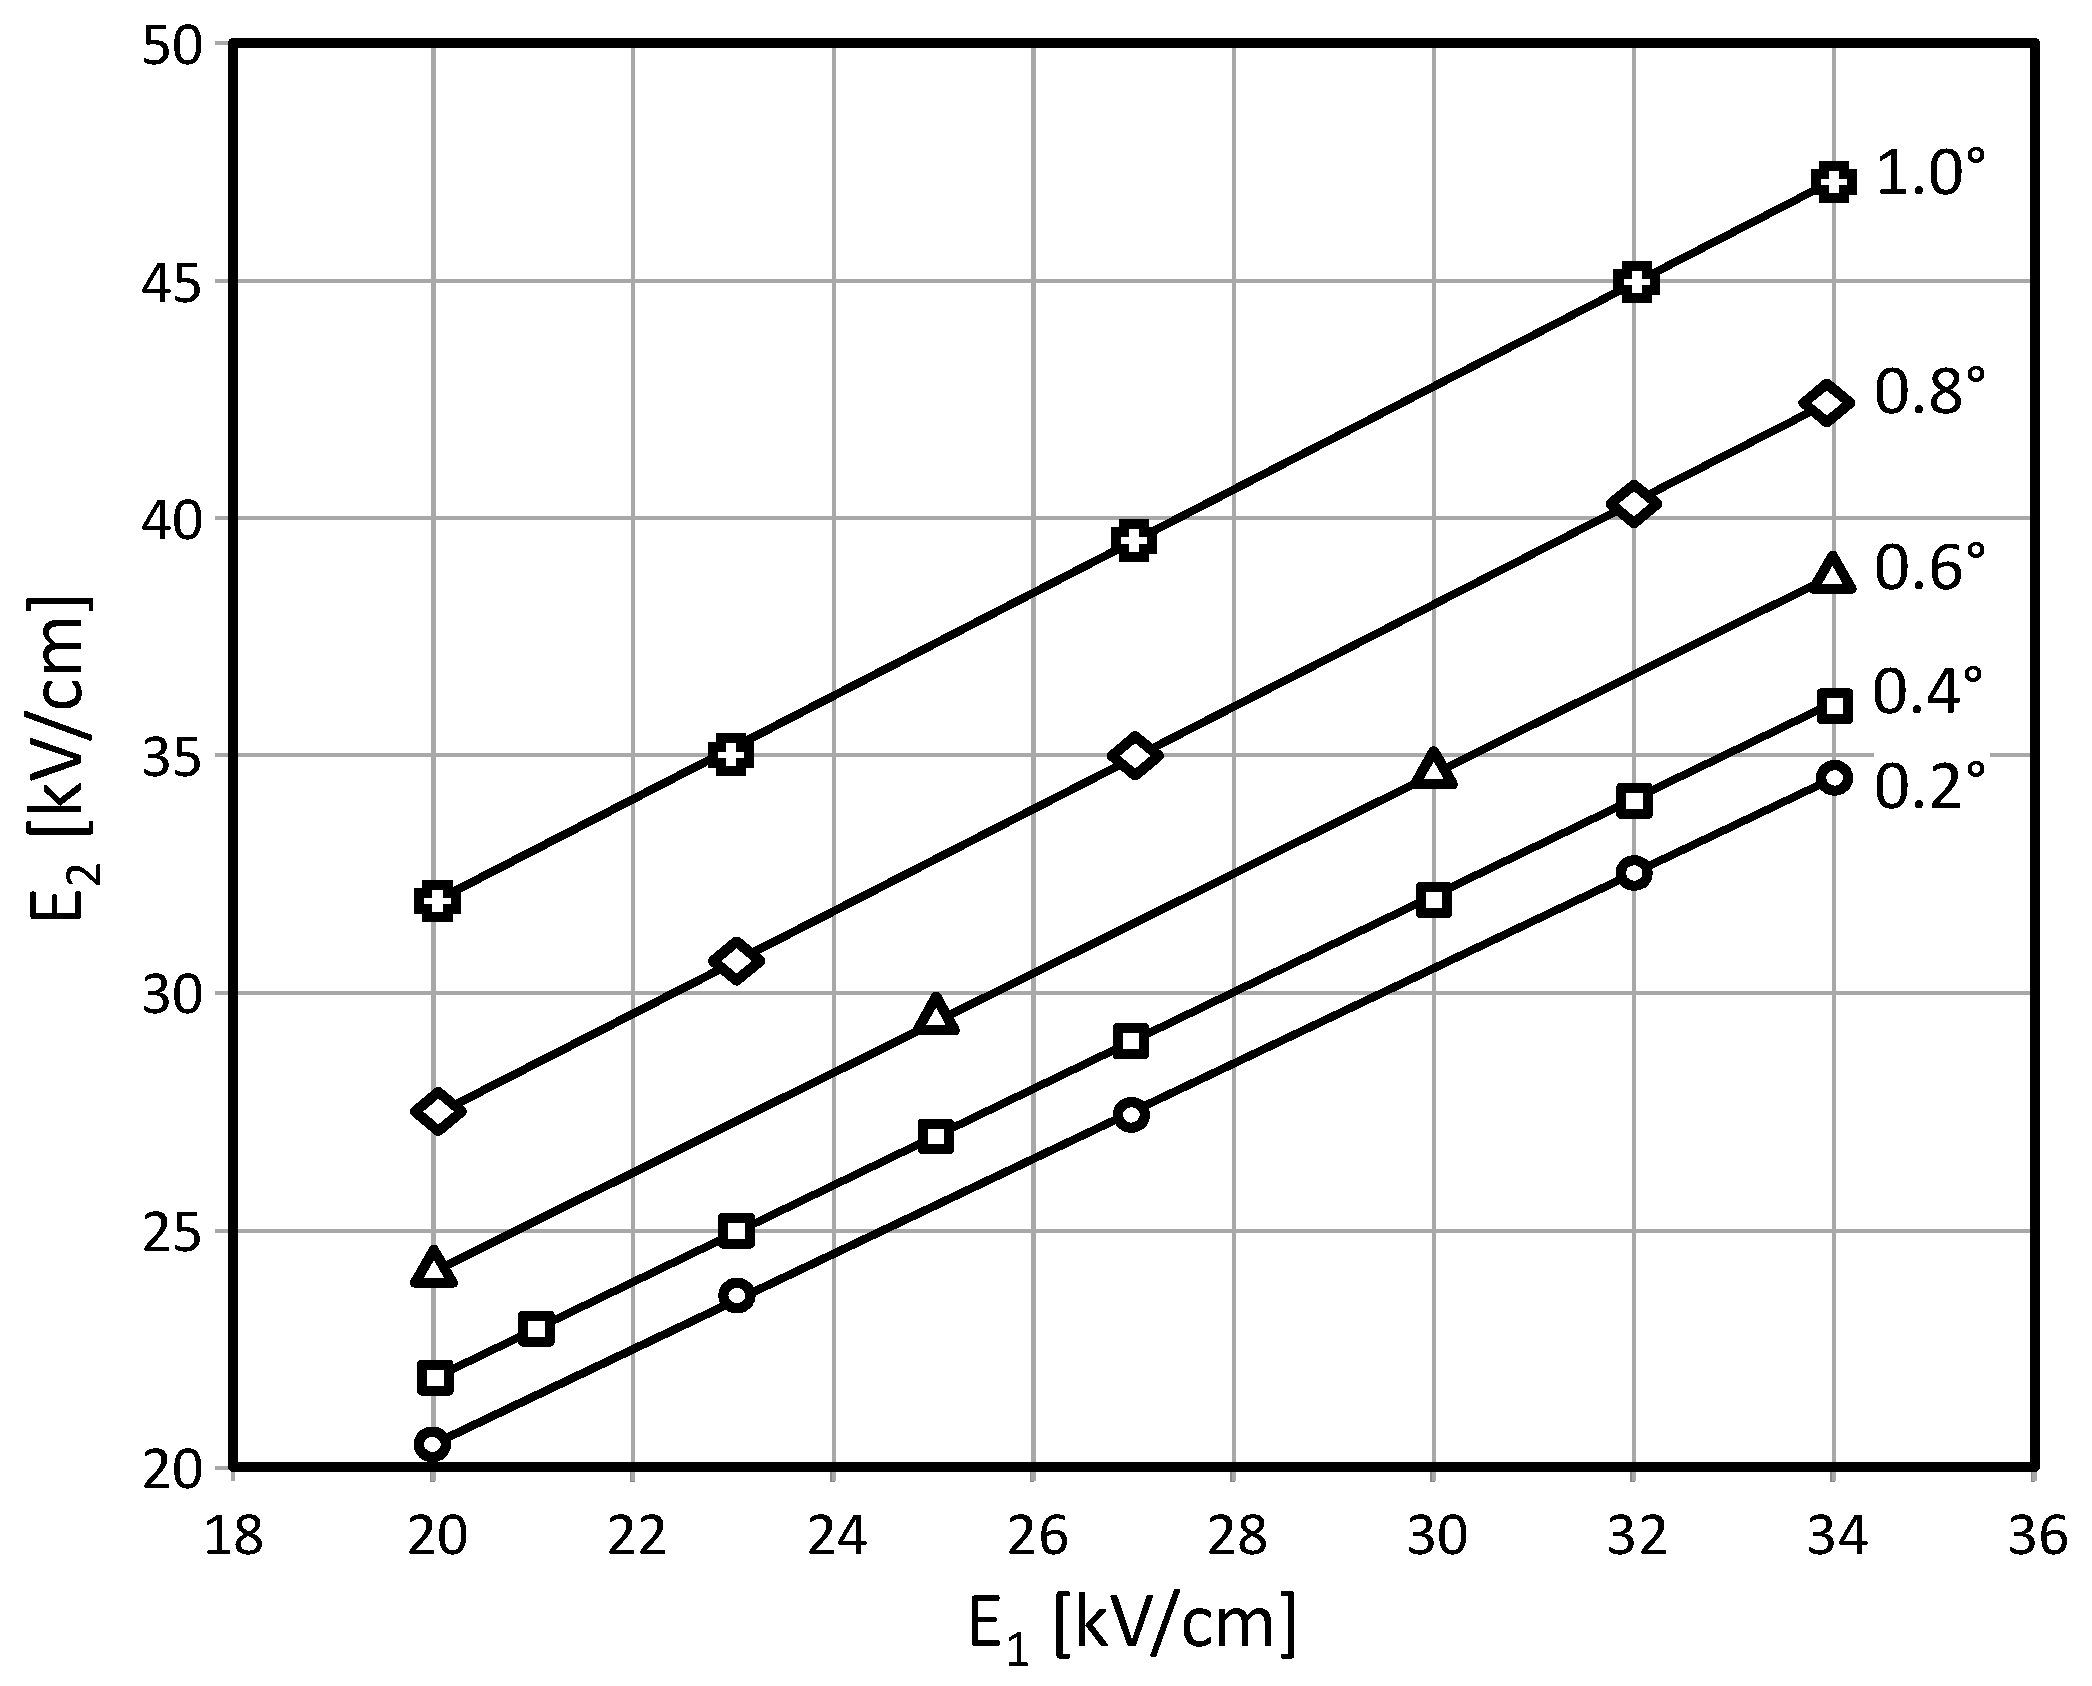
In Figure 4, we have reported all the experimental electric biases corresponding to the critical angles as function of the input complementary angles. All experimental data has been fitted with a straight line equation, obtaining in all cases a coefficient of determination R2 of 1. From the A and B coefficients of the linear regressions (Equation (5)), we inverted the expressions to obtain the γ and α coefficients:
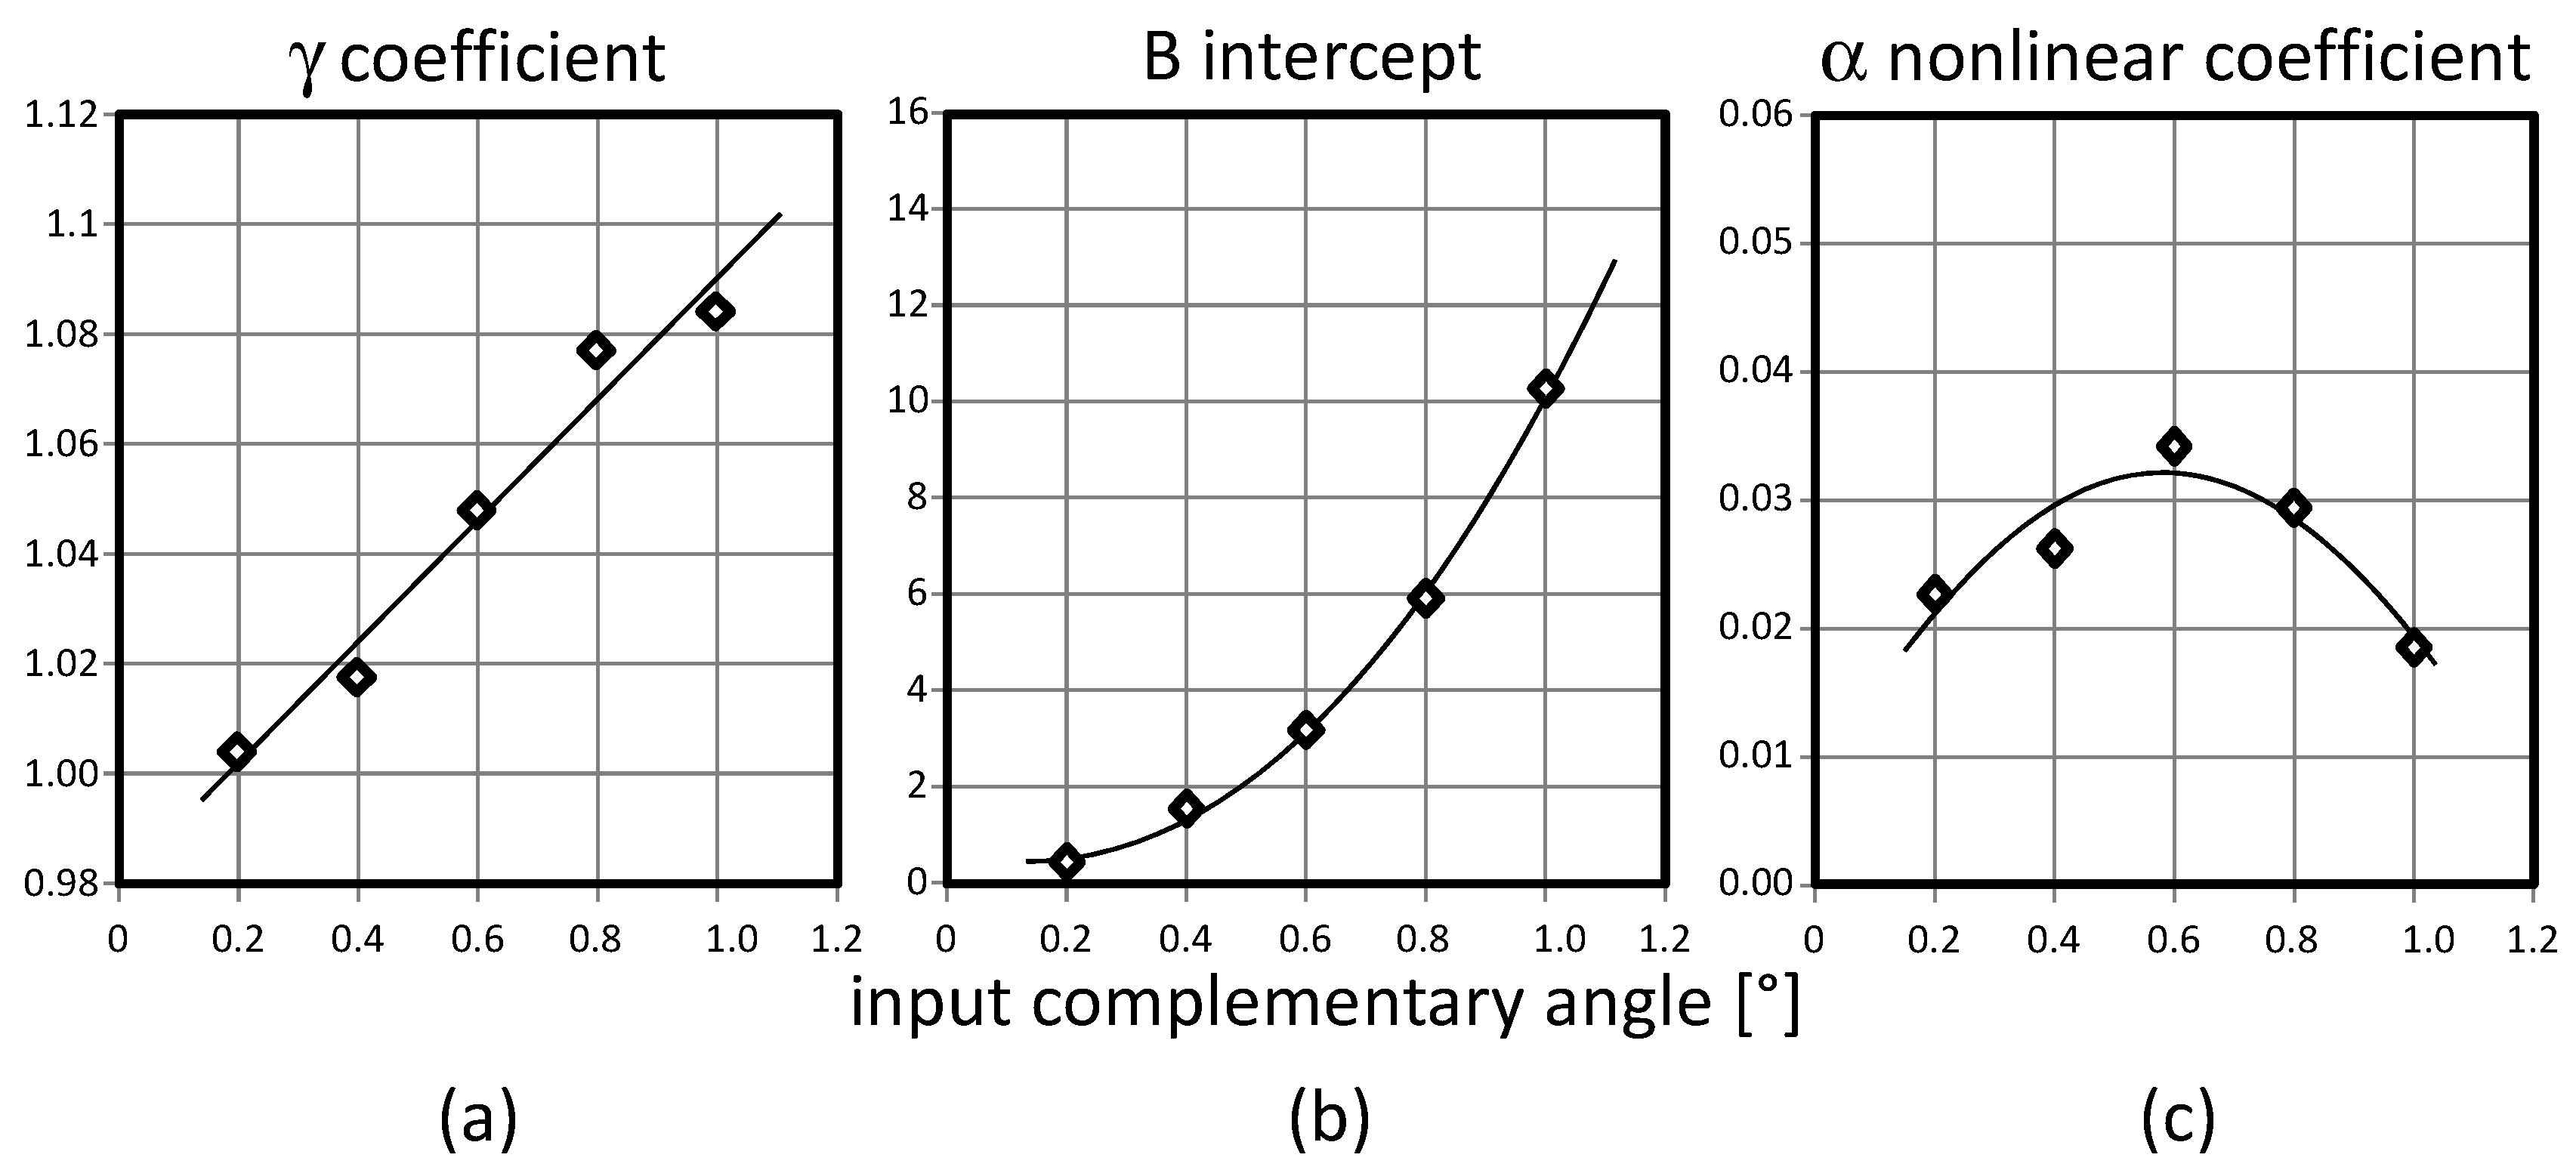
In Figure 5 we have reported the γ, B and α coefficients calculated from Figure 3. The γ correction factor for the GSL still follows a linear trend (Figure 5a) with respect to the input complementary angle. The B intercept instead has a parabolic trend (Figure 5b). This discrepancy leads, as a consequence, that the nonlinear α coefficient, calculated through Equation (7), receiving a parabolic trend as well, as shown in Figure 5c. In particular, this fit points out that the highest nonlinear efficiency for the π/2 refraction of a solitonic beam occurs at a complementary incidence angle of 0.6°. This result occurs because of the mutual effects of the beam refraction and the effective birefringence induced at the electric interface. Thus, we shall use a complementary input beam of 0.6° as the reference value for the following waveguide analysis.
3.2. Waveguiding and Propagation Losses
3.2.1. Straight Propagation
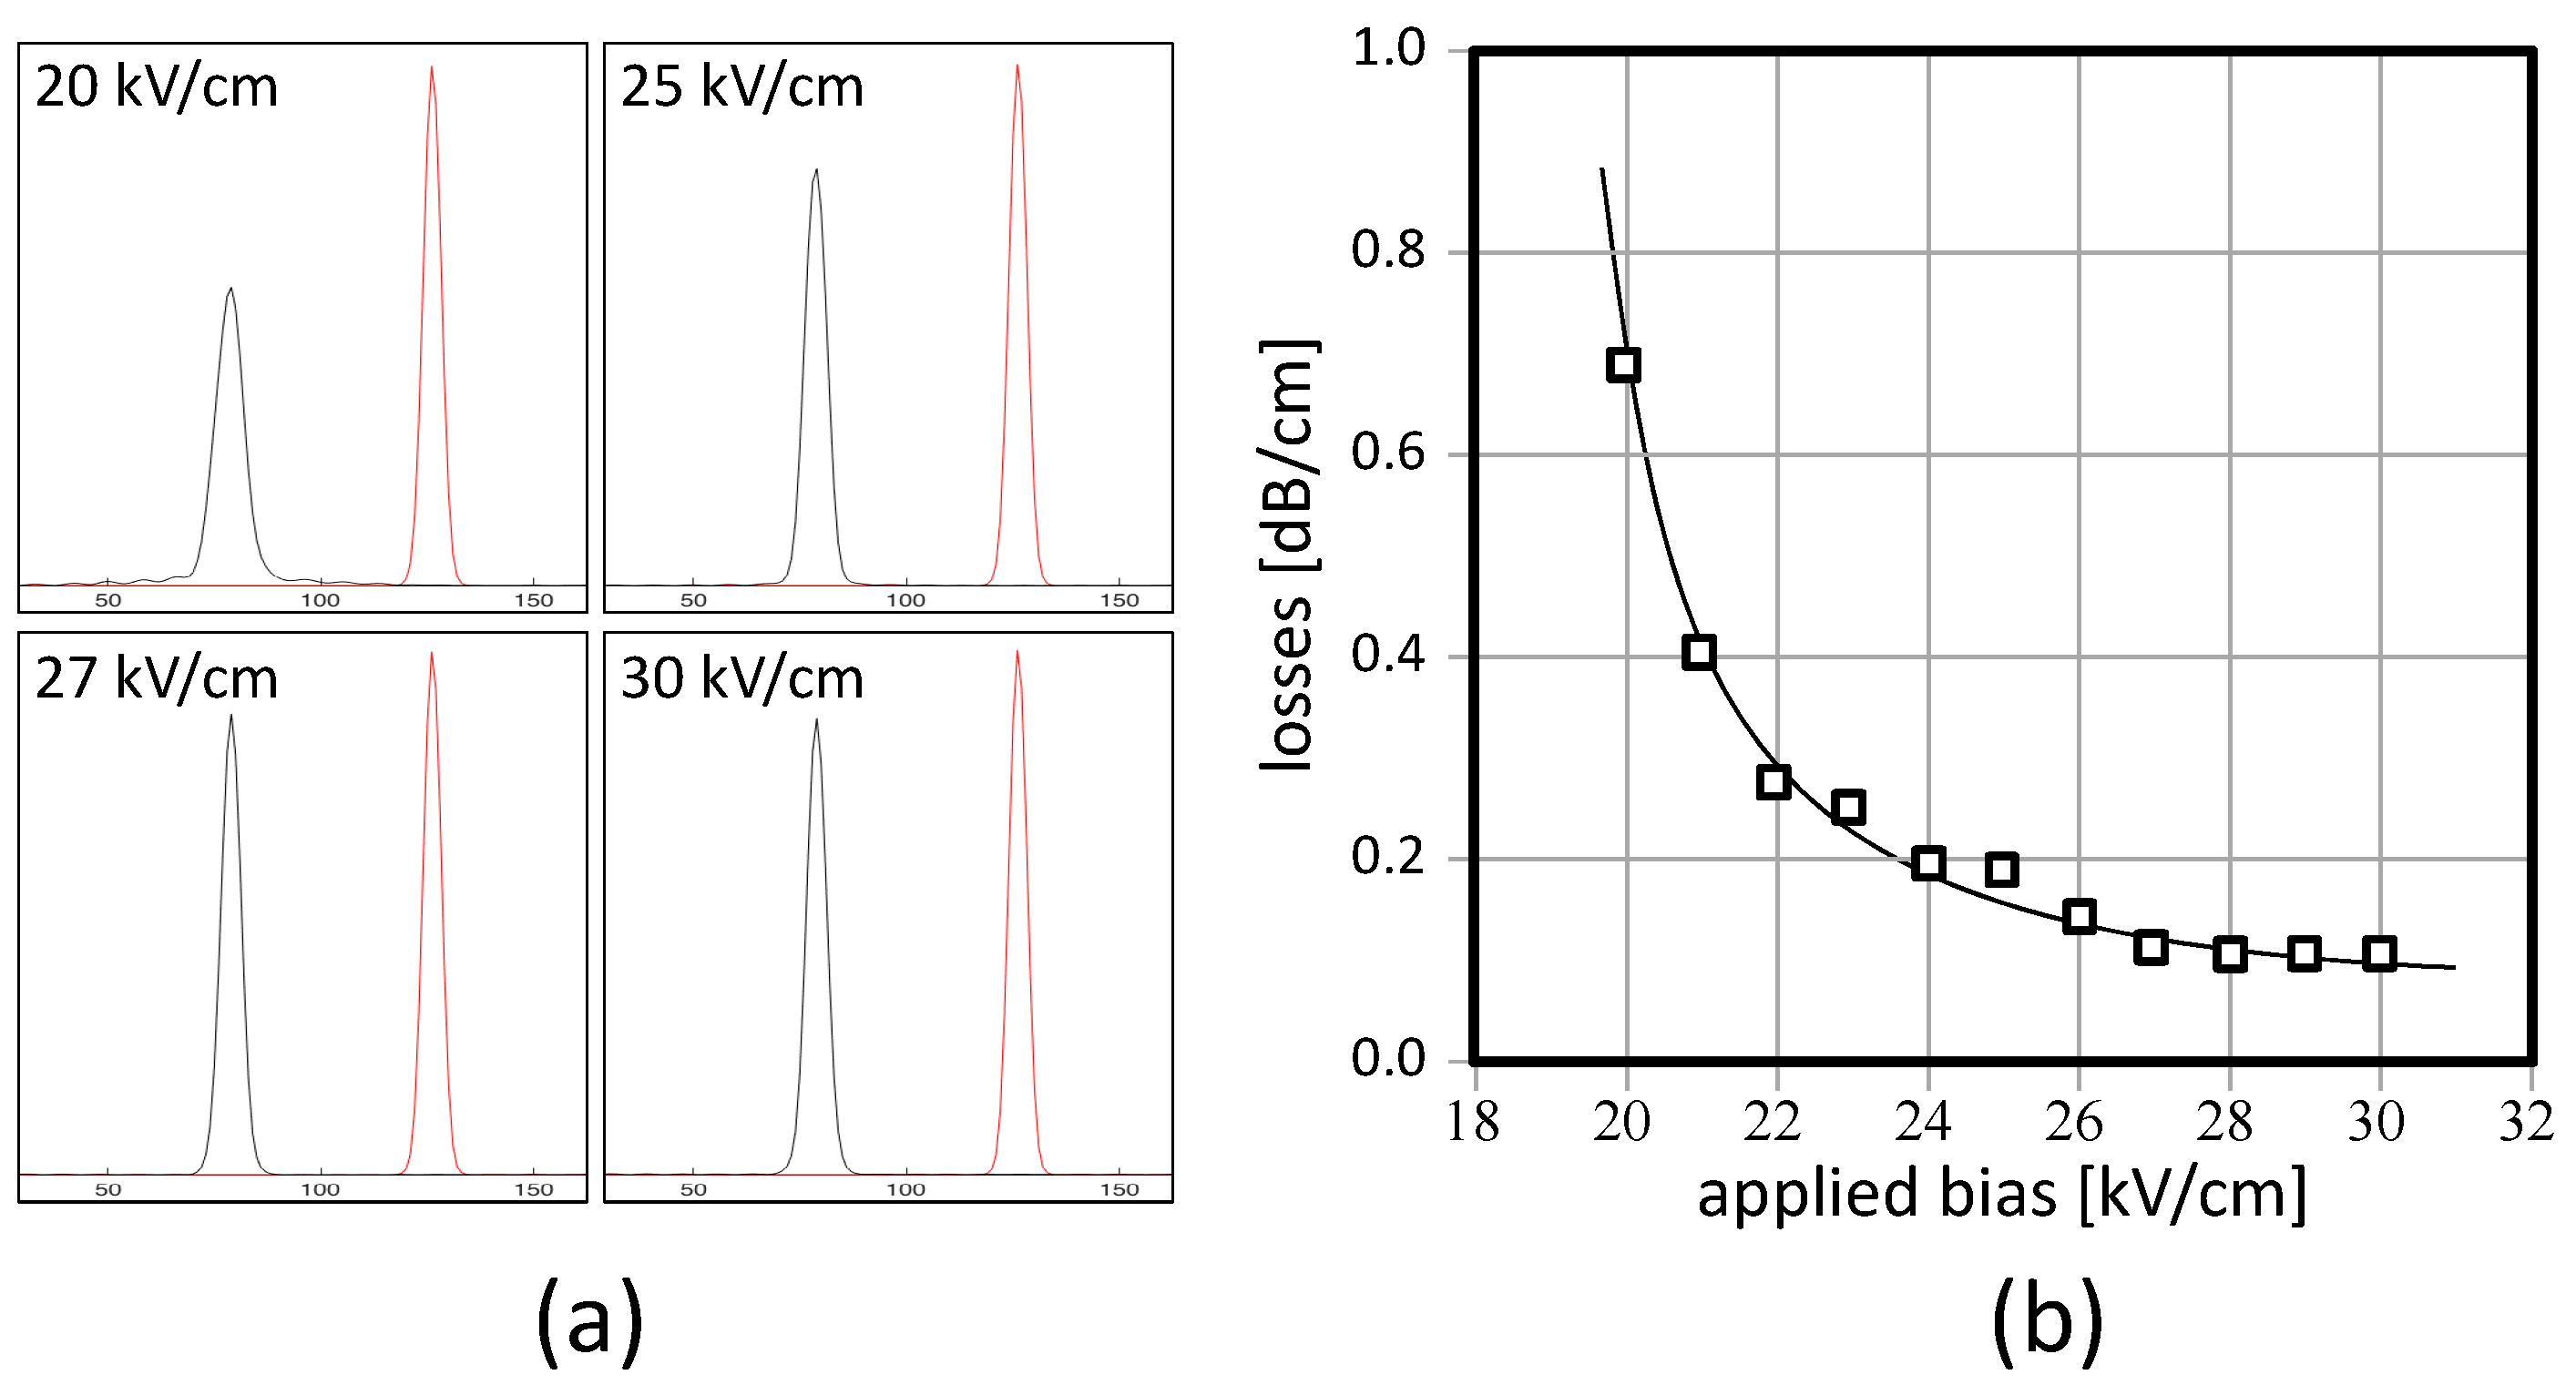
Focusing the attention on the signal beam, the numerical simulator allows us to calculate the propagation losses by comparing the input and output power of the IR beam confined inside the soliton waveguides. In Figure 6a, we have reported the input (red) and output (black) profiles of the signal beam within self-confined structures. In this case, uniform biases are applied (no electric interfaces are present), and straight propagations are obtained consequently. The self-confinement conditions depend on the applied biases, as expected: as previously mentioned, the solitonic regime is considered to be reached at 27 kV/cm, for which a uniform writing beam is obtained (see Figure 1). By integrating the input and output power distributions of the signal beam, the propagation losses have been calculated, as shown in Figure 6b.
These losses strongly depend on the applied bias, which influences the refractive index contrast as well. The larger the electric bias, the larger the refractive index contrast and the higher the capacity of the refractive structure written by the soliton to confine a signal beam. At the solitonic regime (27 kV/cm), losses reach the lowest limit of 0.07 dB/cm, value already found previously [9,10,11,12,13,14,15,16,17,18,19,20,21]. Such value seems to be the reference limit for all cases.
3.2.2. Curved Propagation
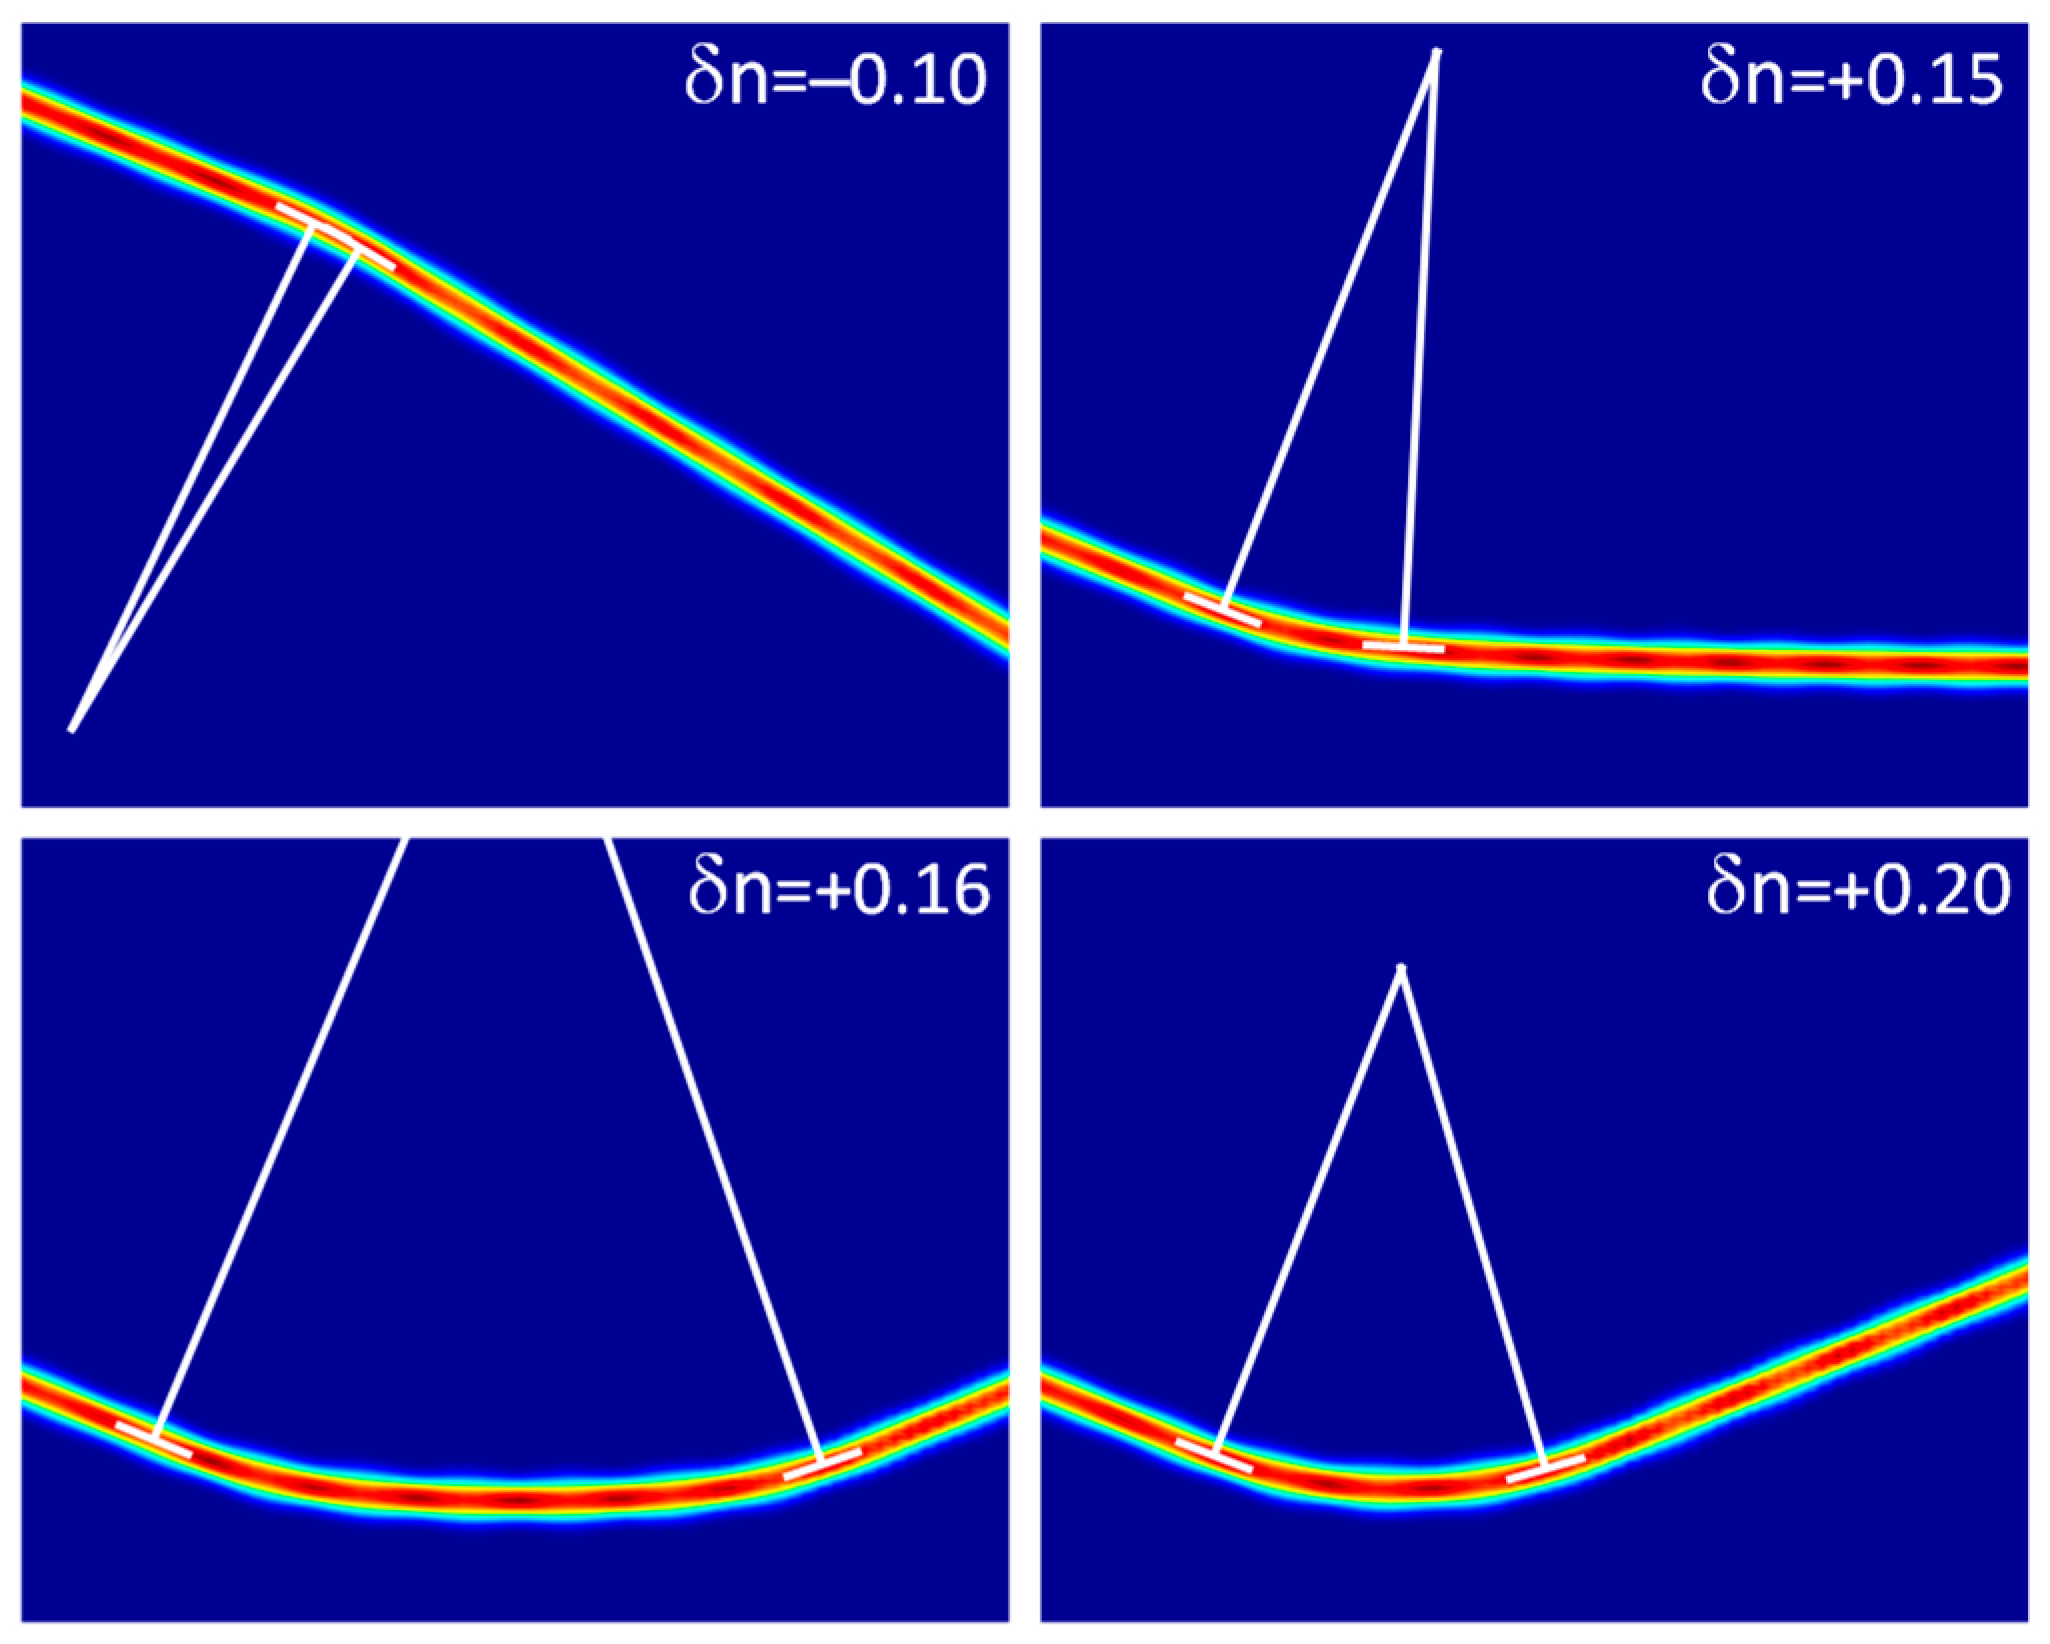
A similar procedure has been applied for curved self-confined structures, i.e., for signal beams propagating inside those written in presence of an electric interface. First of all, the radii of curvature of the osculating circles of the curved trajectories have been calculated from the experimental maps (Figure 7). The obtained values are reported in Figure 8a versus the refractive index contrast δn defined as:
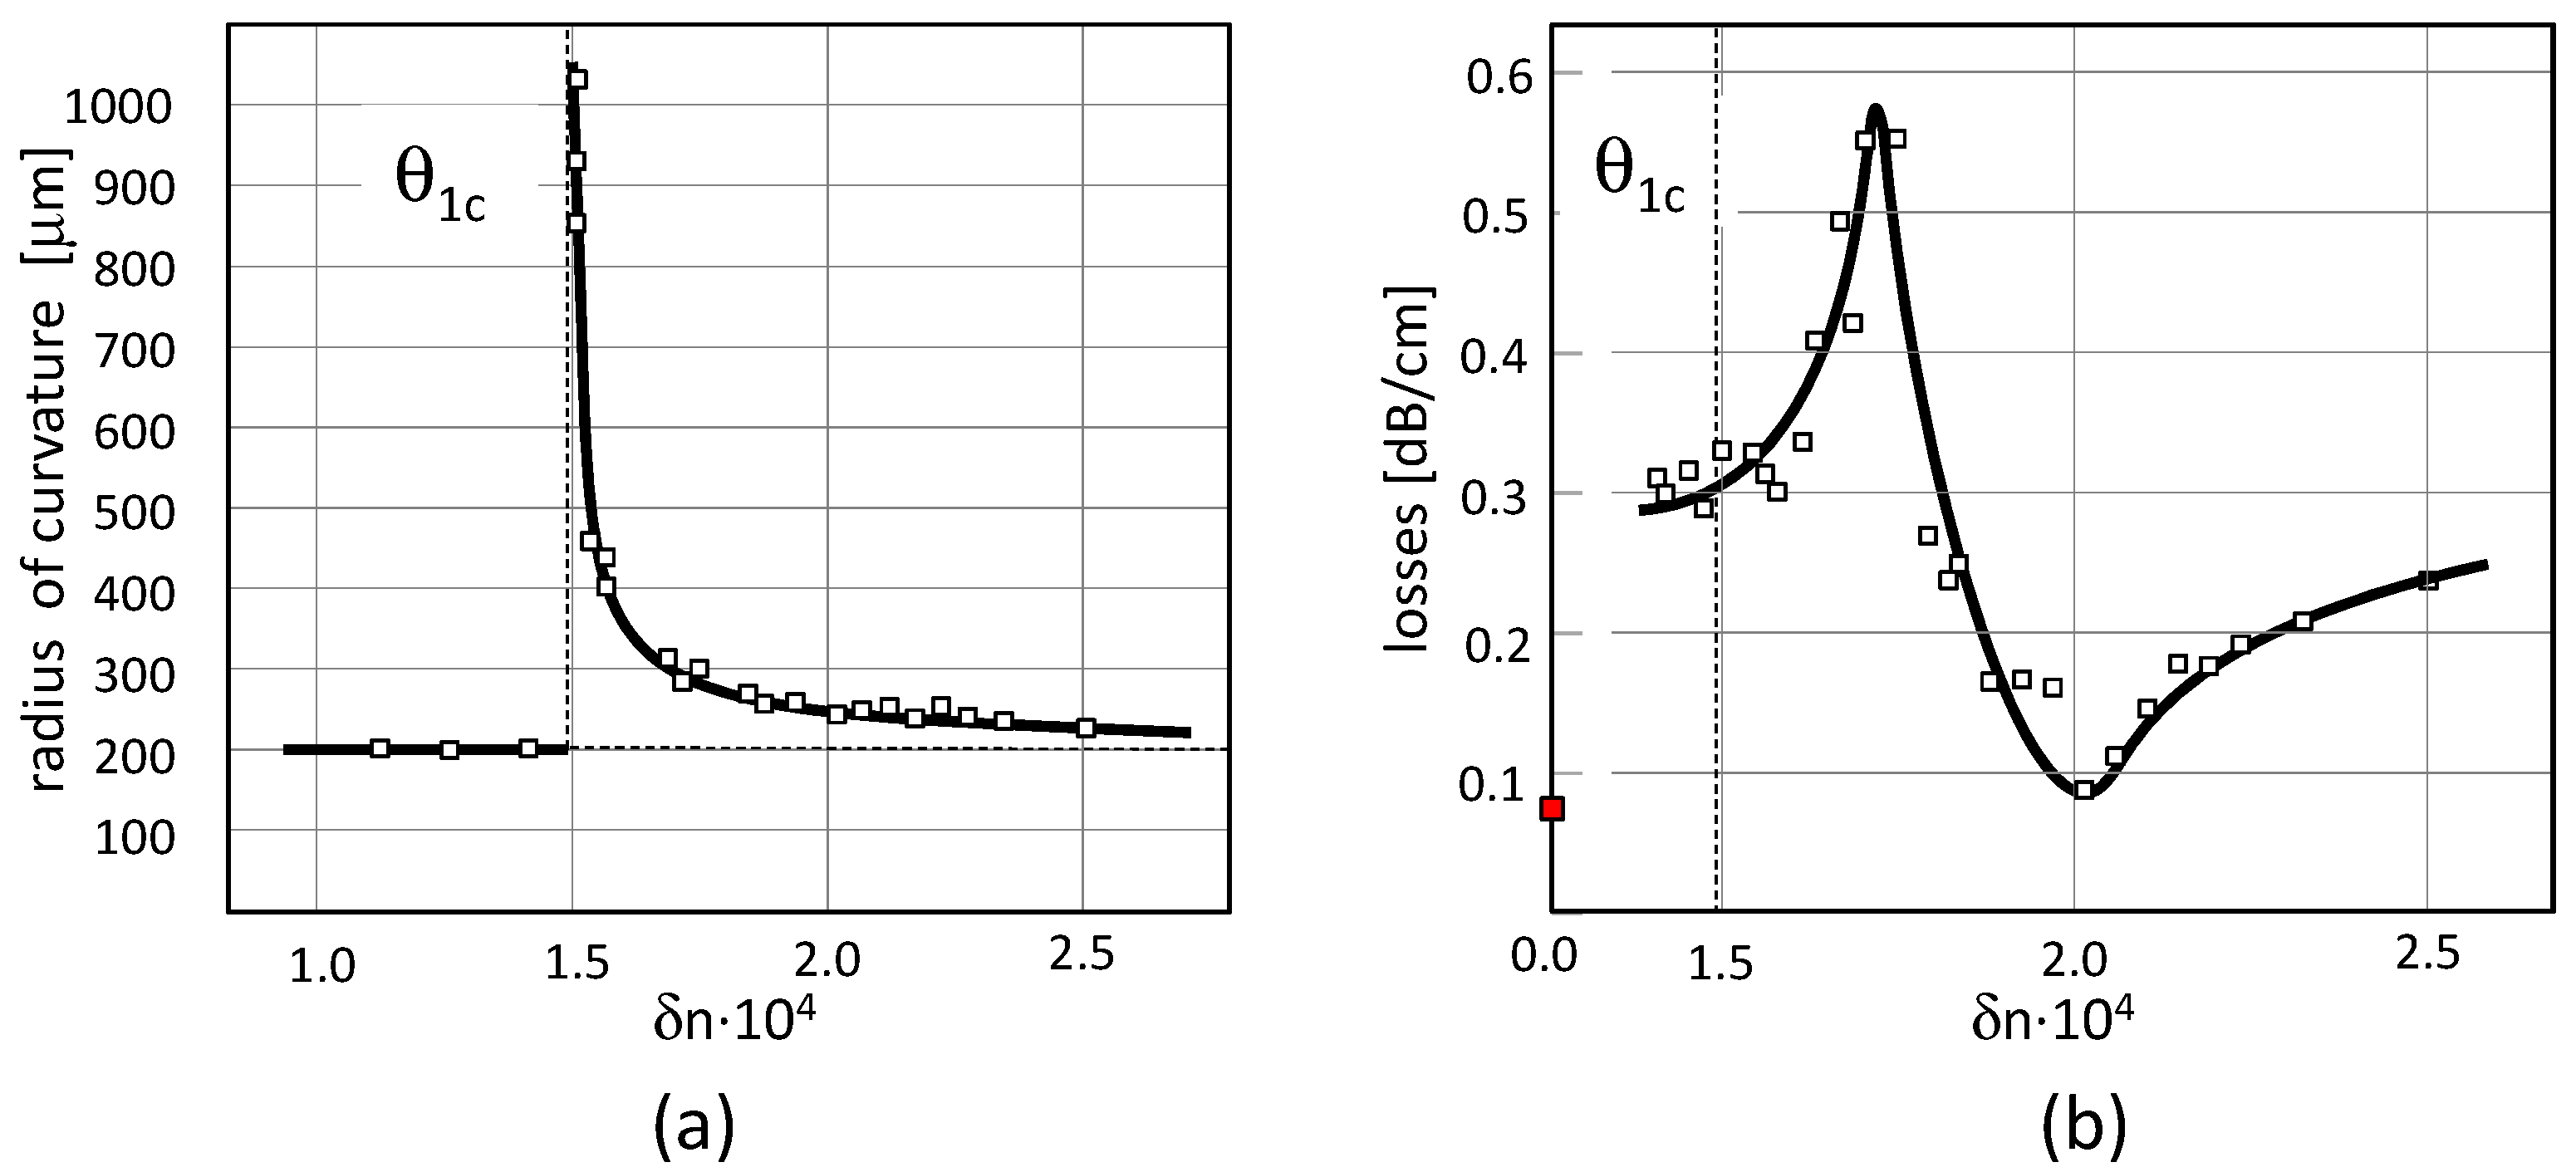
For negative contrasts, as well as for positive contrasts until the critical angles, the curvatures are always the same, all having radii of about 200 μm. The Giant Goos-Hänchen regime occurs [16] above the critical angle for a of up to 0.5 above the critical value.
Just above the critical angle, the refracted beam experiences a transverse instability that forces it to be reflected back within the input volume 1. Such regimes are well identified by monitoring the propagation losses of the signal beam, as shown in Figure 8b.
A single rapid curve of the solitonic waveguide introduces a signal loss as high as 0.2 dB. This is deduced by Figure 8b, where the straight propagation losses (red square) are reported together with the curved waveguide ones (white squares). Until the critical angle , the total losses are about 0.2 dB above the straight propagation ones. With , the Giant Goos-Hänchen occurs; this regime is governed by a double refraction, one towards the π/2 refraction and one towards the back reflection (see for example in Figure 6), connected together by a portion of the trajectory with low curvature (long radius). In Figure 8a such regime is reported by hyperbolic portion of the curve with a vertical asymptote in correspondence of the critical angle. Such double refraction doubles the losses, as well. In fact, the losses’ curve gets a peak up to about 0.6 dB, as the sum of the straight propagation losses (0.07 dB/cm) and two rapid curves, each of which is about 0.2 dB. Above , the two sharp curves homogenize in a larger single curve. An optimal smooth curvature was obtained at about (Figure 6) for which the propagation losses of the signal beam drop down to almost the straight-propagation ones. Above this value, the reflection curve gets sharper and sharper, increasing again the propagation losses up to the single-sharp curve value (see, for example, the 25/32 case in Figure 3).
4. Discussion
An electric interface interposed along the propagation of a soliton waveguide may indeed act as an electric reflector. The advantage of an electrical interface with respect to a physical interface is its modulability, i.e., the possibility of varying its contrast in a continuous and gradual manner. On the other hand, the achievable contrasts are not very high as the variation of the refractive index is induced by the electro-optical effect. Even if we talk about nonlinearities of the second order, the values of contrast of refractive index are still limited. In the present work, we analyzed contrasts up to . This means angles of incidence on the interface were extremely large, and therefore had small complementary angles. With electric reflectors, curves with radiuses of hundreds of microns to millimeters can be obtained, thus offering a rather large panorama of possibilities. Moreover, it is worth noting that propagation losses even for very marked curves remain extremely steep, lower than the guides made with more traditional techniques such as ion exchange or epitaxial growth. The limit of 0.07 dB/cm for straight propagation is not achieved by any other technology. This value increases again by 0.2 dB for tight bends with a radius of 200 μm, and then falls back to the reference value of the straight guides for radius curves of 250–300 μm.
Author Contributions
E.F. performed the simulations, interpreted the data and wrote the paper; A.B. wrote the numerical code; M.A. wrote the numerical code and participated to the data interpretation.
Funding
This research was funded by Sapienza Università di Roma, grant “Progetti di Ricerca—Piccoli” number RP116155012228B3-2016.
Conflicts of Interest
The authors declare no conflict of interest.
References
- Segev, M.; Crosignani, B.; Yariv, A.; Fischer, B. Spatial solitons in photorefractive media. Phys. Rev. Lett. 1992, 68, 923–927. [Google Scholar] [CrossRef] [PubMed]
- Duree, G.; Shultz, J.L.; Salamo, G.; Segev, M.; Yariv, A.; Crosignani, B.; Di Porto, P.; Sharp, E.; Neurgaonkar, R.R. Observation of self-trapping of an optical beam due to the photorefractive effect. Phys. Rev. Lett. 1993, 71, 533–536. [Google Scholar] [CrossRef]
- Shih, M.; Segev, M.; Valley, G.C.; Salamo, G.; Crosignani, B.; Di Porto, P. Observation of two-dimensional steady-state photorefractive screening solitons. Electron. Lett. 1995, 31, 826–827. [Google Scholar] [CrossRef]
- Kivshar, Y.S.; Agrawal, G.P. Optical Solitons—From Fibres to Photonic Crystals; Academic Press: San Diego, CA, USA, 2003; ISBN 0-12-410590-4. [Google Scholar]
- De La Fuente, R.; Barthelemy, A.; Froehly, C. Spatial-soliton-induced guided waves in a homogeneous nonlinear Kerr medium. Opt. Lett. 1991, 16, 793–795. [Google Scholar] [CrossRef] [PubMed]
- Fazio, E.; Renzi, F.; Rinaldi, R.; Bertolotti, M.; Chauvet, M.; Ramadan, W.; Petris, A.; Vlad, V.I. Screening-photovoltaic bright solitons in lithium niobate and associated single-mode waveguides. Appl. Phys. Lett. 2004, 85, 2193–2195. [Google Scholar] [CrossRef]
- Fazio, E.; Ramadan, W.; Petris, A.; Chauvet, M.; Bosco, A.; Vlad, V.I.; Bertolotti, M. Writing single-mode waveguides in lithium niobate by ultra-low intensity solitons. Appl. Surf. Sci. 2005, 248, 97–102. [Google Scholar] [CrossRef]
- Coda, V.; Chauvet, M.; Pettazzi, F.; Fazio, E. 3-D integrated optical interconnect induced by self-focused beam. Electron. Lett. 2006, 42, 463–465. [Google Scholar] [CrossRef]
- Fazio, E.; Chauvet, M.; Vlad, V.I.; Petris, A.; Pettazzi, F.; Coda, V.; Alonzo, M. 3-D Integrated Optical Microcircuits in Lithium Niobate Written by Spatial Solitons. In Ferroelectric Crystals for Photonic Applications; Ferraro, P., Grilli, S., De Natale, P., Eds.; Springer Series on Material Sciences Volume 91; Springer: Berlin/Heidelberg, Germany, 2014; pp. 101–134. ISBN 978-3-662-50111-5. [Google Scholar]
- Chauvet, M.; Coda, V.; Maillotte, H.; Fazio, E.; Salamo, G. Large self-deflection of soliton beams in LiNbO3. Opt. Lett. 2005, 30, 1977–1979. [Google Scholar] [CrossRef]
- Jäger, R.; Gorza, S.P.; Cambournac, C.; Haelterman, M. Sharp waveguide bends induced by spatial solitons. Appl. Phys. Lett. 2006, 88, 061117. [Google Scholar] [CrossRef] [Green Version]
- Chauvet, M.; Coda, V.; Maillotte, H.; Fazio, E.; Jäger, R.; Gorza, S.P.; Cambournac, C.; Haeltereman, M. Complex waveguide trajectory induced by spatial soliton in LiNbO3. Trends Opt. Photonics Ser. 2005, 99, 494. [Google Scholar]
- Assanto, G.; Peccianti, M.; Conti, C. Nematicons: Optical Spatial Solitons in Nematic Liquid Crystals. Opt. Photonics News 2003, 14, 44–48. [Google Scholar] [CrossRef]
- Peccianti, M.; Dyadyusha, A.; Kaczmarek, M.; Assanto, G. Tunable refraction and reflection of self-confined beams. Nature 2006, 2, 737–742. [Google Scholar] [CrossRef]
- Jost, B.M.; Al-Rashed, A.A.R.; Saleh, B.E.A. Observation of Goos-Hänchen effect in a phase-conjugated mirror. Phys. Rev. Lett. 1998, 81, 2233–2235. [Google Scholar] [CrossRef]
- Sanchez-Curto, J.; Chamorro-Posada, P.; McDonald, G.S. Giant Goos-Hänchen shifts and radiation-induced trapping of Helmholtz solitons at nonlinear interfaces. Opt. Lett. 2011, 36, 3605–3607. [Google Scholar] [CrossRef]
- Aceves, A.B.; Moloney, J.V.; Newell, A.C. Theory of light-beam propagation at nonlinear interfaces. I. Equivalent-particle theory for a single interface. Phys. Rev. A 1989, 39, 1809–1827. [Google Scholar] [CrossRef]
- Alonzo, M.; Soci, C.; Chauvet, M.; Fazio, E. Solitonic waveguide reflection at an electric wall. Opt. Express 2019. under review. [Google Scholar]
- Alonzo, M.; Moscatelli, D.; Bastiani, L.; Belardini, A.; Soci, C.; Fazio, E. All-Optical Reinforcement Learning in Solitonic X-Junctions. Sci. Rep. 2018, 8, 5716. [Google Scholar] [CrossRef]
- Yang, Z.; Lu, D.; Hu, W.; Zheng, Y.; Gao, X.; Guo, Q. Propagation of optical beams in strongly nonlocal nonlinear media. Phys. Lett. A 2010, 374, 4007–4013. [Google Scholar] [CrossRef]
- Fazio, E.; Petris, A.; Bertolotti, M.; Vlad, V.I. Optical bright solitons in lithium niobate and their applications. Roman. Rep. Phys. 2013, 65, 878–901. [Google Scholar]
- Fazio, E.; Belardini, A.; Bastiani, L.; Alonzo, M.; Chauvet, M.; Zheludev, N.; Soci, C. Novel paradigm for integrated photonics circuits: Transient interconnection network. Proc. SPIE 2017, 10130, 1013006. [Google Scholar] [CrossRef]
- Fazio, E. A road towards the photonic hardware implementation of artificial cognitive circuits. J. Ment. Health Clin. Psychol. 2018, 2, 1–5. [Google Scholar] [CrossRef]
Figure 1.
Self-focusing, self-confinement and solitonic regimes as function of the static applied bias. Without bias, beam diffraction occurs. At 5 kV/cm, self-focusing is present. Between 10 and 20 kV/cm, the beam is self-confined, with a very strong pulsing. Above this bias, pulsing is reduced and the beam gets a homogeneous shape. The pure soliton regime is reached at 27 kV/cm for which the input and output beam profiles coincide. Above this formation threshold, the beam maintains a solitonic profile.

Figure 2.
Linear propagation of the signal beam within the nonlinear waveguides as a function of the applied bias. Only at about 27 kV/cm is the signal propagation clean and without pulsing, which we call soliton waveguiding or propagation inside a waveguiding soliton.
Figure 2.
Linear propagation of the signal beam within the nonlinear waveguides as a function of the applied bias. Only at about 27 kV/cm is the signal propagation clean and without pulsing, which we call soliton waveguiding or propagation inside a waveguiding soliton.

Figure 3.
Reflection and refraction dynamics of a soliton beam at an ideal electric interface. The dotted line identifies the position of the electric wall. The applied biases at the two volumes before and after the wall are reported in each case.
Figure 3.
Reflection and refraction dynamics of a soliton beam at an ideal electric interface. The dotted line identifies the position of the electric wall. The applied biases at the two volumes before and after the wall are reported in each case.

Figure 4.
This figure reports the obtained values of the applied voltages that generated an EO interface for which a critical angle of the soliton is experimentally examined. The curves correspond to different input angles, whose values are reported on the right-hand side. All straight-line regression fits have a coefficient of determination R2 = 1.

Figure 5.
(a) From the slopes of the regressions in Figure 4, the γ coefficients of the Generalized Snell Law are calculated. They still follow a linear trend as the function of the input angle. (b) The interceptions of the regressions in Figure 4 scale quadratically with the input angle. (c) The discrepancy between the trends in Figure 5a,b gives the most efficient EO nonlinearity at a 0.6° input complementary angle.

Figure 6.
(a) Input (red) and output (black) profiles of the signal beam for different applied biases; (b) propagation losses of solitonic waveguides for different applied biases.
Figure 6.
(a) Input (red) and output (black) profiles of the signal beam for different applied biases; (b) propagation losses of solitonic waveguides for different applied biases.

Figure 7.
Determination of the radius of curvature of the osculating circles for different trajectories of the solitonic waveguides.
Figure 7.
Determination of the radius of curvature of the osculating circles for different trajectories of the solitonic waveguides.

Figure 8.
Radius of curvature and propagation losses calculated from numerical experiments: (a) Radius of curvature as a function of the refractive index contrast; (b) Propagation losses as a function of the refractive index contrast.
Figure 8.
Radius of curvature and propagation losses calculated from numerical experiments: (a) Radius of curvature as a function of the refractive index contrast; (b) Propagation losses as a function of the refractive index contrast.

© 2019 by the authors. Licensee MDPI, Basel, Switzerland. This article is an open access article distributed under the terms and conditions of the Creative Commons Attribution (CC BY) license (http://creativecommons.org/licenses/by/4.0/).
Share and Cite
MDPI and ACS Style
Fazio, E.; Alonzo, M.; Belardini, A. Addressable Refraction and Curved Soliton Waveguides Using Electric Interfaces. Appl. Sci. 2019, 9, 347. https://0-doi-org.brum.beds.ac.uk/10.3390/app9020347
AMA Style
Fazio E, Alonzo M, Belardini A. Addressable Refraction and Curved Soliton Waveguides Using Electric Interfaces. Applied Sciences. 2019; 9(2):347. https://0-doi-org.brum.beds.ac.uk/10.3390/app9020347
Chicago/Turabian StyleFazio, Eugenio, Massimo Alonzo, and Alessandro Belardini. 2019. "Addressable Refraction and Curved Soliton Waveguides Using Electric Interfaces" Applied Sciences 9, no. 2: 347. https://0-doi-org.brum.beds.ac.uk/10.3390/app9020347
Note that from the first issue of 2016, this journal uses article numbers instead of page numbers. See further details here.