1. Introduction
The electric power system started with a battle between two paradigms of AC and DC for power transfer towards the end of the nineteenth century. The earliest power system was DC in nature and AC won the confrontation due to its ability of voltage level transformation [
1,
2]. Evidently, if DC had this property at that time, the power system could have been DC in nature. AC developed this property with the invention of electromagnetic transformers. AC enjoyed its rule over all the major stages (generation, transmission, distribution, and utilization) of the power system. DC could not develop a significant presence at that time and was left with dwarfish importance [
3].
AC had a pleasant time of command over the power system until the evolution of High Voltage Direct Current (HVDC) transmission, which was proven better as compared to High Voltage Alternating Current (HVAC) transmission with profuse successful installations [
4], bringing DC back to the picture of the power system. Generation was a strong ally of AC with three-phase synchronous alternators. DC made its move with the trending renewable energy technologies, threatening AC at the generation end. The solar PV generates DC power; wind farms have a topology, which produces DC at an intermediate stage for conversion to stable and synchronized AC output [
5]. Advancement in power electronics enables both conversions between AC and DC as well as voltage level transformation. The power output from solar/wind can effectively be converted to AC for AC dependent loads with power converters [
6,
7]. It would not be an exaggeration that power electronics have formed a base for DC to stand on and compete against AC. At the utilization end, the stupendous inflation of modern electronic loads had brought notable demand for DC. The shifting trend towards LED lights, electronics, mobile phone and laptop chargers in the modern home adds to the DC side, strengthening it further as compared to AC [
8]. Moreover, lower line losses, lower voltage dips and simplified control associated with the low voltage DC distribution (LVDC) systems have made it an optimal choice for low-cost rural electrification [
9,
10,
11,
12,
13,
14].
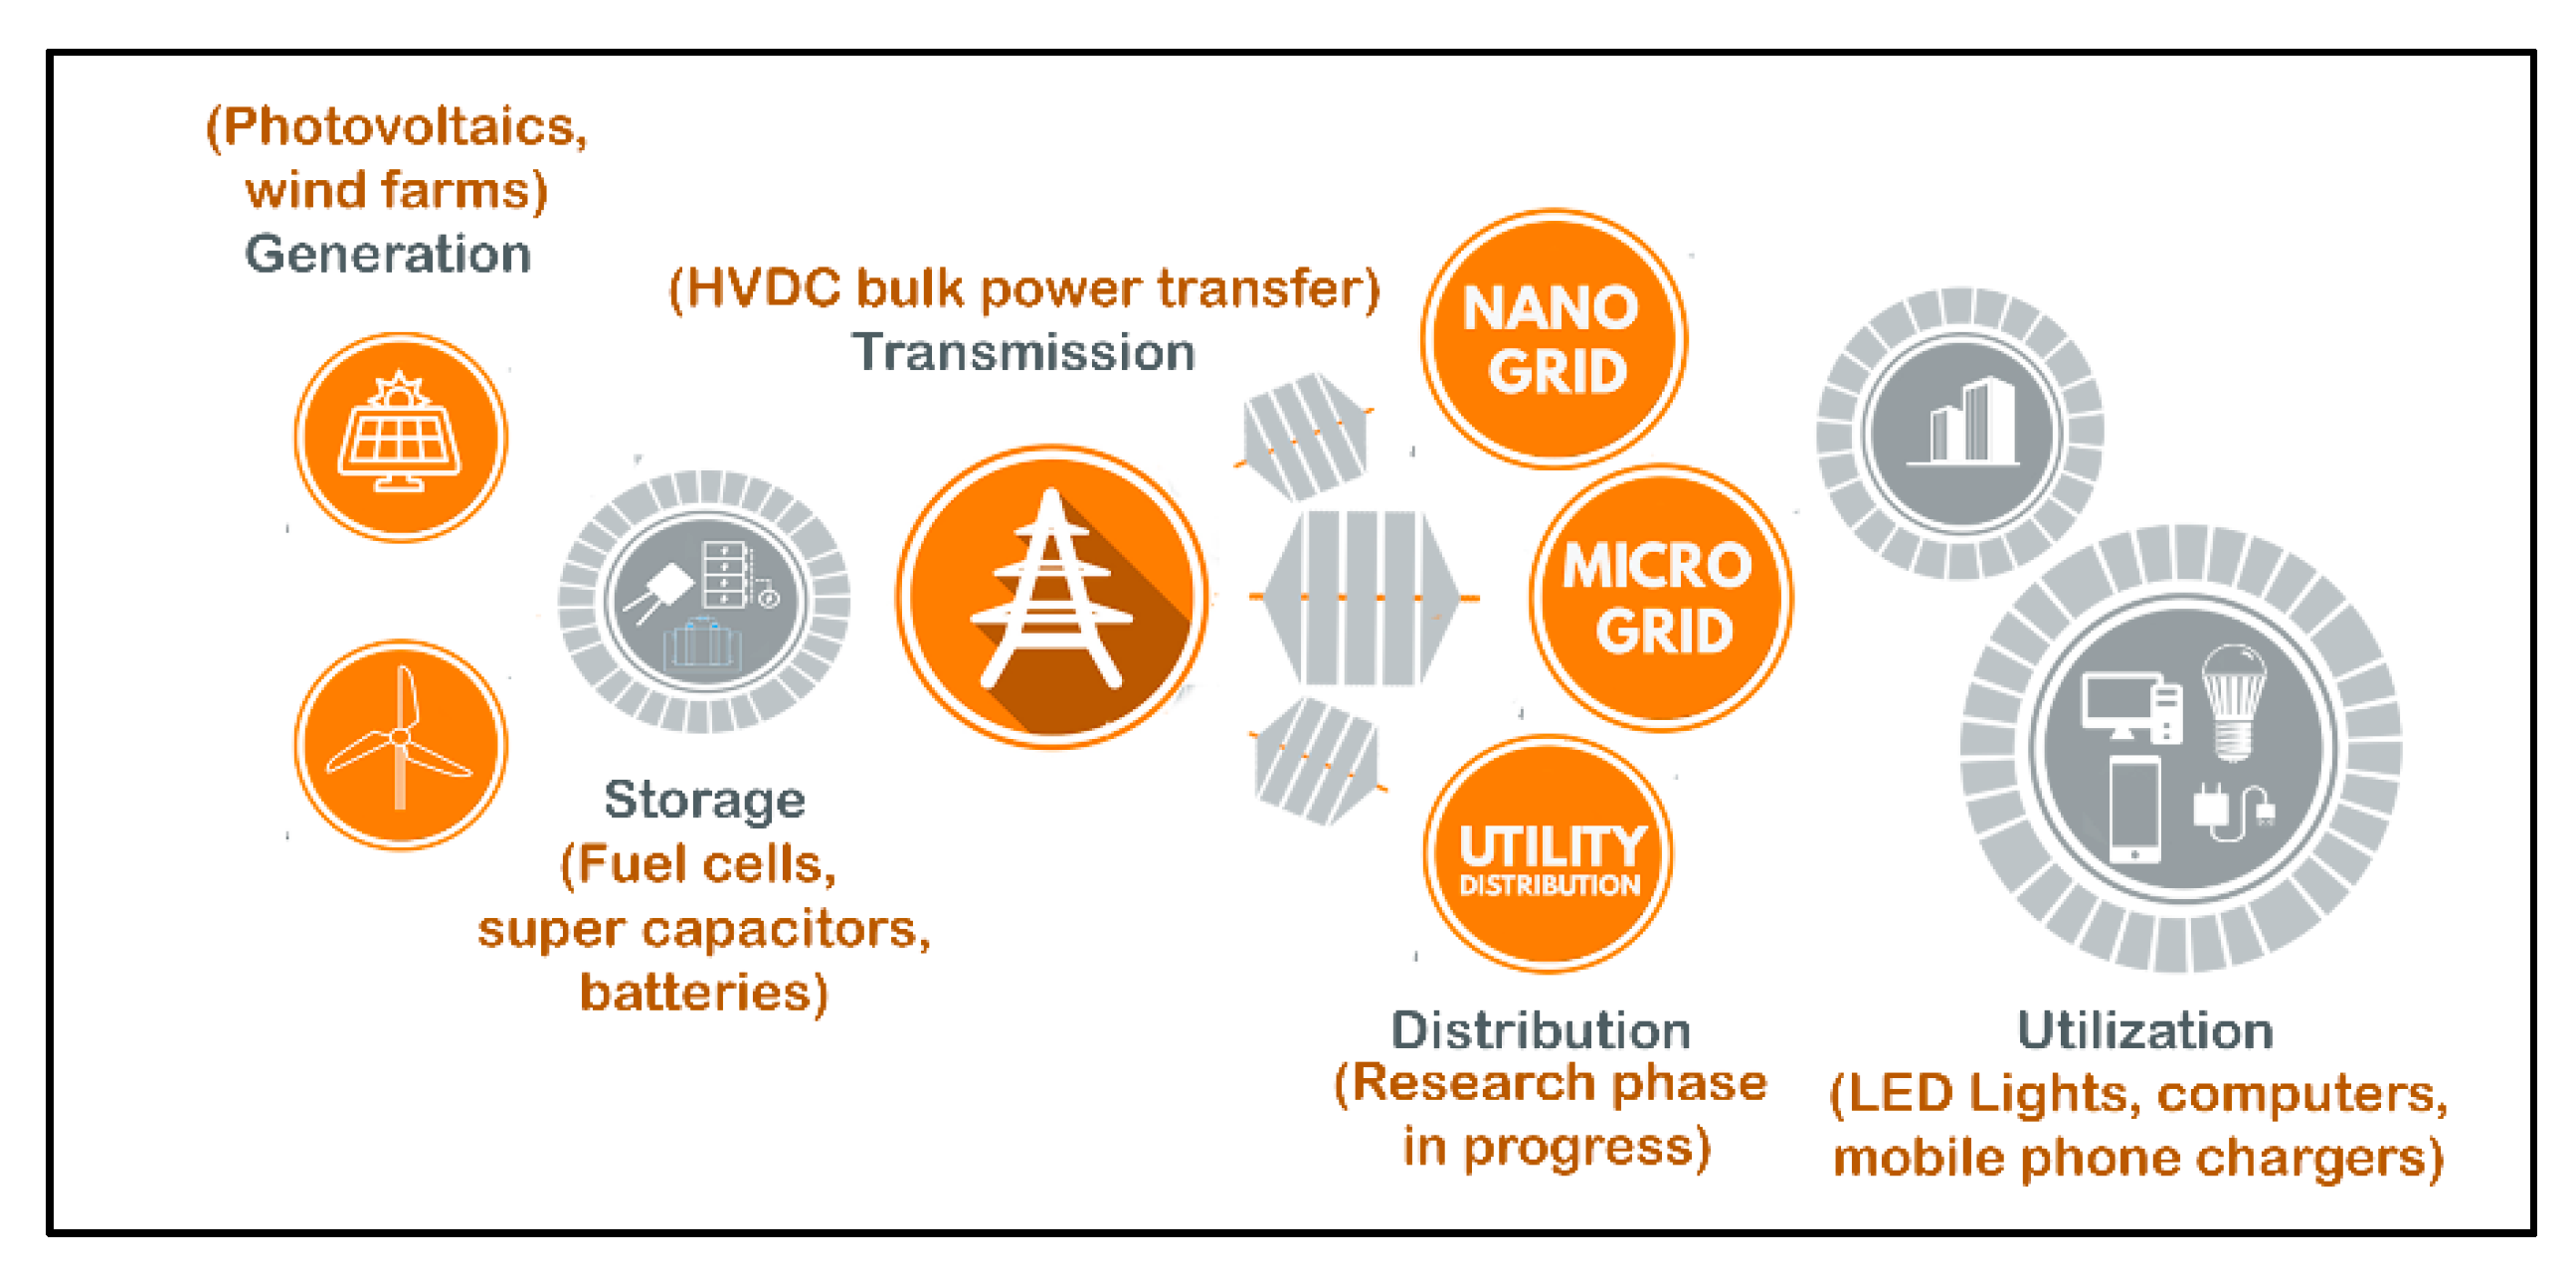
Figure 1 depicts the penetration of DC in the power system. DC has set up concrete grounds in generation, transmission, and utilization, while distribution is the portion that is still under the research phase. Various aspects of DC in distribution still need to be brought to light. The entire shift towards DC cannot be realized without resolving the technical challenges associated with the emerging DC power systems. These challenges mainly include space charge accumulation in DC cable insulation [
15], DC system protection [
16], and DC system stability [
17]. It should be noted that DC breakers are more sophisticated and cumbersome to manage in the case of short-circuits or unwanted transients. For instance, during a system fault and associated opening of the circuit breakers, the arcing is largely limited in AC due to the zero crossing unlike the case of DC, where forced commutation or energy chopping devices have to be installed to dissipate the arc energy. In DC systems these arcs may be higher and could potentially be hazardous [
16]. The existing era is, therefore, witnessing the reignited battle of currents with both the competitors, AC and DC, having their advantages and disadvantages, and thereby motivating the researchers to explore the various factors for comparative analysis.
Comparison of AC and DC distribution is the subject of many researchers. For instance, the authors of [
18] presented a small-scale network for comparison of AC and DC distribution. They concluded that input savings of 7% can be achieved with DC distribution at 400 V. In [
19], the authors presented that conduction losses of DC are 37% of the AC system. Furthermore, [
20] presented the loss comparison of DC distribution for two voltage levels (24 V and 48 V), where it was concluded that the DC system with 48 V should be a better choice. However, load variation was not considered for this study. The authors of [
21] discussed the comparison of AC and DC systems with the inclusion of solar PV. They concluded that the DC system utilized solar energy was better than the AC system. However, the loads under consideration were LED lights with single power electronic converter as a driver. The author of [
22] concluded from the comparison of AC and DC that if local generation is provided, only DC is a suitable option. The work presented in [
23] was another efficiency comparison of the two paradigms. The study revealed that DC-DC converter efficiency as the
defining factor for AC and DC systems’ efficiencies. The loads were divided on a 50-50 basis, i.e., half loads as AC and half DC, and the effect of power electronic inter-conversions (AC/DC, DC/AC) was not included.
Across the globe, DC power is assumed to have not gained significant fame as compared to AC power in the residential sector [
3,
24,
25]. This paper aims to present the viability of DC at the residential level, by presenting a comparative analysis of AC and DC distribution networks. Several factors influence the comparison; however, this study frames the factor of “time”. This reflects how the power demands of loads installed within the home change through a day. Power electronic converters form the backbone of DC distribution systems. With changing load demand, the efficiencies of the installed power electronic converter change. Thus, a time-based study considering daily load variation and efficiency variation of converters with changing loads is important to perform a comparative analysis. In this study, average load data for a standard US home is used for the purpose of analysis. A mathematical model of the systems is formulated at an hourly basis. MATLAB is used for mathematical model-based calculations and analysis. The focus of this study is to keep the comparison fair; therefore, the conditions for both the systems are kept similar so that a real picture is obtained that portrays actual comparison in the time frame.
2. Comparison with Previous Research
DC distribution has been the subject of [
26,
27], but their work lacks comparison of AC and DC at the distribution level. However, the theme of current research is on the comparison of AC and DC distribution systems. The authors of [
28] have focused on commercial buildings with DC loads and assumed DC as an available medium of power, where the conversion stages and associated losses were ignored. This research is solely focusing on residential localities and highlighting the effect of converter efficiencies on residential distribution networks. The work presented in [
29] assumes that all loads in residence are inherently DC. In contrast to the prior-art research, this paper offers work based on practical load data, containing both AC and DC loads that exist in a typical residential building. [
8,
30] are two of our earlier studies on DC power distribution. In [
30], we presented the efficiency analysis of DC distribution system but did not carry out its comparison with AC distribution system. Furthermore, the power consumed by loads was arbitrarily divided into three-time zones constituting a day. However, in the current work, a typical hourly consumption of loads is utilized to derive a comparison of AC and DC distribution systems. In [
8], we took variable converter efficiencies without considering load variation, whereas the theme of the current effort is based on changing efficiencies of converters with loading. The authors of [
23] presented the comparison of both distribution schemes with quite high values of converter efficiencies (up to 99.5%); the authors themselves claimed that such high-value converters are quite rare. A time-based study is missing in [
31], where the authors have presented DC distribution, its efficiency analysis and comparison with AC counterpart with certain assumptions. In addition to the comparison of AC and DC distribution networks considering daily load variation based on actual data, this research effort features the study of the effect of solar irradiance variations throughout the day on DC and AC distribution systems. In the past, studies have been presented with solar PVs in the DC distribution due to the shifting trend towards renewable resources, i.e., [
13,
28]. However, the authors of both research efforts in [
13,
28] did not compare AC and DC distribution at the residential level considering hourly load as well as solar irradiance variations.
3. In-building System Model
The system modeling presented here finds its basis in the Buildings Energy Databook [
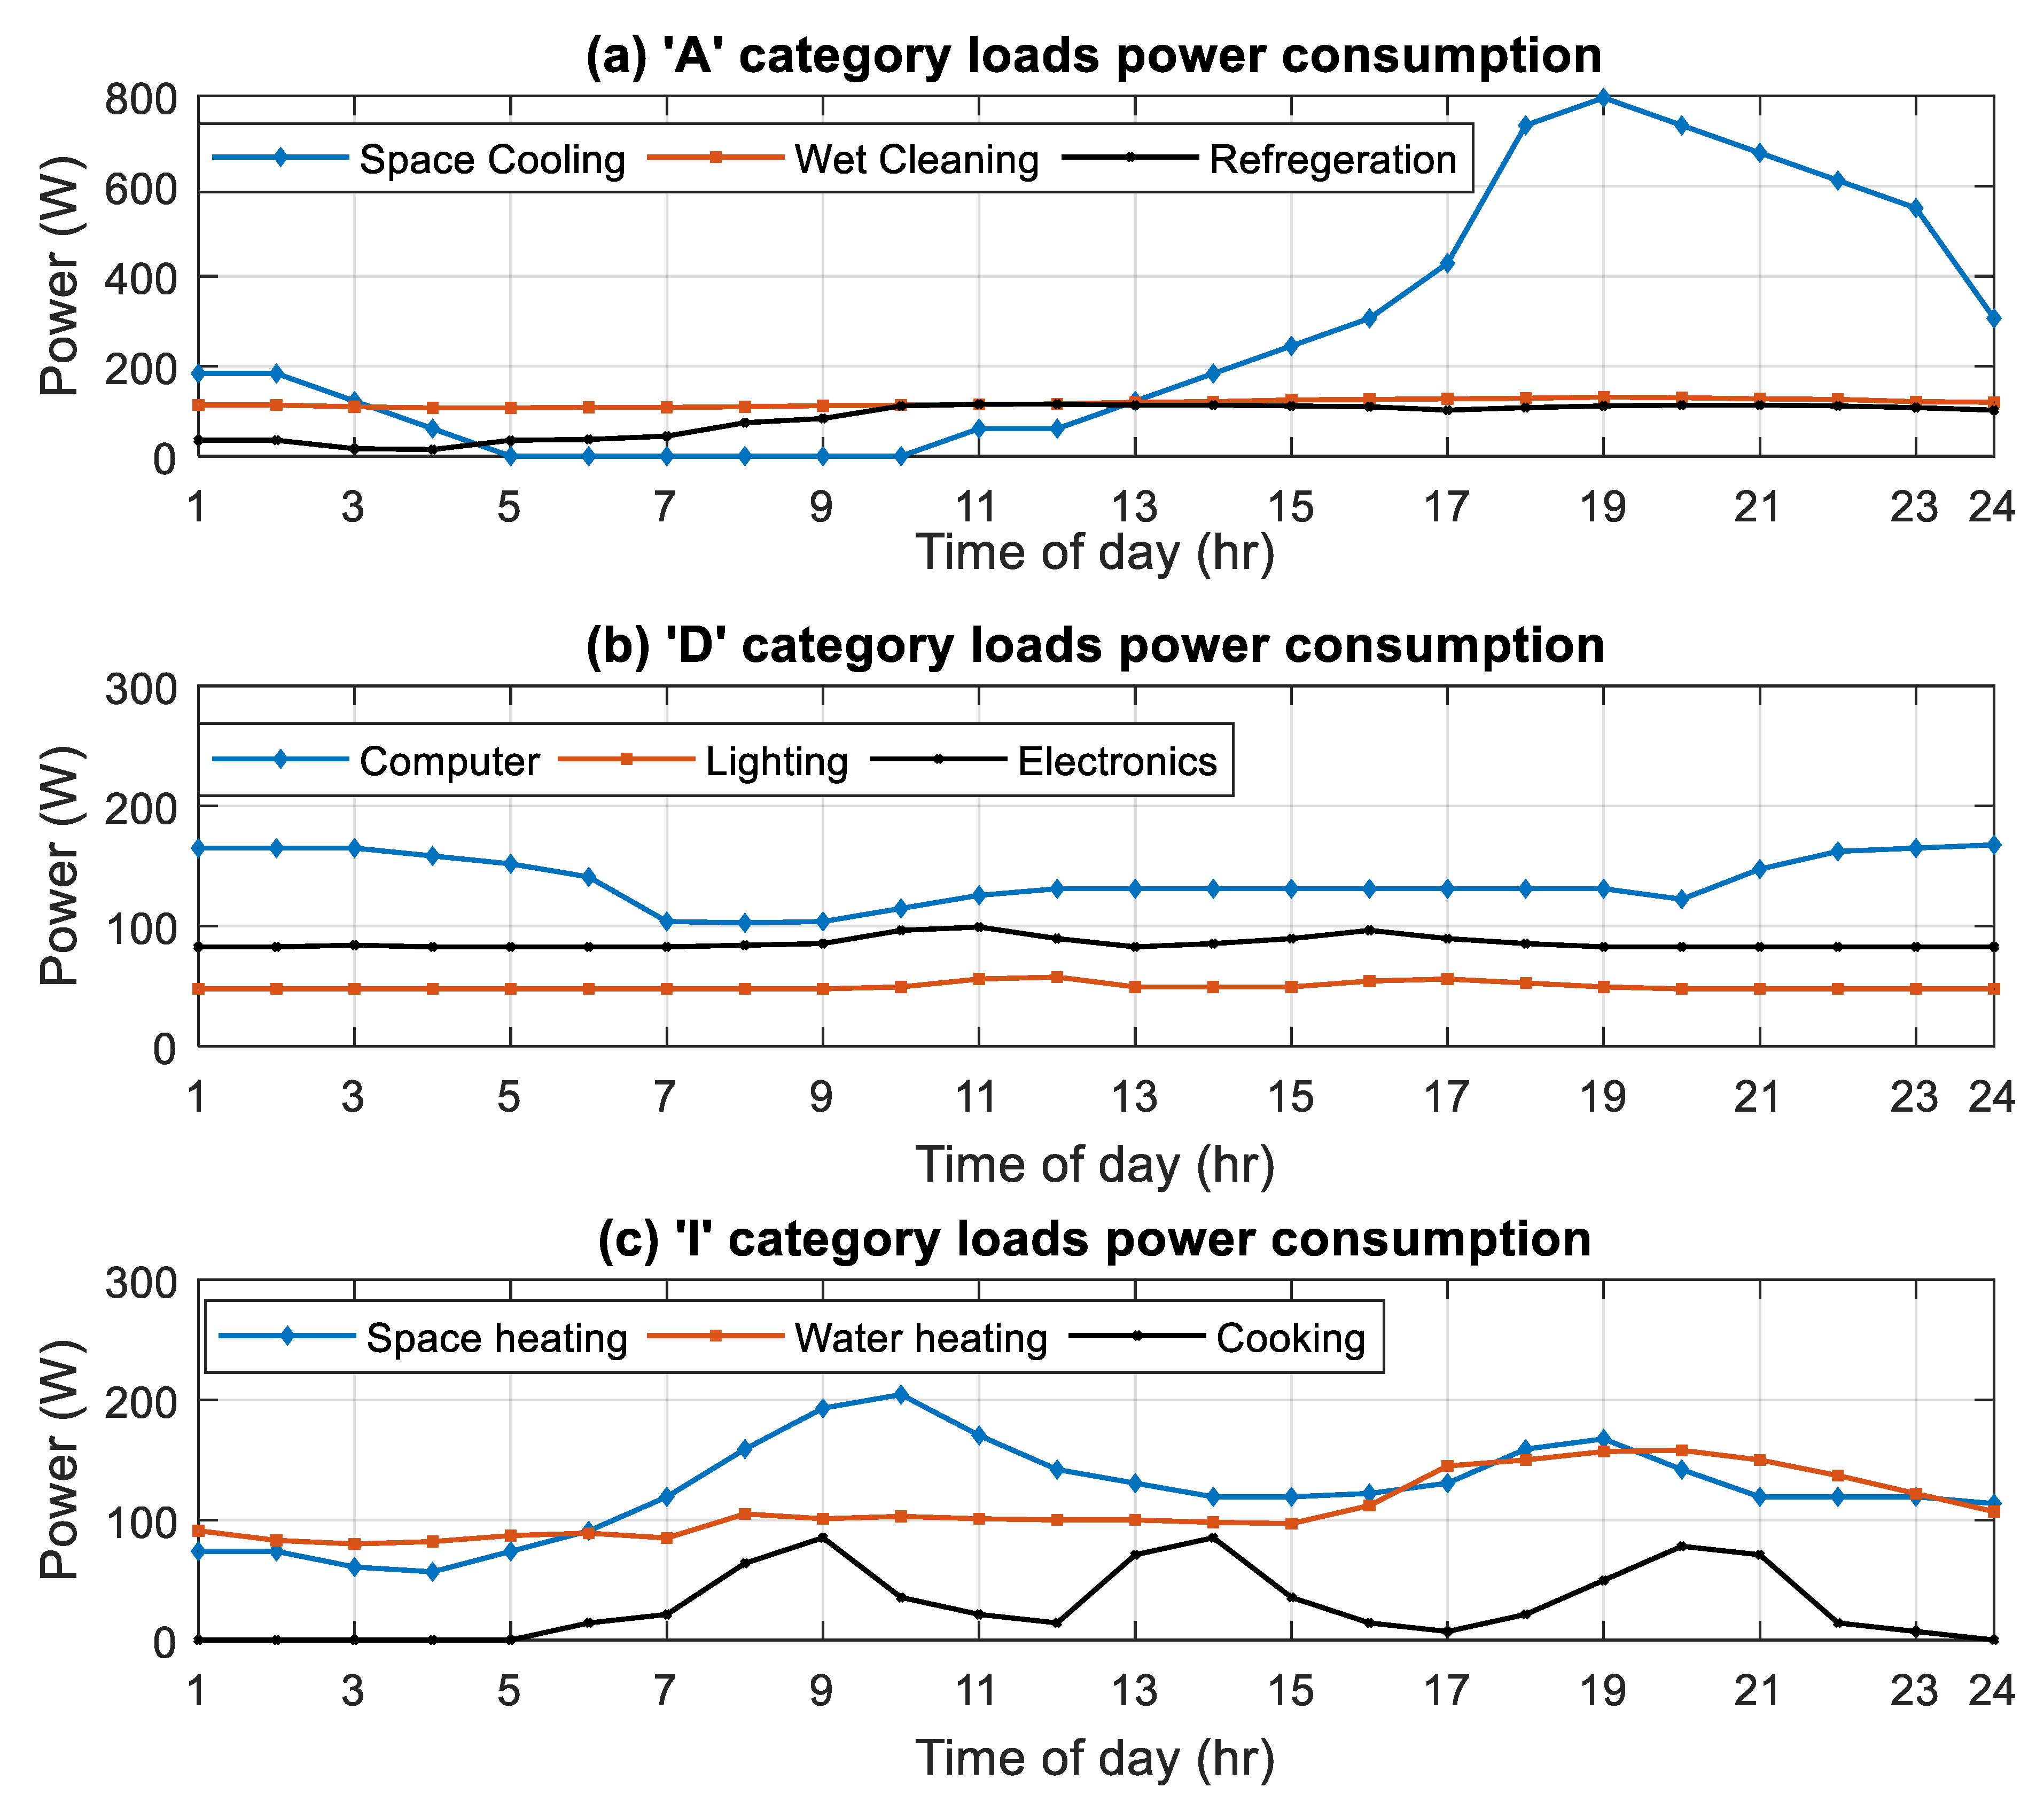
32], which presents end-use splits of US residential energy consumption. Subsequently, the residential loads are broadly classified into three categories; ‘A’, ‘D’ and ‘I’, as explained in the following:
‘A’ category: The loads that are inherently AC in nature. Examples include induction motor-base clothes washer and compressors in refrigerators and air-conditioners. In a DC distribution system, these will require a DC-AC conversion stage for operation, whereas the AC distribution system, they will be directly operated from the power mains.
‘D’ category: The loads that can operate on DC fall in this category. Lighting, due to the advent of LEDs, falls in this category. Home electronics, computers, and laptops are other examples of D category loads. These loads require AC-DC conversion in the AC system and DC-DC conversion in the DC system for stepping down the mains DC voltage to a level essential for the loads.
‘I’ category: The loads independent of the type of power available fall in this category. Heating loads, e.g., electric iron and water heaters, fall in this category. These do not require a conversion stage for their operation and can directly be operated from the power mains if a suitable voltage is supplied.
The average monthly consumption of a US home [
33] is considered for modeling. This allows us the analysis of single/multi-family homes through a single platform. The average monthly consumption of a US home is 911 kWh, which gives average daily consumption of about 30 kWh. The energy data are combined with this value to give the kWh-of-energy consumed by each load.
Table 1 presents the residential energy splits and energy in kWh for each load. The percentage consumption in 24 h is calculated for each load, as depicted in the pie chart. This value is combined with the average daily consumption to form ‘Energy kWh’ column. For example, water heating accounts for 0.48/4.795 of the total home’s consumption. Combining this ratio with the average daily consumption of 30 kWh gives 2.64 kWh of the energy consumed per day. Furthermore, loads are categorized into ‘A’, ‘D’ and ‘I’ categories, as explained in the above; ‘other’ load type is given an equal share in each category. For mathematical modeling/simulation and analysis, the MATLAB software is used.
The next step is to find the energy consumption of each load per hour. For this, we refer to the curves from the Energy Information Administration (EIA) for each load type [
33]. From the curves, we were able to acquire the hourly distribution of energy of each load, as shown in
Figure A1. For example, the overall consumption of space heating is 2.64 kWh, and then we fitted this value in the curve equation gained from MATLAB curve fitting tool and obtained the consumption value for each hour. After performing a similar task for each load type except for the “other” load type, which is allotted the equal share in each hour,
Table 2 was formulated.
4. Mathematical Model
The entries of
Table 2 form a matrix with 24 columns representing hours of the day and 12 rows representing loads in a typical modern home. The entries of the matrix are the power consumption per hour of each load.
where the power consumption of ‘A’ category loads is taken from
x1 to
xn1. Similarly, the power consumption of ‘D’ category loads is taken from
xn1+1 to
xn2, and ‘I’ category from
xn2+1 to
xn3. Here, ‘
j’ defines hours of the day, from 1 to 24.
In order to find the rating of the appropriate converter for the power/voltage level conversion, we need to find the maximum load that needs to be supplied by the converter. The maximum value of power consumption of load can be found from
where ‘
Y’ takes the maximum values of all the entries of
Xi,j representing power consumptions of loads for each hour. A margin of 20% is further added to the maximum value of load consumption for practical reasons as
The matrix is transposed to convert the column matrix formed in (2) to the row matrix for ease of calculations.
The next step is to find the percentage loading. This value is important because it is utilized to find the operating efficiency of the converter. A matrix with the similar dimensions as
Xi,j can be created
For ‘A’ category loads:
The percentage loading is placed in a curve equation of the DC-AC converter that gives the efficiency of converter for each hour. A general equation may be
where ‘
η’ is the efficiency of the DC-AC converter as a function of percentage loading ‘
l’. In (5), the efficiency of the converter is the function of percentage loading. The curves and their corresponding equations are presented in the subsequent section.
For ‘D’ category loads:
Similarly, the percentage loading is placed in the curve equation of the DC-AC converter, which gives the efficiency of converter for each hour. The same equation as (5), with required modifications, can be derived for converters driving ‘D’ category loads.
For ‘D’ Category loads:
There is no need for a conversion stage. Hence, the conversion efficiency is given as
To acquire the input matrix, we made use of the general formula of efficiency that equals 100% of output/input, which is depicted as
which contains the input power to a residential building for 24 h. The efficiency matrix is formed by combining (5)–(7), and the output matrix is the one formed in (1).
All the entries of the input power matrix are added to give the total input to the building per hour as
Similarly, the loadings of each home in each hour can be formed as
The overall efficiency of a building per hour can be computed by
Suppose that we have a system with ‘m’ buildings per DC-DC converter transformer (DC, XFMR) in a residential community. We can adopt the same procedure for the overall efficiency of the system as we did for one building. The output of each DC-DC converter transformer is the input to ‘m’ buildings, which can be expressed as
For the DC-DC converter transformer, (2) and (3) can be utilized to find the ratings given by
In order to find the percentage loading of the DC-DC converter transformer in each hour, the load on DC-DC converter transformer is divided by its rating as
Subsequently, (5) can be utilized to acquire the efficiency for ‘m’ number of buildings as
The overall system input is the power delivered by the grid, which forms the DC-DC converter tansformer’s input. This can be found in
The values for multiple DC-DC converter transformers are combined to produce the power from the grid, which is taken as the system input for each hour. The output of the system per hour is the hourly power consumption of all the loads combined as shown in (1). The ratio of (1) and (16) gives the overall system’s efficiency.
The same procedure is employed to determine the AC system’s efficiency. However, in the case of AC, ‘A’ and ‘I’ category loads are operated directly online, whereas the AC-DC converter is employed for driving D category loads. Moreover, in place of the DC-DC converter transformer, a distribution transformer is employed. The working efficiencies of AC-DC converters and the transformers can be determined by making the use of (5) with appropriate changes.
5. Overall System Model and Analysis
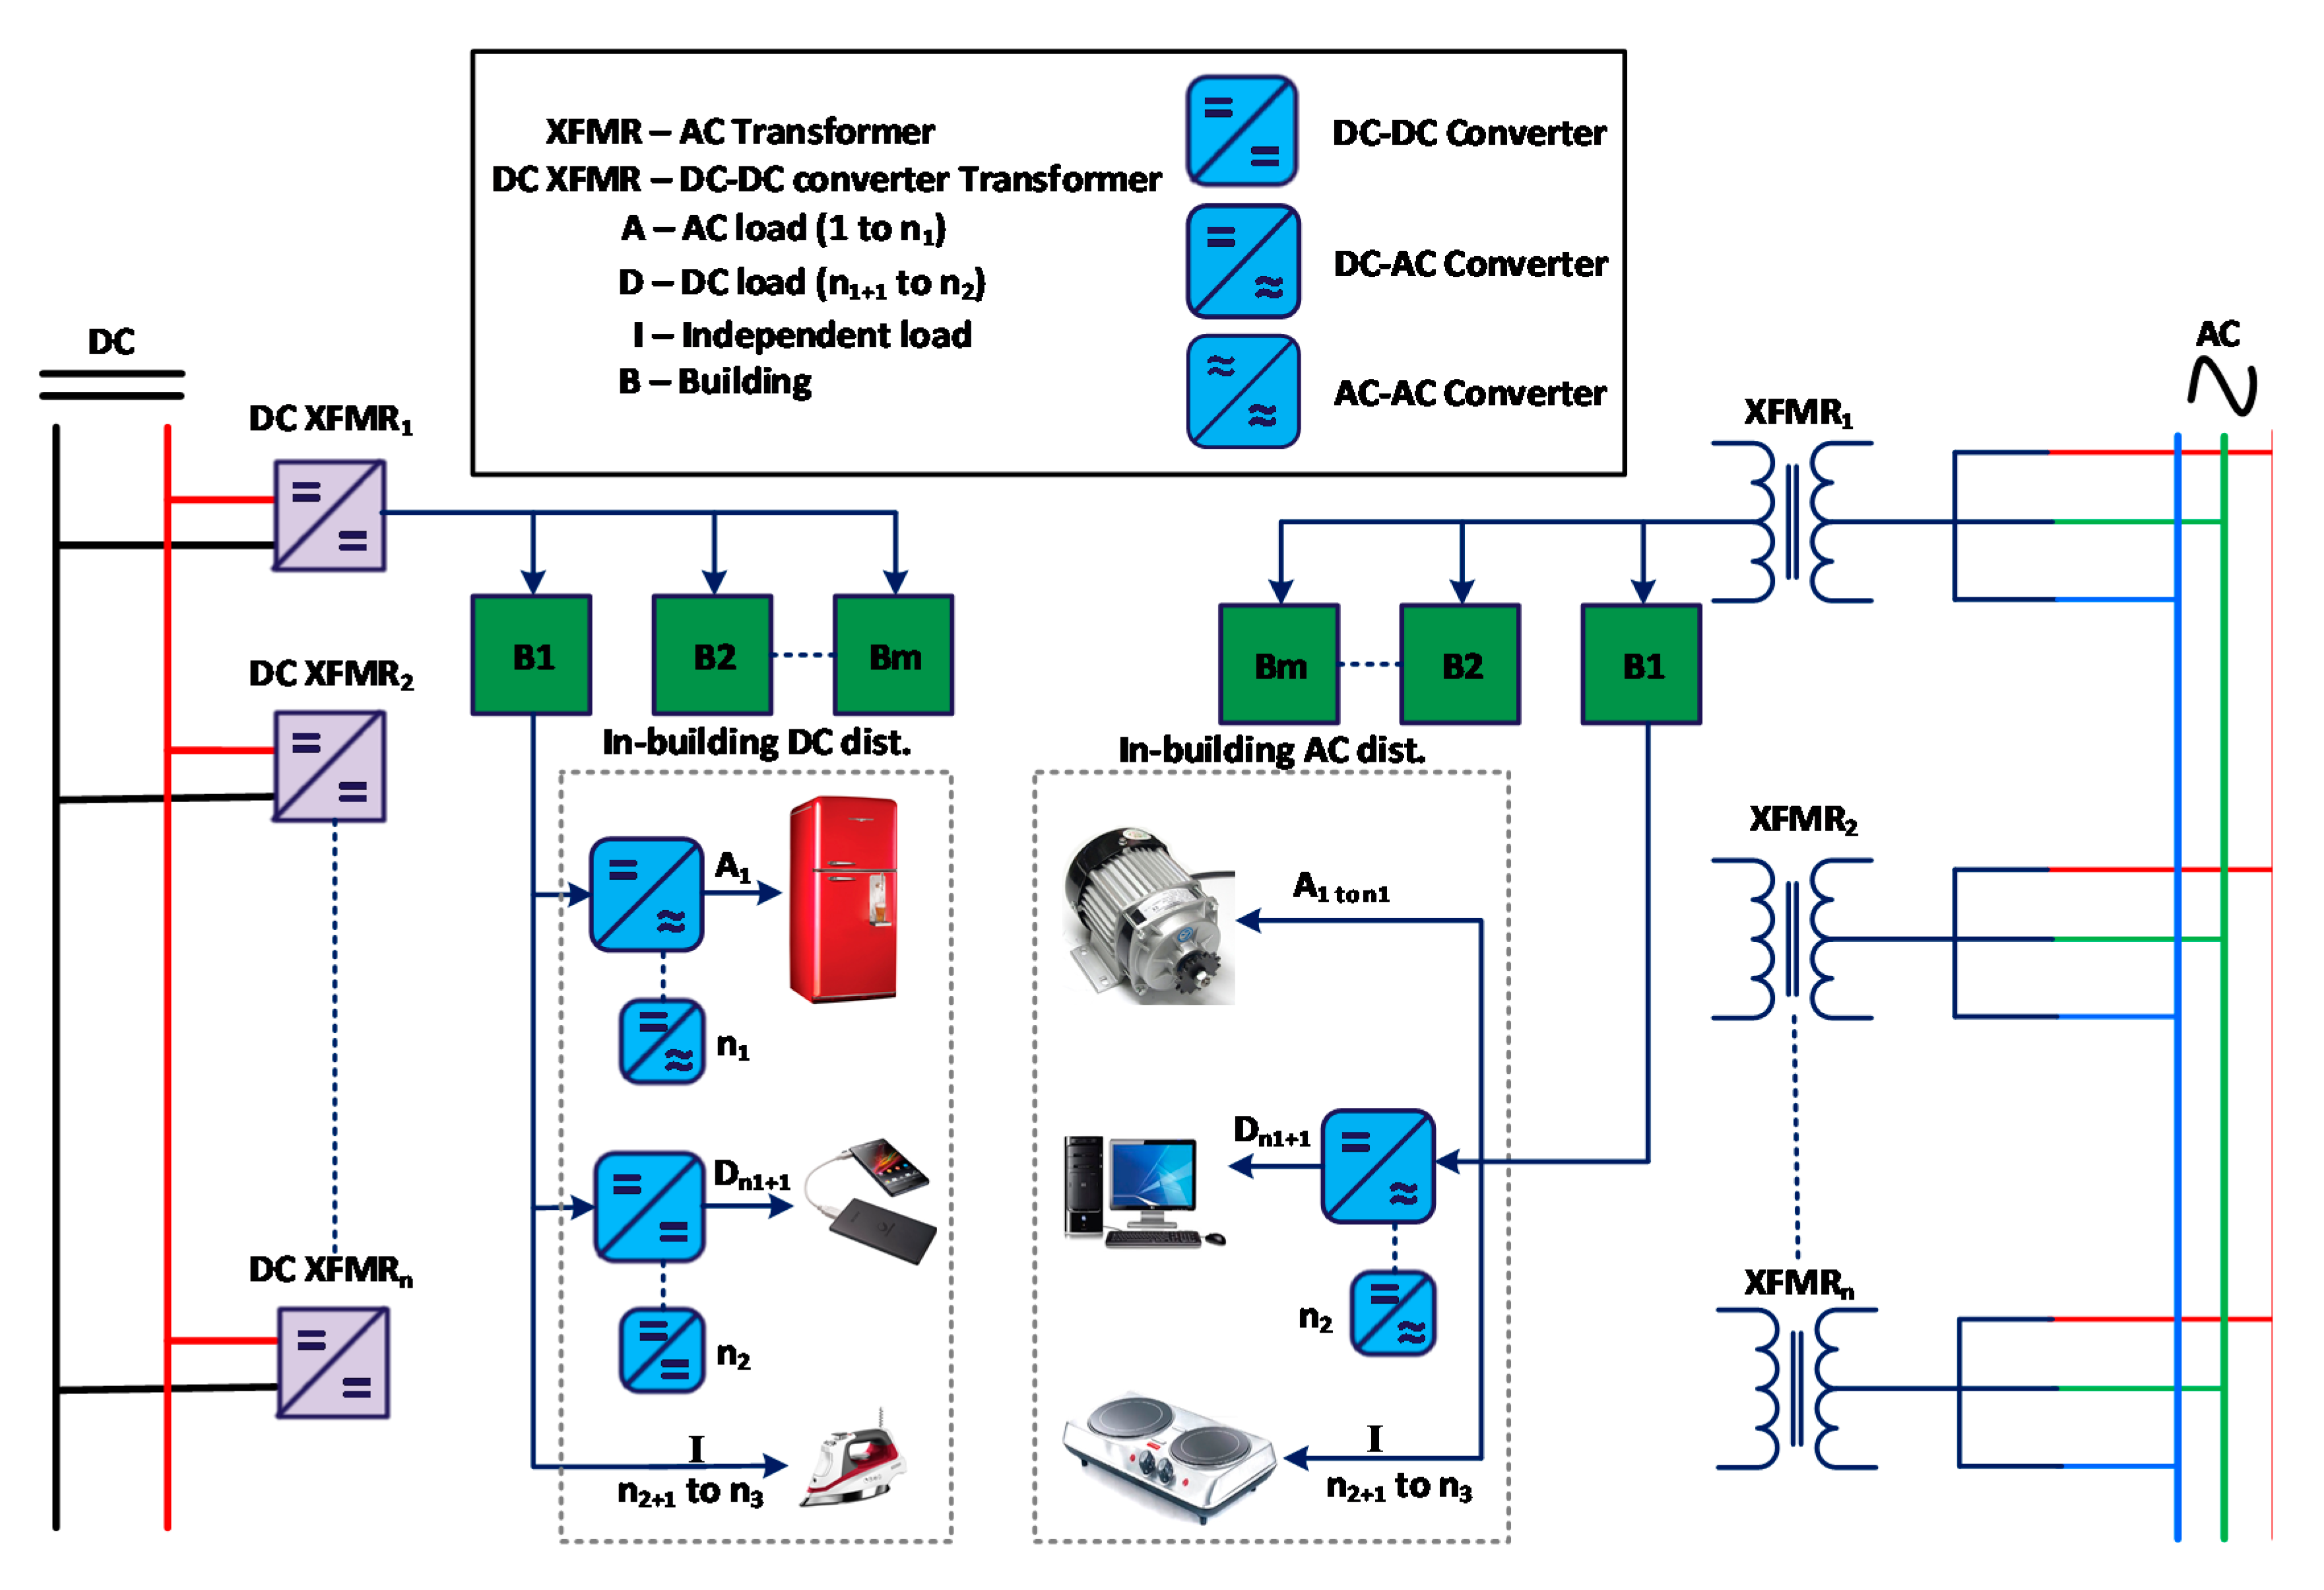
An overall picture of the system model is depicted in
Figure 2. The left side represents a DC distribution system. The 11-kV primary distribution lines are depicted in red and black. DC-DC converter transformers are employed for the primary DC-DC conversion, which steps down the voltage level from 11-kV to 325-V. From each DC-DC Converter transformer, 325-V power lines are drawn to energize the buildings. The in-building “A, D, I” loads are powered through converters where required. ‘A’ category loads are driven through inverters that convert 325-V DC to 230-V AC. Since ‘D’ category loads are small devices, they require power at a lower voltage level. Therefore, they are driven through DC-DC converters that convert 325-V DC to 24-V DC. ‘I’ category loads being independent are driven directly through the service mains.
The right side of
Figure 2 is the AC analogous to the left side. Three-phase lines run from the 11-kV grid. The transformers perform their duty of voltage transformation to 230-V per phase. Power at this voltage level is brought to the building, where it is converted to DC via AC-DC converter to drive ‘D’ category loads. In contrast, category ‘A’ and ‘I’ category loads directly run on 230-V available at the service mains. For analysis, the system voltage at the primary distribution voltage level is chosen to be 11-kV for both AC and DC systems. Secondary distribution is performed at 230-V per phase for the AC system and 325-V for DC system. The purpose of choosing these voltage levels draws support from [
30]. We assumed a system of 63 buildings. For distribution, 21 buildings are assumed; hence, in total3 DC-DC converter transformers are employed. For the AC system, since there are three conductors per phase, each conductor is assumed to supply 7 buildings. The figure presents a conceptual diagram of the two systems. We have chosen “Hare” aluminum conductor steel reinforced (ACSR) for both (AC and DC) distribution networks and spacing of 300 m between distribution transformers is assumed. The physical systems of AC and DC distribution draw their support from [
8]. Conductor losses are almost comparable at the secondary distribution level, therefore neglected. At the primary distribution level, DC resistance of a conductor is accounted in the DC system analysis, whereas, AC, as well as DC resistances, are accounted in the AC system analysis. Moreover, the power factor of AC loads and the loss associated with the power factor is also considered in the analysis of the AC system.
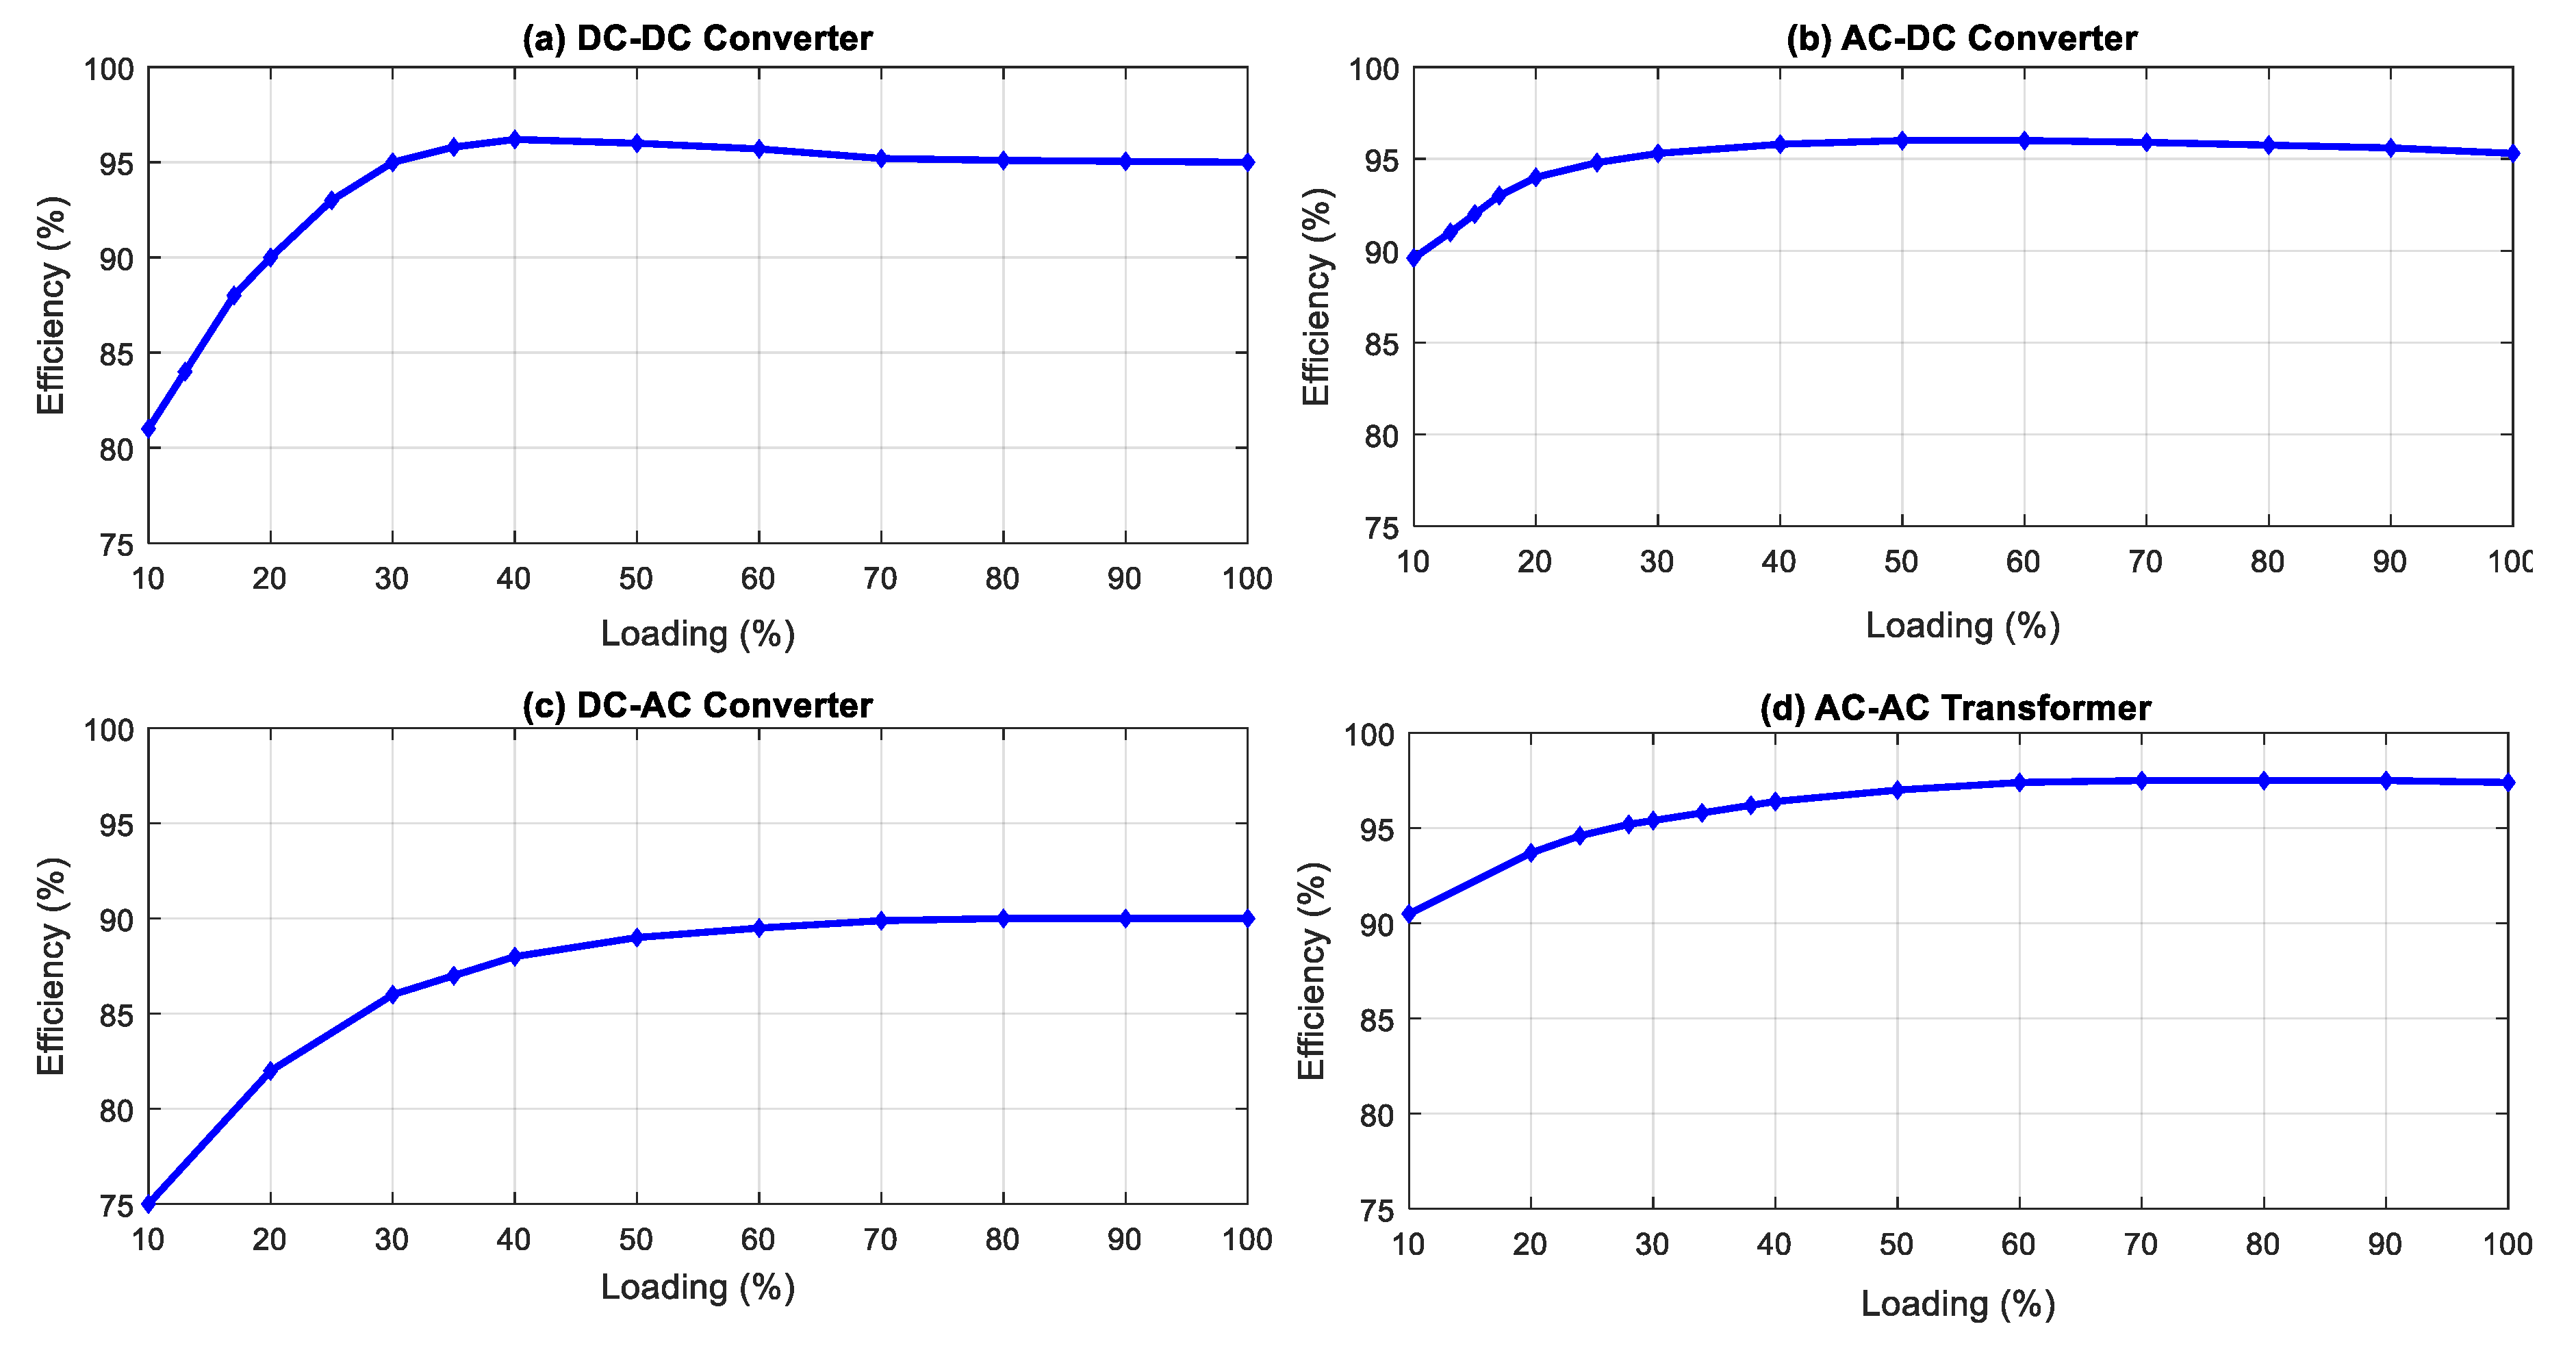
The input data are acquired through a bottom-up approach using the mathematical model discussed in the previous section. The ‘loading vs. efficiency’ curves of converters along with their equations (acquired from MATLAB curve-fitting tool) are presented in
Figure 3 and (17), respectively. The curve-fitting tool provides a function that fits the curve data, and then approximate results can be obtained by increasing the degree of the function.
where “
η” is the efficiency of converter as a function of percentage loading ‘
l’, moreover,
For DC-DC converters, j = 8 and the corresponding values of k are:
k0 = 8.1, k1 = −7.05, k2 = −0.625, k3 = −0.25, k4 = −0.2, k5 = −0.05, k6 = 0.05, k7 = 0, k8 = −0.0125
For AC-DC converters, j = 9 and the corresponding values of k are:
k0 = 9.15, k1 = −8,785, k2 = −0.23, k3 = −0.075, k4 = −0.02, k5 = −0.03, k6 = 0, k7 = 0, k8 = −0.018, k9 = −0.004
For DC-AC converters, j = 9 and the corresponding values of k are:
k0 = 7.52, k1 = −6.74, k2 = −0.48, k3 = −0.1, k4 = −0.09, k5 = −0.07, k6 = −0.06, k7 = 0.05, k8 = −0.01, k9 = −0.01
For AC-AC transformers, j = 7 and the corresponding values of k are:
k0 = 9.47, k1 = −9.24, k2 = −0.15, k3 = −0.06, k4 = −0.01, k5 = −0.01, k6 = −0.01, k7 = 0.005
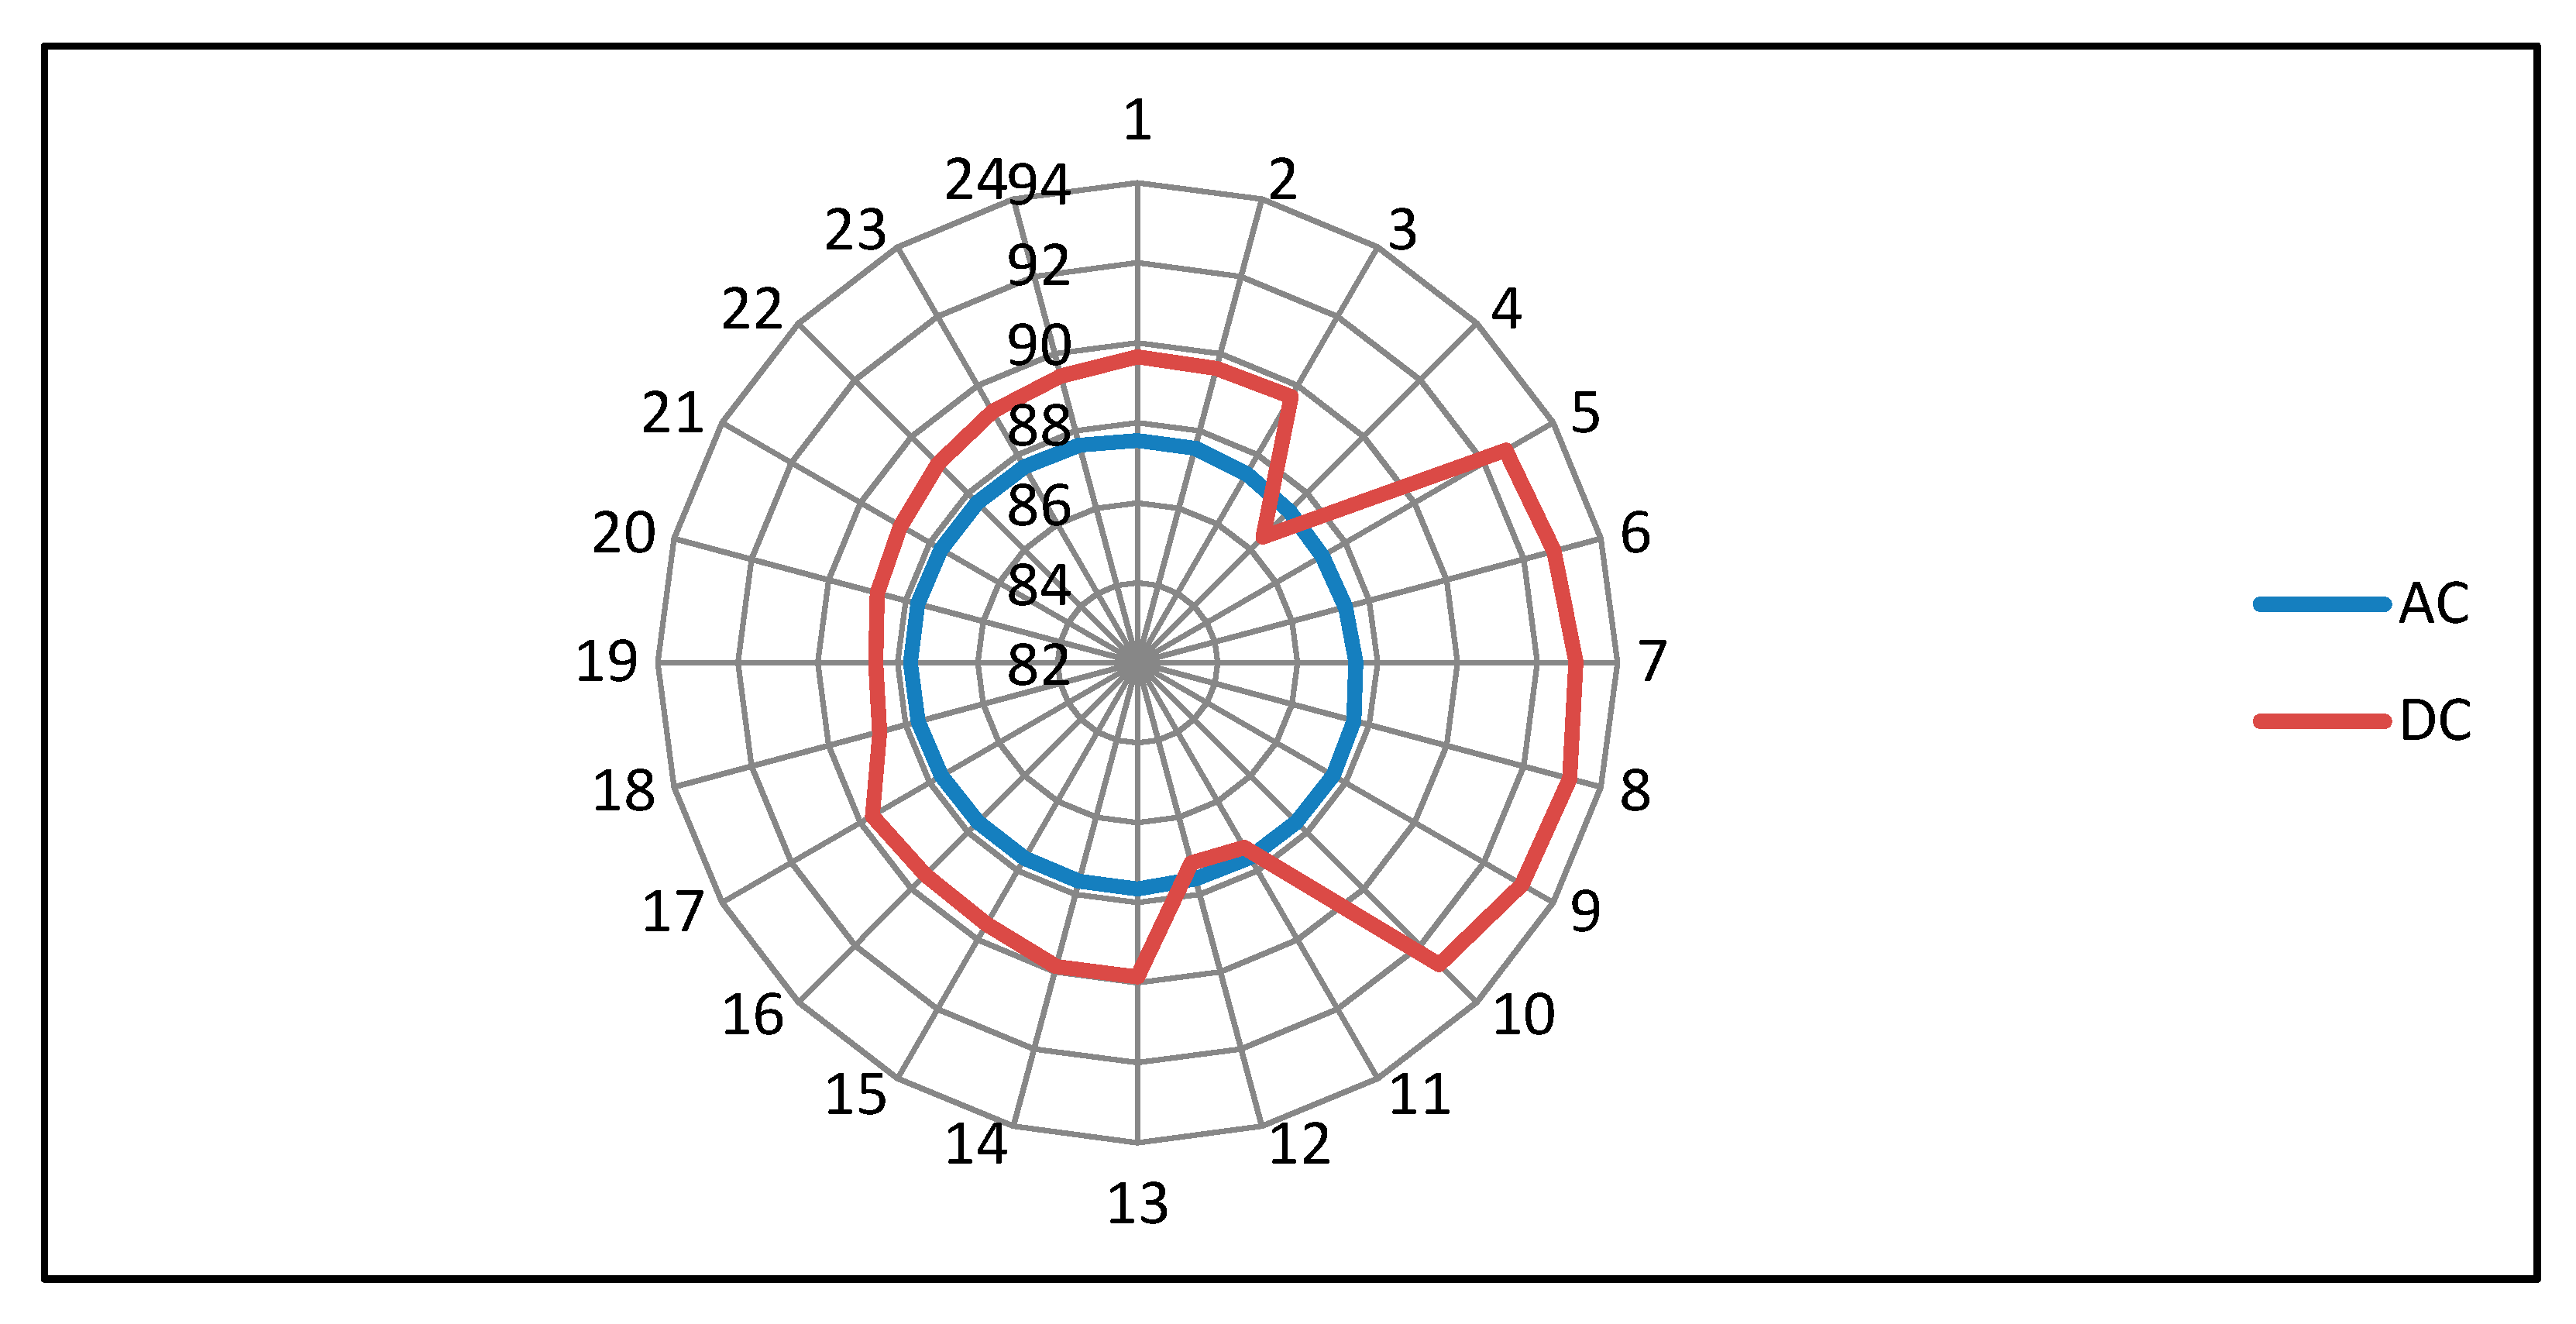
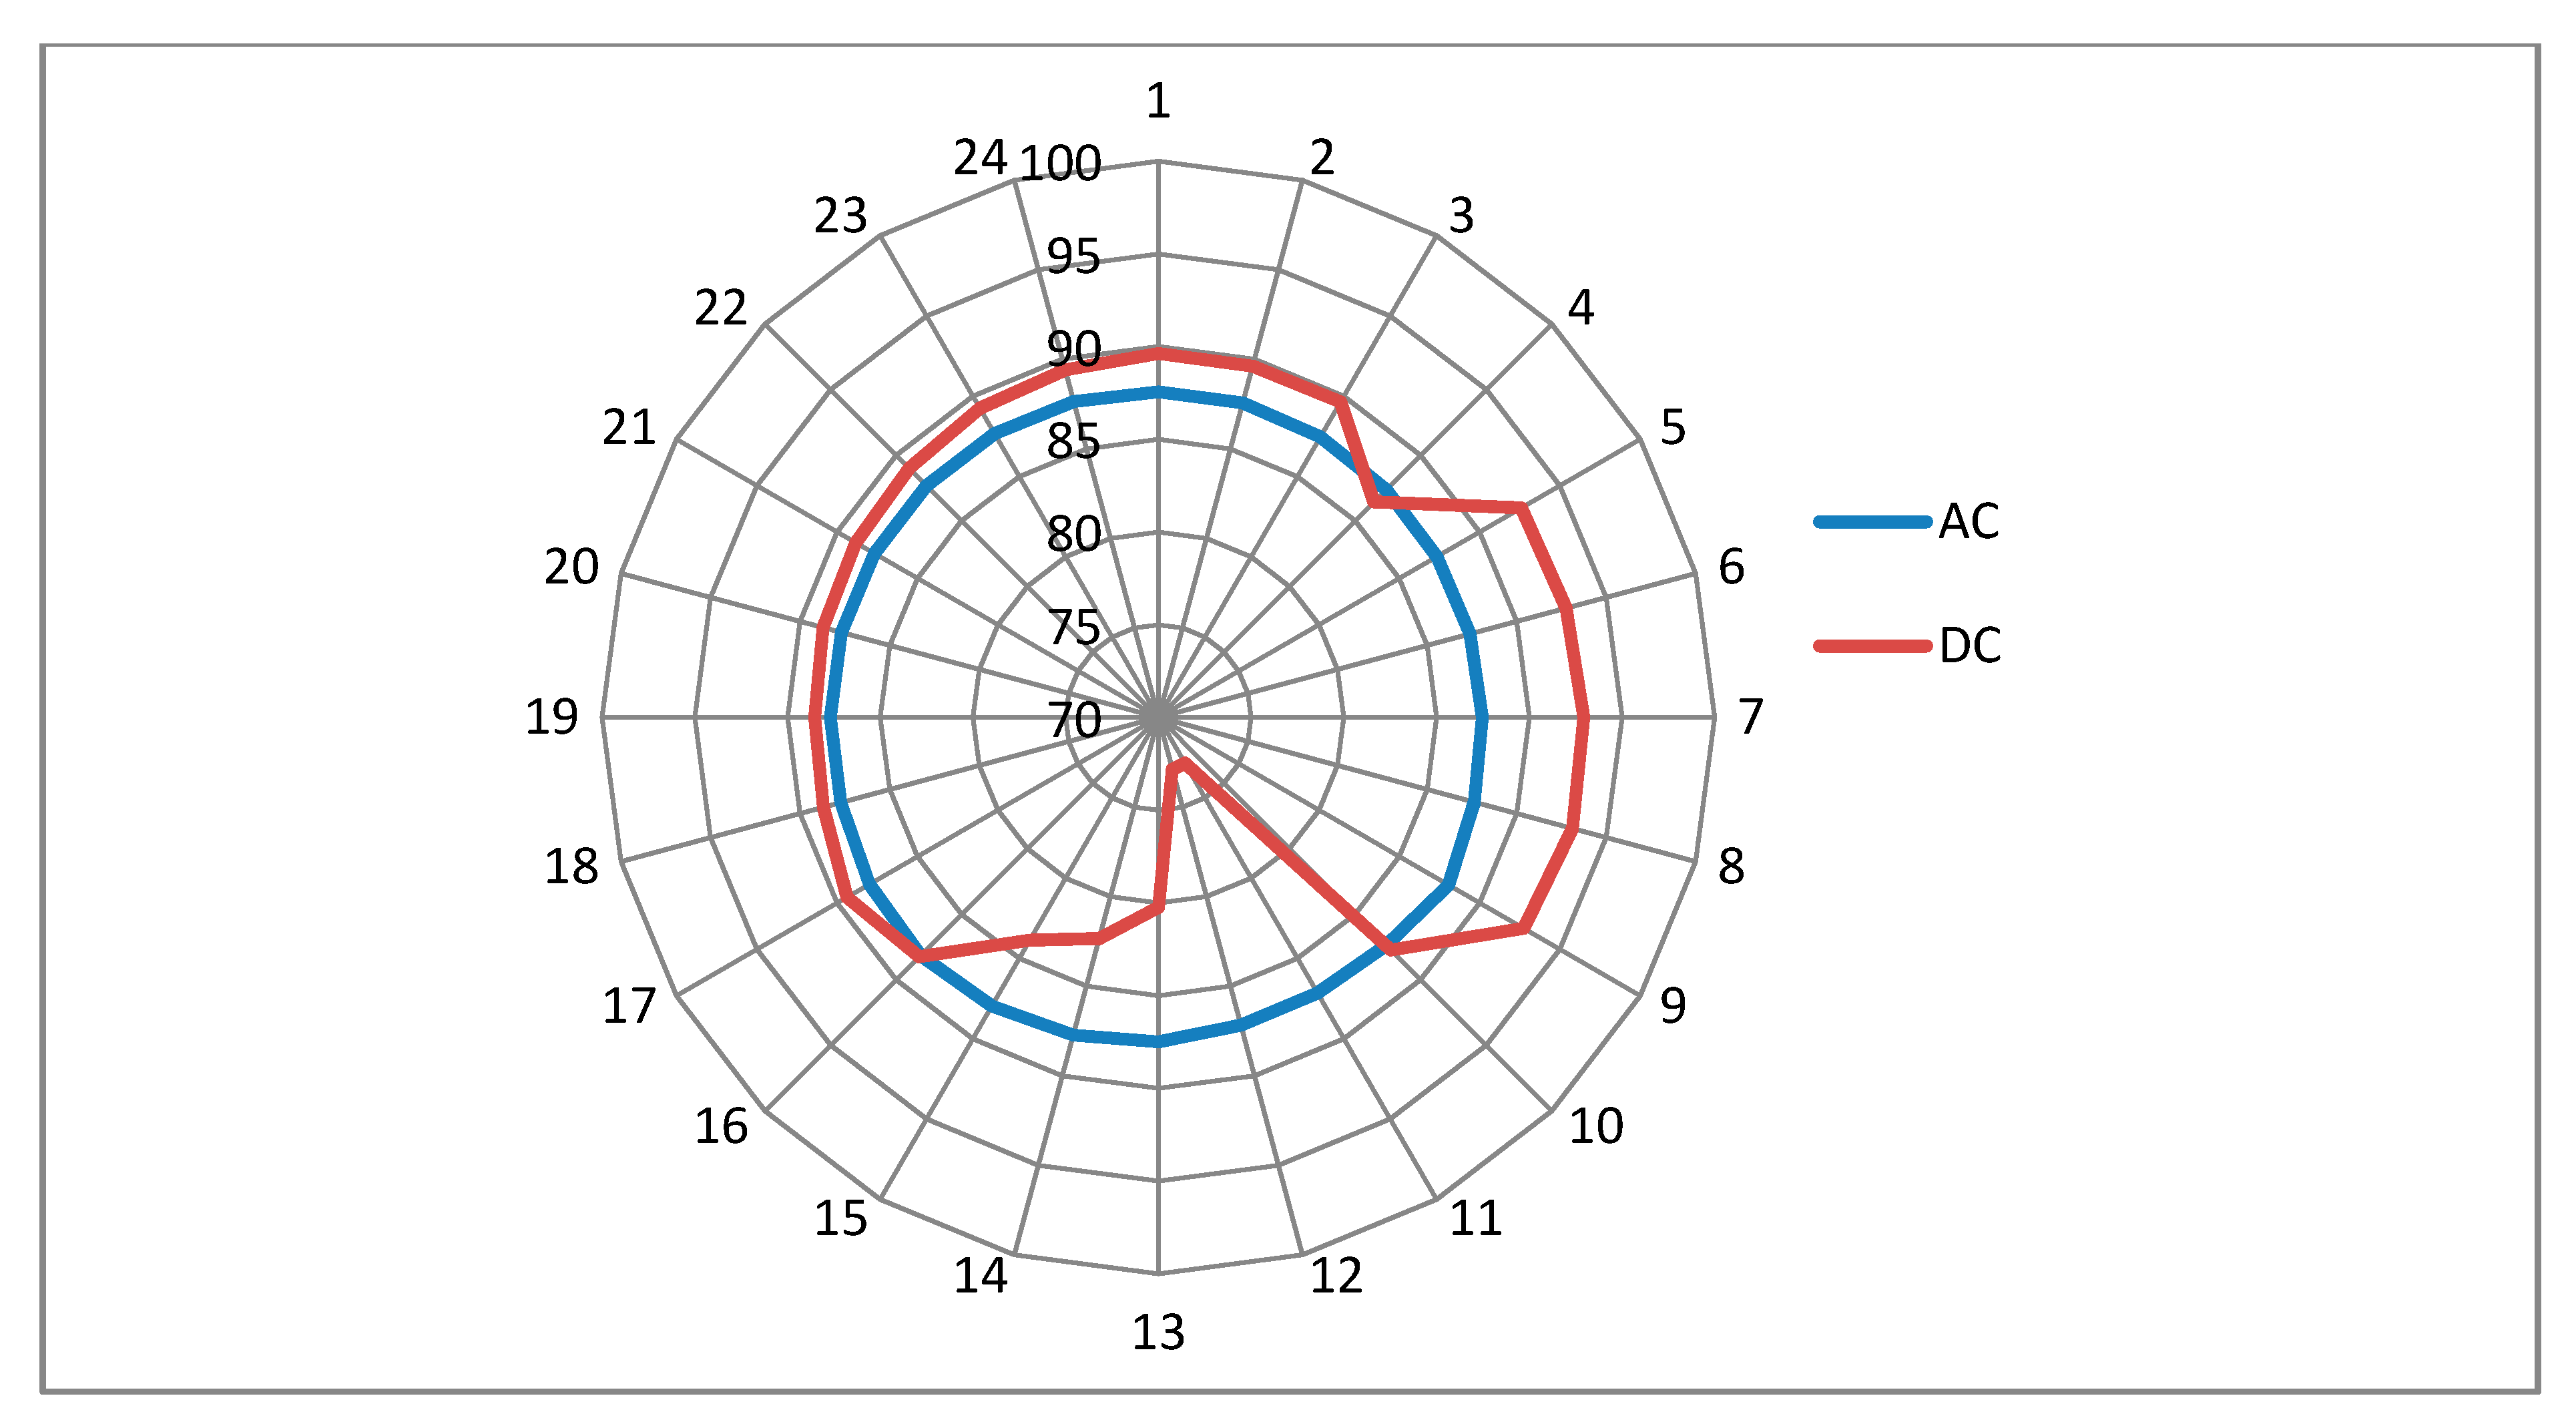
The mathematical model and data from
Table 2 are combined for converter efficiencies against loading using the above expressions resulting in the efficiency comparison of AC and DC distribution systems presented in
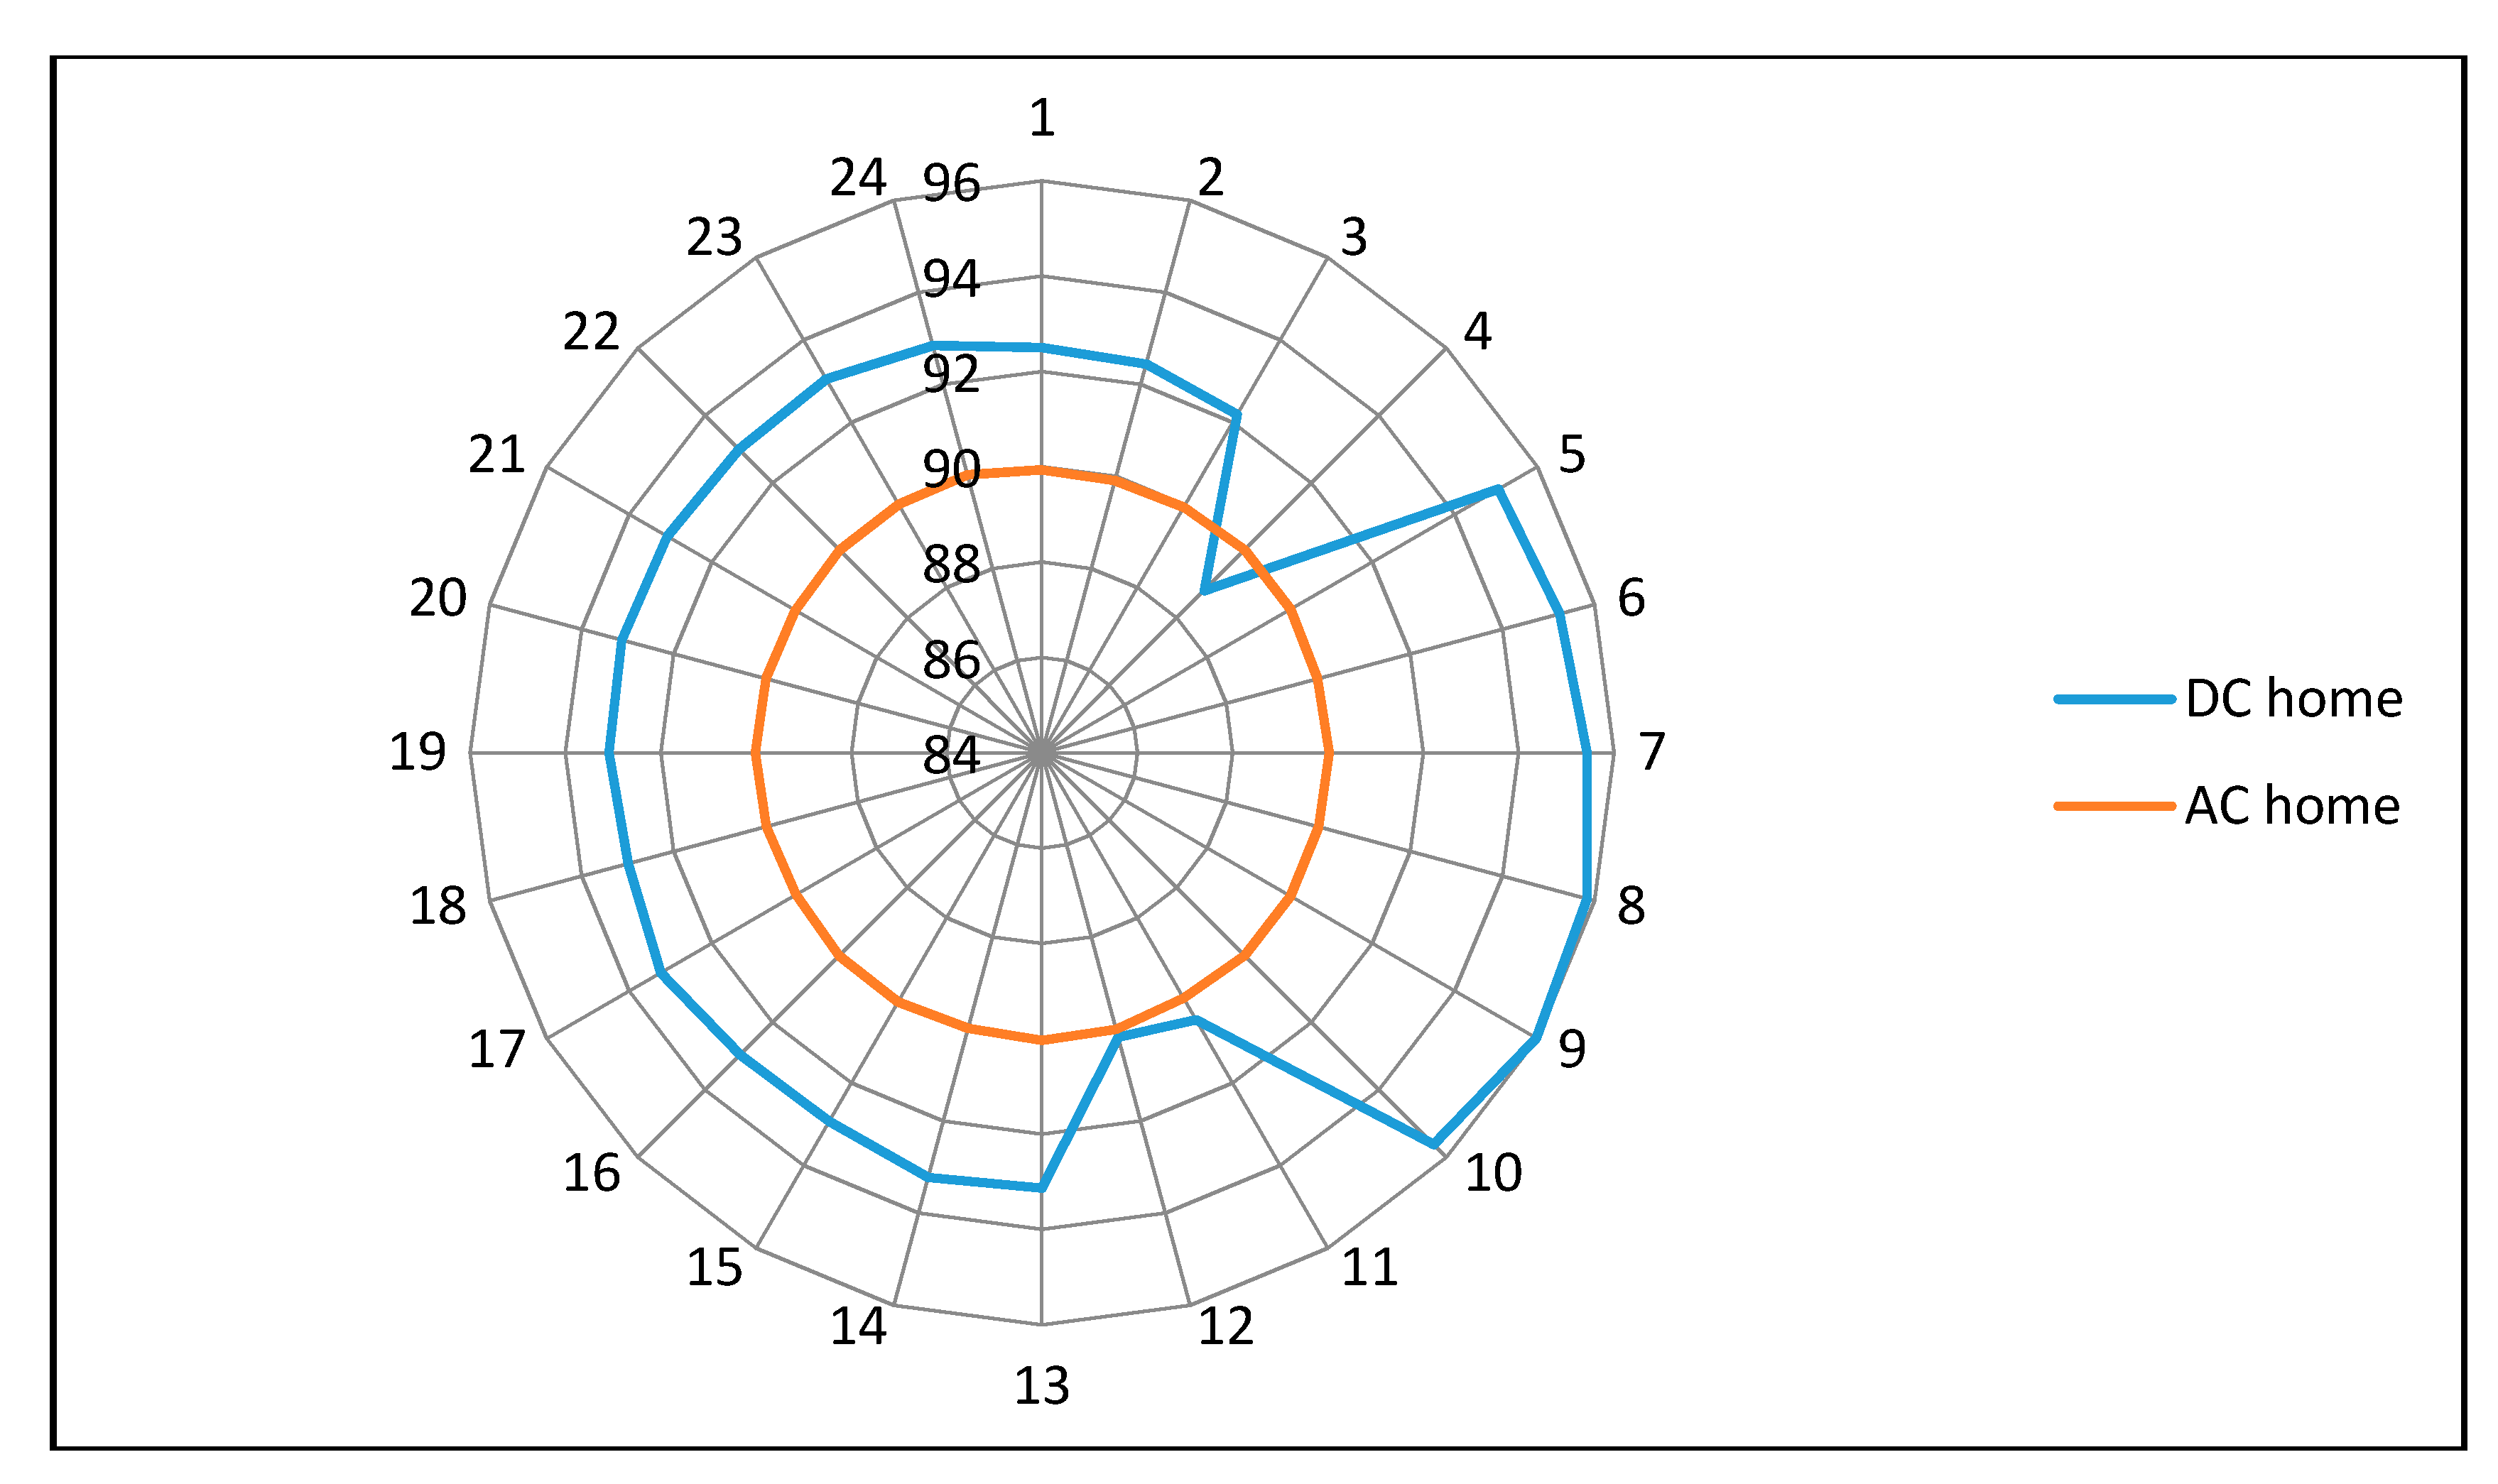
Figure 4. The comparison of AC and DC home is also presented in
Figure A2.
6. Discussion
• Drop in DC system efficiency at 4th hour:
The reason is that ‘A’ category loads operate at lower loading that causes connected inverters’ efficiency to reduce. The effect can also be seen in the building’s efficiency graph. The building’s efficiency drops in this period and the effect is shifted to the system’s efficiency as well.
• The DC curve remains almost constant from the 5th to 10th hour with fair DC efficiency values:
The ‘D’ and ‘A’ category loads operate at an almost constant level in a combined fashion. While DC-DC converters operate at lower efficiency, DC-AC converters operated at higher efficiency and vice versa, keeping overall efficiency constant.
• Drop in the DC efficiency during the 11th and 12th hour:
Again, due to the reduced loading of inverters, ‘A‘ category loads operate at lower efficiency of converters and the effect is pronounced at the DC-DC converter transformer level and in turn the grid level, lowering the overall efficiency of the system
• DC efficiency improved at the 13th hour and onwards:
The reason is the same as that for the 4th to 9th hour. The loads operate in coordination, and the loads consuming more power with converters operating at higher efficiency balance the loads consuming less power with converters operating at lower efficiency.
• Average efficiency
Apparently, DC shows dominance in the comparative graph for the most part of the day. The average efficiencies of both the systems are separated by an amount of almost 2% with the DC system operating at 89.9% and AC system at 87.6% in
Figure 4.
6.1. Effect of Residential Solar PVs on Systems Efficiencies
There is a worldwide focus on the installation of clean, green and environmentally friendly renewable energy resources. In line with the argument, we employed solar PV panels on rooftops of homes and studied the power efficiency comparison of the two paradigms, i.e., AC and DC distribution systems. The topological designs of the two remained the same in this part of the analysis with a slight modification of supplying ‘D’ and ‘I’ category loads with solar PV panels.
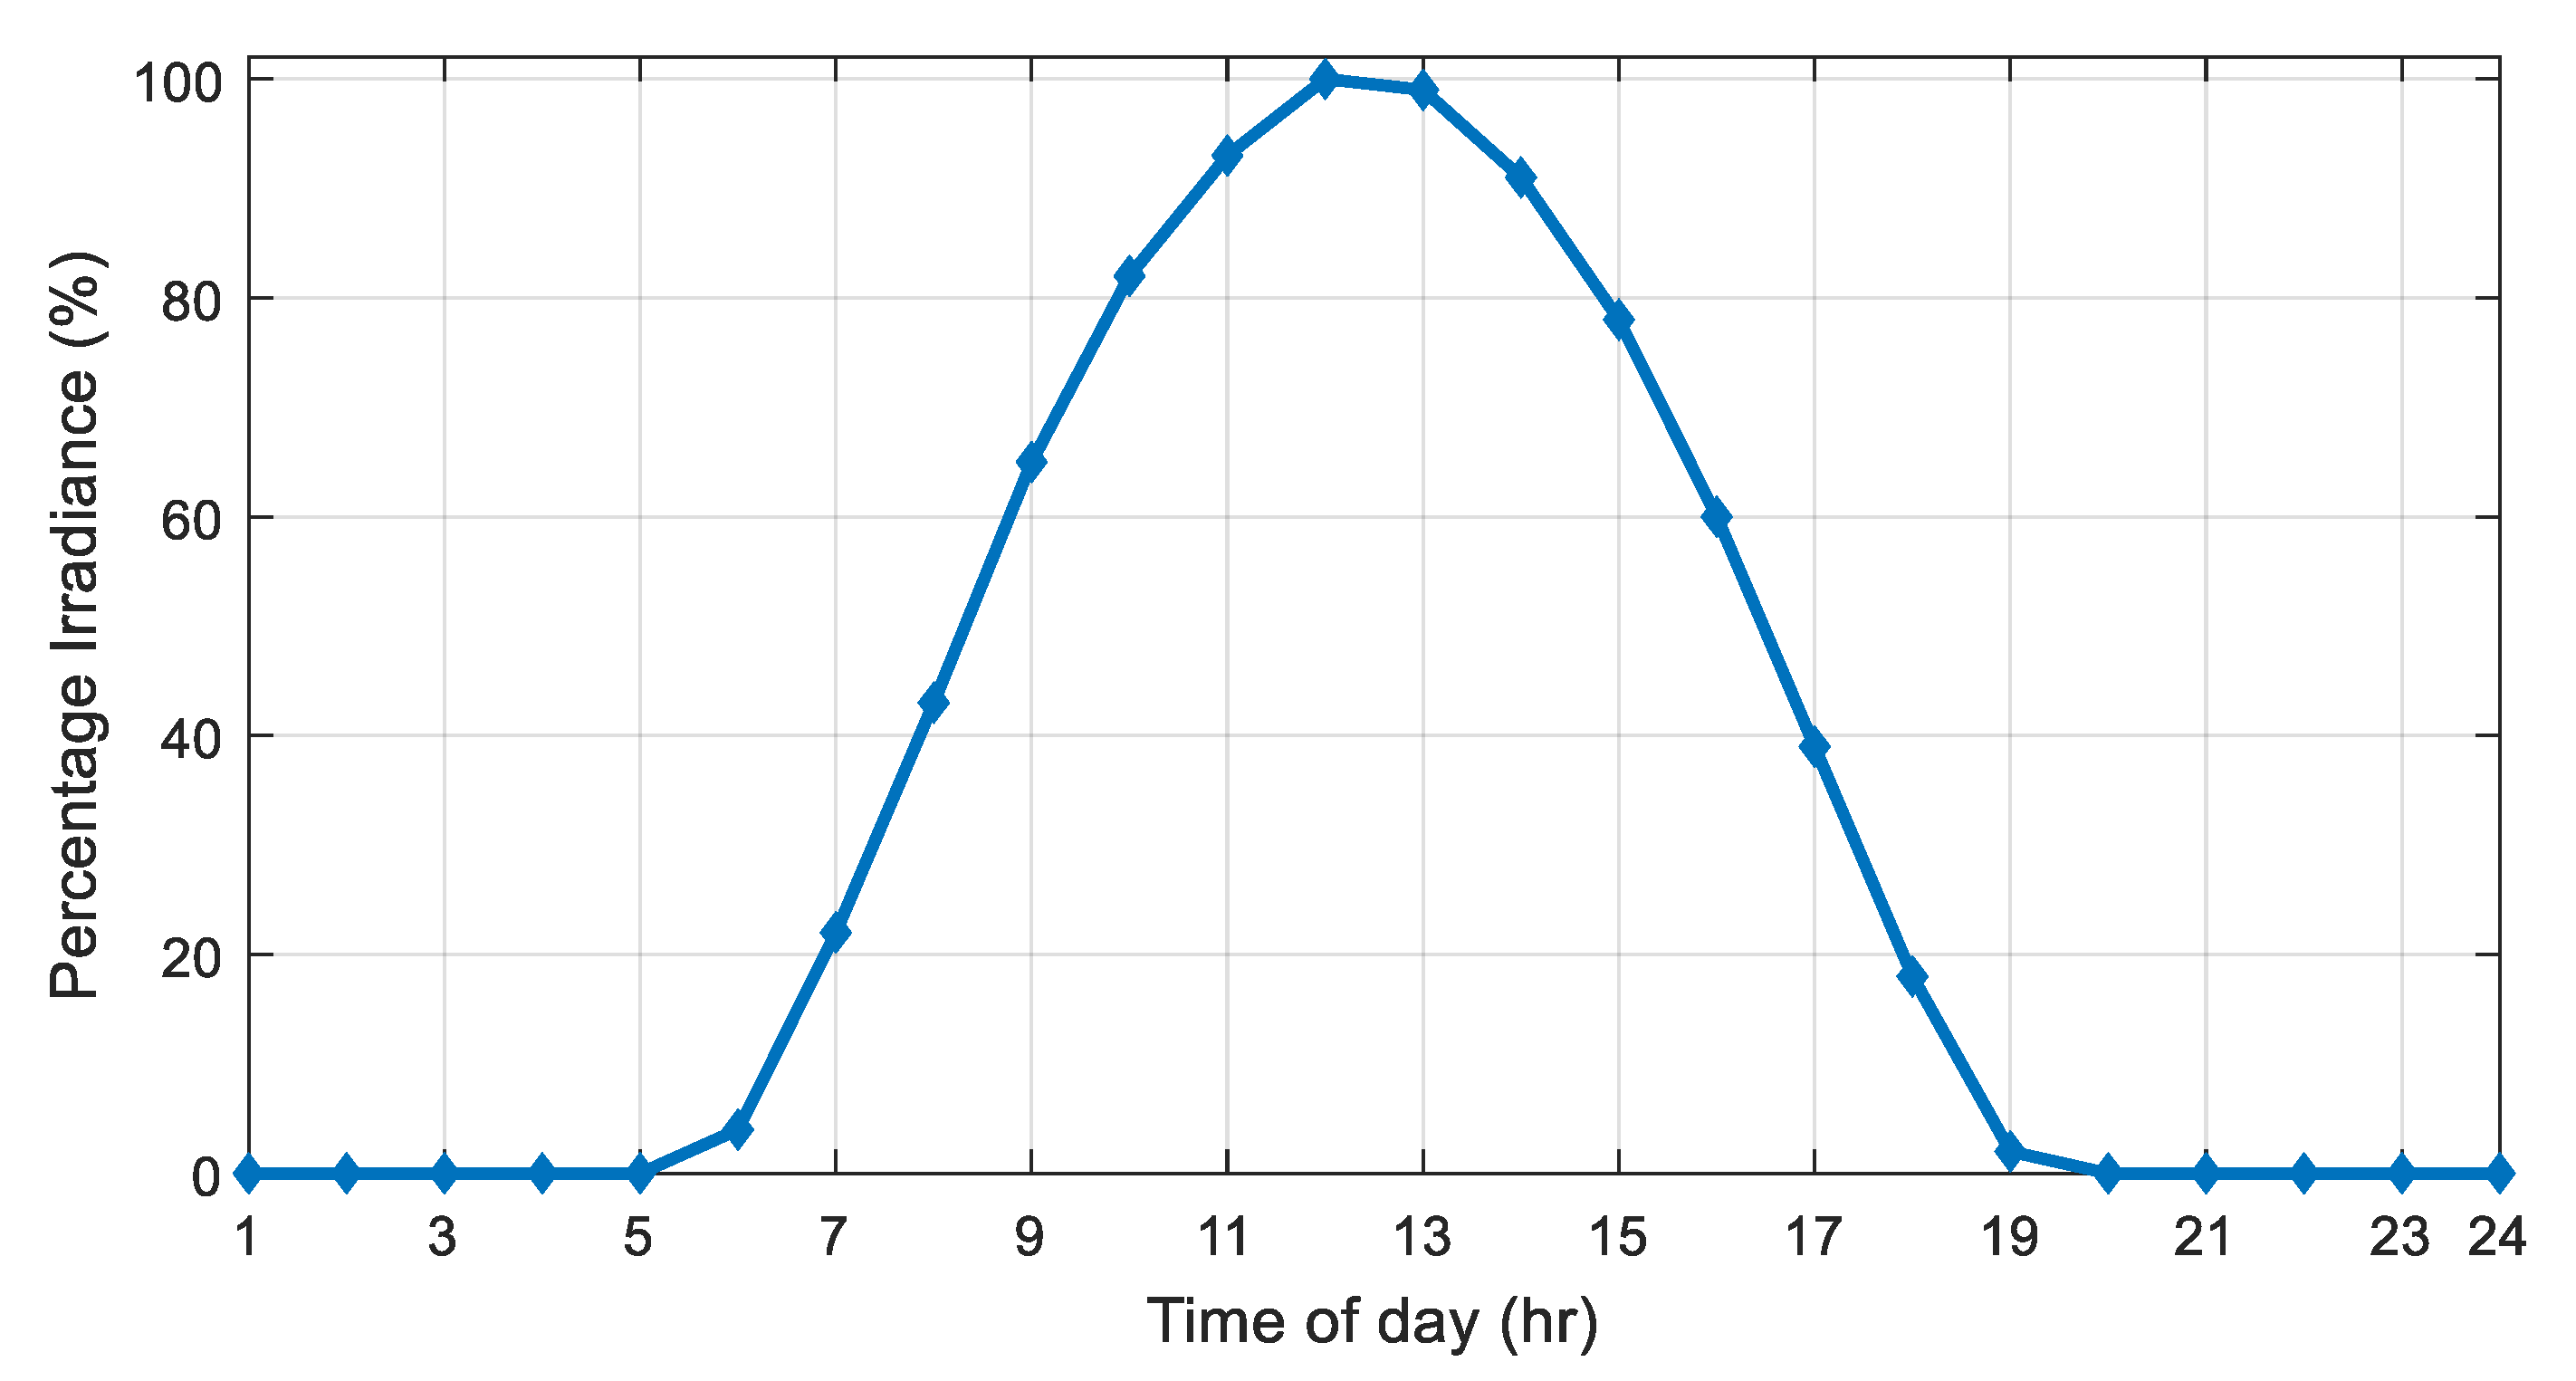
The idea is to supply ‘D’ and ‘I’ category loads with a 1-kW solar system on the rooftop, accompanied with the maximum power point tracking (MPPT) converter and a battery bank, and study the comparative analysis of both AC and DC distribution systems. The priority scheme is as follows. When solar energy is available, loads are driven via solar and extra power is used to charge the battery bank. During the periods when solar energy is insufficient to drive loads, the rest of the power shall be taken from the battery storage. When both solar and battery power are insufficient, power is taken from the utility to drive the loads. In order to fit solar in the mathematical model, the solar irradiance data curve [
38] was utilized, as shown in
Figure A3. The expression for solar power against hours of the day was fitted in the mathematical model for analysis of solar inclusion on the system’s efficiencies. The solar power can be given as
where
‘P (t)’ is the solar power at time ‘
t’ of the day. The system’s efficiencies were plotted against time as shown in
Figure 5.
6.2. Important Points from Efficiency Plot
• Average efficiency
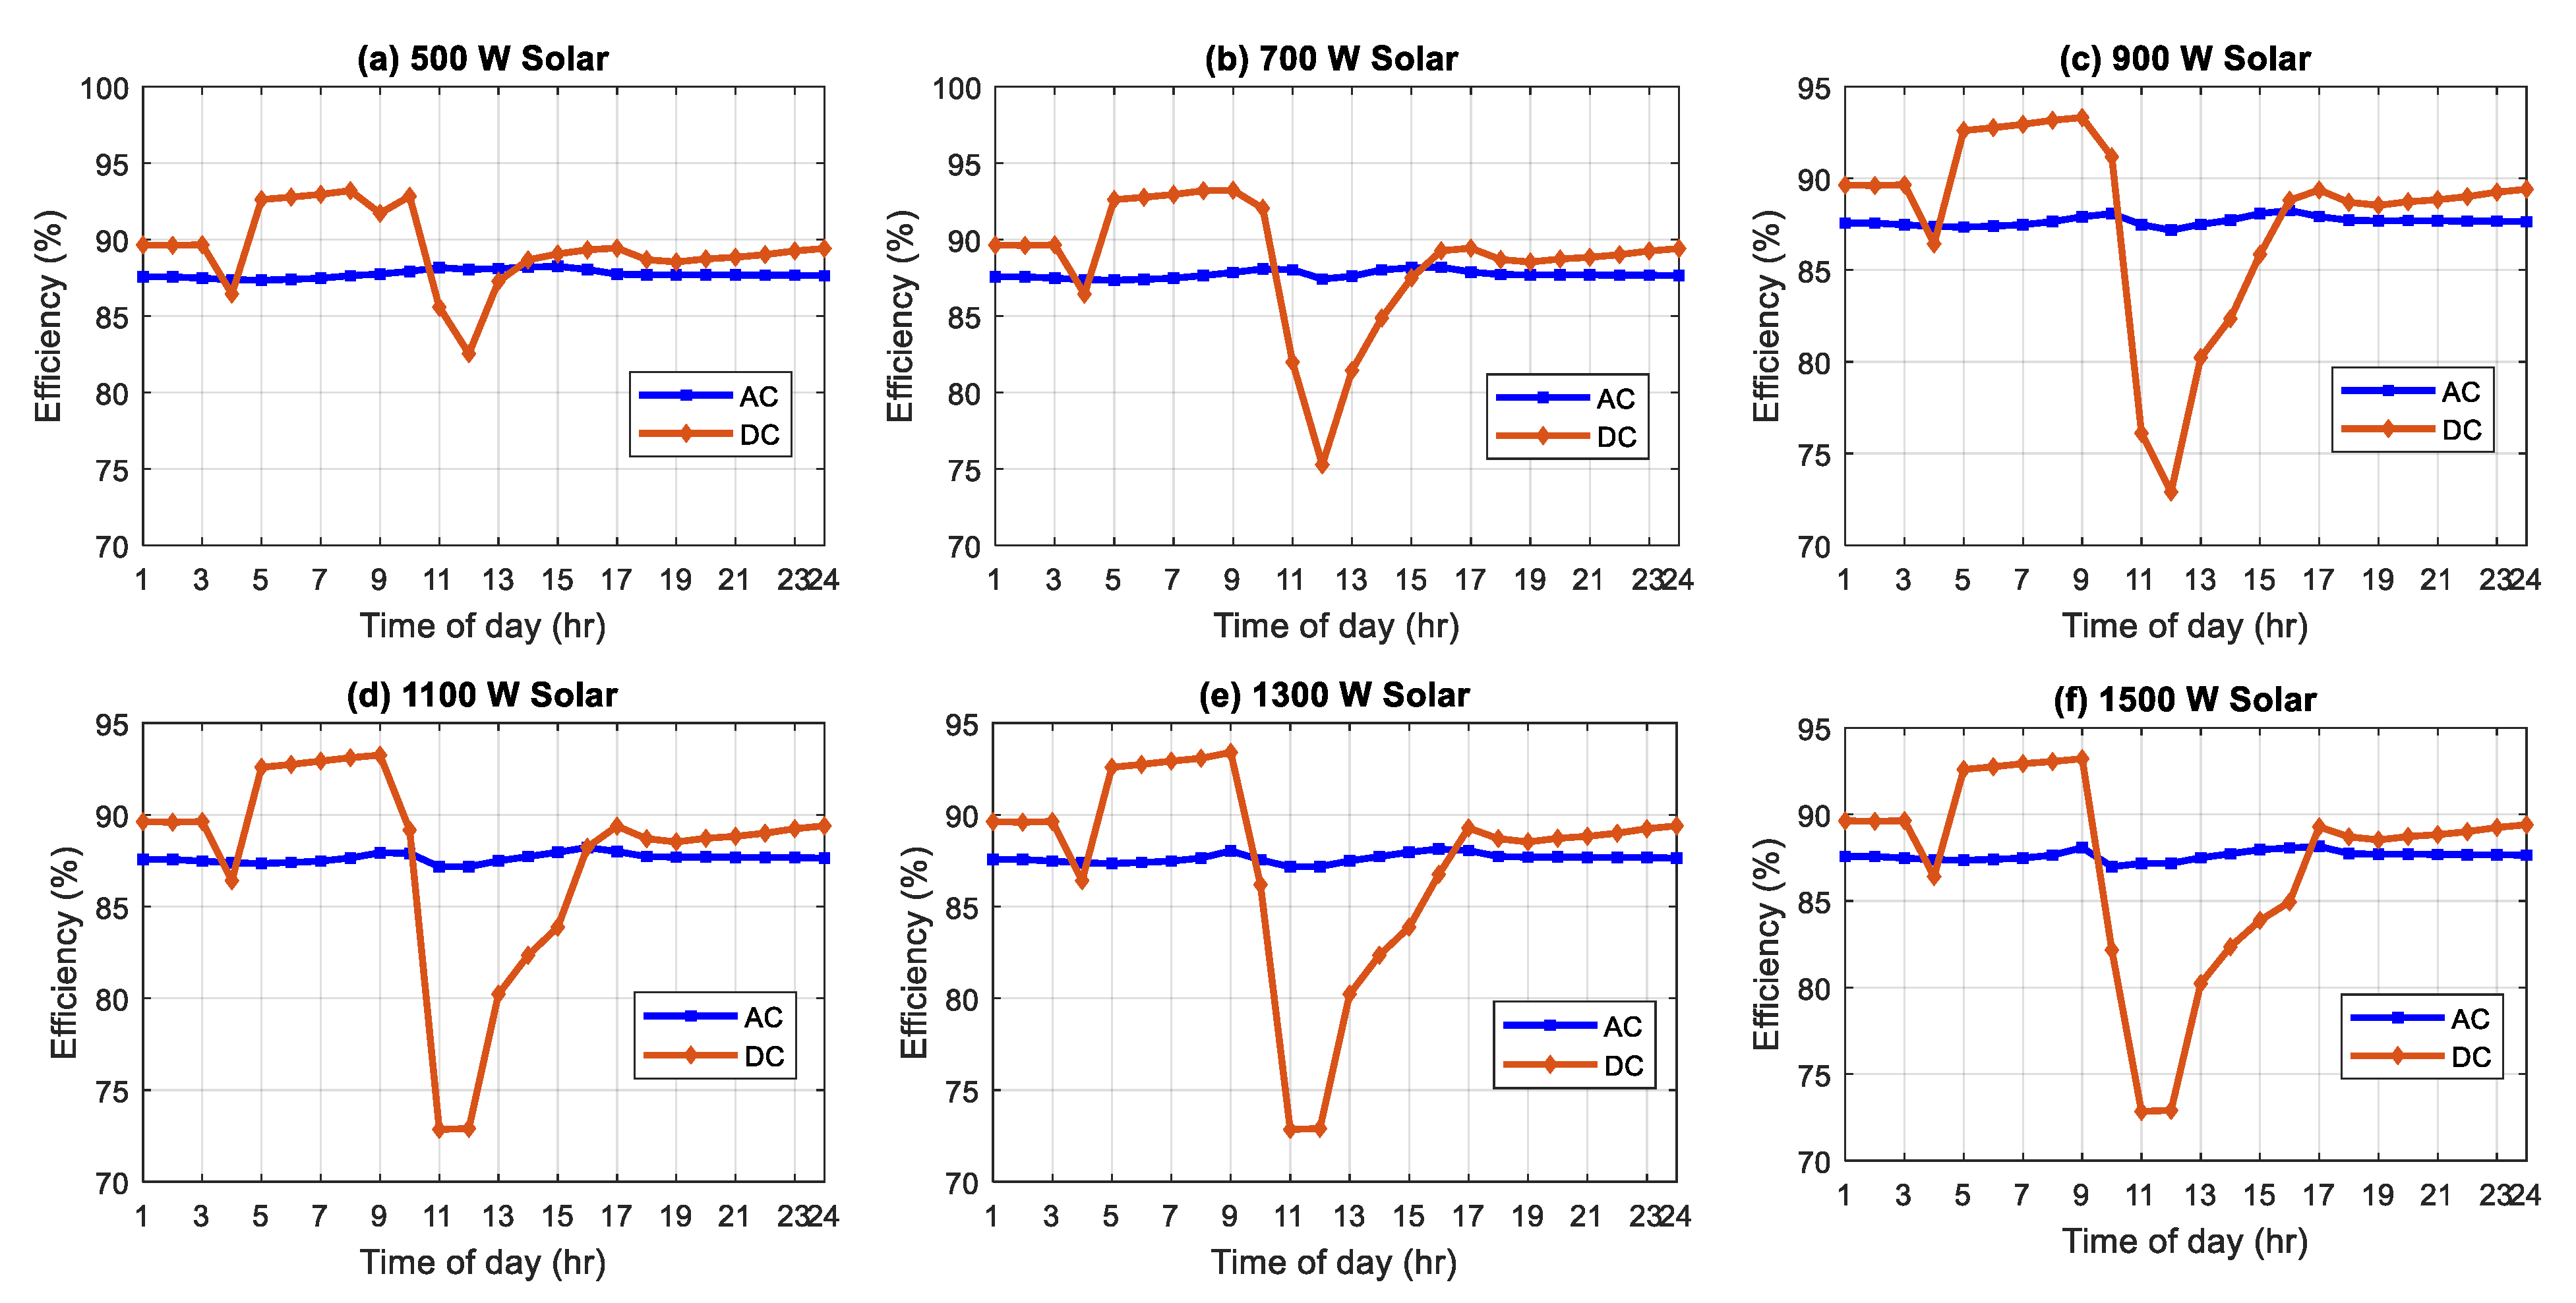
The average efficiency of the DC system with solar addition came out to be 87.5% compared to that of the AC system at 87.6%. However, the DC system efficiency varies between 72.9% and 93.1%, whereas the AC system efficiency is almost constant around 87%. However, average efficiencies of both the systems are comparable. Although it is believed that solar PV, being a DC generating module, supports DC distribution system, the picture changes as compared to what is expected when the effect of conversion efficiencies of involved power electronic converters is included.
• Fall of the DC efficiency at 11th and 12th hour
‘D’ and ‘I’ category loads are supplied from solar panels, and the solar irradiance is at its peak. The DC grid has to supply A category loads only, which are already operating at the reduced loading. The inverters’ efficiencies, which are quite low, define the system’s efficiency during this interval.
In order to check the variation in system’s efficiency with solar capacity, we simulated our system for different solar capacities installed in the home. The results are presented in
Figure 6. The AC system’s efficiency is almost unaltered, and the DC system shows variations in lower efficiency values. However, the higher values are almost constant. The fall in efficiency lies in that with increasing solar power, more ‘D’ type loads are driven by solar, which leaves a lower load on the DC-DC converters, driving their operating efficiencies to lower values.
7. Overall Assessment
The AC system efficiency is almost constant throughout the day; however, with solar PV panels installed, there are periods when D and I category loads are completely supplied by solar or battery and solar/battery combined. Within these periods, the grid has to supply only “A” category loads, which inside the building, require no converter stage, and in-building “conversion” efficiency is almost 100%. The dominant element that defines the system’s efficiency is the transformer efficiency; other parameters that fractionally affect the system’s efficiency are conductor losses and power factor. There is a tiny fall of the efficiency for the AC system during the 6th hour, which is due to the reduced loading within the building. The combined effect of 21 buildings per transformer poses a fall in transformer operating efficiency because the transformer is operating at a reduced efficiency to some extent.
Interpretation of results reveals that the AC system efficiency remains almost constant throughout the day, although the DC system efficiency changes with time. Due to the addition of a solar PV system, one may expect a rise in the DC efficiency, but that is not true! There are even instances when the system’s efficiency is poor (as discussed for the 11th and 12th hour). The converters’ loading is the most critical factor in defining the system’s efficiency. While the converters are loaded close to their rating in those cases, the operating efficiency and in turn the system’s efficiency are better than the case when converters are lightly loaded.
8. Conclusions
This research effort presented a comparative effectiveness study of AC and DC distribution systems. DC, which was considered to have become obsolete, is striking back in power systems. The battle of currents has reignited and DC has appeared in generation, transmission, distribution, and utilization. DC power at the distribution level is under research, and particularly the residential distribution system has become a topic of interest where AC and DC distribution systems’ efficiencies are noticed to be comparable. However, this does not support DC to take AC’s place at the distribution level. In order to do so, DC has to defeat AC considering all factors that affect their efficiencies. One of those factors is the daily load variation. Load variation holds a concrete footing in defining AC and DC systems’ efficiency at the distribution level, as presented in this paper. With varying power consumption, the efficiencies of installed power electronic converters change, and hence, we obtain variable efficiency values of the systems. The results presented comparable overall efficiencies for AC and DC systems in this paper. However, during 24 h, there were intervals when DC was efficient as compared to AC due to better converter efficiencies because of high converter loading. In contrast, there were periods during the day when DC showed less efficiency as compared to AC due to low converter efficiency because of reduced power consumption. The AC system efficiency remained almost constant throughout the day, whereas the DC system efficiency kept dwindling up and down. In addition, the trend of energy generation is shifting to renewable energy resources, and thus we introduced residential solar PV installations because of their rising importance. Since this research focuses on time-based analysis, we performed an analysis of time-varying solar insolation amalgamated with load variations in this paper. In addition to the solar power variations, the power capacities of solar PV panels installed in residences were also varied for analysis. Again, the results demonstrated almost the same average efficiencies for the DC and AC systems and the strong dependence of AC and DC systems’ efficiency on converter efficiencies, which in turn depend on load consumption that varies with time. Hence, time is one strong factor that defines the efficiencies of both systems. Although AC and DC system efficiencies are equivalent when averaged over 24 h, for DC, to completely wipe AC out of the distribution sector, DC should overcome AC throughout the day.

 ,
, 


