Classification of Pulmonary CT Images by Using Hybrid 3D-Deep Convolutional Neural Network Architecture


Department of Computer Engineering, Faculty of Technology, Gazi University, 06500 Ankara, Turkey
*
Author to whom correspondence should be addressed.
Appl. Sci. 2019, 9(5), 940; https://0-doi-org.brum.beds.ac.uk/10.3390/app9050940
Submission received: 14 February 2019
/
Revised: 28 February 2019
/
Accepted: 1 March 2019
/
Published: 6 March 2019
(This article belongs to the Special Issue Data Analytics in Smart Healthcare)
Abstract
:Lung cancer is the most common cause of cancer-related deaths worldwide. Hence, the survival rate of patients can be increased by early diagnosis. Recently, machine learning methods on Computed Tomography (CT) images have been used in the diagnosis of lung cancer to accelerate the diagnosis process and assist physicians. However, in conventional machine learning techniques, using handcrafted feature extraction methods on CT images are complicated processes. Hence, deep learning as an effective area of machine learning methods by using automatic feature extraction methods could minimize the process of feature extraction. In this study, two Convolutional Neural Network (CNN)-based models were proposed as deep learning methods to diagnose lung cancer on lung CT images. To investigate the performance of the two proposed models (Straight 3D-CNN with conventional softmax and hybrid 3D-CNN with Radial Basis Function (RBF)-based SVM), the altered models of two-well known CNN architectures (3D-AlexNet and 3D-GoogleNet) were considered. Experimental results showed that the performance of the two proposed models surpassed 3D-AlexNet and 3D-GoogleNet. Furthermore, the proposed hybrid 3D-CNN with SVM achieved more satisfying results (91.81%, 88.53% and 91.91% for accuracy rate, sensitivity and precision respectively) compared to straight 3D-CNN with softmax in the diagnosis of lung cancer.
1. Introduction
Cancer is an emotive subject of our age, millions of people worldwide are struggling with it and there is still no final cure. However, taking it under control by early detection can be a way to at least increase the survival rate. After prostate and breast cancer, lung cancer is the second most observed cancer type in both men and women. With a death toll of over 70%, the American Cancer Society put lung cancer among the most aggressive cancers in 2016 [1]. Consequently, the probability of survival will be increased to 49% if the cancer is detected in the early stage when it is limited to the lung and has not spread out to the lymph [2,3].
The main purpose is to provide tools for early diagnose and increase care services. Using Computer Aided Diagnosis (CAD) in the medical workflow, which helps physicians to make precise decisions, as well as rising up the accuracy of the diagnosis. Machine learning methods create a model of training for medical images and they are able to handle all objects of data in the computer assistance structure. Generally, in traditional CAD diagnosis systems, to classify tumors, different and complicated image processing techniques and segmentation methods are applied to images. Therefore, the extraction of low-level features from images is a complicated process [4]. However, there are noteworthy studies that have used conventional machine learning methods in CAD in order to diagnose lung cancer. Since deep learning methods are independent of complicated handcraft feature extraction methods and additionally are able to extract low-level to high-level features from a large amount of datasets, in recent years, they have become more successful compared to conventional machine learning methods in CAD. Therefore, deep learning methods in CAD systems help physicians in the diagnosis of cancer by improving the accuracy of diagnosis and cost efficiency in a short time [5].
However, there is no deep learning model that is sufficient in terms of classification or detection of all kinds of real-life problems. Therefore, in recent papers, hybrid architectures of deep learning models using Support Vector Machine (SVM) as a well-known classification algorithm were proposed and achieved significant results in various classification problems [6,7].
In this study, by considering the advantage of deep learning methods as one of the state-of-the-art machine learning methods in terms of automatic feature extraction and the promising results of hybrid architectures in diagnosing lung cancer in early stages, different architectures of Convolutional Neural Network (CNN), as one of the significant models of deep learning methods, were investigated. In this regard, in order to classify Data Science Bowl and Kaggle lung Computed Tomography (CT) scan images, two 3D-CNN architectures were proposed. Straight 3D-CNN was the proposed CNN architecture which used softmax as its conventional classifier and additionally hybrid 3D-CNN was the second proposed CNN architecture which utilized Radial Basis Function (RBF)-based SVM as its classifier instead of softmax. It is noticeable that this method is the first applied method in terms of the classification of lung cancer. Moreover, the altered 3D architectures of AlexNet and GoogleNet, the two well-known architectures of Convolutional Neural Network (CNN), were used for the classification of lung CT scan images as well. The performance of both proposed 3D-CNN, 3D-AlexNet and 3D-GgoogleNet architectures have been evaluated in lung cancer diagnosis.
The rest of the paper is organized as follows: An overview of the other studies which have used Deep learning methods on different lung datasets are presented in Section 2; a brief description of Convolutional Neural Network and its related concepts and also RBF-based SVM classifier are presented in Section 3 as well. Section 4 presents the description of the used dataset and all proposed 3D-CNN architectures in order to diagnose lung cancer. Eventually, experimental results, a discussion and the conclusion are presented in Section 5 and Section 6 as well.
2. Related Works
Since large image datasets of lung cancers are rare and deep learning methods are novel in the diagnosis of diseases, there are few researches in the diagnosis of lung cancer [8].
Ginneken et al. compared overfeat CNN and Food and Drug Administration as a commercial method of CAD for the detection of lung cancer nodules. CT scan images of Lung Image Database Consortium (LIDC) were used for the detection of nodules. Features of lung nodules were extracted by overfeat CNN, and an SVM algorithm was used for classification of the nodules. Furthermore, the nodules were detected by commercial CAD systems. Results showed that each method could detect nodules by over 70% sensitivity [9].
Anthimopoulos et al. proposed CNN to classify and characterize different lung tissues of lung diseases. CT scan images of University Hospital of Geneva and Bern University Hospital were used as Interstitial Lung Disease (ILD) datasets. Their proposed CNN contained five convolutional layers, one pooling layer, and three fully connected layers. The proposed algorithm was compared to other CNN architecture e.g., LeNet, AlexNet and VGG Net. Results showed that the proposed CNN for classification and detection of tissues was superior compared to the other algorithms. The proposed CNN achieved a 85.61% accuracy rate [10].
Gruetzemacher and Gupta used DNN for classification of lung cancer nodules. CT scan images of LIDC and Image Database Resource Initiative (IDRI) were used as a dataset. Four different topologies with different numbers of convolutional layers were compared. Results demonstrated that the accuracy rate of all used methods by different convolutional layers was close to each other, and the network by five convolutional layers achieved the highest accuracy rate (82.10%) [11].
Sun et al. compared three algorithms of deep learning and a traditional CAD system to diagnose lung cancer nodules on CT scan images. They used LIDC and IDRI datasets for the diagnosis of lung cancer. Deep Belief Network (DBN), CNN and Stacked Denoising Auto Encoder (SDAE) were used as three algorithms of deep learning. The results of the accuracy rates demonstrated that CNN and DBN were superior compared to the SDAE and traditional CAD methods Furthermore, DBN achieved the highest accuracy rate of nodules classification (81.19%) [8].
Ciompi et al. applied Multi-scale CNN with multi-stream architecture as a deep learning method for the classification of lung cancer nodules on CT scan images. In order to characterize lung cancer nodules, Multicentric Italian Lung Detection (MID) and Danish Lung Cancer Screening (DLCS) datasets were used. Automatic nodules classification in six types was done without using any segmentation methods. All scales of CNN were combined in a fully connected layer of CNN. Results of proposed multi-scale CNN were compared with radiologists’ diagnosis and the average accuracy rate of CNN (69.6%) is close to the average accuracy rate of radiologists (72.9%). Moreover, the accuracy of CNN with three scales was compared with SVM-based pixel intensity of patches and SVM-based unsupervised learning of features. Results show that CNN with three scales achieved a higher accuracy rate (79.5%) than the other two SVM-based methods [12].
Li et al. proposed a CNN algorithm with a single convolutional layer for the classification of patches on high-resolution computed tomography images. ILD lung dataset was used for this purpose. Furthermore, a combination of SVM classifier with three feature extraction methods (i.e., Scale Invariant Feature Transform (SIFT), Local Binary Pattern and Restricted Boltzmann Machine (RBM)) was used to extract features and classify images. Their proposed CNN was compared with the combination of a three feature extraction method and SVM classifier. Results showed that their proposed CNN achieved higher Sensitivity or Recall (about 0.88) and Precision values (about 0.93) than the other methods [13].
Shen et al. proposed a multiscale CNN for classification of malignant and benign lung nodules. CT scan images of LIDC and IDRI datasets were used. SVM and Random Forest were used as classification algorithms of CNN. Their proposed CNN algorithm with Random Forest classifier achieved 86.84% accuracy rate in the classification of lung nodules without using any segmentation methods [14].
Rao et al. proposed CanNet as a CNN model to classify lung CT scan images of the LIDC dataset. Their proposed CanNet contained two convolutional layers, one max pooling and one fully connected layer. In comparison with traditional Artificial Neural Networks (ANN) and LeNet, their proposed CanNet model achieved the highest accuracy rate in the classification of lung CT scan images. The accuracy rate of each LeNet, ANN and CanNet was 56%, 72.5% and 76% respectively [15].
Song et al. compared the performance of Deep Neural Network (DNN), CNN and Stacked Auto Encoder (SAE) algorithms in the classification of CT scan images of LIDC-IDRI datasets. The results showed that the CNN algorithm surpassed the other two algorithms in the classification of lung CT scan images. CNN, DNN and SAE achieved 84.15%, 82.37% and 82.59% accuracy rate. CNN and SAE achieved the same sensitivity (83.96%) and DNN achieved 80.66% sensitivity [16].
Bondfale and Banait used CNN for the classification of an ILD dataset of lung CT scan images. They reported results of CNN for classification of healthy, ground-glass opacity, micro-nodules, reticulation, honeycombing and consolidation classes of ILDs being favorable [17].
Alakwaa et al. proposed the CNN architecture to classify lung CT scan images of Data Science Bowl and Kaggle [18]. For nodule detection, they used U-Net as a detection architecture on a Lung Nodule Analysis (LUNA) dataset as an assistant dataset. Results showed that CNN classification architecture achieved 86.6% accuracy rate. The False Positive (FP) rate and False Negative (FN) rate of CNN were 11.9% and 14.7% respectively [19].
Kuan et al. used the modified version of ResNet-18 as classification architecture to classify the Data Science Bowl and Kaggle lung CT scan images [18]. Moreover, Luna dataset was used for nodule detection. Results showed that their modified ResNet-18 achieved better results than the original ResNet-18 in terms of sensitivity, specificity and F1. Their achieved sensitivity, specificity, F1, and log loss values were 0.538, 0.648, 0.33, and 0.52712 respectively [20].
Liao et al. used modified 3D U-Net with Region Proposal Networks (RPN) for nodule detection of Data Science Bowl and Kaggle lung CT scan images. Moreover, to evaluate the probability of detected nodule Leaky Noisy-OR method have been integrated into their used classification method. Their used method achieved 0.3998 of log-loss [21].
Serj et al. proposed a CNN architecture in order to classify the Data Science Bowl and Kaggle lung CT scan images. Results showed that their proposed classification architecture was 0.87, 0.991, 0.95, and 0.20 for sensitivity, specificity, F1, and log-loss, respectively [22].
3. Material and Method
3.1. Convolutional Neural Network
In conventional machine learning methods, to acquire features from the dataset, manual feature extraction methods are applied on the dataset and extracted low-level features are fed to a particular machine learning algorithm, whereas deep learning methods are able to extract features from a raw dataset automatically. Detection or classification will be applied to the dataset by extracted low, middle and high-level features [24]. Hence, the main characteristic of deep learning methods is applying nonlinear functions on raw data as inputs to produce abstracted outputs [24]. Nowadays, it is easy to access large datasets and computers by powerful processing systems which are the main requirements of deep learning methods. As a result, in the last decades, deep learning methods have taken advantage of powerful GPUs to minimize training time and improve the accuracy of classifications [25].
CNN, DBN, Recurrent Neural Networks (RNN), Long Short Term Memory (LSTM), and Deep Stacking Networks (DSN) are deep learning architectures which are used in computer vision, automatic audio classification and natural language processing fields to solve problems of large datasets.
Like ANN, CNN is inspired by the system of interconnected biological neurons. Both algorithms include neurons which contain weights and biases [26,27]. Although the structures of both CNN and ANN include layers, there are big differences between the structures of both networks. The structure of layers in an ordinary ANN algorithm is one-dimensional and connections of all layers are fully connected. CNN, however, has three-dimensional neurons in a layer which include width, height, and depth. Furthermore, in CNN, each neuron of one layer is connected to only one region of the previous layer without any full connection between middle layers. In CNN, kernels (filter banks) are used as a unit to connect to the part of the previous layer, and it is called weight connection. In CNN layers, by using local connections, local features are detected, and by pooling operations, identical features are merged to be one feature. The architecture of CNN contains three main layers as convolutional layers, pooling layers and fully connected layers; [28] LeNet, AlexNet, GoogleNet, VGG-Net, Res-Net, ZF-Net, and SqueezNet are the most used architectures of CNN in classification and pattern recognition fields [29,30].
Backpropagation algorithm [31] is one of the best learning algorithms of CNN, due to its ease of use in computation and function. During training, backpropagation differentiates between the prediction of labels which are achieved by the algorithm and ground truth labels which are calculated by a loss function. Consequently, in classification and probabilistic problems, the most popular loss function is the cross-entropy error function. The formula of cross-entropy is given by Equation (1). In this equation, values are denoted as inputs and and are denoted as real values of all output neurons in the output layer; y indicates the desired output values; and n is the number of all training samples. In order to minimize the loss function, the gradient descent optimization algorithm tries to find a local minimum by updating the weights (parameters) through training. In this study, Stochastic Gradient Descent (SGD) is used as a gradient descent algorithm.
3.1.1. Convolutional Layer
The convolutional layer includes feature maps (depth slices) and each feature map includes sets of neurons. The output of the convolutional operation in a convolutional layer is given by Equation (2). In this equation, F is denoted as the kernel (filter) size, is denoted as the feature maps, B is denoted as the bias, and the weight of a kernel is denoted as . The output of a convolutional layer is denoted as where indicates the feature map in a layer that it denoted by [32].
3.1.2. Pooling Layer (Subsampling)
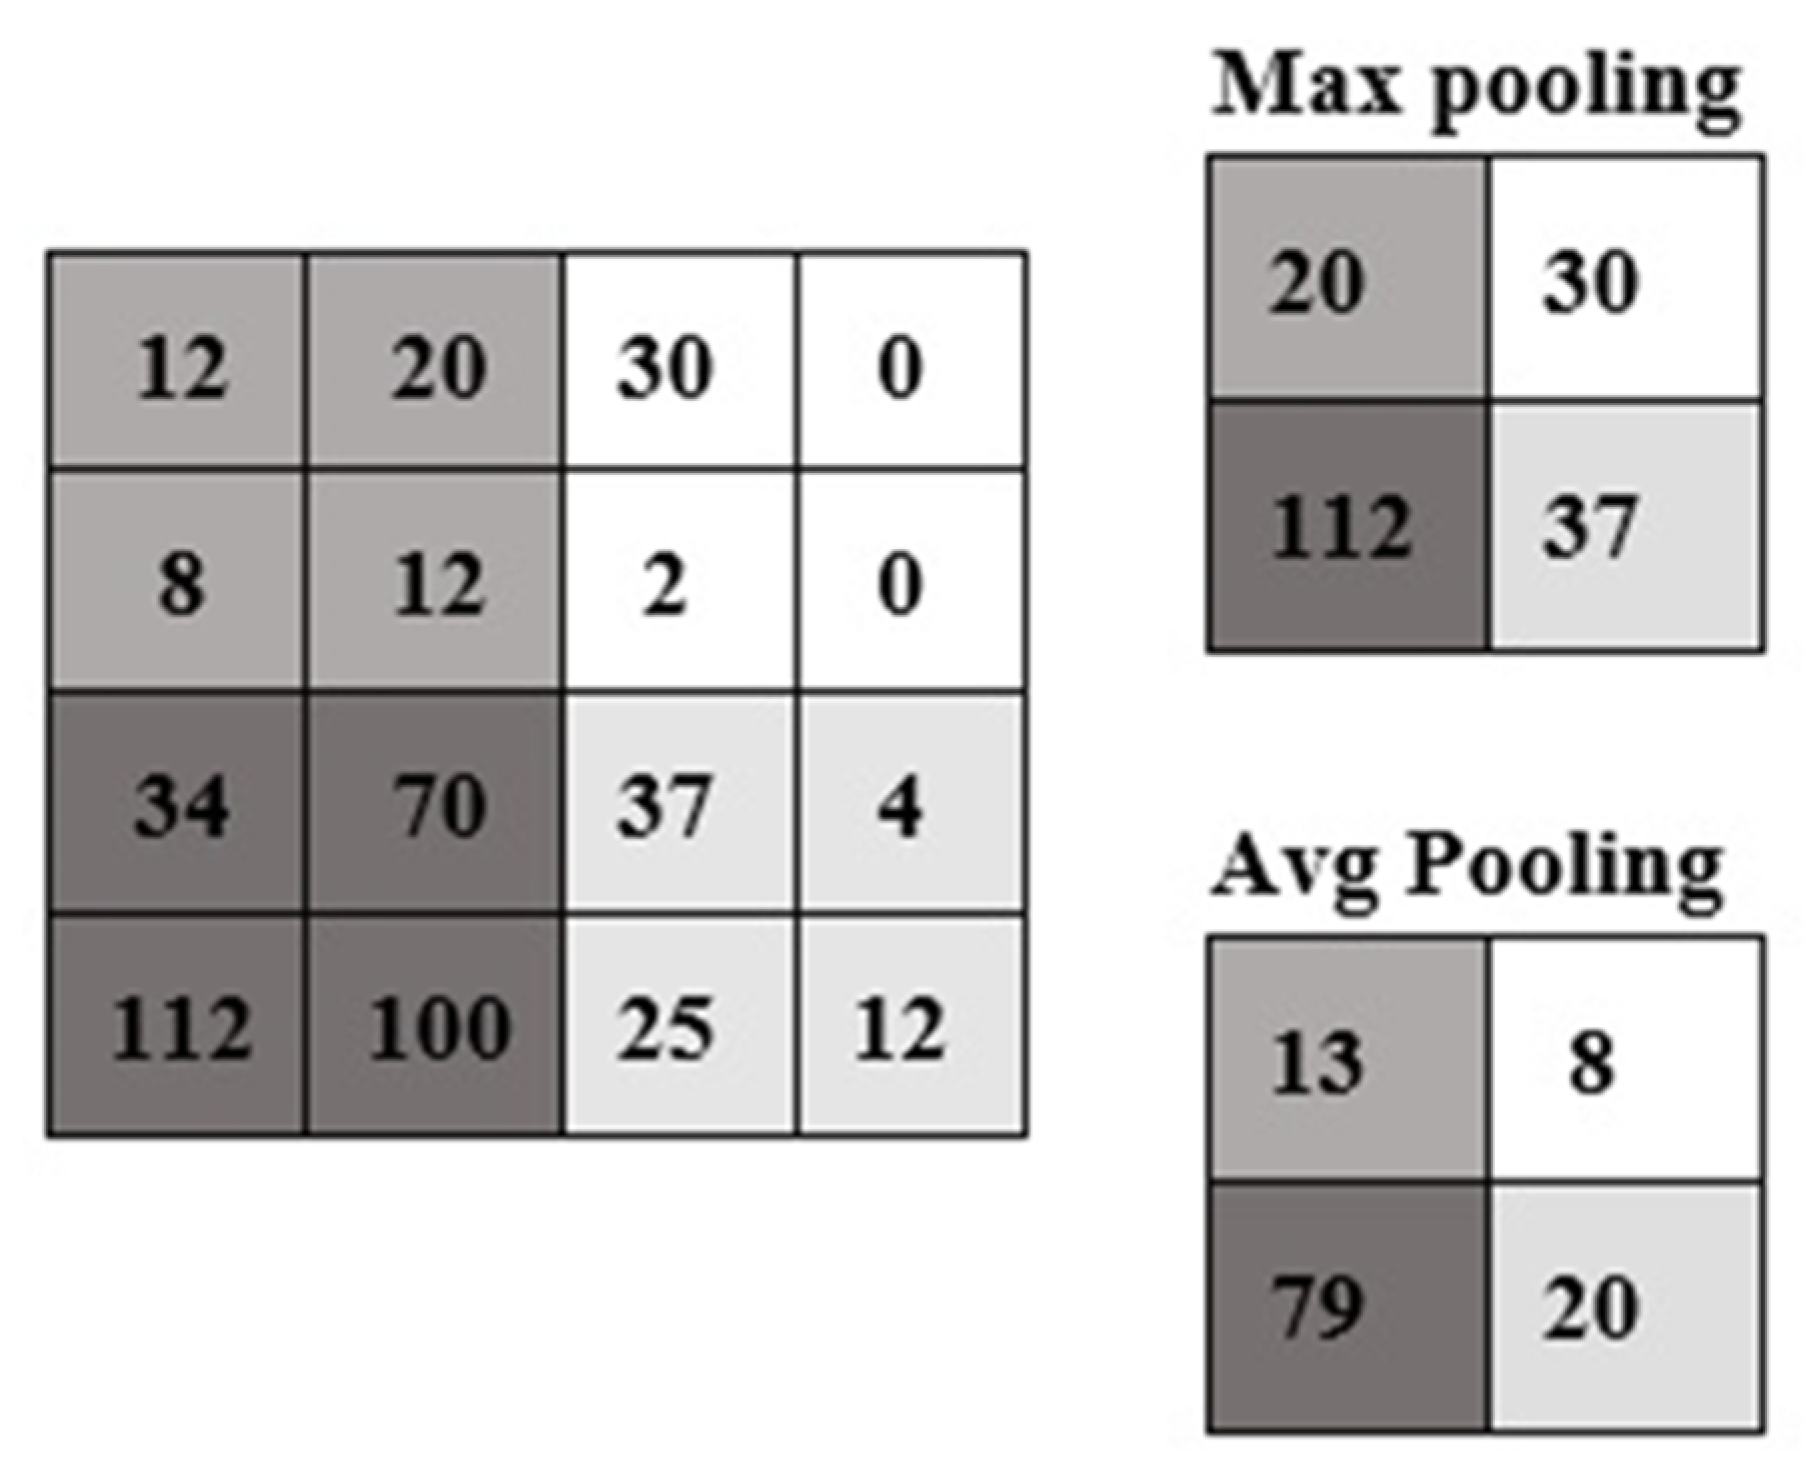
To decrease the number of parameters and network calculation, generally the pooling layer is used among convolutional layers; consequently, through the subsampling operation, input size is decreased in all depth parts and this prevents overfitting through network training. Since the spatial size of input is decreased by the pooling operation, the depth dimension is not changed. Max pooling and average pooling are the two most commonly used types of pooling operations (Figure 1). The width and height of the output in the pooling layer are achieved by Equations (3) and (4). In both equations, W1, H1, D1 are the width, height and the depth size of input respectively. S is denoted as the stride size (the step of shifting by kernels on the input image), and F is denoted as the kernel size [32].
3.1.3. Fully Connected Layer
The last layer of CNN architecture is a fully connected layer. Similar to ordinary ANN, in the fully connected layer, all neurons of a layer are connected to all neurons of the previous layer. Through training, the score of a class between all classes of the dataset is presented in the fully connected layer. Fully connected operations are given by Equation (5), in which and are denoted as fully connected layers. The output of the last fully connected is , which is indicated by the unit in layer . In layer , feature maps of by size are denoted as inputs. is the weights connections of the unit in layer and which is denoted as the unit of layer in (r, s) location [32].
3.1.4. Relu Activation Function
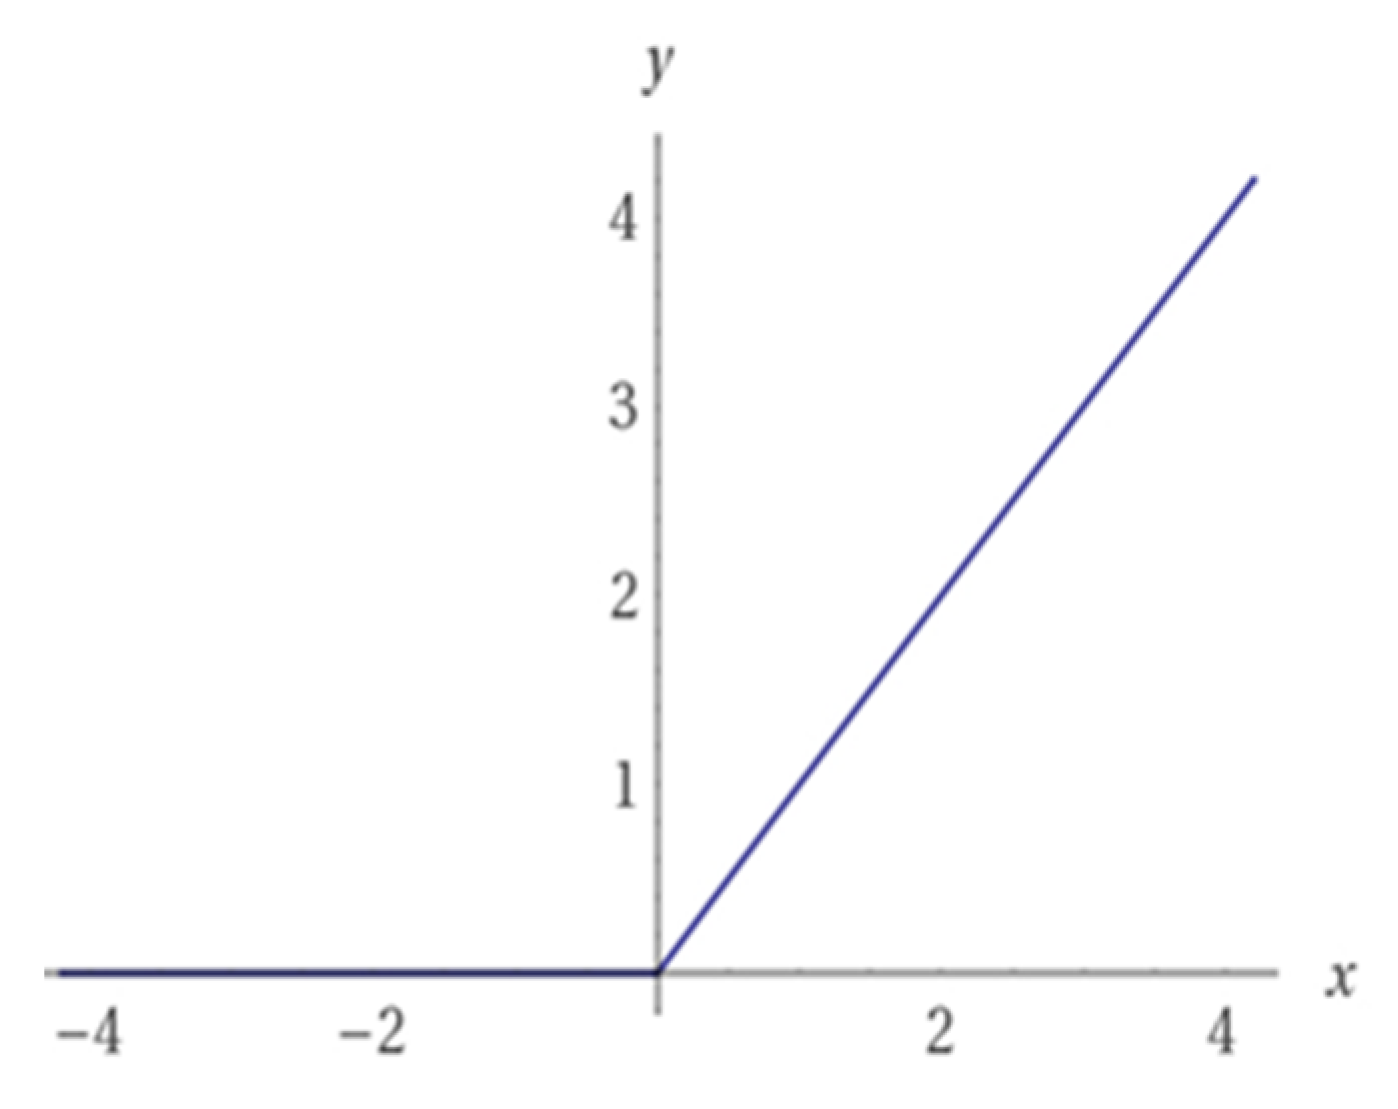
Although the connection between neurons in CNN are a local connection type, similar to ANN, the output of a neuron in CNN is calculated by a nonlinear activation function. Based on the advantage of Relu (Rectified linear unit) activation function (Figure 2) in terms of the high performance, fast learning, and a simple structure it is preferred to logistic sigmoid and hyperbolic tangent functions. The formula of the Relu function and its derivative are shown by Equations (6) and (7). For z ≤ 0, the gradient of the Relu function is 0; otherwise, the gradient of Relu is 1 [33].
3.1.5. Softmax Layer
Generally, in the last layer of CNN architecture, the softmax function is used to calculate the probability of each ground truth label of outputs between 0 and 1, and output values convert to perceptible values [34]. The formula of the softmax function is given by Equation (8). In this equation, k is denoted as the dimension of random values (z) which are converted to the meaningful values between 0 and 1 by the softmax function f(z) [35].
3.2. Radial Basis Function (RBF) Kernel-Based SVM Classifier
SVM that has been proposed for binary classification achieved noteworthy results in real life problems. Additionally, SVM classifier by using RBF kernel makes a nonlinear classifier which can map the original dataset to the higher dimensional space by producing linear data. This is illustrated by Equation (9), where feature vectors of input are presented by x and y; the squared Euclidean distance between x and y vectors is indicated by and the kernel parameter are presented by [36].
3.3. Performance Metrics
Generally, for performance evaluation of the classification algorithm, Sensitivity (Recall), Specificity and Accuracy are used [7]. Performance metrics of this study and assistant measurements (FP, FN, True Positive (TP) and True Negative (TN)) are used to calculate the performance metrics and are given below.
- TP—positive samples which are predicted accurately as a positive label.
- FN—positive samples which are predicted incorrectly as a negative label.
- FP—negative samples which are incorrectly predicted as a positive label.
- TN—negative samples which are correctly predicted as a negative label.
- Accuracy—performance evaluation of the classification algorithm.
- Sensitivity (Recall)—indicates what proportion of classified classes as a positive label have positive class labels.
- Precision—indicates the proportion of classified classes as positive on all positive predicted labels.
- Specificity—indicates what proportion of classified classes as a negative label have negative class labels.
4. Classification of Lung CT Images
4.1. Dataset and Preparing
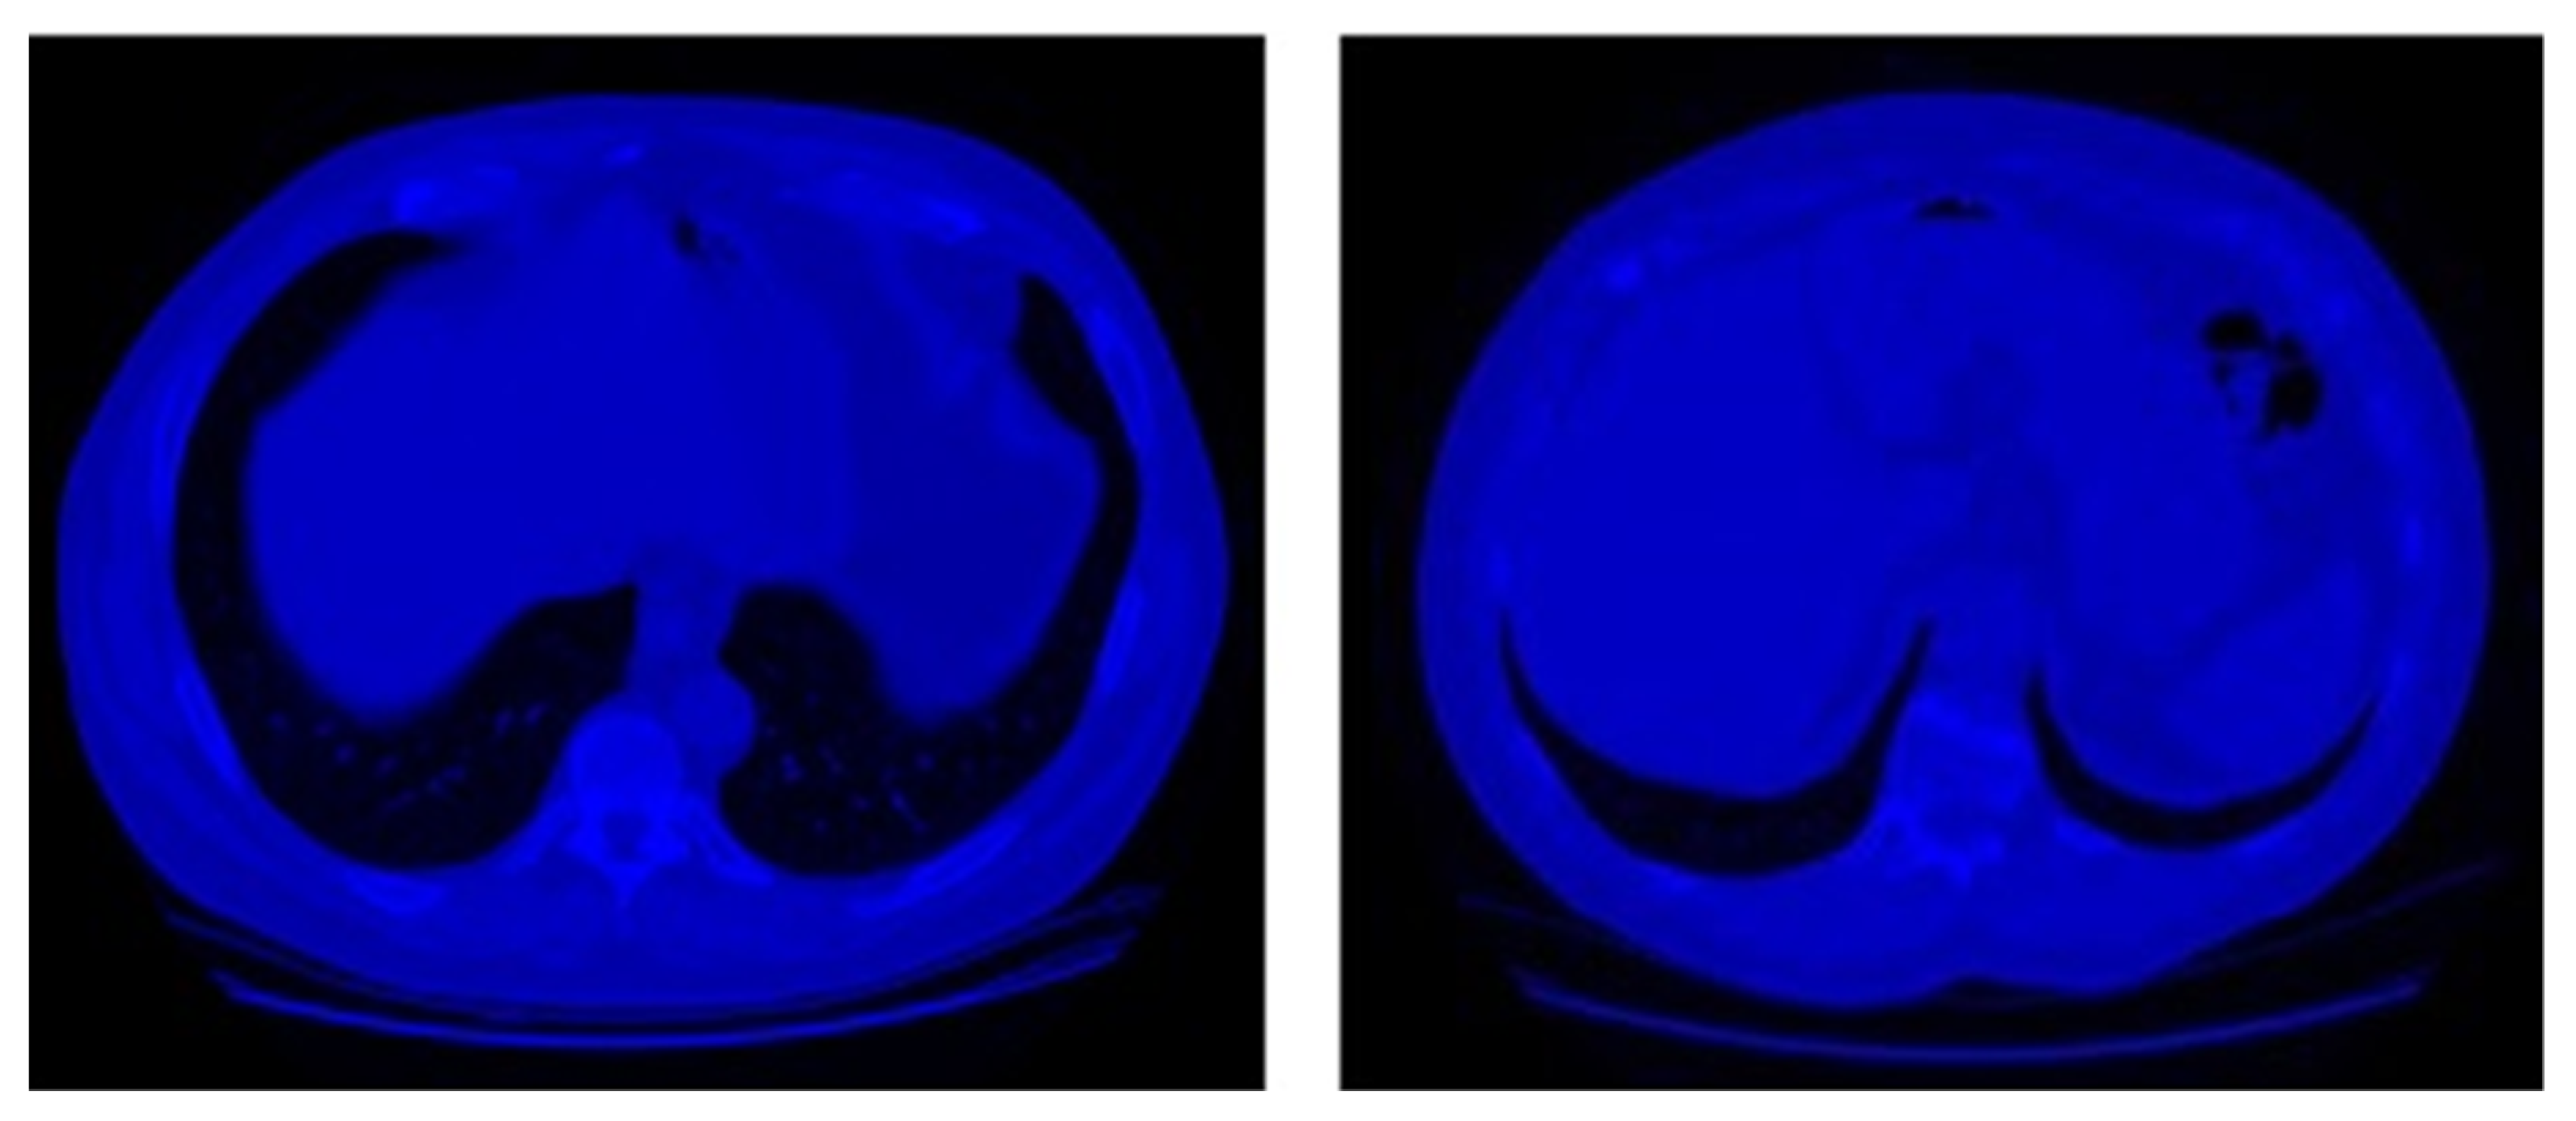
In this study, CT scan images of Data Science Bowl and Kaggle [18] are used. This dataset consists of 2101 high-risk patients with CT scans of chest cavity which includes multiple 2D slices (Figure 3) in an Imaging and Communications in Medicine (DICOM) format. DICOM format is a standard format of medical imagery (i.e., Xray, PET, CT scan) [37]. Moreover, each CT scan is labeled as with cancer or without cancer by pathology diagnosis which contains a different number of images.
Since the main purpose of this study is to apply 3D-CNN architecture in order to classify lung CT scan images, the essential stage is preparing a 3D dataset.
Each CT scan consists of slices by 512 × 512 sizes with a variable number of slices (z dimension) based on the resolution of the scanner machine. Hence, in order to use the 3D dataset, reconstruction of the data by reading all slices of each CT scan is necessary. Therefore, the first integer pixel values of each slice are converted to Hounsfield Units, which are standard for radio density measurement; [38] afterwards each slice is normalized to the (0,1) range. Eventually, 2D slices are stacked into 3D volume in the appropriate sequence to produce 3D inputs. To have the same input, 3D images in terms of dimensions, zero padding is applied on all 3D scans along each dimension to prepare a dataset of 512 × 512 × 512 volume. According to the memory usage of GPU, the input has been rescaled to a 227 × 227 × 227 volume.
By applying and comparing the state-of-the-art architectures on lung CT scan datasets, it has been proved that the appropriate architecture can be the customized architecture of CNN. Hence, in this study, the most significant purpose was to propose appropriate 3D-CNN models. Furthermore, in order to evaluate the performance of proposed 3D-CNN models (straight 3D-CNN and hybrid 3D-CNN), AlexNet and GoogleNet, two well-known architectures of CNN, are applied on the prepared CT scan images. Since the prepared CT scan image dataset contains 3D images, both AlexNet and GoogleNet architectures have been altered to 3D architectures to be suitable architectures in order to classify the 3D images. In this section, the proposed 3D-CNN architectures and both 3D-AlexNet and 3D-GoogleNet architectures are explained as well. Furthermore, Python was used to prepare the dataset and open-source python-friendly library Tensorflow was used to create the 3D learning architectures. The models ran over a computer with Nvidia GeForce Titan X Pascal 12 GB GPU.
4.2. Proposed 3D-CNN Architectures for Classification of Lung CT
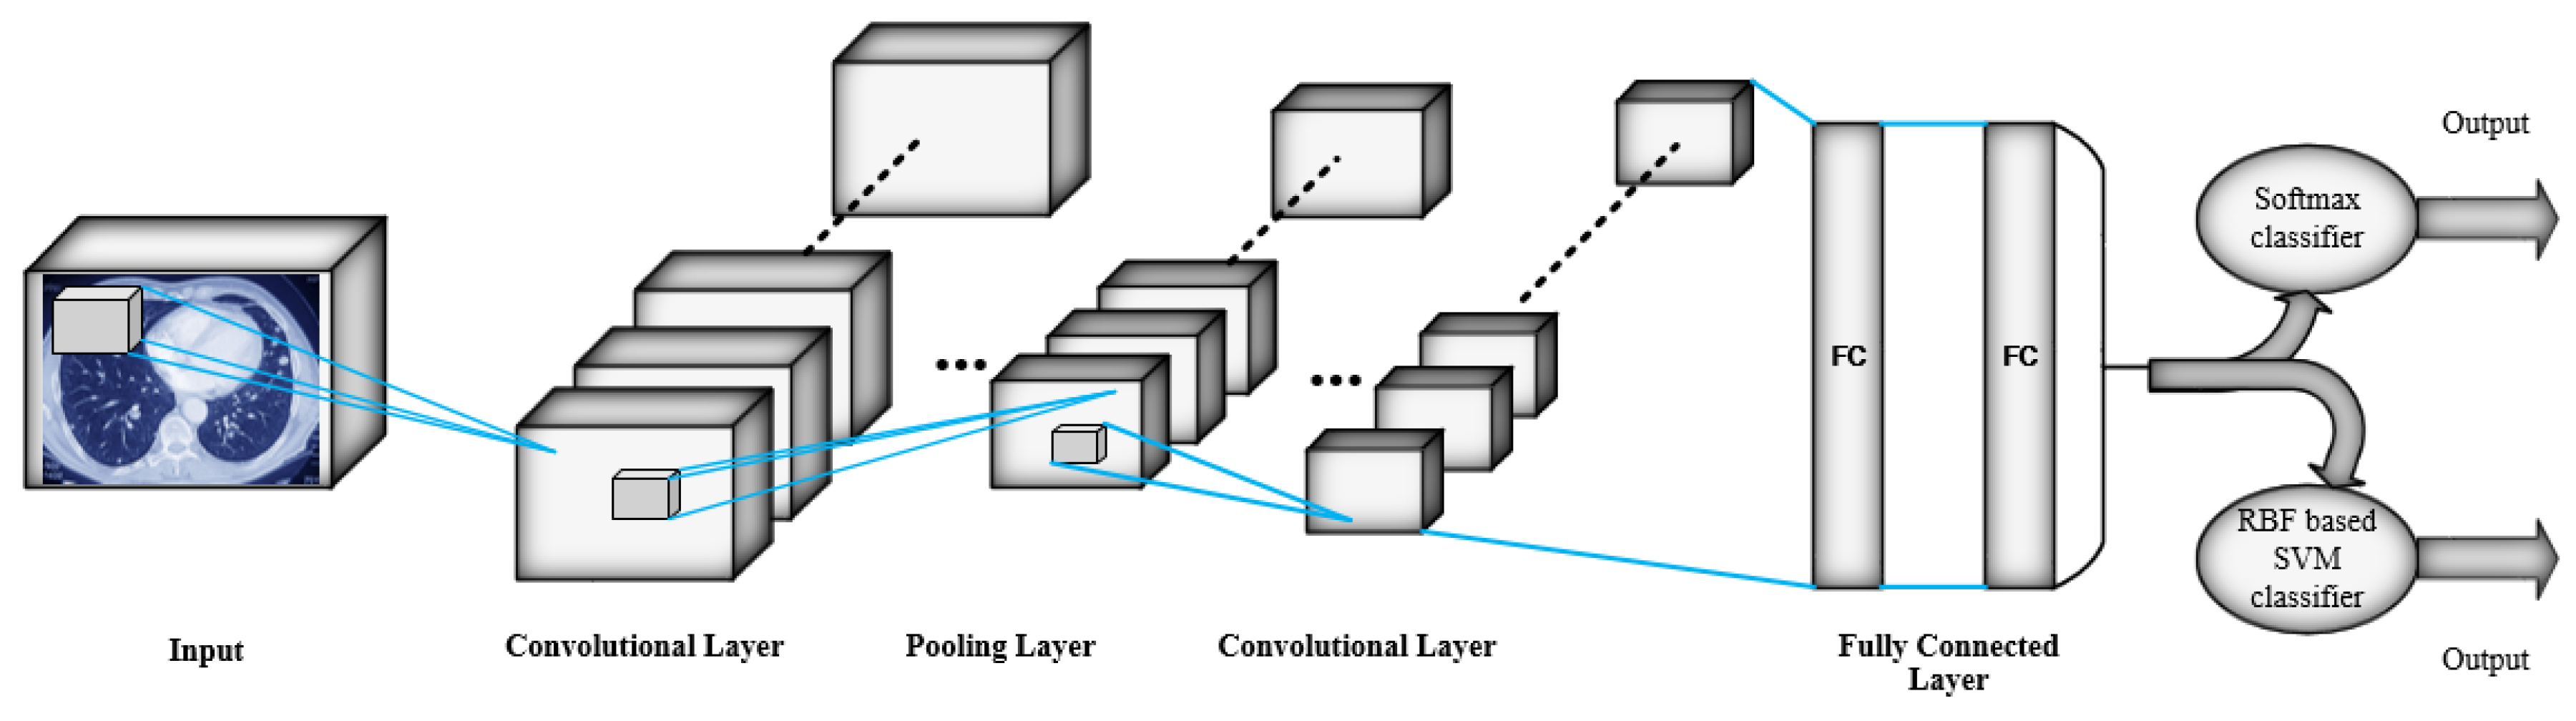
The main structures of both proposed 3D-CNN architectures, which are used for automatic feature extraction, contain six convolutional layers, four max pooling layers, and two fully connected layers. The kernel size in all convolutional layers and pooling layers is considered 3 × 3 × 3 and 2 × 2 × 2 respectively. Moreover, the number of applied kernels on feature maps in convolutional layers is 96, 128, 256, 324 and 512 respectively. For non-linearity, the Relu activation function with less computation cost is applied to the output of each convolutional layer and fully connected layers. In the first convolutional layer, 96 filters by 3 × 3 × 3 filter size are applied on the input images of 227 × 227 × 227 size. The max pooling layer is used to reduce the output size of the previous convolutional layer by applying 2 × 2 × 2 filters. Consequently, the downsampled feature maps go through the second and third convolutional layers. In order to operate downsampling on the output feature maps of the third convolutional layer, the second pooling layer is applied. Afterwards, the fourth and fifth convolutional layers are applied on the downsampled feature maps. The model continues by the rest of layers until two fully connected layers where all neurons are connected to all neurons of the previous layer. Consequently, the difference between the two 3D-CNN architectures is in their classification layers. Accordingly, in straight 3D-CNN architecture as commonplace CNN, Softmax classifier is used to classify with cancer and without cancer classes of CT scan images and, additionally, the RBF-based SVM classifier is used as a classification layer of hybrid 3D-CNN. Thus, SVM through RBF kernel can map the data to a high dimensional feature space which is considered as separable data. Furthermore, in both proposed architectures, outputs of the last fully connected layer after applying Relu activation function are fed to the classification layer as the input of classifiers. The architecture of both proposed 3D-CNNs is illustrated in Figure 4, where the classification layers are separated as two softmax and RBF-based SVM classifiers to depict both proposed architectures. Moreover, the summary of the layers is illustrated in Table 1. In addition, in this study, batch size (number of samples through one training cycle) and the learning rate of the network are determined to be 32 and 0.01, respectively, in both proposed 3D-CNN architectures. Furthermore, both proposed architectures are trained in 30 epochs as well.
4.3. AlexNet Architecture for Classification of Lung CT Images
Krizhevsky et al. won ILSVRC-2012 (ImageNet Large Scale Visual Recognition challenge) by proposing the AlexNet architecture for the first time [39]. AlexNet contains five convolutional layers, five pooling layers and three fully-connected layers.
Since in original AlexNet architecture, 2D images are used, in this study, in order to classify a 3D CT scan dataset, 3D-AlexNet architecture is implemented. For non-linearity, the Relu activation function is applied to the output of each convolutional layer and fully connected layers. Softmax classifier is used as AlexNet’s default classifier as well. Moreover, in this study, batch size and the learning rate of the network are determined to be 32 and 0.01, respectively, and it is trained in 30 epochs. Additionally, a summary of the layers and output size of lung images through training by 3D-AlexNet architecture is given in Table 2.
4.4. GoogleNet Architecture for Classification of Lung CT Images
The winners of ILSVRC14 proposed a CNN architecture that was called GoogleNet. This architecture consists of three convolutional, two max pooling and nine inception modules. Moreover, each inception module includes convolutional layers and a max pooling layer [29]. In this study, standard 2D-GoogleNet architecture is modified to create a compatible 3D-GoogleNet architecture with 3D CT scan images. Moreover, in this study, default softmax is used as a classifier of 3D-GoogleNet. In addition, the batch size and learning rate of the 3D-GoogleNet are determined to be 32 and 0.01 as well, and the training of CNN in 3D-GoogleNet architecture for lung CT scan images is applied in 30 epochs. A summary of the layers and output size of lung images through training by 3D-GoogleNet architecture is illustrated in Table 3.
5. Experimental Results and Discussion
In this section, the output results of two proposed 3D-CNN architectures and both 3D-AlexNet and 3D-GoogleNet architectures on lung CT scan images are presented. Furthermore, the achieved results of proposed architectures are compared with the 3D-AlexNet and 3D-GoogleNet as well.
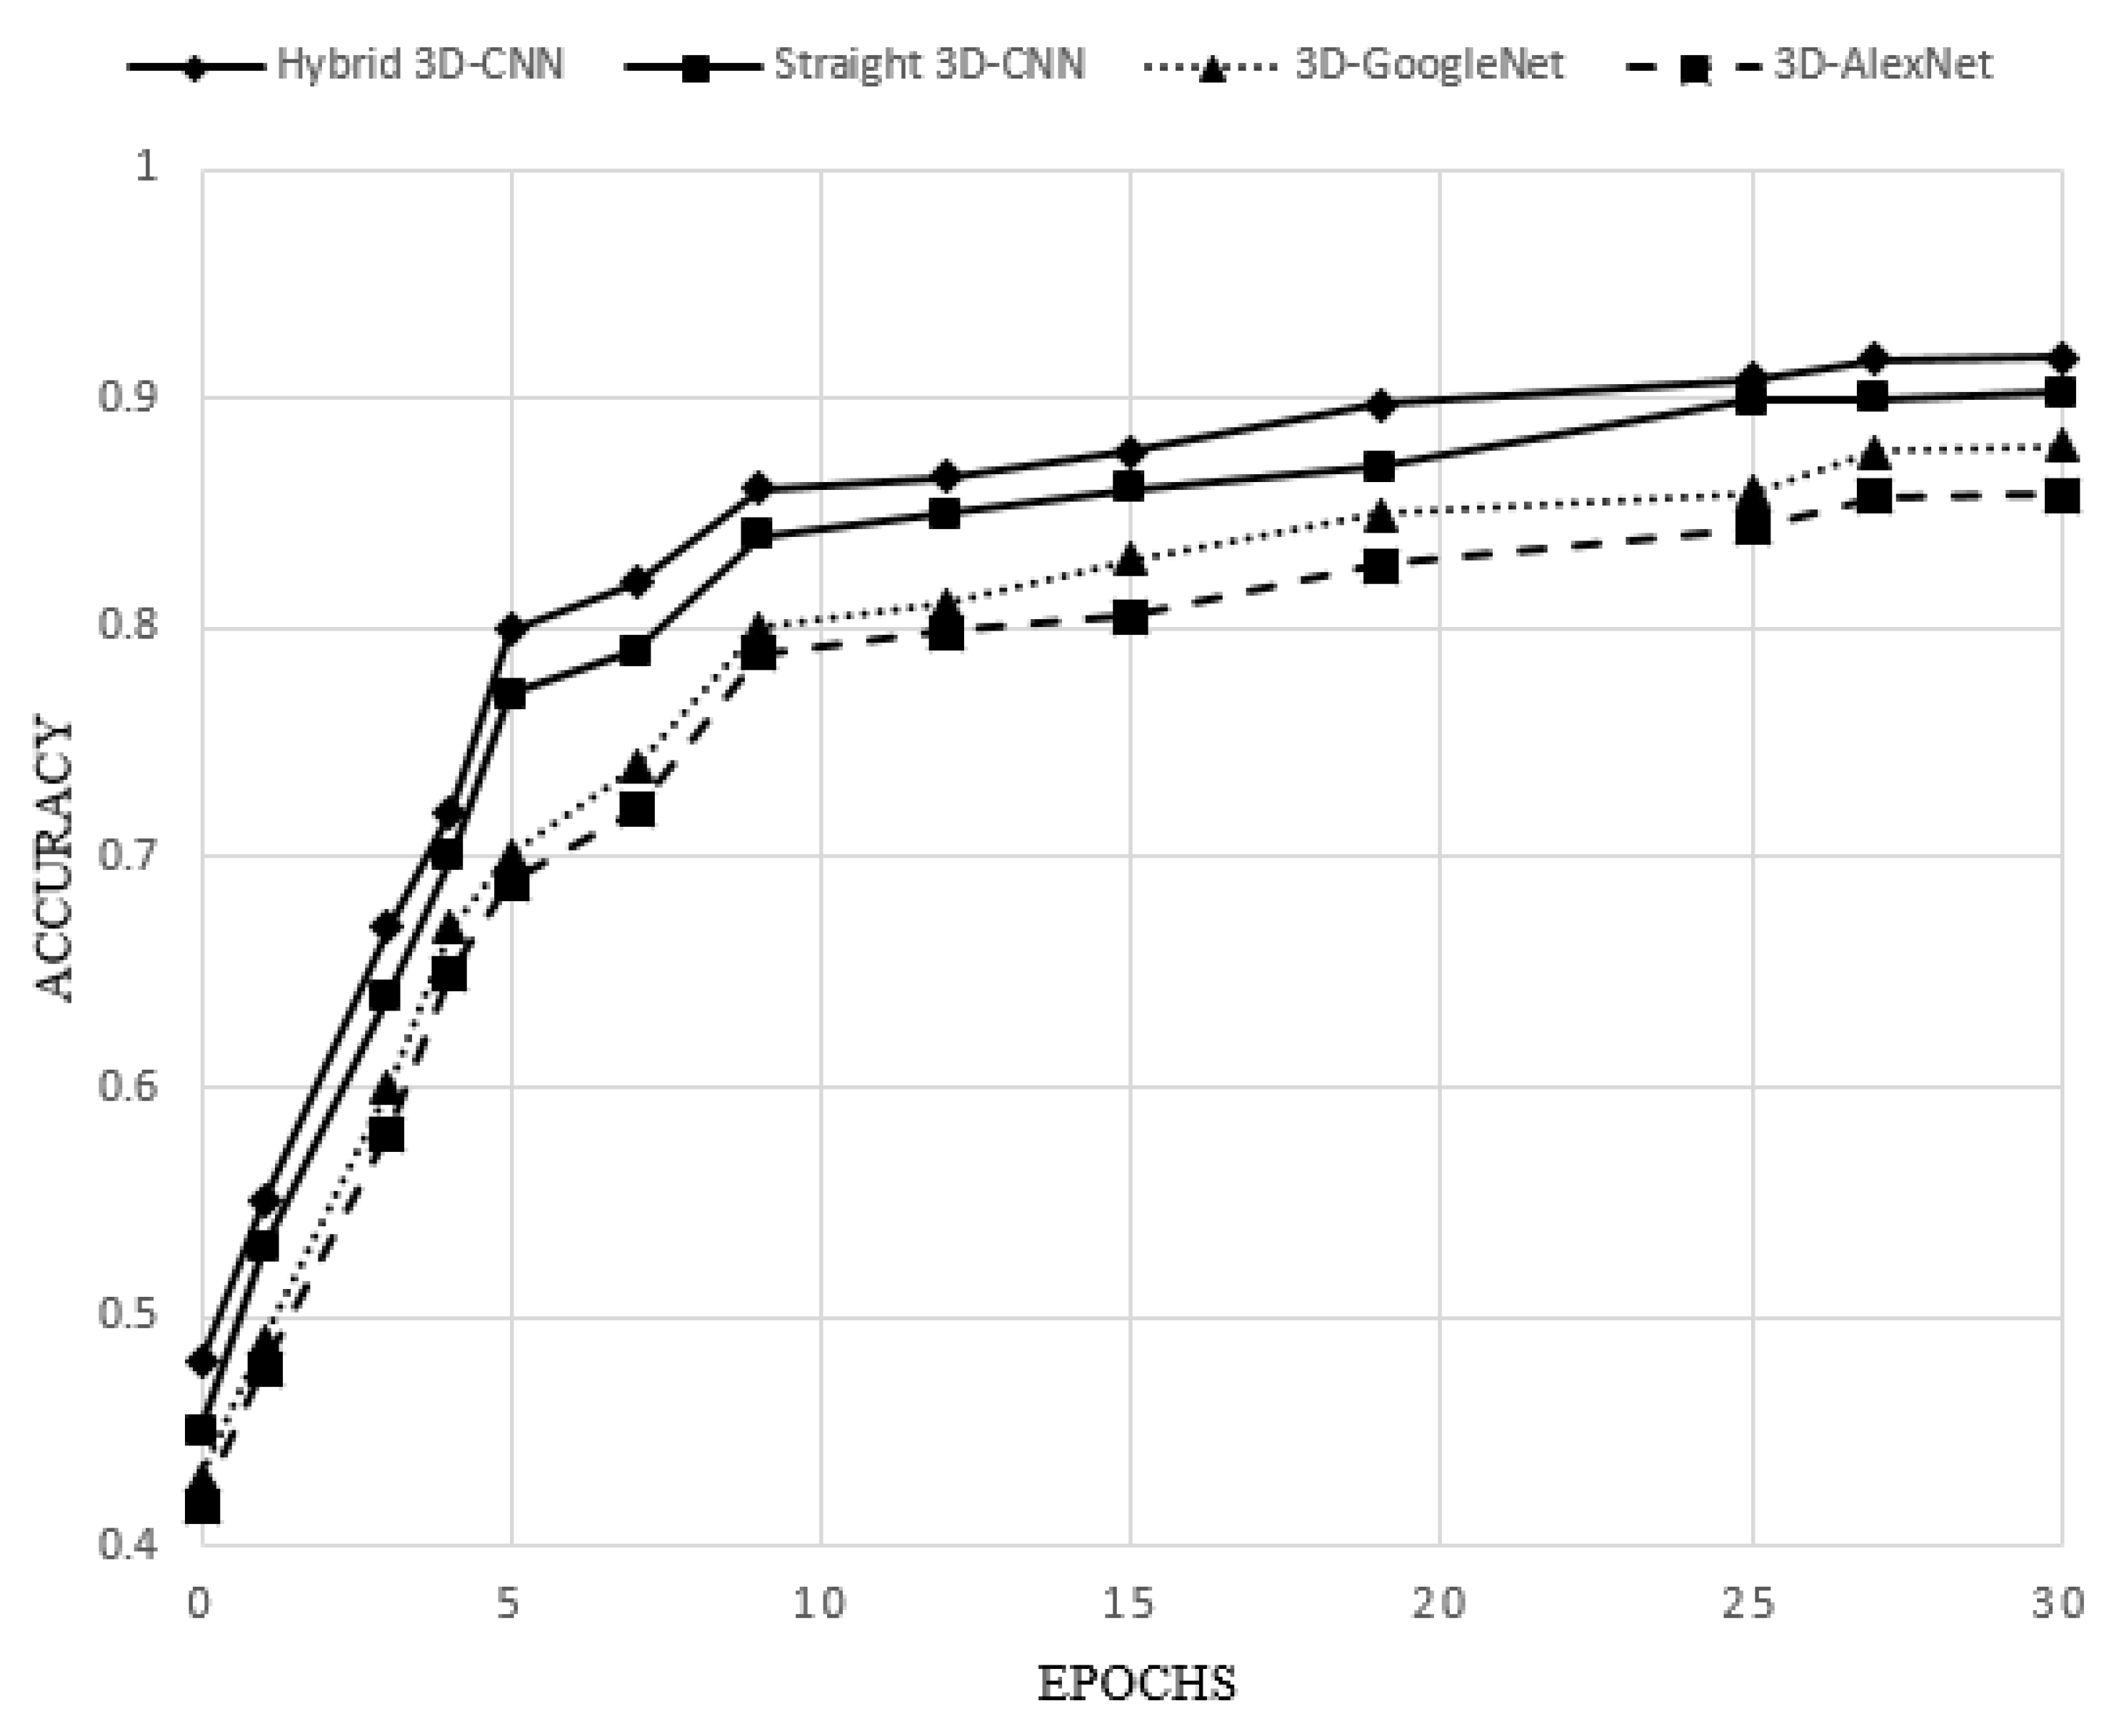
To evaluate the performance of 3D-CNN proposed architectures (straight 3D-CNN and hybrid 3D-CNN) and two 3D-AlexNet and 3D-GoogleNet architectures, 75% of the dataset is considered as a train set and 25% is considered as a test set. A summary of the accuracy rate, sensitivity, precision, and specificity of all four architectures is presented in Table 4. Moreover, the accuracy of all four architectures with epochs is depicted in Figure 5.
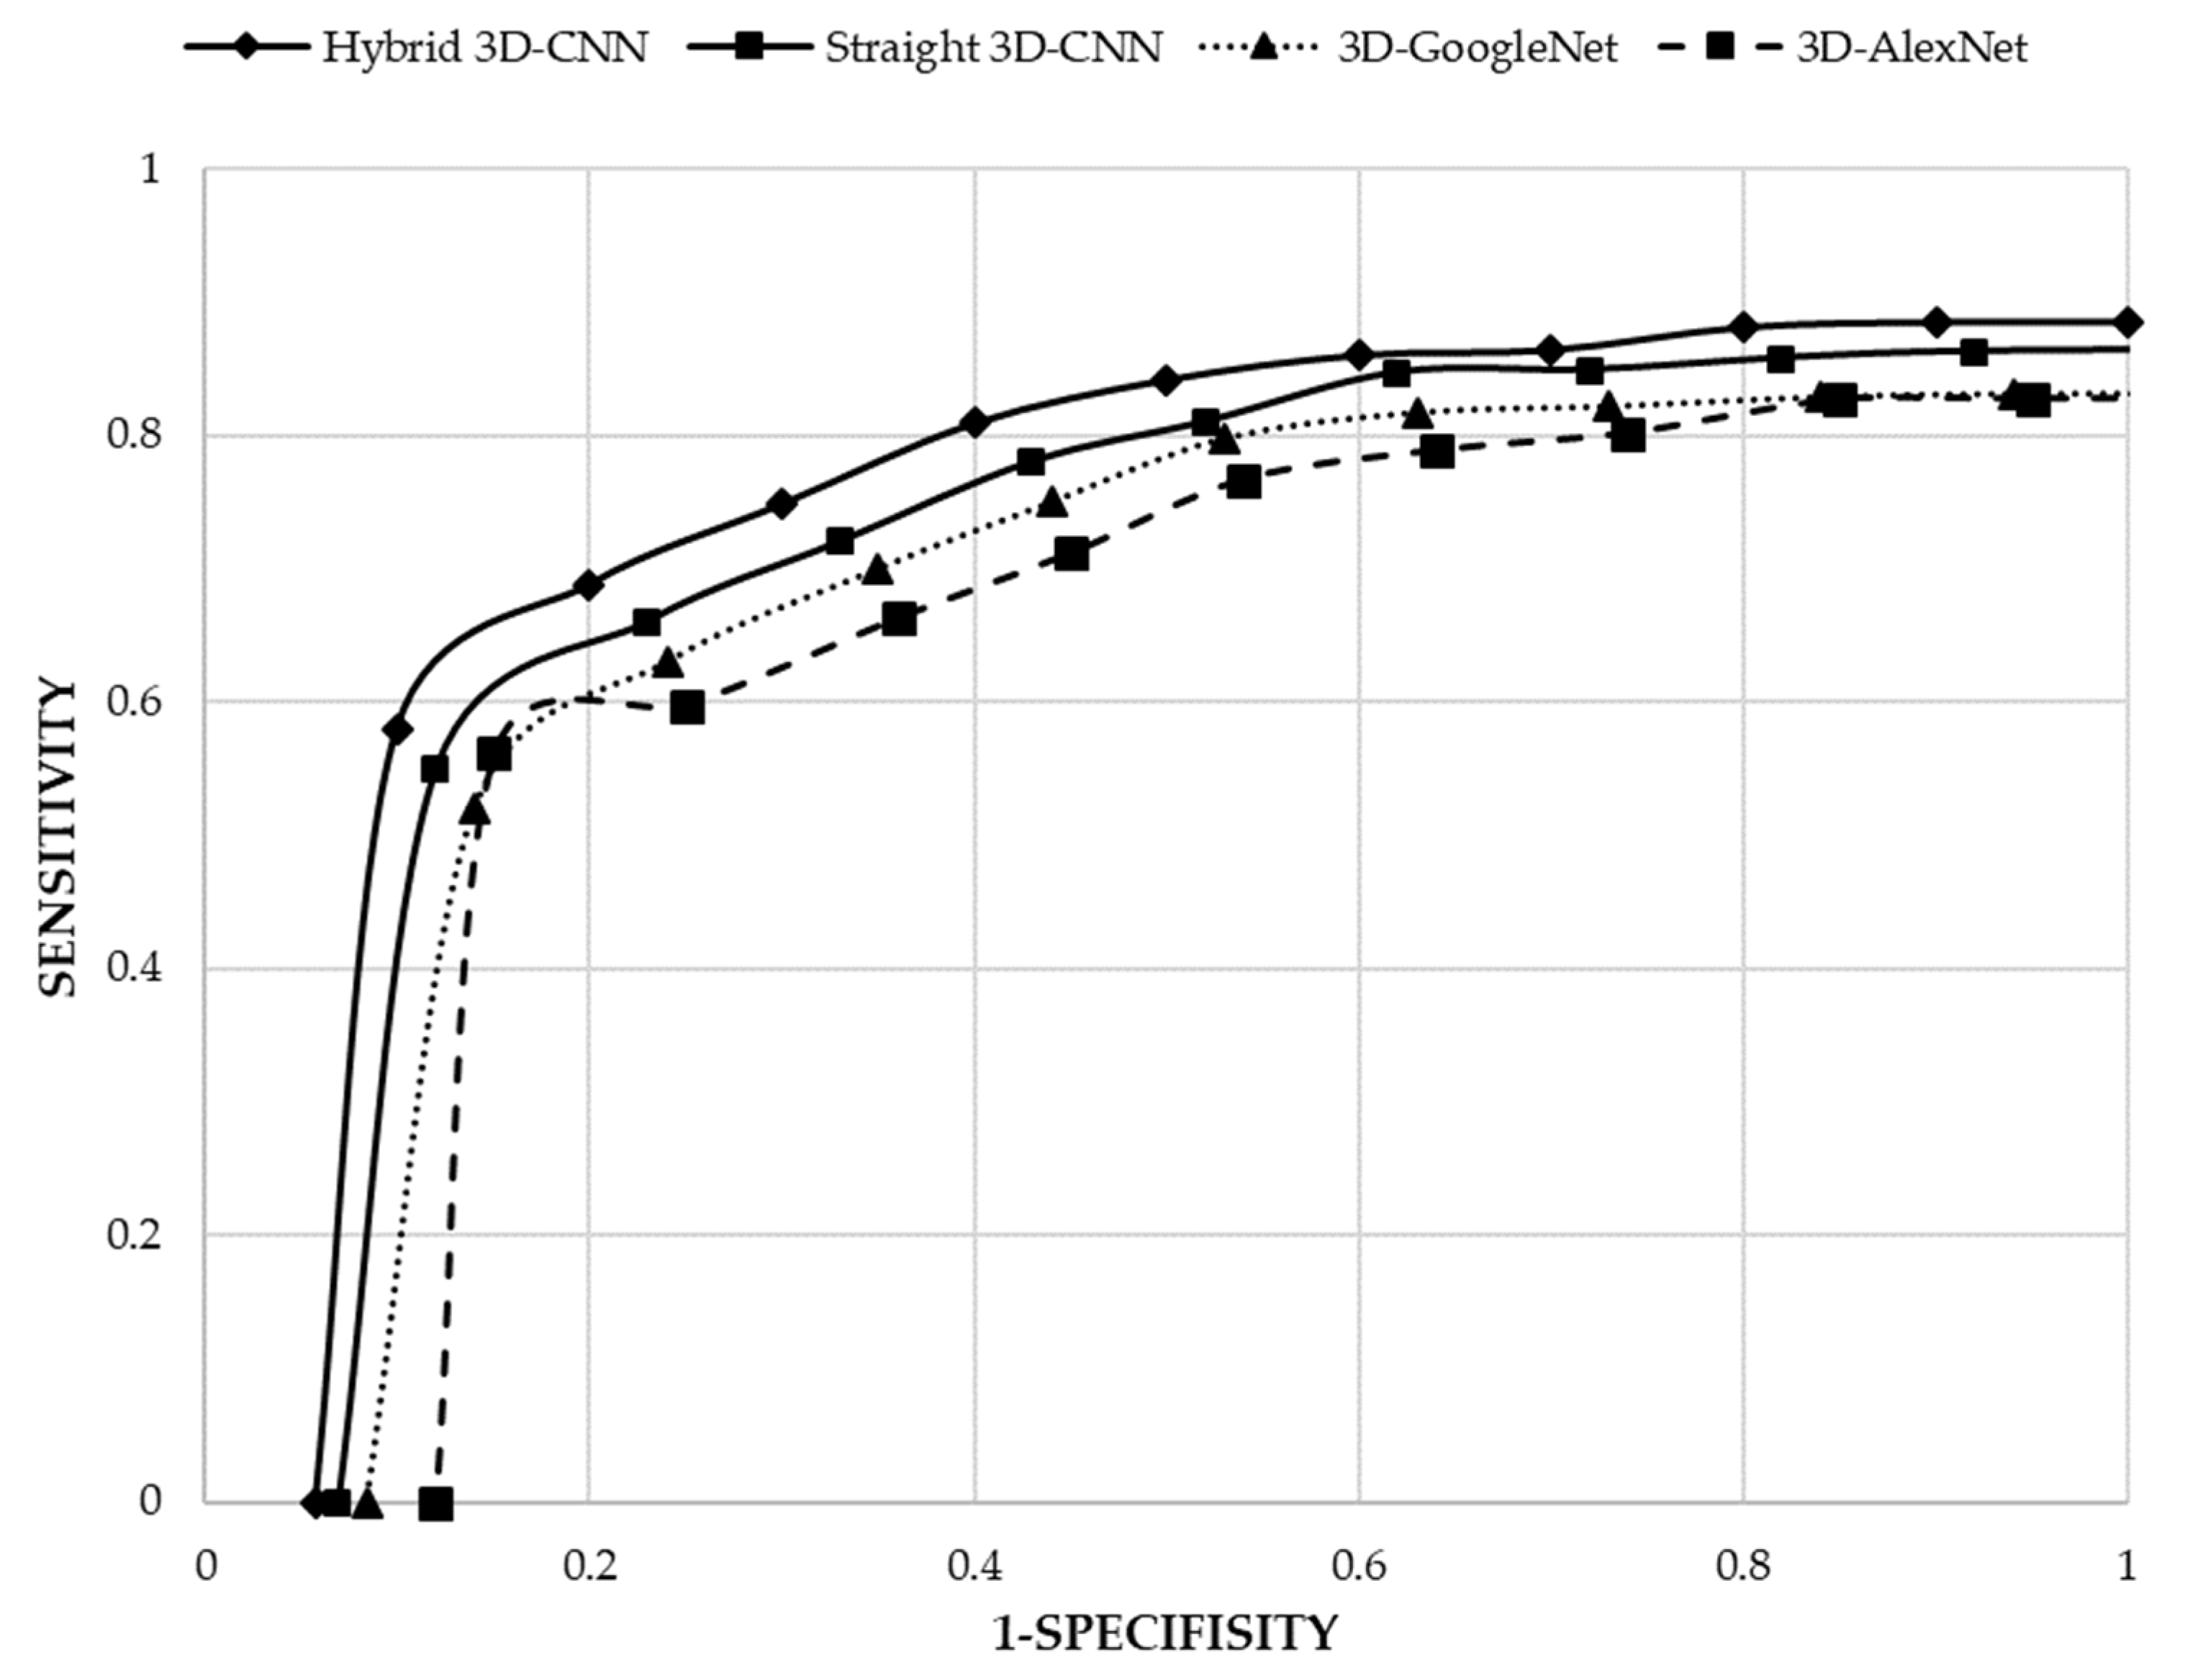
By considering the achieved results (Table 4 and Figure 5), it can be demonstrated that both proposed 3D-CNN architectures (straight 3D-CNN and hybrid 3D-CNN) have achieved a higher accuracy rate in the classification of lung CT scan images compared to the 3D-Alexnet and 3D-GoogleNet. As a result, the proposed hybrid 3D-CNN using RBF-based SVM classifier surpassed all other architectures by 91.81% accuracy rate and the second best accuracy rate belongs to the proposed straight 3D-CNN (90.23%) which used softmax classifier in the classification of lung CT scan images. However, in comparison with 3D-Alexnet having 85.79% accuracy rate, 3D-GoogleNet achieved a higher accuracy rate (87.95%). Consequently, by considering the structure of all four architectures, it will be demonstrated that more convolutional layers can help to produce more features that lead to the satisfying accuracy rate, for example, 3D-GoogleNet obtained a higher accuracy rate than 3D-AlexNet. More convolutional layers, however, can make a more complicated model to extract features. Therefore, the complex model of 3D-GoogleNet achieved a lower accuracy rate than the proposed straight 3D-CNN and hybrid 3D-CNN architectures. Hence, creating balanced CNN layers is the most significant issue in classification problems. Although 3D-GoogleNet achieved a higher sensitivity (prediction of samples with cancer) of 83.17%, specificity (prediction of samples without cancer) of 91.61% and precision (prediction of samples with cancer among all samples with the cancer label) of 88.36% compared to 3D-AlexNet (82.74% sensitivity, 88.04% specificity and 83.66% precision), the proposed two 3D-CNN architectures have obtained higher sensitivity, specificity and precision in the diagnosis of lung cancer. Therefore, according to the sensitivity, hybrid 3D-CNN using RBF-based SVM classifier and straight 3D-CNN by using softmax classifier could classify 88.53% and 86.40% samples with cancer among all samples respectively. However, 11.47% and 13.60% of samples with cancer among all samples were misclassified and are determined as without cancer samples by hybrid 3D-CNN and straight 3D-CNN as well. Furthermore, according to the specificity of both proposed architectures, only 5.77% and 6.91% of samples without cancer among all samples have been misclassified by hybrid 3D-CNN and straight 3D-CNN respectively. Both two proposed 3D-CNN architectures have surpassed the other two architectures in terms of classifying samples with cancer among all samples with the cancer label (specificity) and, additionally, hybrid 3D-CNN has obtained the highest specificity (94.23%). Figure 6 illustrates Roc curves of all four architectures based on sensitivity and 1-specificity. According to the results, it can be proved that not only did hybrid 3D-CNN by using RBF-based SVM achieve the highest results among all three architectures, but it also could acquire satisfying results by using the RBF-based SVM classifier than softmax classifier in straight 3D-CNN. Thus, the RBF-based SVM classifier could improve the performance of CNN architecture in the classification of 3D lung CT scan images.
6. Conclusions
Since lung cancer is one of the most common cancer types in men and women around the world, CAD systems based on machine learning techniques designed to assist physicians have been developed extensively. However, machine learning techniques using handcrafted methods to feature extraction can take a long time and lack the precise diagnosis process. Therefore, deep learning methods could alleviate the feature extraction process by automatic methods in order to extract more useful low-level to high-level features. Due to the satisfying results of deep learning methods, in this study, in order to diagnose lung cancer on CT scan images of the Data Science Bowl and Kaggle dataset, CNN architecture, one of the successful models of deep learning in medical researches, was considered. Therefore, before applying the model, an image dataset was prepared to form a 3D dataset of CT scan images. Furthermore, in order to classify lung CT scan images, two straight 3D-CNN and hybrid 3D-CNN architectures were proposed, in which the architecture of the feature extraction section of both models was the same. However, each proposed model uses different classifiers; straight 3D-CNN uses softmax as the common classifier of standard CNN and hybrid 3D-CNN uses RBF-based SVM classifier instead of the softmax. Furthermore, in order to evaluate both proposed architectures, two-well known architectures of CNN were considered which were modified to be compatible with the 3D images as 3D-AlexNet and 3D-GoogleNet. Experimental results show that both straight and hybrid 3D-CNN models surpassed the two others in the diagnosis of lung cancer. However, the proposed hybrid 3D-CNN by using RBF-based SVM achieved significant results: an accuracy rate of 91.81%, sensitivity of 88.53%, precision of 91.91%, and specificity of 94.23% compared to the straight 3D-CNN which used softmax. It has been demonstrated that SVM classifier could enhance the performance of the architecture. Our next objective will be to use deep learning-based methods for the detection of nodules on a more complicated CT scan image to classify the various types of nodules for our proposed models.
Author Contributions
H.P. and H.D.M. conceived and designed the experiments. H.P. and H.D.M. performed the experiments. H.P. contributed to setting up the simulation platform and GPU. H.D.M. analyzed the data. H.P. and H.D.M. wrote the paper. All authors read and approved the manuscript.
Funding
This research received no external funding.
Acknowledgments
We gratefully acknowledge the support of NVIDIA Corporation with the donation of the Titan X Pascal GPU used for this research.
Conflicts of Interest
The authors declare no conflict of interest.
References
- Firmino, M.; Angelo, G.; Morais, H.; Dantas, M.R.; Valentim, R. Computer aided detection (CADe) and diagnosis (CADx) system for lung cancer with likelihood of malignancy. BioMed. Eng. OnLine 2016, 15, 2. [Google Scholar] [CrossRef] [PubMed]
- Wang, M.; Long, F.; Tang, F.; Jing, Y.; Wang, X.; Yao, L.; Ma, J.; Fei, Y.; Chen, L.; Wang, G.; et al. Autofluorescence Imaging and Spectroscopy of Human Lung Cancer. Appl. Sci. 2017, 7, 32. [Google Scholar] [CrossRef]
- Wingo, P.A.; Ries, L.A.G.; Giovino, G.A.; Miller, D.S.; Rosenberg, H.M.; Shopland, D.R.; Thun, M.J.; Edwards, B.K. Annual Report to the Nation on the Status of Cancer, 1973–1996, With a Special Section on Lung Cancer and Tobacco Smoking. J. Natl. Cancer Inst. 1999, 91, 675–690. [Google Scholar] [CrossRef] [PubMed]
- Kulkarni, A.; Panditrao, A. Classification of lung cancer stages on CT scan images using image processing. In Proceedings of the IEEE International Conference on Advanced Communications, Control and Computing Technologies, Ramanathapuram, India, 8–10 May 2014. [Google Scholar]
- Cheng, J.Z.; Ni, D.; Chou, Y.H.; Qin, J.; Tiu, C.M.; Chang, Y.C.; Huang, C.S.; Shen, D.; Chen, C.M. Computer-Aided Diagnosis with Deep Learning Architecture: Applications to Breast Lesions in US Images and Pulmonary Nodules in CT Scans. Sci. Rep. 2016, 6, 24454. [Google Scholar] [CrossRef] [PubMed] [Green Version]
- Geng, M.; Wang, Y.; Tian, Y.; Huang, T. CNUSVM: Hybrid CNN-Uneven SVM Model for Imbalanced Visual Learning. In Proceedings of the IEEE Second International Conference on Multimedia Big Data, Taipei, Taiwan, 20–22 April 2016. [Google Scholar]
- Cascio, D.; Taormina, V.; Raso, G. Deep Convolutional Neural Network for HEp-2 Fluorescence Intensity Classification. Appl. Sci. 2019, 9, 408. [Google Scholar] [CrossRef]
- Sun, W.; Zheng, B.; Qian, W. Computer aided lung cancer diagnosis with deep learning algorithms. In Proceedings of the International Society for Optics and Photonics Conference, San Diego, CA, USA, 24 March 2016. [Google Scholar]
- Ginneken, B.V.; Setio, A.A.A.; Jacobs, C.; Ciompi, F. Off-The-Shelf Convolutional Neural Network Features for Pulmonary Nodule Detection in Computed Tomography Scans. In Proceedings of the IEEE 12th International Symposium on Biomedical Imaging (ISBI), New York, NY, USA, 16–19 April 2015. [Google Scholar]
- Anthimopoulos, M.; Christodoulidis, S.; Ebner, L.; Christe, A.; Mougiakakou, S. Lung Pattern Classification for Interstitial Lung Diseases Using a Deep Convolutional Neural Network. IEEE Trans. Med. Imaging 2016, 35, 1207–1216. [Google Scholar] [CrossRef] [PubMed]
- Gruetzemacher, R.; Gupta, A. Using Deep Learning for Pulmonary Nodule Detection & Diagnosis. In Proceedings of the Twenty-Second Americas Conference on Information Systems, San Diego, CA, USA, 11 August 2016. [Google Scholar]
- Ciompi, F.; Chung, K.; Riel, S.J.V.; Setio, A.A.A.; Gerke, P.K.; Jacobs, C.; Scholten, E.T.; Prokop, C.S.; Wille, M.M.W.; Marchianò, A.; et al. Towards automatic pulmonary nodule management in lung cancer screening with deep learning. Sci. Rep. 2017, 7, 46479. [Google Scholar] [CrossRef] [PubMed] [Green Version]
- Li, Q.; Cai, W.; Wang, X.; Zhou, Y.; Feng, D.D.; Chen, M. Medical Image Classification with Convolutional Neural Network. In Proceedings of the 13th International Conference on Control, Automation, Robotics & Vision, Marina Bay Sands, Singapore, 10–12 December 2014. [Google Scholar]
- Shen, W.; Zhou, M.; Yang, F.; Yang, C.; Tian, J. Multi-scale Convolutional Neural Networks for Lung Nodule Classification. Inf. Process. Med. Imaging 2015, 24, 588–599. [Google Scholar] [PubMed]
- Rao, P.; Pereira, N.A.; Srinivasan, R. Convolutional Neural Networks for Lung Cancer Screening in Computed Tomography (CT) Scans. In Proceedings of the 2nd International Conference on Contemporary Computing and Informatics (IC3I), Noida, India, 14–17 December 2016. [Google Scholar]
- Song, Q.Z.; Zhao, L.; Luo, X.K.; Dou, X.C. Using Deep Learning for Classification of Lung Nodules on Computed Tomography Images. J. Healthc. Eng. 2017, 2017, 1–7. [Google Scholar] [CrossRef] [PubMed] [Green Version]
- Bondfale, N.; Banait, S. Lung Pattern Classification for Interstitial Lung Diseases Using a Deep Convolutional Neural Network. IJARCCE 2017, 5, 9851–9856. [Google Scholar]
- Data Science Bowl 2017. Kaggle. Available online: https://www.kaggle.com/c/data-science-bowl-2017 (accessed on 5 February 2019).
- Alakwaa, W.; Nassef, M.; Badr, A. Lung Cancer Detection and Classification with 3D Convolutional Neural Network (3D-CNN). IJACSA 2017, 8, 409–417. [Google Scholar] [CrossRef]
- Kuan, K.; Ravaut, M.; Manek, G.; Chen, H.; Lin, J.; Nazir, B.; Chen, C.; Howe, T.C.; Zeng, Z.; Chandrasekhar, V. Deep Learning for Lung Cancer Detection: Tackling the Kaggle Data Science Bowl 2017 Challenge. arXiv, 2017; arXiv:1705.09435. [Google Scholar]
- Liao, F.; Liang, M.; Li, Z.; Hu, X.; Song, S. Evaluate the Malignancy of Pulmonary Nodules Using the 3D Deep Leaky Noisy-or Network. J. Latex Class Files 2015, 14, 1–12. [Google Scholar]
- Serj, M.F.; Lavi, B.; Hoff, G.; Valls, D.P. A Deep Convolutional Neural Network for Lung Cancer Diagnostic. arXiv, 2018; arXiv:1804.08170. [Google Scholar]
- Jin, T.; Cui, H.; Zeng, S.; Wang, X. Learning deep spatial lung features by 3D convolutional neural network for early cancer detection. In Proceedings of the International Conference on Digital Image Computing: Techniques and Applications (DICTA), Sydney, Australia, 29 November–1 December 2017. [Google Scholar]
- LeCun, Y.; Bengio, Y.; Hinton, G. Deep learning. Nature 2015, 521, 436–444. [Google Scholar] [CrossRef] [PubMed]
- Laszlo, E.; Szolgay, P.; Nagy, Z. Analysis of a GPU based CNN implementation. In Proceedings of the 13th International Workshop on Cellular Nanoscale Networks and their Applications, Turin, Italy, 29–31 August 2012. [Google Scholar]
- Hinton, G.; Osindero, S.; Teh, Y.W. A fast learning algorithm for deep belief nets. Neural Comput. 2006, 18, 1527–1554. [Google Scholar] [CrossRef] [PubMed]
- Hubel, D.H.; Wiesel, T.N. Receptive Fields and Functional Architecture of Monkey Striate Cortex. J. Physiol. 1968, 195, 215–243. [Google Scholar] [CrossRef] [PubMed]
- Turaga, S.C.; Murray, J.F.; Jain, V.; Roth, F.; Helmstaedter, M.; Briggman, K.; Denk, W.; Seung, H.S. Convolutional Networks Can Learn to Generate Affinity Graphs for Image Segmentation. Neural Comput. 2010, 22, 511–538. [Google Scholar] [CrossRef] [PubMed] [Green Version]
- Szegedy, C.; Liu, W.; Jia, W.; Sermanet, P.; Reed, S.; Anguelov, D.; Erhan, D.; Vanhoucke, V.; Rabinovich, A. Going deeper with convolutions. arXiv, 2014; arXiv:1409.4842. [Google Scholar]
- Image Net. Available online: http://www.webcitation.org/query?url=http%3A%2F%2Fimage-net.org%2F&date=2017-12-27 (accessed on 4 February 2019).
- Leung, H.; Haykin, S. The Complex Backpropagation Algorithm. IEEE Trans. Signal Process. 1991, 39, 2101–2104. [Google Scholar] [CrossRef]
- Scherer, D.; Müller, A.; Behnke, S. Evaluation of Pooling Operations in Convolutional Architectures for Object Recognition. In Proceedings of the 20th International Conference on Artificial Neural Networks (ICANN), Thessaloniki, Greece, 15–18 September 2010. [Google Scholar]
- Maas, A.L.; Hannun, A.Y.; Ng, A.Y. Rectifier nonlinearities improve neural network acoustic models. In Proceedings of the 30th International Conference on Machine Learning, Atlanta, GA, USA, 16–21 June 2013. [Google Scholar]
- Kang, X.; Song, B.; Sun, F. A Deep Similarity Metric Method Based on Incomplete Data for Traffic Anomaly Detection in IoT. Appl. Sci. 2019, 9, 135. [Google Scholar] [CrossRef]
- Bouchard, G. Efficient Bounds for the Softmax Function and Applications to Approximate Inference in Hybrid models. In Proceedings of the Presentation at the Workshop For Approximate Bayesian Inference in Continuous/Hybrid Systems at Neural Information Processing Systems (NIPS), Meylan, France, 31 May 2008. [Google Scholar]
- Mu, T.; Nandi, A.K. Breast cancer detection from FNA using SVM with different parameter tuning systems and SOM–RBF classifier. J. Frankl. Inst. 2007, 344, 285–311. [Google Scholar] [CrossRef]
- Suapang, P.; Dejhan, K.; Yimmun, S. Medical Image Compression and DICOM-Format Image Archive. In Proceedings of the ICROS-SICE International Joint Conference, Fukuoka, Japan, 18–21 August 2009. [Google Scholar]
- Gücük, A.; Üyetürk, U. Usefulness of hounsfield unit and density in the assessment and treatment of urinary stones. World J. Nephrol. 2014, 6, 282–286. [Google Scholar] [CrossRef] [PubMed]
- Krizhevsky, A.; Sutskever, I.; Hinton, G.E. ImageNet Classification with Deep Convolutional Neural Networks. In Proceedings of the Advances in Neural Information Processing Systems 25 (NIPS 2012), Lake Tahoe, NV, USA, 3–6 Decemeber 2012. [Google Scholar]
Figure 1.
Examples of max and average pooling.

Figure 2.
Relu activation function.

Figure 3.
Example of without cancer samples (left) and with cancer samples (right) of the dataset [18].
Figure 3.
Example of without cancer samples (left) and with cancer samples (right) of the dataset [18].

Figure 4.
Architecture of the two proposed 3D-CNN.

Figure 5.
Accuracy of the four 3D-CNN architectures over epochs.

Figure 6.
Roc curve of the four 3D-CNN architectures.


Table 1.
Summary of two proposed 3D-CNN architectures in the classification of lung CT scan images.
| Layer Type | Number of Kernels | Kernel Size | Output Size |
|---|---|---|---|
| Convolutional | 96 | 3 × 3 × 3 | 96 × 114 × 114 × 114 |
| Max pooling | 2 × 2 × 2 | 96 × 113 × 113 × 113 | |
| Convolutional | 128 | 3 × 3 × 3 | 128 × 111 × 111 × 111 |
| Convolutional | 256 | 3 × 3 × 3 | 256 × 109 × 109 × 109 |
| Max pooling | 2 × 2 × 2 | 256 × 54 × 54 × 54 | |
| Convolutional | 324 | 3 × 3 × 3 | 324 × 51 × 51 × 51 |
| Convolutional | 324 | 3 × 3 × 3 | 324 × 49 × 49 × 49 |
| Max pooling | 2 × 2 × 2 | 324 × 24 × 24 × 24 | |
| Convolutional | 512 | 3 × 3 × 3 | 512 × 12 × 12 × 12 |
| Max pooling | 2 × 2 × 2 | 512 × 6 × 6 × 6 | |
| Fully connected | 1000 × 1 × 1 × 1 | ||
| Fully connected | 1000 × 1 × 1 × 1 | ||
| Softmax/RBF-based SVM | 2 × 1 × 1 × 1 |
Table 2.
Summary of AlexNet architecture in the classification of lung CT scan images.
| Layer Type | Number of Kernels | Kernel Size | Output Size |
|---|---|---|---|
| Convolutional | 96 | 11 × 11 × 11 | 96 × 55 × 55 × 55 |
| Max pooling | 3 × 3 × 3 | 96 × 27 × 27 × 27 | |
| Convolutional | 256 | 5 × 5 × 5 | 256 × 27 × 27 × 27 |
| Max pooling | 3 × 3 × 3 | 256 × 13 × 13 × 13 | |
| Convolutional | 384 | 3 × 3 × 3 | 384 × 13 × 13 × 13 |
| Convolutional | 256 | 3 × 3 × 3 | 256 × 13 × 13 × 13 |
| Max pooling | 3 × 3 × 3 | 256 × 6 × 6 × 6 | |
| Fully connected | 4096 × 1 × 1 × 1 | ||
| Fully connected | 4096 × 1 × 1 × 1 | ||
| Fully connected with softmax | 2 × 1 × 1 × 1 |
Table 3.
Summary of GoogleNet architecture in the classification of lung CT scan images.
| Layer Type | Number of Kernels | Kernel Size | Output Size |
|---|---|---|---|
| Convolutional | 64 | 7 × 7 × 7 | 64 × 112 × 112 × 112 |
| Max pooling | 3 × 3 × 3 | 64 × 56 × 56 × 56 | |
| Convolutional | 192 | 3 × 3 × 3 | 192 × 56 × 56 × 56 |
| Max pooling | 3 × 3 × 3 | 192 × 28 × 28 × 28 | |
| Inception 3(a) | 256 × 28 × 28 × 28 | ||
| Inception 3(b) | 480 × 28 × 28 × 28 | ||
| Max pooling | 3 × 3 × 3 | 480 × 14 × 14 × 14 | |
| Inception 4(a) | 512 × 14 × 14 × 14 | ||
| Inception 4(b) | 512 × 14 × 14 × 14 | ||
| Inception 4(c) | 512 × 14 × 14 × 14 | ||
| Inception 4(d) | 528 × 14 × 14 × 14 | ||
| Inception 4(e) | 832 × 14 × 14 × 14 | ||
| Max pooling | 3 × 3 × 3 | 832 × 7 × 7 × 7 | |
| Inception 5(a) | 832 × 7 × 7 × 7 | ||
| Inception 5(b) | 1024 × 7 × 7 × 7 | ||
| Avg pooling | 7 × 7 × 7 | 1024 × 1 × 1 × 1 | |
| Fully connected | 1024 × 1 × 1 × 1 | ||
| Fully connected with softmax | 2 × 1 × 1 × 1 |
Table 4.
Comparative results of the proposed and other used models.
| Architecture | Classifier (%) | Sensitivity (%) | Precision (%) | Specificity (%) | Accuracy (%) |
|---|---|---|---|---|---|
| 3D-AlexNet | Softmax | 82.74 | 83.66 | 88.04 | 85.79 |
| 3D-GoogleNet | Softmax | 83.17 | 88.36 | 91.61 | 87.95 |
| Straight 3D-CNN | Softmax | 86.40 | 90.37 | 93.09 | 90.23 |
| Hybrid 3D-CNN | RBF-based SVM | 88.53 | 91.91 | 94.23 | 91.81 |
© 2019 by the authors. Licensee MDPI, Basel, Switzerland. This article is an open access article distributed under the terms and conditions of the Creative Commons Attribution (CC BY) license (http://creativecommons.org/licenses/by/4.0/).
Share and Cite
MDPI and ACS Style
Polat, H.; Danaei Mehr, H. Classification of Pulmonary CT Images by Using Hybrid 3D-Deep Convolutional Neural Network Architecture. Appl. Sci. 2019, 9, 940. https://0-doi-org.brum.beds.ac.uk/10.3390/app9050940
AMA Style
Polat H, Danaei Mehr H. Classification of Pulmonary CT Images by Using Hybrid 3D-Deep Convolutional Neural Network Architecture. Applied Sciences. 2019; 9(5):940. https://0-doi-org.brum.beds.ac.uk/10.3390/app9050940
Chicago/Turabian StylePolat, Huseyin, and Homay Danaei Mehr. 2019. "Classification of Pulmonary CT Images by Using Hybrid 3D-Deep Convolutional Neural Network Architecture" Applied Sciences 9, no. 5: 940. https://0-doi-org.brum.beds.ac.uk/10.3390/app9050940
Note that from the first issue of 2016, this journal uses article numbers instead of page numbers. See further details here.