Analysis of Quality Factor Enhancement in the Monolithic InGaN/GaN Nanorod Array


Department of Photonics, College of Electrical and Computer Engineering, National Chiao Tung University, 1001 Ta Hsueh Rd., Hsinchu 300, Taiwan
*
Authors to whom correspondence should be addressed.
Appl. Sci. 2019, 9(7), 1295; https://0-doi-org.brum.beds.ac.uk/10.3390/app9071295
Submission received: 17 February 2019
/
Revised: 16 March 2019
/
Accepted: 22 March 2019
/
Published: 28 March 2019
(This article belongs to the Special Issue Group III-V Nitride Semiconductor Microcavities and Microemitters)
Abstract
:Whispering gallery mode (WGM) lasers and resonators are key building blocks for photonic integrated circuits. The quality factor and resonant wavelength are strong functions of the cavity size. Nanoscale WGM cavities suffer from a low-quality factor due to prominent scattering loss. However, the quality factor could be enhanced by forming an optically-coupled rod array or photonic molecules. Through simulations, we revealed how rod-to-rod optical coupling influenced the threshold pumping level and dominant mode selection, where the trend showed good agreement with the experimental observation. According to the simulation, the quality factor could be enhanced by up to eight times by forming a six-rod photonic molecule. The quality factor and effective mode were both superior to the single rods with the same wafer device footprint.
1. Introduction
Low-loss microcavity lasers have attracted a great amount of research interest for studying fundamental light–matter interactions and their potential applications for on-chip light manipulation [1,2]. Among the different categories of microcavity lasers, whispering gallery mode (WGM) lasers possess high feasibility for use in monolithic fabrication, which is essential for large-area and high-order device integration. In order to take advantage of the total internal reflection, the cavity of a WGM laser usually possesses a full rotational symmetry, such as a microdisk, microsphere, micro-ring, or a suspended toroid, in a wide range of materials [3,4,5,6,7,8,9,10]. Cavities with very high-quality factors (Q-factor) have mostly been reported with the dimensions of tens of micrometers or larger. However, a large cavity is accompanied by narrower mode spacing, lower speed, and a larger footprint on the chip, which might not be desirable for wavelength-selective applications. The resonant wavelengths also shift with the cavity dimensions, bringing additional constraints in spectral engineering. One of the known approaches to enhance the overall Q-factor is to arrange the cavities into a certain spatial configuration for mutual resonance. Analogous to a hydrogen molecule, the coupling of two degenerate electron states will create two new states with different eigen energies. Moreover, the coupling between identical microcavities also results in new supermodes with slightly shifted resonant wavelengths. These optically-coupled microcavities are also known as “photonic molecules” (PM) [11,12,13]. Mode-coupling only causes fine-splitting in the spectrum and the resulting resonant wavelengths do not deviate much from the original, which is a strong advantage in spectral engineering. Photonic molecules consisting of identical circular or spherical cavities have been intensely studied for AlInGaP-materials or doped-silica in the near infrared region [14,15,16]. In recent years, WGM lasers with wide bandgap materials, for example ZnO and III-nitrides, have also attracted much attention due to their strong potential for observing room-temperature excitonic behaviors [17,18,19]. Due to their wurtzite crystal structure, crystallographic hexagonal nanowires or nanorods along the c-axis can be fabricated under a controlled growth condition [20,21]. There have been studies on WGM resonance criteria and mode intensity profiles within a single hexagon cross-section, however the interaction between multiple optically-coupled hexagons has rarely been discussed [22,23,24]. Recently, we experimentally revealed the excitation-area-dependent and temperature-dependent mode hopping competition in the collective lasing of optically-coupled InGaN-based nanorods [25,26]. In this paper, we conducted a semi-quantitative analysis of the influence of mutual coupling on Q-factor enhancement and its relevance to the dominant mode selection in the monolithic InGaN-GaN rod array. At the end of this paper, we suggest a highly symmetric photonic molecule consisting of six hexagon nanorods, which would balance a small mode-volume, a high-quality factor, and a low device footprint on the wafer according to the simulation results.
2. Materials and Methods
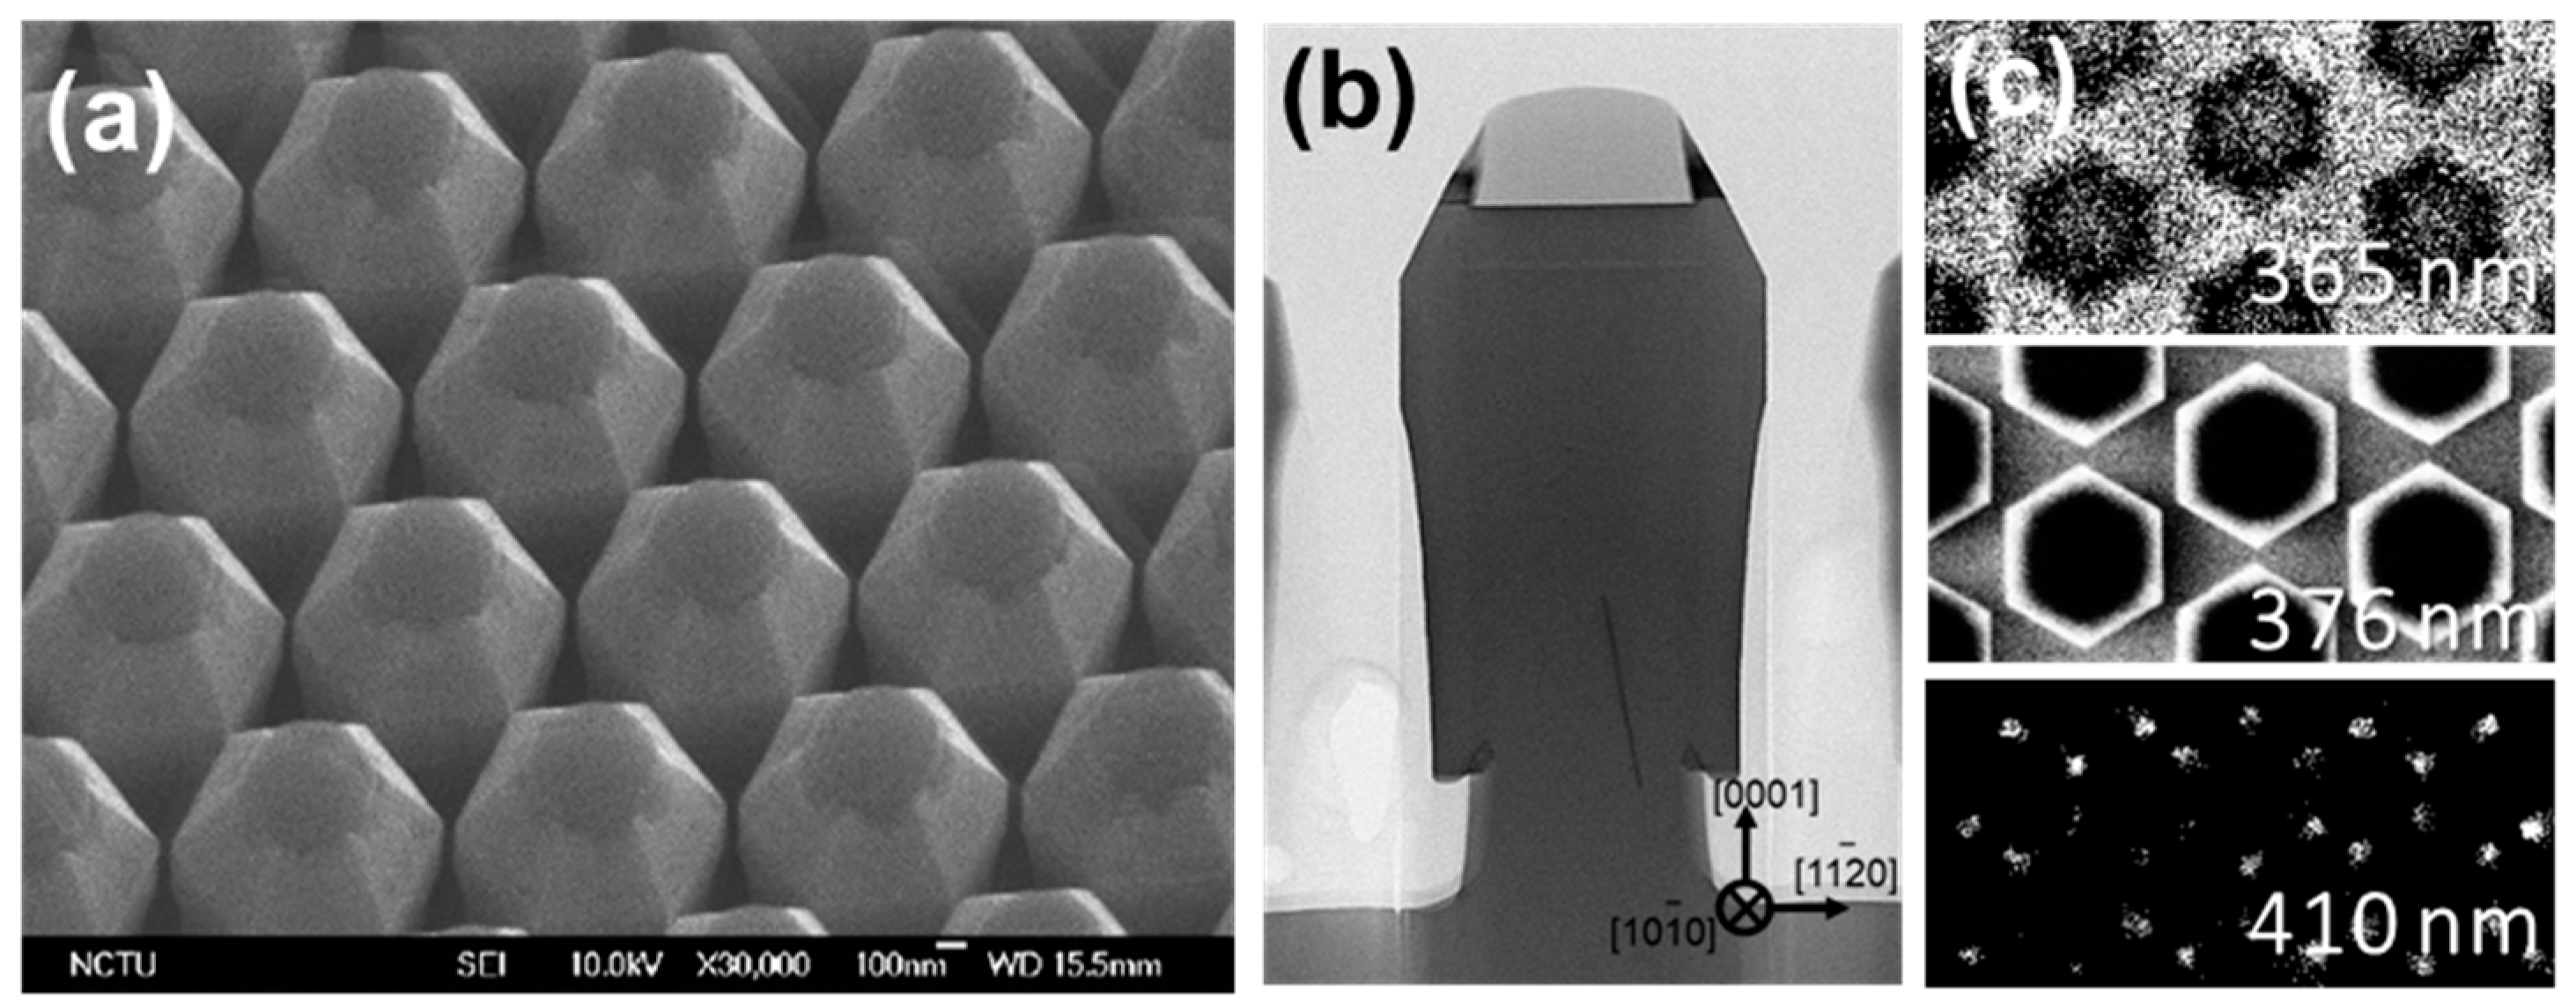
The monolithic GaN-InGaN core-shell nanorod array was fabricated via a series of pattern-and-regrowth processes. The detailed process flow can be found in [25]. The scanning electron microscopy (SEM), cross-sectional transmission electron microscopy (TEM), and monochromatic cathodoluminescence (CL) images are shown in Figure 1. The core diameter before regrowth was 400 nm wide with a period of 900 nm. After regrowth, the hexagon diagonal was estimated to be 850 nm with a minimum rod spacing of 50 nm. The shell region consisted of five pairs of InGaN/GaN multiple-quantum-wells (MQWs). The composition of the quantum wells was 3–4%. The quantum well (QW) thicknesses ranged from 0.8 nm to 1.8 nm and the barrier thickness ranged from 6 nm to 8 nm according to its position in the rods. The QW/barrier thicknesses were found to be thinner at the rod-top facets and thicker on the vertical sidewalls, which was attributed to the inherently different growth dynamics among the crystallography planes in wurtzite crystals. The 376 nm CL emission in Figure 1c came from the InGaN quantum wells in the shell region, the 365 nm emission was from the core, and the 410 nm emission was attributed to the parasitic segregation at the top corners. The sample was excited by 355 nm Nd:YVO4 pulse solid-state lasers for the photoluminescence (PL) measurement at room temperature. The excitation source was focused by a 100 times magnification objective lens. The spot size was controlled by tuning the position of the sample along the optical axis.
Two-dimensional mode simulations were conducted by commercially available software (COMSOL Multiphysics), which solved the wave equation of the electric field (E) with finite element methods. The eigen-solution can be expressed in the following form:
where E0 stands for the amplitude profile of the standing wave and ω is the complex eigen-frequency:
where ωres is the resonant frequency and γ is the damping rate of the electric field. Then, the Q-factor can be estimated by:
E(x,y,t) = E0 (x,y)*exp(iωt)
ω = ωres + iγ
Q = |ωres/2γ|
Finally, the mode intensity profile (U) can be plotted by:
U(x,y) = |E0(x,y)|2
We adopted the geometry nanorods in Figure 1 as the forming unit in the PM simulations. A single 50 nm InGaN layer was used instead of the actual 5-pair MQW structure in the shell region as a reasonable simplification for a semi-quantitative simulation study. The refractive indices for GaN and InGaN were 2.56 and 2.62, respectively. The extinction coefficients were first assumed to be zero without a loss of generality (i.e., the cold cavity case). Three-dimensional mode simulations were also conducted with the same methodology. Due to limited computational capacity, 3D simulations were only conducted for the single rod case. For the mode simulations that consisted of multiple rods, only 2D simulations were conducted. In a monolithic wurtzite crystal, the perimeters of the hexagon were surrounded by crystallographic planes, so they must be parallel to each other. Therefore, the relative orientation in the crystal between the hexagons is an essential parameter that does not exist in photonic molecules with circular disks.
3. Results
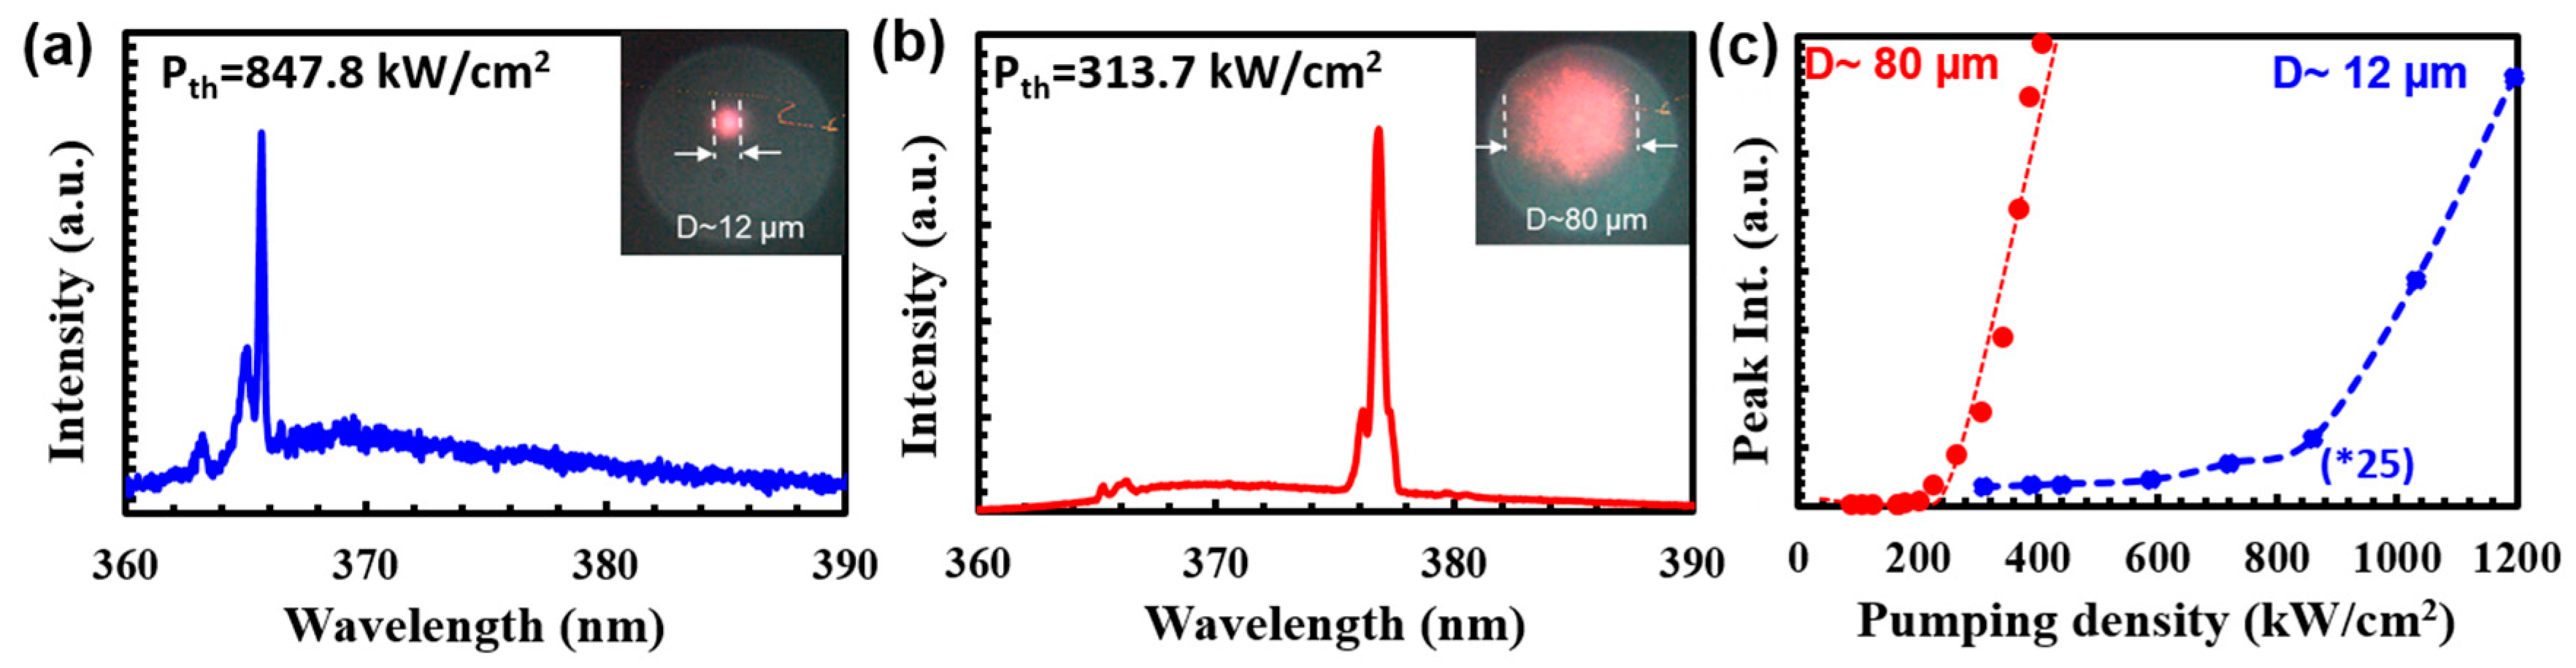
Figure 2a,b illustrated the lasing spectrum under two different excitation spot sizes, and their light–light curves are plotted in Figure 2c. Under a relatively small excitation area (diameter, D ~ 12 µm), the threshold pumping density (Pth) was as high as 847.85 kW/cm2, and the dominant lasing mode resided near 368 nm. The Pth was lowered to 313.7 kW/cm2 while the D was 80 µm. Simultaneously, the dominant modes shifted to 376 nm under a large excitation area. In other words, the Pth was reduced and the dominant lasing mode switched when more rods were included in the collective lasing. According to the CL in Figure 1c, the gain medium of 376 nm lasing was mostly found in the MQW shell region, while the gain medium of 368 nm was mostly in the core. Therefore, both modes could lase simultaneously if the pumping density was sufficiently high. A more detailed argument about the gain profile evolution with the pumping density can be found in our previous publication [26].
We attributed this excitation-area-dependent collective lasing behavior to the different extent of the side-coupling effects among the different lasing modes [25]. In our previous study, we qualitatively proved this mechanism with a truncated rod experiment where we removed the rods mechanically by blades and then attached them manually to a foreign SiO2 template by gently smearing them on it. The SiO2 template was thermally oxidized from Si substrates. While the rods were put on SiO2, the 376 nm lasing mode was strongly suppressed. As the long wavelength mode had a stronger coupling to the SiO2 template, its optical energy leaked out more easily than the short wavelength modes [25]. In this publication, we performed a semi-quantitative analysis to prove this mechanism with mode simulations.
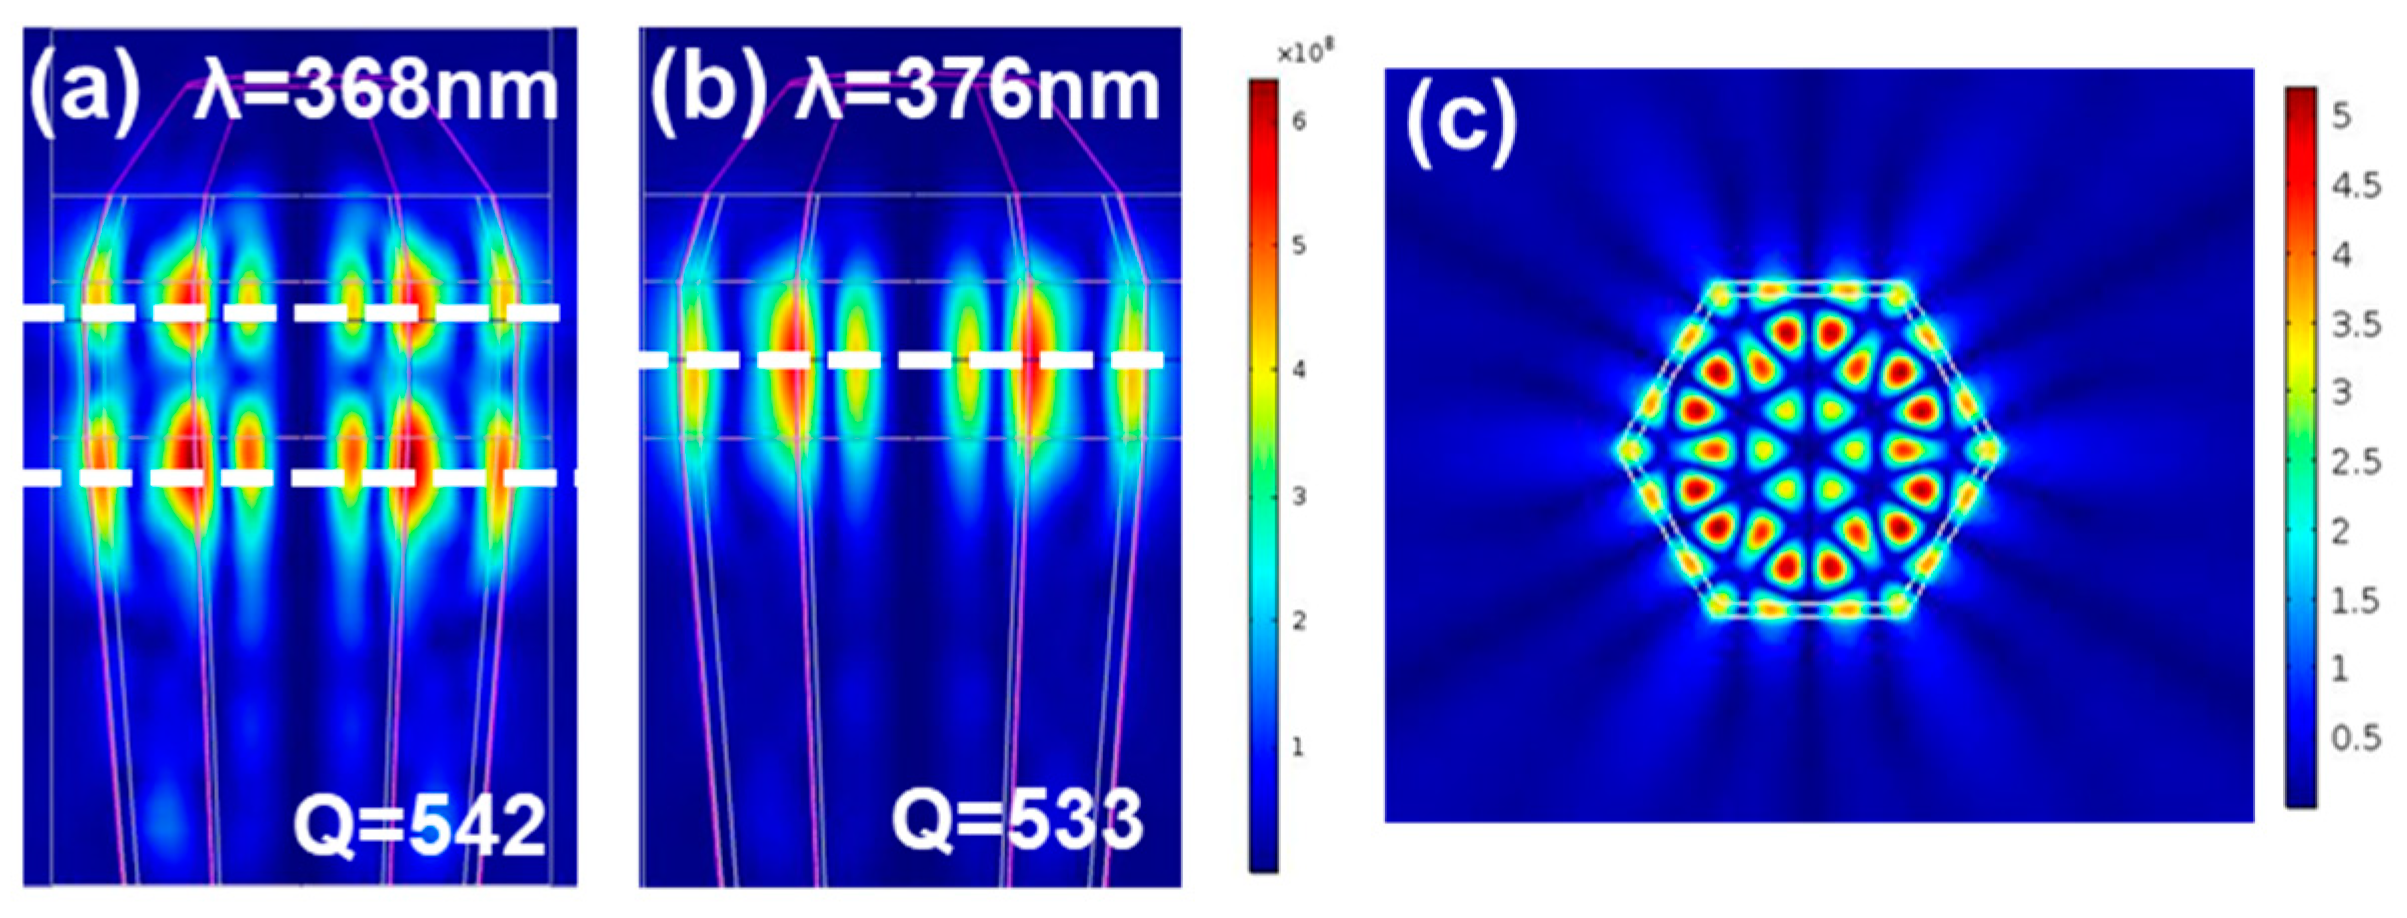
A 3D model was built according to the actual rod geometry acquired in Figure 1. The energy profile of the two representative modes is illustrated in Figure 3. The 368 nm mode (Figure 3a) had a one node plane along the rod axis while the 376 nm mode (Figure 3b) had none. In the cross-section planes with local maximum intensity (white dashed lines), the energy profiles were all similar to that in Figure 3c. As the Q-factors of either mode were similar (Q = 533 or 542), both modes were competitive to each other in the single rod case. Therefore, the Pth variation and dominant mode selection phenomena could not be explained by their original Q-factors. In the collective lasing, the coupling effects between adjacent rods need to be taken into account.
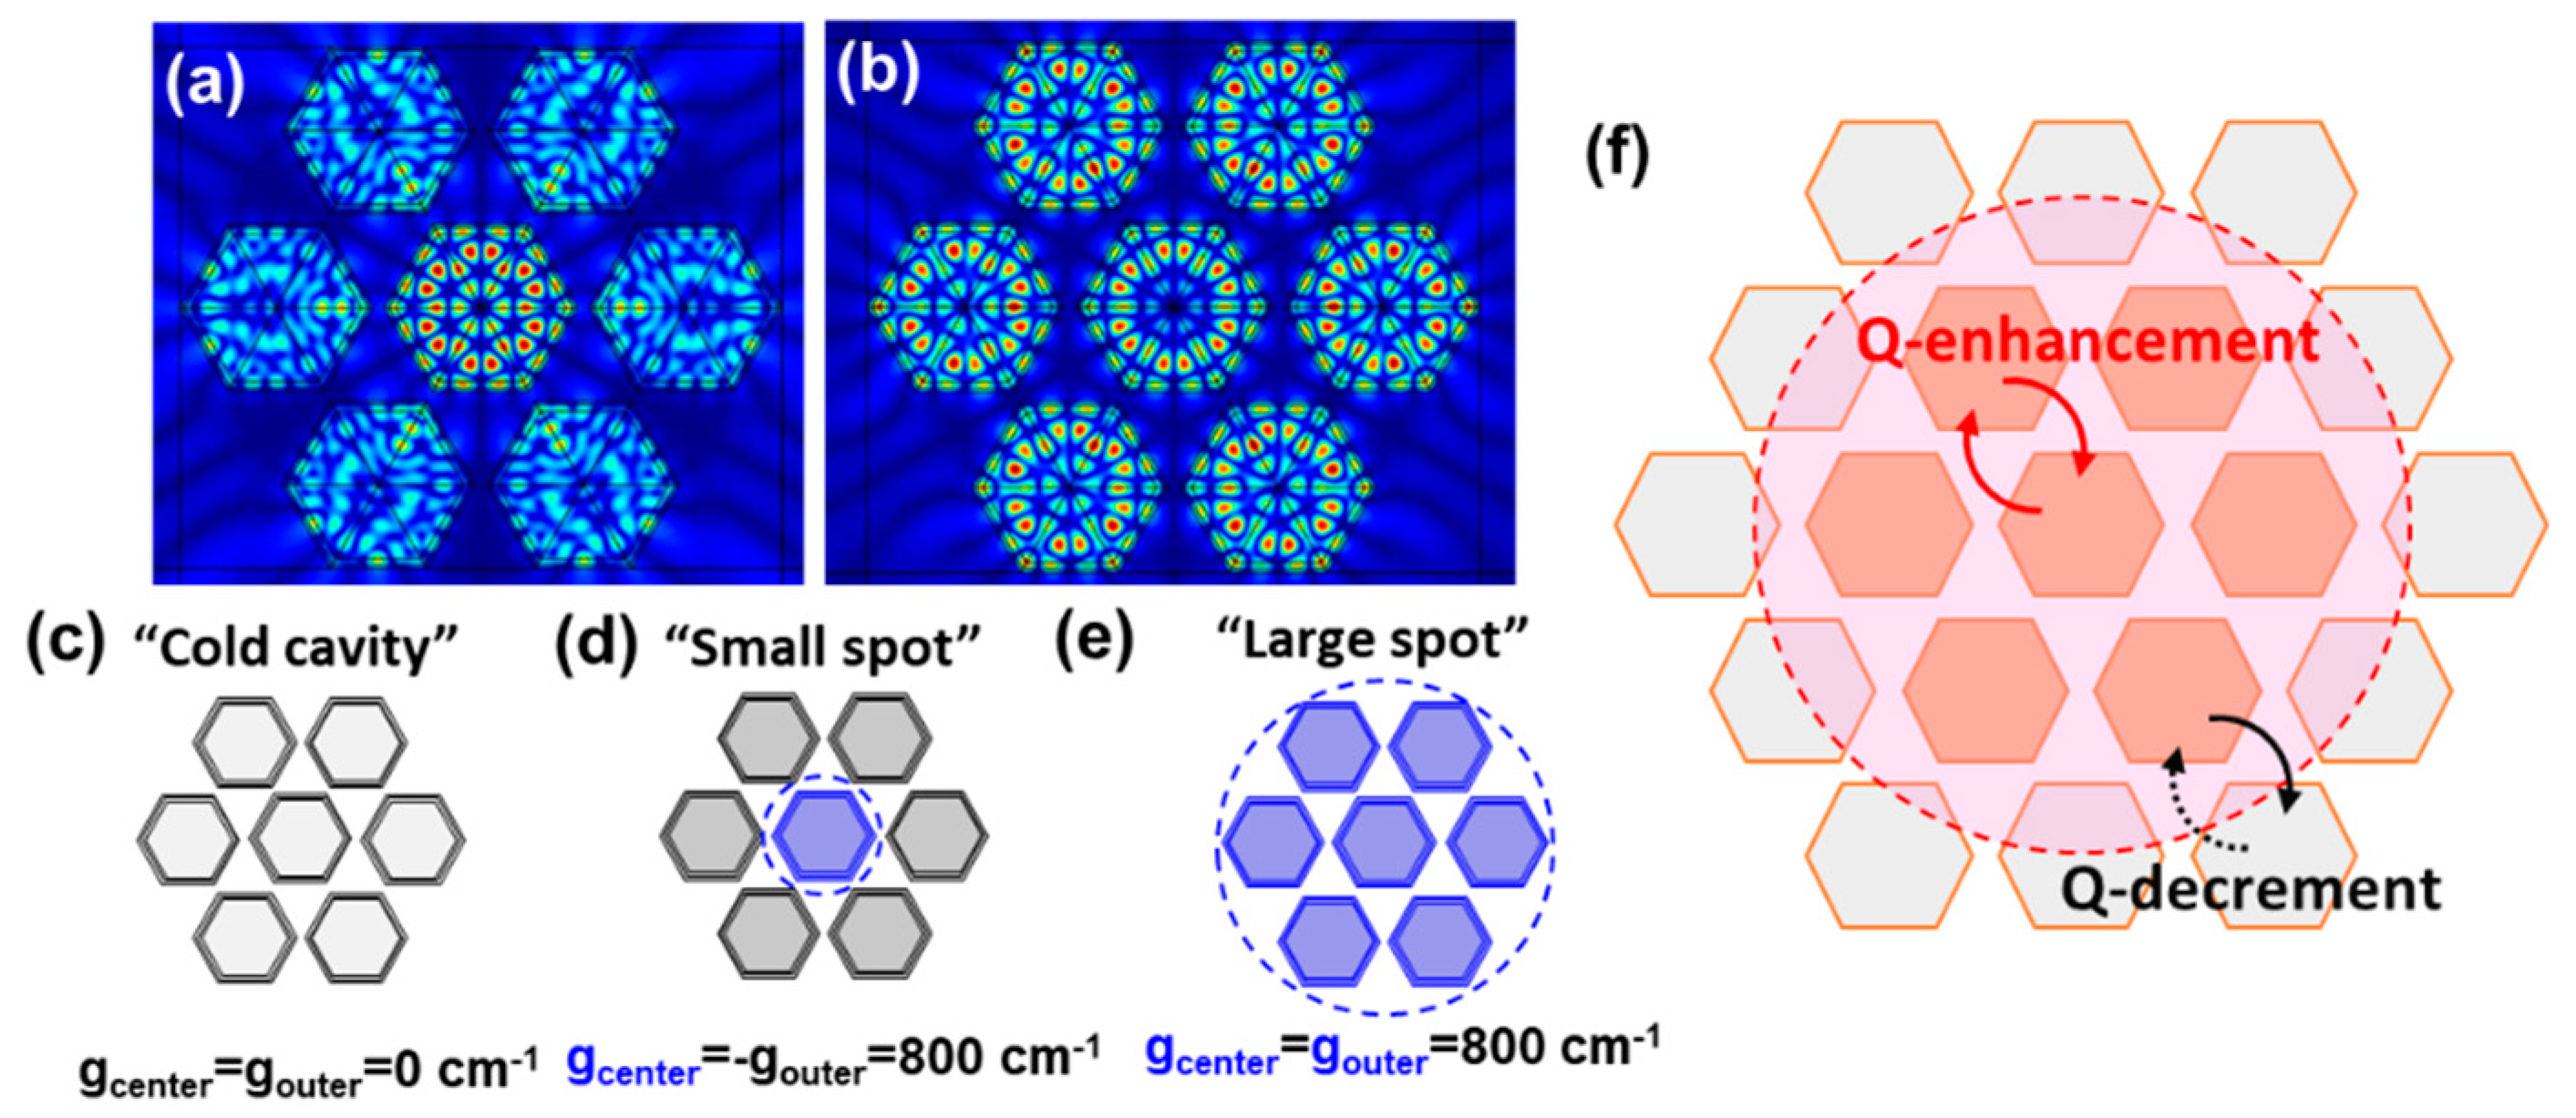
To study the side coupling effects to the Q-factors, we formed a 2D seven-rod photonic molecule as depicted in Figure 4a–e. Six rods surrounded the central one with a six-fold rotational symmetry. The rods were aligned along the hexagon diagonals with a 50 nm corner-to-corner distance. Assuming the intensity profile of the central rod is invariant to Figure 3c, where two different supermodes resulted due to the interaction between the outer rods to the central one. Figure 4a is the intensity profile when the outer rods were weakly coupled to the central one. The photons leaking out of the central rod were partly recycled by the outer rods, but did not oscillate in the same way. Therefore, the optical energy was mostly restored only in the central rod. On the other hand, Figure 4b illustrates the profile when all rods were strongly coupled to each other and the mode intensities of all rods were similar. For convenience, we named Figure 4a as the “weakly-coupled” PM mode and Figure 4b as the “strongly-coupled” PM mode.
To simulate the response of the PM modes to the different excitation scenarios, three different optical gain settings were applied. For the cold cavity case as depicted in Figure 4c, the optical gain of all rods was set at zero as the reference. However, because the material gain spectrum actually covered the PM modes’ eigen frequencies, the material gain is a function of pumping density. We assumed a pumping power density that gave the excited rods an optical gain of g = 800 cm−1. Without a loss of generality, we also assumed that the rods were weakly absorbing and the absorption coefficient was α = −g = 800 cm−1 if it was not sufficiently pumped. Simultaneously, Figure 4d simulated the case when only the center rod of the PM was pumped, i.e., the small spot case. Figure 4e shows the case when all rods were equally pumped under a large spot. The simulated Q-factors of two PM modes under three pumping scenarios are summarized in Table 1.
The Q-factors under the cold cavity condition (Qcold) of the weakly-coupled and strongly-coupled PM was 241 and 448, respectively. Since the PM mode simulations were only two dimensional, the absolute quantity of Qs might not be in full agreement with those three-dimensional simulations in Figure 3. However, the Q-factor response under different excitation scenarios still provided a significant insight. Under the small spot condition, the Q-factor (Qsmall) of the weakly-coupled PM was reduced by 1% when compared to Qcold, while that of the strongly-coupled PM was reduced by 35%. On the other hand, the Q factor of the strongly-coupled PM under the large spot (Qlarge) was enhanced by 495%, while the Q factor of the weakly-coupled one was only enhanced by 75%. In a nutshell, coupling with adjacent excited or unexcited rods will enhance or decrease the overall Q-factor respectively, as depicted in Figure 4f, and the response was stronger for the strongly-coupled PM modes. A similar argument can also be applied to the PM consisting of more rods. As the excitation area increases, the number of paired interactions between the excited rod will also increase, which yields a greater enhanced overall Q-factor. Since a higher Q-factor is an equivalent statement of a lower threshold pumping density, the significant enhancement from Qsmall to Qlarge explains the dramatic Pth reduction from Figure 2a to Figure 2b.
As the 376 nm mode and 368 nm mode had the same transverse mode profile, this simulation was applied to both lasing wavelengths. To explain the dominant-mode switch phenomena, we needed to consider the different coupling strengths among the different modes. As the 376 nm mode was in the fundamental axial mode and its maximum intensity plane lay in the rod cross-section with a maximum-width, its mode interaction to adjacent rods will be stronger than that of the 368 nm mode. Therefore, we can analogize the 368 nm and 376 nm lasing to the weakly-coupled and strongly-coupled PM modes in Figure 4, respectively. Consider when the 376 nm and 368 nm supermodes have very close Pths under a given diameter of the excited area, D’. When D < D’, the 368 nm supermode will dominate due to a smaller decrement of the Q-factor. Vice versa, when D > D’, the 376 nm supermode will dominate due to a more dramatic increment of the Q-factor. The simulation results also had good agreement with experimental observation.
4. Discussion
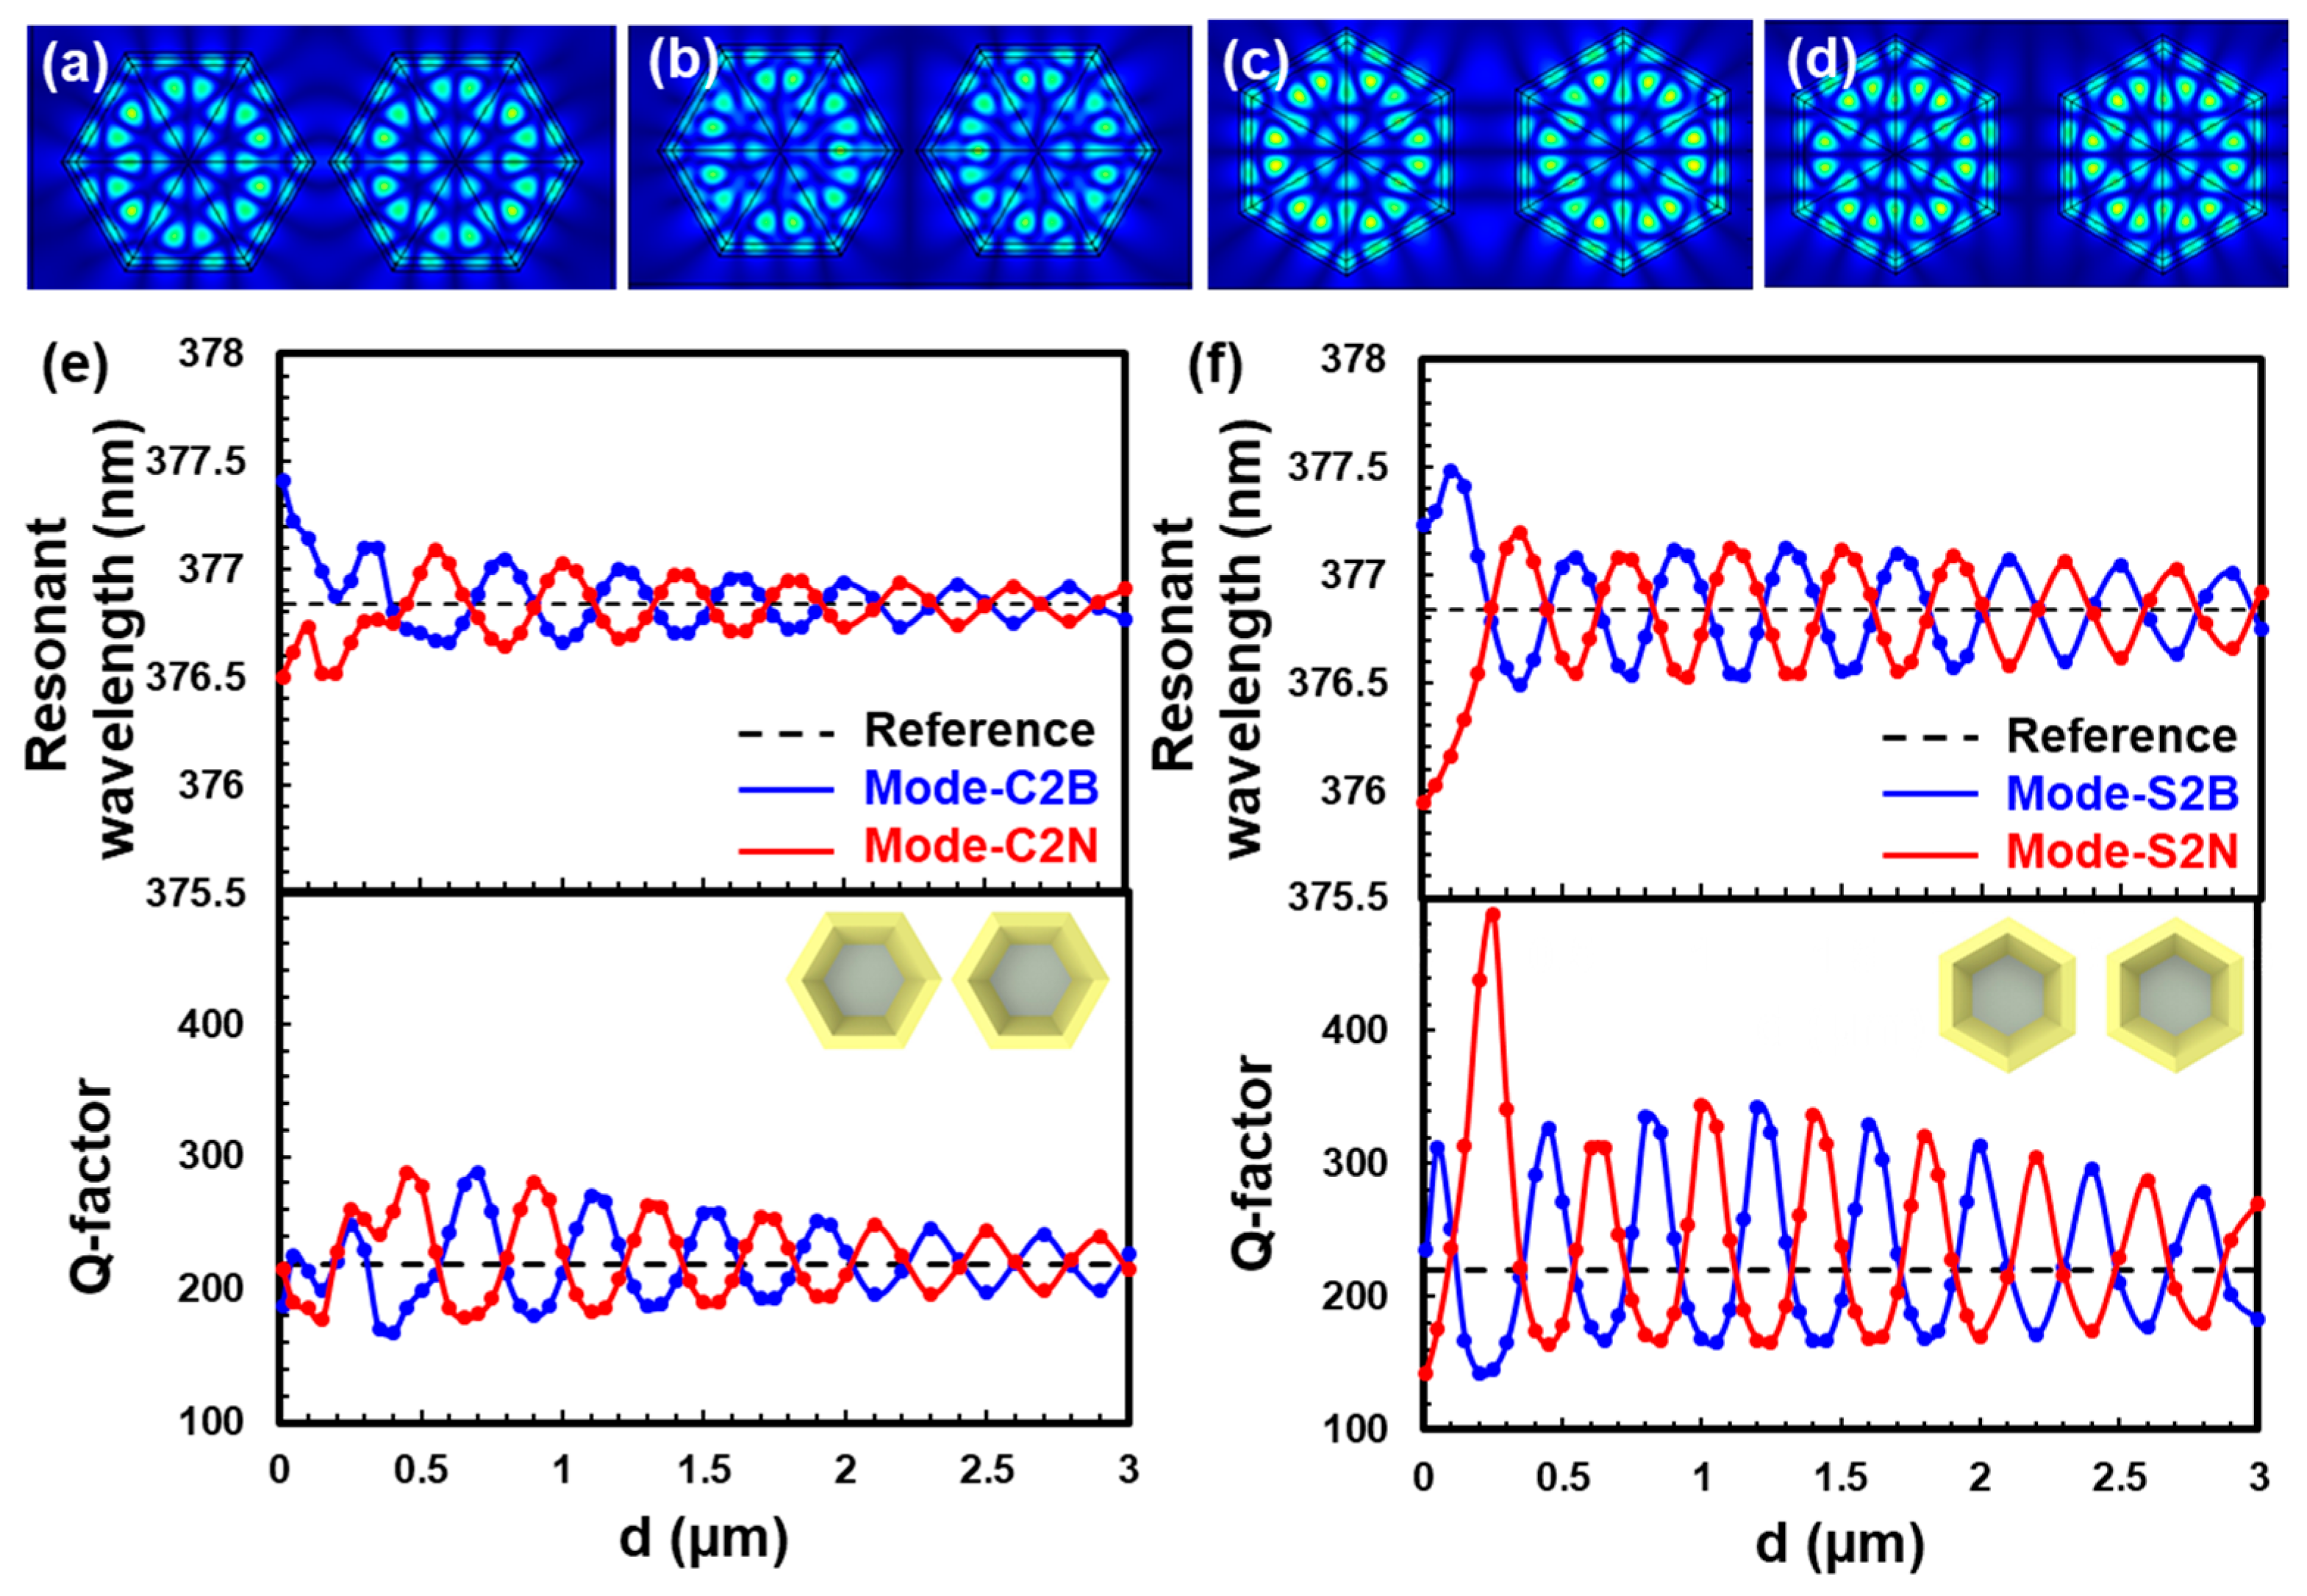
The mutual coupling between rods has a strong influence on the overall threshold pumping density of a PM, but not always in a positive trend. To design a low threshold PM that is also practical for actual devices, all rods in the PM have to be uniformly excited. An effective coupling with peripheral unexcited rods will only increase the threshold pumping density. Therefore, a well-coupled PM with a confined device footprint is more practical than a large-area two-dimensional rod array for practical implementation. Furthermore, the hexagons do not possess a full rotational symmetry like that of the microdisks or micro-rings. The relative orientation between adjacent rods also plays an important role in forming PMs in the monolithic wurtzite crystal. For example, Figure 5a–d showed four different kinds of supermode in a hexagon dimer. The rods in Figure 5a,b were aligned along the [100] direction (or a-axis) while those in Figure 5c,d were along the [110] direction, (or m-axis) in the wurtzite crystal. In each configuration, the evanescent interaction further split into two supermodes, forming optical bonds or node planes in the middle of two rods. For the sake of brevity, we coded the supermodes with three digits: The first letter illustrated the relative orientation among each cavity, which could be either corner-to-corner (C) or side-to-side (S); the second digit was the number of cavities in the photonic molecules; and the last digit described the type of evanescent field interaction between adjacent cavities, which could be either bond-like (B) or node-like (N). For example, the supermodes from Figure 5a–d were coded as C2B, C2N, S2B, and S2N, respectively.
Figure 5e,f illustrate the λ and Q-factor response to the minimum distance d between two rods. Figure 5e is the summary for the dimer with C-configuration. When the hexagons were in a subwavelength proximity (D < 200 nm), the formation of optical-bonds caused a resonance wavelength redshift, while forming an optical node plane resulted in a blueshift to the reference of a singular hexagon. As d increased, the spectral splitting gradually decreased to zero and then the sign changed when d > 450 nm. As d further increased, both λ’s oscillated sinusoidally with a diminishing amplitude. This damped oscillation characteristic originated from the mutual interference of the evanescent fields. The strength of the interacting evanescent field became weak as d increased, resulting in a gradual decoherence in the space. A similar damped oscillation also occurred in the Q-factor. It is worth noting that forming a photonic molecule does not guarantee an enhanced Q-factor for a particular supermode. If the evanescent field “outside” the photonic molecule is strengthened under mutual resonance, the photons are actually more likely to be scattered. Fortunately, when the Q-factor of one supermode is beneath the reference under a given d, the other one will surpass it. Therefore, we can still say that forming a photonic molecule helps enhance the overall Q-factor. Figure 5f is the same summary as Figure 3a, but for the side-to-side configuration. The dependence of λ and the Q-factor on d were similar, but the oscillation amplitude was higher in Figure 3b. We attributed the stronger response in λ and Q-factor simply due to a higher overlap of the evanescent field from each cavity. The maximum Q-factor took place in mode S2N, which was 2.2 times higher than that of the single rod case. The comparison further justified the necessity of considering the relative orientations for photonic molecules in a monolithic wurtzite crystal.
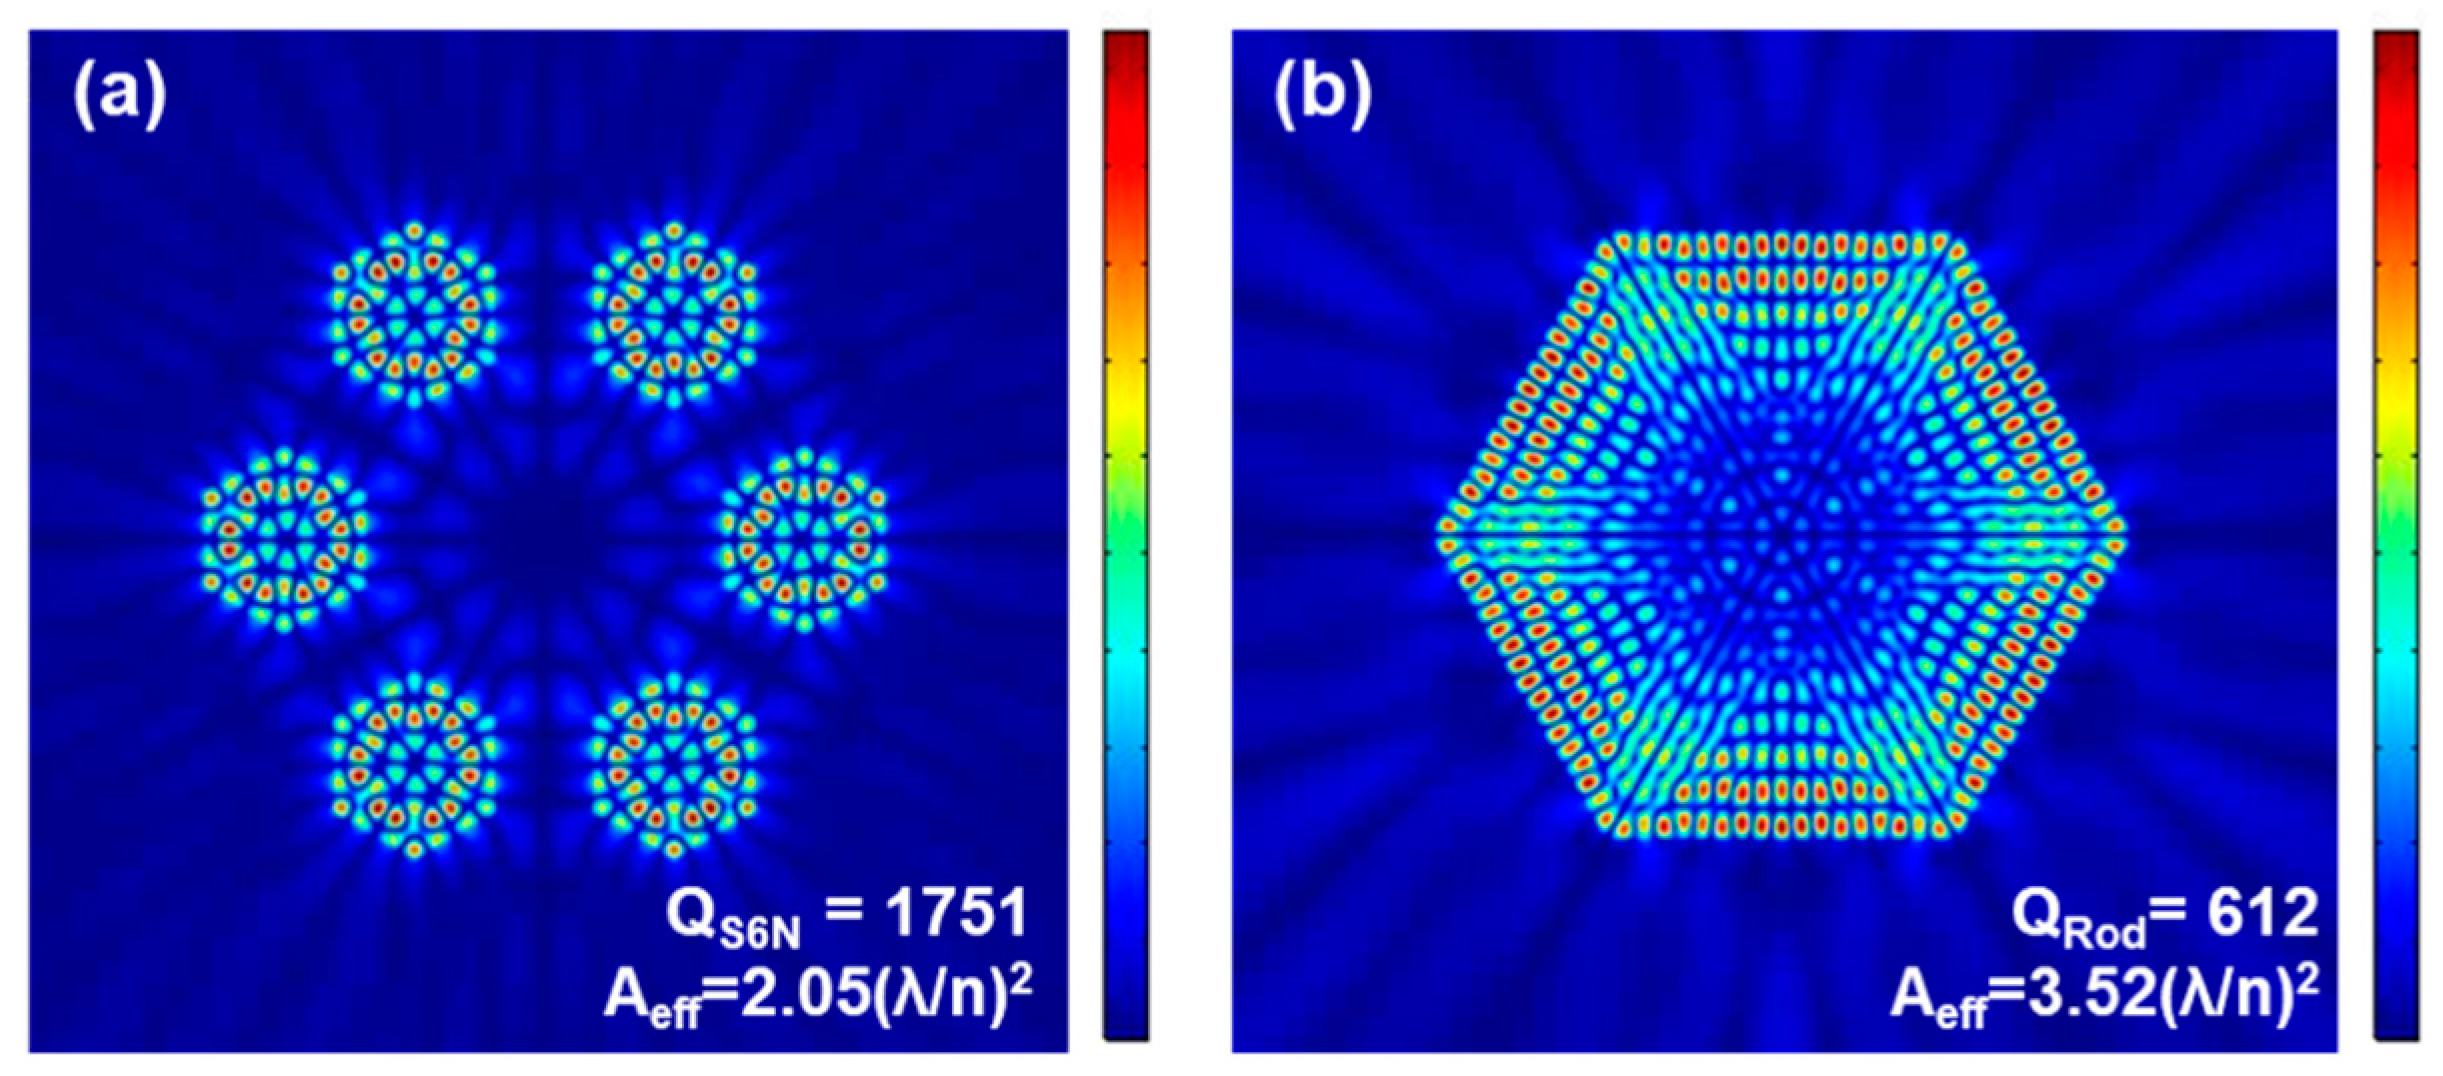
As a result, we could enhance the Q-factor by optimizing the PM’s orientation and rod-to-rod spacing rather than by only varying the rod size. Figure 6a illustrates an optimized PM whose Q-factor was around eight times higher than the reference value (QS6N = 1751). The supermode was noted as mode S6N according to the given naming rule, and the minimum rod-to-rod spacing was 300 nm. The evanescent field of each cavity in Figure 6a was squeezed by the node planes, which suppressed photons from leaking out of the PM. Furthermore, the overall lateral dimension was less than 3 µm, whose footprint was still much smaller than most of the reported microdisk WGM lasers. Figure 6b shows another single hexagon cavity whose footprint and resonance wavelength were both close to the PM in Figure 6a. However, the Q-factor was only 34% of the optimized QS6N. Additionally, the PM also possessed a reduced effective mode area (Aeff) rather than a single large rod. Therefore, a much-improved Purcell factor can be expected since its quantity is proportional to the Q/Aeff.
5. Conclusions
In conclusion, we explained the collective lasing behavior in an InGaN-based hexagon rod array by mode simulations. The strength of the mode interactions had a strong impact on the overall quality factor and dominant mode selection. Furthermore, we also found that an optimized PM with small hexagon cavities had superior device characteristics to a single hexagon cavity in both pumping threshold and speed. Such PMs have strong potential for miniaturizing the active devices in III-nitride-based monolithically photonic integrated circuits.
Author Contributions
Conceptualization, C.-Y.H.; methodology, C.-Y.H., K.-B.H., and T.-C.L.; software, T.-C.L.; validation, T.-Y.T.; formal analysis; C.-Y.H. and T.-Y.T.; resources, H.-C.K.; writing, C.-Y.H.; visualization, T.-Y.T. and K.-B.H.; supervision, C.-Y.H.; project administration, C.-Y.H.; funding acquisition, C.-Y.H. and H.-C.K.
Funding
This research received no external funding.
Acknowledgments
This research was funded by the Ministry of Science and Technology (MoST) of Taiwan, under the project contact number 106-2221-E-009-119.
Conflicts of Interest
The authors declare no conflict of interest.
References
- Vahala, K.J. Optical microcavities. Nature 2003, 424, 839–846. [Google Scholar] [CrossRef]
- Ilchenko, V.S.; Matsko, A.B. Optical resonators with whispering-gallery modes—Part II: Applications. IEEE J. Sel. Top. Quantum Electron. 2006, 12, 15–31. [Google Scholar] [CrossRef]
- McCall, S.L.; Levi, A.F.J.; Slusher, R.E.; Pearton, S.J.; Logan, R.A. Whispering-gallery mode microdisk lasers. Appl. Phys. Lett. 1992, 60, 289–291. [Google Scholar] [CrossRef]
- Sandoghdar, V.; Treussart, F.; Hare, J.; Lefèvre-Seguin, V.; Raimond, J.M.; Haroche, S. Very low threshold whispering-gallery-mode microsphere laser. Phys. Rev. A 1996, 54, R1777–R1780. [Google Scholar] [CrossRef]
- Cao, H.; Xu, J.Y.; Xiang, W.H.; Ma, Y.; Chang, S.H.; Ho, S.T.; Solomon, G.S. Optically pumped InAs quantum dot microdisk lasers. Appl. Phys. Lett. 2000, 76, 3519–3521. [Google Scholar] [CrossRef]
- Armani, D.K.; Kippenberg, T.J.; Spillane, S.M.; Vahala, K.J. Ultra-high-Q toroid microcavity on a chip. Nature 2003, 421, 925–928. [Google Scholar] [CrossRef] [PubMed]
- Polman, A.; Min, B.; Kalkman, J.; Kippenberg, T.J.; Vahala, K.J. Ultralow-threshold erbium-implanted toroidal microlaser on sillcon. Appl. Phys. Lett. 2004, 84, 1037–1039. [Google Scholar] [CrossRef]
- Tomboli, C.; Haberer, E.D.; Sharma, R.; Lee, K.H.; Nakamura, S.; Hu, E.L. Room-temperature continuous-wave lasing in GaN/InGaN microdisks. Nat. Photonics 2007, 1, 61–64. [Google Scholar] [CrossRef]
- Zhu, Y.; Qin, F.F.; Guo, J.Y.; Xu, C.X.; Wang, Y.J. Unidirectional ultraviolet whispering gallery mode lasing from floating asymmetric circle GaN microdisk. Appl. Phys. Lett. 2017, 111, 202103. [Google Scholar] [CrossRef]
- Zhang, H.; Liao, Q.; Wu, Y.; Zhang, Z.; Gao, Q.; Liu, P.; Li, M.; Yao, J.; Fu, H. 2D Ruddlesden-popper perovskites microring laser array. Adv. Mater. 2018, 30, 1706186. [Google Scholar] [CrossRef]
- Bayer, M.; Gutbrod, T.; Reithmaier, J.P.; Forchel, A.; Reinecke, T.L.; Knipp, P.A.; Dremin, A.A.; Kulakovskii, V.D. Optical modes in photonic molecules. Phys. Rev. Lett. 1998, 81, 2582–2585. [Google Scholar] [CrossRef]
- Hara, Y.; Mukaiyama, T.; Takeda, K.; Kuwata-Gonokami, M. Photonic molecule lasing. Opt. Lett. 2003, 28, 2437–2439. [Google Scholar] [CrossRef] [PubMed]
- Nakagawa, A.; Ishii, S.; Baba, T. Photonic molecule laser composed of GaInAsP microdisks. Appl. Phys. Lett. 2005, 86, 041112. [Google Scholar] [CrossRef]
- Smith, D.D.; Chang, H.; Fuller, K.A. Whispering-gallery mode splitting in coupled microresonators. J. Opt. Soc. Am. B 2003, 9, 1967–1974. [Google Scholar] [CrossRef]
- Smotrova, E.I.; Nosich, A.I.; Benson, T.M.; Sewell, P. Threshold reduction in a cyclic photonic molecule laser composed of identical microdisks with whispering-gallery modes. Opt. Lett. 2006, 31, 921–923. [Google Scholar]
- Boriskina, S.V. Theoretical prediction of a dramatic Q-factor enhamcement and degeneracy removal of whispering gallery modes in symmetrical photonic molecules. Opt. Lett. 2006, 31, 338–340. [Google Scholar] [CrossRef] [PubMed]
- Chen, R.; Ling, B.; Sun, X.W.; Sun, H.D. Room temperature excitonic whisperong gallery mode lasing from high-quality hexagonal ZnO microdisks. Adv. Mater. 2001, 23, 2199. [Google Scholar] [CrossRef] [PubMed]
- Hangleiter, A.; Jin, Z.; Gerhard, M.; Kalincev, D.; Langer, T.; Bremers, H.; Rossow, U.; Koch, M.; Bonn, M.; Turchinovich, D. Efficient formation of excitons in a dense electron-hole plasma at room temperature. Phys. Rev. B 2015, 92, 241305. [Google Scholar] [CrossRef]
- Tao, R.; Kamide, K.; Arita, M.; Kako, S.; Arakawa, Y. Room-temperature observation of trapped exciton-polariton emission in GaN/AlGaN microcavities with air-gap/III-nitride distributed bragg reflectors. ACS Photonics 2016, 3, 1182–1187. [Google Scholar] [CrossRef]
- Park, W.I.; Kim, D.H.; Jung, S.W.; Yi, G.C. Metalorganic vapor-phase epitaxial growth of vertically well-aligned ZnO nanorods. Appl. Phys. Lett. 2002, 80, 4232–4234. [Google Scholar] [CrossRef]
- Hersee, D.; Sun, X.; Wang, X. The controlled growth of GaN nanowires. Nano Lett. 2011, 6, 1808–1811. [Google Scholar] [CrossRef] [PubMed]
- Nobis, T.; Kaidashev, E.M.; Rahm, A.; Lorenz, M.; Grundmann, M. Whispering gallery modes in nanosized dielectric resonators with hexagonal cross section. Phys. Rev. Lett. 2004, 93, 103903. [Google Scholar] [CrossRef] [PubMed]
- Hauschild, R.; Kalt, H. Guided modes in ZnO nanorods. Appl. Phys. Lett. 2006, 89, 123107. [Google Scholar] [CrossRef]
- Tran, T.T.D.; Chen, R.; Ng, K.W.; Ko, W.S.; Lu, F.; ChangHasnain, C.J. Three-dimensional whispering gallery modes in InGaAs nanoneedle lasers on silicon. Appl. Phys. Lett. 2014, 105, 111105. [Google Scholar] [CrossRef]
- Huang, Y.; Lin, J.J.; Chang, T.C.; Liu, C.Y.; Tai, T.Y.; Hong, K.B.; Lu, T.C.; Kuo, H.C. Collective lasing behavior of monolithic GaN-InGaN core-shell nanorod lattice under room temperature. Nano Lett. 2017, 17, 6228–6234. [Google Scholar] [CrossRef]
- Huang, Y.; Tai, T.Y.; Lin, J.J.; Chang, T.C.; Liu, C.Y.; Lu, T.C.; Wu, Y.R.; Kuo, H.C. Mode-hopping phenomena in the InGaN-based core–shell nanorod array collective lasing. ACS Photonics 2018, 5, 2724–2729. [Google Scholar] [CrossRef]
Figure 1.
(a) The bird-view scanning electron microscopy; (b) cross-sectional transmission electron microscopy; (c) top view monochromatic cathodoluminescence images of the GaN-InGaN core-shell array.
Figure 1.
(a) The bird-view scanning electron microscopy; (b) cross-sectional transmission electron microscopy; (c) top view monochromatic cathodoluminescence images of the GaN-InGaN core-shell array.

Figure 2.
The lasing spectrum under 1.5 times of the threshold pumping density (Pth), where the diameter of the laser spot was (a) 12 µm and (b) 80 µm. The Pth value and optical microscopic image are the insets. (c) The light–light curves with D ~ 12 µm (blue) and D ~ 80 µm (red). The intensity under small spot excitation was multiplied 25 times intentionally for figure clarity.

Figure 3.
The side-view mode intensity profile of the (a) 368 nm and (b) 376 nm mode in a single rod whose geometry followed the parameters extracted from SEM and TEM images of Figure 1; (c) the mode intensity profile acquired from the white dashed line cross-sections in (a,b).
Figure 3.
The side-view mode intensity profile of the (a) 368 nm and (b) 376 nm mode in a single rod whose geometry followed the parameters extracted from SEM and TEM images of Figure 1; (c) the mode intensity profile acquired from the white dashed line cross-sections in (a,b).

Figure 4.
The mode intensity profiles of the (a) weakly-coupled mode and (b) strongly-coupled mode in the 6-fold symmetric seven-rod photonic molecules (PM). The optical gain parameter setting of rods in a (c) cold cavity, (d) small spot, and (e) large spot scenario. (f) An illustration of the influence of rod-to-rod coupling on the overall high-quality factors (Q-factor). The pink circle represents the excitation area.

Figure 5.
(a–d) show the intensity profiles of a two-rod PM with two relative orientations and two type mode interaction. The dependence of the Q-factor and resonant wavelength on the rod-to-rod spacing, (d) while two rods were aligned (e) corner-to-corner and (f) side-to-side. The black dashed line marked the reference value from a single rod.

Figure 6.
The intensity profiles of (a) a PM consisting of a 6-nanorod whose rod-to-rod spacing was optimized for a maximum Q-factor; (b) a 2.8 µm wide microrod whose device footprint and resonant wavelength were both close to those of (a).
Figure 6.
The intensity profiles of (a) a PM consisting of a 6-nanorod whose rod-to-rod spacing was optimized for a maximum Q-factor; (b) a 2.8 µm wide microrod whose device footprint and resonant wavelength were both close to those of (a).


Table 1.
The Q-factors of PM modes under different parameter settings.
| Weakly-Coupled PM | Strongly-Coupled PM | |
|---|---|---|
| Qcold | 241 | 448 |
| Qsmall/Qcold | 99% | 65% |
| Qlarge/Qcold | 175% | 595% |
© 2019 by the authors. Licensee MDPI, Basel, Switzerland. This article is an open access article distributed under the terms and conditions of the Creative Commons Attribution (CC BY) license (http://creativecommons.org/licenses/by/4.0/).
Share and Cite
MDPI and ACS Style
Huang, C.-Y.; Tai, T.-Y.; Hong, K.-B.; Kuo, H.-C.; Lu, T.-C. Analysis of Quality Factor Enhancement in the Monolithic InGaN/GaN Nanorod Array. Appl. Sci. 2019, 9, 1295. https://0-doi-org.brum.beds.ac.uk/10.3390/app9071295
AMA Style
Huang C-Y, Tai T-Y, Hong K-B, Kuo H-C, Lu T-C. Analysis of Quality Factor Enhancement in the Monolithic InGaN/GaN Nanorod Array. Applied Sciences. 2019; 9(7):1295. https://0-doi-org.brum.beds.ac.uk/10.3390/app9071295
Chicago/Turabian StyleHuang, Chia-Yen, Tzu-Ying Tai, Kuo-Bin Hong, Hao-Chung Kuo, and Tien-Chang Lu. 2019. "Analysis of Quality Factor Enhancement in the Monolithic InGaN/GaN Nanorod Array" Applied Sciences 9, no. 7: 1295. https://0-doi-org.brum.beds.ac.uk/10.3390/app9071295
Note that from the first issue of 2016, this journal uses article numbers instead of page numbers. See further details here.