Impact of Structural Parameters on the Auditory Perception of Musical Sounds in Closed Spaces: An Experimental Study

1
School of Marine Science and Technology, Northwestern Polytechnical University, Xi’an 710072, China
2
Xi’an ACT Acoustic Science and Technology Co., Ltd, Xi’an 710072, China
*
Author to whom correspondence should be addressed.
Appl. Sci. 2019, 9(7), 1416; https://0-doi-org.brum.beds.ac.uk/10.3390/app9071416
Submission received: 21 February 2019
/
Revised: 23 March 2019
/
Accepted: 31 March 2019
/
Published: 4 April 2019
(This article belongs to the Special Issue Psychoacoustic Engineering and Applications)
Abstract
:Featured Application
This work is closely related to the binaural auralization, such as sound reduction in virtual reality.
Abstract
This study attempts to investigate the impact of structural parameters (volume, shape, and the wall absorption coefficient) in closed space on the auditory perception of three different musical sound types. With binaural audibility technology and room impulse response measurement (RIR), this paper first verifies the reliability of using ODEON software in simulating simplified closed-space auditory scenes. Then, 96 music binaural signals produced in eight simulated closed spaces with different structural parameters are synthesized. Finally, auditory perception experiment is conducted on the synthesized binaural signals by using pair comparison method, and variance analysis is also made on the experimental results. It is concluded that (1) a hemispherical cabin with a small volume and large wall sound absorption coefficient is most suitable for playing a single instrument, such as the flute or violin, and (2) a cabin with large volume is suitable for playing multiple instruments music such as symphony, but the walls should not be totally reflective. The experimental scheme and results of current study provide guidance for designing the inner structure of the concert hall to achieve preferable auditory perception in practice.
1. Introduction
The human auditory system can sense and process sound information directly related to spatial structure parameters and, on this basis, assess the sound quality of the spatial sound field. Sandvad [1] found that listeners can accurately identify the room from which the sound comes among a large number of different room pictures based on the indoor sound field binaural signals played back via acoustic devices. McGrath [2] found that both listeners with normal vision (both eyes covered) and blind listeners can identify the size of the indoor space through their own voices and other occasional sounds in the room. Blind listeners can complete the hearing tasks more quickly and accurately [3]. Therefore, in-depth research on the impact of the structural parameter on the auditory perception is of great significance, and can both explore human spatial auditory mechanism as well as test the effectiveness of the auditory virtual simulation technology.
Theoretically, the above research on subjective evaluation should be conducted by playing sound samples in different rooms with variable structural parameters, such as volume, shape, and wall absorption coefficient. However, this is usually inefficient due to the requirements for experimental environments and time-consuming in practice. As a result, the virtual sound synthesis technology and acoustic software have occurred to meet the practical requirement, by which the acoustic signals generated at different receiving points in the rooms can be simulated. After that, subjective experiments can be conducted, and the impacting rules of changed structural parameters on auditory perception can be explored.
With the help of digital signal processing and binaural technology, which is an actual reproduction of sounds receiving in the listener’s eardrum, acoustic signals generated in real rooms can be synthesized without experimental measurement. Therefore, psychoacoustic experimental research in complex auditory environments, such as concert halls, can be conducted simulatively. By simulating the auditory scene, not only can the rapid switching between different types of spatial sound fields be easily realized, but the acoustic signals can also be acquired and played back efficiently. Meanwhile, the requirements for the listeners’ auditory memory decline. Currently, binaural technology is primarily used in virtual reality to restore a real listening experience [4,5,6,7]. Focused on better recovering the real listening experience in virtual hearing, some other researches involved Head-Related Transfer Function (HRTF), a vital clue that describes the filtering effect of body surface of a listener as a sound propagates from the source to the ear drum in free space, to restore the spatialization cues of virtual sounds [8,9,10].
Based on the above-mentioned researches, this study also uses binaural technology to simulate binaural signals generated in closed spaces with different structural parameters. Particularly, the software ODEON 8.0 is firstly used to obtain the room impulse responses at different receiving points in different rooms with variable structural parameters. Then, the binaural signals at different receiving points in real rooms with variable structural parameters are synthesized by using the binaural technology, and the subjective experiment is conducted by using audio devices of headphone, power amplifier and computer.
There are many researches conducted by using subjective experiments. Hyung [11] investigated the effects of diffusing elements on sound field diffuseness by subjective evaluations using binaural impulse responses (BIRs) in seating areas in a surround hall. Their subjective experiment was used to quantitatively evaluate the combination of acoustic parameters and degree of diffusion. Burno [12] conducted a subjective audio quality evaluation experiment to assess the performance of a precompensation algorithm for mitigating perceptible linear and nonlinear distortion in audio signals. The subjective experiment in his study used a degradation category scale to quantitatively evaluate the sound quality. Some researchers even introduced the anchor semantic differential (ASD) method to evaluate subjective annoyance of noises, and modeled the results of subjective evaluation by nonlinear methods to make further predictions of sound quality [13]. By subjective experiment, Miguel [14] established a methodology to define valid evaluation scales for different collectives and determine evaluation criteria related to the overall assessment of music hall acoustics. Their subjective experiment was on-site and evaluated some parameters such as reverberant, resounding, and balanced by grading. Lee [15] conducted two subjective experiments for evaluating floor vibrations induced by walking barefoot in heavyweight buildings, one was rating the intensity of the vibrations and the acceptability and serviceability of the floors when the subject himself walked across, and the other was to rating the floor vibrations when a walker passed by the subject. Kurt [16] conducted subjective evaluations to compare driving experience in real cars and virtual environment. The comparison evaluation was quantified by using semantic differential method. Fotis [17] explored a method for auralization of a car pass-by in a street from using a wave-based acoustic prediction. A subjective evaluation based on pair comparison was carried out in order to detect the maximum spacing between the discrete source positions that still can produce a perceived continuous car pass-by auralization.
Our study aims to evaluate the changed auditory perception in eight simulated closed spaces with variable structural parameters. In this view, pair comparison method matches our purpose best and be selected in our subjective experiment, by which the preferable stimulus can be selected.
Both the virtual sound synthesis technology and the experimental method used in this study are not innovative. But, the main contribution of this research lies in analyzing the impact of changed structural parameters on the auditory perception in preference of three typical music sound types for those acoustic environments with higher auditory perception requirements such as concert hall. Eight closed-space models with different volume, shape, and wall absorption coefficient are simulated by ODEON 8.0. Then, 96 simulating binaural signals in those models are synthesized by binaural technology. By using pair comparison method in the subjective experiment, structural parameters for achieving preferable auditory perception of the three testing musical sounds are concluded. The conclusions can be a reference for the design of concert hall on purpose of achieving better listening experience.
2. Feasibility on ODEON-Based Auditory Scene Simulation in Closed Spaces
ODEON [18,19] is an architectural acoustic simulation software based on geometric acoustics developed by the Technical University of Denmark. The software uses the hybrid method [20] combined with the virtual sound source method [21,22] and the sound ray tracking method [23,24,25] as well as the second source method [26], which can calculate the internal sound field of various types of closed spaces and simulate the noise control measures to be taken and their effects. Many scholars [27,28,29,30] have studied and confirmed the credibility of the software in simulating indoor sound field. In this paper, we will use hearing experiments to study the feasibility of ODEON 8.0 in simulating simplified closed-field auditory scenes.
First, the binaural signals in two real rooms are collected by a spherical sound source and a dummy head (see Table 1 for details). Then, ODEON 8.0 is used to establish the indoor sound field models of the two rooms in order to simulate the corresponding binaural room impulse responses. After that, simulated binaural signals can be achieved by means of virtual auditory technology, referring the process of simulating the transmission of sound waves to both ears meanwhile obtaining the information of time and space. Finally, after the hearing experiment is designed and completed, the degree of consistency in the auditory perception is compared between the actual binaural signals recorded in the real rooms and the simulated binaural signal by use of ODEON 8.0. The feasibility of the software in spatial sound field auditory perception research is tested.
2.1. Binaural Signal Collection in Real Rooms
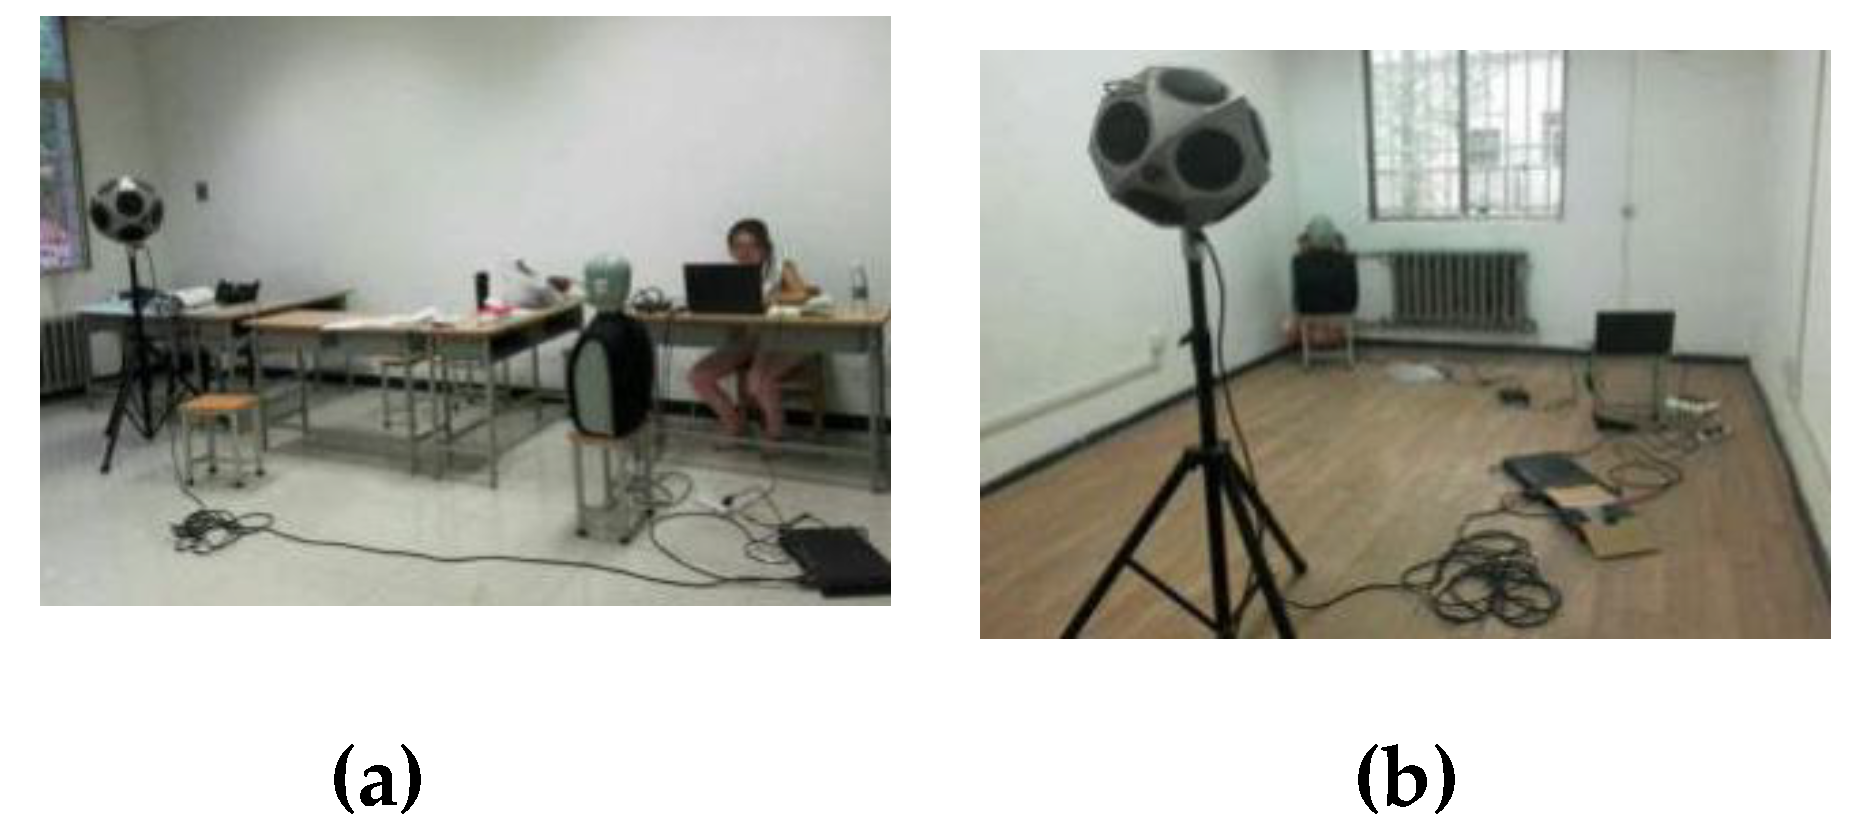
In two ordinary rooms with different spatial sizes (Figure 1), the original signal (the sound of Windows 7 system startup, lasting ~3 s) is played with a spherical sound source and the binaural signals are collected with a dummy head. The structural parameters of the two rooms are shown in Table 2, where L, W, and H represent the length, width, and height of the closed space, respectively, S is the internal surface area, and V is the volume. The midpoint of the short side of the room’s bottom is selected as the coordinate origin to establish a Cartesian coordinate system, in which the vertex coordinates of the windows in the rooms are Room A (2.45, −3.25, 1.00), (2.45, −3.25, 2.40), (0.75, −3.25, 2.40), (0.75, −3.25, 1.00); Room B (5.70, 0.50, 1.00), (5.70, 0.50, 2.40), (5.70, −1.00, 2.40), (5.70, −1.00, 1.00).
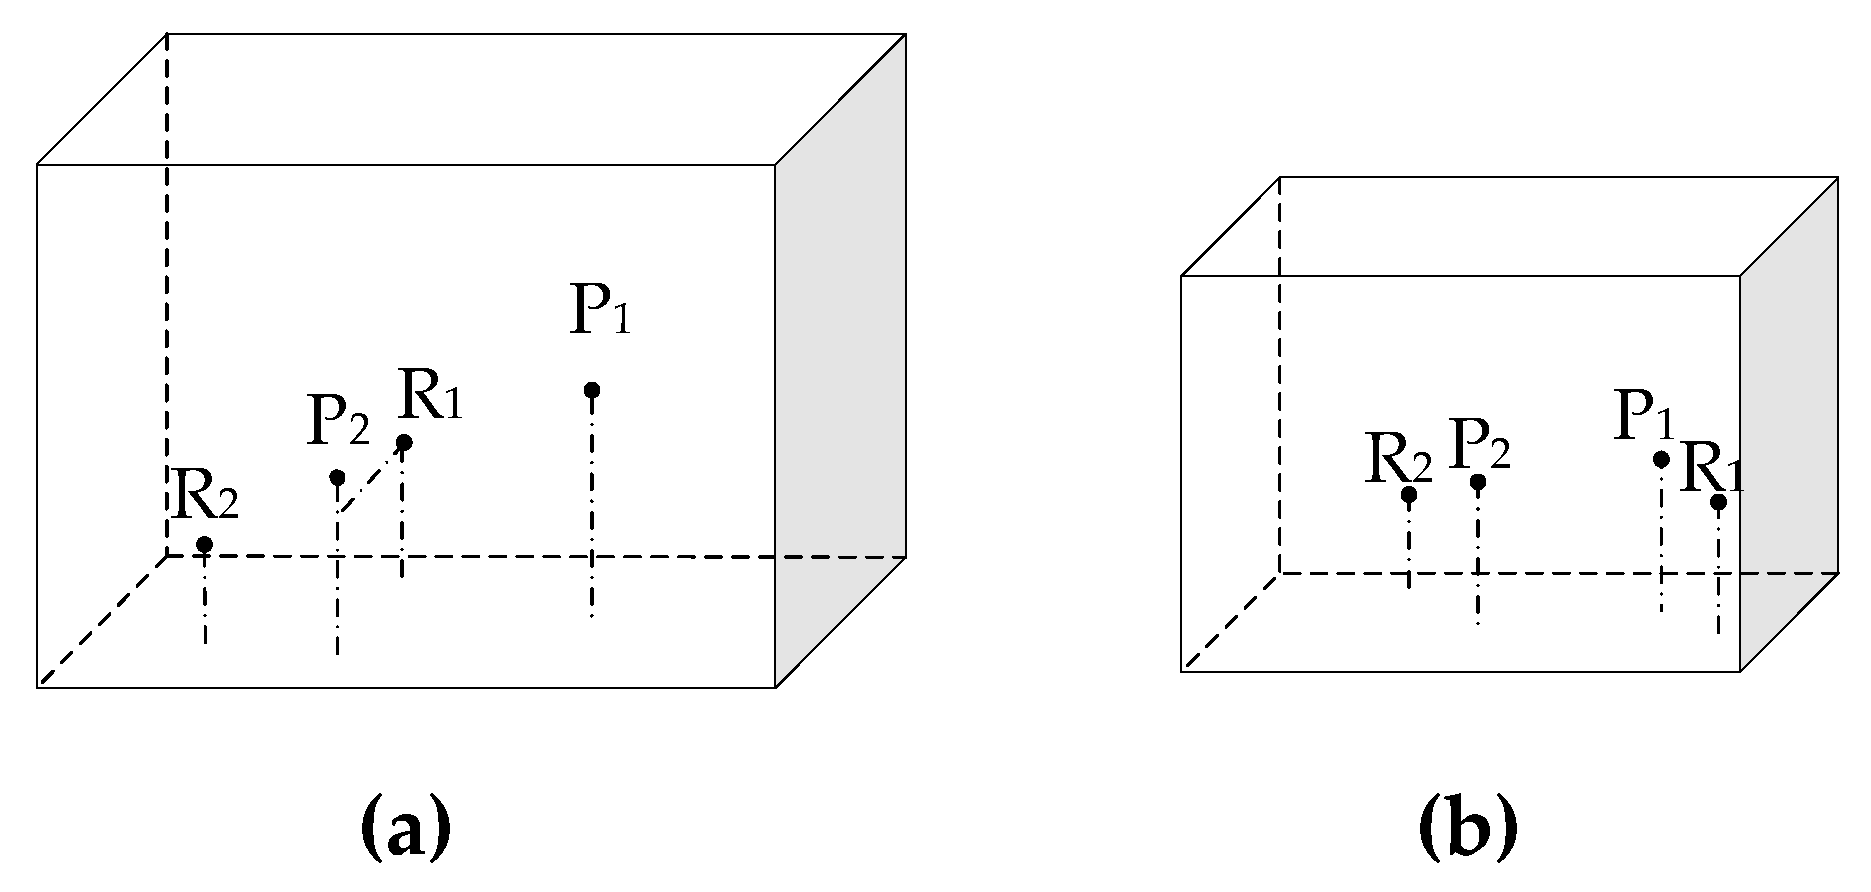
In Room A, the spherical sound sources are placed at two different positions denoted as PA1 (3.60, 0, 1.50) and PA2 (1.60, −2.25, 1.50), and the corresponding two dummy heads are set at receiving points RA1 (1.60, 1.55, 1.13) and RA2 (5.70, −1.55, 1.13). In Room B, the position coordinates of the sound sources and the receiving points are PB1 (2.00, 0, 1.50), PB2 (4.00, −0.30, 1.50), RB1 (1.00, −1.00, 1.13), and RB2 (5.00, 1.00, 1.13). The binaural signals from the two sound sources to the two receiving points in the room A are collected and recorded as PA1RA1, PA1RA2, PA2RA1, and PA2RA2. Additionally, the binaural signals in the room B are recorded as PB1RB1, PB1RB2, PB2RB1, and PB2RB2, respectively. The room windows remain closed during the signal collection. The positions of PA1, PA2, RA1, RA2, PB1, PB2, RB1 and RB2 are indicated in Figure 2.
2.2. ODEON-Based Binaural Auditory Simulation in Virtual Rooms
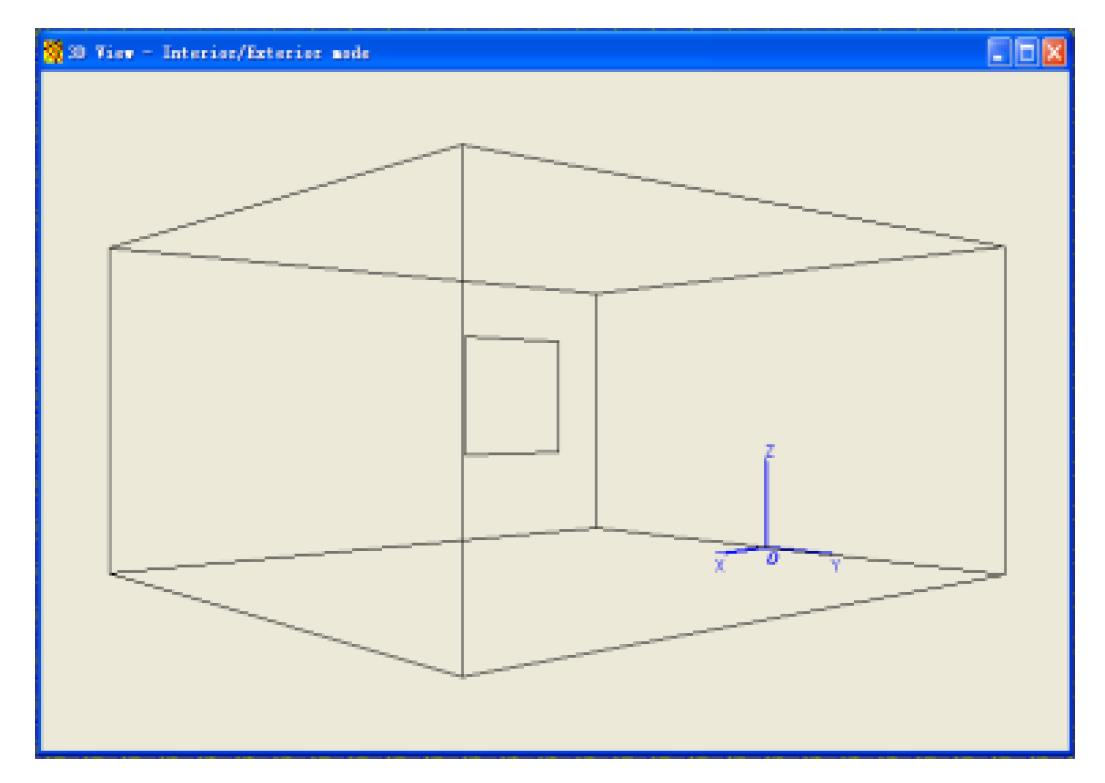
With ODEON 8.0, we draw a rectangular room model, set sound absorption coefficient (concrete and glass), select sound sources and the receiving points (the position coordinates are the same as in the real room), establish sound field models of Room A and Room B (shown in Figure 3) by means of sound ray tracking method (5000 sound rays), and calculate the eight binaural impulse responses (the response duration is 1 s for all points) in the virtual rooms. The reverberation times are 0.16 s for simulated room A and 0.2s for simulated room B, respectively. The original signal in Section 2.1 is convolved with the eight impulse responses, respectively. Finally, the convolved left and right aural signals are played back with a properly balanced and adjusted headphone to produce “virtual hearing” that correspond to each receiving point in the real rooms. Before the listening test, all the headphones are connected with the power amplifier and adjusted at the same output level, with which the experimenter feels comfortable.
2.3. Evaluation Experiment of Auditory Perception Consistency between Real and Simulated Binaural Signals
For the auditory experiment, 20 listeners (undergraduates, postgraduates, and doctoral students majoring in acoustics aged between 20 and 30), who are familiar with the procedure of subjective listening test due to their former experience, are organized and the binaural signals are played back in pairs (“real” and “simulated”) through Sennheiser HD280 Pro headphones. The listeners are unaware of the difference between the stimuli in each pair, they are only instructed to judge whether each pair of sounds is aurally distinguishable (if the two stimuli sound different or same). According to the experimental results, the degree of aural consistency between “real” and “simulated” binaural signals is evaluated to test the feasibility and accuracy of using ODEON 8.0 for indoor sound field auditory simulation research.
2.4. Experimental Results
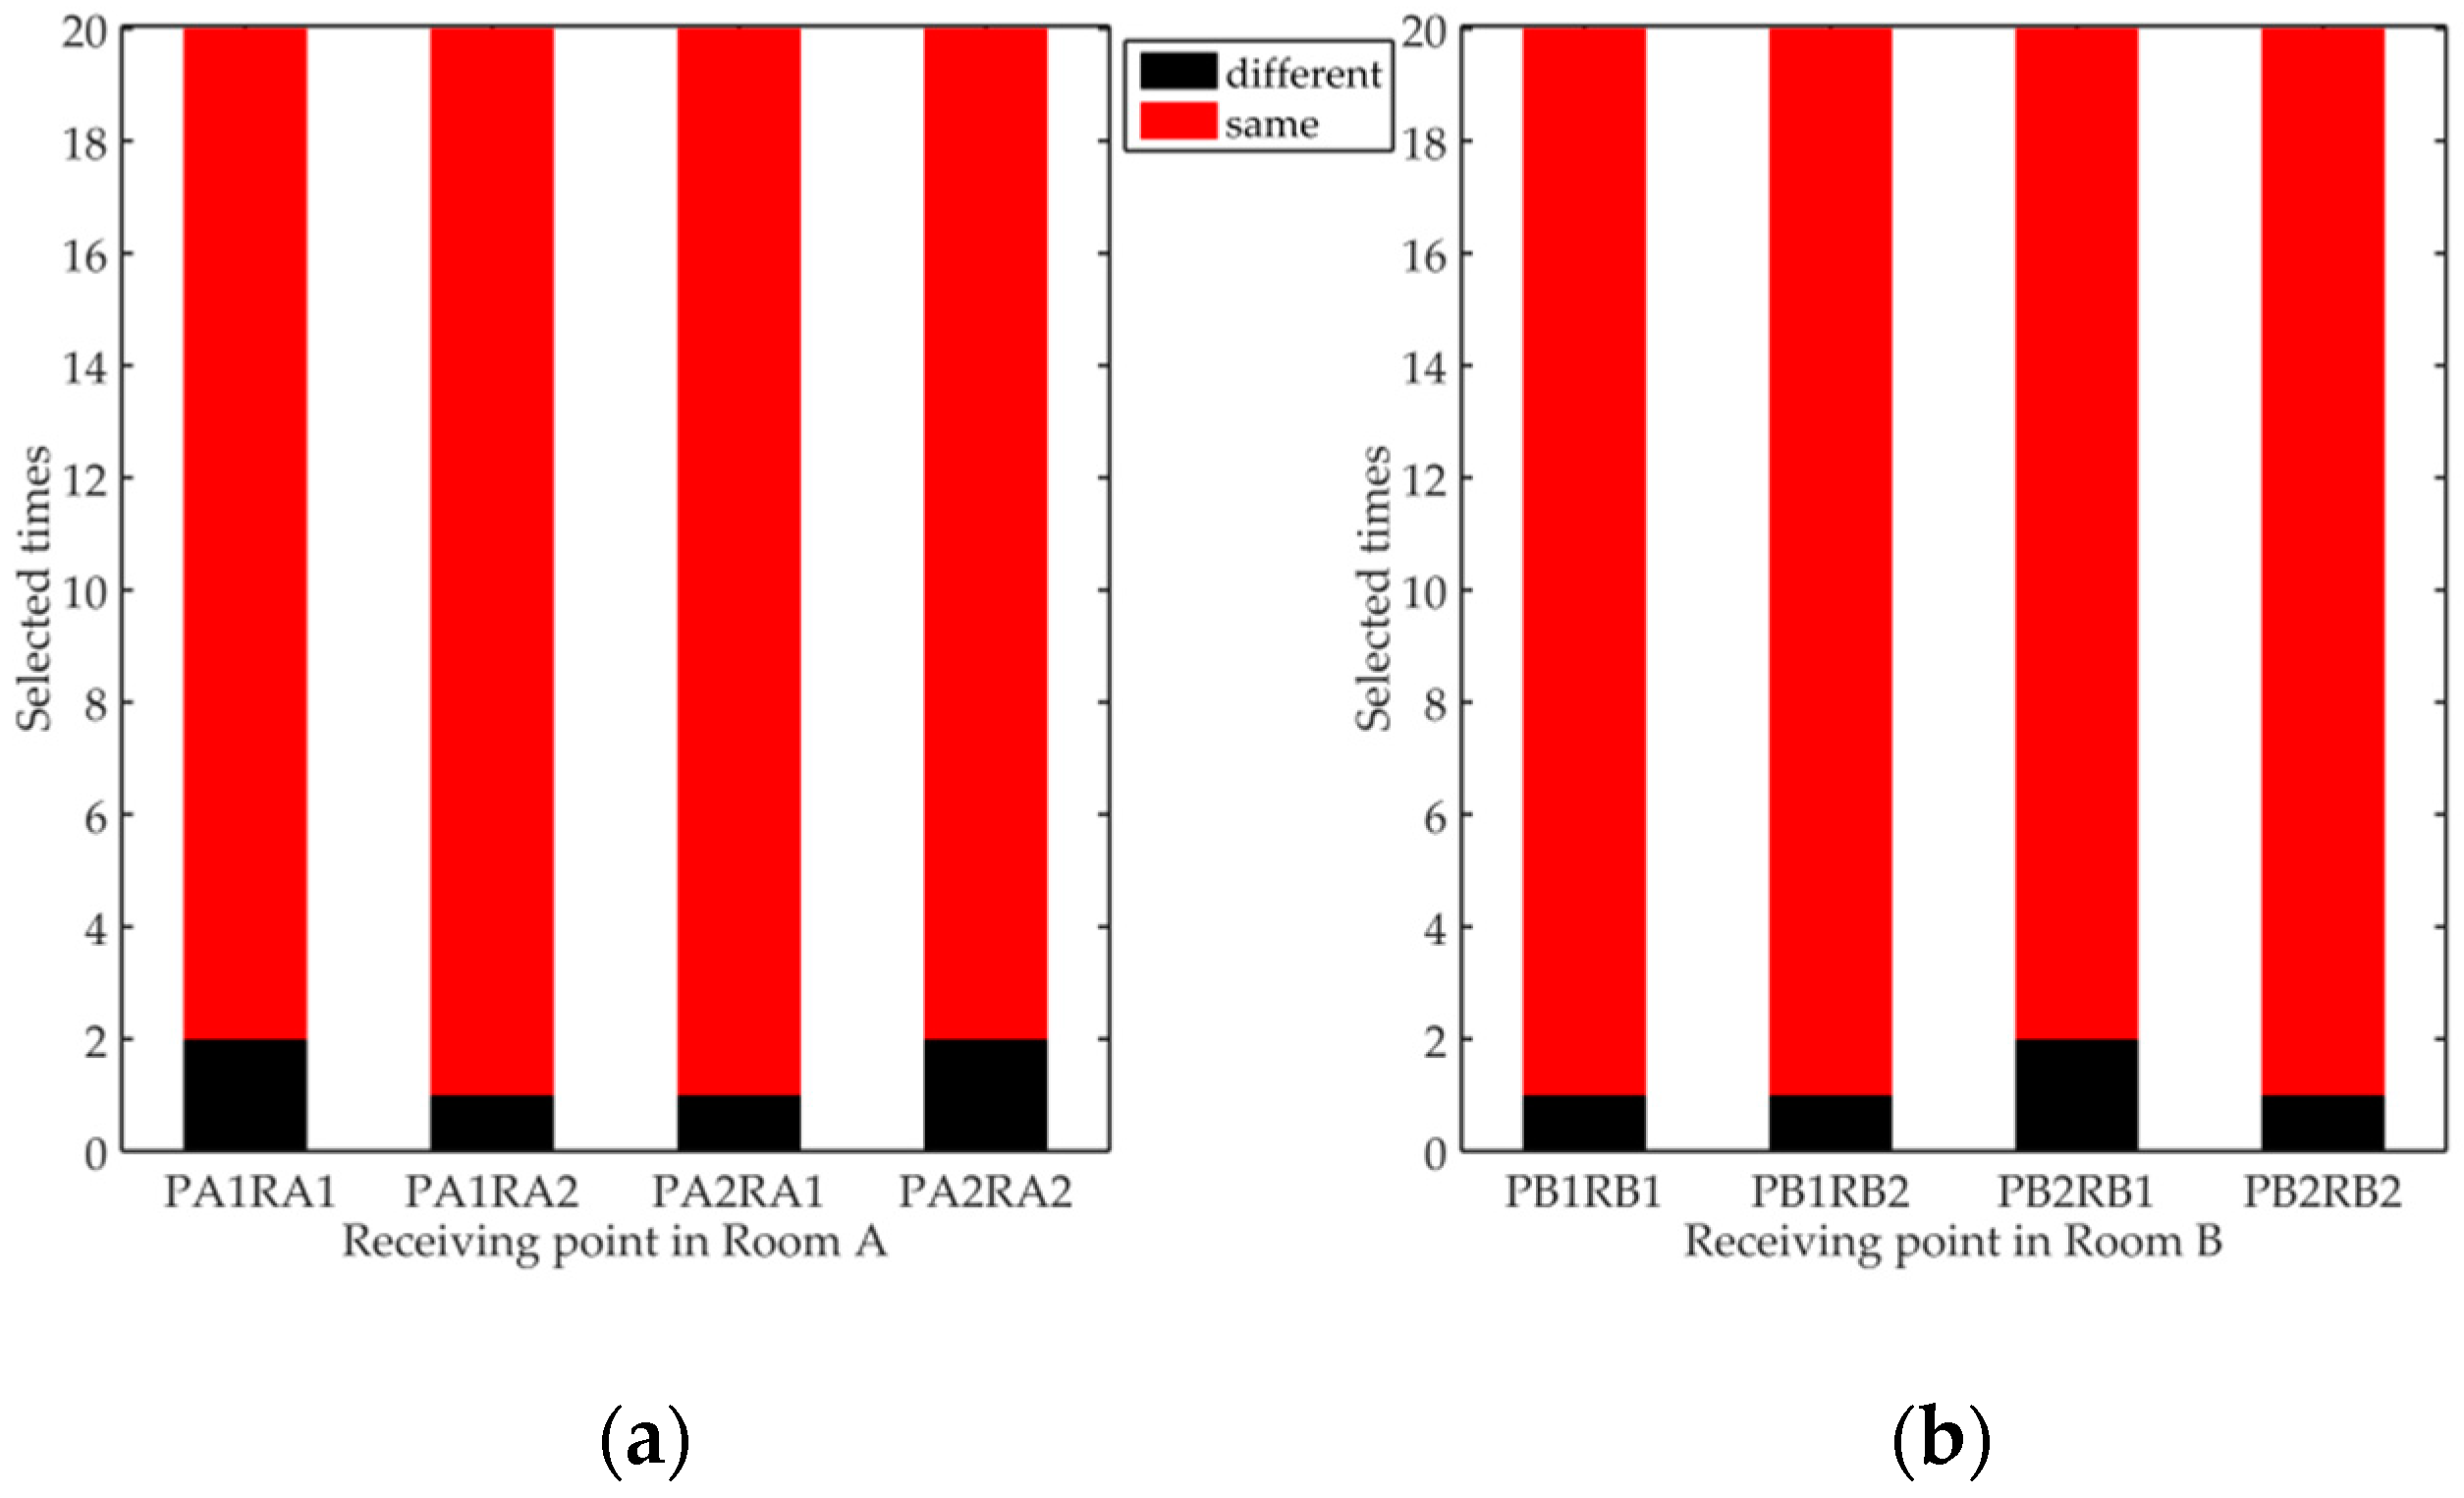
The evaluation results are analyzed and processed as shown in Figure 4. The red bar denotes the number of listeners who sense that the “real” and “simulated” binaural signals are coincident; the black bar denotes the number of listeners who sense that the “real” and “simulated” binaural signals are different. The longer the bar, the more numerous the selected times.
Apparently, the “real” and “simulated” binaural signals are largely aurally consistent, with no obvious difference in terms of auditory perception. At significant level of α = 0.05, a t-test is employed to explore if there is significant difference between the selection of “same” and “different”. The result (p = 0.0126 < α) indicates that the selection of “same” and “different” are significantly different to each other. Therefore, with ODEON 8.0, a virtual auditory environment with high fidelity can be created. In conducting closed-space auditory simulations and related researches, using ODEON 8.0 to simulate indoor sound fields is feasible.
3. Auditory Perception Study of Sound Field in Closed Spaces with Different Structural Parameters
Similar as the method described in Section 2.2, the closed-space models are established with ODEON 8.0, and the simulated binaural signals are synthesized to qualitatively study the impact of structural parameters of closed spaces on the auditory perception.
3.1. Experiment Details
3.1.1. Subjects
There were 20 participants in this subjective experiment, including 11 males and nine females, aged between 20 and 30. The participants were undergraduates, postgraduates, and doctoral students majoring in acoustics with normal hearing and subjective hearing test experience. All participants in this experiment were remunerated for their participation.
3.1.2. Binaural Signal Simulation
In this experiment, three kinds of musical sounds are selected for spatial auditory perception research, i.e., flute (wind instrument), violin (stringed instrument), and symphony (multiple instruments). The flute music used in the listening test is published by Sony Music, the violin, and symphony music are published by China National Symphony Orchestra. All three signals are without any auxiliary effect, so they are proper original signals.
In view of the influence of closed space volume on auditory perception, three cuboid space models with volumes of 24 m3, 96 m3, and 192 m3 (see Table 3 for specific dimensions) and thick pit sand mortar polished brick walls are established, which are denoted as a, b, and c. The positions of sound source and receiving points in each space are shown in Table 4. The room sizes are selected randomly with referring the sizes of real rooms in Section 2.
In view of the influence of inner surface absorption coefficient on auditory perception, four cuboid spatial models of thick pit sand mortar polished brick wall surface (the absorption coefficient of the wall is a function of frequency), α = 0.00 (total reflection), α = 0.50, and α = 1.00 (total sound absorption) with a volume of 192 m3 are constructed, which are denoted as c, d, e, and f. The positions of sound source and receiving points in each space are the same as model c in Table 4.
Considering the influence of space shapes on auditory perception, cuboid, semicylinder, and semisphere closed-space models are established and denoted as b, g, and h, respectively (see Table 5 for specific dimensions). Assume the space volume is 96 m3 and the wall surfaces are all thick pit sand mortar polished brick. The positions of sound source and receiving points in each space are shown in Table 6.
To sum up, current research has established a total of eight closed-space models with different volumes, inner surface absorption coefficients, and space shapes. After determining the above experiment parameters, select the research type calculation level, set the number of sound lines to be 5000 (maximum number of sound lines, more accurate calculation result), and take 1000 ms as the response time of the binaural impulse. Then, the indoor binaural impulse responses of the above eight closed-space models are calculated. Next, the three original signals (flute, violin, and symphony with length of 10 s) are convolved with those binaural impulse responses to synthesize the binaural signals at different positions within different closed spaces, i.e., 8 (closed space) ×4 (receiving point) ×3 (original signal) = 96.
3.2. Experimental Process
This experiment adopts a pairwise comparison method, and the stimulus is presented to the subject through the headphone. Participants are asked to choose the more preferable audio in each pair of stimuli presented. The receiving points in different closed space that have the same coordinate index are arranged as a group to compare with each other. At each index, each of the musical sounds has a total of 34 pairs of stimuli, as shown in Table 7. Therefore, the experiment includes 34 × 4 (receiving point index) × 3 (original signal) = 408 pairs of stimulation signals.
In the experiment, the experimenter plays the stimulus pairs on the computer. One stimulus signal is played for three times in succession, and the other is played (three times in succession) after an interval of 2 s. After each pair of stimuli is played, the subject has 5 s to select the one they preferred and felt more comfortable with and marks it on the questionnaire. Then, the next pair of stimuli is played until all 34 pairs at the receiving point have been played. After 10 min of rest, the stimulus pairs of another type of musical sound is played at the receiving point until the stimulation of all the three musical sounds is played. After that, a rest for half an hour is scheduled to eliminate hearing fatigue of the subjects, which may lead to a deviation of experiment results. Then, in the same way, the stimulus pairs of all three musical sounds are played at the next receiving point. Until the stimulation of the four receiving points has been played, the auditory experiment is finished.
In this experiment, the test sequences of the receiving points, of different musical sounds and of the stimulation pairs of the same receiving point and the same musical sound, are randomized by the Latin Square Scheme to eliminate the deviation of the experimental results that may be caused by the testing sequence.
The auditory experiment in current study is performed only once, and the subjects are required to make only one judgment for each pair of stimulation signals. The whole experiment lasts about 6.5 h.
3.3. Experimental Results
3.3.1. Summary of Results
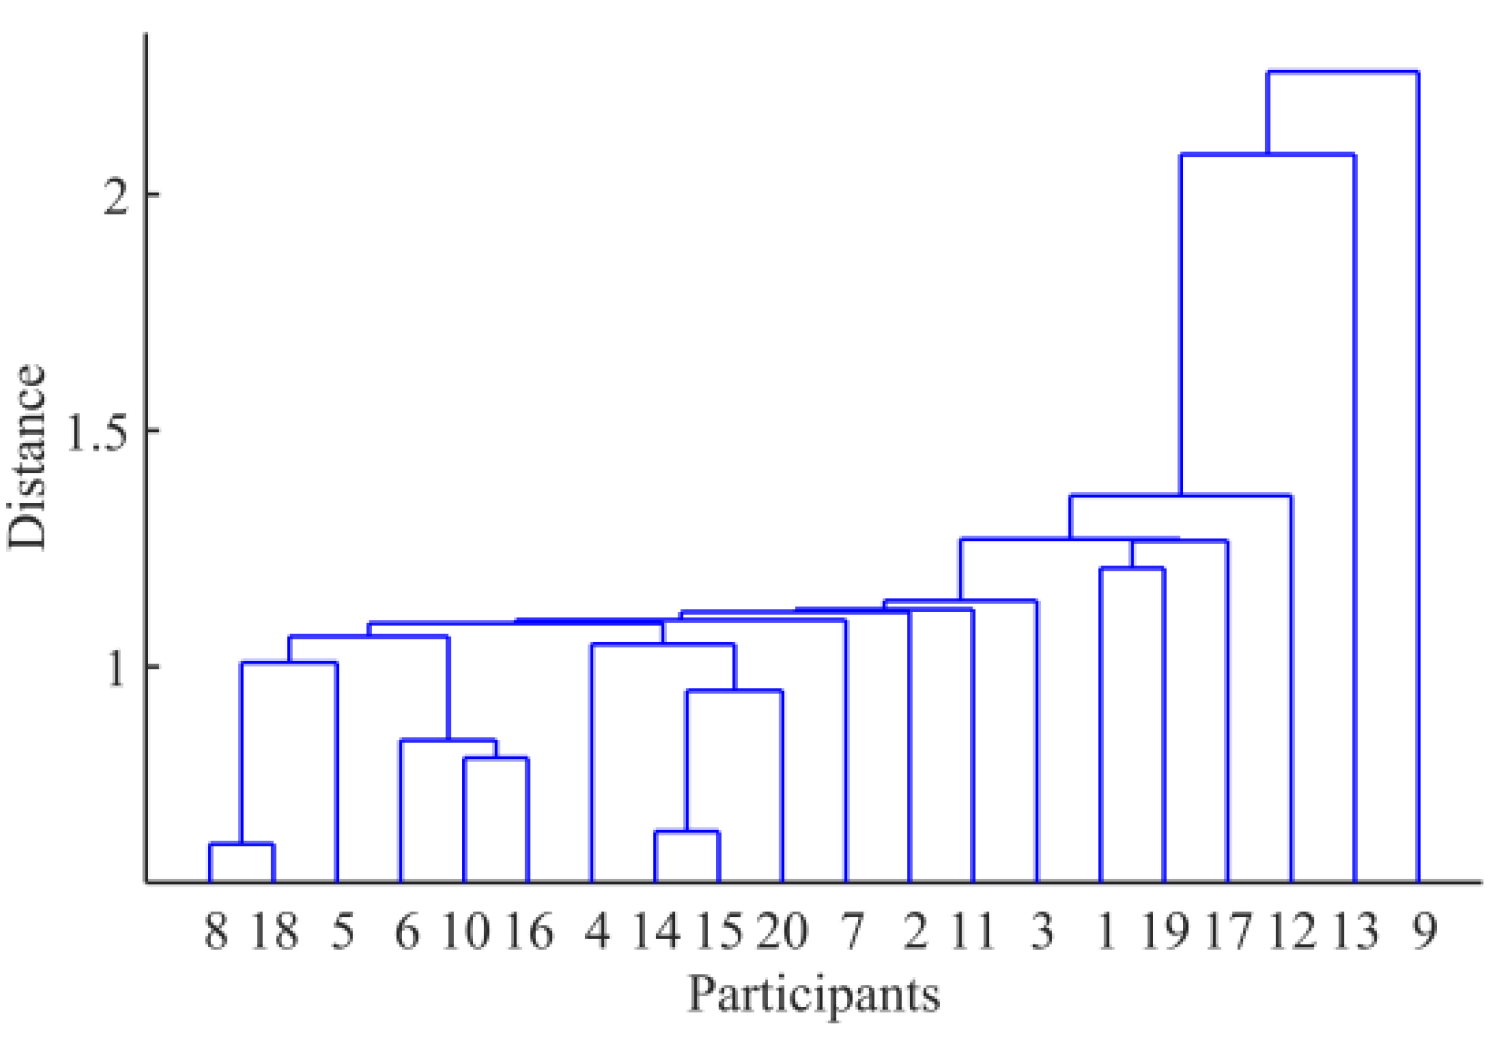
First of all, analysis of variance (at significant level of α = 0.05) for the evaluation data given by all the participants proves that the effect (difference among the testing stimuli) is statistically significant (p = 0.0095 < 0.05). The testing stimuli have significant effect on the participants. The listening test is valid. All the evaluation data given by the subjects are collected to perform cluster analysis to judge the validity of the evaluation results (as seen in Figure 5). For this tree diagram, the y-axis denotes the distance of among each class in the cluster analysis. It refers to the difference among each class; the greater the distance, the greater the difference between the subject’s evaluation result and other subjects’.
According to the results of the cluster analysis, the evaluation data of No. 13 and No. 9 are significantly different from the evaluation results of other subjects, and should be eliminated. The rest of the data is valid in the subjective evaluation experiment.
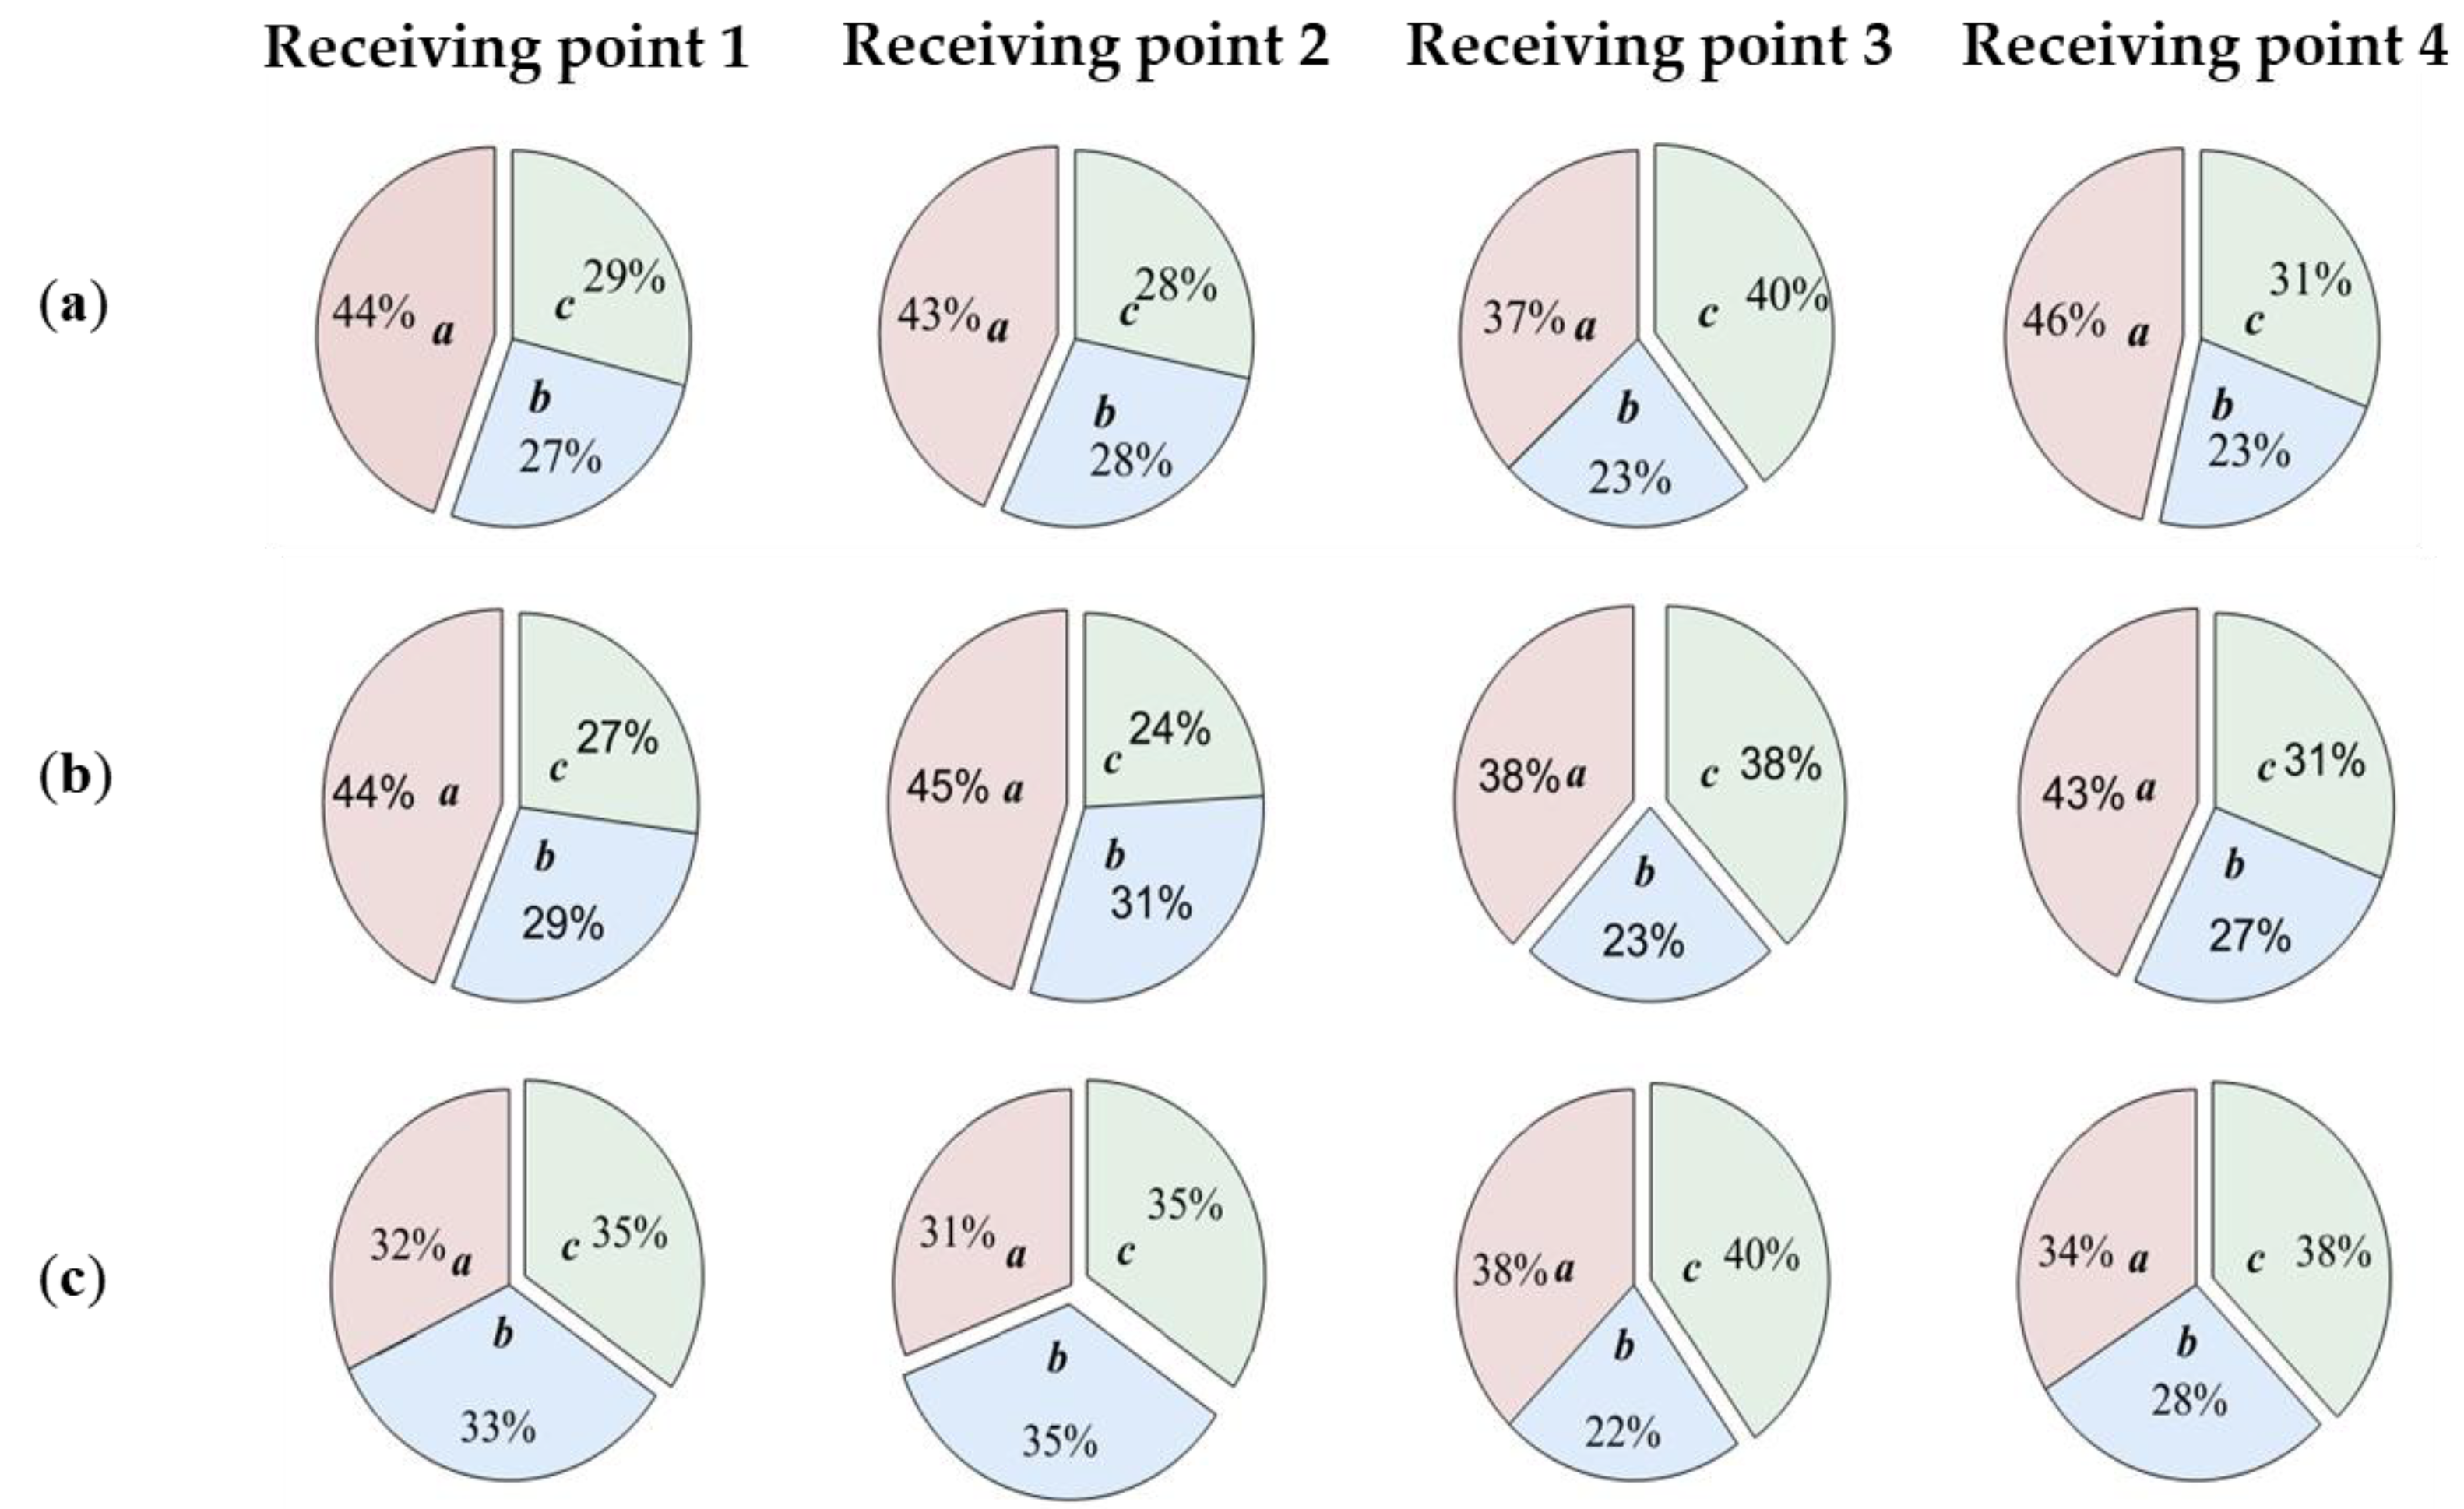
For the three cuboid closed spaces, with volumes of 24 m3, 96 m3, and 192 m3 (each with a thick pit sand mortar polished brick wall), the absolute variations of the corresponding space volume are ∣∣ = 72 m3, ∣∣ = 96 m3, and ∣∣ = 168 m3, respectively. The subjective test results of spatial auditory perception changes caused by volume are shown in Figure 6.
It can be seen from Figure 6 that, for the three different musical sounds, when the spatial volume changes, the influence in different receiving points on hearing is not obvious. When the volume is changing, the auditory perception of the flute music and the violin music change. Generally, the smaller the volume, the better the auditory perception of flute music and violin music will be. As for the symphony sound, its auditory perception does not change obviously in different spatial volumes.
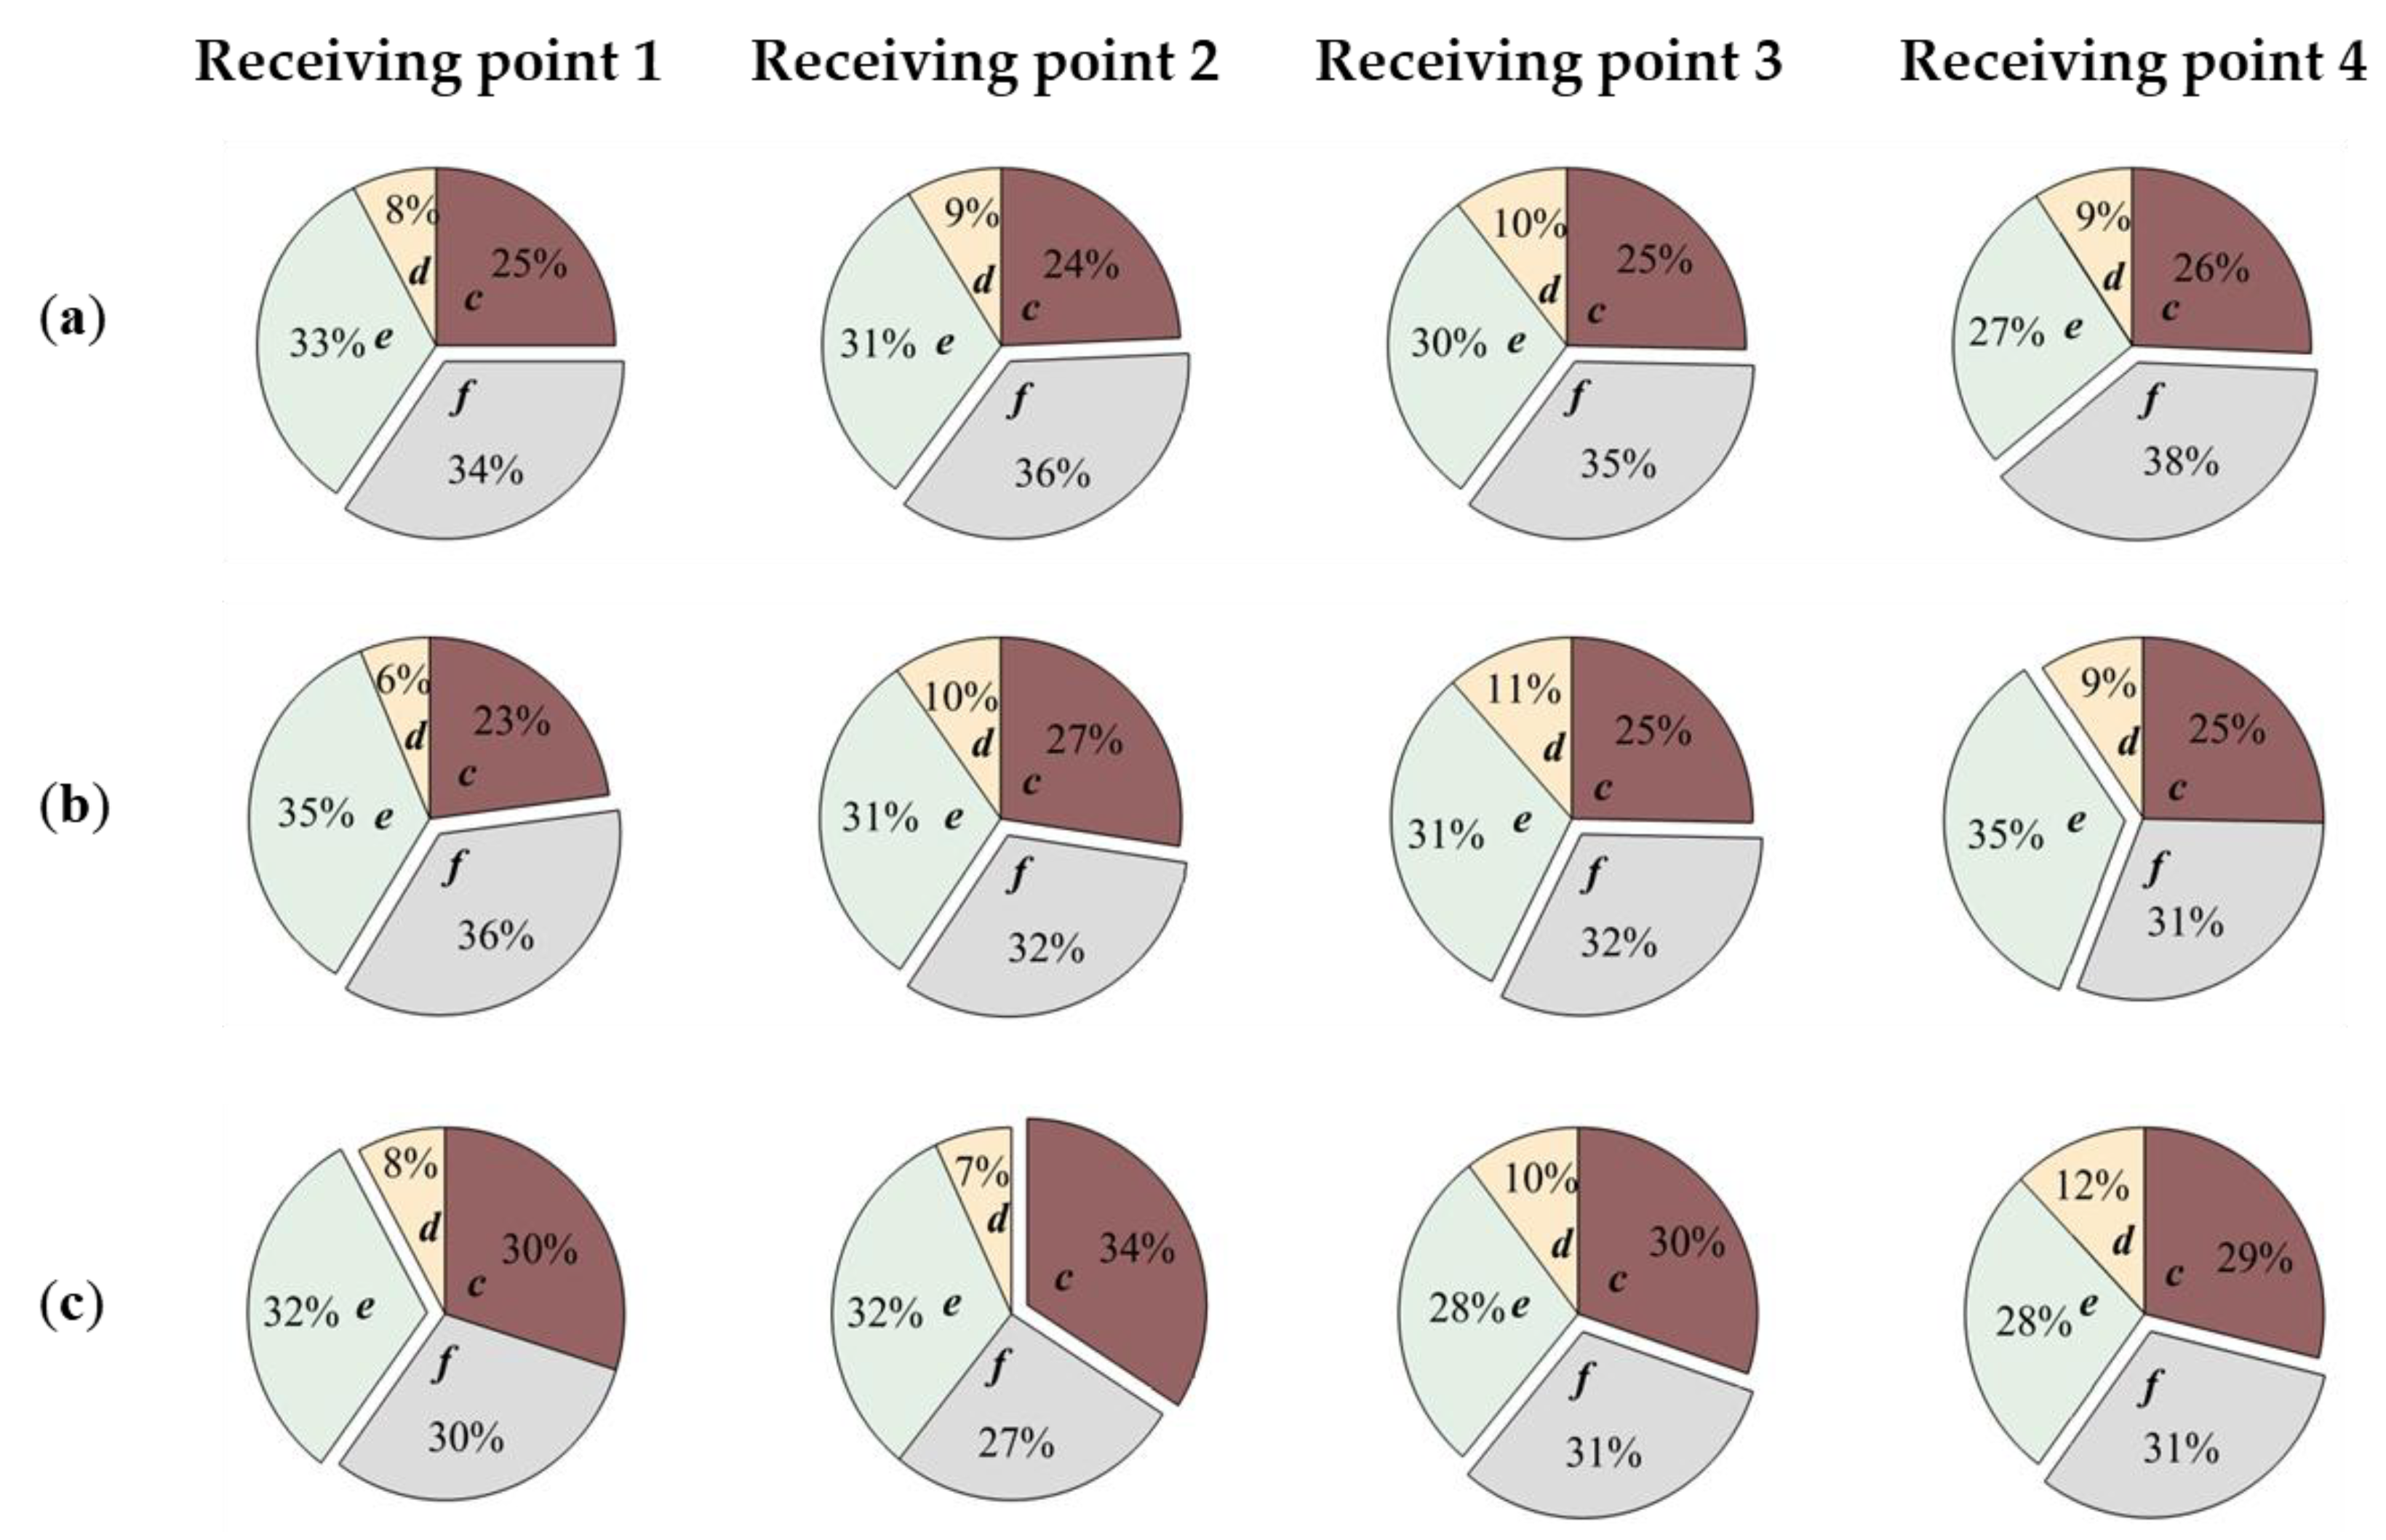
For the four closed spaces, with absorption coefficients of 0, 0.5, and 1 (cases d, e, and f, respectively), and the inner surface of thick pit sand mortar polished brick (the absorption coefficient of the wall is a function of frequency, case c) in the same volume and shape, their sound absorptions are 0 m2, 104 m2, 208 m2, and 31.98 m2, respectively (where α of space c is calculated according to GB_T 3947-1996). The absolute variations of the corresponding spatial sound absorption are ∣∣ = 31.98 m2, ∣∣ = 72.02 m2, and ∣∣ = 176.02 m2. The subjective test results of the changing of the spatial auditory perception caused by the inner surface absorption coefficient are shown in Figure 7.
It can be seen from Figure 7 that when the inner surface absorption coefficient is changed, the spatial hearing changes caused by different receiving points of the three musical sounds are not obvious. In the extreme case of α = 0, the hearing effects of the three musical sounds are the worst. For flute music, when α = 1 the hearing effect is the best. For violin music, in the cases of α = 0.5 and α = 1, the hearing effect is relatively good with no obvious difference. For symphony music, in the three cases of α = 0.5, α = 1, and thick pit sand mortar polished brick wall surface, there is no obvious difference in hearing effect.
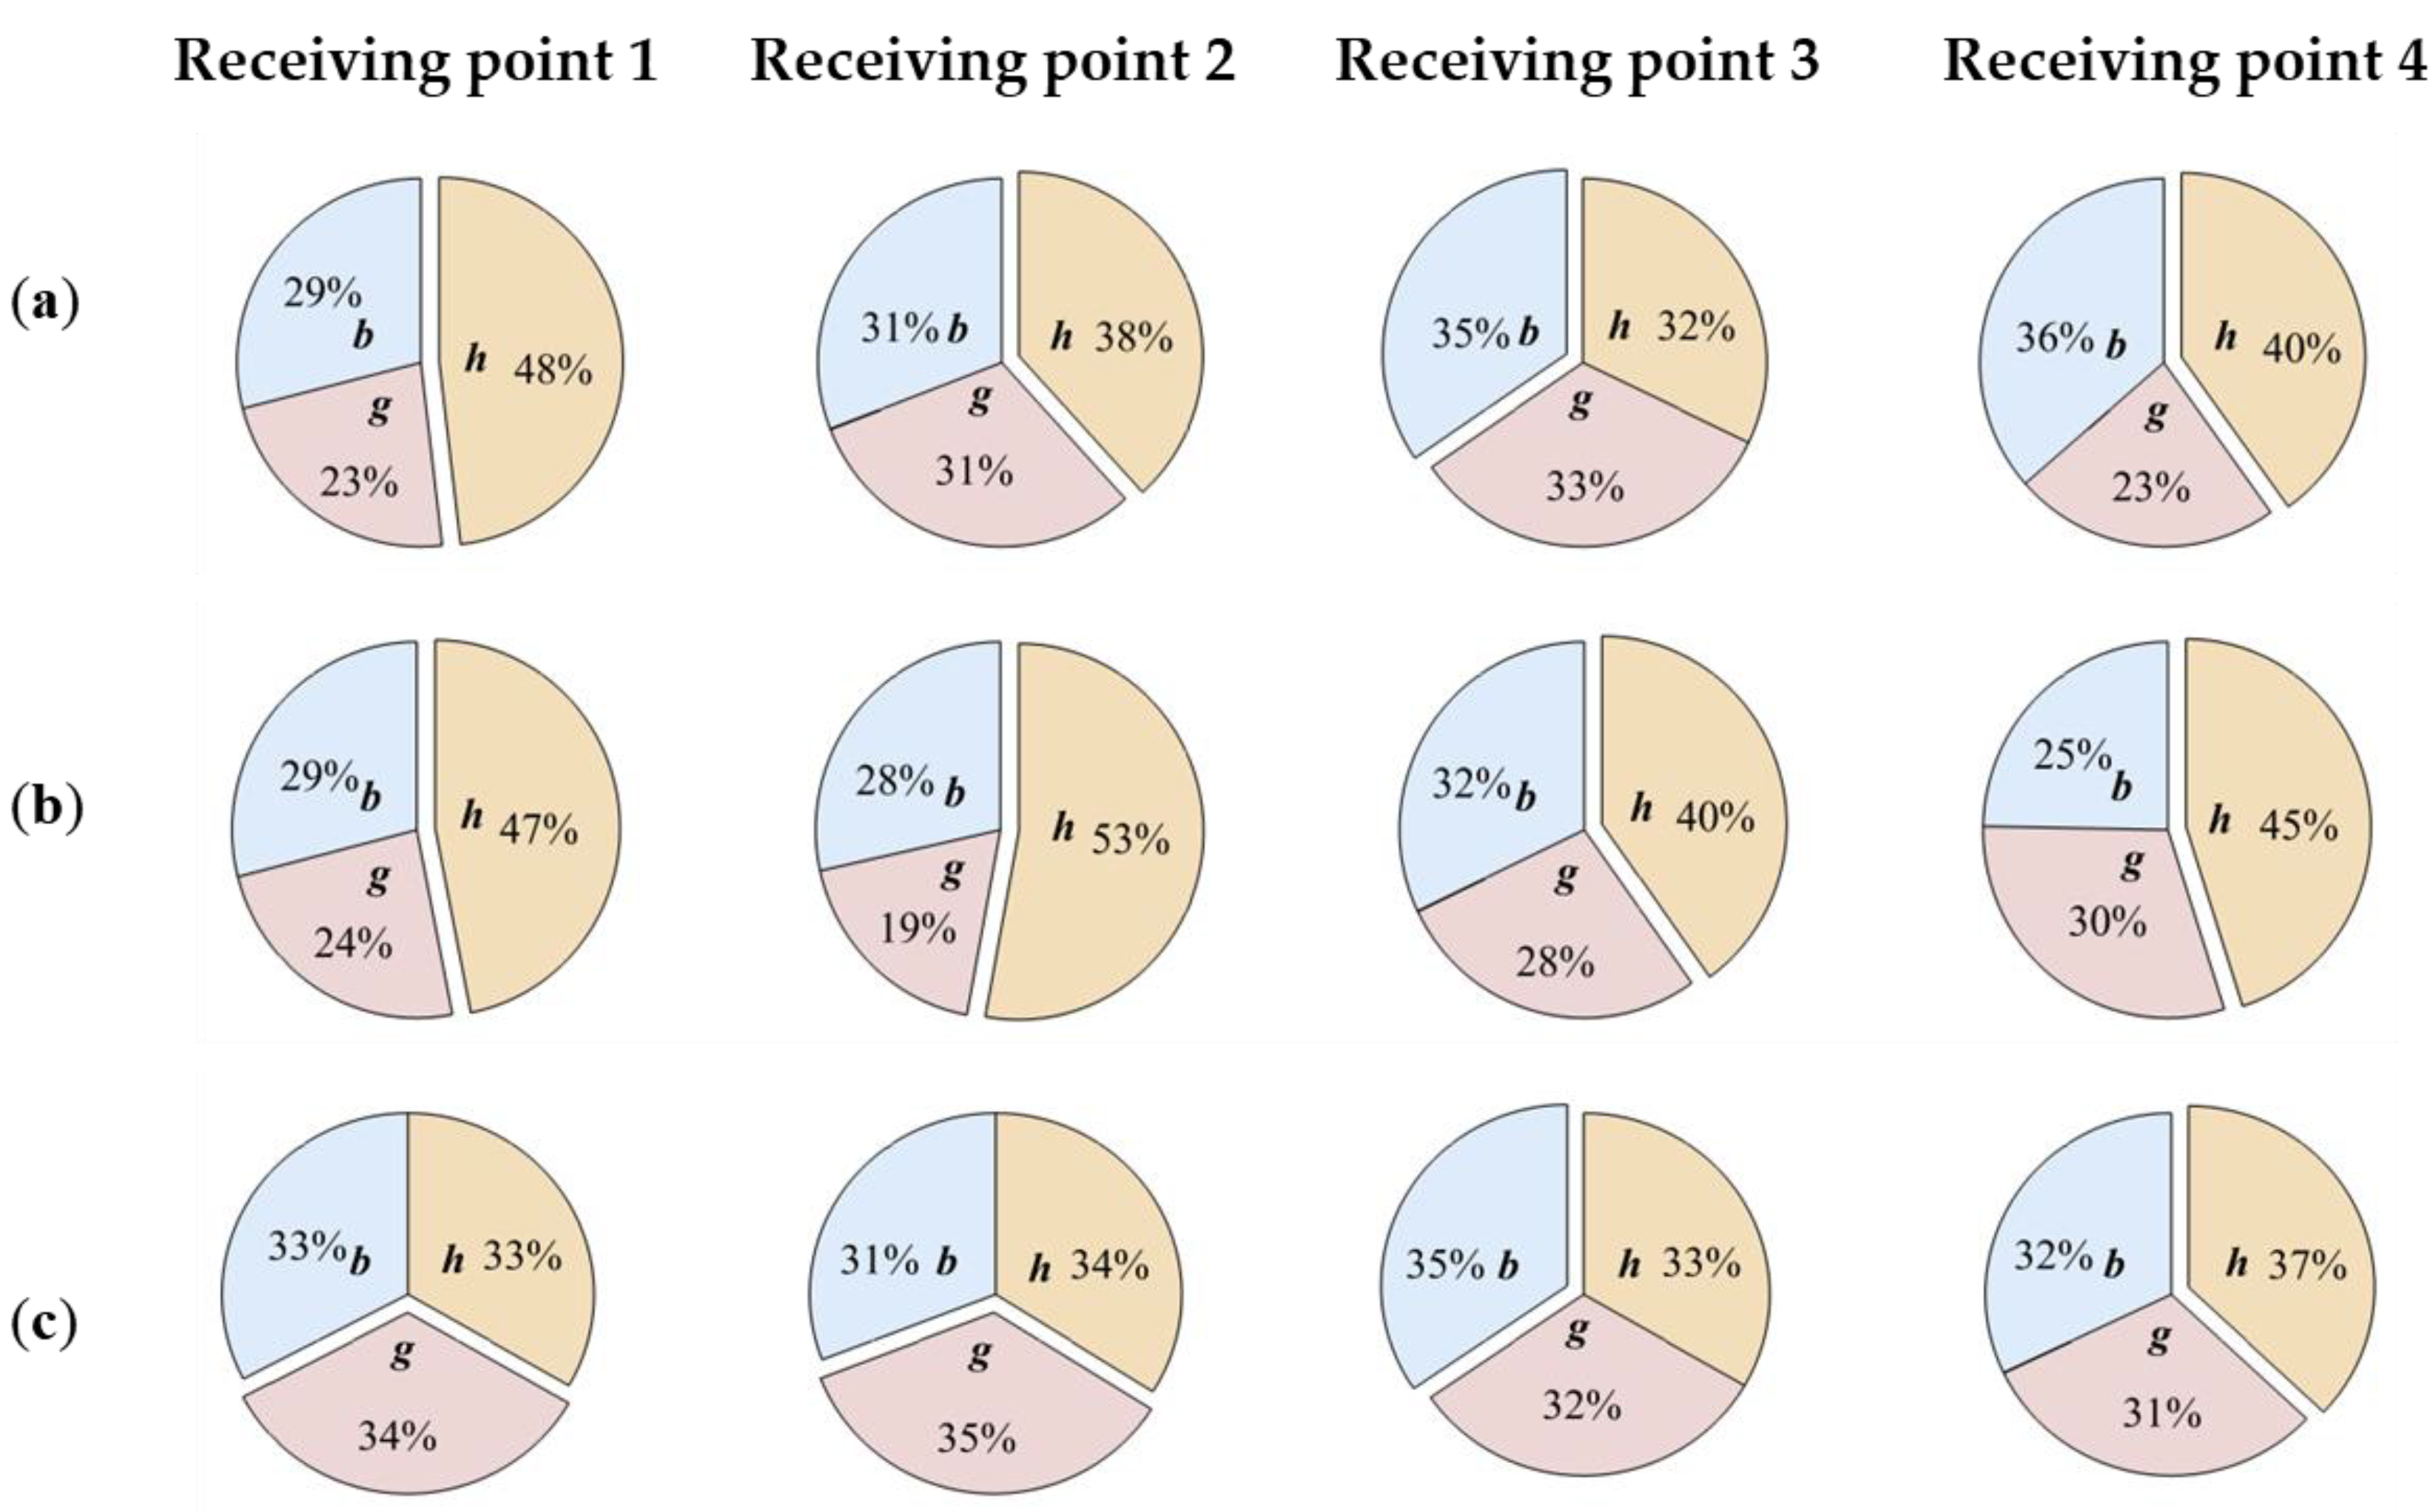
For the cuboid, cylinder, and hemisphere closed spaces with a volume of approximately 96 m3, the changes in auditory perception are shown in Figure 8. As can be seen from Figure 8, for the flute music, the impact of changed receiving point on the auditory perception is very remarkable in the closed space of different shapes. At receiving point 1, the hemispherical space has the best auditory perception, and the other two shapes of space have similar auditory perception. At receiving point 2, the hemispherical space still has the best auditory perception; the auditory perceptions in rectangular and cylindrical spaces are also comparable. At receiving point 3, the auditory perception is optimal in the rectangular space, while the auditory perception in the other two shapes of spaces is also comparable. At receiving point 4, the hemispherical space has the best auditory perception, and the cylindrical space has the worst. For violin music, the hemispherical closed space has the best auditory perception at different receiving points, while the rectangular closed space has a better overall auditory perception than the cylindrical one. For symphonic music, the shape of the closed space has no obvious impact on the auditory perception in each receiving point.
3.3.2. Analysis of Variance
The listening test in the current research is of a two-factor interactive design. To be specific, when considering the effect of space volume, the inner surface absorption coefficient and space shape are held constantly, while the volume and the position of receiving point are changed. When considering the effect of inner surface absorption coefficient, the space volume and shape are held constant, while the absorption coefficient and the receiving point position are changed. When considering the effect of space shape, the space volume and the absorption coefficient are held constantly while the shape and the receiving point position are changed. Consequently, at the significant level of α = 0.05, a two-factor nonrepetitive experimental variance analysis is conducted to test whether the volume, inner surface absorption coefficient, shape of the closed space, and the position of the receiving point have significant impacts on auditory perception. The results of the analysis are shown in Table 8.
From the results of the variance analysis, it can be seen that the change of inner surface absorption coefficient has a significant impact on the auditory perceptions of all the three testing musical sounds, which is consistent with our reasoning. The change of volume of closed spaces has a significant impact the auditory perception of flute and violin music, and the change of closed space shape has a significant impact on the auditory perception of the violin music. Besides, the change in position of the receiving point has no significant impact on the auditory perceptions of all the three testing musical sounds.
At significant level of α = 00.05, the post-hoc of the above ANOVA is conducted to explore whether there is significant difference among the observing samples. The evaluation results for each simulated model were taken as the observing sample. The results of the post-hoc are shown in Table 9. It can be seen from Table 9 that the auditory perception of flute and violin music has a significant difference among most simulated models. The auditory perception of flute music has no significant difference only between models b and h. The auditory perception of violin music has no significant difference between models b and c. However, the auditory perception of symphony music has no significant difference when space volume and shape change except models b and h. When the absorption coefficient changes, the auditory perception of all the testing music type changes significantly.
3.4. Discussion
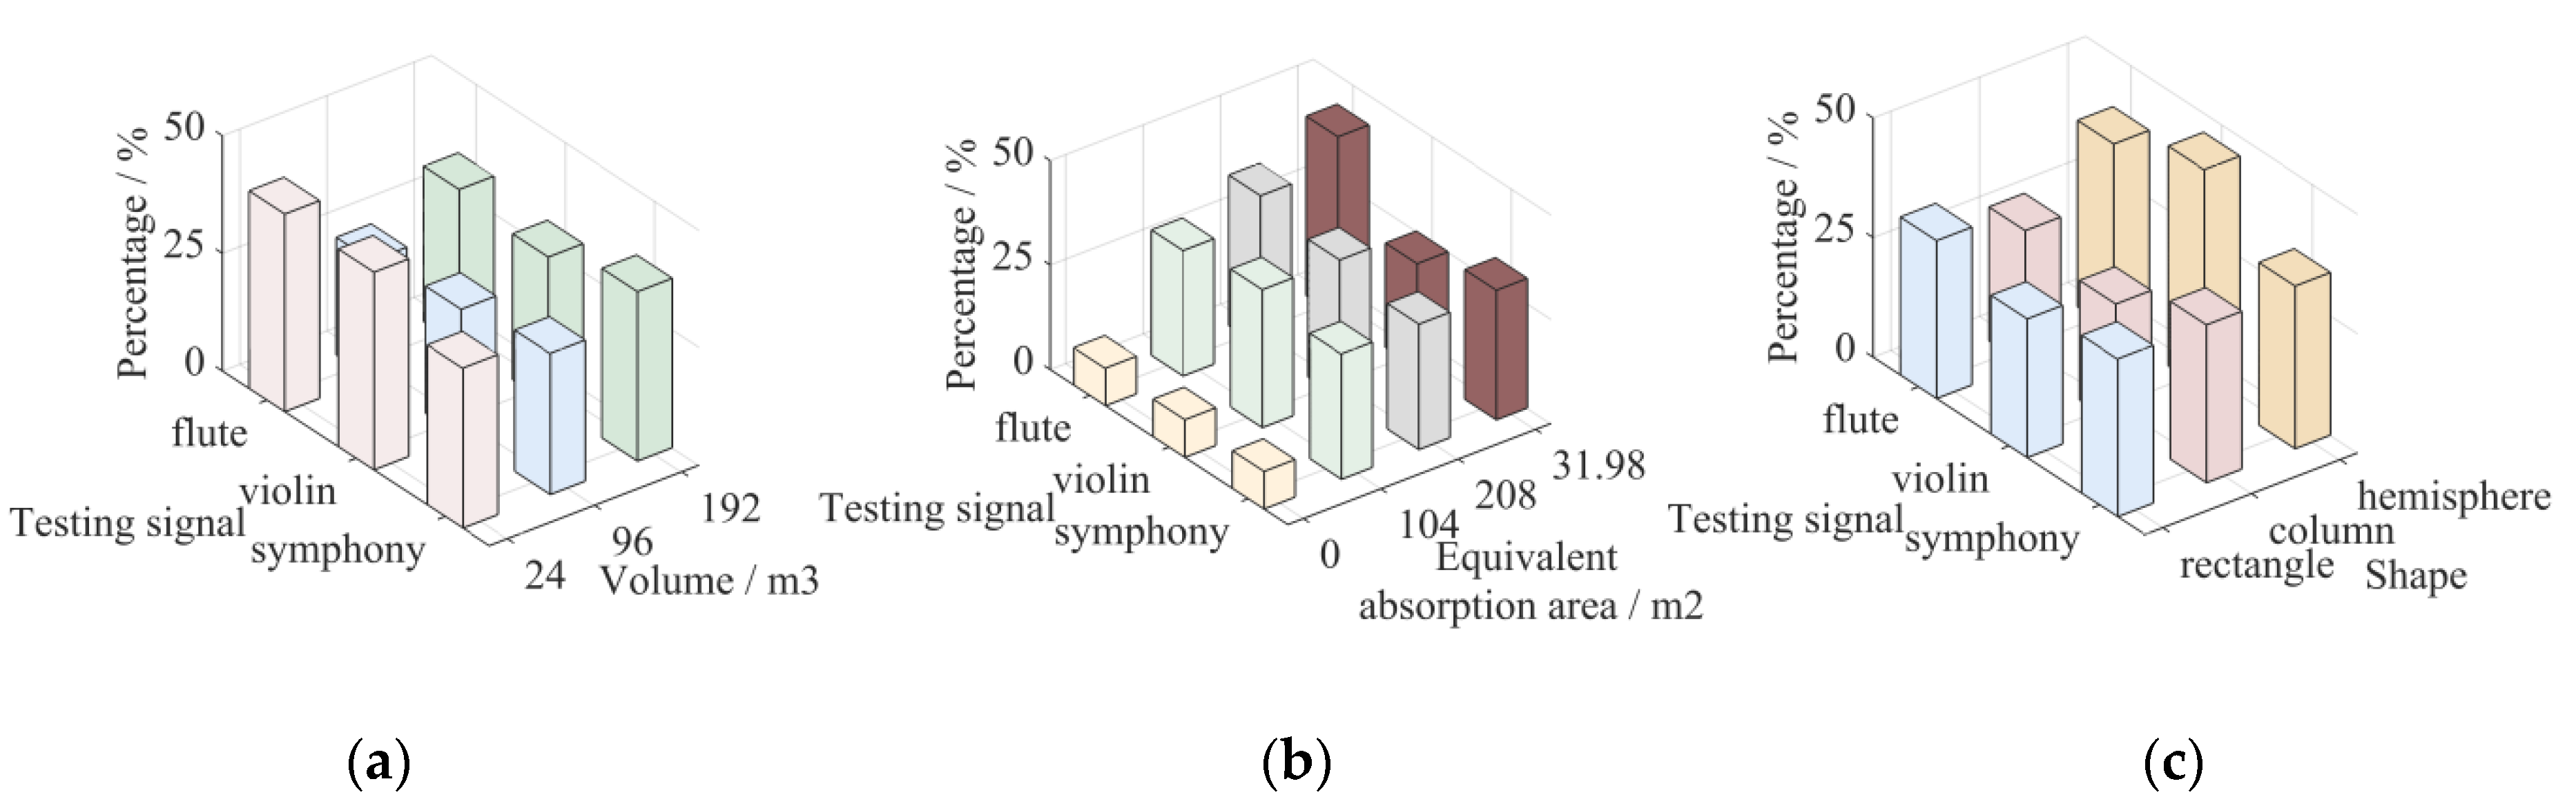
When the position of the receiving point is not considered, the auditory perception changes caused by the volume, inner surface absorption coefficient, and shape are shown in Figure 9.
It can be seen from Figure 9 that, for the flute music, when the volume changes, the cabin with a volume of 24 m3 achieves the best auditory perception. When the wall absorption coefficient changes, the cabins with the thick pit sand mortar polished brick wall surface and the full sound absorption wall surface can impart better auditory perception. When the shape changes, the hemispherical cabin can impart better auditory perception. For violin music, when the volume changes, the cabin with a volume of 24 m3 has better auditory perception. When the absorption coefficient changes, the cabin with a sound absorption coefficient of 0.5 and the full absorption wall have better auditory perception. When the shape changes, the hemispherical cabin has better auditory perception. For the symphonic music, when the volume changes, there is no significant difference among the cabins. When the wall sound absorption coefficient changes, the total reflection wall cabin has the worst auditory perception, while the other cabins have no significant difference. When the shape changes, there is no significant difference among the cabins.
It can be concluded from the above observations that the flute and violin music are most suitable for playing in a hemispherical cabin with a small volume and a relatively large wall sound absorption coefficient in the various simulated cabin environments of this experiment, and that the symphony has no special requirements for the playing environment except for total reflection walls. That is to say, hemispherical cabin with a small volume and a relatively large absorption coefficient wall achieves better auditory perception for playing single instrument music such as the flute and violin. While multiple instruments music such as the symphonic has no specific requirement for playing except the extreme case of total reflection wall.
4. Conclusions
In this paper, binaural audibility technology is used in conjunction with closed space sound field simulation technology (ODEON 8.0) to carry out auditory scene simulation of closed spaces with variable structural parameters. With the help of binaural virtual simulation technology, the study focuses on the auditory perception variation of musical sounds in internal sound field caused by changed structural parameters of the closed spaces.
It was found that (1) hemispherical cabins with small volume and large wall sound absorption coefficient are most suitable for playing a single instrument music such as flute and violin and (2) cabins with large volumes are suitable for playing multiple instruments music such as symphony, but the walls should not be totally reflect. Meanwhile, there is no specific requirement for the shape of the closed space. The experimental scheme and results in this study can provide guidance for designing the inner structure of the concert hall for achieving better auditory perception in practice.
Author Contributions
Methodology, X.Z.; Software, R.L.; Validation, L.W., R.L.; Data Collection, R.L.; Formal Analysis, L.W.; Writing—Original Draft Preparation, L.W.; Writing—Review and Editing, L.W., X.M.; Funding Acquisition, X.M.
Funding
This research was funded by Fundamental Research Funds for the Central Universities, grant number 3102017OQD005 and the National Natural Science Foundation of China, grant number 51705421.
Conflicts of Interest
The authors declare no conflict of interest.
References
- Sandvad, J. Auditory Perception of Reverberant Surroundings. J. Acoust. Soc. Am. 1999, 105, 152–163. [Google Scholar] [CrossRef]
- Mcgrath, R.; Waldmann, T.; Fernström, M. Listening to Rooms and Objects; Audio Engineering Society: New York, NY, USA, 1999; pp. 512–522. [Google Scholar]
- Cabrera, D.; Jeong, D. Auditory Room Size Perception in Concert Auditoria. In Proceedings of the International Congress on Acoustics, Madrid, Spain, 2–7 September 2007. [Google Scholar]
- Lentz, T. Binaural technology for virtual reality. J. Acoust. Soc. Am. 2007, 124, 3359. [Google Scholar] [CrossRef]
- Vorländer, M.; Pelzer, S.; Wefers, F. Virtual Room Acoustics, Sound-Perception-Performance; Springer International Publishing: Berlin, Germany, 2013. [Google Scholar]
- Connor, M.; Hyunkook, L. An Investigation into Spatial Attributes of 360° Microphone Techniques for Virtual Reality. In Audio Engineering Society Convention 144; Audio Engineering Society: New York, NY, USA, 2018. [Google Scholar]
- Fisher-Gewirtzman, D. Perception of density by pedestrians on urban paths: An experiment in virtual reality. J. Urban Des. 2018, 23, 674–692. [Google Scholar]
- Yu, G.; Wu, R.; Liu, Y.; Xie, B. Near-field head-related transfe function measurement and database of human subjects. J. Acoust. Soc. Am. 2018, 143, 194–198. [Google Scholar] [CrossRef] [PubMed]
- Zhang, W.; Abhayapala, T.D.; Kennedy, R.A.; Duraiswami, R. Insights into head-related transfer function: Spatial dimensionality and continuous representation. J. Acoust. Soc. Am. 2010, 127, 2347–2357. [Google Scholar] [CrossRef]
- Zhang, W.; Kennedy, R.A.; Abhayapala, T.D. Efficient Continuous HRTF Model Using Data Independent Basis Functions: Experimentally Guided Approach. IEEE Trans. Audio Speech Lang. Process. 2009, 17, 819–829. [Google Scholar]
- Jang, H.S.; Lim, H.; Jeon, J.Y. Subjective evaluation of sound diffusion in a surround hall. J. Acoust. Soc. Am. 2016, 140, 3175–3176. [Google Scholar]
- Defraene, B.; van Waterschoot, T.; Diehl, M.; Moonen, M. Subjective audio quality evaluation of embedded-optimization-based distortion precompensation algorithms. J. Acoust. Soc. Am. 2016, 140, EL101–EL106. [Google Scholar]
- Li, H.; Chen, K.; Wang, X.; Gao, Y.; Yu, W. A perceptual dissimilarities based nonlinearsound quality model for range hood noise. J. Acoust. Soc. Am. 2018, 144, 2300–2311. [Google Scholar]
- Galiana, M.; Llinares, C.; Page, Á. Subjective evaluation of music hall acoustics: Response of expert and non-expert users. Build. Environ. 2012, 58. [Google Scholar] [CrossRef]
- Lee, P.J.; Lee, B.K.; Griffin, M.J. Evaluation of floor vibrations induced by walking in reinforced concrete buildings. In Proceedings of the Internoise 2013, Innsbruck, Austria, 15–18 September 2013. [Google Scholar]
- Debattista, K.; Bashford-Rogers, T.; Harvey, C.; Waterfield, B.; Chalmers, A. Subjective Evaluation of High-Fidelity Virtual Environments for Driving Simulations. IEEE Trans. Hum. Mach. Syst. 2018, 48, 30–40. [Google Scholar] [Green Version]
- Georgiou, F.; Hornikx, M. Auralization of a car pass-by using impulse responses computed with the pseudospectral time-domain method. J. Acoust. Soc. Am. 2017, 141, 3778–3779. [Google Scholar]
- Chen, J. The Application of the ODEON Used in Architecture Acoustics. Master’s Thesis, Chongqing University, Chongqing, China, 1 May 2012. [Google Scholar]
- Hai, W.; Lin, T. Odeon Software Engineering Mode Evaluation of Computational Results. Tech. Acoust. 2016, 40, 9–19. [Google Scholar]
- Min, H.; Chen, Y.; Qiu, X. A coherent image source method for sound prediction in long spaces with a sound absorbent ceiling. In Proceedings of the INTER-NOISE and NOISE-CON Congress and Conference, Melbourne, Australia, 16–19 November 2014. [Google Scholar]
- Bi, C.-X.; Hu, D.-Y.; Zhang, Y.-B.; Xu, L. Sound Field Separation Technique Based on Equivalent Source Method and Double-Layer Particle Velocity Measurements. Acta Phys. Sin. 2013, 62. [Google Scholar] [CrossRef]
- Gu, C.; Zhu, M.; Lu, H.; Beckers, B. Room Impulse Response Simulation Based on Equal-Area Ray Tracing. In Proceedings of the International Conference on Audio, Language and Image Processing, Shanghai, China, 7–9 July 2014; pp. 832–836. [Google Scholar]
- Chen, Z.; Cai, M.; Li, F.; Ye, W. Dynamic Simulation of Traffic Noise by Applying Ray Tracing Method based on Indoor Space Partitioning. Acta Acust. United Acust. 2014, 100, 467–476. [Google Scholar] [CrossRef]
- Cai, M.; Chen, Z.; Zou, J. A Ray Tracing Method Based on Indoor Space Partitioning. Appl. Acoust. 2013, 32, 34–38. [Google Scholar]
- Shi, Q.; Wu, X.; Xu, C.; Shi, X.; Guo, D. Analysis on Acoustic Field of an NVH Test Bench. Tech. Acoust. 2015, 39, 48–53. [Google Scholar]
- Ma, J.; Zou, H.; Qiu, X. Performance Analysis of Feedforward Active Noise Control Systems with Acoustic Feedback. Acta Acust. 2016, 41, 686–693. [Google Scholar]
- Groendyke, B.; Gipson, K. Acoustic response of a multipurpose auditorium at Grand Valley State University. J. Acoust. Soc. Am. 2015, 138, 1901. [Google Scholar] [CrossRef]
- Hodgson, M.; York, N.; Yang, W.; Bliss, M. Comparison of Predicted, Measured and Auralized Sound Fields with Respect to Speech Intelligibility in Classrooms Using CATT-Acoustic and ODEON. Acta Acust. United Acust. 2008, 94, 883–890. [Google Scholar] [CrossRef]
- Chen, J.; Lin, T. Comparison of Calculated by ODEON and Measured Value about Interior Sound Field. Audio Eng. 2014, 38, 1–5. [Google Scholar]
- Chen, J.; Lin, T. The Hall T30 of ODEON Software Simulation and Measurement. Audio Eng. 2016, 40, 9–14. [Google Scholar]
Figure 1.
Binaural signal collection scene in real rooms. (a) Room A (b) Room B.

Figure 2.
Sketch map of positions of sound source and receiving point in real rooms. (a) Room A (b) Room B.
Figure 2.
Sketch map of positions of sound source and receiving point in real rooms. (a) Room A (b) Room B.

Figure 3.
Sound field model by use of ODEON 8.0 in Room A.

Figure 4.
The distinguishability between real and simulated binaural signals. (a) Room A (b) Room B.
Figure 4.
The distinguishability between real and simulated binaural signals. (a) Room A (b) Room B.

Figure 5.
Cluster analysis of subjective experimental results. In the figure, the x-coordinate and the y-coordinate denote the subject number and the calculated distance, respectively. The larger the distance, the greater the difference between the participant’s evaluation result and other participants’.

Figure 6.
The changes of spatial sound field auditory of the three musical sounds. The colors represent different spatial models: red, blue, and green correspond to a, b, and c models in Table 4. The size of the fan indicates the number of the stimuli selected at a receiving point in this space; the larger the number being selected, the larger the fan area. (a) Flute; (b) Violin; (c) Symphony.

Figure 7.
The spatial sound field auditory changes for different wall absorption coefficients for the three musical sounds. The colors represent different spatial models: green, gray, red, and yellow correspond to e, f, c, and d models. The size of the fan indicates the number of the stimuli selected at a receiving point in this space; the larger the number being selected, the larger the fan area. (a) Flute; (b) Violin; (c) Symphony.

Figure 8.
The spatial sound field auditory changes for the different space shape for the three musical sounds. The colors represent different spatial models: blue, red and yellow correspond to b, g, and h models. The size of the fan indicates the number of the stimuli selected at a receiving point in this space; the larger the number being selected, the larger the fan area. (a) Flute; (b) Violin; (c) Symphony.

Figure 9.
The sound perception changes caused by closed space parameters of (a) space volume, (b) wall surface sound absorption coefficient, and (c) space shape when the position of the receiving point is not considered. The x, y, and z axes represent the parameter change, the testing audio, and the corresponding percentage of the times being selected, respectively; the higher the percentage, the better the auditory perception.


Table 1.
Experimental apparatus for binaural signal collection in the rooms.
| Equipment | Model | Brand | Number |
|---|---|---|---|
| Spherical sound source | 4292 | B&K, Denmark | 1 |
| Dual channel sound card | M-Track | M-AUDIO | 1 |
| Microphone | Mic M N201 | Shengwang, Beijing | 2 |
| Power amplifier | 2716C | B&K, Denmark | 1 |
| Dummy head | 4100-D | B&K, Denmark | 1 |
Table 2.
The parameters of real rooms.
| Room No. | L/m | W/m | H/m | S/m2 | V/m3 | T60/s | Background Noise/dB(A) |
|---|---|---|---|---|---|---|---|
| A | 7.30 | 6.50 | 3.05 | 179.08 | 144.72 | 0.162 | 35 |
| B | 5.70 | 3.00 | 3.00 | 86.40 | 51.30 | 0.119 | 37 |
Table 3.
The dimensions of closed-space models with different volumes.
| Space Model | L/m | W/m | H/m | S/m2 | V/m3 |
|---|---|---|---|---|---|
| a | 4 | 2 | 3 | 52 | 24 |
| b | 6 | 4 | 4 | 128 | 96 |
| c | 8 | 6 | 4 | 208 | 192 |
Table 4.
The positions of sound source and receiving points in closed-space models.
| Space Model | a | b | c | |
|---|---|---|---|---|
| Coordinates of sound source | (2, 0, 1.4) | (3, 0, 2) | (4, 0, 2) | |
| Coordinates of receiving points | 1 | (1, 0, 1) | (1.5, 0, 1) | (2, 0, 1) |
| 2 | (3, 0, 2) | (4.5, 0, 3) | (6, 0, 3) | |
| 3 | (2, 0.5, 1) | (3, 1, 1) | (4, 1.5, 1) | |
| 4 | (2, −0.5, 2) | (3, −1, 3) | (4, −1.5, 3) | |
Table 5.
The dimensions of closed-space models with different volumes.
| Space Model | Dimension Diameter/m | Volume Calculation | S/m2 | V/m3 |
|---|---|---|---|---|
| b | L—6 W—4 H—4 | V = L × W × H | 128 | 96 |
| g | L—6, r—3.2 | V = 1/2 × πr2 × L | 98.72 | 96.51 |
| h | r—3.58 | V = 1/2 × 4πr3/3 | 62.76 | 96.10 |
Table 6.
The positions of sound source and receiving points in closed-space models.
| Space Model | b | g | h | |
|---|---|---|---|---|
| Coordinates of sound source | (3, 0, 2) | (3, 0, 1.6) | (0, 0, 1.6) | |
| Coordinates of receiving points | 1 | (1.5, 0, 1) | (1.5, 0, 0.8) | (1, 1, 0.8) |
| 2 | (4.5, 0, 3) | (4.5, 0, 2.4) | (−1, −1, 2.4) | |
| 3 | (3, 1, 1) | (3, 1.5, 0.8) | (0, 0, 0.8) | |
| 4 | (3, -1, 3) | (3, −1.5, 2.4) | (0, 0, 2.4) | |
Table 7.
Stimulus pairs of a musical sound at the same receiving point.
| Structural Parameter | Stimulus Pair | Number of Pairs | |||||
|---|---|---|---|---|---|---|---|
| Volume | (a,a) | (a,b) | (a,c) | 9 | |||
| (b,a) | (b,b) | (b,c) | |||||
| (c,a) | (c,b) | (c,c) | |||||
| Absorption coefficient | (c,c) | (c,d) | (c,e) | (c,f) | 16 | ||
| (d,c) | (d,d) | (d,e) | (d,f) | ||||
| (e,c) | (e,d) | (e,e) | (e,f) | ||||
| (f,c) | (f,d) | (f,e) | (f,f) | ||||
| Shape | (b,b) | (b,g) | (b,h) | 9 | |||
| (g,b) | (g,g) | (g,h) | |||||
| (h,b) | (h,g) | (h,h) | |||||
| Total | 34 | ||||||
Table 8.
Results of two-factor nonrepetitive experimental variance analysis. F(n1,n2) denotes the value in the F distribution table with freedom degree of n1 and n2. It is hypothesized that the factors have no significant impact on the auditory perception. When the calculated F is less than F(n1,n2), the hypothesis is accepted. When the calculated F is larger than F(n1,n2), the hypothesis is rejected; the factor is considered to impact auditory perception significantly.
| Signal Type | F | F | F | |||
|---|---|---|---|---|---|---|
| Volume F(2,8) = 4.46 | Receiving Point F(3,8) = 4.07 | Absorption Coefficient F(3,9) = 3.86 | Receiving Point F(3,9) = 3.86 | Shape F(2,8) = 4.46 | Receiving Point F(3,8) = 4.07 | |
| Flute | 12.37 | 0.15 | 145.89 | 0 | 3.52 | 0 |
| Violin | 9.05 | 0 | 14.77 | 0.09 | 14.77 | 0.09 |
| Symphony | 2.13 | 0 | 63.81 | 0 | 0.81 | 0 |
Table 9.
Post-hoc of two-factor ANOVA. The samples are hypothesized to be of no significant difference (α = 00.05). H = 0 denotes that the hypothesis is accepted, while H = 1 denotes that the hypothesis is rejected.
Table 9.
Post-hoc of two-factor ANOVA. The samples are hypothesized to be of no significant difference (α = 00.05). H = 0 denotes that the hypothesis is accepted, while H = 1 denotes that the hypothesis is rejected.
| Sample | Volume | Absorption Coefficient | Shape | |||||||||||
|---|---|---|---|---|---|---|---|---|---|---|---|---|---|---|
| H | ab | ac | bc | cd | ce | cf | de | df | ef | bg | bh | gh | ||
| Signal Type | ||||||||||||||
| flute | 1 | 1 | 1 | 1 | 1 | 1 | 1 | 1 | 1 | 1 | 0 | 1 | ||
| violin | 1 | 1 | 0 | 1 | 1 | 1 | 1 | 1 | 1 | 1 | 1 | 1 | ||
| symphony | 0 | 0 | 0 | 1 | 1 | 1 | 1 | 1 | 1 | 1 | 0 | 0 | ||
© 2019 by the authors. Licensee MDPI, Basel, Switzerland. This article is an open access article distributed under the terms and conditions of the Creative Commons Attribution (CC BY) license (http://creativecommons.org/licenses/by/4.0/).
Share and Cite
MDPI and ACS Style
Wang, L.; Ma, X.; Li, R.; Zeng, X. Impact of Structural Parameters on the Auditory Perception of Musical Sounds in Closed Spaces: An Experimental Study. Appl. Sci. 2019, 9, 1416. https://0-doi-org.brum.beds.ac.uk/10.3390/app9071416
AMA Style
Wang L, Ma X, Li R, Zeng X. Impact of Structural Parameters on the Auditory Perception of Musical Sounds in Closed Spaces: An Experimental Study. Applied Sciences. 2019; 9(7):1416. https://0-doi-org.brum.beds.ac.uk/10.3390/app9071416
Chicago/Turabian StyleWang, Lei, Xiyue Ma, Rong Li, and Xiangyang Zeng. 2019. "Impact of Structural Parameters on the Auditory Perception of Musical Sounds in Closed Spaces: An Experimental Study" Applied Sciences 9, no. 7: 1416. https://0-doi-org.brum.beds.ac.uk/10.3390/app9071416
Note that from the first issue of 2016, this journal uses article numbers instead of page numbers. See further details here.