Mechanical Behaviour of TRC Composites: Experimental and Analytical Approaches


Department of Civil and Environmental Engineering, Politecnico di Milano, 20133 Milan, Italy
*
Author to whom correspondence should be addressed.
Appl. Sci. 2019, 9(7), 1492; https://0-doi-org.brum.beds.ac.uk/10.3390/app9071492
Submission received: 15 March 2019
/
Revised: 2 April 2019
/
Accepted: 3 April 2019
/
Published: 10 April 2019
(This article belongs to the Special Issue Textile Reinforced Cement Composites: New Insights in Structural and Material Engineering)
Abstract
:Featured Application
Optimisation of textile reinforced concrete (TRC) composites for new constructions and for the seismic retrofitting of existing buildings.
Abstract
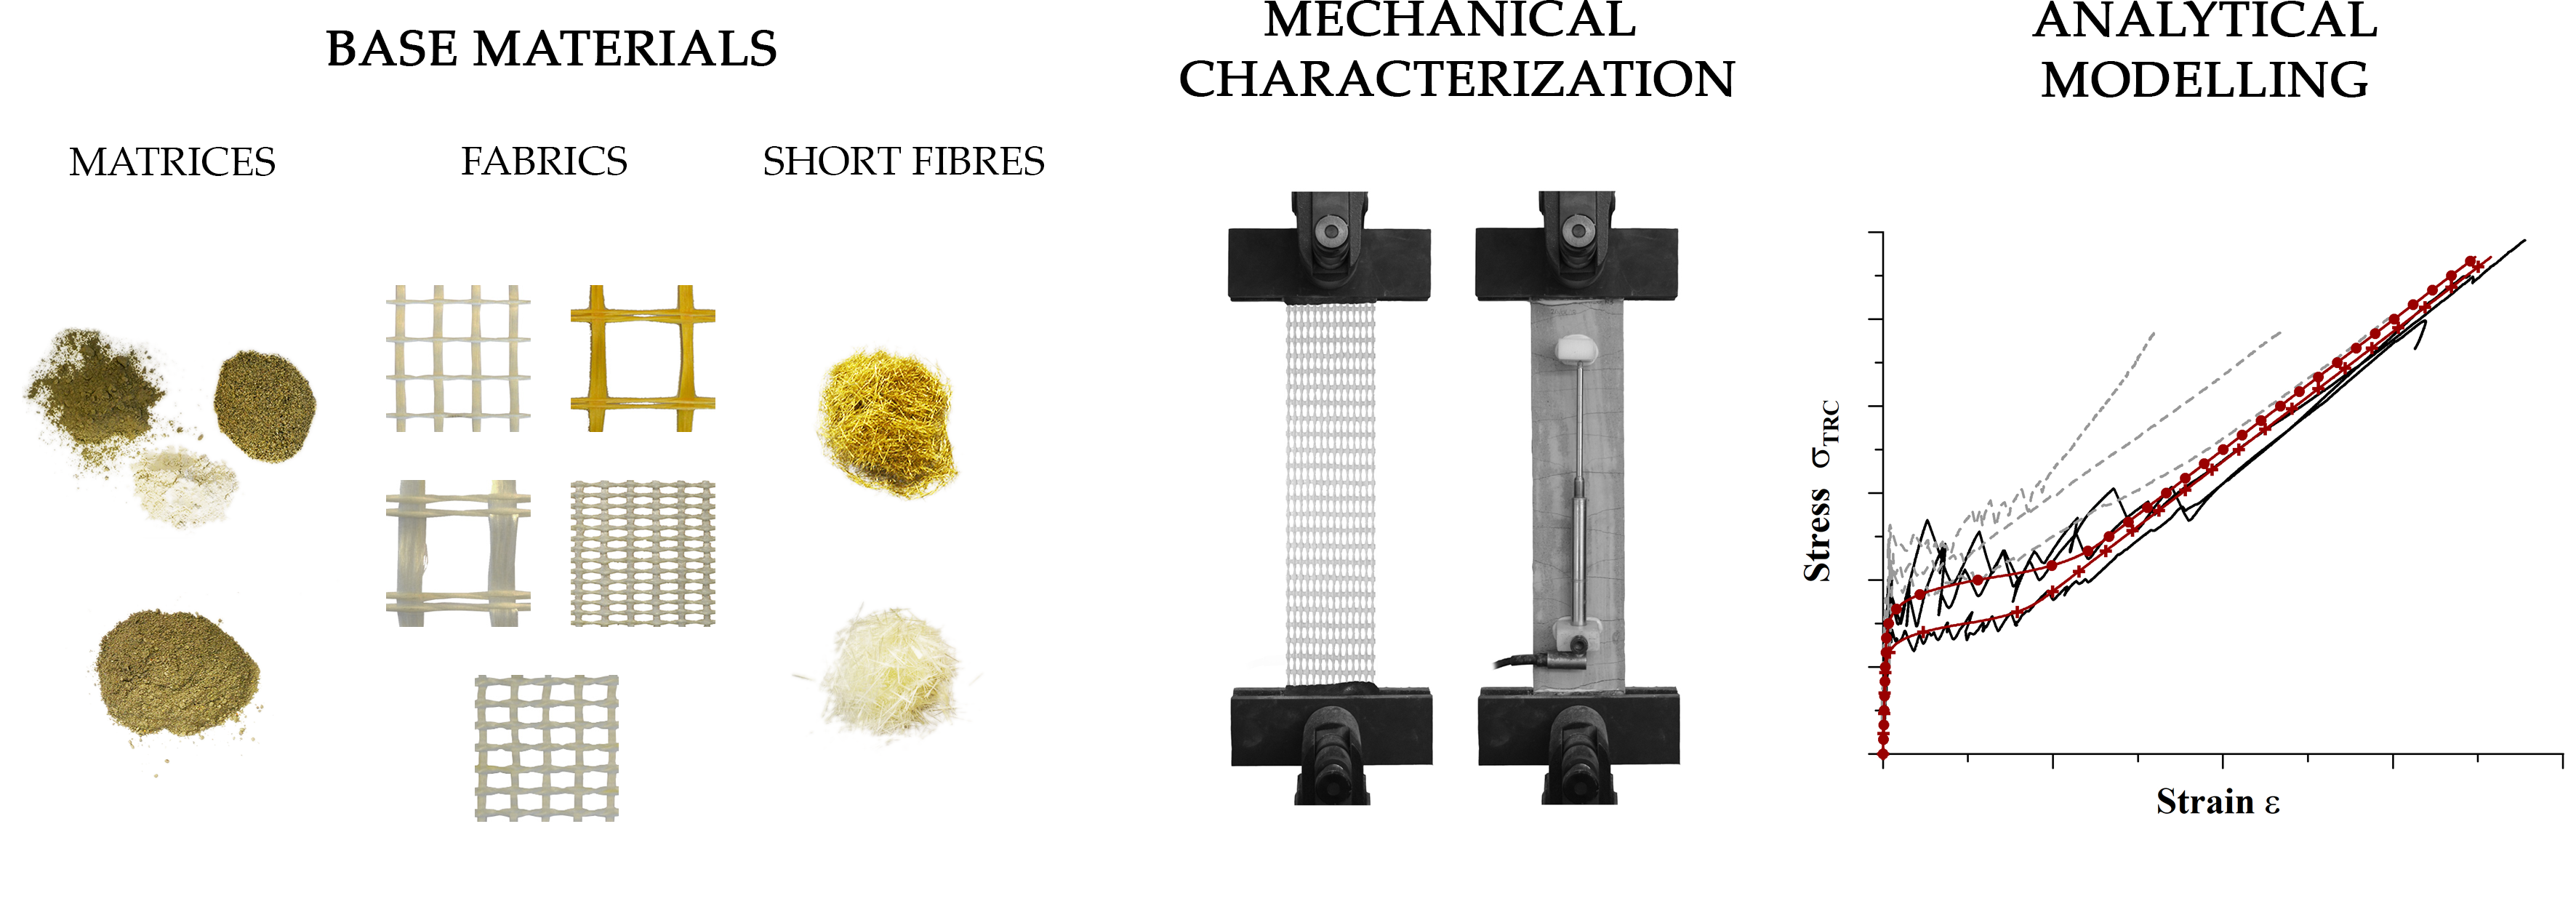
Textile reinforced concrete (TRC) is a promising high-performance material that has been employed with success in new constructions, as well as a strengthening layer of existing structural components. In this work, we document the optimisation procedure of textile-based composites for new construction and for the seismic retrofitting of under-reinforced concrete elements and masonry buildings. The study, aimed at maximising the material performances avoiding waste of economic resources, was addressed by means of a series of uniaxial tensile tests conducted on a wide set of alkali-resistant (AR) glass fabrics and TRCs. The samples differed in terms of cement-based matrices, embedded textiles and addition of dispersed microfibers. The results highlight the effects of fabric characteristics and introduction of short fibres on the mechanical behaviour, proposing novel comparison parameters based upon the load bearing capacity and the deformation response of the composites. The application of simplified analytical models borrowed from the literature finally revealed the limitations of the available predictive approaches, suggesting future lines of investigation.

1. Introduction
The growing interest in cost-effective solutions for the structural upgrading of existing buildings and infrastructures has gradually oriented research towards the optimisation of high-performance cement-based composites originally conceived for new lightweight constructions. Such materials, known as textile reinforced concretes (TRCs) [1,2] and fabric-reinforced cementitious mortars (FRCMs) in their recent developments [3,4,5], are generally employed in the form of thin layers and have proven able to significantly enhance the load-bearing and deformation capacities of underperforming structures [6]. Among economy, ease of application, fire safety, durability and compatibility with the hosting substrates, one of the main advantages is the limited increase in the global mass and, hence, the containment of the inertial forces activated during seismic motions.
Considering the large surfaces targeted by the retrofitting interventions, a primary objective is to avoid material wastage; in this sense, there is a major need of guidelines and simplified predictive models that can effectively assist the identification of optimum design solutions. Being the tensile behaviour of TRC strongly influenced by the matrix composition [7,8], the geometrical and chemo-mechanical characteristic of the embedded fabrics [9,10,11] and the possible presence of short fibres [12], in this paper we aim at further clarifying the involved phenomena, introducing comparison parameters that may represent a starting point for future developments.
The investigation procedures were set in the context of recent legislative initiatives, which resulted in new Italian regulations: (1) the CNR DT-215 [13], National Research Council technical instructions for the design, execution and control of static consolidation interventions through the use of FRCMs; and (2) the mandatory “Guidelines for the identification, qualification and control of fibre-reinforced inorganic-matrix composites, referred to as FRCMs”, recently issued by the Supreme Council for Public Works [14]. Against this background, experimental results pertaining to 70 fabric specimens and 72 composites tested in uniaxial tension are presented, discussed and modelled by means of a well-established analytical approach. In particular, the ACK model originally proposed by Aveston, Cooper and Kelly [15,16] and extended to E-glass fibre reinforced Inorganic Phosphate Cement (IPC) by Cuypers and Wastiels [17] was critically assessed, highlighting the merits, the predictive limitations and the room for improvement.
2. Mechanical Characterisation and Selection of Base Materials
FRCM samples were manufactured out of two alternative mix designs: (i) a flowable high-strength micro-concrete for applications comprising temporary formworks; and (ii) a commercial ready-mix thixotropic mortar developed for repairing. One layer of alkali-resistant (AR) glass fabric, alternately selected amongst seven products, was always placed at mid-thickness, by way of a traditional hand lay-up technique. The dispersion of short fibres into the matrix was also explored, with a view to improve energy absorption, control crack openings and guarantee greater structural performances at serviceability. Relevant material properties are described in the following.
2.1. Cement-Based Materials
The compositions of the two cement-based matrices are displayed in Table 1 and Table 2. Matrix M1 was a fine-grained self-compacting very high performance concrete (VHPC), characterised by an average cubic compressive strength fcc of 93.55 MPa and a flexural tensile strength fctf of 14.26 MPa, while matrix M2 was a shrinkage-compensated thixotropic mortar exhibiting an average cubic compressive strength fcc of 58.94 MPa and a flexural tensile strength fctf of 7.02 MPa (Table 3).
Bending and compressive tests were carried out on six nominally identical prismatic specimens (40 × 40 × 160 mm3) according to UNI EN 196 [18] and the tensile strengths fct were deduced from the bending results via the formula proposed in the Model Code 2010 (MC2010) [19]:
where h is the beam depth (40 mm) and α is a coefficient that decreases as the concrete brittleness increases; on a first approximation, α was taken equal to 0.06 (value referred to normal strength concrete) for both M1 and M2. Elastic moduli were estimated from the average compressive strength (42.9 GPa for M1 according to MC2010), or from data provided by the manufacturer (28 GPa for M2). Concerning the commercial mortar, it is important to underline the discrepancy between the mean flexural results of Table 3 (7.02 MPa) and the average values declared by the producer (10.1 MPa, corresponding to an fctm of 4.47 MPa), probably caused by a different casting procedure. Beam specimens were in fact manufactured without paying much attention to the material compaction and this resulted in a macroscopic porosity.
2.2. Alkali-Resistant Glass Fabrics
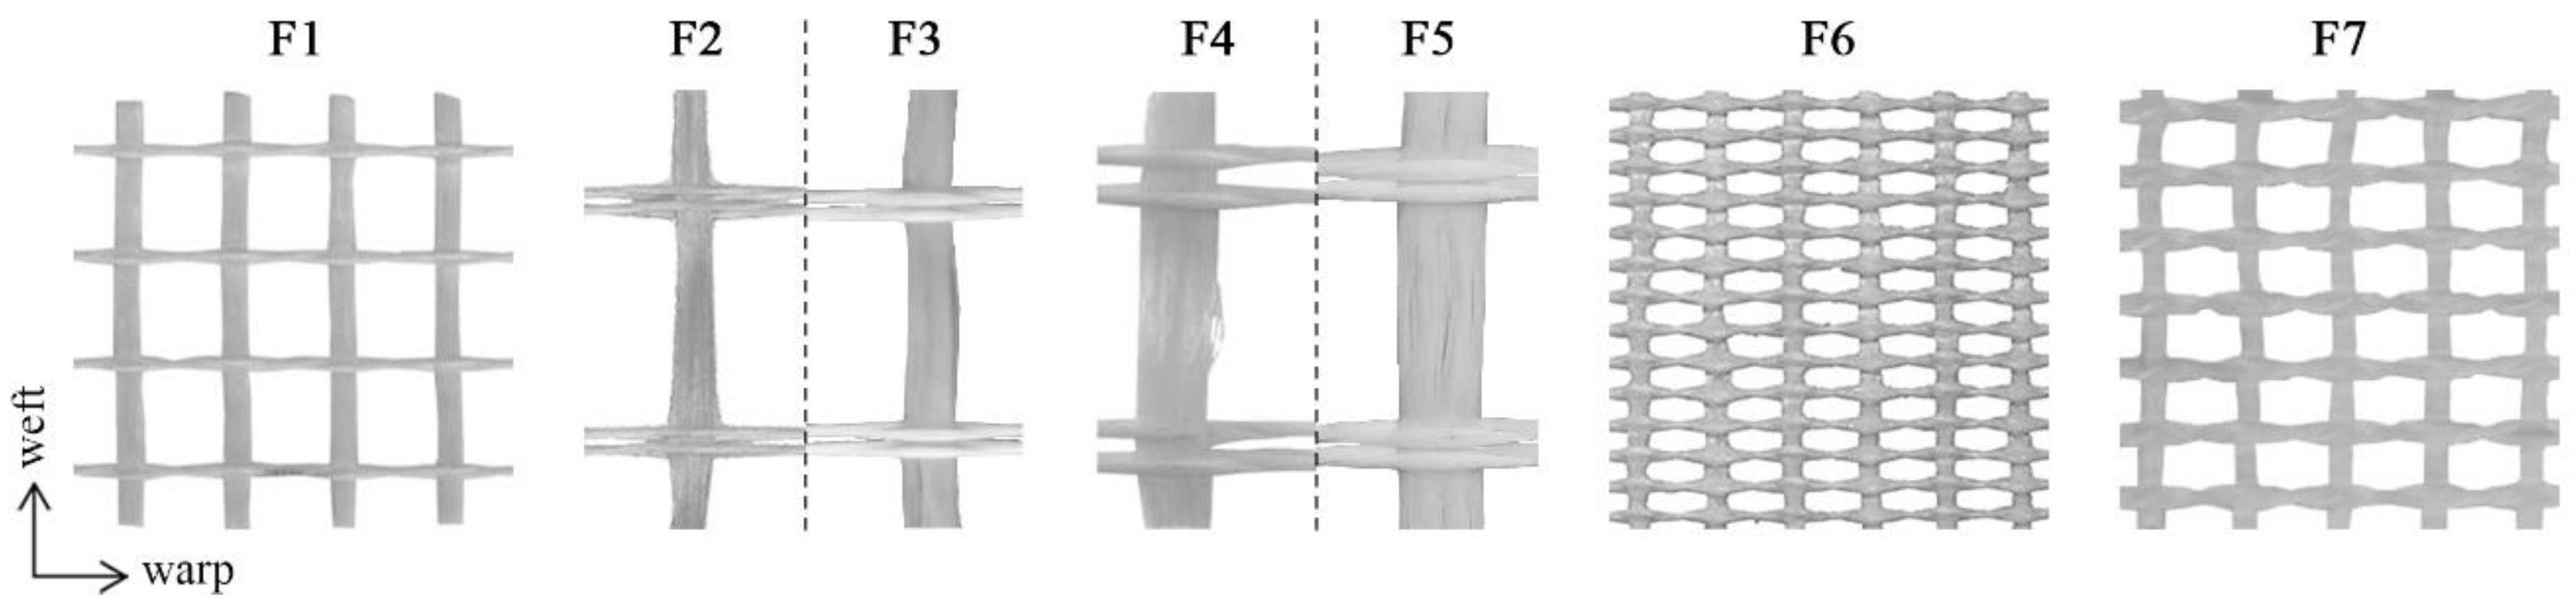
The seven AR-glass fabrics depicted in Figure 1 were selected from a broad set proposed by the manufacturer, following preliminary considerations aimed at ensuring the typical trilinear tensile behaviour of TRC and covering diverse structural interventions, where textile geometry and tensile capacity play a significant role.
The main characteristics of the fabrics are given in Table 4, where it is possible to observe that grid spacings between 5 and 38 mm were explored and both styrene-butadiene rubber (SBR) and epoxy coatings were considered. As displayed in Figure 1, Fabrics F2 and F3 as well as F4 and F5 were identical, with the only exception being the coating nature; on close observation it was possible to detect that slight geometrical alterations were present, since SBR-coated fabrics tended to be more squashed at the manufacturing stage. To the exclusion of Fabrics F6 and F7, the reinforcements were balanced in the warp and in the weft directions, as proved by the equivalent thicknesses teq collected in Table 4. This geometrical parameter was evaluated according to the following steps: (i) calculation of the equivalent wire section Aw as the ratio between the Tex (g/km) and the glass density (2680 kg/m3); (ii) calculation of the number of wires nw over 1 m, according to the spacing; and (iii) calculation of teq as the ratio between the global area (equivalent wire section times the number of wires Aw · nw) and 1 m width.
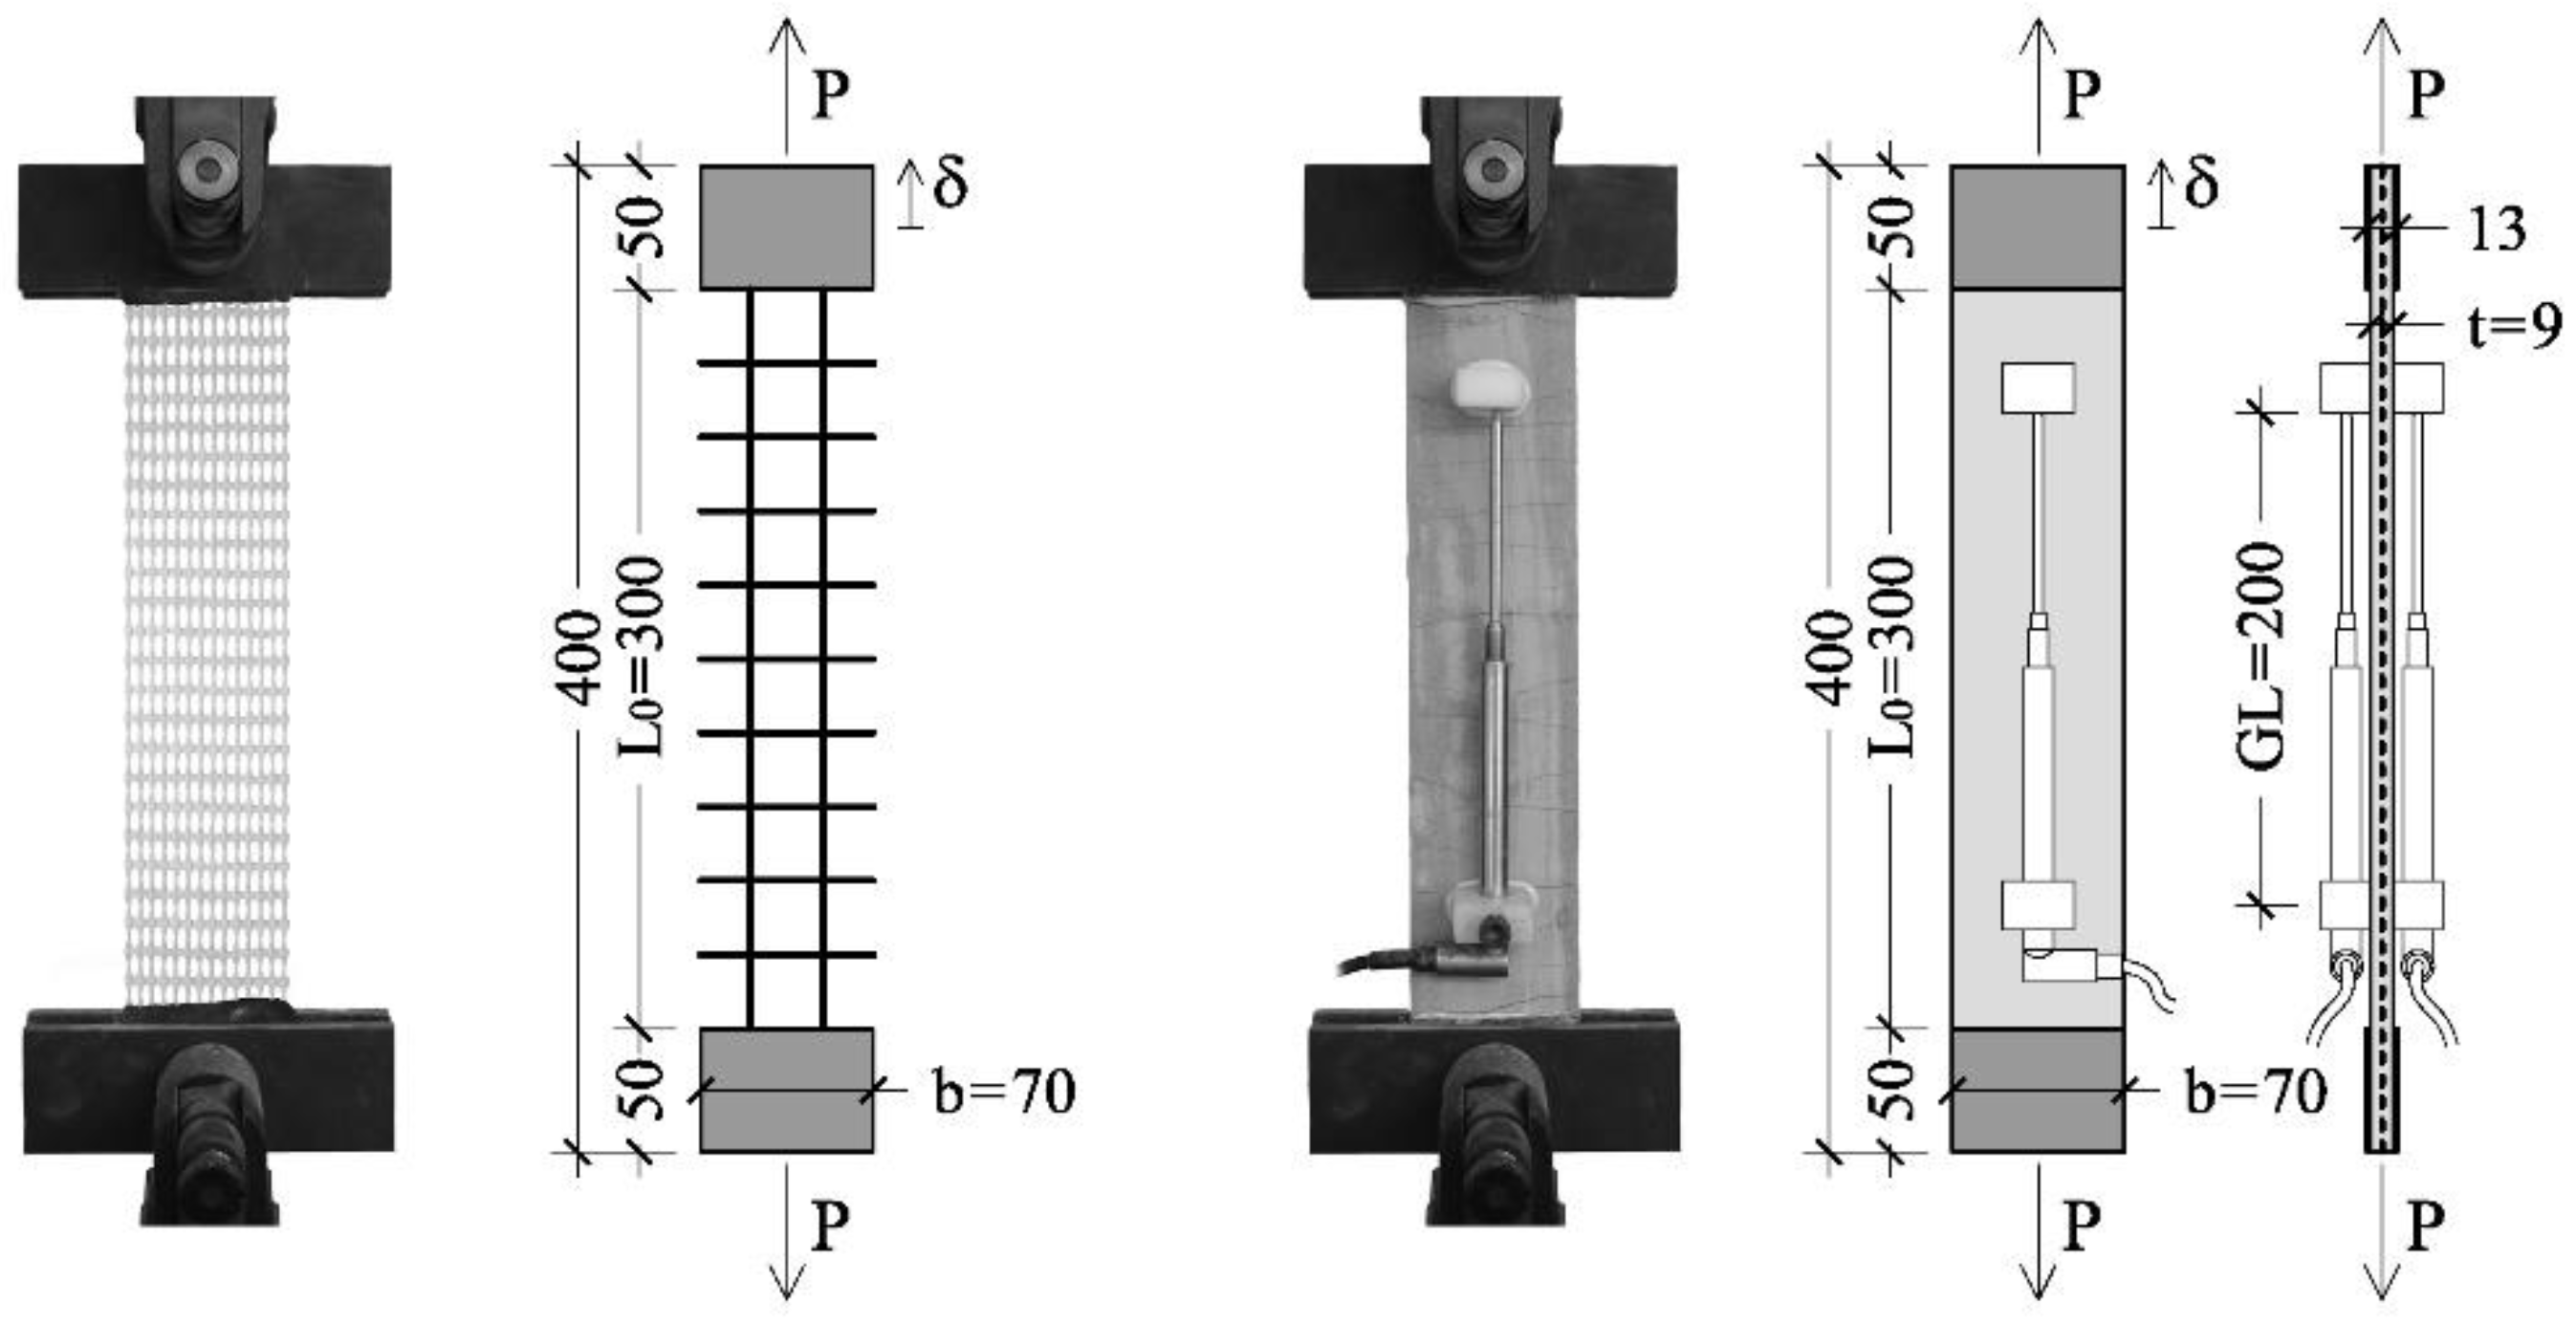
For each direction of the reinforcements, five uniaxial tensile tests were performed according to the strip method [20] of Figure 2, obtaining the average peak loads Pmax,avg given in Table 5. The samples (70 × 400 mm2 in size) were clamped to an electromechanical press (a clamping force of about 8 kN was applied) with a maximum load capacity of 30 kN and a constant machine crosshead displacement (stroke) rate of 100 mm/min was taken as the feedback parameter. Epoxy resin tabs were preliminary created at the ends of each specimen (see Figure 2), to prevent stress localisation and slippage phenomena within the clamping zones.
Referring to the standard deviations (std%) of Table 5, smaller pick distances (Fabrics F6 and F7) were generally associated to smaller dispersion of the mechanical results, in particular in the warp direction. The reason for this was the greater redundancy of the sample, which resulted less exposed to uneven stress distributions due to imprecise fabric geometry or clamping misalignments. The glass areas Af given in Table 5 represent the cross-sections of the assembled rovings actually embedded within the 70 mm specimen widths, i.e. subjected to the tensile load P; as one should note, Af does not correspond to the product between the equivalent thickness teq and 70 mm, since the strip width was generally not an exact multiple of the grid spacing. The fabric efficiency factor EFf was instead calculated as follows:
where σfu is the glass filament strength, assumed equal to 2000 MPa according to the manufacturer data. The parameter EFf provides crucial information on the rate of utilisation of the reinforcing material and may hence be related to cost-efficiency considerations. As an example, despite Fabric F4 being characterised by a 43% smaller Af than Fabric F7 (warp direction), the average peak loads were nearly the same, meaning that in Fabric F7 several glass filaments were basically ineffective. This was explained by the greater capability of epoxy resin to impregnate the glass filaments, limiting telescopic failure modes [21].
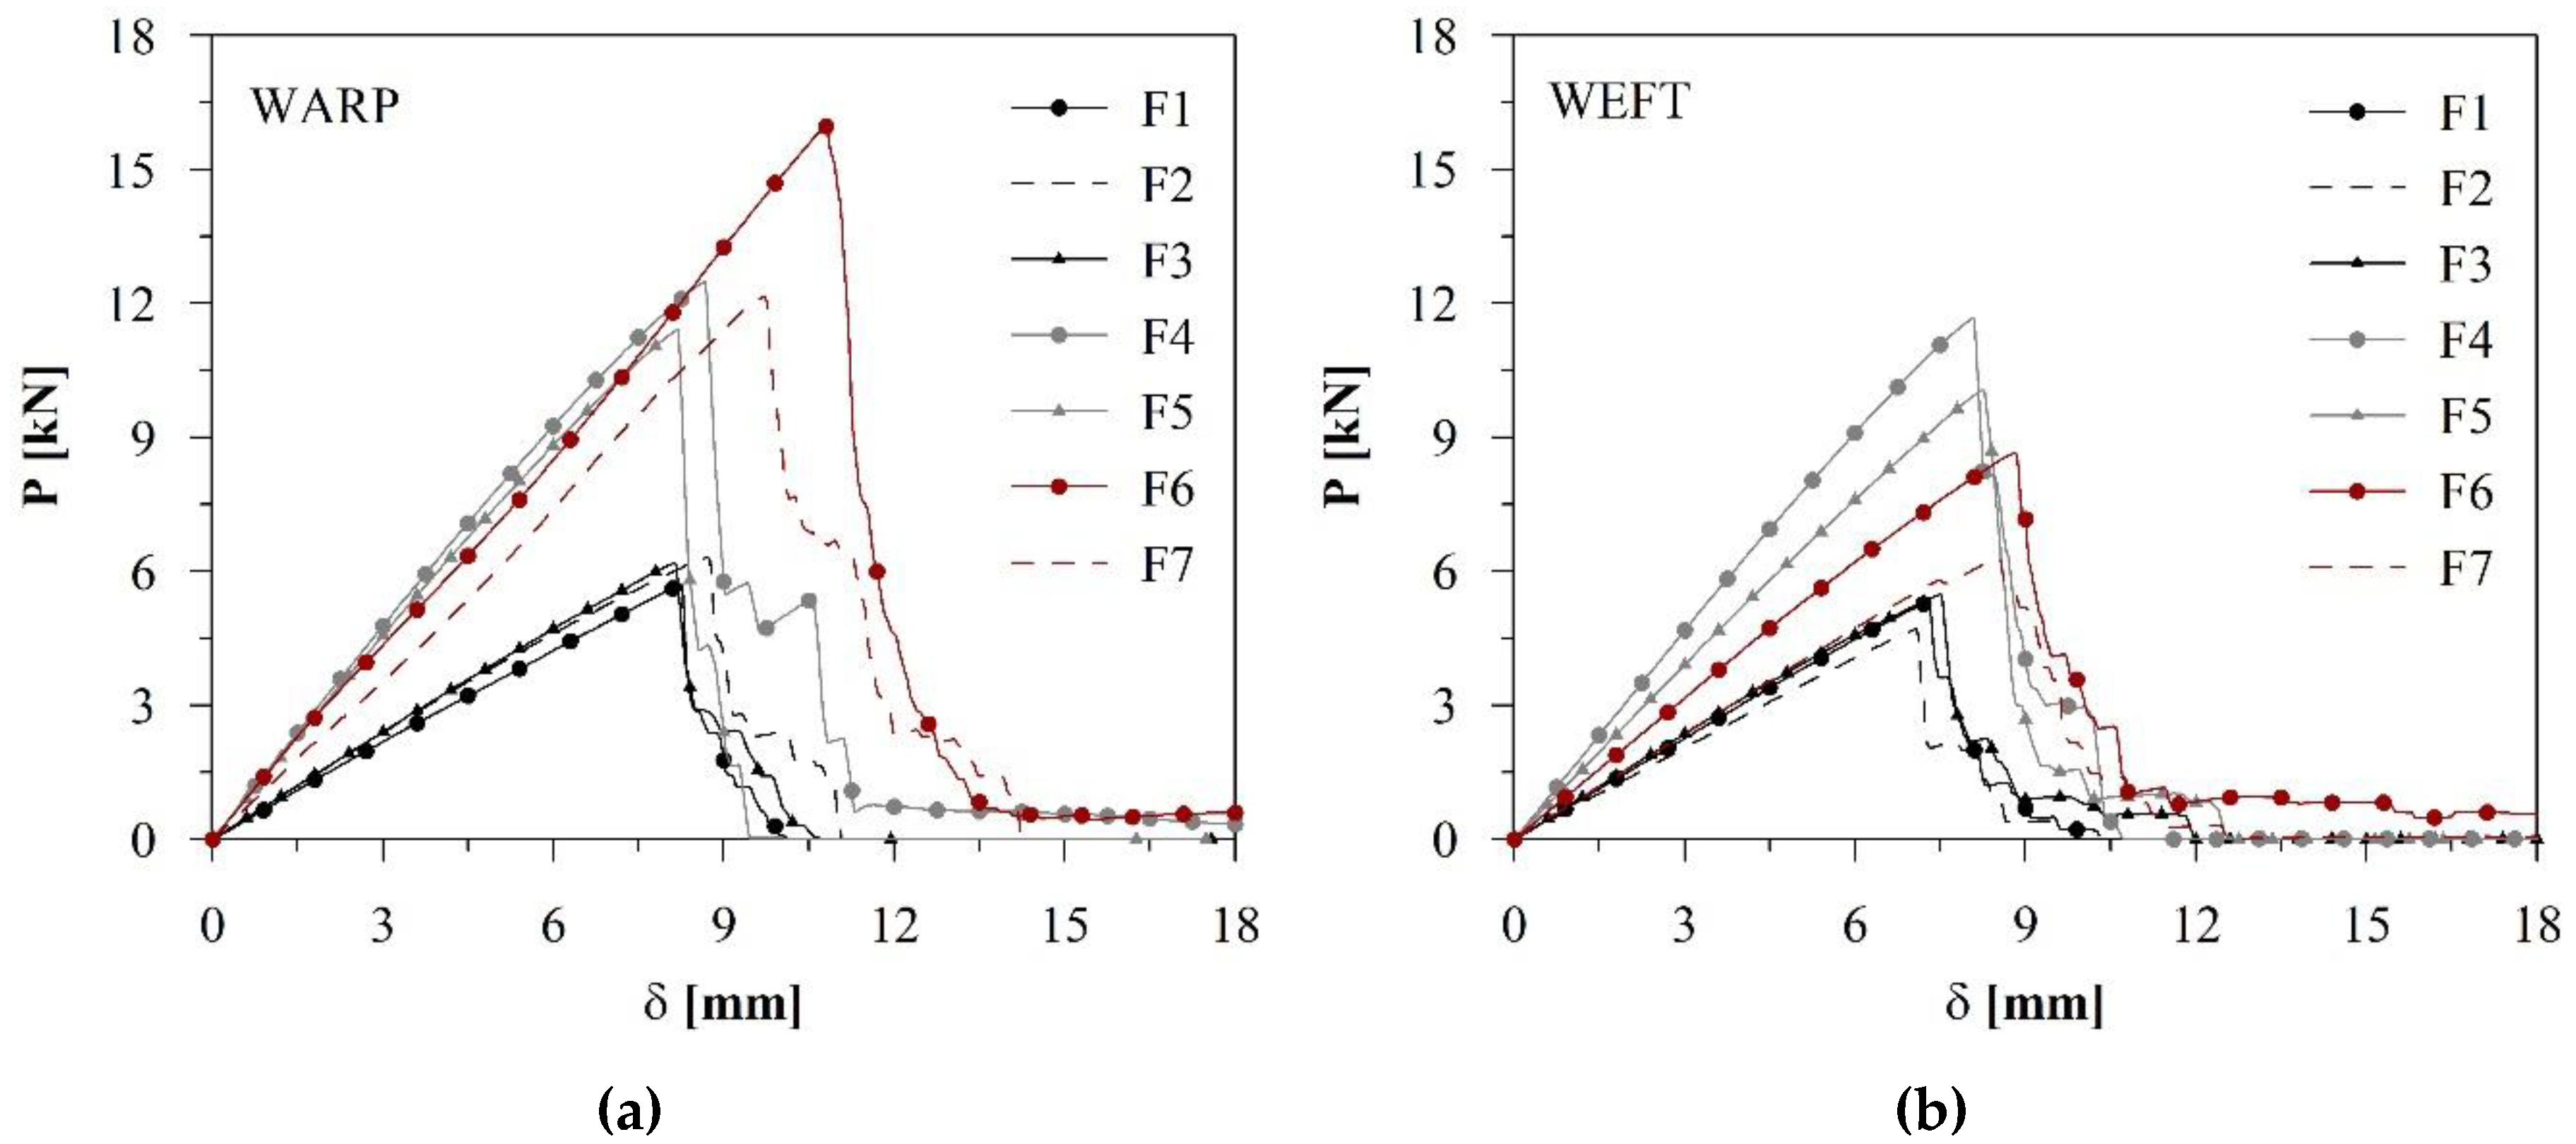
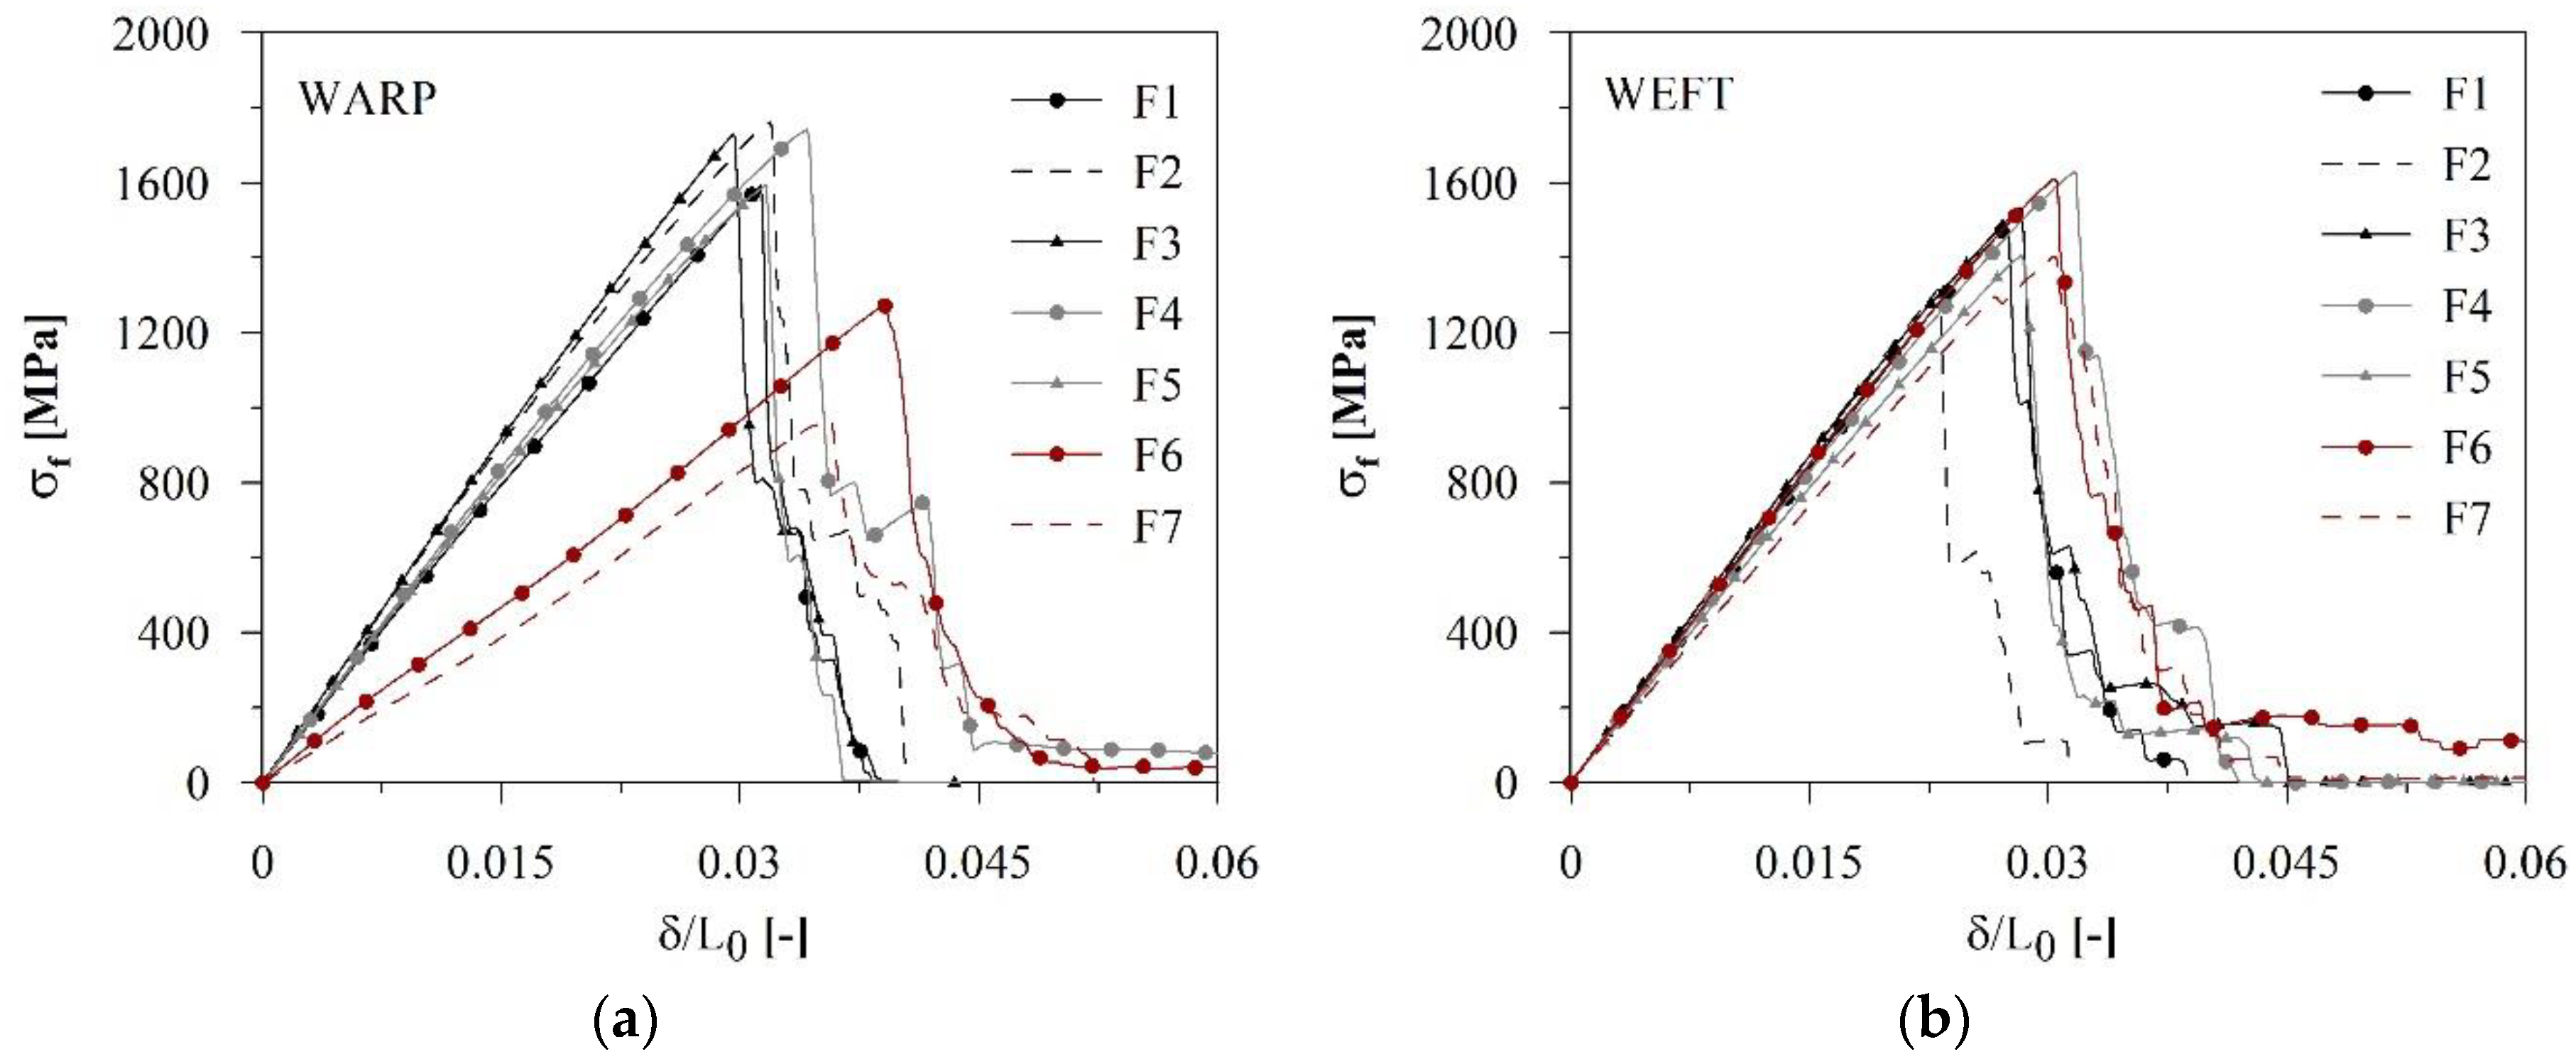
Average load vs. stroke displacement (P-δ) and nominal fabric stress vs. normalised displacement (σf -δ/L0) curves are plotted in Figure 3 and Figure 4, respectively; the nominal fabric stress σf was calculated as Pf,max,avg/Af, while the normalised displacement was obtained as the ratio between the stroke displacement and the free specimen length of Figure 2 (about 300 mm). As clearly shown in Figure 4a, heavy-duty textiles F6 and F7 markedly deviated from Fabrics F1–F5, confirming their lower efficiency. It is also worth noticing that F6 and, to a greater extent, F7 became stiffer as the applied tensile load increased, as a result of a strong fabric “Poisson” effect that is addressed below.
2.3. Short Fibres
Hybrid reinforcing solutions were explored by including in the cement-based mortars the short fibres described in Table 6: (i) straight high-carbon steel microfibers (diameter 0.21 mm, length 13 mm, aspect ratio 62, tensile strength 2750 MPa), encoded as S; and (ii) high alkali resistance polyvinyl alcohol fibres (equivalent diameter 0.16–0.24 mm, length 18 mm, aspect ratio 90, yield strength 790–1160 MPa), encoded as PVA. Nominal volume fractions Vsf of 1% were considered, although it is fair to note that segregation of steel fibres in the fresh-state VHPC led, in some cases, to effective volume fractions of about 0.5%, as proven by the wash-out of the fibres segregated in the mixer bowl; however, as discussed in the following, no significant changes in the response were observed.
As shown in the literature [12], synergy effects can be achieved thanks to the mechanical stabilisation ensured by the textiles, potentially improving the material strength, the fracture behaviour and the bond between the yarns and the matrix.
3. Mechanical Characterisation of TRC Composites
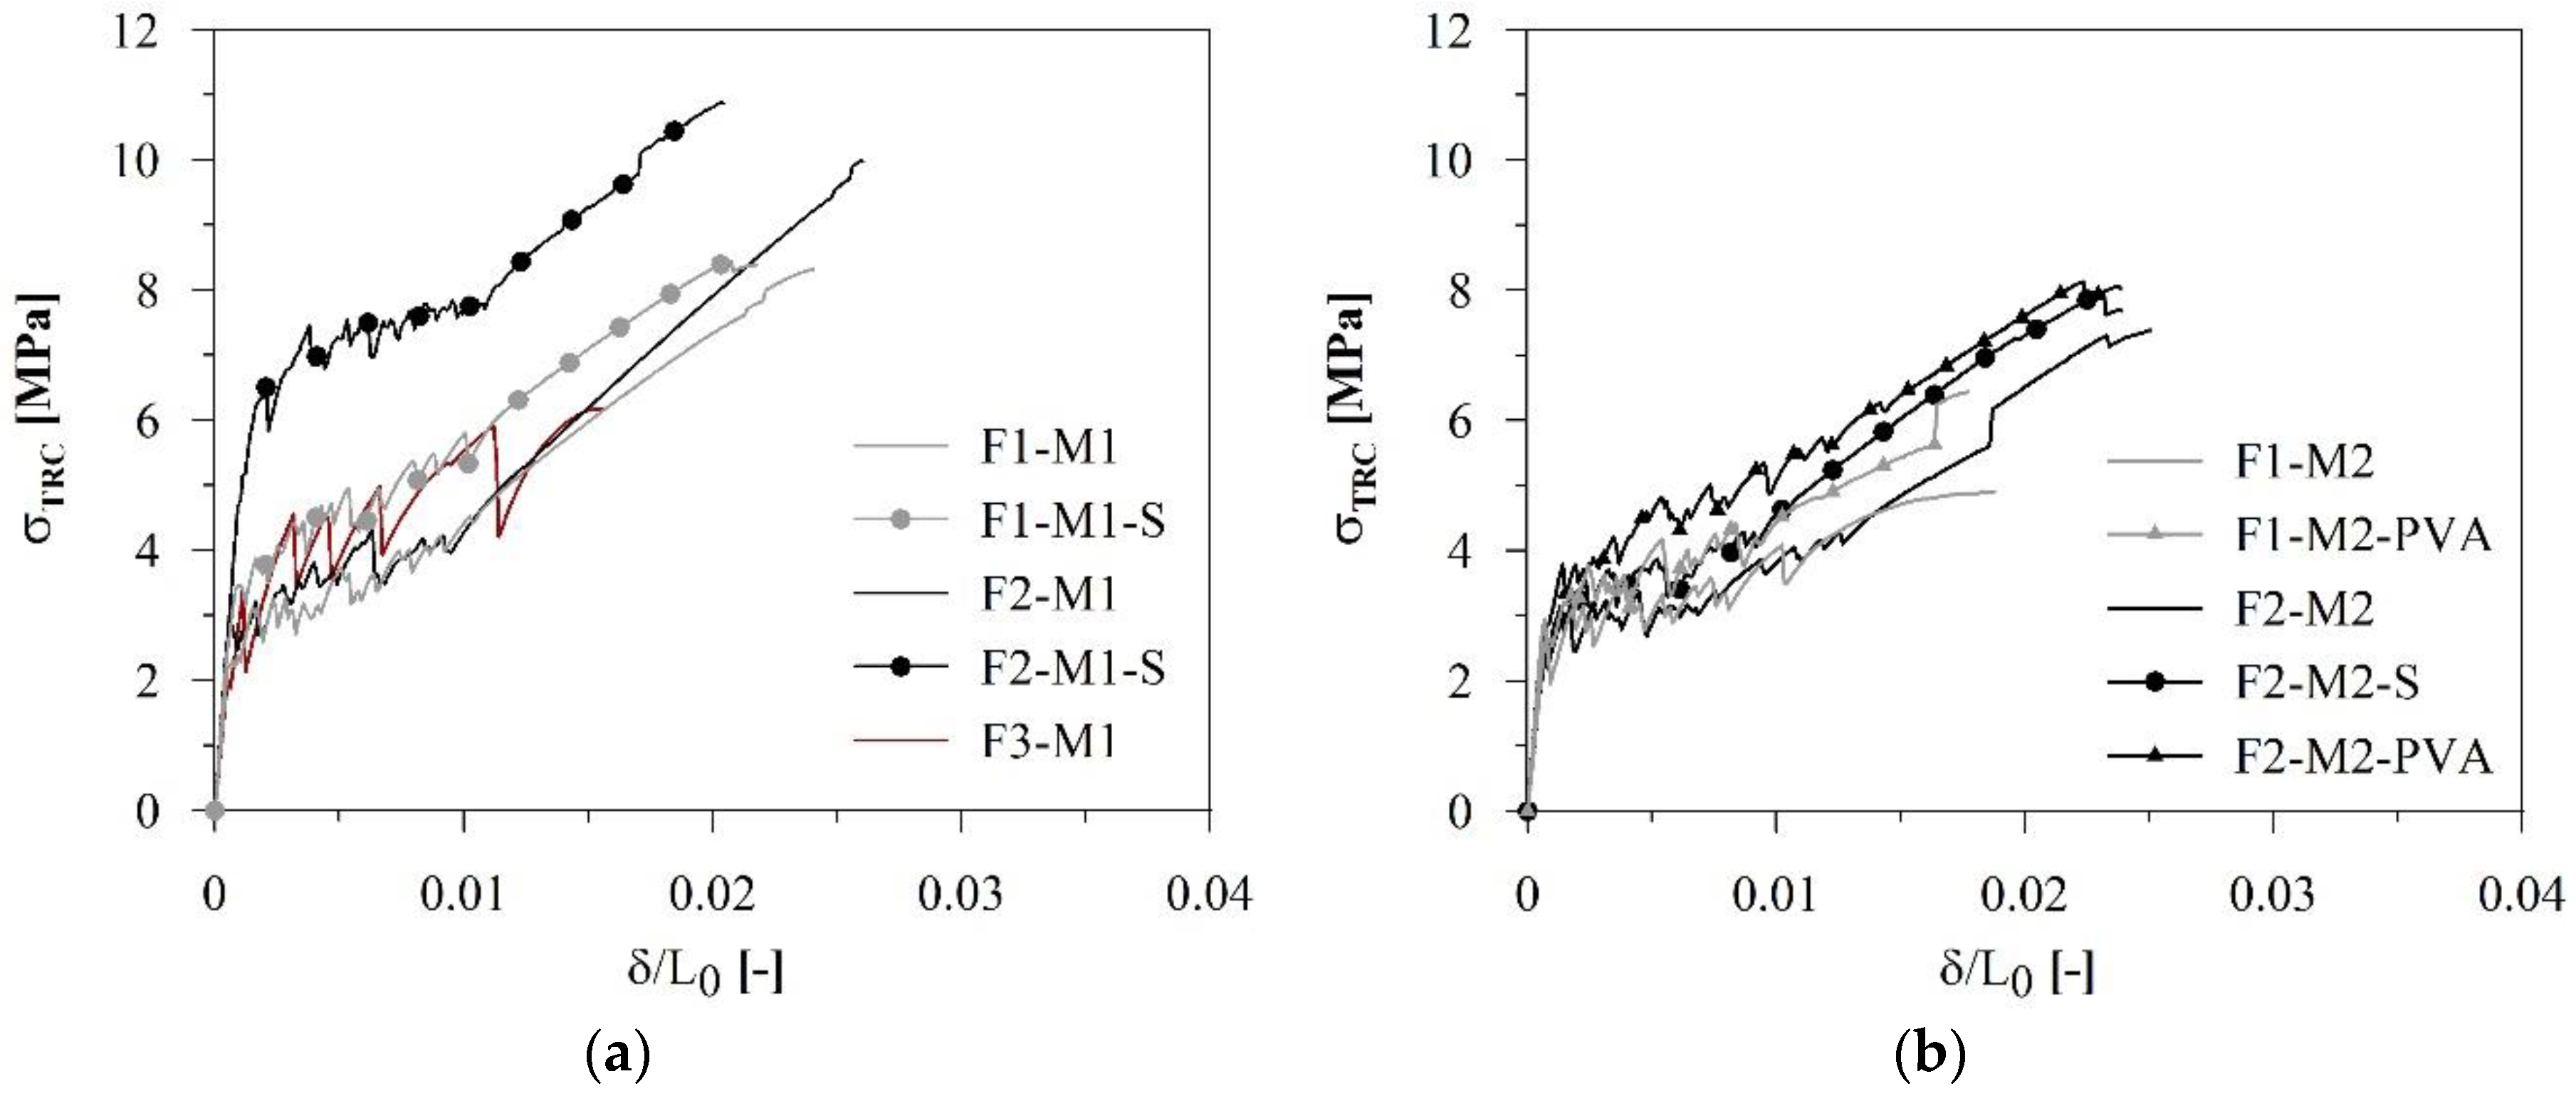
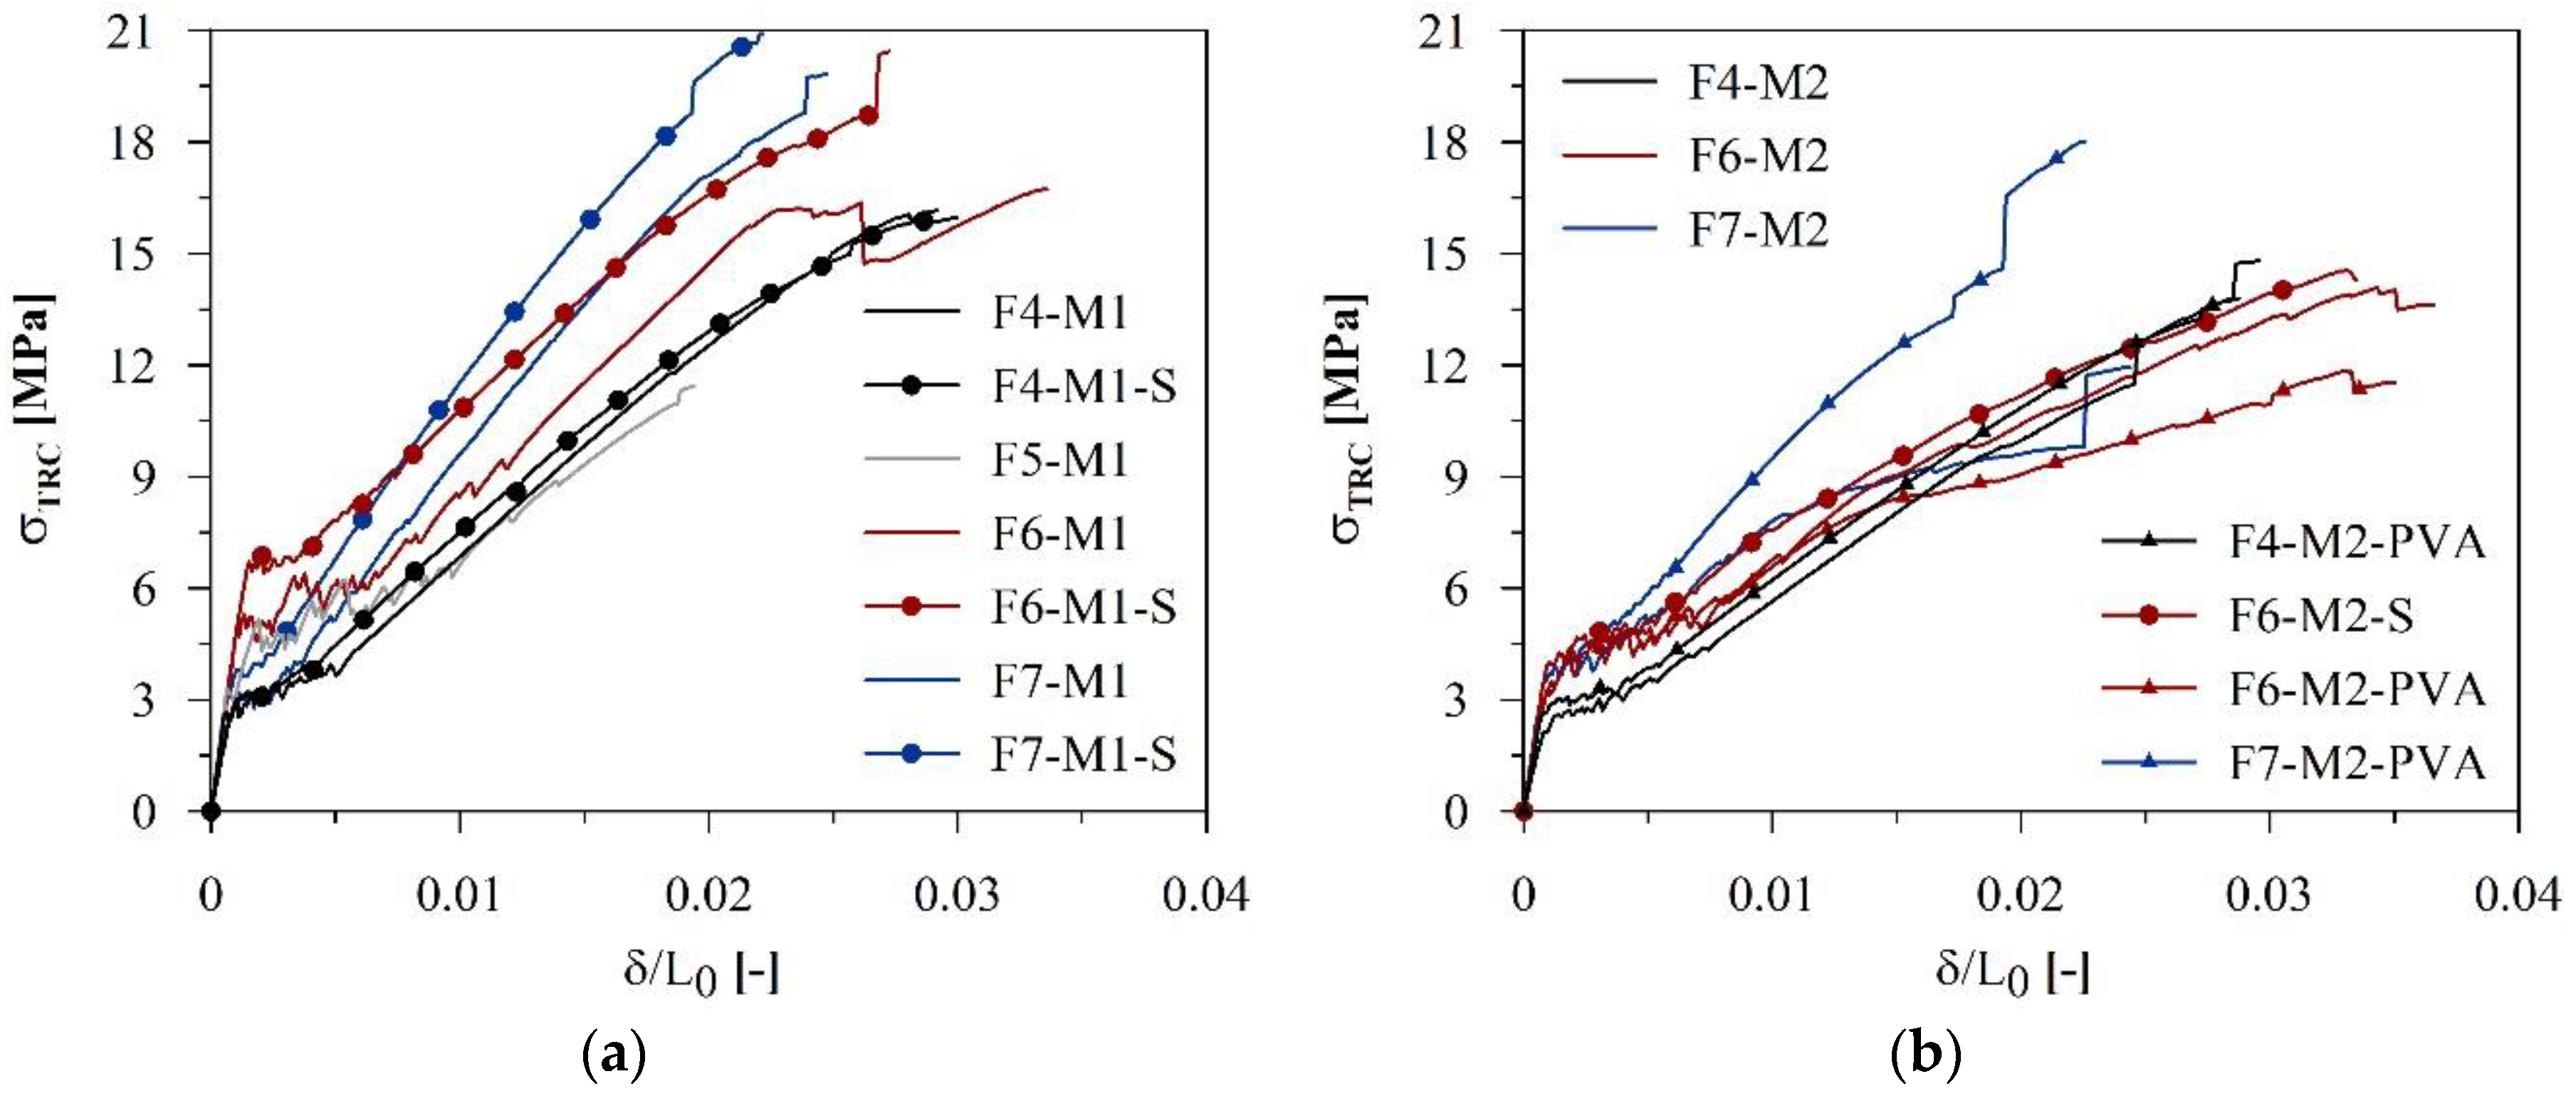
TRC specimens (70 × 400 × 9 mm3 in size) were tested in uniaxial tension after at least 28 days of natural curing, according to the scheme in Figure 2. Four steel plates (70 × 50 × 1 mm3) were glued at the ends, to prevent stress localisations within the clamping regions, where a transverse force of about 12 kN was imposed. The tests were displacement controlled imposing a constant stroke rate of 0.02 mm/s and two linear variable differential transformer (LVDT) transducers measured integral crack opening displacements astride a gauge length (GL) of about 200 mm. Average results of each set of three nominally identical samples are depicted in Figure 5 and Figure 6, in terms of nominal TRC stress (σTRC = P/ATRC, with ATRC = t·b) vs. normalised displacement (δ/L0) along the warp reinforcing direction; relevant geometrical and mechanical quantities are collected in Table 7. The curves reflect the typical trilinear behaviour of TRC, consisting of a first linear-elastic branch, a second multiple crack formation phase and a third region dominated by the fabric response [22]; please note that marked discontinuities of the average third-branch responses generally indicate the failure of one of the three nominal identical specimens belonging to the set, after which the results are averaged on the remaining samples. It is hence important to observe that the peaks of the curves are representative of the best performing sample, while the numbers collected in Table 7 are always the average of the three individual values.
Focussing on the final state—theoretically associated to the rupture of the AR-glass textile—it was possible to notice that some samples failed due to a loss of textile/matrix bond, mostly caused by an insufficient anchorage length. In fact, the length of the load introduction zones in Figure 2, albeit in the range of the minimum values prescribed by the Italian guidelines [14], is about half of the one suggested by recent recommendations for TRC tensile tests [23]. Fabric slippage most likely occurred on M2-based composites, since the greater porosity (noticed by visual inspection) of the thixotropic mortar penalised the bond between the rovings and the cementitious phase.
4. Discussion of the Results
4.1. Effect of Fabric Coating
As already introduced, the nature of the coating acts on both the efficiency of the AR-glass fabric and the strength of the composite. This is explained by the greater surface roughness observed in epoxy-impregnated textiles, which increases the adhesion with the surrounding cementitious matrix, and by the greater mechanical anchorage offered by the weft yarns when the specimen is loaded along the warp direction. This phenomenon is clearly correlated to the better ability of epoxy resins to penetrate and impregnate the glass filaments, stiffening the nodal connections between weaved strands. The latter effect assumes greater importance in the case of wide-spaced fabrics because, contrary to narrow-spaced textiles, the number of nodal connections within the sample width is limited and, in some combinations, the TRC is unable to exhibit the intended trilinear response [22].
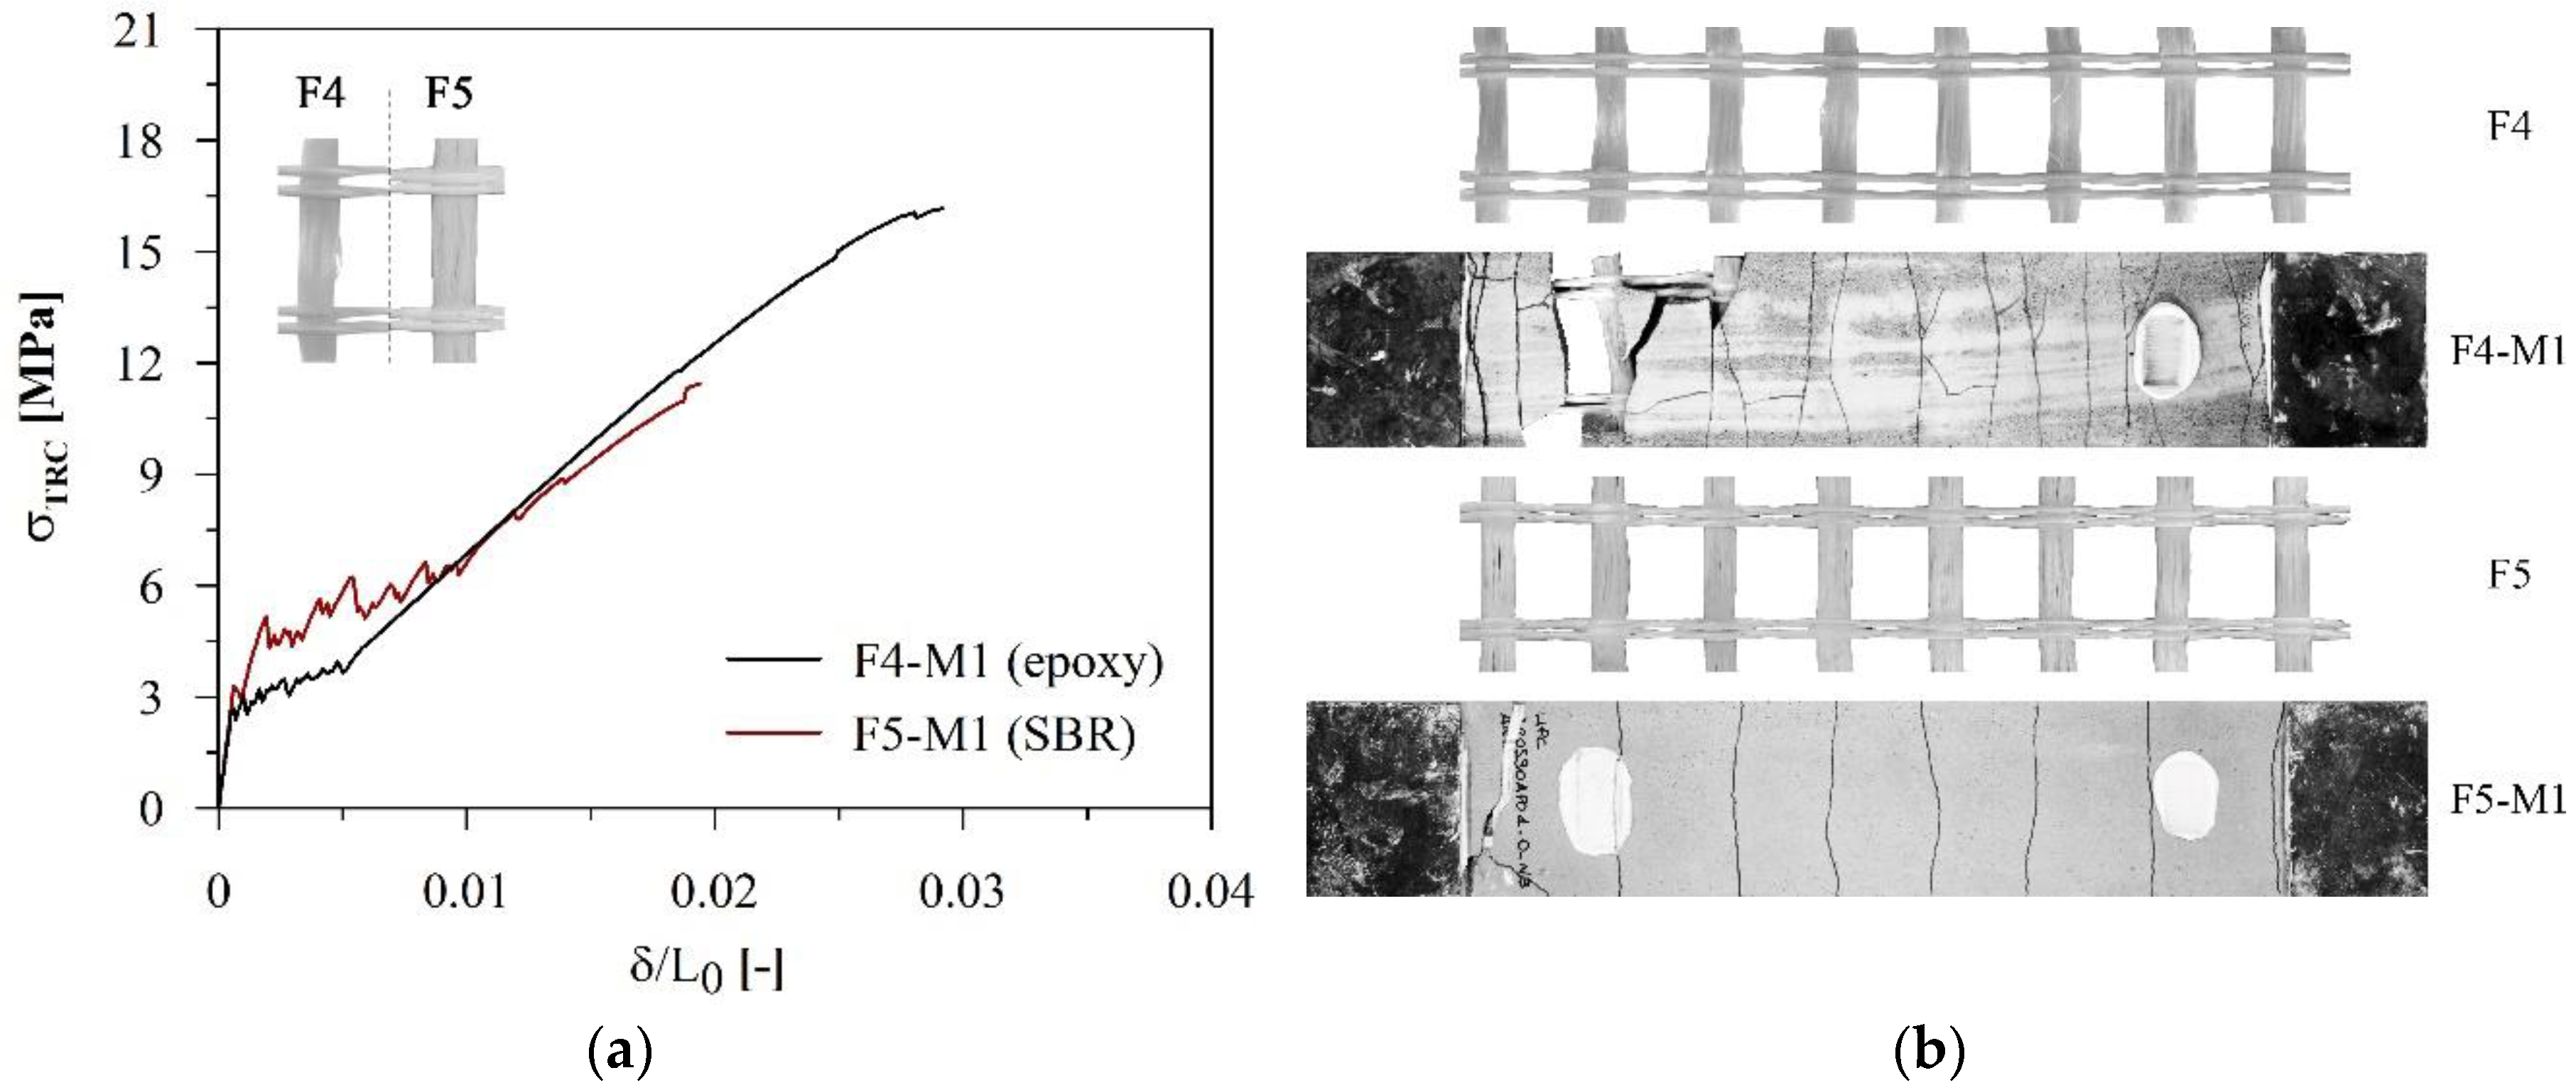
To better highlight the effect of the coating nature, M1-based composites alternately reinforced with Fabrics F2 and F3 as well as F4 and F5 Were considered. Such couples of textiles were characterised by the same geometry, being the only difference the impregnation technique: SBR for F3 and F5 and epoxy for F2 and F4. In Figure 7 and Figure 8, the comparison between the two average responses in terms of nominal stress vs. normalised displacement corroborates the mentioned explanations, since a general increase of the mechanical capacity amid epoxy-impregnated textiles can be observed. The use of epoxy coating also entailed an increased number of cracks and a more stable multi-cracking phase (stress drops appear smoother). Moreover, it is worth underlining that the flatter geometry of SBR coated textiles, explained by the greater pressure exerted by the impregnation rollers, led to an increase of the nominal cracking stresses (given a constant composite thickness, the effective cross-section of the mortar is bigger).
4.2. Effect of Dispersed Short Fibres
The addition of short fibres impacts on the mechanical performances of TRC composites by increasing the first cracking stress, the nominal stress in the second and third branches—due to the improvement of the bond between the textile and the matrix—and the number of cracks, hence ensuring a better behaviour in terms of durability [12].
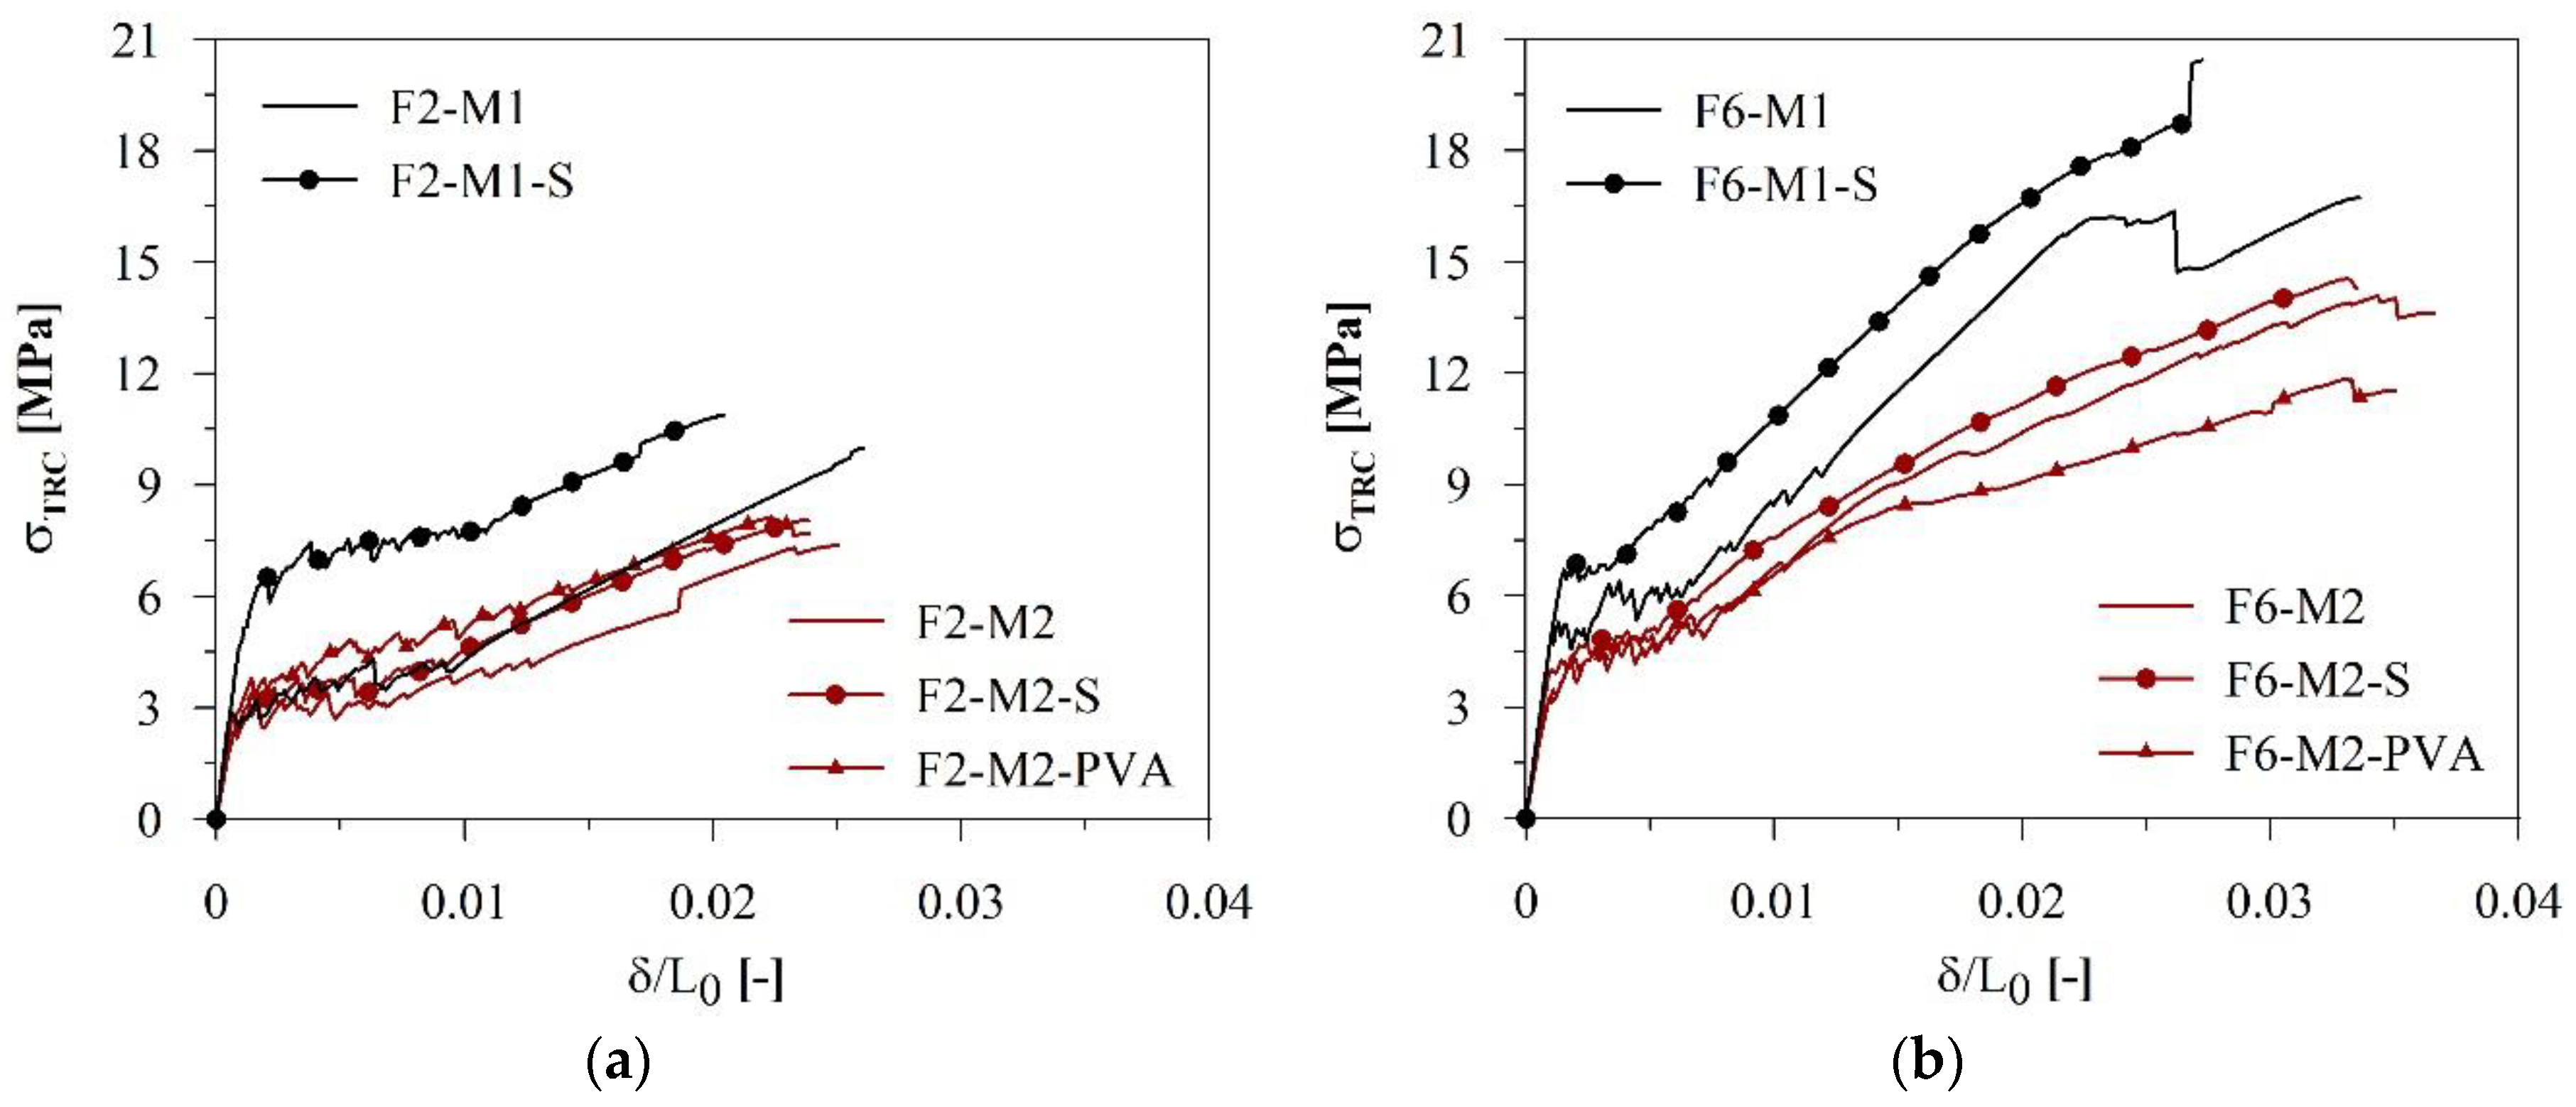
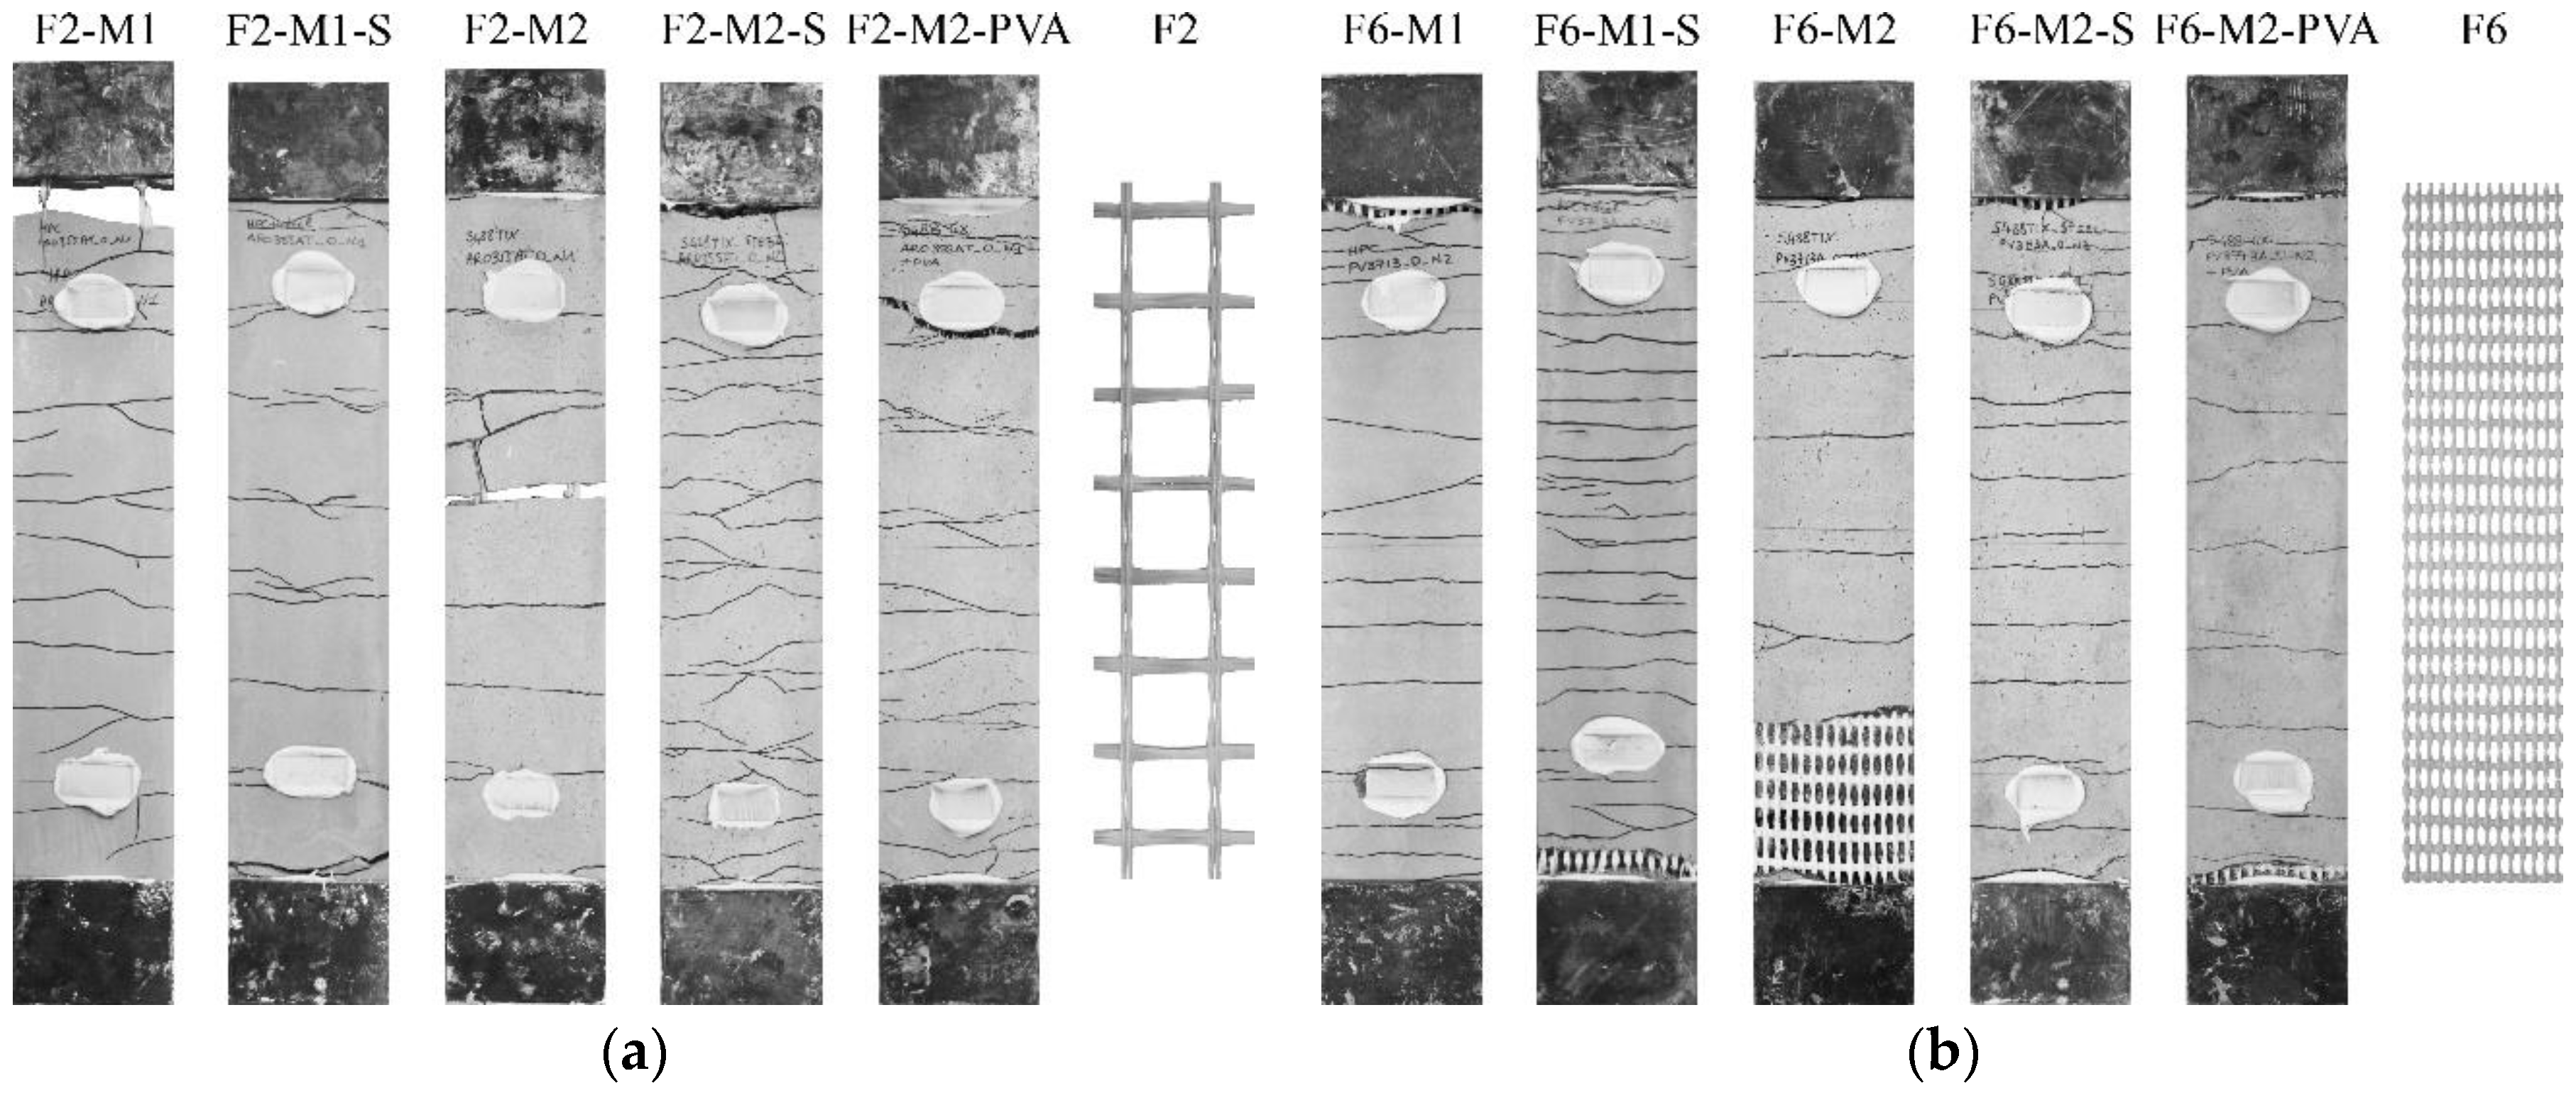
Average tensile responses of different composites reinforced with Fabrics F2 and F6, with or without the addition of short steel and PVA fibres, are displayed in Figure 9. It was possible to notice an overall improvement of the mechanical capacity for all types of matrices and added fibres, with the exception of F6-M2-PVA composites, where the benefits on the mechanical response were not visible, probably because of a combined effect of the narrow-spaced grid of the textile and the porosity of the matrix (in this case the addition of fibres may increase the number of defects, reducing bond and promoting early fabric slippage). The effect of hybrid reinforcing technologies is also assessed in Figure 10, where a densification of the cracking patterns can be generally observed.
4.3. Definition of Comparison Parameters
In light of the foregoing evidence on the influence of each component (fabric, coating, matrix and dispersed short fibres) on the TRC tensile behaviour, it was deemed necessary to establish a quantitative comparison approach between different responses to validate the observed trends in the perspective to promote the use of such materials among designers. The following considerations were made after excluding from the whole set the composites manufactured with Fabrics F3 and F5, on account of the observations drawn in Section 4.1.
Two different families of values were introduced: (i) efficiency factors (EF), which quantify the global load capacity of the systems and the exploitation of the AR-glass fibres; and (ii) ductility/energy absorption parameters, which describe the behaviour of a composite system in the multi-cracking phase (regarded as significant, since in seismic retrofitting applications hysteretic energy dissipation is expected to occur mainly in this region). Ductility coefficients may also help to better underline the effect of hybrid reinforcing solutions.
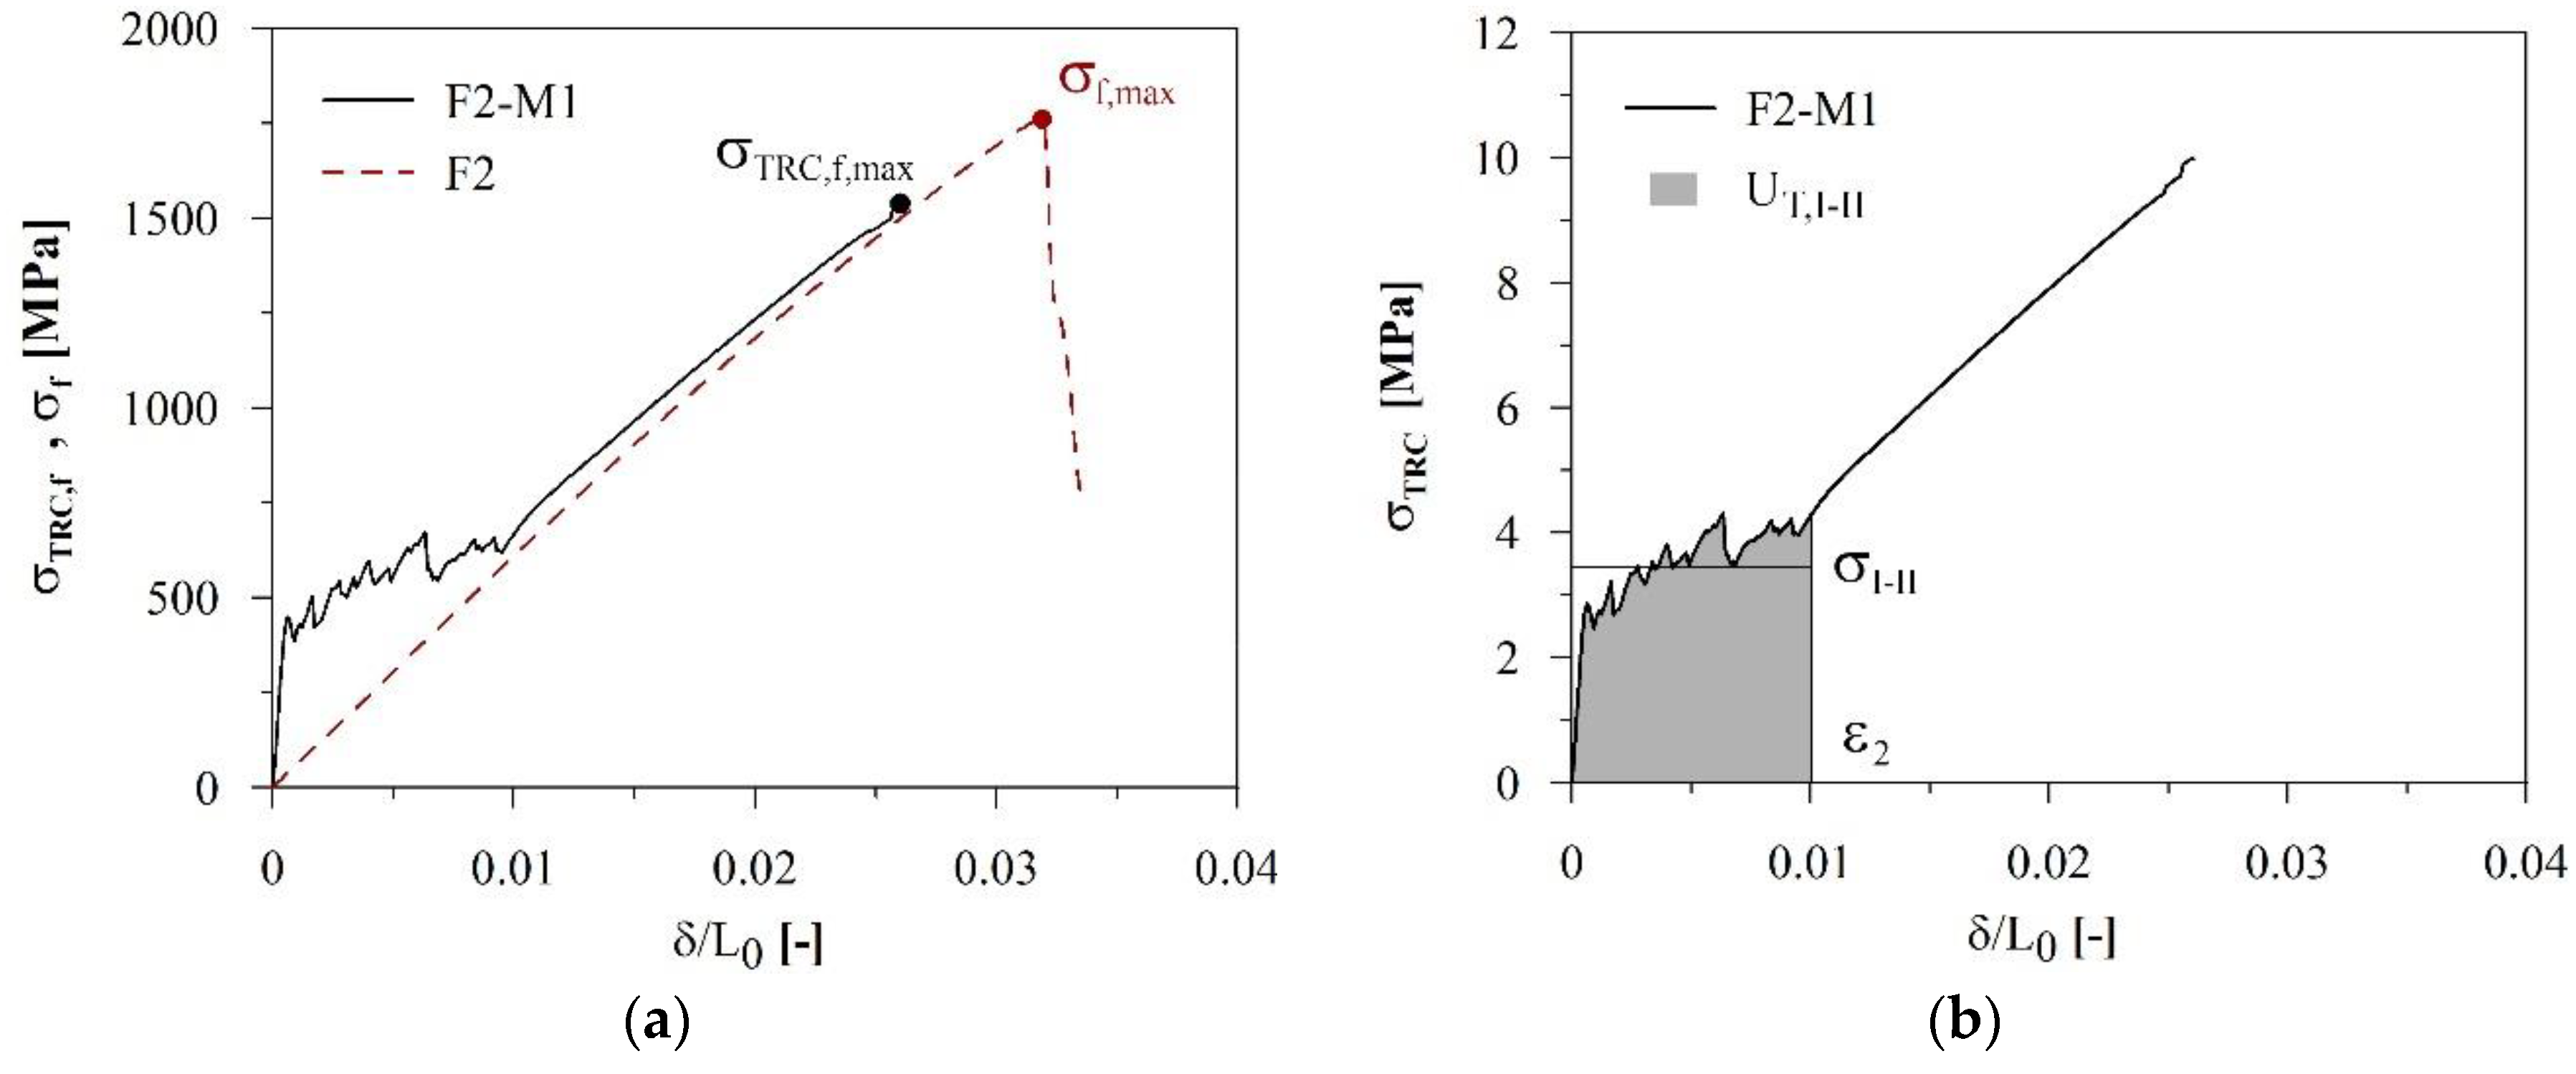
In addition to the standard efficiency factor, EFTRC, defined as the ratio between the maximum capacity of the composite and the one of the plain fabric (see Equation (3) and Figure 11a), a second factor EFTRC,f was introduced (see Equation (4) and Figure 11a), obtained dividing the ultimate TRC stress referred to the fabric equivalent section, σTRC,f, by the glass filaments strength σfu:
The ductility/energy absorption parameters depicted in Figure 11b are defined as: (i) the value of normalised displacement ε2 = δ2/L0 corresponding to the end of the multi-cracking phase; (ii) the total absorbed energy per unit volume UT,I-II within the equivalent strain range 0-ε2; and (iii) the average stress σI-II (Equation (5)) obtained by imposing the equivalence of the area under the stress–strain curve in the first two stages of the response:
The introduced parameters, averaged over each nominally identical set, are collected in Table 8.
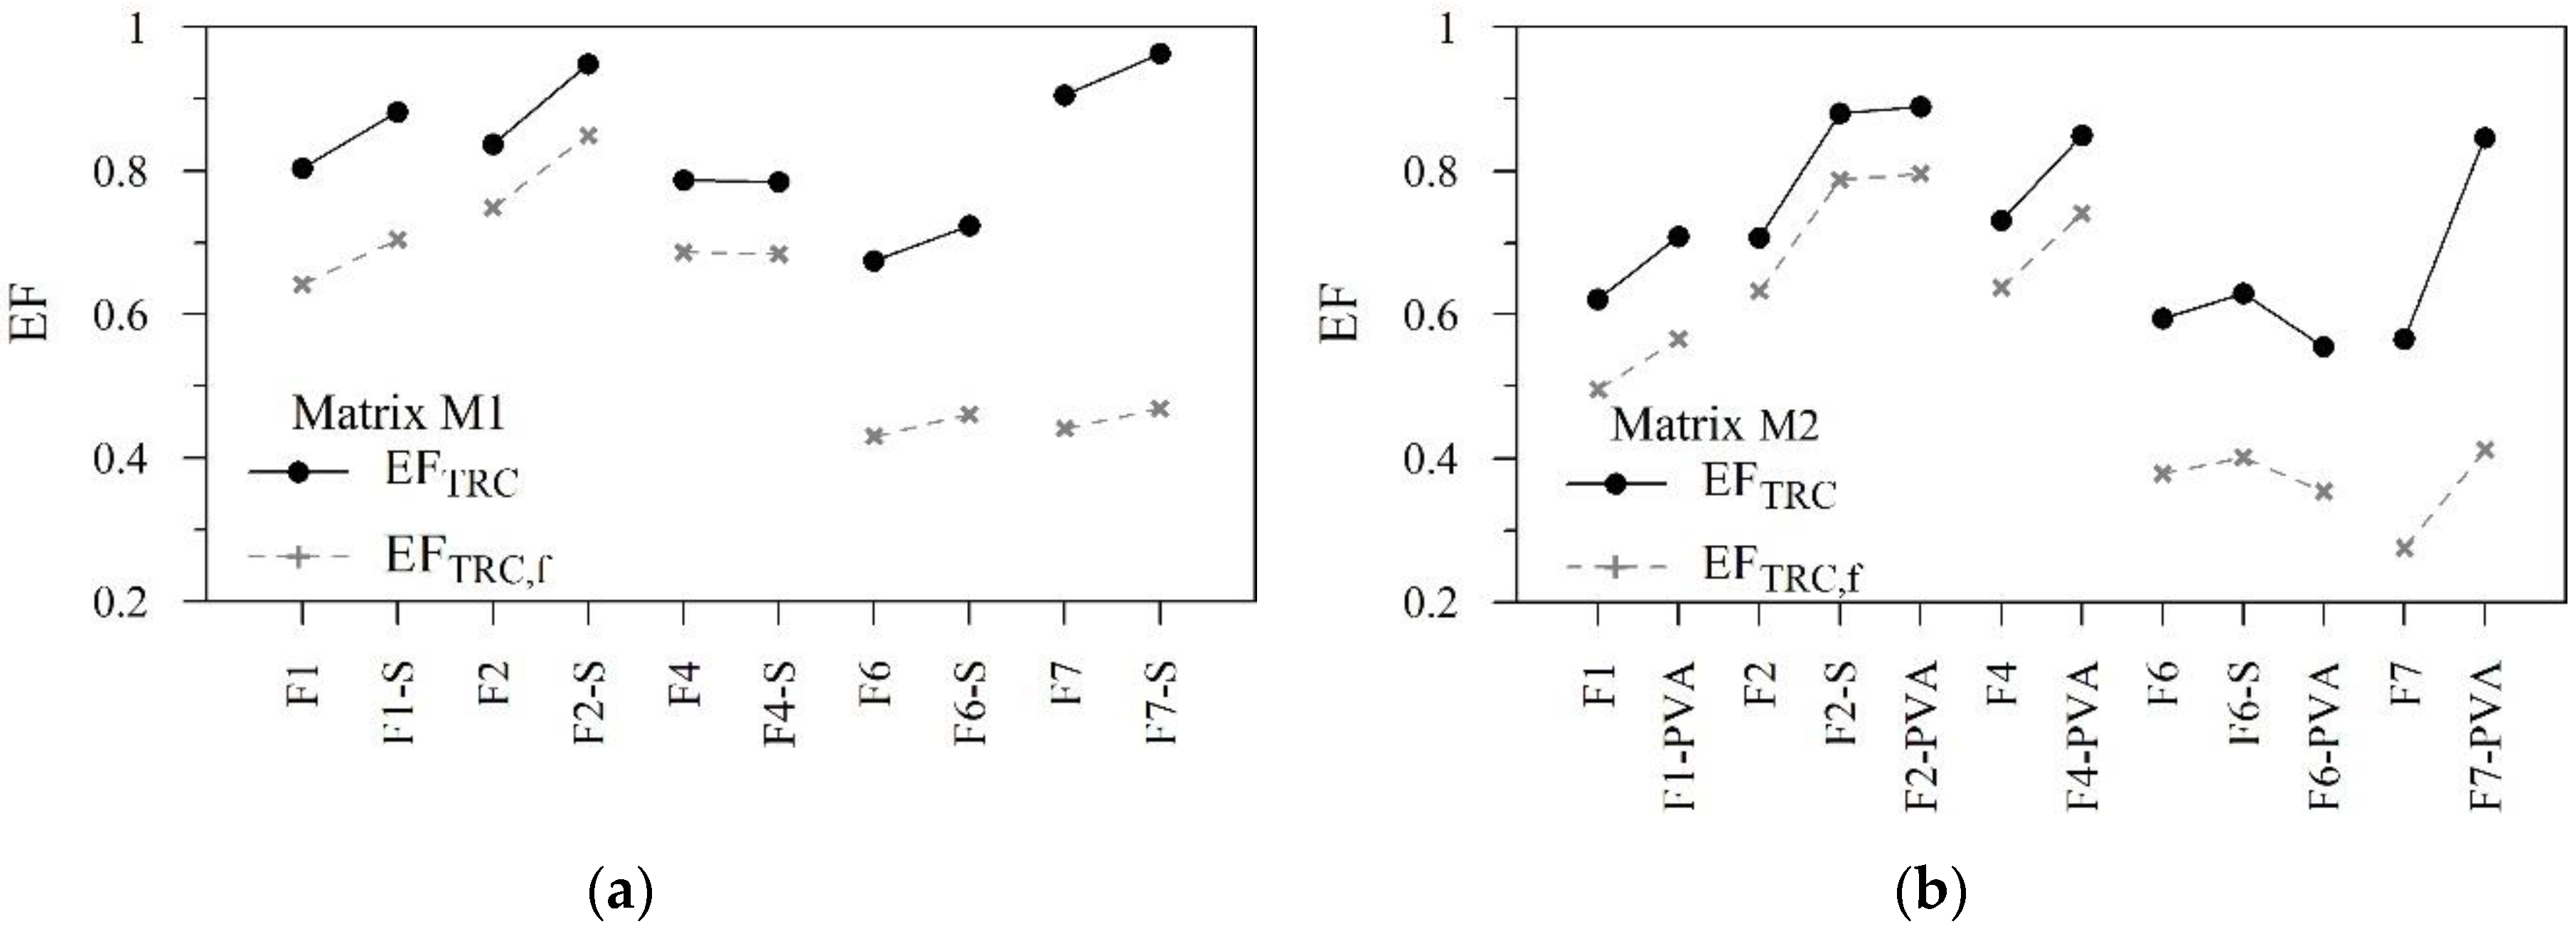
Looking at the efficiency factors trends plotted in Figure 12, it was possible observe that:
- A more loosely packed matrix (i.e., M2) generally implied lower EFTRC (solid black dots) in the composites, thus confirming the previously drawn conclusion about the internal fabric slippage in M2-based systems (see Section 3).
- The values of EFTRC,f (grey crosses) were lower in the composites reinforced with greater amounts of AR-glass (F6 and F7, compared with F1, F2 and F4) and this clearly indicated a material waste, while EFTRC (solid black dots) was only representative of the interaction between matrix and fabric. Focussing on F6-M1 and F7-M1 systems, it was possible to observe that close EFTRC,f values did not imply similar EFTRC values, probably due to different internal slippage (see Figure 6a).
- The addition of short fibres implied, as expected, a general increase of the EFTRC parameters. The only exception was represented by F6-M2-PVA samples, possibly because the addition of short fibres in a matrix embedding a narrow-grid textile introduced a defect at the fabric–matrix interface, favouring internal slippage. In addition, it is important to stress that the higher porosity of matrix M2 entailed a lower fibre pull-out strength; moreover, the increment of EFTRC was higher in the cases with low-grammage textiles (F1 and F2) because, given the fixed volume fraction of short fibres, the percentage increase of the reinforcement ratio was higher.
- The composites manufactured with epoxy-impregnated fabrics (F2–F4) were more efficient, probably due to a greater chemo-mechanical bond (greater surface roughness combined with stiffer nodal connections between warp and weft yarns, as discussed in Section 4.1). Moreover, the two composite efficiency factors (EFTRC and EFTRC,f) were closer, due to the greater efficiency of the plain fabric (see the warp EFf values of Table 5).
Figure 13 reveals the effect of short fibres addition on the ductility/energy absorption parameters. Normalising each average value with respect to the corresponding plain TRC one, was noticed that:
- In the case of low to medium grammage fabrics (F1 and F2), a general increase of the average stress σI-II was observed. Moreover, greater control over damage development was achieved. An overall increase of the total absorbed energy was observed, in particular in M1-based composites, confirming preliminary considerations.
- In the case of heavy-duty fabrics (F6 and F7, already characterised by a great reinforcement volume fraction), the responses became stiffer and showed a reduction of ε2 and UT,I-II; consequently, the improvement of the mechanical capacity could only be assessed through the efficiency factors.
5. Analytical Modelling
As proven by empirical results, variations in the tensile response of TRC and hybrid composites depend upon the characteristics of base materials (fabrics, coatings, matrices and dispersed fibres) and their positive or negative interactions when combined into a complex system. The evaluation of the tensile capacity of TRC is generally assessed experimentally, by performing uniaxial tensile tests that represent the basis of current engineering approaches [23] for the structural design of building interventions.
In this context, there is a strong need to implement available analytical tools into robust predictive models aimed at assisting the experimental optimisation procedures. The following subsections deal with the modelling of the macro-mechanical tensile responses by means of well-established simplified approaches, critically assessed in the perspective of highlighting future lines of investigation.
5.1. Description of the ACK and the Stochastic Cracking Models
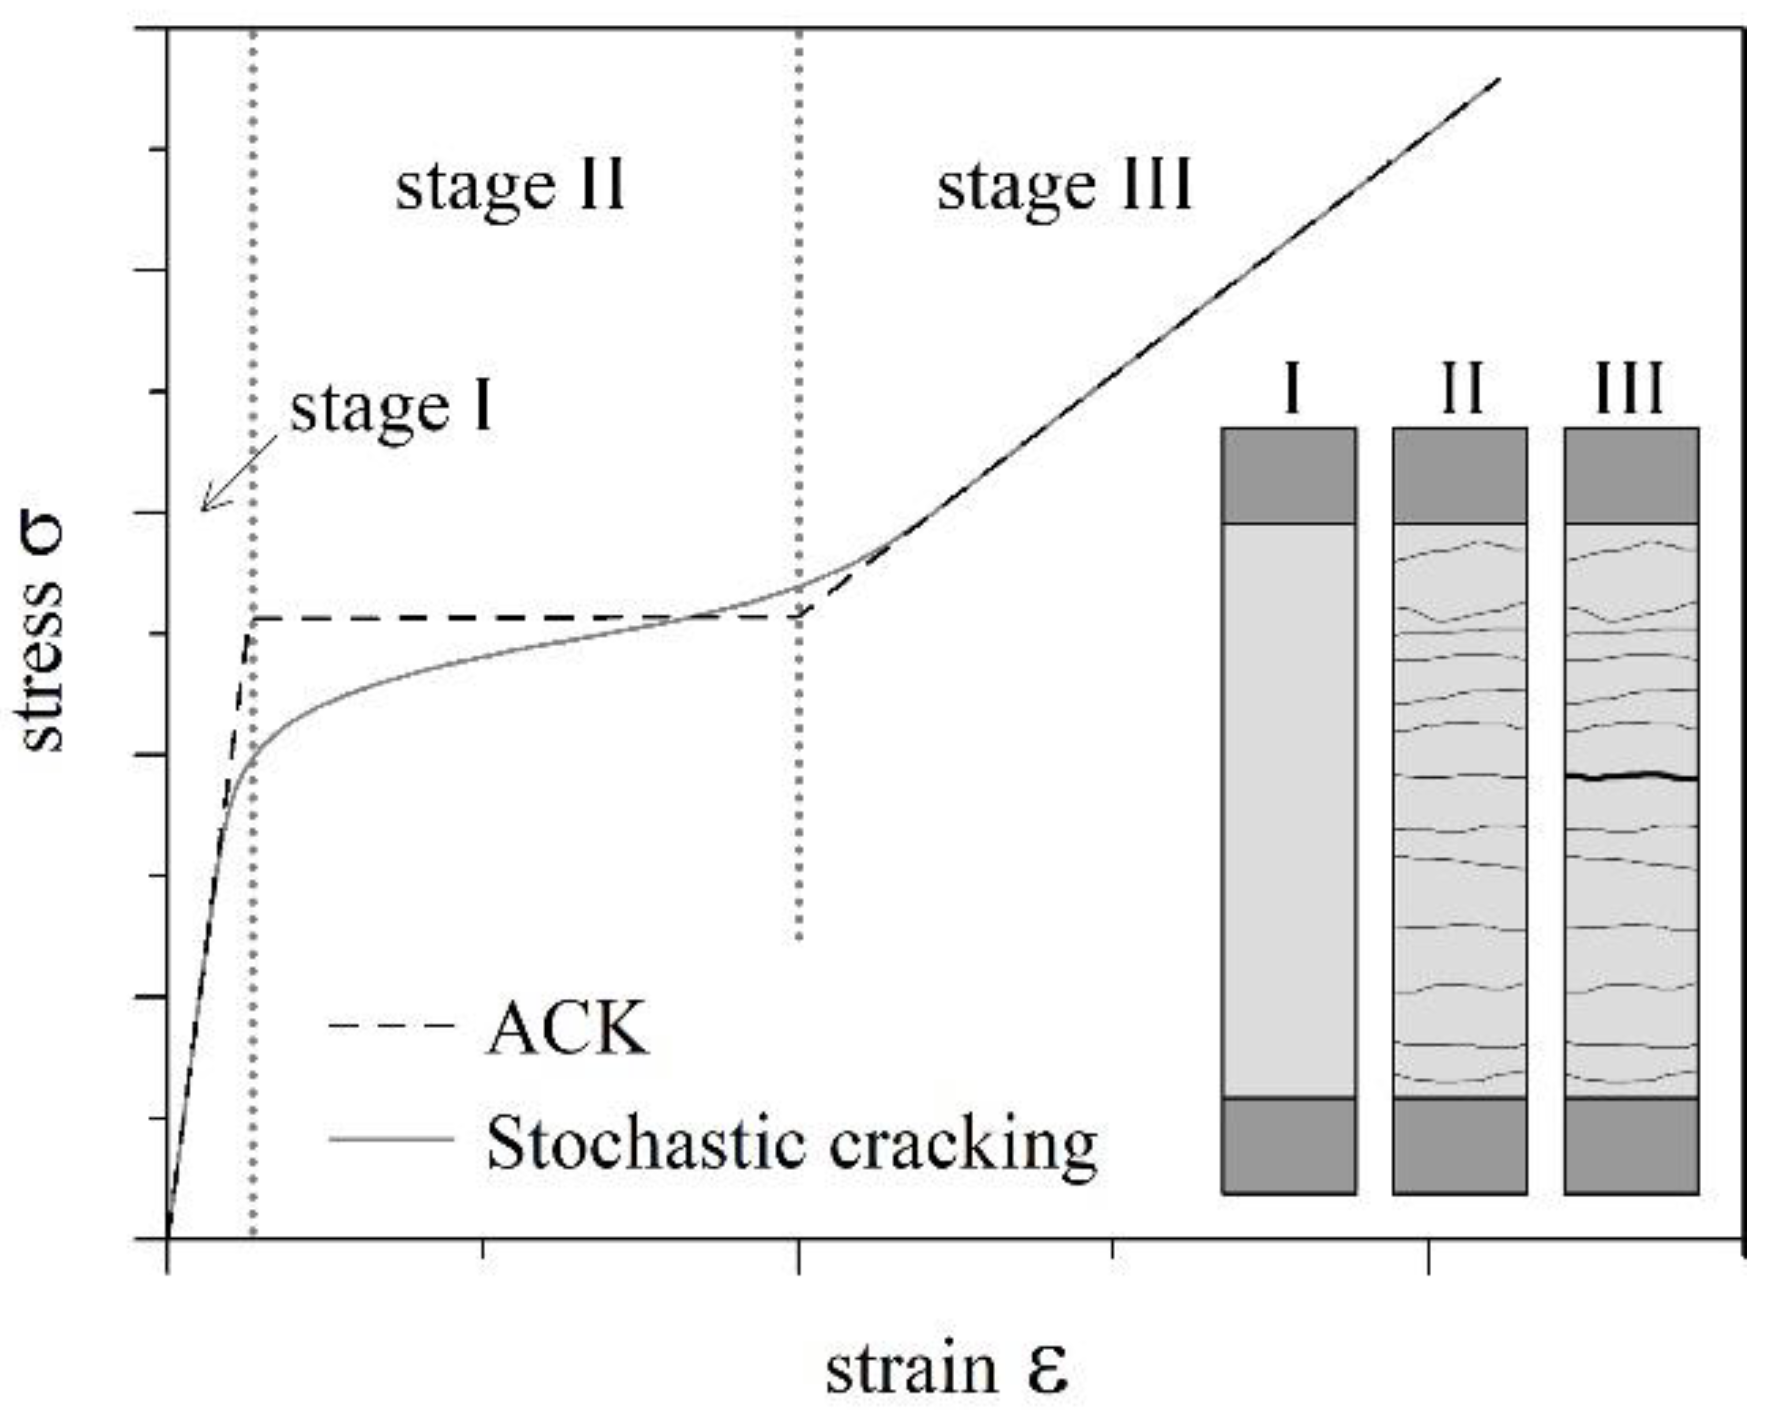
The Aveston, Cooper and Kelly theory [15,16] for fibre-reinforced composites was originally developed to describe the tensile stress–strain curve of brittle matrix composites, reinforced with quasi-unidirectional fibres characterised by a volume fraction greater than the critical one. The response (see Figure 14) is described by means of a three stages curve: pre-cracking zone (Stage I), multiple cracking zone (Stage II) and post-cracking zone (Stage III). The basic assumptions of this model are:
- The fibres are considered capable of carrying loads only along their longitudinal axis.
- The matrix–fibre bond is assumed to be weak.
- Once the matrix and the fibres debond, a pure frictional shear stress τ0 is considered. This shear stress is assumed constant along the debonded interface.
- Poisson effects (transverse contraction) of both the fibres and the matrix are neglected.
- Global load sharing is used for fibres.
- In a section orthogonal to the applied load, matrix normal stresses are considered uniform.
The first branch of the response is linear elastic and the bond between the matrix and the fibres is assumed to be perfect. In this stage, the stiffness of the composite Ec,I is function of the fibres and the matrix volume fractions (Vf, Vm) and their stiffness (Ef, Em) and it is computed by means of the well-known rule of mixtures, via the following equation:
The two volume fractions can be decreased by means of fibres and matrix efficiency factors (ηf, ηm) connected to imperfect matrix–fibre adhesion, warping or misalignment of the unidirectional fibres and eventual presence of inclusions or air voids in the matrix [24]. The modification of the ACK theory is described as follows:
According to the ACK model, the matrix has a deterministic tensile failure stress σmu. When this value is reached, the composite shows multiple cracking (Stage II). The composite multiple cracking stress σmc is computed as:
When the first crack appears, matrix and fibres debond and the pure constant frictional shear stress is considered, τ0 provides the stress transfer between fibres and matrix. From the equilibrium in the longitudinal direction, it is possible to obtain the transmission length δ0, equal to the distance from a crack face at which the matrix reaches again the stress σmu:
where r is the equivalent fibres radius. Since, according to the ACK theory, the matrix has a unique tensile failure stress, multiple parallel cracks are simultaneously introduced in the specimen, until saturation is reached. In Stage II, the internal stress leads to a final state where the distance among cracks is between δ0 and 2δ0 (with an average value equal to X = 1.337∙δ0 [25]).
In Stage III, when the multi-cracking phenomenon is over, only fibres contribute to the stiffness of the composite:
An extension of the original ACK theory to E-glass fibre reinforced cementitious composites was proposed by Cuypers and Wastiels under the name of stochastic cracking model [17]. They considered the stochastic nature of the tensile strength of the matrix, through the use of a two-parameter Weibull distribution function [26] and they assumed the same distribution for the crack spacing. Because of the non-deterministic nature of the matrix cracking stress, it is necessary to underline the difference between the mean saturated crack distance at the end of Stage II (X) and the mean actual crack spacing (x). While the X value can be evaluated experimentally, observing the crack pattern at the end of a tensile test, both the values of the transmission length δ0 and the actual crack distance x are functions of the applied stress. Depending on the value of the stress σc applied to the composite, x may be smaller than, equal to or larger than 2δ0. In particular, x tends to X according to the following formula:
where σRc is the reference average cracking composite stress, computed according to Equation (10). The stress σmu is taken as the average tensile strength fctm of Table 3 and m is the width of the strength distribution (respectively, the first and the second parameter of the Weibull function, see Table 3). The analytical stress–strain curve of the composite (see Figure 14) is described by means of the following non-linear functions:
with
and where δ* is evaluated according to Equation (11), with the evolving matrix stress in place of σmu.
5.2. Implementation of the Stochastic Cracking Model
To apply the stochastic cracking model to the set of TRC composites and compare the obtained analytical responses with the experimental results along the warp direction, some assumptions regarding the base materials and the efficiency of the composites were made.
As regards the failure strength fctm of the two matrices, different approaches were considered, following the observations of Section 2.1: (i) average values of the fct tensile strengths, computed with Equation (1); (ii) average tensile strengths empirically derived, according to the MC2010, from the average compressive strengths; and (iii) data provided by the premixed mortar manufacturer (the obtained values are collected in Table 9).
Analyses “A” (see Section 5.3) considered the average strengths calculated from the three-point bending flexural strengths (fctm = 6.31 MPa for M1 and fctm = 3.10 MPa for M2), while Analyses “B” instead assumed fctm = 4.59 MPa for M1 and fctm = 4.47 MPa for M2; the former value is the one obtained from the average compressive strength, while the latter is the one provided by the thixotropic mortar manufacturer. Regarding M2, the selection of the highest tensile strength was consistent with a greater compaction of the mortar (as resulting in the composites, produced by means of a hand lay-up technique) and the stabilising effect offered by polyacrylonitrile-based microfibres originally introduced in the pre-mixed powder to minimise shrinkage effects.
For both analyses, the matrix elastic modulus Em and the Weibull shape coefficient m were assumed equal to 42.9 GPa and 11.58 for the M1-based composites and 28.0 GPa and 7.15 for the M2-based ones, respectively (please note that the m Weibull parameter associated to the tensile strength distribution was hence assumed equal to the experimental flexural one). The efficiency of the cement-based matrix, as defined in the original theory, was set at ηm = 1. Regarding the textiles, an elastic modulus Ef of 70 GPa was assumed, as suggested by the glass filaments manufacturer. The fabric volume fraction Vf was calculated as the ratio between Af (Table 5) and the average cross section of the samples belonging to each set (see Table 7), while Vm was equal to 1-Vf. The reinforcement efficiency ηf was taken equal to EFf, where EFf is the fabric efficiency factor introduced in Section 2.2 (see Equation (2) and Table 4). This latter assumption followed the hypothesis that the filaments that effectively contribute to the resisting mechanism (Af* = Af ·EFf) work in parallel and each of them is capable of reaching the maximum tensile material strength (σfu = 2000 MPa).
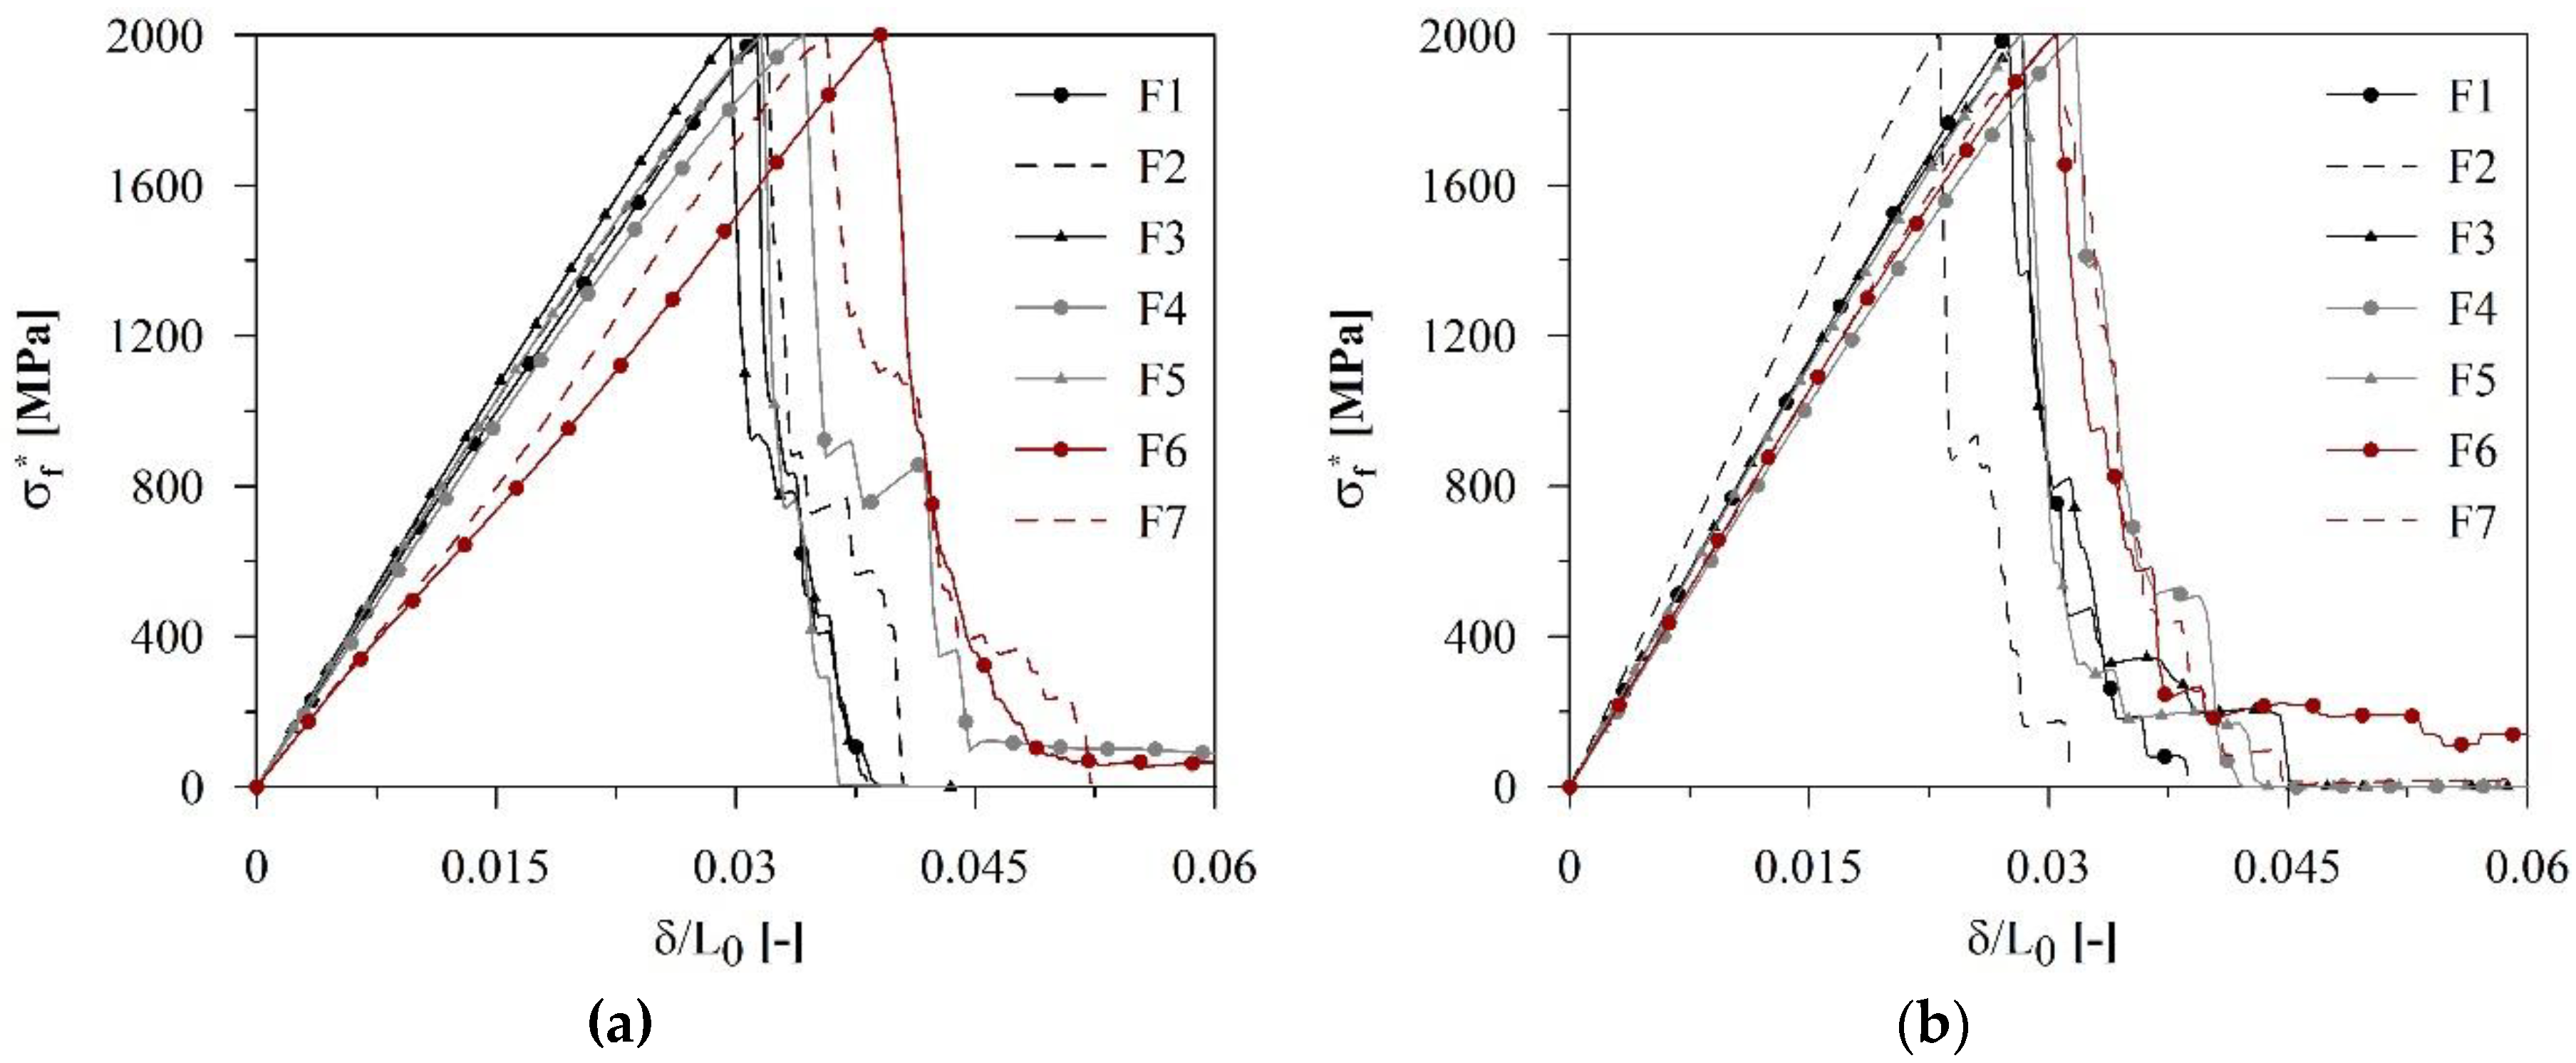
The hypothesis seems to be confirmed by Figure 15, showing a reworking of the plain fabric tensile responses of Figure 4 carried out by calculating the nominal fabric stress σf* as the ratio between the load Pf and the effective fabric area Af*. As one should note, the scatter of the seven average curves in terms of stiffness was limited, proving that a fabric efficiency factor merely estimated on the failure loads (see Equation (2)) may be sufficiently representative of the global textile behaviour.
The value of the average saturated crack spacing X was obtained experimentally, dividing the LVDT gauge length (the nominal value of 200 mm was assumed) by the number of cracks detected at the end of each tensile test (see Figure 10).
It is worth noticing that this simplified analysis could not simulate any of the contributions provided by dispersed short fibres, since the matrix was treated as an elasto-brittle material, with null post-cracking behaviour. Moreover, it is important to underline that the theoretical response was always trilinear-hardening, since volume fractions greater than the critical one were assumed a priori and fabric end-slippage phenomena—as the one occurring in the F3-M1 response of Figure 7a—could not be captured. Hence, in its present configuration, the algorithm cannot be regarded as sufficiently robust to represent a comprehensive predictive tool and, for this reason, its application in this research was limited to the assessment of ex-post modelling capabilities.
5.3. Assessment of Analytical Modelling Capabilities
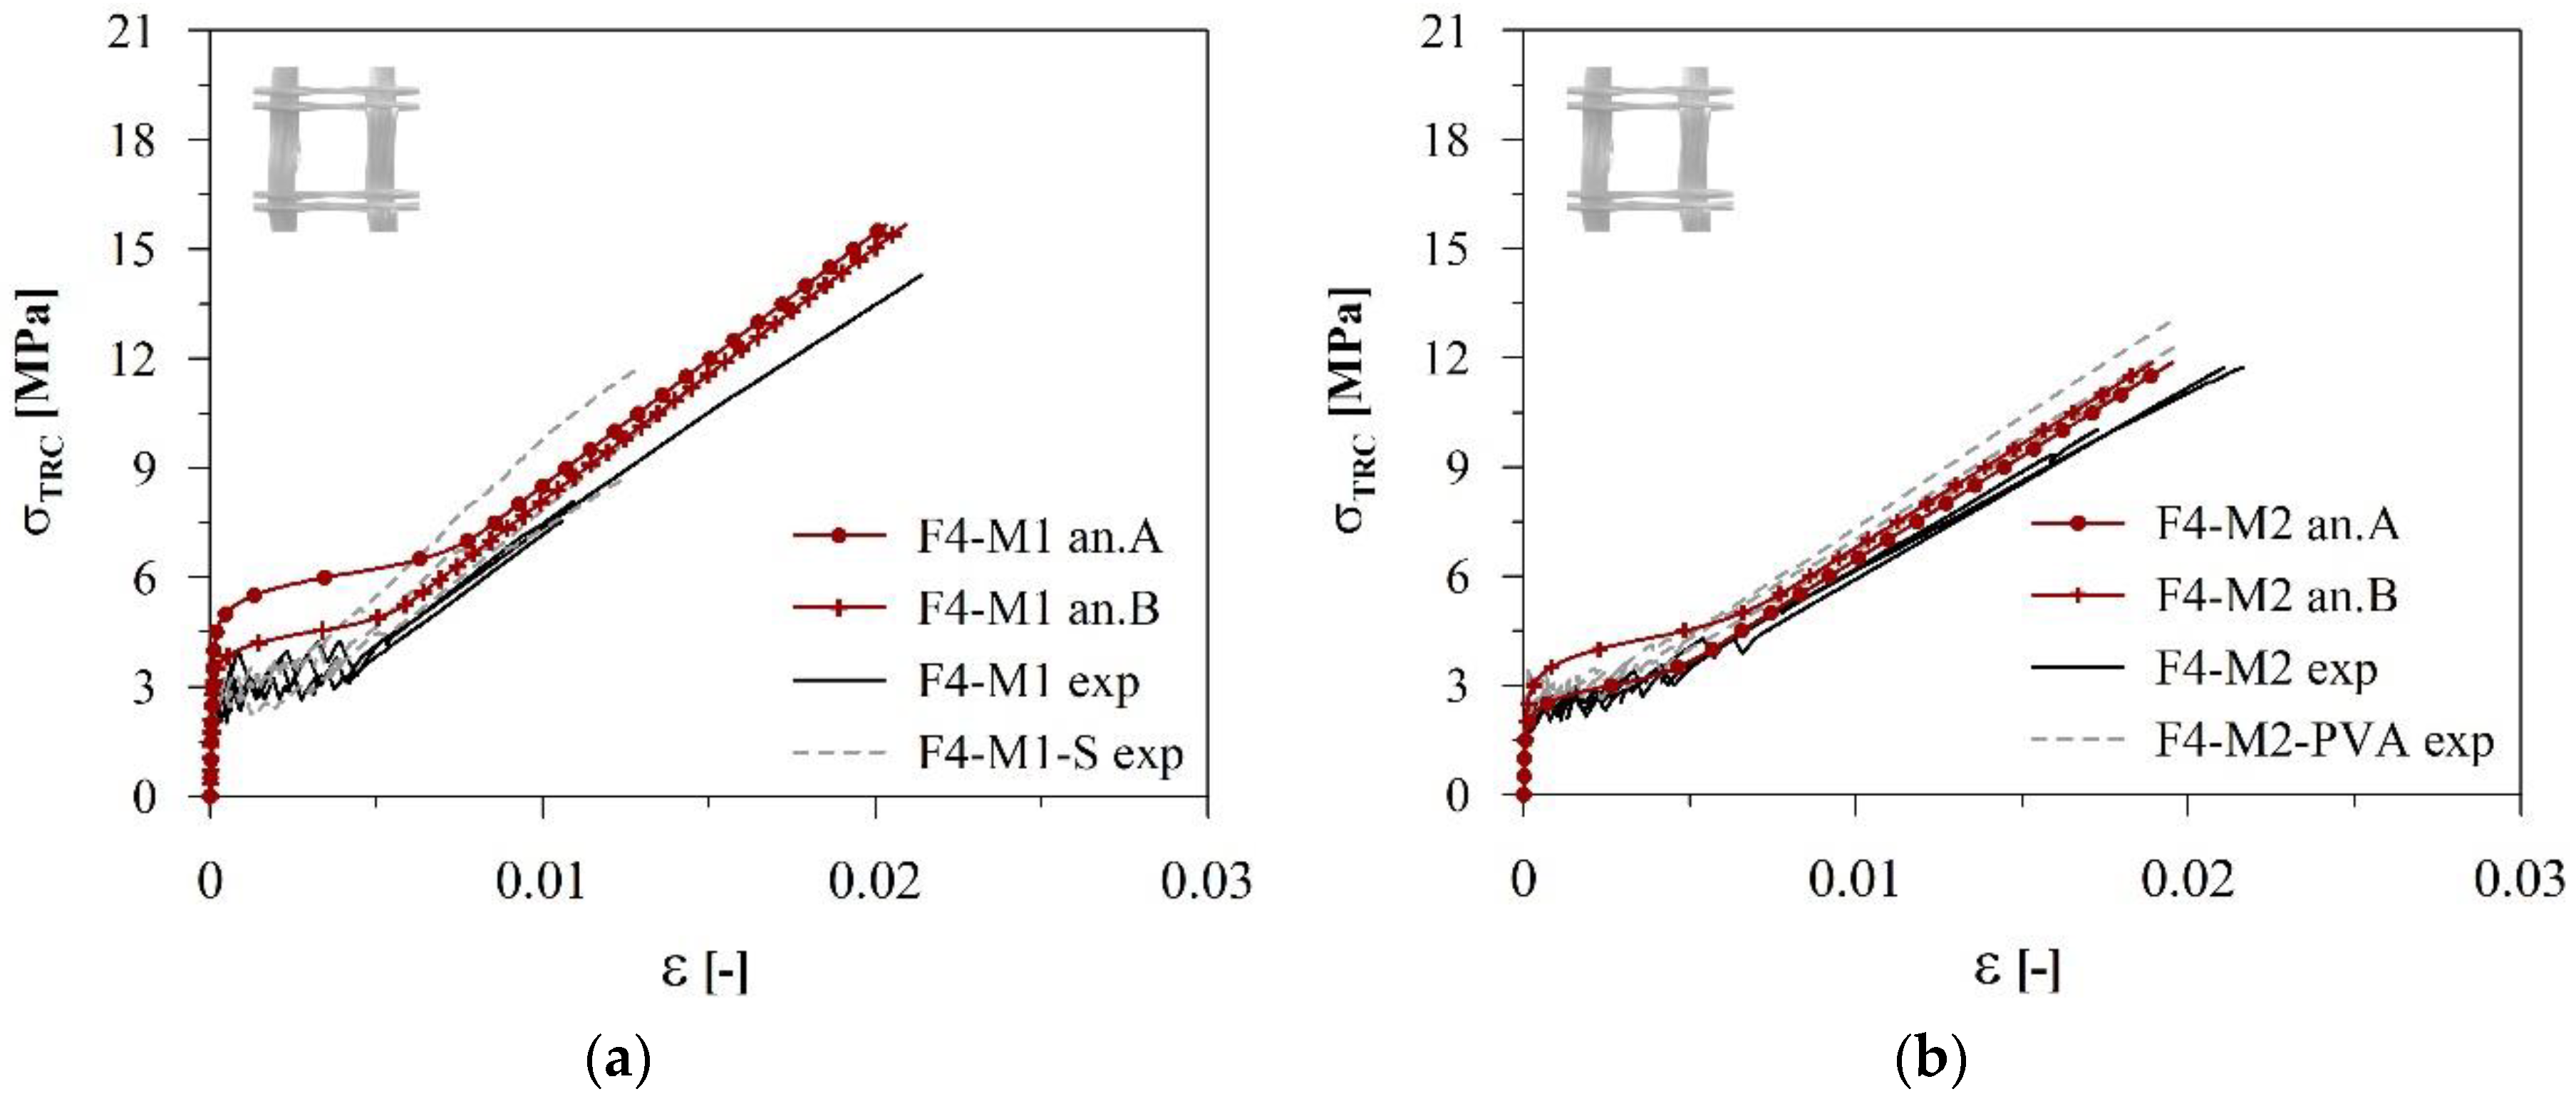
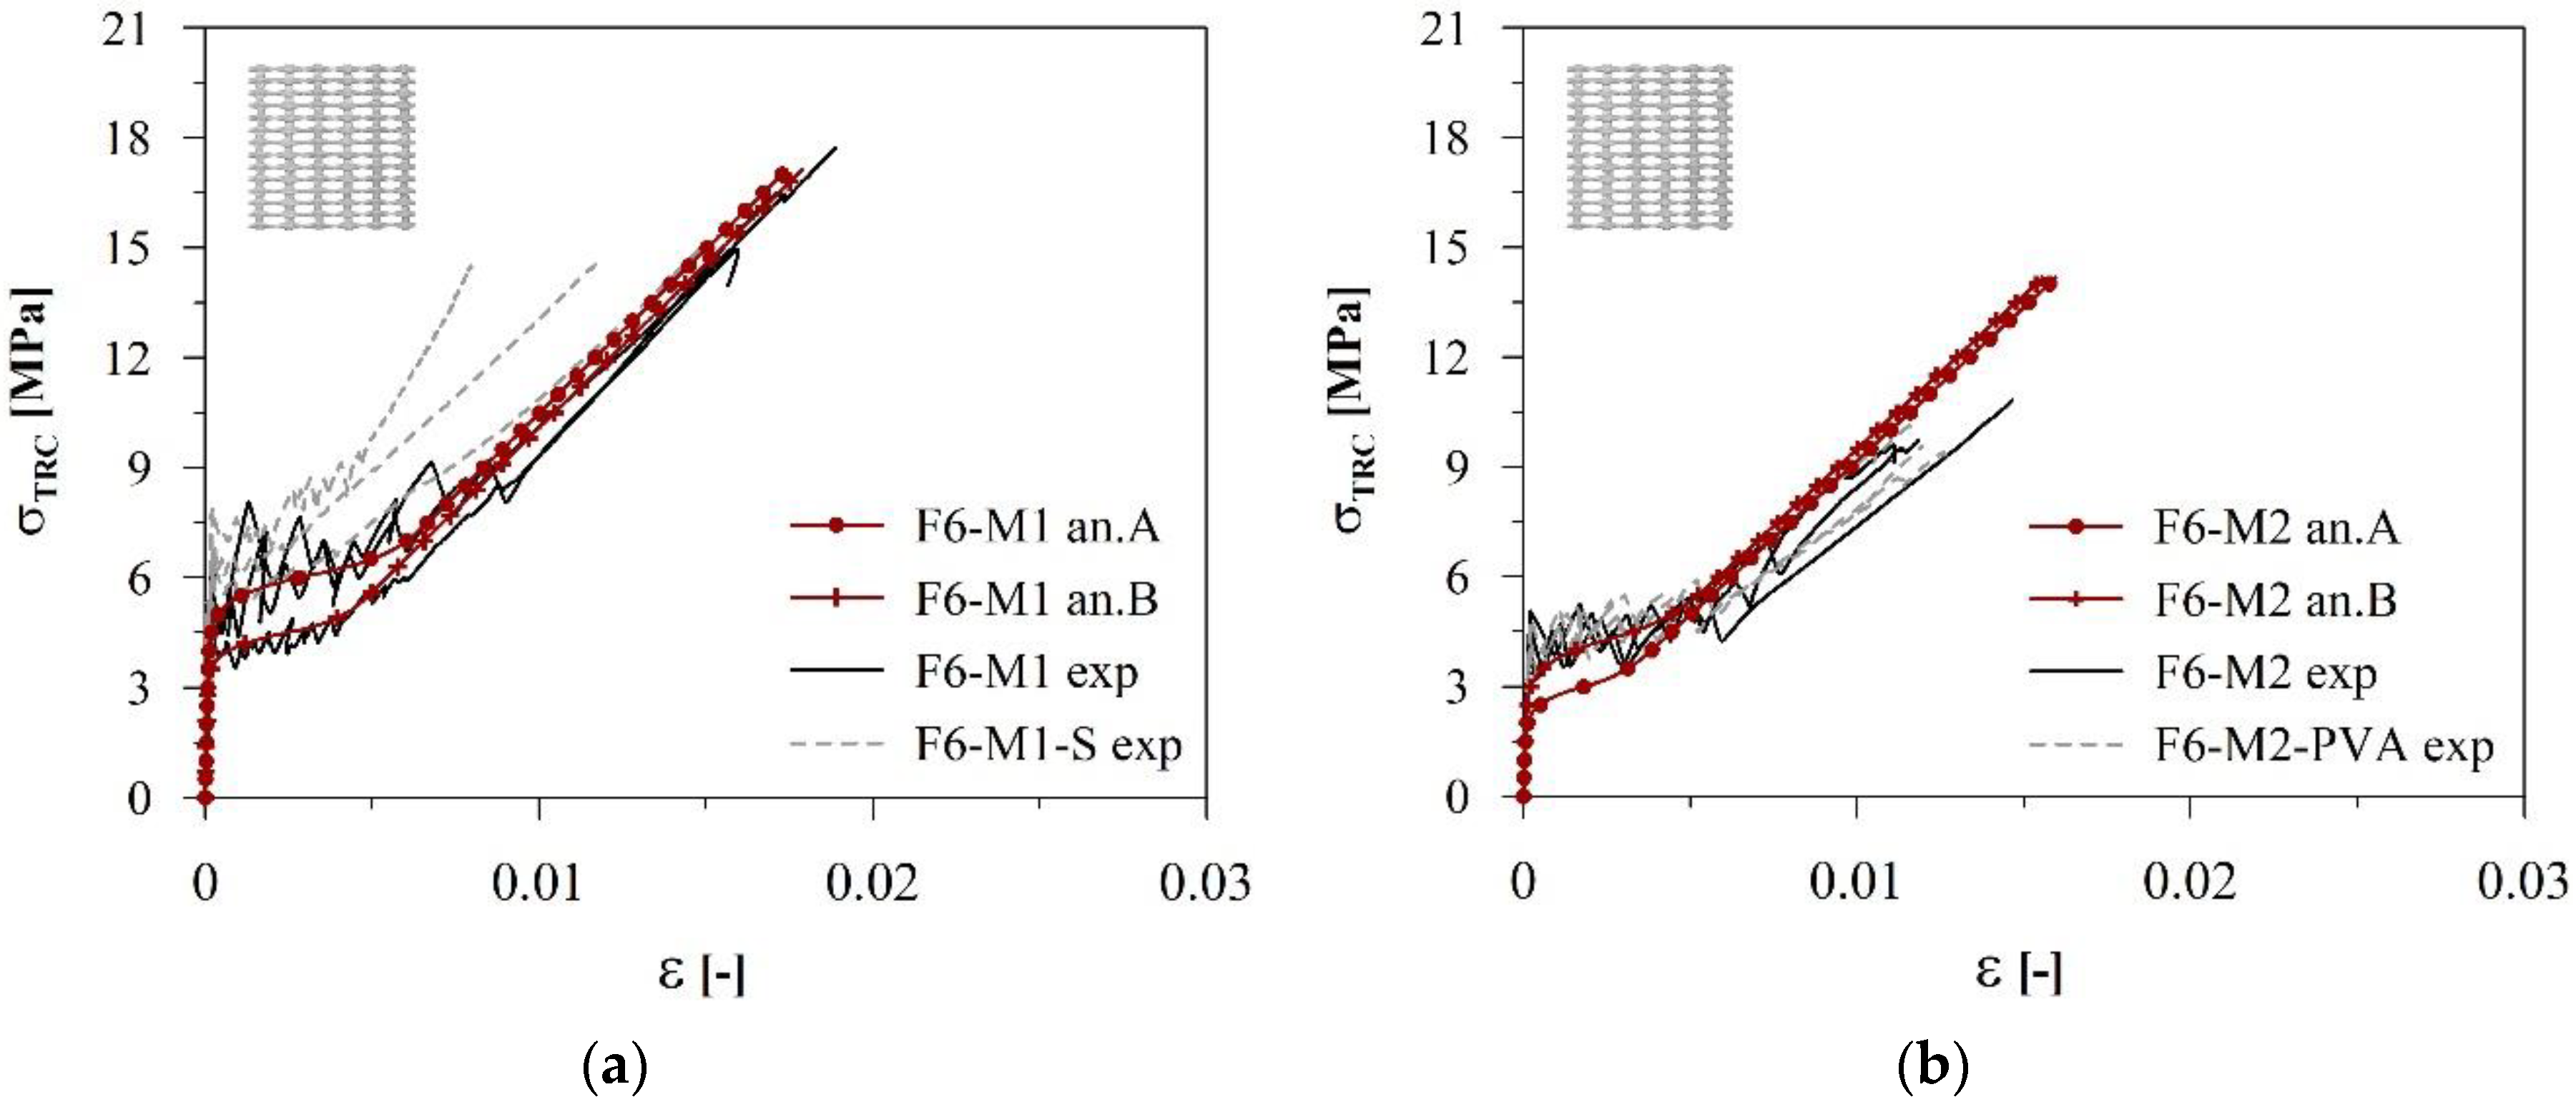
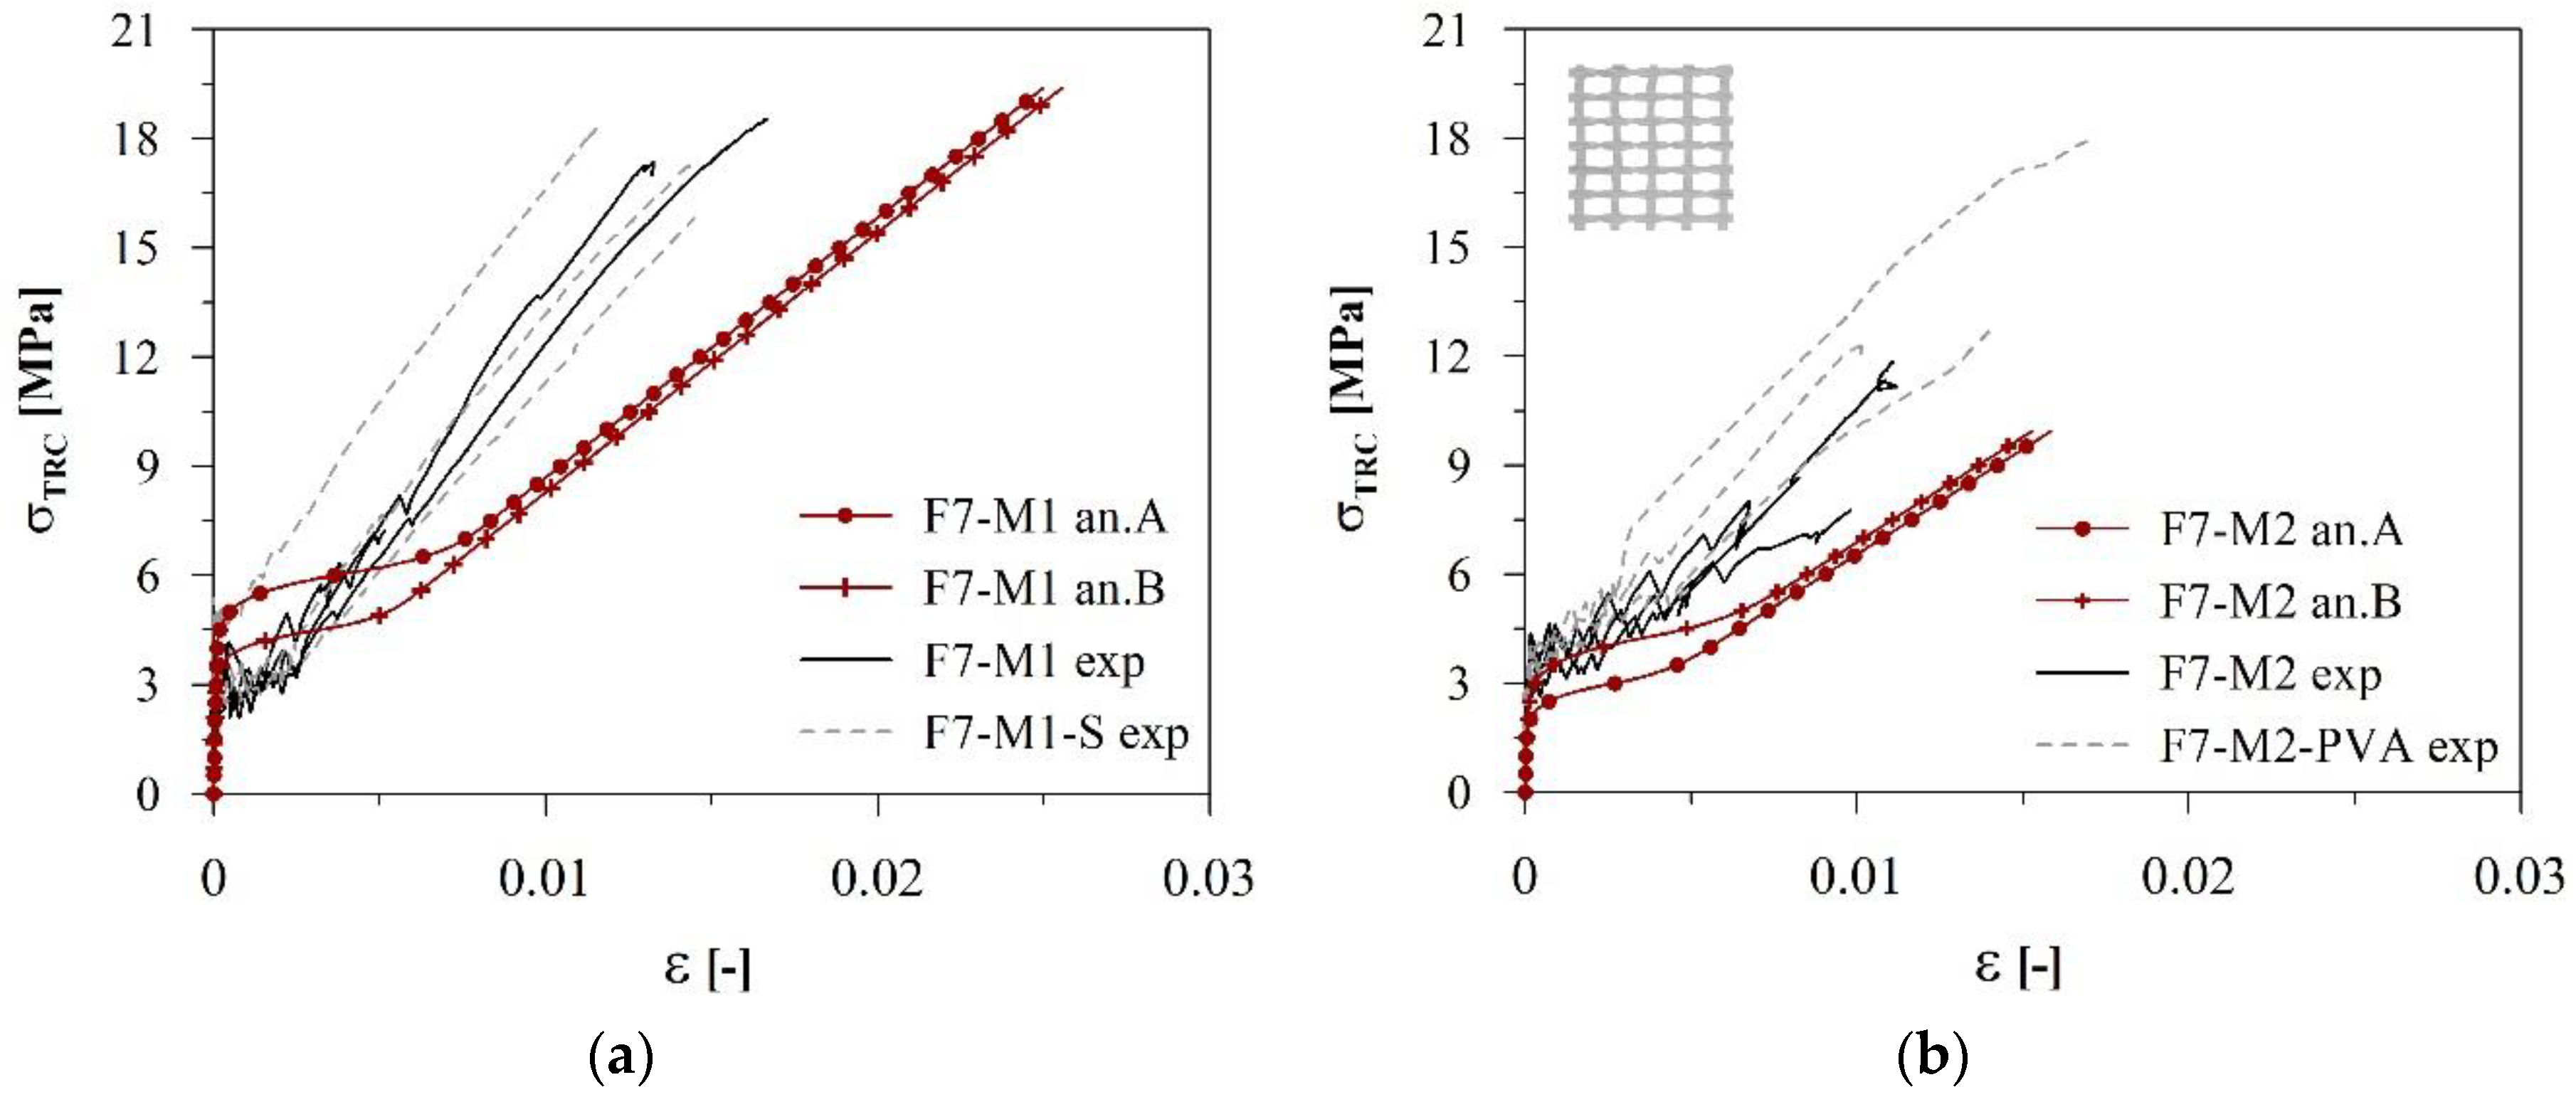
The results obtained by applying the stochastic cracking model to the investigated sets of TRC systems are displayed in the following, with reference to M1- and M2-based composites reinforced with Fabrics F1 (Figure 16), F2 (Figure 17), F4 (Figure 18), F6 (Figure 19) and F7 (Figure 20). Average sample dimensions were considered and the analytical responses were cut at the maximum average stress value σTRC,max (see Table 7). The analytical curves were compared with the experimental results in terms of composite stress σTRC vs. strain ε. Experimental strains were evaluated from the LVDT outputs, as the ratio between the average crack opening displacement COD and the measured gauge lengths GL. Please note that each curve in the figures is broken to the loss of the first transducer.
From the comparison, it was possible to notice that the analytical curves seem to properly fit the experimental results in almost any of the investigated TRCs. It was observed that:
- The stochastic model should fit the sequence of cracking stress values in the stable propagation phase. In all the cases investigated, the choice of a different tensile strength (type “B” analysis in place of type “A”) allowed containing estimation errors. Moreover, it could be concluded that: (i) the two-parameter Weibull distribution function worked adequately; (ii) the m parameter, despite being obtained from flexural results, satisfactorily simulated the slope of direct tension curves; (iii) as expected, the effect of dispersed microfibers was not captured; and (iv) differences between the analytical and the experimental cracking stresses may be connected to mixed tensile-bending stress fields (unbalanced shrinkage could lead to a loss of planarity of the specimen).
- The transition point between the second and the third branch was satisfactorily caught by the analytical simulations. The ability of a simplified model to fit this response range was really important, bearing in mind that one of the main advantages of TRC—as an example in the case of retrofitting applications—is its energy dissipation capacity (Section 4.3). In these preliminary analyses, the use of mean saturated crack distances X obtained from experimental observation seemed an adequate compromise solution and again confirmed that the Weibull function can effectively describe discrete distributions of cracks. Future alternatives for the assessment of the X value might be based on the experimental evaluation of the frictional shear stress by means of pull-out tests and the use of refined approaches, such as the car parking problem solution.
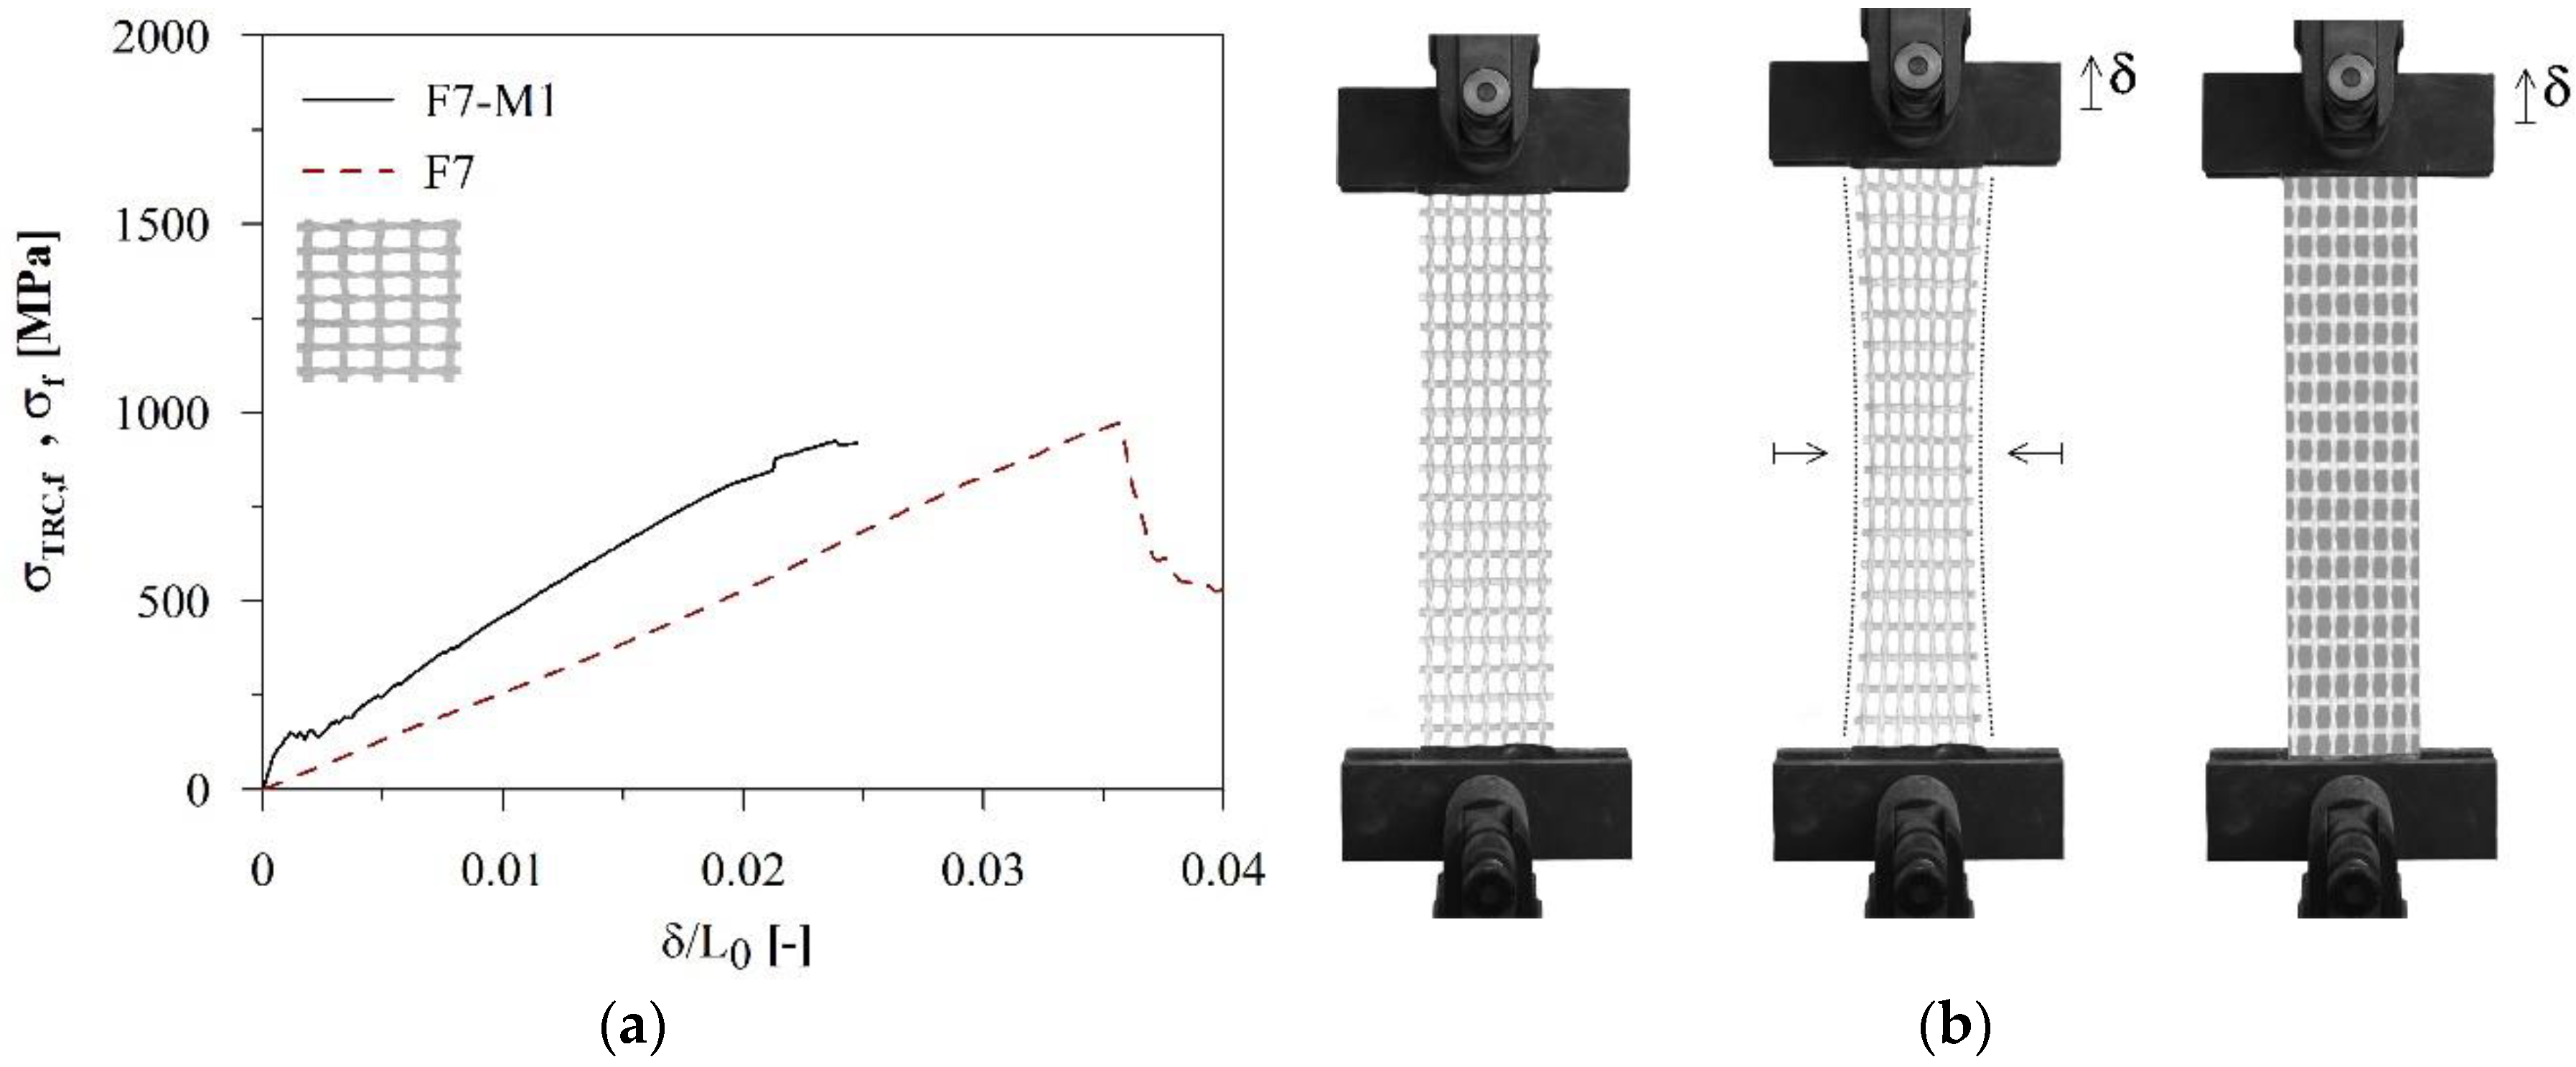
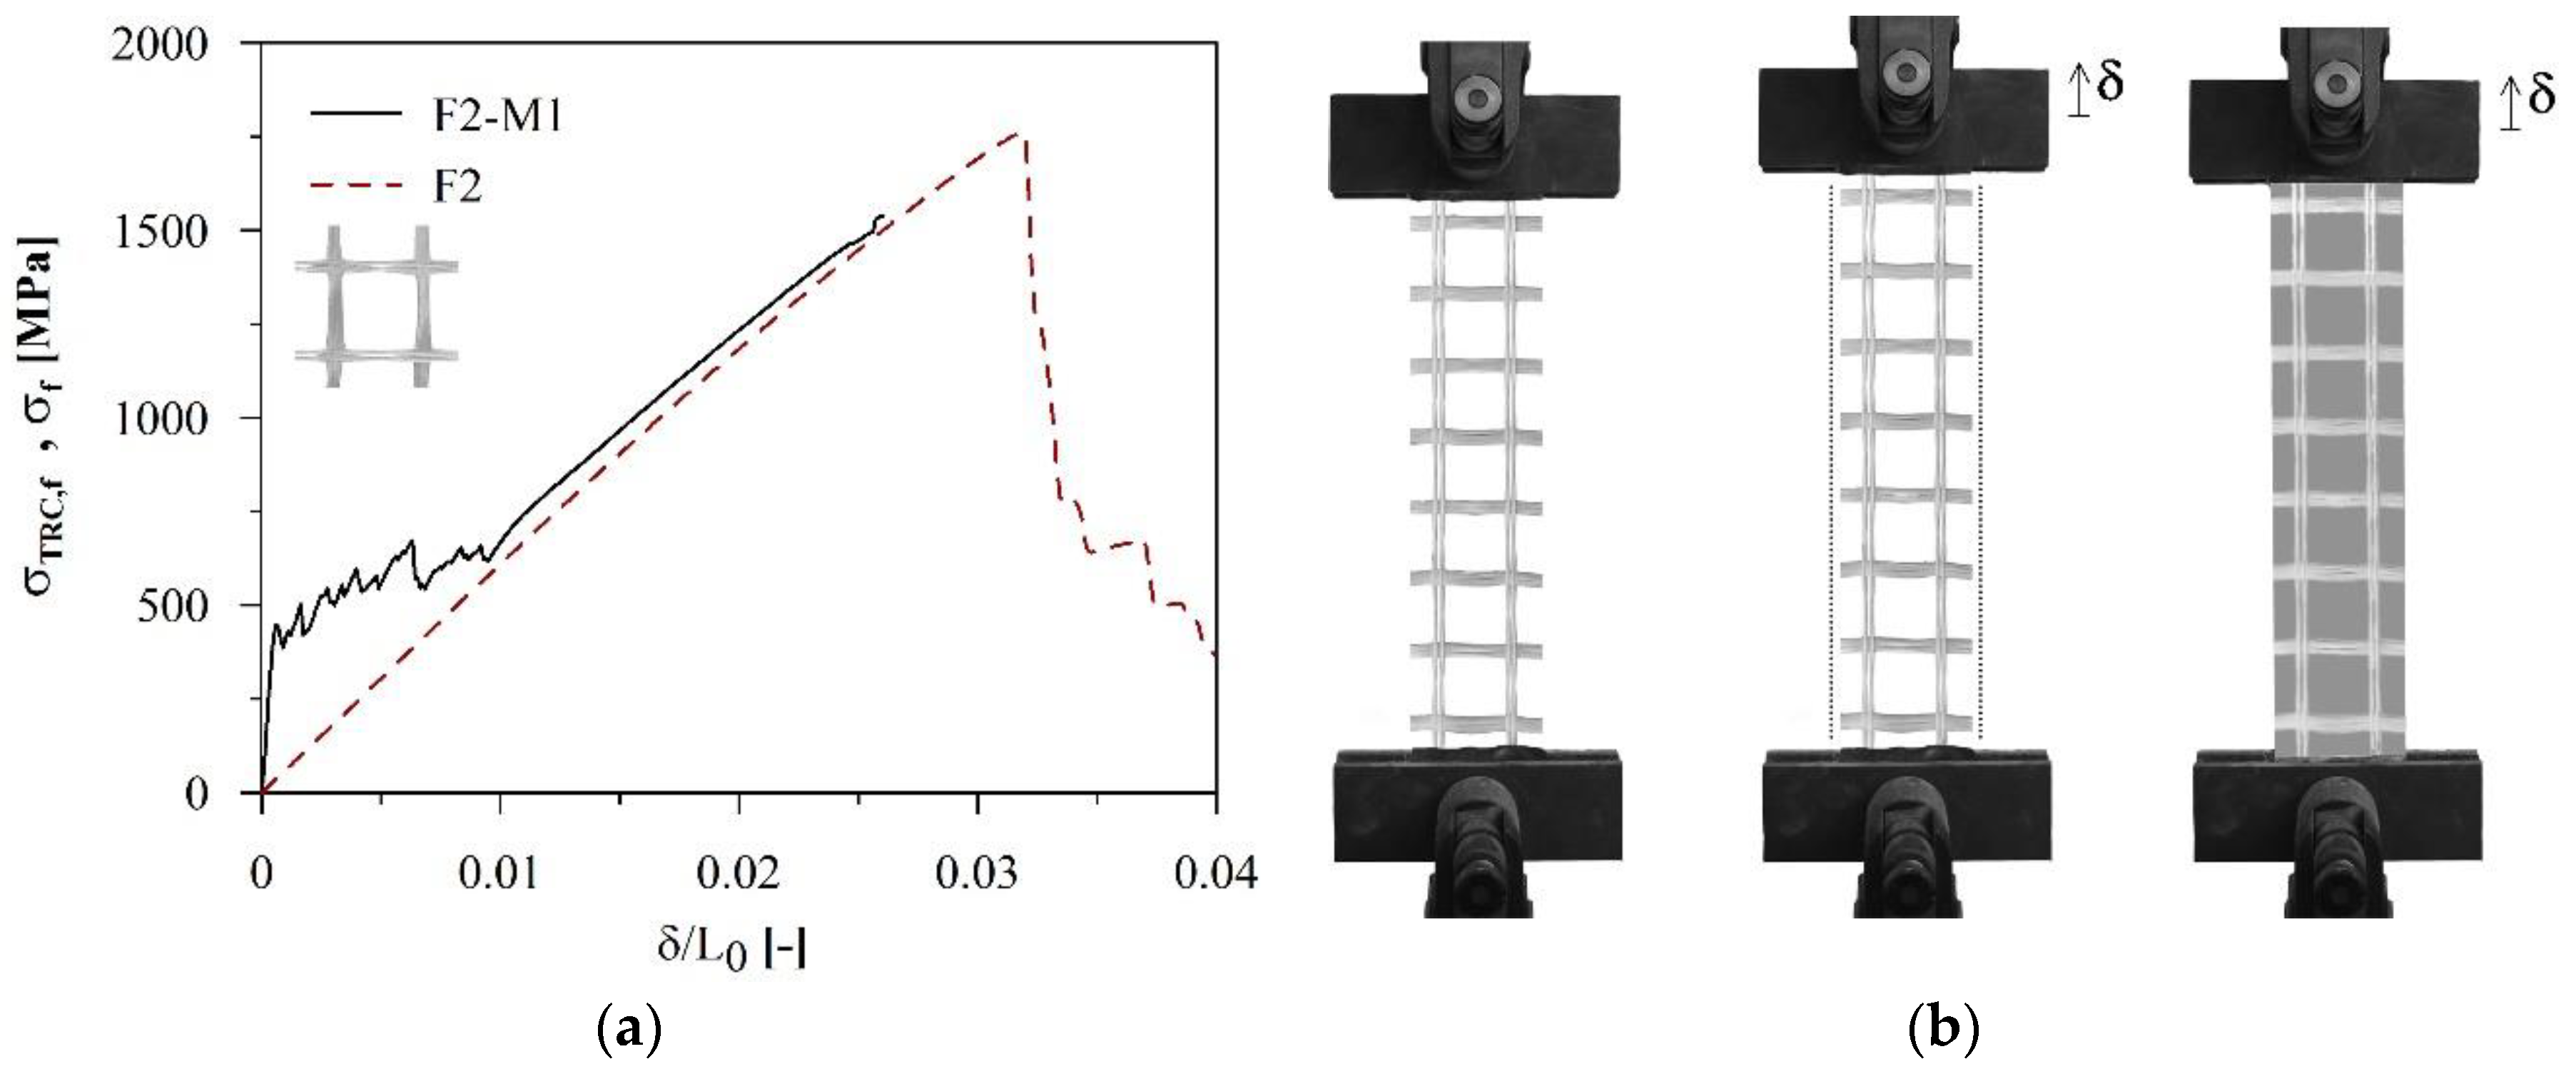
- The hypothesis of evaluating the effective amount of AR-glass reinforcement multiplying the fibres volume fraction Vf by the fabric efficiency factor EFf appeared to properly fit the third-branch slopes in almost all cases, with the only exception being F7-based composites. This was probably associated to the fabric–matrix interaction during the tensile loading: as confirmed by the experimental evidences graphically reconstructed in Figure 21b, during the loading phase along the warp direction, Fabric F7 exhibited a marked transverse deformation correlated to the “Poisson” effect in woven fabrics [27]. This deformability seemed to be negligible in the other cases, e.g., Fabric F2 (see Figure 22). In the composite system, the embedding matrix acted as a restraint to this transverse deformation, stiffening the third branch composite response with respect to the plain fabric behaviour. In Figure 21a, this effect is highlighted by the comparison between the composite and the fabric experimental curves. According to the literature, it can be stated that the “Poisson” effect is more significant in the case of unbalanced warp/weft fabrics [27], in terms of both equivalent diameter ratio and pick distances of the yarns; nevertheless, greater role is attributed to the warp crimp, found to have almost a linear correlation with the fabric transverse deformation [28]. Within the group of fabrics investigated in this work, F7 was clearly the more affected, due to the higher AR-glass grammage and the significant yarn diameter in the warp direction (this effect is greater also with respect to Fabric F6 where, even though the warp grammage is identical, the crimp is lower due to the smaller spacing of warp yarns).
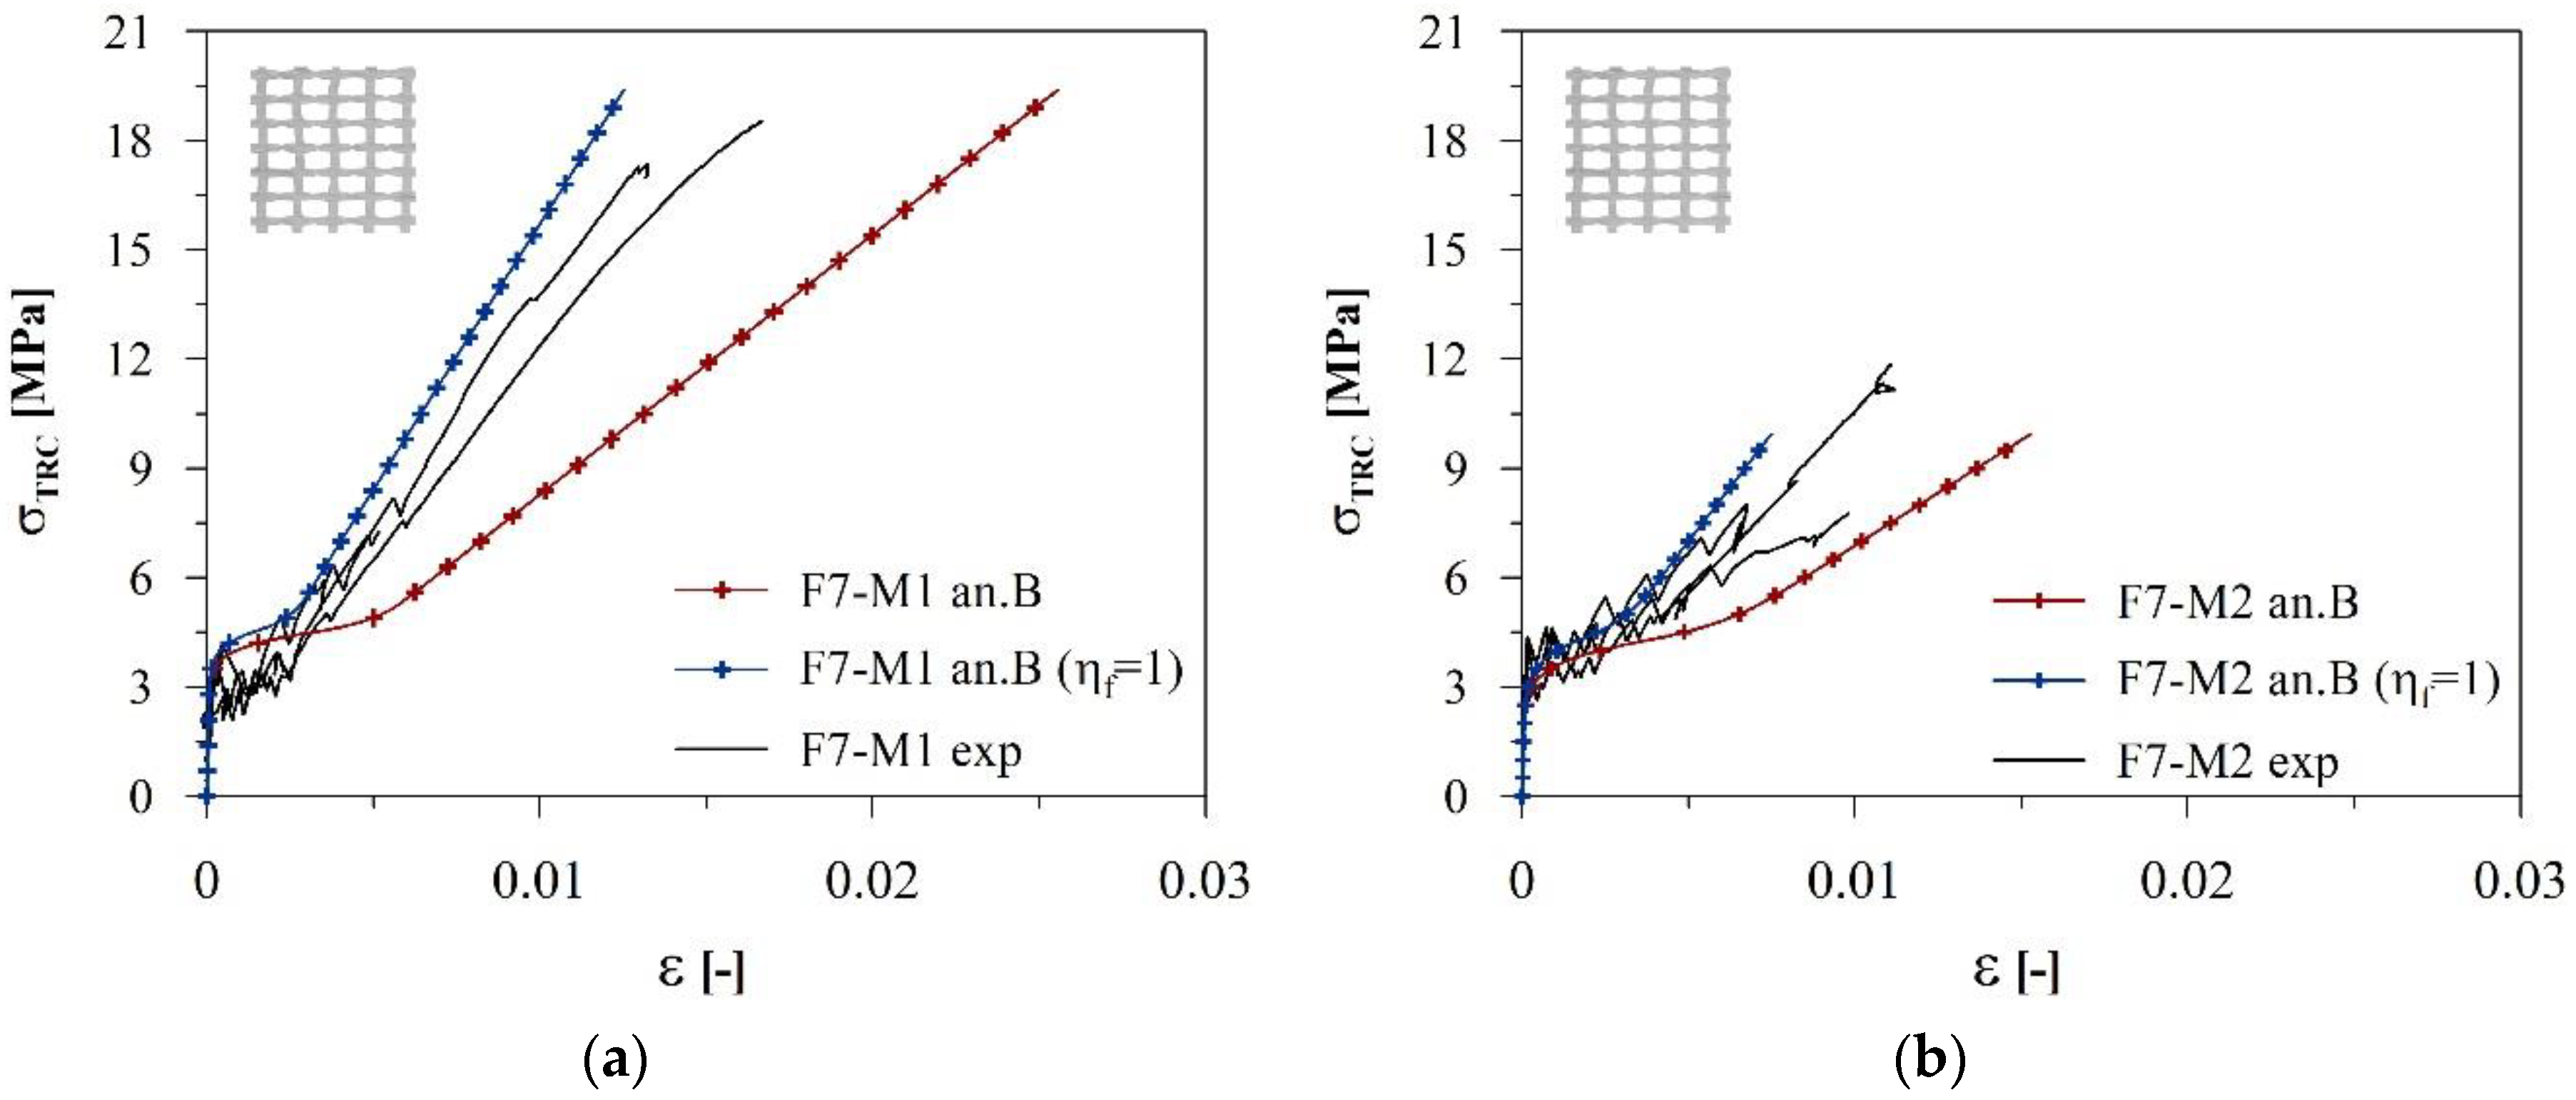
In view of the latter remarks, the stochastic model was again applied to the F7-based composites, adopting ηf = EFf only in the evaluation of the peak analytical stress, but imposing ηf = 1 in Equation (8) (in this sense, all filaments contributed to the resisting mechanism and Ec,III was assumed equal to the elastic modulus Ef of the AR-glass filaments). This solution, in which all filaments (Af) worked as parallel springs with Ef = 70 GPa, represents an upper bound of the experimental results in terms of third branch slope, as shown in Figure 23.
6. Conclusions and Future Developments
The extensive experimental campaign presented in this work allowed better understanding the involved phenomena and the effect of individual components (matrix, textile and short fibres) on the tensile behaviour of TRC composites. In this sense, the use of the efficiency and the ductility/energy absorption parameters introduced in this work represent a systematic approach for the comparison of alternative TRC configurations and for the assessment of synergic contributions. From the interpretation of the experimental results, it can be concluded that:
- The coating nature and the fabric weaving had a significant influence on the global capacity of the composites, mainly in terms of global efficiency; both the reduction of the filaments that effectively participated in the mechanical response and the variation in the bond–slip behaviour at the fabric/matrix interface played a significant role.
- In general, the addition of short fibres was reflected in an increase of the mechanical capacities and a better behaviour in terms of durability. This effect seemed to be less visible in the case of narrow-spaced textiles, or when the matrix choice entailed a reduced fibre pull-out strength.
- The differences between matrices designed for different applications (new constructions vs. retrofitting) should be considered not only in terms of first cracking strength and initial elastic stiffness, but also in view of better understanding the global response of TRC composites. In particular, the internal slippage of the fabric—favoured by the use of less compact matrices—may significantly reduce the stiffness of the third branch of the curve, affecting the ultimate capacity of the composite.
- To obtain efficient tensile responses also when heavy-duty textiles are adopted, it might be necessary to slightly increase the thickness of the specimens, better controlling the internal slippage between the fabric and the surrounding matrix.
Cost-effective solutions were obtained by carefully combining the different components, in view of minimising the waste of material while improving the overall mechanical capacity. In this sense, the aims of the optimisation process were the maximisation of the efficiency (both the EFTRC and the EFTRC,f) and of the energy absorption capacity.
The application of the stochastic cracking model showed that it was possible to simulate the experimental tensile curves with a good correlation, starting from assumptions directly derived from standard tests results (Section 5.3). The fabric efficiency factor EFf appeared to be directly related to the slope of the third branch in the stress–strain composite behaviour on condition that the transverse deformation of the fabric was limited. In the attempt to provide a predictive capacity to the model, it might be necessary: (i) to implement the effect of added fibres, so as to capture the second stage stress increase and the correct extent of the multi-cracking zone (this last directly correlated to the variation of the cracking pattern development due to fibres addition); (ii) to investigate the non-linear nature of the bond–slip behaviour between the fabric and the matrix by means of pull-out tests, even if this might overcomplicate the model; (iii) to better evaluate the cracking tensile stress of the employed matrix, for instance by means of direct tensile tests on more representative specimens (e.g., with the same nominal dimensions and the same mortar compaction of the TRC composites); and (iv) to develop a method to assess the fabric elastic behaviour, when transversely restrained by the mortar (furtherly investigating the effects of crimp, yarns diameter and grid spacing on the fabric “Poisson” effect).
Author Contributions
Conceptualisation, M.C.R., G.Z., M.C. and M.d.P.; methodology, M.C.R., G.Z. and M.C.; software, M.C.R. and G.Z.; validation, M.C.R. and G.Z.; formal analysis, M.C.R. and G.Z.; investigation, M.C.R. and G.Z.; data curation, M.C.R. and G.Z.; writing—original draft preparation, M.C.R. and G.Z.; writing—review and editing, M.C.R., G.Z., M.C. and M.d.P.; visualisation, M.C.R. and G.Z.; supervision, G.Z., M.C. and M.d.P.; and funding acquisition, M.d.P.
Funding
This research was funded by the ReLUIS interuniversity consortium (ReLUIS PR 5 2017).
Acknowledgments
The authors would like to acknowledge Gavazzi Tessuti Tecnici Spa, BASF Construction Chemicals Italia Spa, BEng. Nicola Borgioni, MEng. Giada Catalano and MEng. Laura Tiraboschi for their precious contribution to the research.
Conflicts of Interest
The authors declare no conflict of interest. The funders had no role in the design of the study; in the collection, analyses, or interpretation of data; in the writing of the manuscript, or in the decision to publish the results.
References
- Peled, A.; Bentur, A.; Mobasher, B. Textile Reinforced Concrete, 1st ed.; CRC Press: Boca Raton, FL, USA, 2017; pp. 1–473. [Google Scholar]
- Brameshuber, W. (Ed.) Textile Reinforced Concrete—State-of-the-Art Report of RILEM TC 201-TRC; RILEM Publications SARL: Bagneux, France, 2006. [Google Scholar]
- De Felice, G.; De Santis, S.; Garmendia, L.; Ghiassi, B.; Larrinaga, P.; Lourenço, P.B.; Oliveira, D.V.; Paolacci, F.; Papanicolaou, C.G. Mortar-based systems for externally bonded strengthening of masonry. Mater. Struct. 2014, 47, 2021–2037. [Google Scholar] [CrossRef] [Green Version]
- De Santis, S.; De Felice, G. Tensile behaviour of mortar-based composites for externally bonded reinforcement systems. Compos. Part B Eng. 2015, 68, 401–413. [Google Scholar] [CrossRef]
- Rampini, M.C.; Zani, G.; Colombo, M.; Di Prisco, M. Textile reinforced concrete composites for existing structures: Performance optimization via mechanical characterization. In Proceedings of the 12th Fib International PhD Symposium in Civil Engineering, Prague, Czech Republic, 29–31 August 2018; pp. 907–914. [Google Scholar]
- Koutas, L.N.; Tetta, Z.; Bournas, D.A.; Triantafillou, T.C. Strengthening of Concrete Structures with Textile Reinforced Mortars: State-of-the-Art Review. J. Compos. Constr. 2019, 23, 03118001. [Google Scholar] [CrossRef]
- Mechtcherine, V.; Schneider, K.; Brameshuber, W. Mineral-Based Matrices for Textile-Reinforced Concrete. In Textile Fibre Composites in Civil Engineering; Triantafillou, T.C., Ed.; Elsevier Inc.: Amsterdam, The Netherlands, 2016; pp. 25–43. [Google Scholar]
- Butler, M.; Mechtcherine, V.; Hempel, S. Durability of textile reinforced concrete made with AR glass fibre: Effect of the matrix composition. Mater. Struct. 2010, 43, 1351–1368. [Google Scholar] [CrossRef]
- Colombo, I.G.; Magri, A.; Zani, G.; Colombo, M.; Di Prisco, M. Erratum: Textile reinforced concrete: Experimental investigation on design parameters. Mater. Struct. 2013, 46, 1953–1971. [Google Scholar] [CrossRef]
- Peled, A.; Bentur, A. Mechanisms of fabric reinforcement of cement matrices: Effect of fabric geometry and yarn properties. Beton- und Stahlbetonbau 2004, 99, 456–459. [Google Scholar] [CrossRef]
- Soranakom, C.; Mobasher, B. Geometrical and mechanical aspects of fabric bonding and pullout in cement composites. Mater. Struct. 2009, 42, 765–777. [Google Scholar] [CrossRef]
- Barhum, R.; Mechtcherine, V. Influence of short dispersed and short integral glass fibres on the mechanical behaviour of textile-reinforced concrete. Mater. Struct. 2013, 46, 557–572. [Google Scholar] [CrossRef]
- Consiglio Nazionale delle Ricerche. CNR DT-215 Istruzioni per la Progettazione, l’Esecuzione ed il Controllo di Interventi di Consolidamento Statico Mediante L’utilizzo di Compositi Fibrorinforzati a Matrice Inorganica; Consiglio Nazionale delle Ricerche: Rome, Italy, 2018. (In Italian) [Google Scholar]
- Consiglio Superiore dei Lavori Pubblici, Servizio Tecnico Centrale. Linea Guida per la Identificazione, la Qualificazione ed il Controllo di Accettazione di Compositi Fibrorinforzati a Matrice Inorganica (FRCM) da Utilizzarsi per il Consolidamento Strutturale di Costruzioni Esistenti; Consiglio Superiore dei Lavori Pubblici, Servizio Tecnico Centrale: Rome, Italy, 2018. (In Italian) [Google Scholar]
- Aveston, J.; Cooper, G.A.; Kelly, A. Single and multiple fracture. The Properties of Fibre Composites. In Proc Conf National Physical Laboratories; IPC Science & Technology Press Ltd.: London, UK, 1971; pp. 15–24. [Google Scholar]
- Aveston, J.; Kelly, A. Theory of multiple fracture of fibrous composites. J. Mater. Sci. 1973, 8, 352–362. [Google Scholar] [CrossRef]
- Cuypers, H.; Wastiels, J. Stochastic matrix-cracking model for textile reinforced cementitious composites under tensile loading. Mater. Struct. 2006, 39, 777–786. [Google Scholar] [CrossRef]
- UNI EN 196. Method of Testing Cement-Part 1: Determination of Strength; UNI EN: Brussels, Belgium, 2005. [Google Scholar]
- fib Model Code 2010, Vol. 1, Bull. 65; International Federation for Structural Concrete: Lausanne, Switzerland, 2012.
- ISO 4606. Textile Glass—Woven Fabric—Determination of Tensile Breaking Force and Elongation at Break by the Strip Method; ISO: Geneva, Switzerland, 1995. [Google Scholar]
- Cohen, Z.; Peled, A. Controlled telescopic reinforcement system of fabric-cement composites - Durability concerns. Cem. Concr. Res. 2010, 40, 1495–1506. [Google Scholar] [CrossRef]
- Hegger, J.; Will, N.; Curbach, M.; Jesse, F. Tragverhalten von textilbewehrtem Beton. Beton- und Stahlbetonbau 2004, 99, 452–455. (In German) [Google Scholar] [CrossRef]
- RILEM Technical Committee 232-TDT (Wolfgang Brameshuber). Recommendation of RILEM TC 232-TDT: Test Methods and Design of Textile Reinforced Concrete. Mater. Struct. 2016, 49, 4923–4927. [Google Scholar] [CrossRef]
- Blom, J.; Cuypers, H.; Van Itterbeeck, P.; Wastiels, J. Determination of material parameters of a textile reinforced composite using an inverse method. In Proceedings of the ECCCM 13 Conference, Stockholm, Sweden, 2–5 June 2008. [Google Scholar]
- Curtin, W.A. Stochastic Damage Evolution and Failure in Fibre-Reinforced Composites. Adv. Appl. Mech. 1999, 36, 163–253. [Google Scholar]
- Weibull, W. A Statistical distribution function of wide applicability. ASME J. 1951, 18, 293–297. [Google Scholar]
- Sun, H.; Pan, N.; Postle, R. On the Poisson’s ratios of a woven fabric. Compos. Struct. 2005, 68, 505–510. [Google Scholar] [CrossRef]
- Shahabi, N.E.; Saharkhiz, S.; Varkiyani, S.M.H. Effect of fabric structure and weft density on the Poisson’s ratio of worsted fabric. J. Eng. Fibers Fabr. 2013, 8, 63–71. [Google Scholar] [CrossRef]
Figure 1.
Overview of the investigated alkali-resistant glass fabrics (70 × 70 mm2 samples).

Figure 2.
Fabric and textile reinforced concrete (TRC) specimens: uniaxial tensile test setups and nominal geometries (measures expressed in mm).
Figure 2.
Fabric and textile reinforced concrete (TRC) specimens: uniaxial tensile test setups and nominal geometries (measures expressed in mm).

Figure 3.
Fabric average tensile responses in terms of load vs. displacement: in the warp direction (a); and in the weft direction (b).
Figure 3.
Fabric average tensile responses in terms of load vs. displacement: in the warp direction (a); and in the weft direction (b).

Figure 4.
Fabric average tensile responses in terms of fabric stress vs. normalised displacement: in the warp direction (a); and in the weft direction (b).
Figure 4.
Fabric average tensile responses in terms of fabric stress vs. normalised displacement: in the warp direction (a); and in the weft direction (b).

Figure 5.
Average tensile response in terms of nominal stress vs. normalised displacement for M1-based (a) and M2-based (b) composites reinforced with Fabrics F1–F3 (warp direction).
Figure 5.
Average tensile response in terms of nominal stress vs. normalised displacement for M1-based (a) and M2-based (b) composites reinforced with Fabrics F1–F3 (warp direction).

Figure 6.
Average tensile response in terms of nominal stress vs. normalised displacement for M1-based (a) and M2-based (b) composites reinforced with Fabrics F4–F7 (warp direction).
Figure 6.
Average tensile response in terms of nominal stress vs. normalised displacement for M1-based (a) and M2-based (b) composites reinforced with Fabrics F4–F7 (warp direction).

Figure 7.
Effect of different coatings on the uniaxial tensile response (a); and on the cracking pattern (b) of M1-based composites reinforced with geometrically identical F2 and F3 fabrics.
Figure 7.
Effect of different coatings on the uniaxial tensile response (a); and on the cracking pattern (b) of M1-based composites reinforced with geometrically identical F2 and F3 fabrics.

Figure 8.
Effect of different coatings on the uniaxial tensile response (a); and on the cracking pattern (b) of M1-based composites reinforced with geometrically identical F4 and F5 fabrics.
Figure 8.
Effect of different coatings on the uniaxial tensile response (a); and on the cracking pattern (b) of M1-based composites reinforced with geometrically identical F4 and F5 fabrics.

Figure 9.
Effect of short fibres addition on the uniaxial tensile response of TRC composites reinforced with Fabrics: F2 (a); and F6 (b).
Figure 9.
Effect of short fibres addition on the uniaxial tensile response of TRC composites reinforced with Fabrics: F2 (a); and F6 (b).

Figure 10.
Cracking patterns with and without short fibres for TRC composites reinforced with Fabrics: F2 (a); and F6 (b).
Figure 10.
Cracking patterns with and without short fibres for TRC composites reinforced with Fabrics: F2 (a); and F6 (b).

Figure 11.
Identification of relevant mechanical parameters on the uniaxial tensile response: efficiency (a) and ductility/energy absorption (b) variables.
Figure 11.
Identification of relevant mechanical parameters on the uniaxial tensile response: efficiency (a) and ductility/energy absorption (b) variables.

Figure 12.
Efficiency factors in uniaxial tension for M1-based (a) and M2-based (b) TRC composites.

Figure 13.
Ductility/energy absorption parameters in uniaxial tension for M1-based (a) and M2-based (b) TRC composites: effect of fibres addition.
Figure 13.
Ductility/energy absorption parameters in uniaxial tension for M1-based (a) and M2-based (b) TRC composites: effect of fibres addition.

Figure 14.
Typical stages of the tensile response in the ACK and Stochastic cracking models and illustrative cracking patterns.
Figure 14.
Typical stages of the tensile response in the ACK and Stochastic cracking models and illustrative cracking patterns.

Figure 15.
Fabric average tensile responses in terms of fabric stress on effective filaments σf* vs. normalised displacement in the warp directions (a) and in the weft directions (b).
Figure 15.
Fabric average tensile responses in terms of fabric stress on effective filaments σf* vs. normalised displacement in the warp directions (a) and in the weft directions (b).

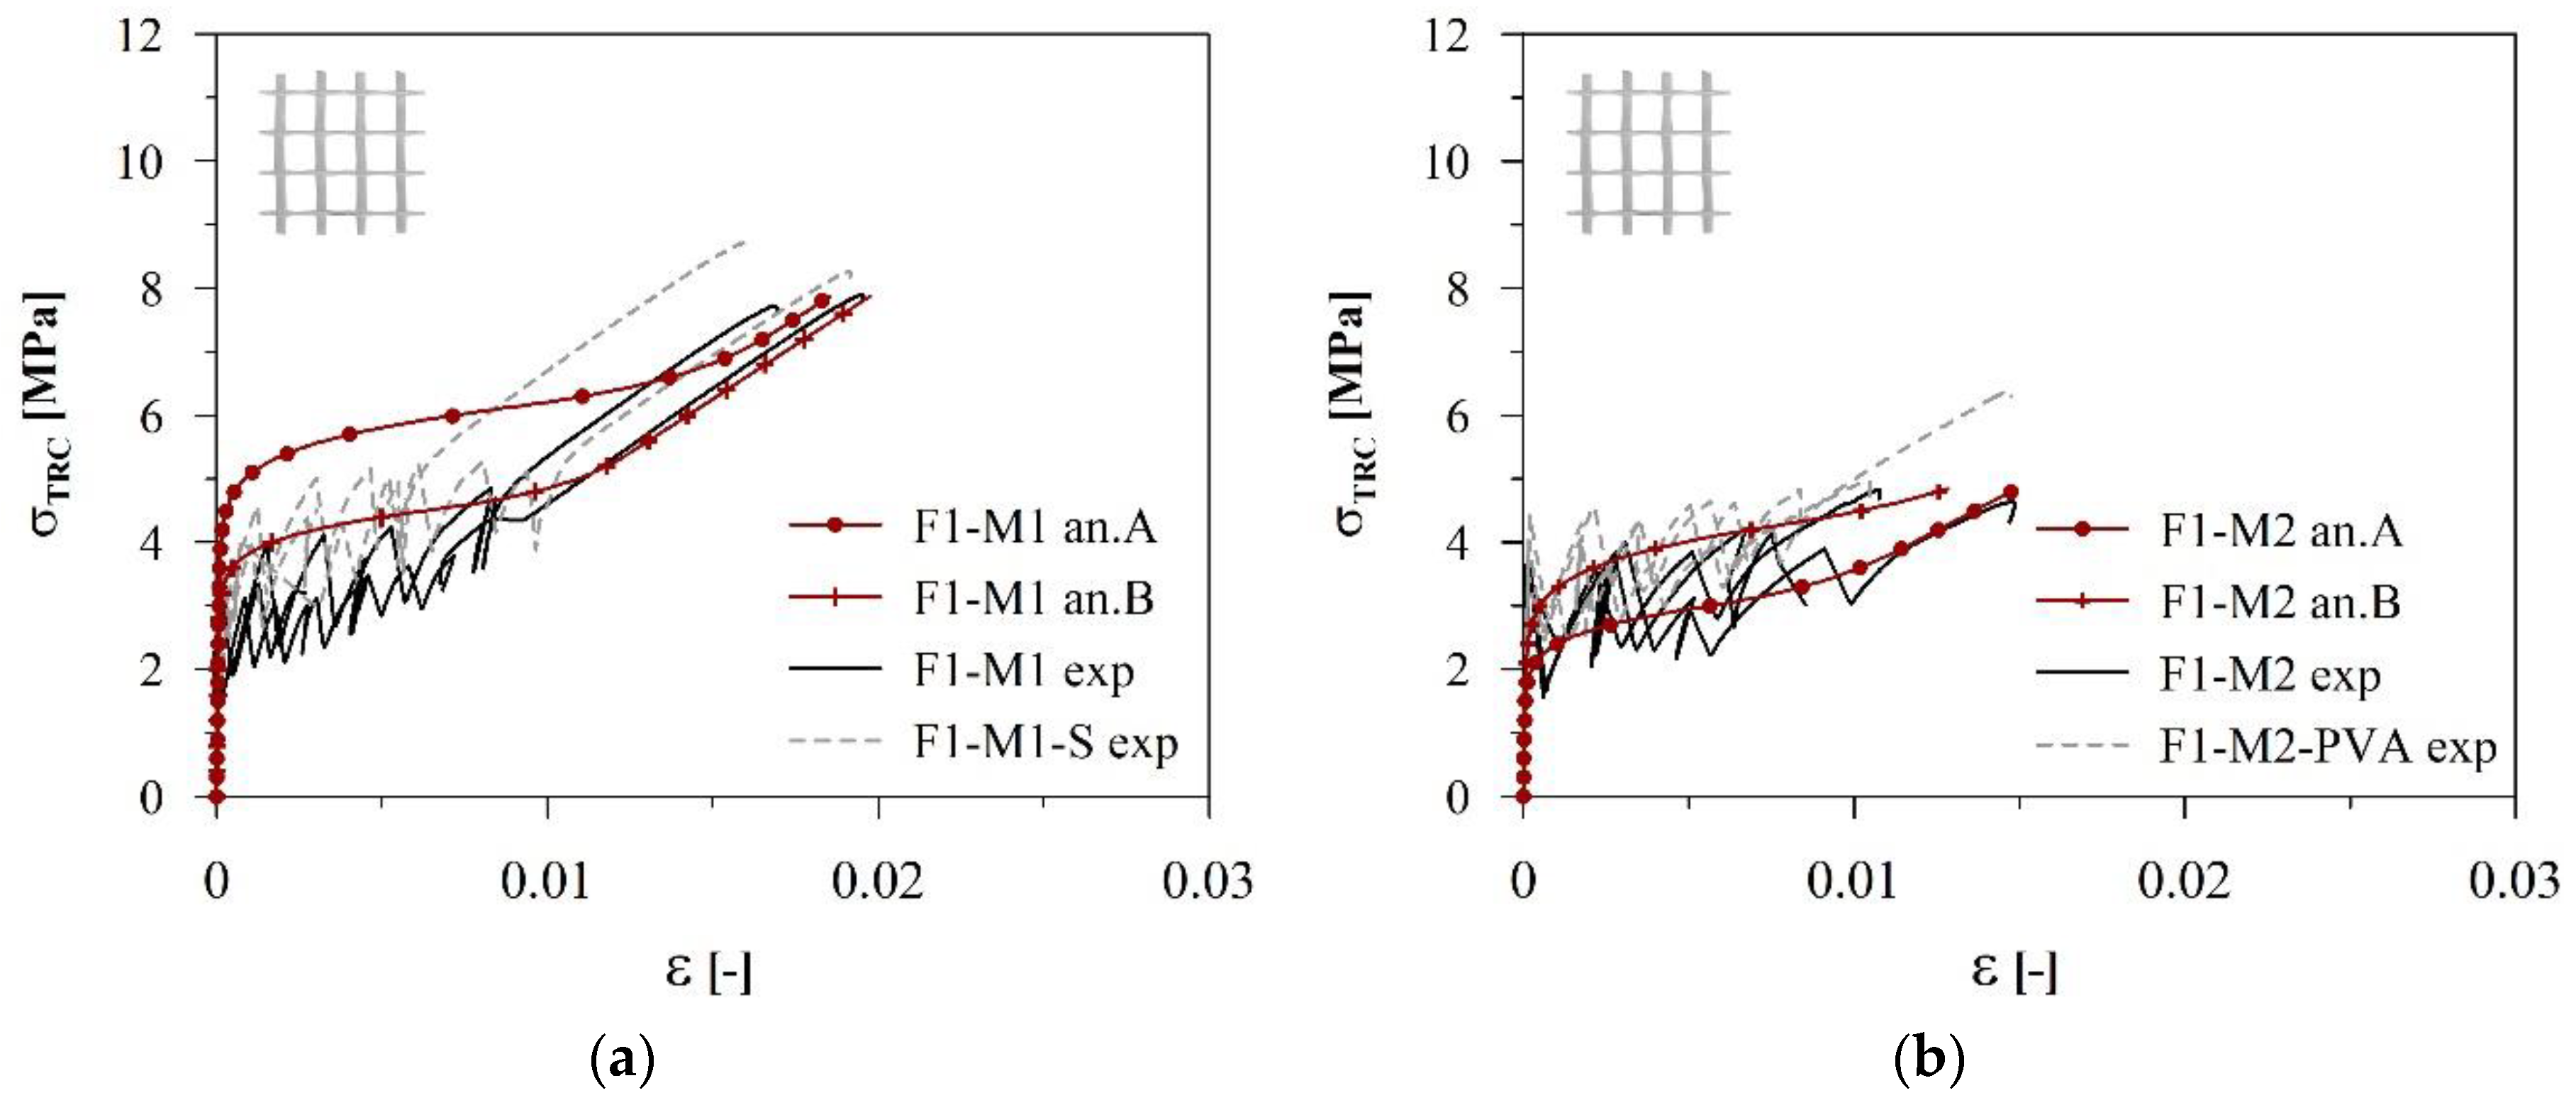
Figure 16.
Comparison between the predicted analytical curves and the experimental responses in terms of nominal stress vs. strain for M1-based (a) and M2-based (b) composites reinforced with Fabric F1.
Figure 16.
Comparison between the predicted analytical curves and the experimental responses in terms of nominal stress vs. strain for M1-based (a) and M2-based (b) composites reinforced with Fabric F1.

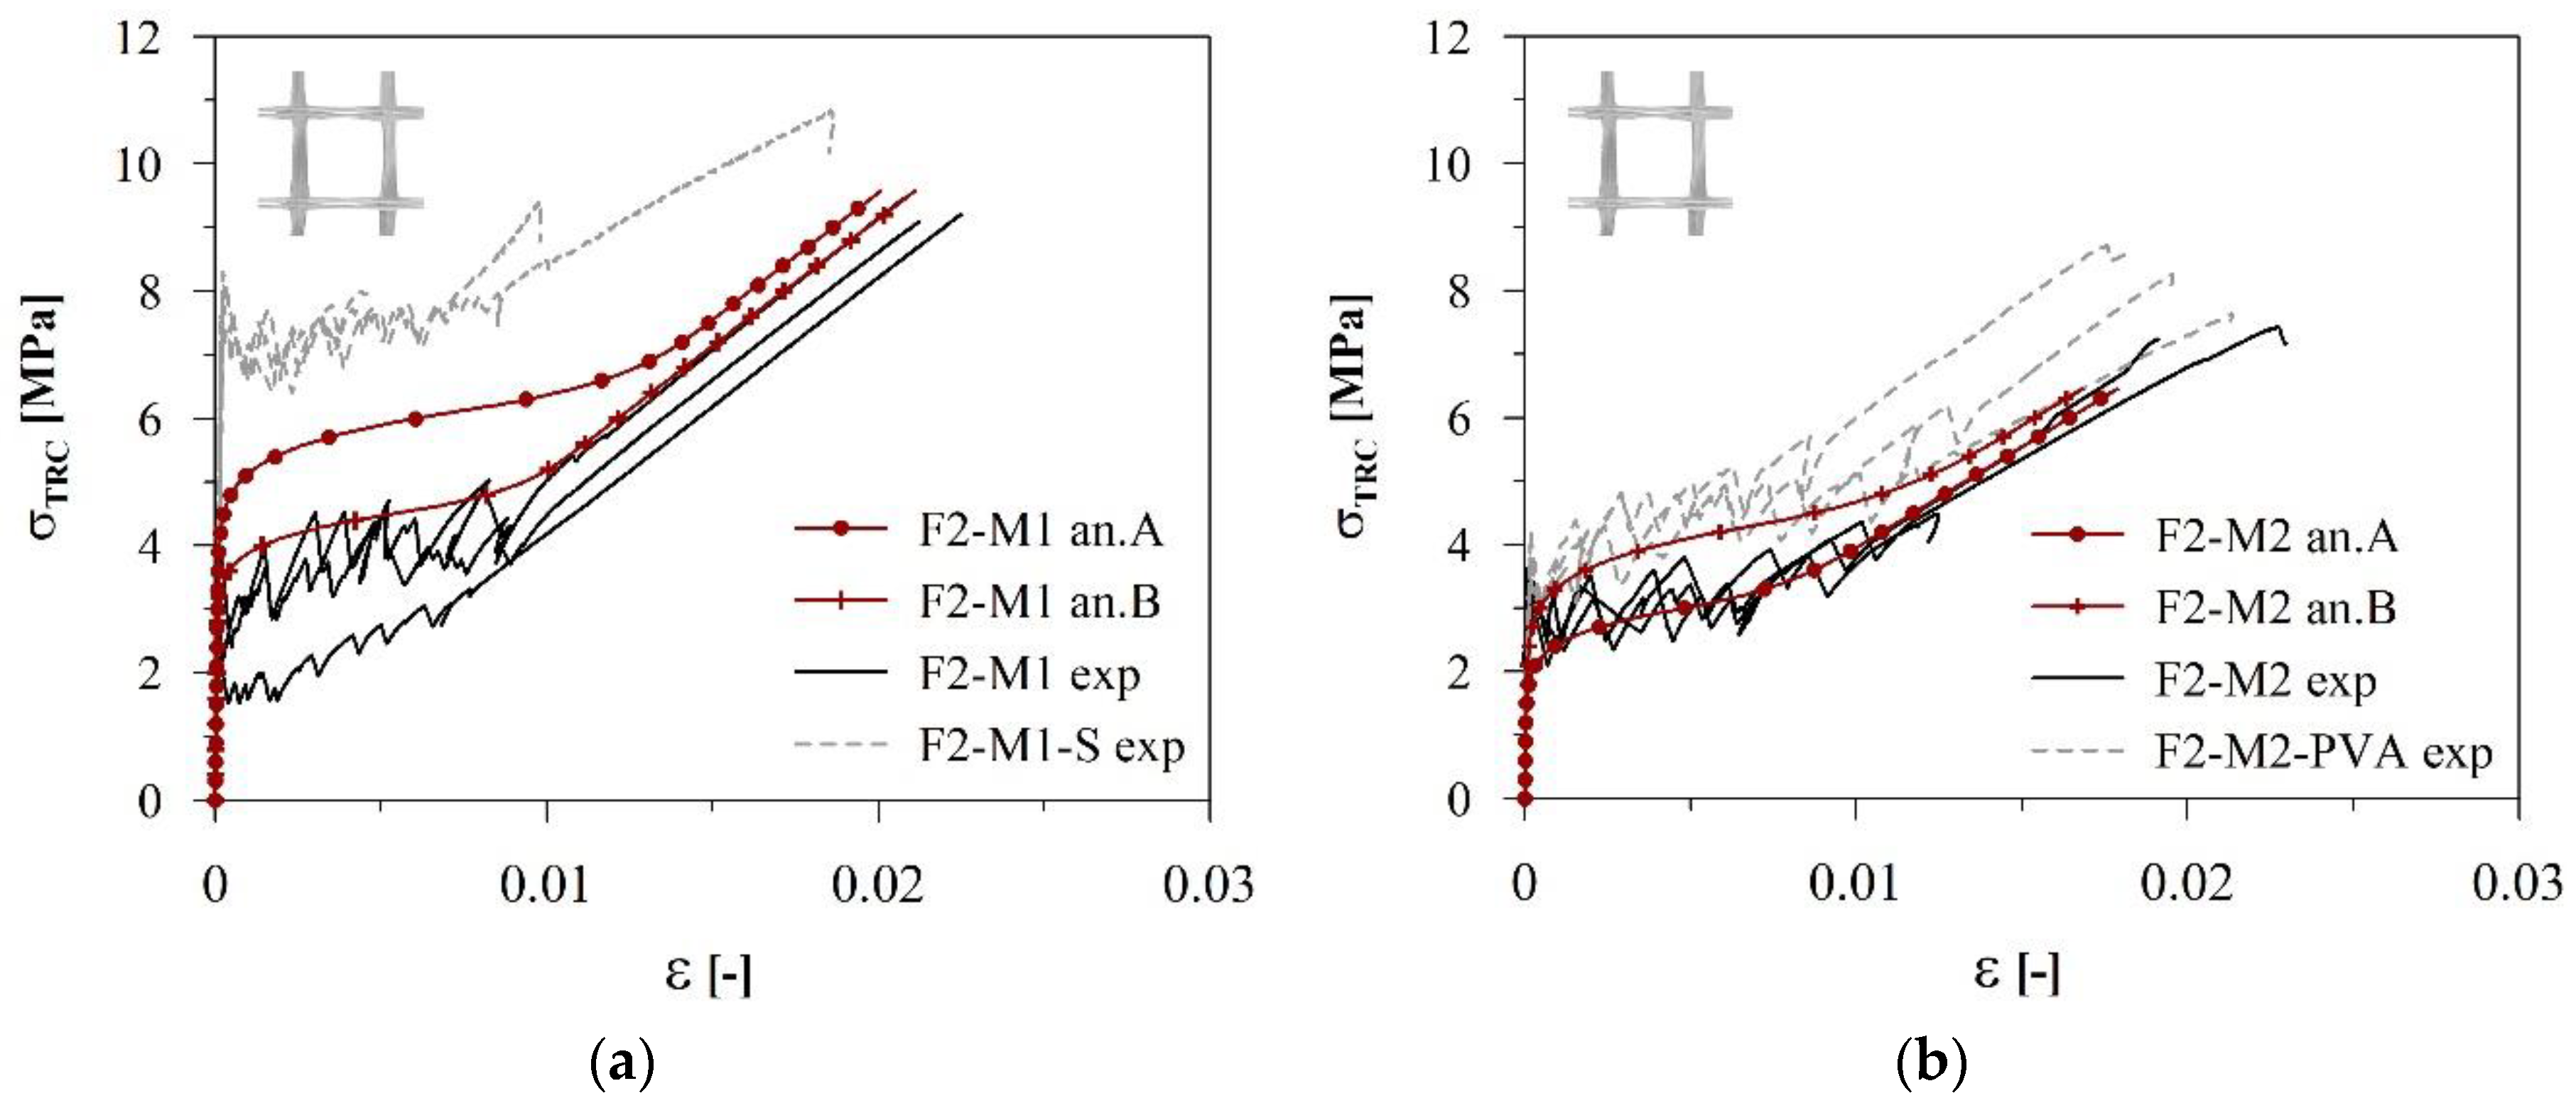
Figure 17.
Comparison between the predicted analytical curves and the experimental responses in terms of nominal stress vs. strain for M1-based (a) and M2-based (b) composites reinforced with Fabric F2.
Figure 17.
Comparison between the predicted analytical curves and the experimental responses in terms of nominal stress vs. strain for M1-based (a) and M2-based (b) composites reinforced with Fabric F2.

Figure 18.
Comparison between the predicted analytical curves and the experimental responses in terms of nominal stress vs. strain for M1-based (a) and M2-based (b) composites reinforced with Fabric F4.
Figure 18.
Comparison between the predicted analytical curves and the experimental responses in terms of nominal stress vs. strain for M1-based (a) and M2-based (b) composites reinforced with Fabric F4.

Figure 19.
Comparison between the predicted analytical curves and the experimental responses in terms of nominal stress vs. strain for M1-based (a) and M2-based (b) composites reinforced with Fabric F6.
Figure 19.
Comparison between the predicted analytical curves and the experimental responses in terms of nominal stress vs. strain for M1-based (a) and M2-based (b) composites reinforced with Fabric F6.

Figure 20.
Comparison between the predicted analytical curves and the experimental responses in terms of nominal stress vs. strain for M1-based (a) and M2-based (b) composites reinforced with Fabric F7.
Figure 20.
Comparison between the predicted analytical curves and the experimental responses in terms of nominal stress vs. strain for M1-based (a) and M2-based (b) composites reinforced with Fabric F7.

Figure 21.
Comparison between F7-M1 composite and F7 fabric tensile responses (a); and explanation of the stiffening effect provided by the prevented transverse contraction of Fabric F7 (b).
Figure 21.
Comparison between F7-M1 composite and F7 fabric tensile responses (a); and explanation of the stiffening effect provided by the prevented transverse contraction of Fabric F7 (b).

Figure 22.
Comparison between F2-M1 composite and F2 fabric tensile responses (a); and negligible transverse contraction of Fabric F2 (b).
Figure 22.
Comparison between F2-M1 composite and F2 fabric tensile responses (a); and negligible transverse contraction of Fabric F2 (b).

Figure 23.
Effect of fabric efficiency on the predicted analytical response and comparison with the experimental data in terms of nominal stress vs. strain for M1-based (a) and M2-based (b) composites reinforced with F7 fabric.
Figure 23.
Effect of fabric efficiency on the predicted analytical response and comparison with the experimental data in terms of nominal stress vs. strain for M1-based (a) and M2-based (b) composites reinforced with F7 fabric.


Table 1.
Matrix M1 composition.
| Component | (kg/m3) |
|---|---|
| Cement I 52.5 | 600 |
| Sand 0–2 mm | 976.46 |
| Water | 209 |
| Superplasticiser | 44 |
| Blast furnace slag | 500 |
Table 2.
Matrix M2 composition.
| Component | (kg/m3) |
|---|---|
| Ready-mix admixture | 1840 |
| Water | 276 |
| Expansive agent | 18.4 |
Table 3.
Bending, tensile and compressive strengths of matrices M1 and M2: discrete values, average values, standard deviations and shape coefficients m of the two-parameter Weibull distributions.
Table 3.
Bending, tensile and compressive strengths of matrices M1 and M2: discrete values, average values, standard deviations and shape coefficients m of the two-parameter Weibull distributions.
| Specimen | Matrix M1 | Matrix M2 | ||||
|---|---|---|---|---|---|---|
| fctf (MPa) | fct (MPa) | fcc (MPa) | fctf (MPa) | fct (MPa) | fcc (MPa) | |
| N1 | 16.49 | 7.30 | 100.42 | 8.26 | 3.66 | 69.08 |
| N2 | 14.81 | 6.55 | 98.36 | 7.15 | 3.16 | 65.20 |
| N3 | 14.01 | 6.20 | 93.86 | 8.46 | 3.74 | 59.94 |
| N4 | 14.61 | 6.47 | 90.66 | 7.28 | 3.22 | 56.77 |
| N5 | 12.74 | 5.63 | 88.97 | 5.11 | 2.26 | 49.52 |
| N6 | 12.90 | 5.71 | 89.01 | 5.85 | 2.59 | 53.12 |
| Average | 14.26 | 6.31 | 93.55 | 7.02 | 3.10 | 58.94 |
| (std) | (1.39) | - | (4.91) | (1.32) | - | (7.35) |
| (std%) | (10%) | - | (5%) | (19%) | - | (12%) |
| m (Weibull) | 11.58 | - | - | 7.15 | - | - |
Table 4.
Alkali-resistant glass fabrics characteristics.
| F1 | F2 | F3 | F4 | F5 | F6 | F7 | ||
|---|---|---|---|---|---|---|---|---|
| Fabrication technique | Leano weave | Double leano weave | Double leano weave | Double leano weave | Double leano weave | Leano weave | Leano weave | |
| Coating nature | SBR | Epoxy | SBR | Epoxy | SBR | SBR | SBR | |
| Warp | Wire spacing (mm) | 18 | 38 | 38 | 38 | 38 | 5 | 10 |
| Roving fineness (Tex) | 2 × 1200 | 2 × 1200 | 2 × 1200 | 2 × 2400 | 2 × 2400 | 2 × 1200 | 2 × 2400 | |
| Filament diameter (μm) | 19 | 19 | 19 | 27 | 27 | 19 | 27 | |
| Equivalent reinforcement thickness* teq (mm) | 0.050 | 0.046 | 0.046 | 0.093 | 0.093 | 0.179 | 0.179 | |
| Weft | Wire spacing (mm) | 18 | 38 | 38 | 38 | 38 | 12 | 14.3 |
| Roving fineness (Tex) | 2400 | 2 × 2400 | 2 × 2400 | 4 × 2400 | 4 × 2400 | 2400 | 2 × 1200 | |
| Filament diameter (μm) | 27 | 27 | 27 | 27 | 27 | 27 | 19 | |
| Equivalent reinforcement thickness* teq (mm) | 0.050 | 0.046 | 0.046 | 0.093 | 0.093 | 0.071 | 0.062 | |
* calculated over a width of 1 m.
Table 5.
Mechanical properties of the investigated fabrics: average maximum tensile loads and efficiency parameters (70 mm wide specimens).
Table 5.
Mechanical properties of the investigated fabrics: average maximum tensile loads and efficiency parameters (70 mm wide specimens).
| F1 | F2 | F3 | F4 | F5 | F6 | F7 | ||
|---|---|---|---|---|---|---|---|---|
| Warp | Af (mm2) | 3.582 | 3.582 | 3.582 | 7.164 | 7.164 | 12.537 | 12.537 |
| Pf,max,avg (kN) | 5.72 | 6.41 | 6.21 | 12.50* | 11.44* | 15.98 | 12.20* | |
| (std) | (0.27) | (0.29) | (0.31) | (0.67) | (0.63) | (0.15) | (0.20) | |
| (std%) | (4.80%) | (4.53%) | (4.92%) | (5.34%) | (5.48%) | (0.93%) | (1.63%) | |
| EFf | 0.80 | 0.89 | 0.87 | 0.87 | 0.80 | 0.64 | 0.49 | |
| Weft | Af (mm2) | 3.582 | 3.582 | 3.582 | 7.164 | 7.164 | 5.373 | 4.478 |
| Pf,max,avg (kN) | 5.36 | 4.81 | 5.51 | 11.70 | 10.09* | 8.69 | 6.34 | |
| (std) | (0.27) | (0.33) | (0.76) | (0.75) | (0.82) | (0.71) | (0.41) | |
| (std%) | (5.13%) | (6.86%) | (13.78%) | (6.42%) | (8.09%) | (8.15%) | (6.40%) | |
| EFf | 0.75 | 0.67 | 0.77 | 0.82 | 0.70 | 0.81 | 0.71 | |
* average of four samples.
Table 6.
Geometrical and mechanical properties of the short fibres (high-carbon steel S and polyvinyl alcohol PVA).
Table 6.
Geometrical and mechanical properties of the short fibres (high-carbon steel S and polyvinyl alcohol PVA).
| Characteristics | S fibres | PVA fibres |
|---|---|---|
| Material | High-carbon steel | Polyvinyl alcohol |
| Length lf (mm) | 13 | 18 |
| Diameter df (mm) | 0.21 | 0.16–0.24 |
| Aspect ratio lf/df | 62 | ~90 |
| Tensile strength (MPa) | 2750 | 790–1160 |
| Modulus of elasticity (GPa) | 200 | 30 |
Table 7.
Tensile test results for TRC composites: average values (avg.) and standard deviations (std).
Table 7.
Tensile test results for TRC composites: average values (avg.) and standard deviations (std).
| t (mm) | b (mm) | L0 (mm) | Pmax (kN) | δu (mm) | σTRC,max (MPa) | σTRC,f,max (MPa) | δu/L0 (–) | σI (MPa) | ||
|---|---|---|---|---|---|---|---|---|---|---|
| F1-M1 | avg. | 8.34 | 70.66 | 295.67 | 4.60 | 6.66 | 7.82 | 1283.82 | 0.0225 | 3.35 |
| (std) | (0.49) | (1.24) | (0.58) | (0.13) | (0.44) | (0.45) | (36.83) | (0.0014) | (0.15) | |
| F1-M1-S | avg. | 8.41 | 70.71 | 295.00 | 5.05 | 6.24 | 8.49 | 1408.65 | 0.0211 | 2.88 |
| (std) | (0.17) | (0.76) | (1.00) | (0.16) | (0.16) | (0.30) | (45.14) | (0.0006) | (1.18) | |
| F1-M2 | avg. | 10.40 | 70.59 | 293.00 | 3.55 | 5.01 | 4.84 | 991.96 | 0.0171 | 3.46 |
| (std) | (0.68) | (0.19) | (1.00) | (0.18) | (0.44) | (0.11) | (49.49) | (0.0015) | (0.49) | |
| F1-M2-PVA | avg. | 10.60 | 70.46 | 293.33 | 4.05 | 4.48 | 5.46 | 1131.77 | 0.0153 | 2.96 |
| (std) | (0.60) | (1.03) | (1.15) | (0.38) | (0.92) | (0.85) | (107.46) | (0.0032) | (0.15) | |
| F2-M1 | avg. | 7.92 | 70.62 | 294.00 | 5.36 | 7.50 | 9.59 | 1497.15 | 0.0255 | 3.34 |
| (std) | (0.05) | (1.12) | (1.00) | (0.14) | (0.20) | (0.39) | (38.75) | (0.0006) | (0.78) | |
| F2-M1-S | avg. | 8.87 | 70.46 | 292.67 | 6.08 | 5.03 | 9.74 | 1698.58 | 0.0172 | 6.25 |
| (std) | (0.10) | (0.54) | (1.15) | (0.61) | (0.97) | (1.08) | (169.29) | (0.0033) | (1.53) | |
| F2-M2 | avg. | 9.99 | 70.25 | 293.67 | 4.53 | 6.56 | 6.48 | 1265.55 | 0.0223 | 3.02 |
| (std) | (0.18) | (0.90) | (0.58) | (1.12) | (0.97) | (1.68) | (313.91) | (0.0033) | (0.39) | |
| F2-M2-S | avg. | 9.73 | 70.45 | 293.33 | 5.64 | 7.24 | 8.24 | 1575.79 | 0.0247 | 3.23 |
| (std) | (0.31) | (0.57) | (0.58) | (0.43) | (0.29) | (0.71) | (120.65) | (0.0010) | (0.22) | |
| F2-M2-PVA | avg. | 9.81 | 70.50 | 294.00 | 5.70 | 6.81 | 8.27 | 1591.94 | 0.0232 | 2.75 |
| (std) | (0.61) | (1.33) | (1.73) | (0.08) | (0.23) | (0.54) | (23.05) | (0.0008) | (0.46) | |
| F3-M1 | avg. | 8.95 | 70.45 | 294.33 | 3.75 | 2.78 | 5.96 | 1047.76 | 0.0094 | 4.64 |
| (std) | (0.41) | (0.19) | (1.53) | (0.19) | (2.22) | (0.48) | (52.64) | (0.0075) | (1.93) | |
| F4-M1 | avg. | 8.89 | 70.66 | 293.33 | 9.84 | 8.04 | 15.67 | 1373.17 | 0.0274 | 2.97 |
| (std) | (0.29) | (0.57) | (0.58) | (0.68) | (0.63) | (0.93) | (94.33) | (0.0022) | (0.43) | |
| F4-M1-S | avg. | 9.11 | 70.61 | 293.33 | 9.80 | 7.99 | 15.24 | 1368.26 | 0.0272 | 2.96 |
| (std) | (0.10) | (1.00) | (2.08) | (0.56) | (0.76) | (0.74) | (78.02) | (0.0024) | (0.17) | |
| F4-M2 | avg. | 10.86 | 70.61 | 294.33 | 9.13 | 7.65 | 11.91 | 1274.61 | 0.0260 | 2.53 |
| (std) | (0.15) | (1.01) | (0.58) | (1.34) | (0.73) | (1.84) | (187.71) | (0.0024) | (0.36) | |
| F4-M2-PVA | avg. | 11.17 | 70.56 | 292.33 | 10.61 | 8.32 | 13.51 | 1481.42 | 0.0285 | 2.99 |
| (std) | (0.51) | (0.63) | (1.53) | (0.31) | (0.38) | (1.13) | (43.17) | (0.0012) | (0.26) | |
| F5-M1 | avg. | 8.77 | 70.58 | 294.00 | 6.46 | 5.12 | 10.45 | 902.39 | 0.0174 | 3.86 |
| (std) | (0.12) | (0.89) | (1.00) | (0.82) | (0.88) | (1.15) | (114.31) | (0.0030) | (0.38) | |
| F6-M1 | avg. | 9.01 | 69.70 | 295.00 | 10.78 | 8.25 | 17.15 | 859.64 | 0.0280 | 5.23 |
| (std) | (0.34) | (0.65) | (1.73) | (0.60) | (1.43) | (0.78) | (48.21) | (0.0050) | (1.33) | |
| F6-M1-S | avg. | 8.83 | 70.58 | 295.33 | 11.56 | 7.63 | 18.58 | 921.68 | 0.0258 | 6.07 |
| (std) | (0.44) | (1.05) | (0.58) | (0.77) | (0.60) | (1.65) | (61.05) | (0.0021) | (0.76) | |
| F6-M2 | avg. | 9.51 | 70.29 | 293.67 | 9.50 | 10.39 | 14.22 | 757.92 | 0.0354 | 2.84 |
| (std) | (0.17) | (0.54) | (3.51) | (0.35) | (0.41) | (0.51) | (27.62) | (0.0012) | (0.36) | |
| F6-M2-S | avg. | 9.67 | 70.58 | 295.00 | 10.06 | 10.00 | 14.73 | 802.07 | 0.0339 | 4.15 |
| (std) | (0.10) | (0.76) | (1.00) | (0.40) | (0.25) | (0.41) | (32.27) | (0.0008) | (0.44) | |
| F6-M2-PVA | avg. | 10.99 | 70.46 | 294.67 | 8.87 | 9.67 | 11.46 | 707.14 | 0.0328 | 4.11 |
| (std) | (0.42) | (0.56) | (1.53) | (0.62) | (0.69) | (0.90) | (49.46) | (0.0025) | (0.19) | |
| F7-M1 | avg. | 8.55 | 70.43 | 294.00 | 11.05 | 6.86 | 18.38 | 881.37 | 0.0233 | 2.54 |
| (std) | (0.68) | (0.33) | (0.00) | (0.96) | (0.53) | (1.28) | (76.22) | (0.0018) | (0.85) | |
| F7-M1-S | avg. | 8.54 | 70.53 | 295.33 | 11.76 | 6.26 | 19.54 | 938.03 | 0.0212 | 3.77 |
| (std) | (0.54) | (0.63) | (0.58) | (1.33) | (0.48) | (1.99) | (105.96) | (0.0016) | (1.20) | |
| F7-M2 | avg. | 10.62 | 69.96 | 293.00 | 6.91 | 5.63 | 9.31 | 550.79 | 0.0192 | 3.83 |
| (std) | (0.20) | (0.44) | (1.00) | (1.62) | (2.17) | (2.28) | (128.93) | (0.0074) | (0.48) | |
| F7-M2-PVA | avg. | 10.32 | 70.13 | 294.00 | 10.32 | 5.79 | 14.38 | 823.55 | 0.0197 | 3.30 |
| (std) | (0.65) | (1.23) | (1.00) | (1.73) | (0.77) | (3.15) | (138.05) | (0.0027) | (0.42) | |
Table 8.
Relevant mechanical parameters for TRC composites under uniaxial tension: average values (avg.) and standard deviations (std).
Table 8.
Relevant mechanical parameters for TRC composites under uniaxial tension: average values (avg.) and standard deviations (std).
| σf,max (MPa) | σTRC,f,max (MPa) | EFTRC (-) | EFTRC,f (-) | UT,I-II (J/m3) | ε2 (-) | σI-II (MPa) | ||
|---|---|---|---|---|---|---|---|---|
| F1-M1 | avg. | 1596.87 | 1283.82 | 0.80 | 0.64 | 0.0283 | 0.0089 | 3.13 |
| (std) | (76.62) | (36.83) | (0.02) | (0.02) | (0.0079) | (0.0015) | (0.39) | |
| F1-M1-S | avg. | 1596.87 | 1408.65 | 0.88 | 0.70 | 0.0421 | 0.0097 | 4.30 |
| (std) | (76.62) | (45.14) | (0.03) | (0.02) | (0.0114) | (0.0023) | (0.21) | |
| F1-M2 | avg. | 1596.87 | 991.96 | 0.62 | 0.50 | 0.0357 | 0.0114 | 3.13 |
| (std) | (76.62) | (49.49) | (0.03) | (0.02) | (0.0057) | (0.0014) | (0.17) | |
| F1-M2-PVA | avg. | 1596.87 | 1131.77 | 0.71 | 0.57 | 0.0345 | 0.0098 | 3.49 |
| (std) | (76.62) | (107.46) | (0.07) | (0.05) | (0.0051) | (0.0005) | (0.36) | |
| F2-M1 | avg. | 1789.50 | 1497.15 | 0.84 | 0.75 | 0.0358 | 0.0101 | 3.43 |
| (std) | (81.01) | (38.75) | (0.02) | (0.02) | (0.0139) | (0.0019) | (0.84) | |
| F2-M1-S | avg. | 1789.50 | 1698.58 | 0.95 | 0.85 | 0.0786 | 0.0116 | 6.79 |
| (std) | (81.01) | (169.29) | (0.09) | (0.08) | (0.0052) | (0.0004) | (0.31) | |
| F2-M2 | avg. | 1789.50 | 1265.55 | 0.71 | 0.63 | 0.0302 | 0.0100 | 2.96 |
| (std) | (81.01) | (313.91) | (0.18) | (0.16) | (0.0126) | (0.0035) | (0.18) | |
| F2-M2-S | avg. | 1789.50 | 1575.79 | 0.88 | 0.79 | 0.0329 | 0.0096 | 3.43 |
| (std) | (81.01) | (120.65) | (0.07) | (0.06) | (0.0047) | (0.0011) | (0.08) | |
| F2-M2-PVA | avg. | 1789.50 | 1591.94 | 0.89 | 0.80 | 0.0466 | 0.0110 | 4.24 |
| (std) | (81.01) | (23.05) | (0.01) | (0.01) | (0.0088) | (0.0018) | (0.22) | |
| F4-M1 | avg. | 1744.44 | 1373.17 | 0.79 | 0.69 | 0.0167 | 0.0054 | 3.09 |
| (std) | (93.24) | (94.33) | (0.05) | (0.05) | (0.0034) | (0.0007) | (0.25) | |
| F4-M1-S | avg. | 1744.44 | 1368.26 | 0.78 | 0.68 | 0.0124 | 0.0043 | 2.90 |
| (std) | (93.24) | (78.02) | (0.04) | (0.04) | (0.0030) | (0.0008) | (0.31) | |
| F4-M2 | avg. | 1744.44 | 1274.61 | 0.73 | 0.64 | 0.0189 | 0.0066 | 2.84 |
| (std) | (93.24) | (187.71) | (0.11) | (0.09) | (0.0053) | (0.0012) | (0.27) | |
| F4-M2-PVA | avg. | 1744.44 | 1481.42 | 0.85 | 0.74 | 0.0166 | 0.0055 | 3.00 |
| (std) | (93.24) | (43.17) | (0.02) | (0.02) | (0.0030) | (0.0005) | (0.29) | |
| F6-M1 | avg. | 1274.63 | 859.64 | 0.67 | 0.43 | 0.0666 | 0.0107 | 6.02 |
| (std) | (11.80) | (48.21) | (0.04) | (0.02) | (0.0300) | (0.0027) | (1.21) | |
| F6-M1-S | avg. | 1274.63 | 921.68 | 0.72 | 0.46 | 0.0394 | 0.0061 | 6.19 |
| (std) | (11.80) | (61.05) | (0.05) | (0.03) | (0.0231) | (0.0023) | (1.01) | |
| F6-M2 | avg. | 1274.63 | 757.92 | 0.59 | 0.38 | 0.0433 | 0.0095 | 4.53 |
| (std) | (11.80) | (27.62) | (0.02) | (0.01) | (0.0107) | (0.0017) | (0.32) | |
| F6-M2-S | avg. | 1274.63 | 802.07 | 0.63 | 0.40 | 0.0304 | 0.0068 | 4.45 |
| (std) | (11.80) | (32.27) | (0.03) | (0.02) | (0.0036) | (0.0007) | (0.06) | |
| F6-M2-PVA | avg. | 1274.63 | 707.14 | 0.55 | 0.35 | 0.0356 | 0.0082 | 4.33 |
| (std) | (11.80) | (49.46) | (0.04) | (0.02) | (0.0073) | (0.0012) | (0.25) | |
| F7-M1 | avg. | 972.32 | 881.37 | 0.91 | 0.44 | 0.0320 | 0.0073 | 4.27 |
| (std) | (15.90) | (76.22) | (0.08) | (0.04) | (0.0135) | (0.0019) | (0.92) | |
| F7-M1-S | avg. | 972.32 | 938.03 | 0.96 | 0.47 | 0.0109 | 0.0031 | 3.46 |
| (std) | (15.90) | (105.96) | (0.11) | (0.05) | (0.0035) | (0.0002) | (0.84) | |
| F7-M2 | avg. | 972.32 | 550.79 | 0.57 | 0.28 | 0.0358 | 0.0079 | 4.47 |
| (std) | (15.90) | (128.93) | (0.13) | (0.06) | (0.0100) | (0.0014) | (0.49) | |
| F7-M2-PVA | avg. | 972.32 | 823.55 | 0.85 | 0.41 | 0.0251 | 0.0057 | 4.36 |
| (std) | (15.90) | (138.05) | (0.14) | (0.07) | (0.0046) | (0.0008) | (0.31) | |
Table 9.
Average matrix failure strengths fctm.
| Approach | Matrix M1 | Matrix M2 |
|---|---|---|
| (i) from bending tests | 6.31 MPa | 3.10 MPa |
| (ii) from compressive tests | 4.59 MPa | 3.46 MPa |
| (iii) manufacturer data | n.a. | 4.47 MPa |
© 2019 by the authors. Licensee MDPI, Basel, Switzerland. This article is an open access article distributed under the terms and conditions of the Creative Commons Attribution (CC BY) license (http://creativecommons.org/licenses/by/4.0/).
Share and Cite
MDPI and ACS Style
Rampini, M.C.; Zani, G.; Colombo, M.; di Prisco, M. Mechanical Behaviour of TRC Composites: Experimental and Analytical Approaches. Appl. Sci. 2019, 9, 1492. https://0-doi-org.brum.beds.ac.uk/10.3390/app9071492
AMA Style
Rampini MC, Zani G, Colombo M, di Prisco M. Mechanical Behaviour of TRC Composites: Experimental and Analytical Approaches. Applied Sciences. 2019; 9(7):1492. https://0-doi-org.brum.beds.ac.uk/10.3390/app9071492
Chicago/Turabian StyleRampini, Marco Carlo, Giulio Zani, Matteo Colombo, and Marco di Prisco. 2019. "Mechanical Behaviour of TRC Composites: Experimental and Analytical Approaches" Applied Sciences 9, no. 7: 1492. https://0-doi-org.brum.beds.ac.uk/10.3390/app9071492
Note that from the first issue of 2016, this journal uses article numbers instead of page numbers. See further details here.