Characterization of Emission Factors Concerning Gasoline, LPG, and Diesel Vehicles via Transient Chassis-Dynamometer Tests

Abstract
:
1. Introduction
2. Methods
2.1. Vehicle-Selection Criteria and Test Cycle
2.2. Gaseous-Component Analysis
3. Results and Discussion
3.1. Characteristics of Gaseous Emissions from Vehicles Powered by Different Fuel Types
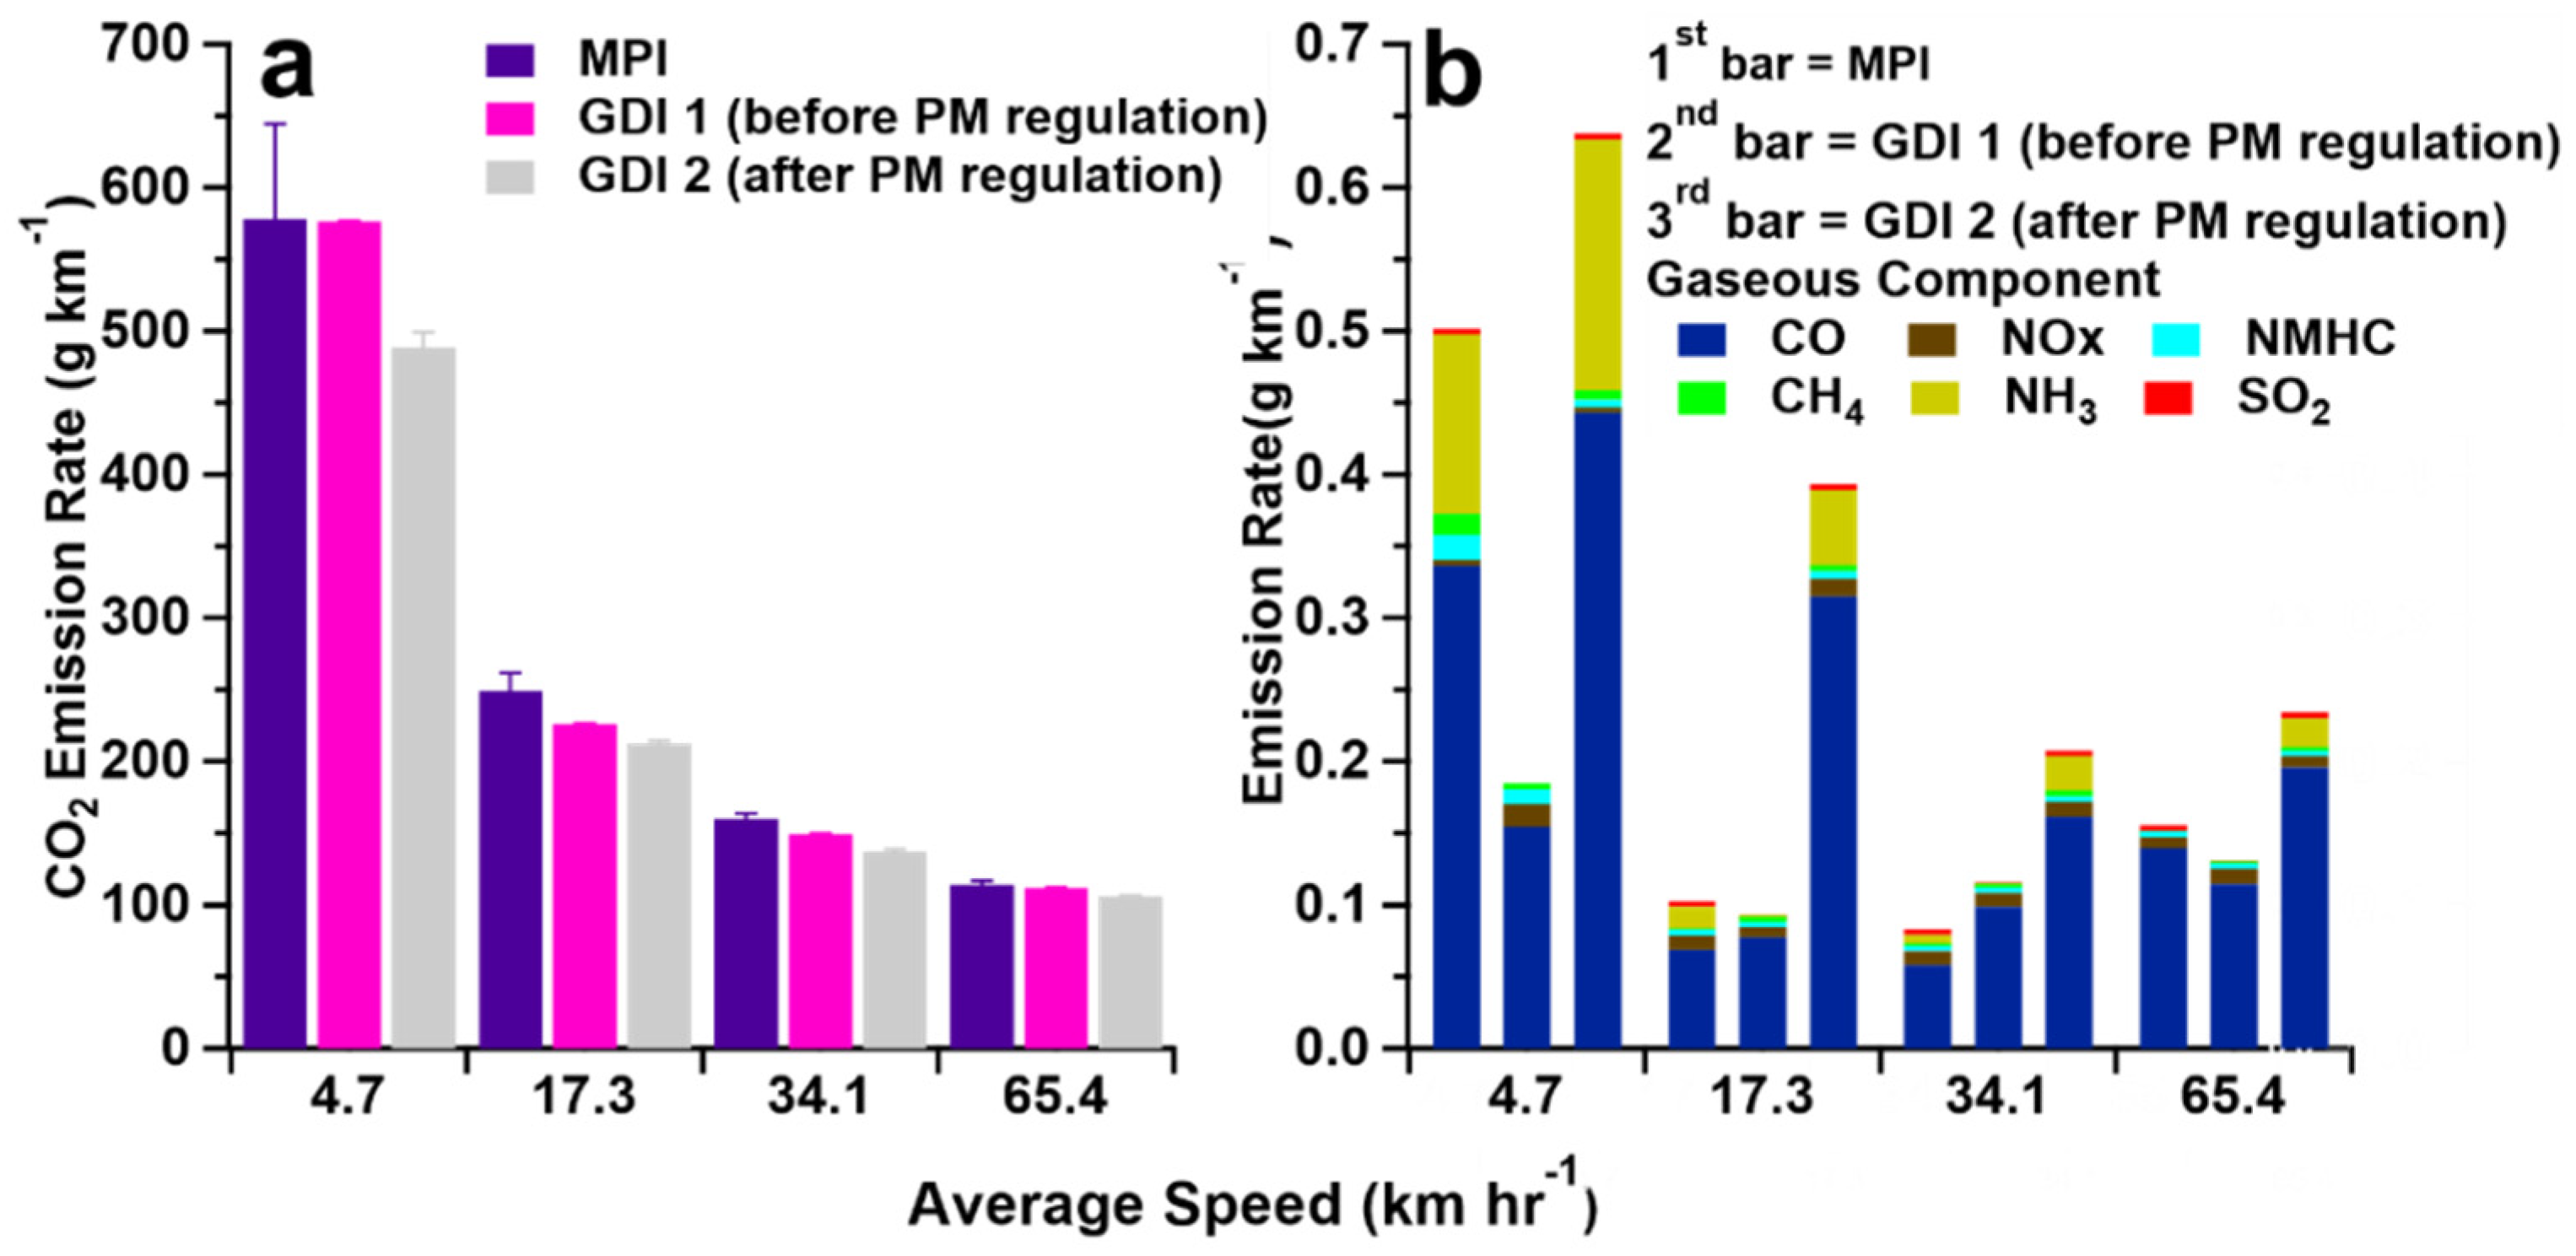
3.2. Emissions Caused by Use of Different Gasoline-Combustion Technologies
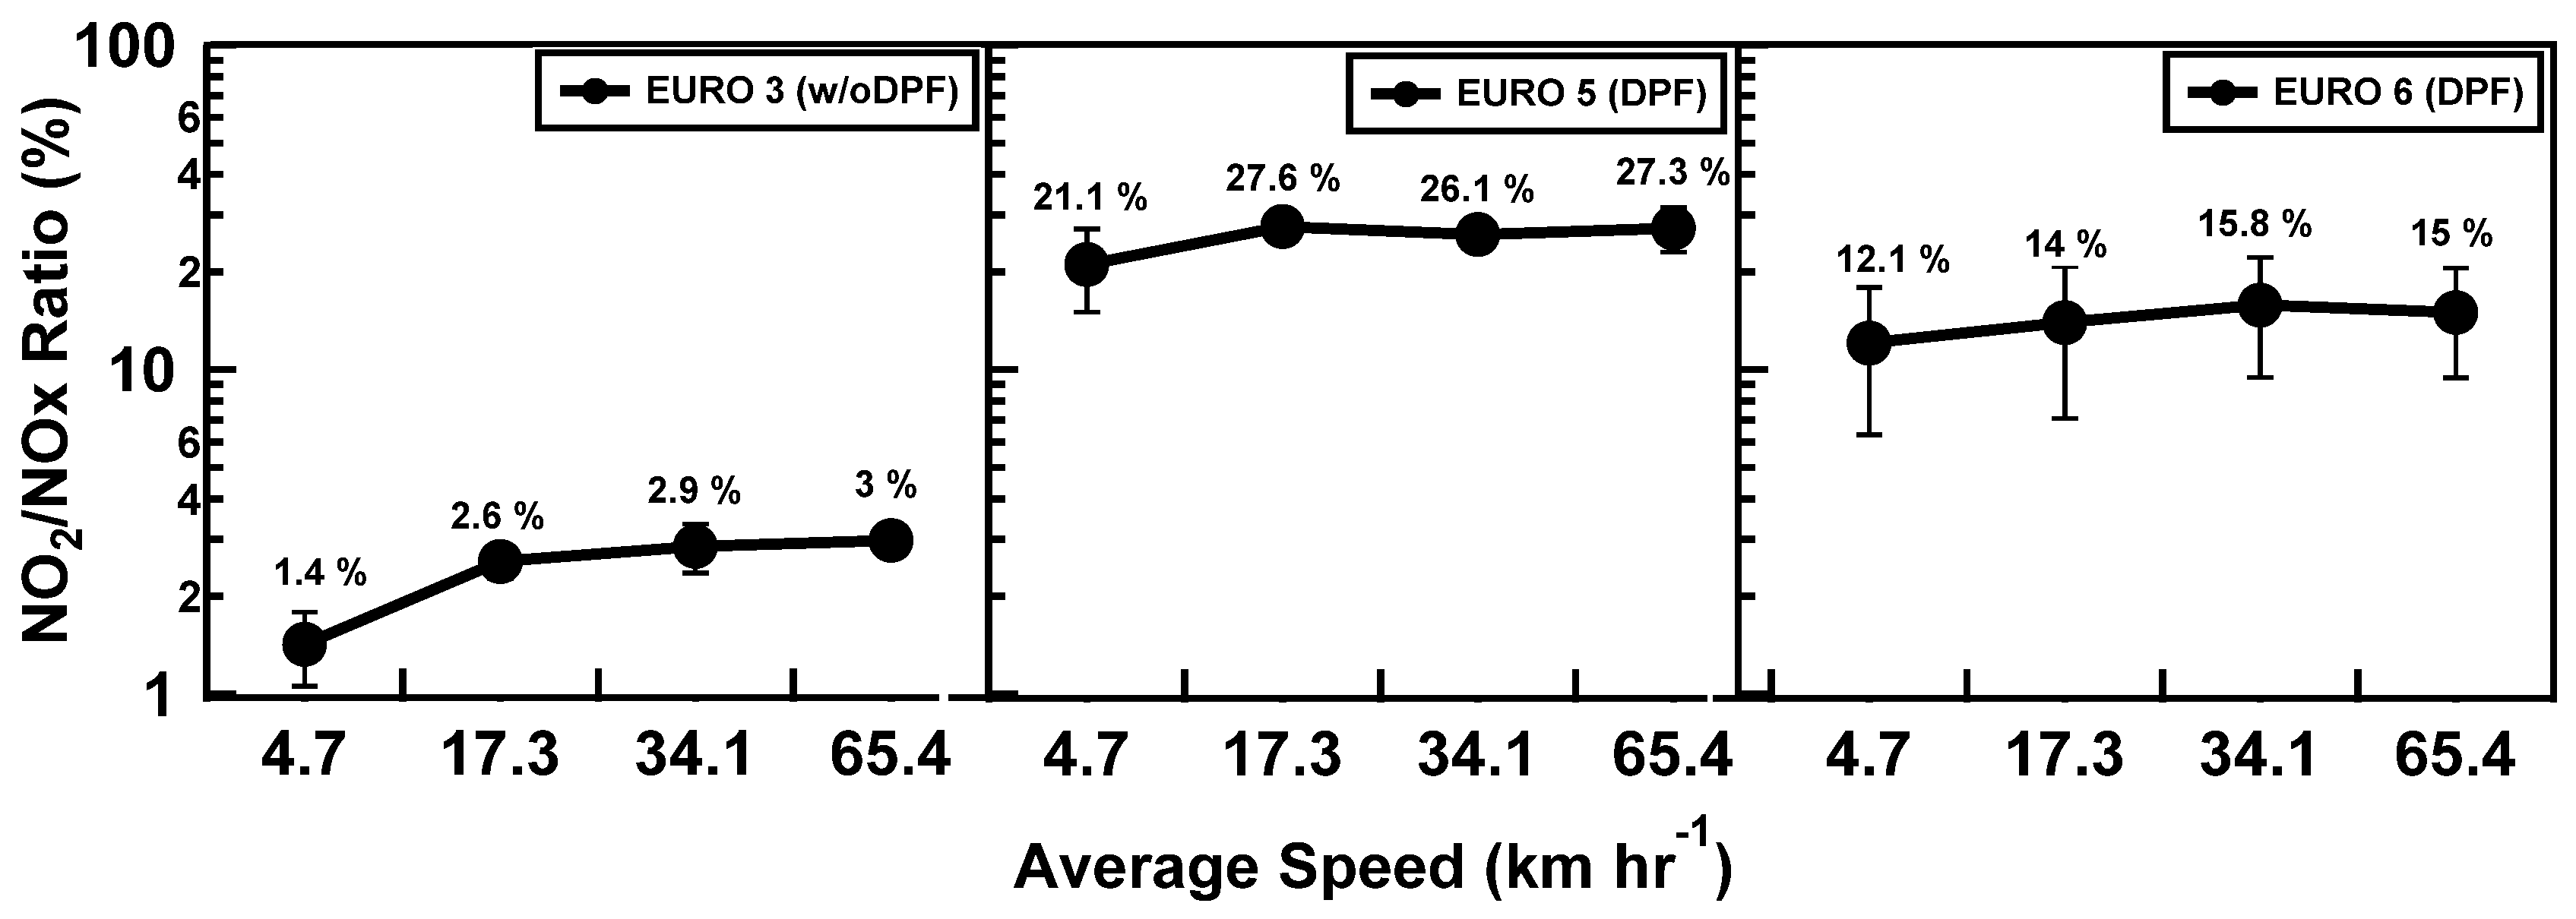
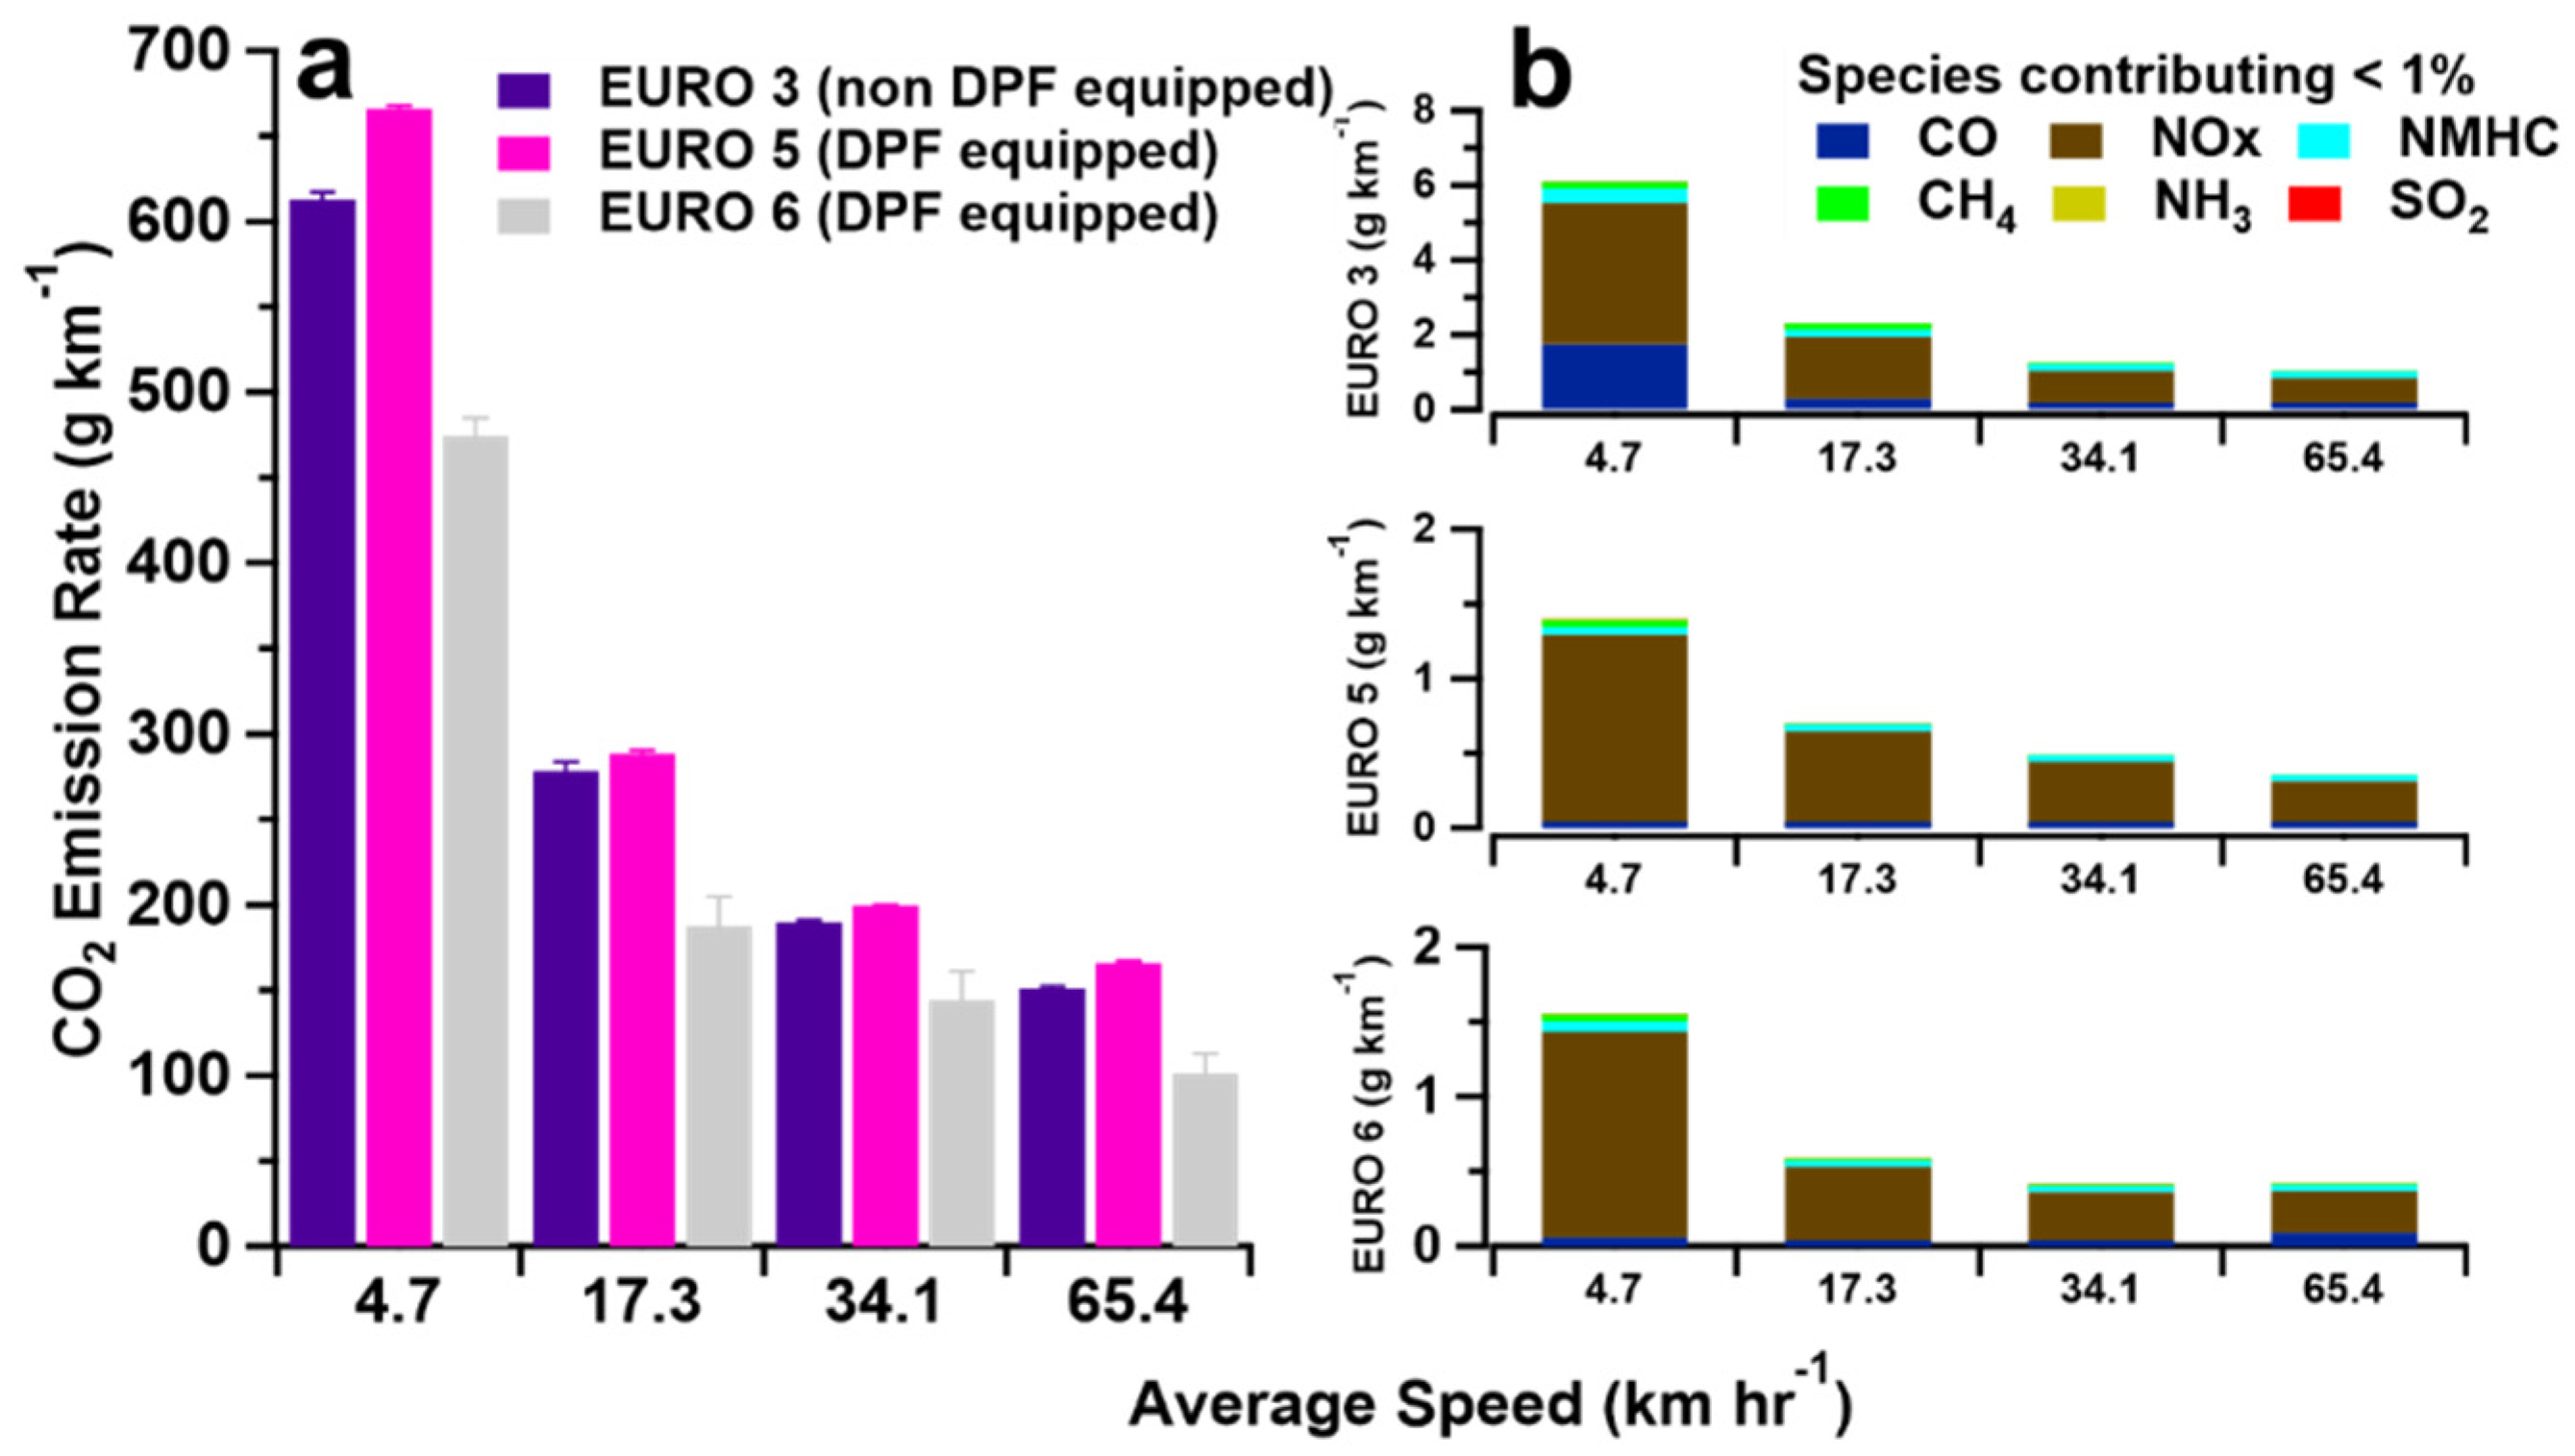
3.3. Emissions from Diesel-Powered Vehicles under Different Emission Regulations
4. Conclusions
- (1)
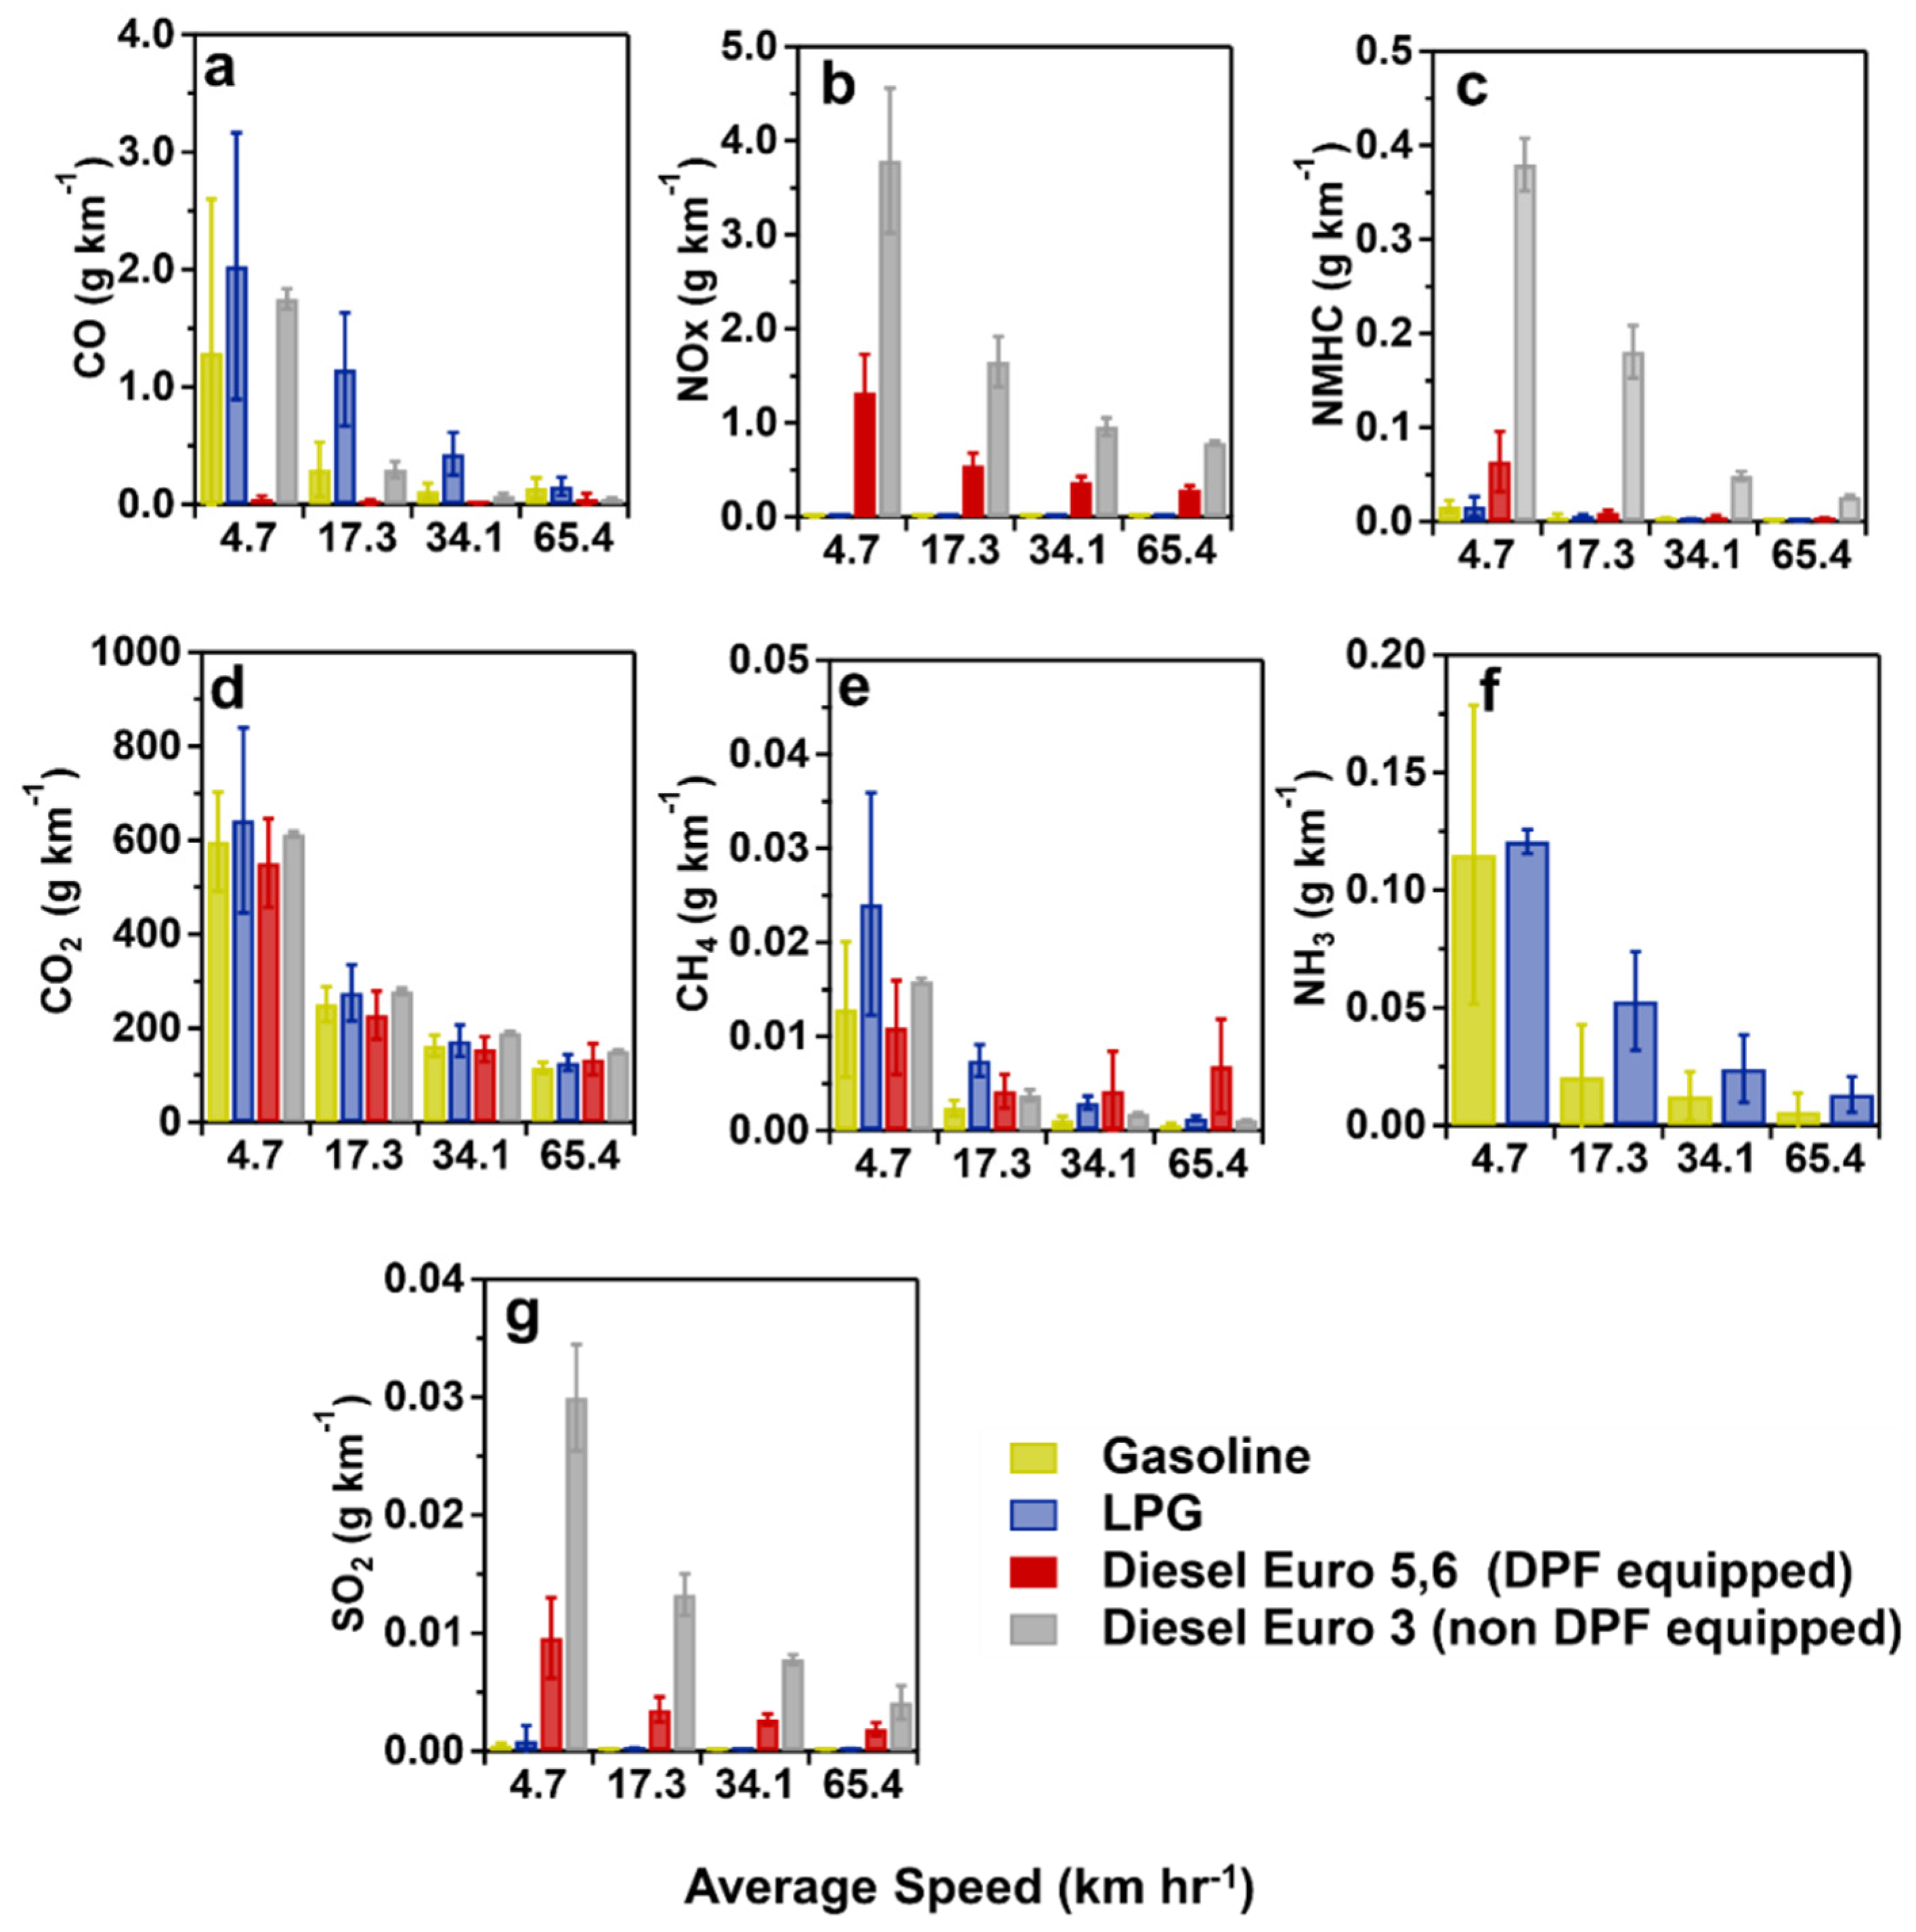
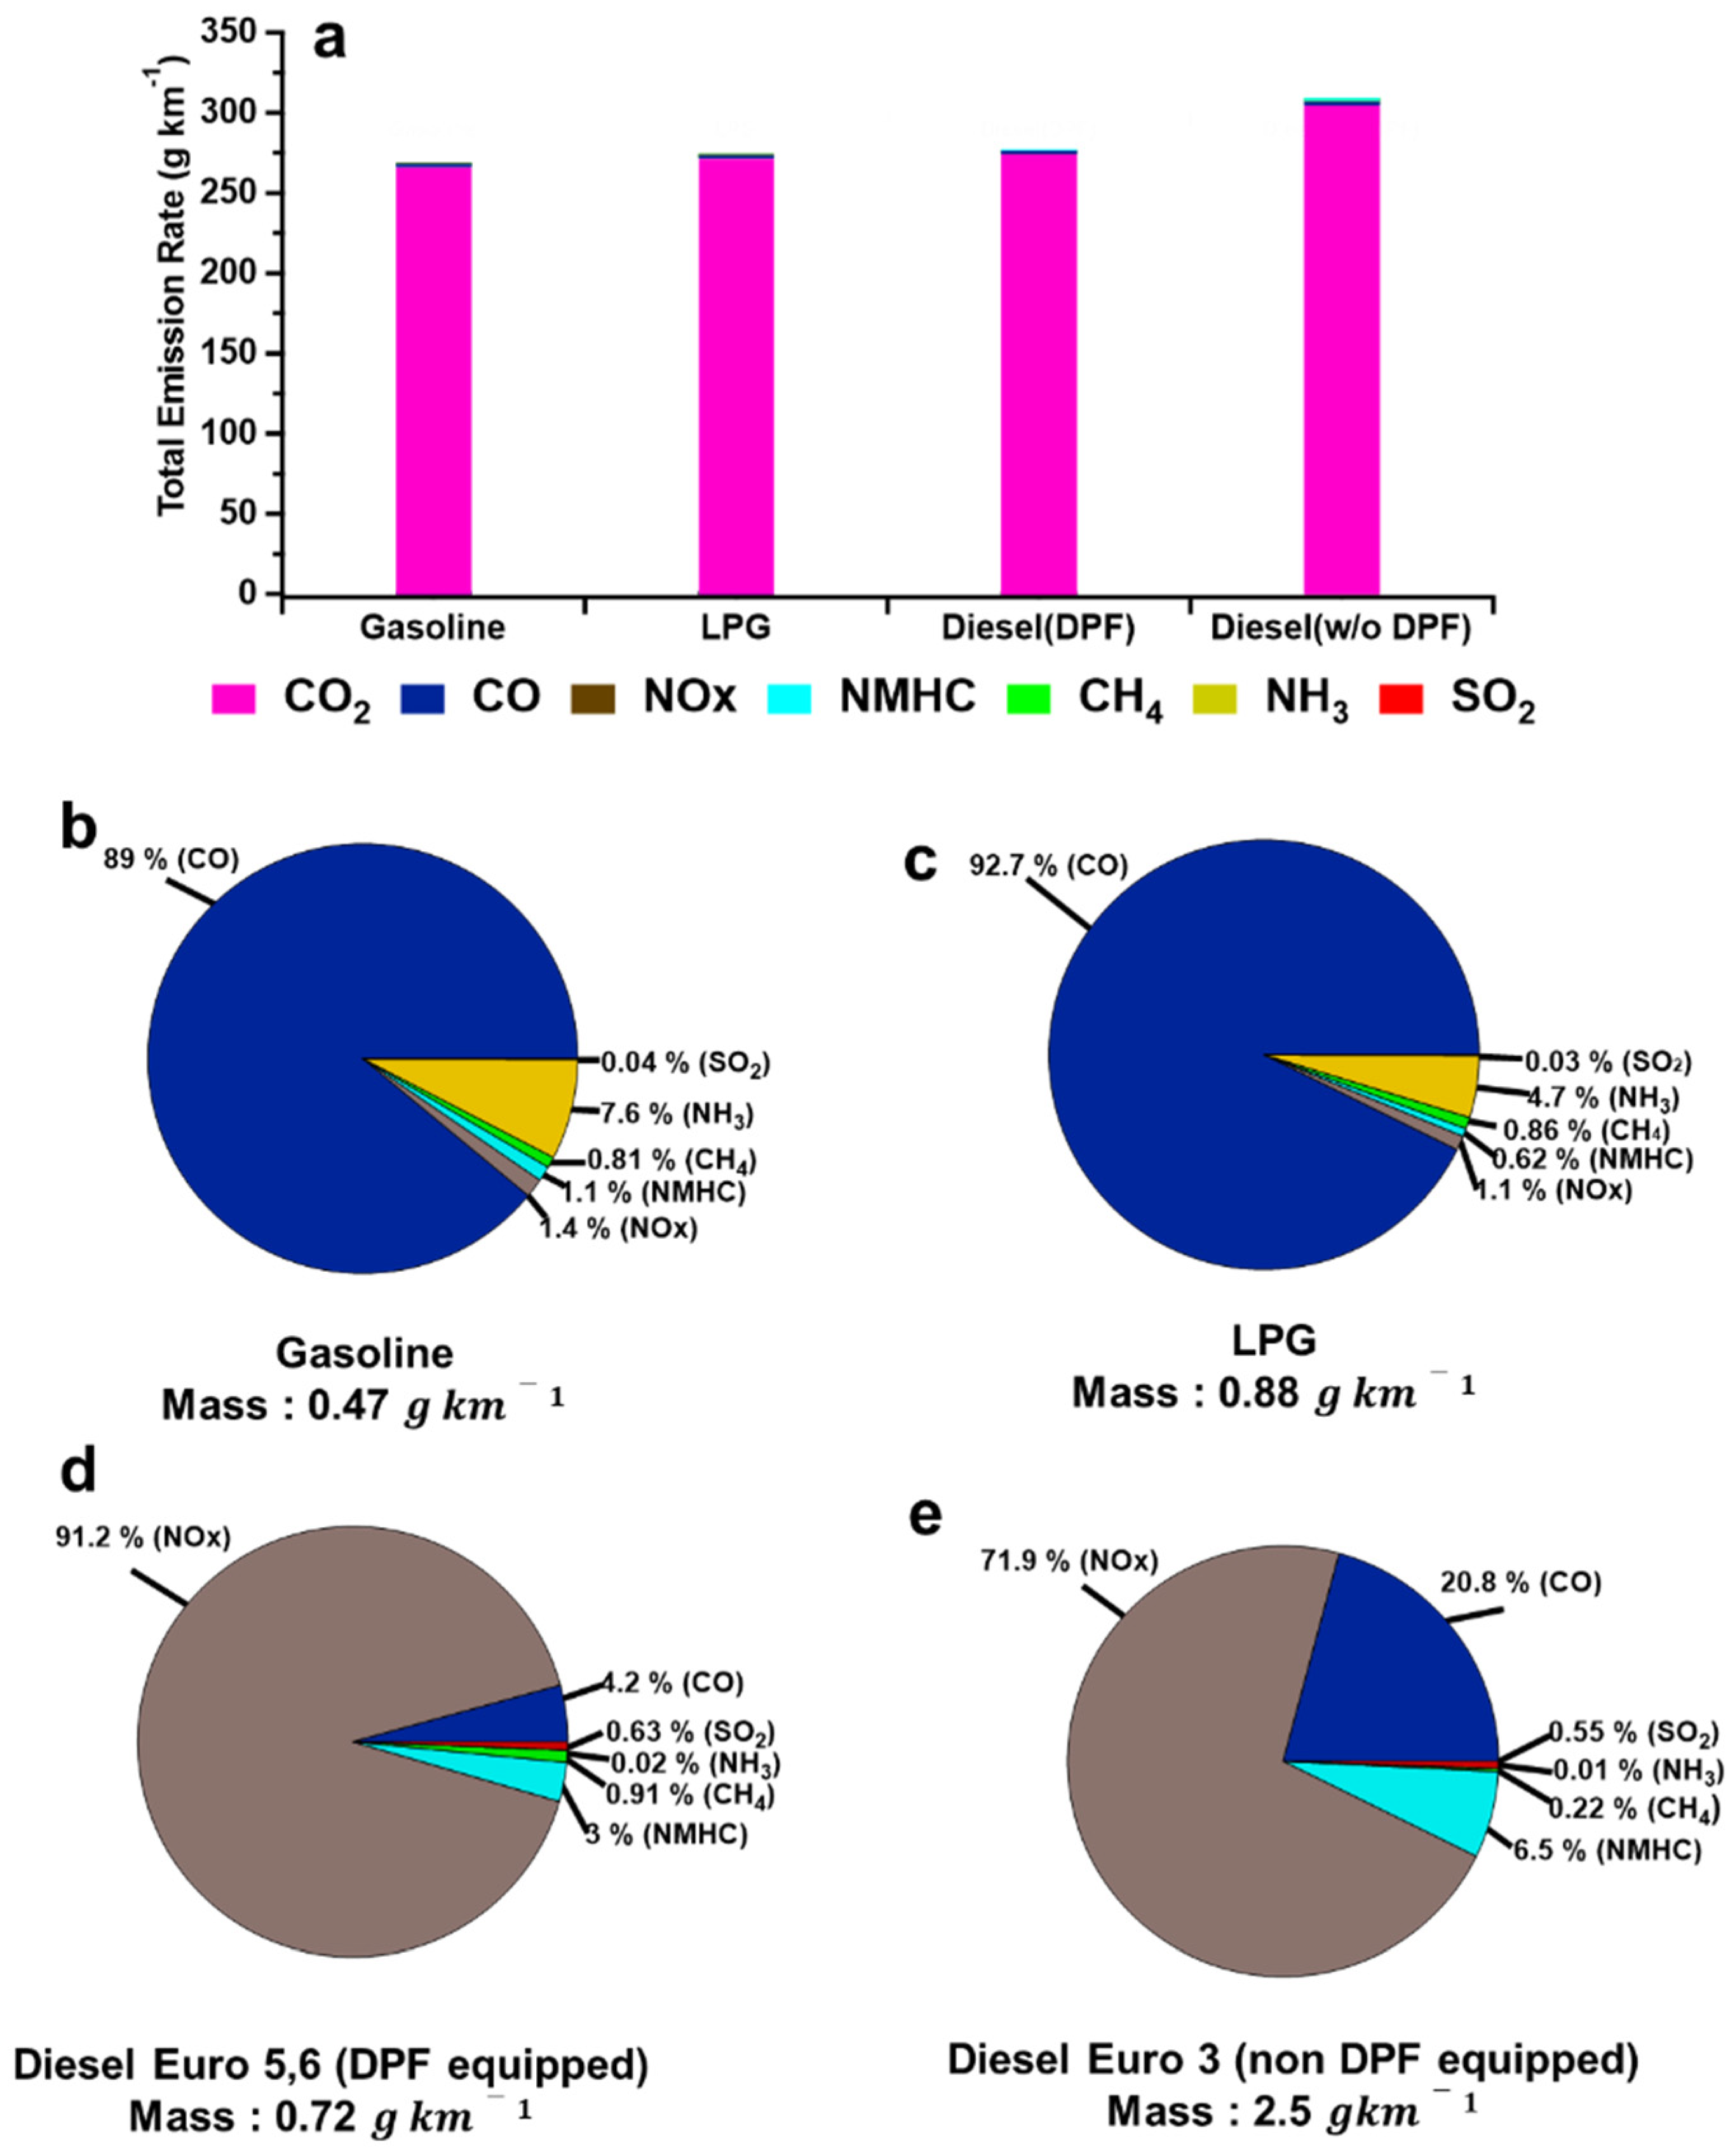
- Emissions of all gaseous pollutants demonstrated an initial decrease with an increase in average speed. For all vehicle types, CO2 accounted for more than 99% of aggregate emissions, whereas the remaining 1% was comprised of various gas species, and its composition varied depending on the type of fuel used.
- (2)
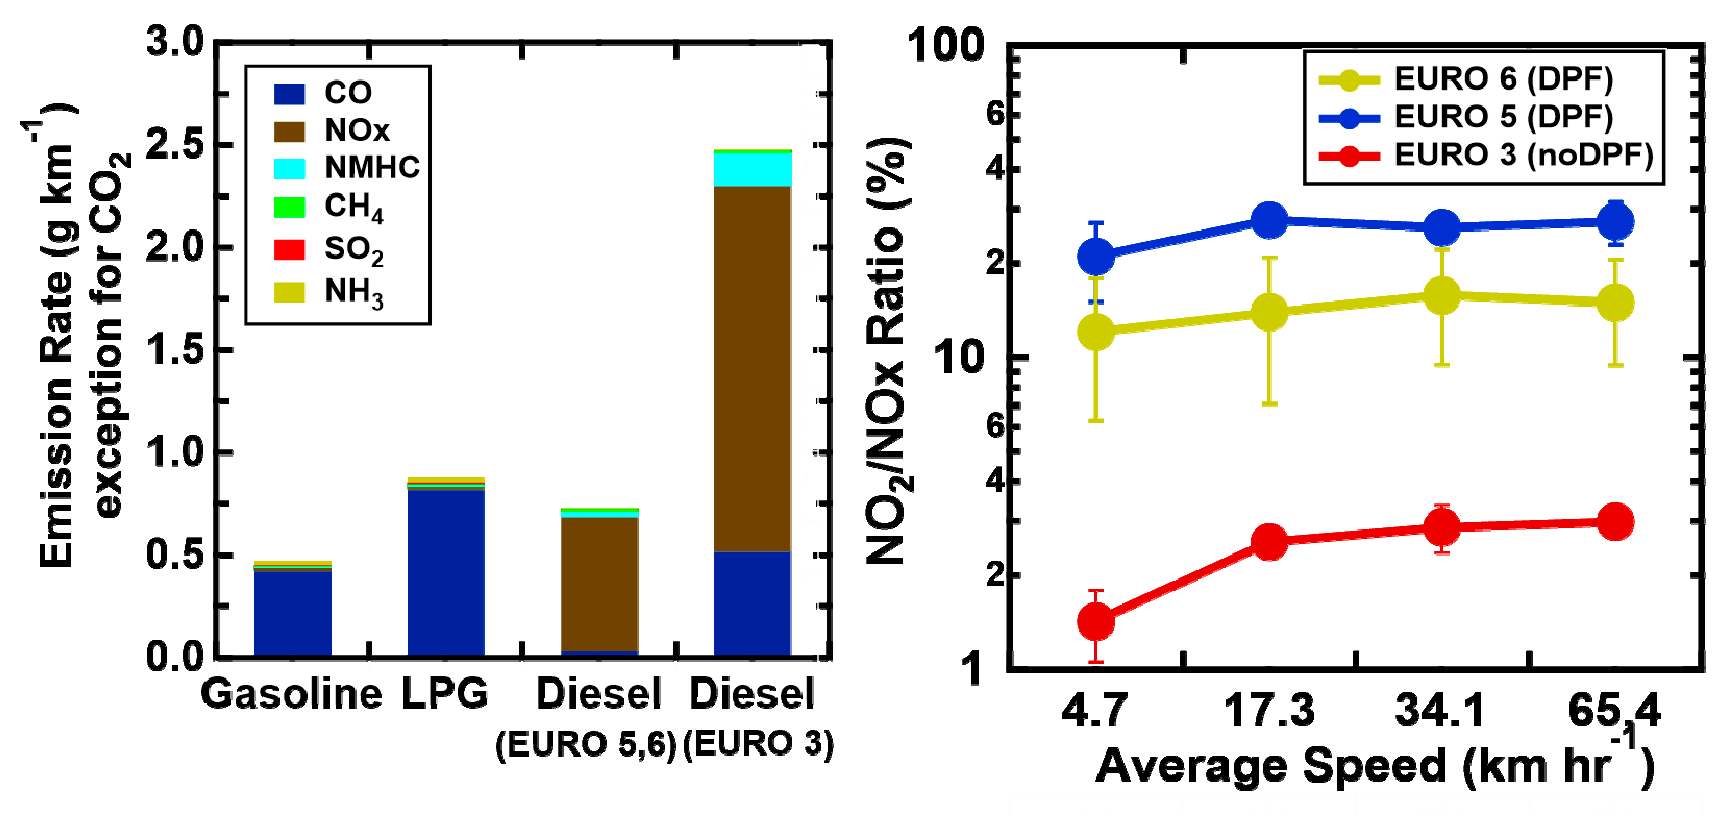
- CO and NH3 were observed to be predominant non-CO2 species of pollutants emitted from gasoline- and LPG-powered vehicles, whereas emissions from diesel-powered vehicles were dominated by NOx, CO, and NMHC. Additionally, SO2 emissions from diesel-powered vehicles were observed to exceed those from their gasoline- and LPG-powered counterparts by up to 28 times.
- (3)
- Strengthening emission-regulation standards for diesel vehicles has somewhat reduced the effect of NOx emissions in recent years. However, the value of the NO2/NOx ratio has witnessed a significant increase, as depicted in Figure 5, owing to advancement in combustion technology and operating conditions of after-treatment devices.
- (4)
- Gaseous pollutants, such as NOx, NMHC, NH3, and SO2, emitted by vehicles employing different types of fuel constitute a major source of primary pollution, and these tend to ultimately react with other atmospheric species to produce secondary gases and PM. Inhibition of potential atmospheric pollution, therefore, requires the development of stringent regulations and establishment of emission-reduction policies.
Author Contributions
Funding
Acknowledgments
Conflicts of Interest
References
- Ministry of Environment (MOE). Enforcement Decree of the Clean Air Conservation; MOE: Yeongi-gun, Korea, 2017.
- O’Driscoll, R.; Stettler, M.E.; Molden, N.; Oxley, T.; ApSimon, H.M. Real world CO2 and NOx emissions from 149 Euro 5 and 6 diesel, gasoline, and hybrid passenger cars. Sci. Total Environ. 2018, 621, 282–290. [Google Scholar]
- Carslaw, D.C.; Rhys-Tyler, G. New insights from comprehensive on-road measurements of NOx, NO2 and NH3 from vehicle emission remote sensing in London, UK. Atmos. Environ. 2013, 81, 339–347. [Google Scholar] [CrossRef]
- Carslaw, D.C.; Farren, N.J.; Vaughan, A.R.; Drysdale, W.S.; Young, S.; Lee, J.D. The diminishing importance of nitrogen dioxide emissions from road vehicle exhaust. Atmos. Environ. 2019, 1, 100002. [Google Scholar] [CrossRef]
- Huang, Y.; Organ, B.; Zhou, J.L.; Surawski, N.C.; Hong, G.; Chan, E.F.; Yam, Y.S. Emission measurement of diesel vehicles in Hong Kong through on-road remote sensing: Performance review and identification of high-emitters. Environ. Pollut. 2018, 237, 133–142. [Google Scholar] [CrossRef] [PubMed]
- Huang, Y.; Organ, B.; Zhou, J.L.; Surawski, N.C.; Hong, G.; Chan, E.F.; Yam, Y.S. Remote sensing of on-road vehicle emissions: Mechanism, applications and a case study from Hong Kong. Atmos. Environ. 2018, 182, 58–74. [Google Scholar] [CrossRef]
- Tkacik, D.S.; Lambe, A.T.; Jathar, S.; Li, X.; Presto, A.A.; Zhao, Y.; Blake, D.; Meinardi, S.; Jayne, J.T.; Croteau, P.L. Secondary organic aerosol formation from in-use motor vehicle emissions using a potential aerosol mass reactor. Environ. Sci. Technol. 2014, 48, 11235–11242. [Google Scholar] [CrossRef] [PubMed]
- Link, M.F.; Kim, J.; Park, G.; Lee, T.; Park, T.; Babar, Z.B.; Sung, K.; Kim, P.; Kang, S.; Kim, J.S. Elevated production of NH4NO3 from the photochemical processing of vehicle exhaust: Implications for air quality in the Seoul Metropolitan Region. Atmos. Environ. 2017, 156, 95–101. [Google Scholar] [CrossRef]
- Gordon, T.; Presto, A.; May, A.; Nguyen, N.; Lipsky, E.; Donahue, N.; Gutierrez, A.; Zhang, M.; Maddox, C.; Rieger, P. Secondary organic aerosol formation exceeds primary particulate matter emissions for light-duty gasoline vehicles. Atmos. Chem. Phys. 2014, 14, 4661–4678. [Google Scholar] [CrossRef] [Green Version]
- Lee, J.T.; Son, J.; Kim, J.; Choi, Y.; Yoo, H.-M.; Kim, K.J.; Kim, J.S.; Park, S.W.; Park, G.; Park, T. Comparison of Chemical Composition of Particulate Matter Emitted from a Gasoline Direct Injected (GDI) Vehicle and a Port Fuel Injected (PFI) Vehicle using High Resolution Time of Flight Aerosol Mass Spectrometer (HR-ToF-AMS). Asian. J. Atmos. Environ. 2016, 10, 51–56. [Google Scholar] [CrossRef]
- Wei, L.; Yao, C.; Wang, Q.; Pan, W.; Han, G. Combustion and emission characteristics of a turbocharged diesel engine using high premixed ratio of methanol and diesel fuel. Fuel 2015, 140, 156–163. [Google Scholar] [CrossRef]
- Hasan, A.O.; Abu-Jrai, A.; Ala’a, H.; Tsolakis, A.; Xu, H. HC, CO and NOx emissions reduction efficiency of a prototype catalyst in gasoline bi-mode SI/HCCI engine. J. Environ. Chem. Eng. 2016, 4, 2410–2416. [Google Scholar] [CrossRef]
- Meng, Z.; Lin, W.; Zhang, R.; Han, Z.; Jia, X. Summertime ambient ammonia and its effects on ammonium aerosol in urban Beijing, China. Sci. Total Environ. 2017, 579, 1521–1530. [Google Scholar] [CrossRef] [PubMed]
- Tang, W.; Cai, Y.; Wang, J. Experimental studies on the diesel engine urea-SCR system using a double NOx sensor system. Environ. Eng. Res. 2015, 20, 397–402. [Google Scholar] [CrossRef]
- Tan, P.-Q.; Hu, Z.-Y.; Lou, D.-M. Regulated and unregulated emissions from a light-duty diesel engine with different sulfur content fuels. Fuel 2009, 88, 1086–1091. [Google Scholar] [CrossRef]
- Wang, T.; Quiros, D.C.; Thiruvengadam, A.; Pradhan, S.; Hu, S.; Huai, T.; Lee, E.S.; Zhu, Y. Total particle number emissions from modern diesel, natural gas, and hybrid heavy-duty vehicles during on-road operation. Environ. Sci. Technol. 2017, 51, 6990–6998. [Google Scholar] [CrossRef] [PubMed]
- Maricq, M.M.; Szente, J.J.; Jahr, K. The impact of ethanol fuel blends on PM emissions from a light-duty GDI vehicle. Aerosol Sci. Technol. 2012, 46, 576–583. [Google Scholar] [CrossRef]
- Borsari, V.; de Assunção, J.V. Ammonia emissions from a light-duty vehicle. Transp. Res. D Transp. Environ. 2017, 51, 53–61. [Google Scholar] [CrossRef]
- Reşitoğlu, İ.A.; Altinişik, K.; Keskin, A. The pollutant emissions from diesel-engine vehicles and exhaust aftertreatment systems. Clean Technol. Environ. Policy 2015, 17, 15–27. [Google Scholar] [CrossRef]
- Carslaw, D.C.; Murrells, T.P.; Andersson, J.; Keenan, M. Have vehicle emissions of primary NO2 peaked? Faraday Discuss. 2016, 189, 439–454. [Google Scholar] [CrossRef]
- He, C.; Li, J.; Ma, Z.; Tan, J.; Zhao, L. High NO2/NOx emissions downstream of the catalytic diesel particulate filter: An influencing factor study. J. Environ. Sci. 2015, 35, 55–61. [Google Scholar] [CrossRef]
- Ban-Weiss, G.A.; McLaughlin, J.P.; Harley, R.A.; Kean, A.J.; Grosjean, E.; Grosjean, D. Carbonyl and nitrogen dioxide emissions from gasoline-and diesel-powered motor vehicles. Environ. Sci. Technol. 2008, 42, 3944–3950. [Google Scholar] [CrossRef] [PubMed]
- Shin, H.J.; Park, J.H.; Park, J.S.; Song, I.H.; Park, S.M.; Roh, S.A.; Son, J.S.; Hong, Y.D. The long term trends of tropospheric ozone in major regions in Korea. Asian. J. Atmos. Environ. 2017, 11, 235–253. [Google Scholar] [CrossRef]


| Regulation | Date | CO | NOx | HC a | HC+NOx | PM | PN | Cycle |
|---|---|---|---|---|---|---|---|---|
| Gasoline & LPG b | ||||||||
| ULEV | January 2013 | 1.31 | 0.044 | 0.034 | 0.004 c | FTP-75 d | ||
| ULEV | January 2016 | 1.31 | 0.078 | 0.004 | FTP-75 US06 e, SC03 f | |||
| Diesel g | ||||||||
| EURO 3 | July 2002 | 1.1 | 0.95 | 0.22 | 0.11 | FTP-75 | ||
| EURO 4 | January 2006 | 0.74 | 0.39 | 0.46 | 0.06 | NEDC h | ||
| EURO 5 | September 2009 | 0.74 | 0.28 | 0.35 | 0.005 | NEDC | ||
| EURO 6 | January 2014 | 0.5 | 0.08 | 0.17 | 0.0045 | 6 × 10¹¹ km−1 | NEDC | |
| No. | ID a | Type | Fuel | Year | Displacement (cc) | Engine | Mileage (km) | After-Treatment Device | Emission Standard |
|---|---|---|---|---|---|---|---|---|---|
| 1 | G1 | Passenger | Gasoline | 2015 | 1999 | MPI b | 44,238 | TWC c | ULEV |
| 2 | G2 | Passenger | Gasoline | 2015 | 2999 | GDI d | 69,057 | TWC | ULEV |
| 3 | G3 | Passenger | Gasoline | 2016 | 1591 | GDI | 25,944 | TWC | ULEV |
| 4 | G4 | Passenger | Gasoline | 2015 | 1591 | GDI | 24,570 | TWC | ULEV |
| 5 | L1 | Passenger | LPG | 2014 | 2999 | LPI e | 87,606 | TWC | ULEV |
| 6 | L2 | Passenger | LPG | 2015 | 1519 | LPI | 142,492 | TWC | ULEV |
| 7 | L3 | Passenger | LPG | 2015 | 2999 | LPI | 70,324 | TWC | ULEV |
| 8 | D1 | Truck | Diesel | 2016 | 2497 | DI f | 11,239 | DOC g, DPF h | EURO 5 |
| 9 | D2 | Passenger | Diesel | 2016 | 2199 | DI | 15,606 | DOC, DPF, LNT i | EURO 6 |
| 10 | D3 | Passenger | Diesel | 2016 | 1582 | DI | 37,018 | DOC, DPF, LNT | EURO 6 |
| 11 | D4 | SUV | Diesel | 2002 | 1991 | DI | 183,472 | DOC | EURO 3 |
| Cycle | Total Duration (s) | Distance (km) | Average Speed (km h−1) | Maximum Speed (km h−1) |
|---|---|---|---|---|
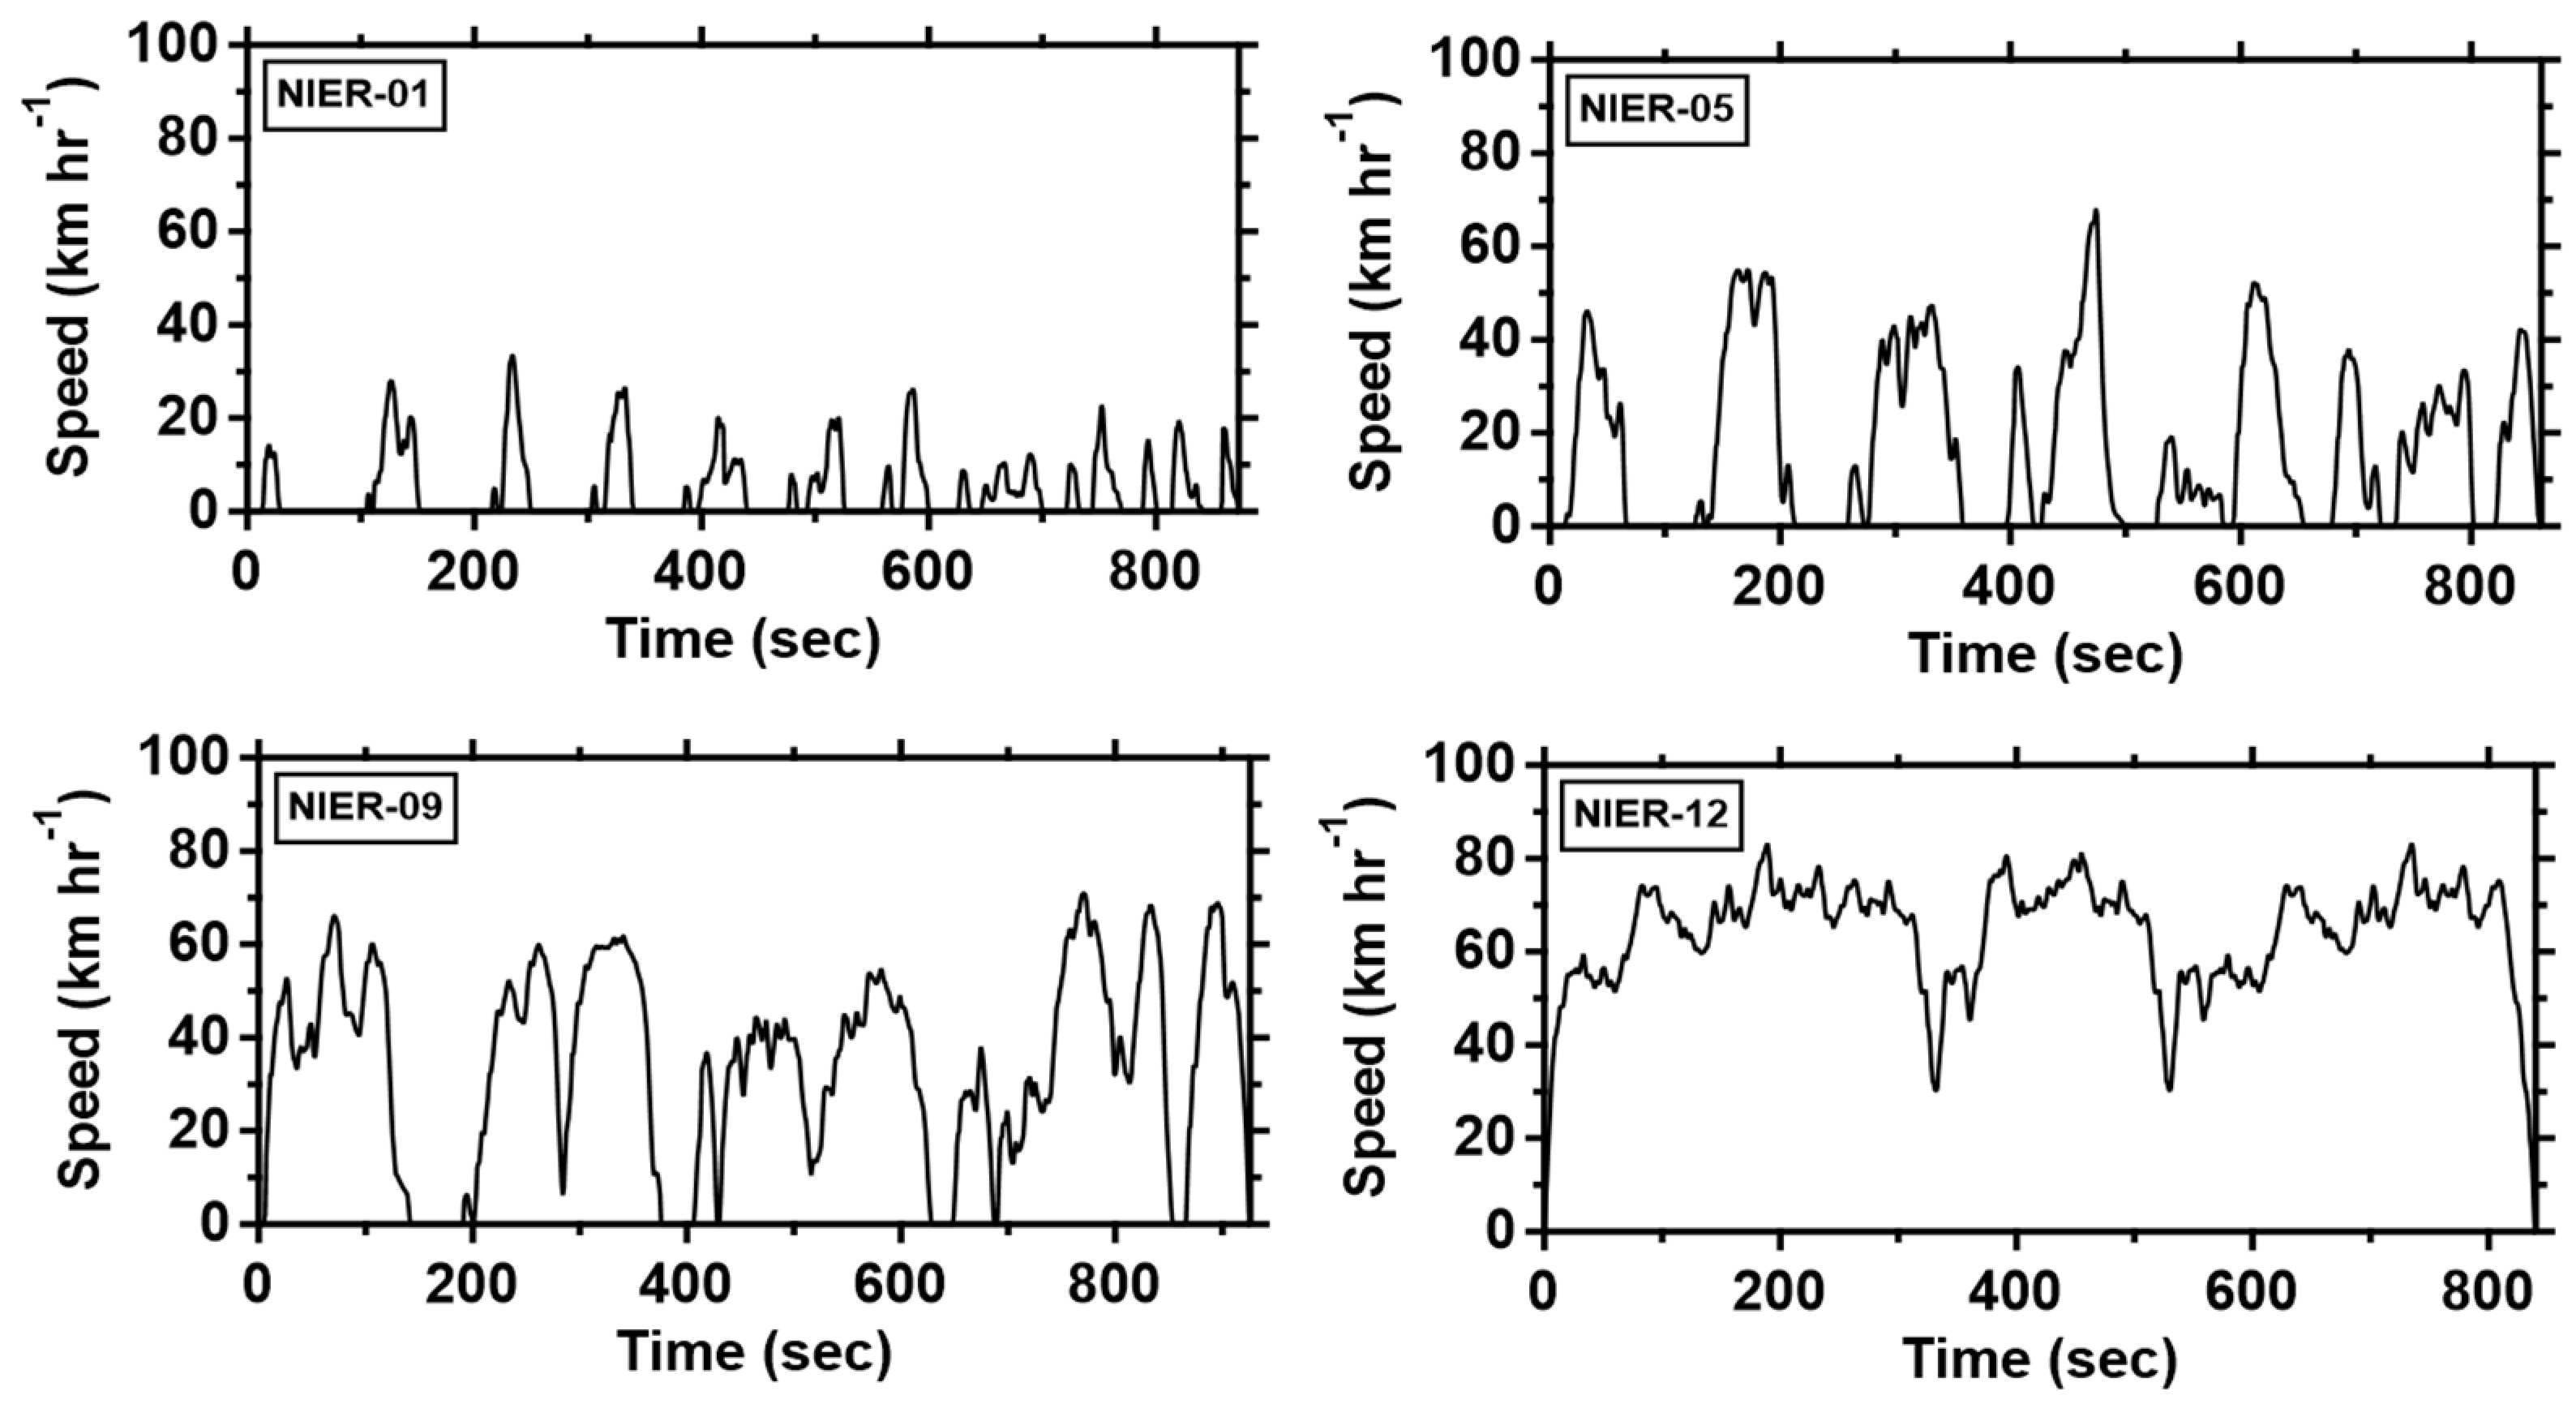
| NIER a-01 | 873 | 1.1 | 4.7 | 33.4 |
| NIER-05 | 864 | 4.2 | 17.3 | 68.1 |
| NIER-09 | 926 | 8.8 | 34.1 | 70.9 |
| NIER-12 | 840 | 15.3 | 65.4 | 83.3 |
© 2019 by the authors. Licensee MDPI, Basel, Switzerland. This article is an open access article distributed under the terms and conditions of the Creative Commons Attribution (CC BY) license (http://creativecommons.org/licenses/by/4.0/).
Share and Cite
Park, G.; Mun, S.; Hong, H.; Chung, T.; Jung, S.; Kim, S.; Seo, S.; Kim, J.; Lee, J.; Kim, K.; et al. Characterization of Emission Factors Concerning Gasoline, LPG, and Diesel Vehicles via Transient Chassis-Dynamometer Tests. Appl. Sci. 2019, 9, 1573. https://0-doi-org.brum.beds.ac.uk/10.3390/app9081573
Park G, Mun S, Hong H, Chung T, Jung S, Kim S, Seo S, Kim J, Lee J, Kim K, et al. Characterization of Emission Factors Concerning Gasoline, LPG, and Diesel Vehicles via Transient Chassis-Dynamometer Tests. Applied Sciences. 2019; 9(8):1573. https://0-doi-org.brum.beds.ac.uk/10.3390/app9081573
Chicago/Turabian StylePark, Gyutae, Sunhee Mun, Heekyoung Hong, Taekho Chung, Sungwoon Jung, Sunmoon Kim, Seokjun Seo, Jounghwa Kim, Jongtae Lee, Kyunghoon Kim, and et al. 2019. "Characterization of Emission Factors Concerning Gasoline, LPG, and Diesel Vehicles via Transient Chassis-Dynamometer Tests" Applied Sciences 9, no. 8: 1573. https://0-doi-org.brum.beds.ac.uk/10.3390/app9081573