Nondestructive Ultrasonic Inspection of Composite Materials: A Comparative Advantage of Phased Array Ultrasonic


1
Department of Manufacturing Engineering, Georgia Southern University, Statesboro, GA 30460, USA
2
Manufacturing Demonstration Facility (MDF), Oak Ridge National Laboratory (ORNL), Knoxville, TN 37932, USA
3
Department of Mechanical, Aerospace and Biomedical Engineering, University of Tennessee, Estabrook Rd, Knoxville, TN 37916, USA
*
Author to whom correspondence should be addressed.
Appl. Sci. 2019, 9(8), 1628; https://0-doi-org.brum.beds.ac.uk/10.3390/app9081628
Submission received: 17 March 2019
/
Revised: 14 April 2019
/
Accepted: 16 April 2019
/
Published: 19 April 2019
(This article belongs to the Special Issue Nondestructive Testing in Composite Materials)
Abstract
:Featured Application
The featured application of the proposed study is to develop the application and describe the advantages of phased array ultrasonic technique for the inspection of composite materials. The proposed method not only enhances the probability of detection of the defects in composite materials, but also increases the distance over which the defects are detectable with a single inspection location.
Abstract
Carbon- and glass fiber-reinforced polymer (CFRP and GFRP) composite materials have been used in many industries such as aerospace and automobile because of their outstanding strength-to-weight ratio and corrosion resistance. The quality of these materials is important for safe operation. Nondestructive testing (NDT) techniques are an effective way to inspect these composites. While ultrasonic NDT has previously been used for inspection of composites, conventional ultrasonic NDT, using single element transducers, has limitations such as high attenuation and low signal-to-noise ratio (SNR). Using phased array ultrasonic testing (PAUT) techniques, signals can be generated at desired distances and angles. These capabilities provide promising results for composites where the anisotropic structure makes signal evaluation challenging. Defect detection in composites based on bulk and guided waves are studied. The capability of the PAUT and its sensitivity to flaws were evaluated by comparing the signal characteristics to the conventional method. The results show that flaw sizes as small as 0.8 mm with penetration depth up to 25 mm can be detected using PAUT, and the result signals have better characteristics than the conventional ultrasonic technique. In addition, it has been shown that guided wave generated by PAUT also has outstanding capability of flaw detection in composite materials.
1. Introduction
Carbon fiber-reinforced polymer (CFRP) and glass fiber-reinforced polymer (GFRP) composite materials are widely used in a variety of applications such as aerospace structures, wind turbine blades, the automotive industry, and mass transit [1,2,3,4]. Nondestructive testing/evaluation (NDT/E) and inspection of these materials are necessary to control the quality of the parts and inspect for anomalies in the structures to prevent catastrophic failure. Nondestructive techniques are widely used for material evaluation and flaw detection [5,6]. Ultrasonic testing is one of the most commonly used NDT methods for various applications, where characteristics of ultrasonic signals, such as reflection and scattering of ultrasound waves, are used for material properties evaluation and flaw detection [5,7,8,9,10]. In ultrasonic testing, a piezoelectric transducer is commonly used for generation of compression or shear wave which are propagating through the inspected media. When these waves interact with media boundaries, they face reflection, transmission, and scattering from the boundaries [5]. These scattering characteristics, the speed of sound wave, and travelling time provide valuable information about the material properties and integrity. However, using conventional ultrasonic methods for composite inspection can be challenging due to the anisotropic nature of the composites structures [11,12,13]. Wave propagation in anisotropic composite structures is complex, and random scattering as well as high attenuation of ultrasonic waves reduce the probability of defect detection [14,15]. Several ultrasonic techniques have been used for inspection and characterization of composite materials. Castellano et. al. (2018) introduced a new experimental approach for the comparison between Quasi Static Indentation (QSI) damage and Low-Velocity Impact (LVI) damage in polymer composites starting from the results of ultrasonic goniometric immersion tests [16]. In their study, the differences and similarities between QSI and LVI damage starting from the analysis of the variations of the acoustic behavior and by using a suitable anisotropic damage model developed in the framework of the Continuum Damage Mechanics theory [16].
Phased array ultrasonic testing (PAUT) can overcome conventional ultrasonic method limitations by providing the capability of signal focusing and steering at desired angles and locations [17,18,19]. In PAUT, a series of ultrasonic elements in a phased array transducer can provide the option to activate each individual element in a programmed sequence [20,21]. A phased array unit includes a computer-based instrument capable of driving multielements, as well as receiving and digitizing the returning echoes based on the appropriate delay law for firing the elements. This is done by changing the time between the outgoing ultrasonic pulses of each element so that the superimposed wave front effectively steers and shapes the resultant final sound beam. This capability assists in generating the desired type of ultrasonic signal and improving the wave characteristics in comparison to the conventional single-element ultrasonic transducer. The PAUT method can also be used to generate guided waves [22,23,24,25,26]. Guided waves are another type of ultrasonic wave, which provide useable features for inspection of plate type structures. Guided waves can travel longer distances compared to the other types of ultrasonic waves and can cover more area of inspection, making faster inspections possible [19,27,28,29]. Chimenti (1997) comprehensively discussed the composite materials and their inspection and characterization using guided waves [30].
In this work, we first compare the defect detection capability and sensitivity of the PAUT signals with single element (conventional) ultrasonic (SEUT). The back wall reflection of bulk wave through the thickness of composite samples was used to study the signal characteristics of the PAUT and compare them with SEUT. The sensitivity of the signal to flaw detection was also studied using the response signal from the artificially made defects in composite parts. Next, guided wave modes were generated using the PAUT system for defect detection in sample plates. The guided waves generated using PAUT were used to show the feasibility of flaw detection on composite plates.
2. Materials and Sample Preparation
2.1. SEUT Versus PAUT Methods
GFRP plates, extracted from a wind turbine blade, were used for the experiments as shown in Figure 1a. The GFRP samples have various thicknesses of 4, 10, 12, 18, and 25 mm. In order to study the sensitivity of flaw detection in both the PAUT and SEUT methods, various sizes of holes were drilled on one side of the sample (with the largest thickness being 25 mm), as shown schematically in Figure 1b.
2.2. PAUT Guided Wave Method
Two different types of materials were used in this experiment, Aluminum (Al) and CFRP plates, as introduced in Table 1. The reason for selecting these materials for guided wave evaluation was that they were available in plate shape and desired thicknesses (in the range of 1 to 2 mm) for guided wave generation. For both Aluminum and CFRP samples, artificial defects, in the form of drilled holes, were made into the samples. Figure 2 shows a schematic for the location and depth of the artificial holes in both inspected samples.
3. Experimental Setup
3.1. SEUT Versus PAUT Methods
It is important to understand how far an ultrasonic signal can travel through the composite material while the back wall reflection is still detectable. This shows the capability of signal focusing and propagation for an ultrasonic setup. The SEUT experiments were performed using three different frequencies including 0.5, 1.0, and 1.5 MHz, where the attenuation of ultrasound signals at different frequencies was evaluated. In the PAUT experiments, a 1.5 MHz, 16-element transducer was used accompanying the related normal wedge. Both SEUT and PAUT transducer and setups are shown in Figure 3.
3.2. PAUT Guided Wave Method
Guided wave modes were generated on Al and CFRP plates by means of a commercially available phased array probe and wedges. The procedure of plate wave generation and parametric evaluation are described in detail in [8,18]. A 1.5 MHz phased array ultrasonic probe with 16 elements and related 60 degrees longitudinal wave wedge was used for guided wave generation and flaw detection. Figure 4 shows the setup used for inspecting the artificial defects (drilled holes) in CFRP sample. In CFRP sample, guided waves were generated in direction of the fibers.
4. Results and Discussions
4.1. SEUT Versus PAUT Methods
4.1.1. Focusing Depth Comparison
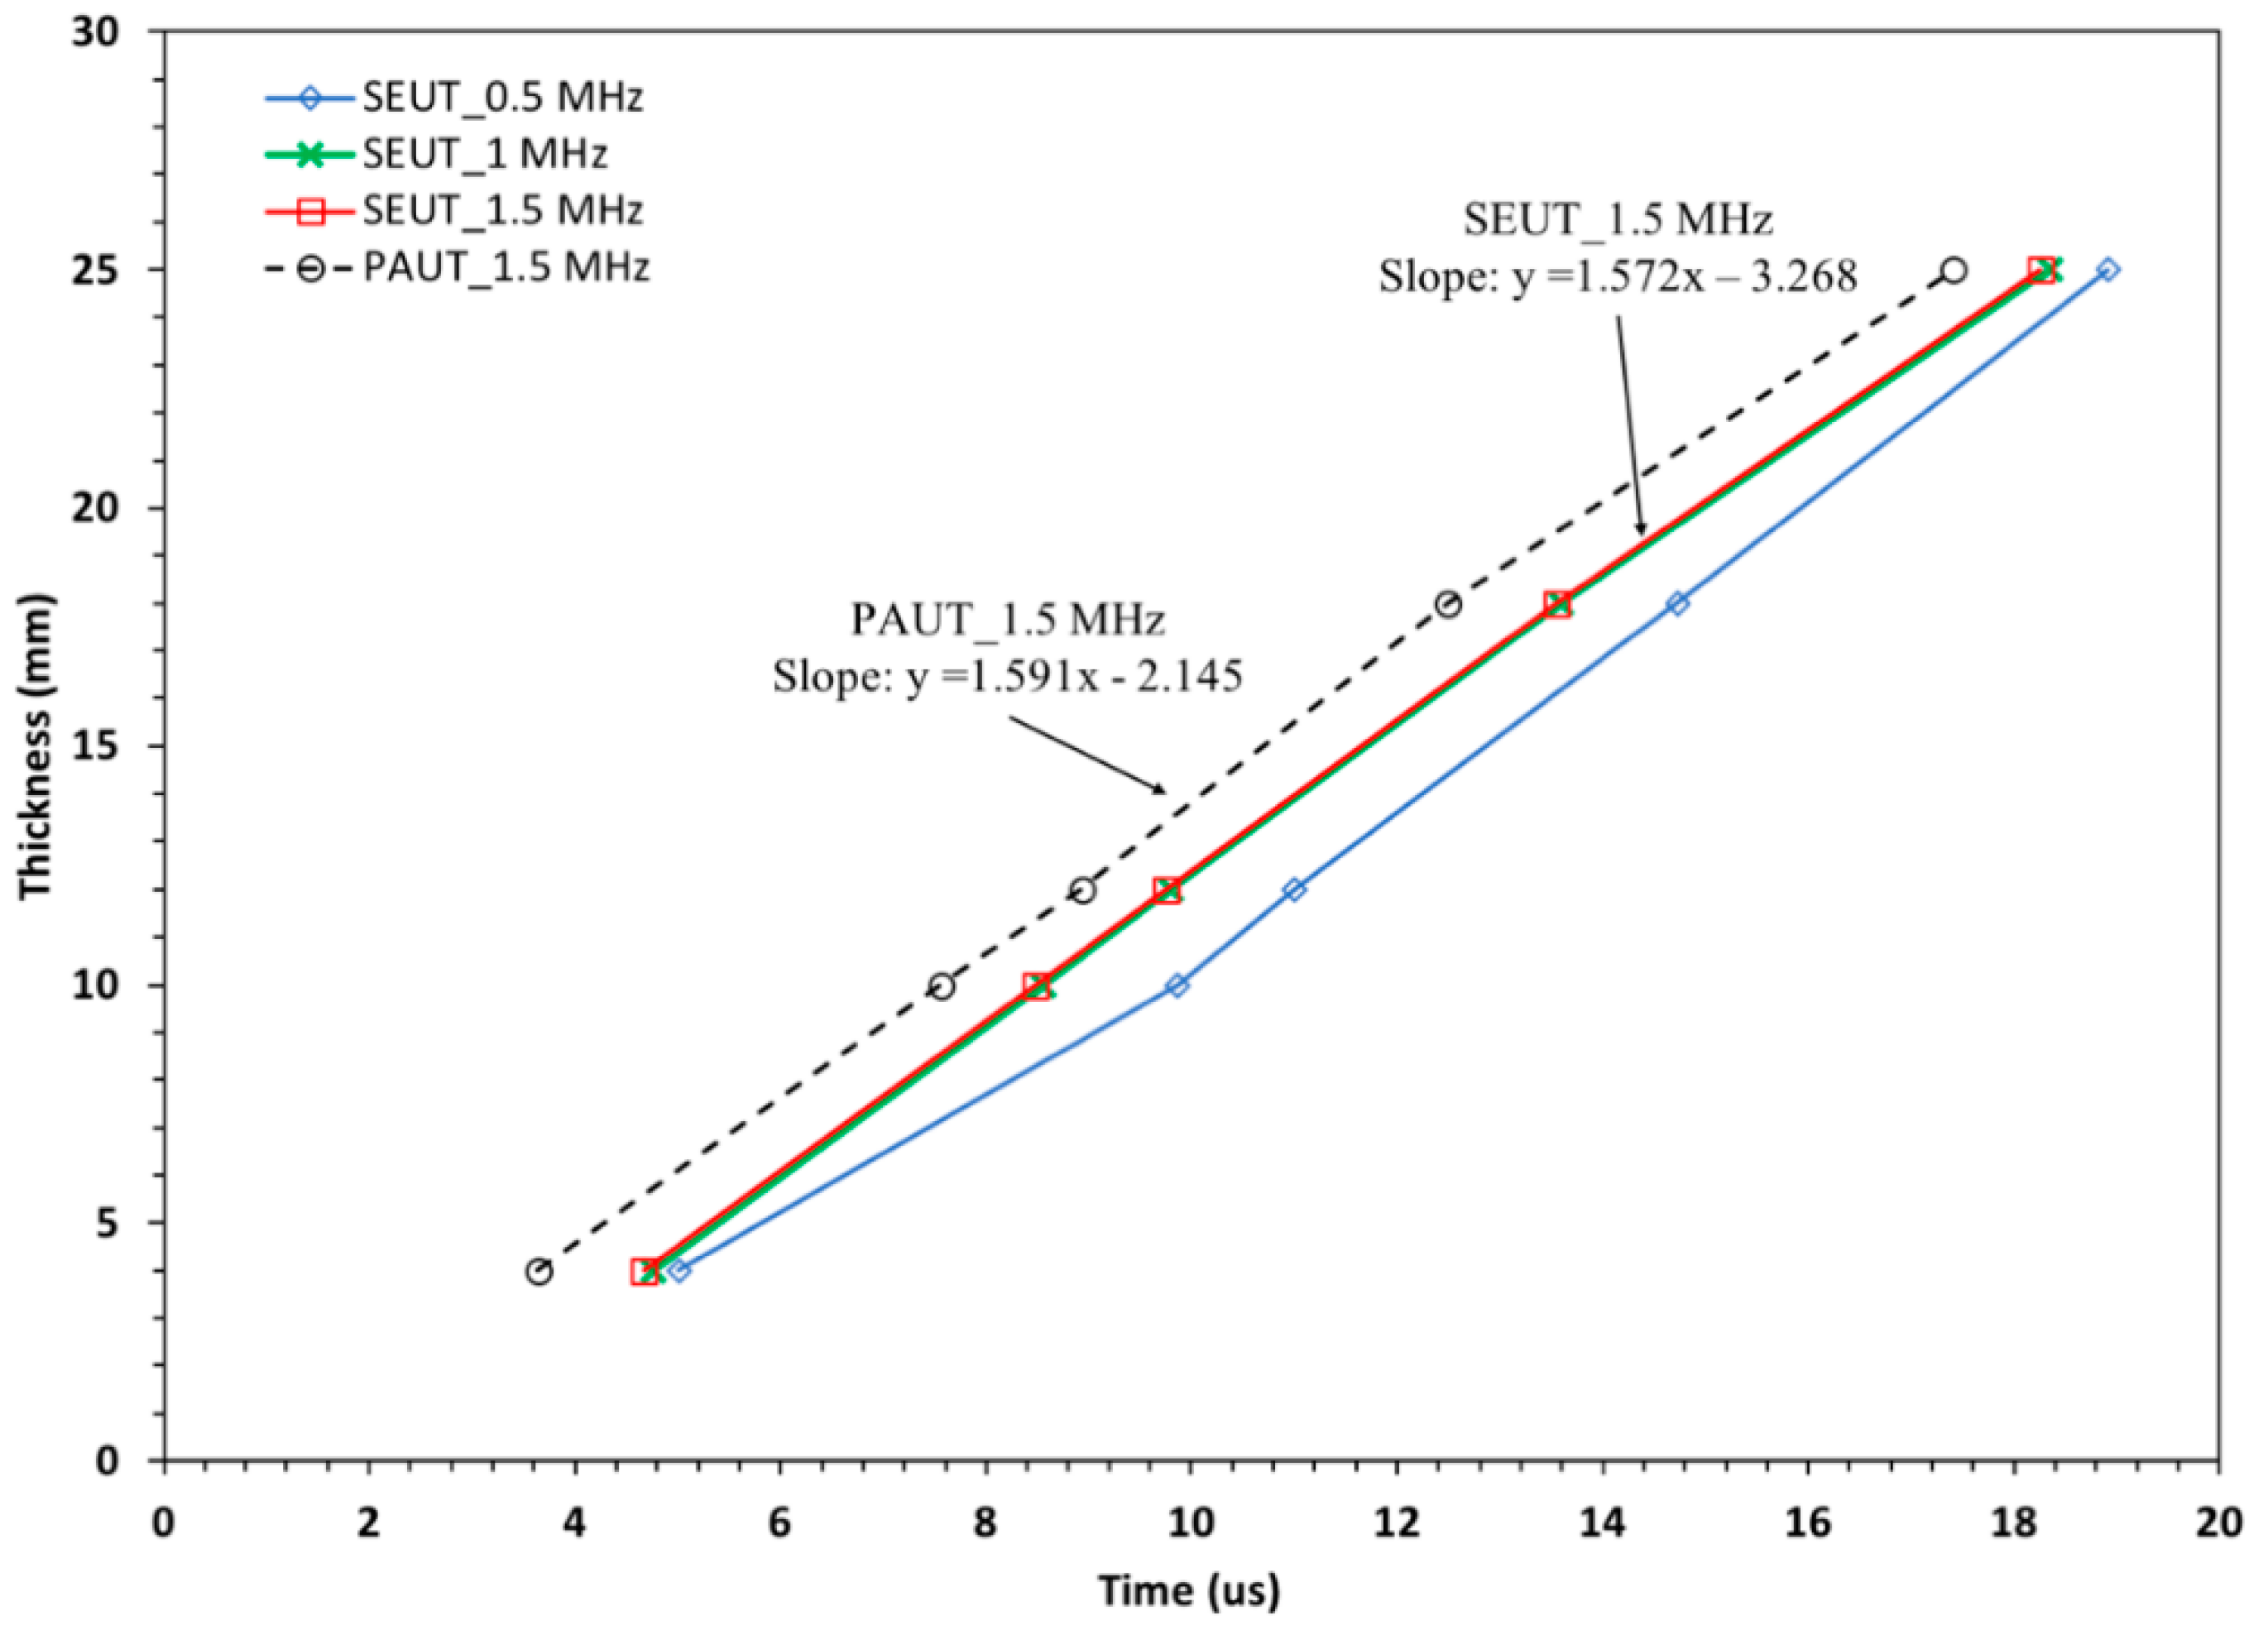
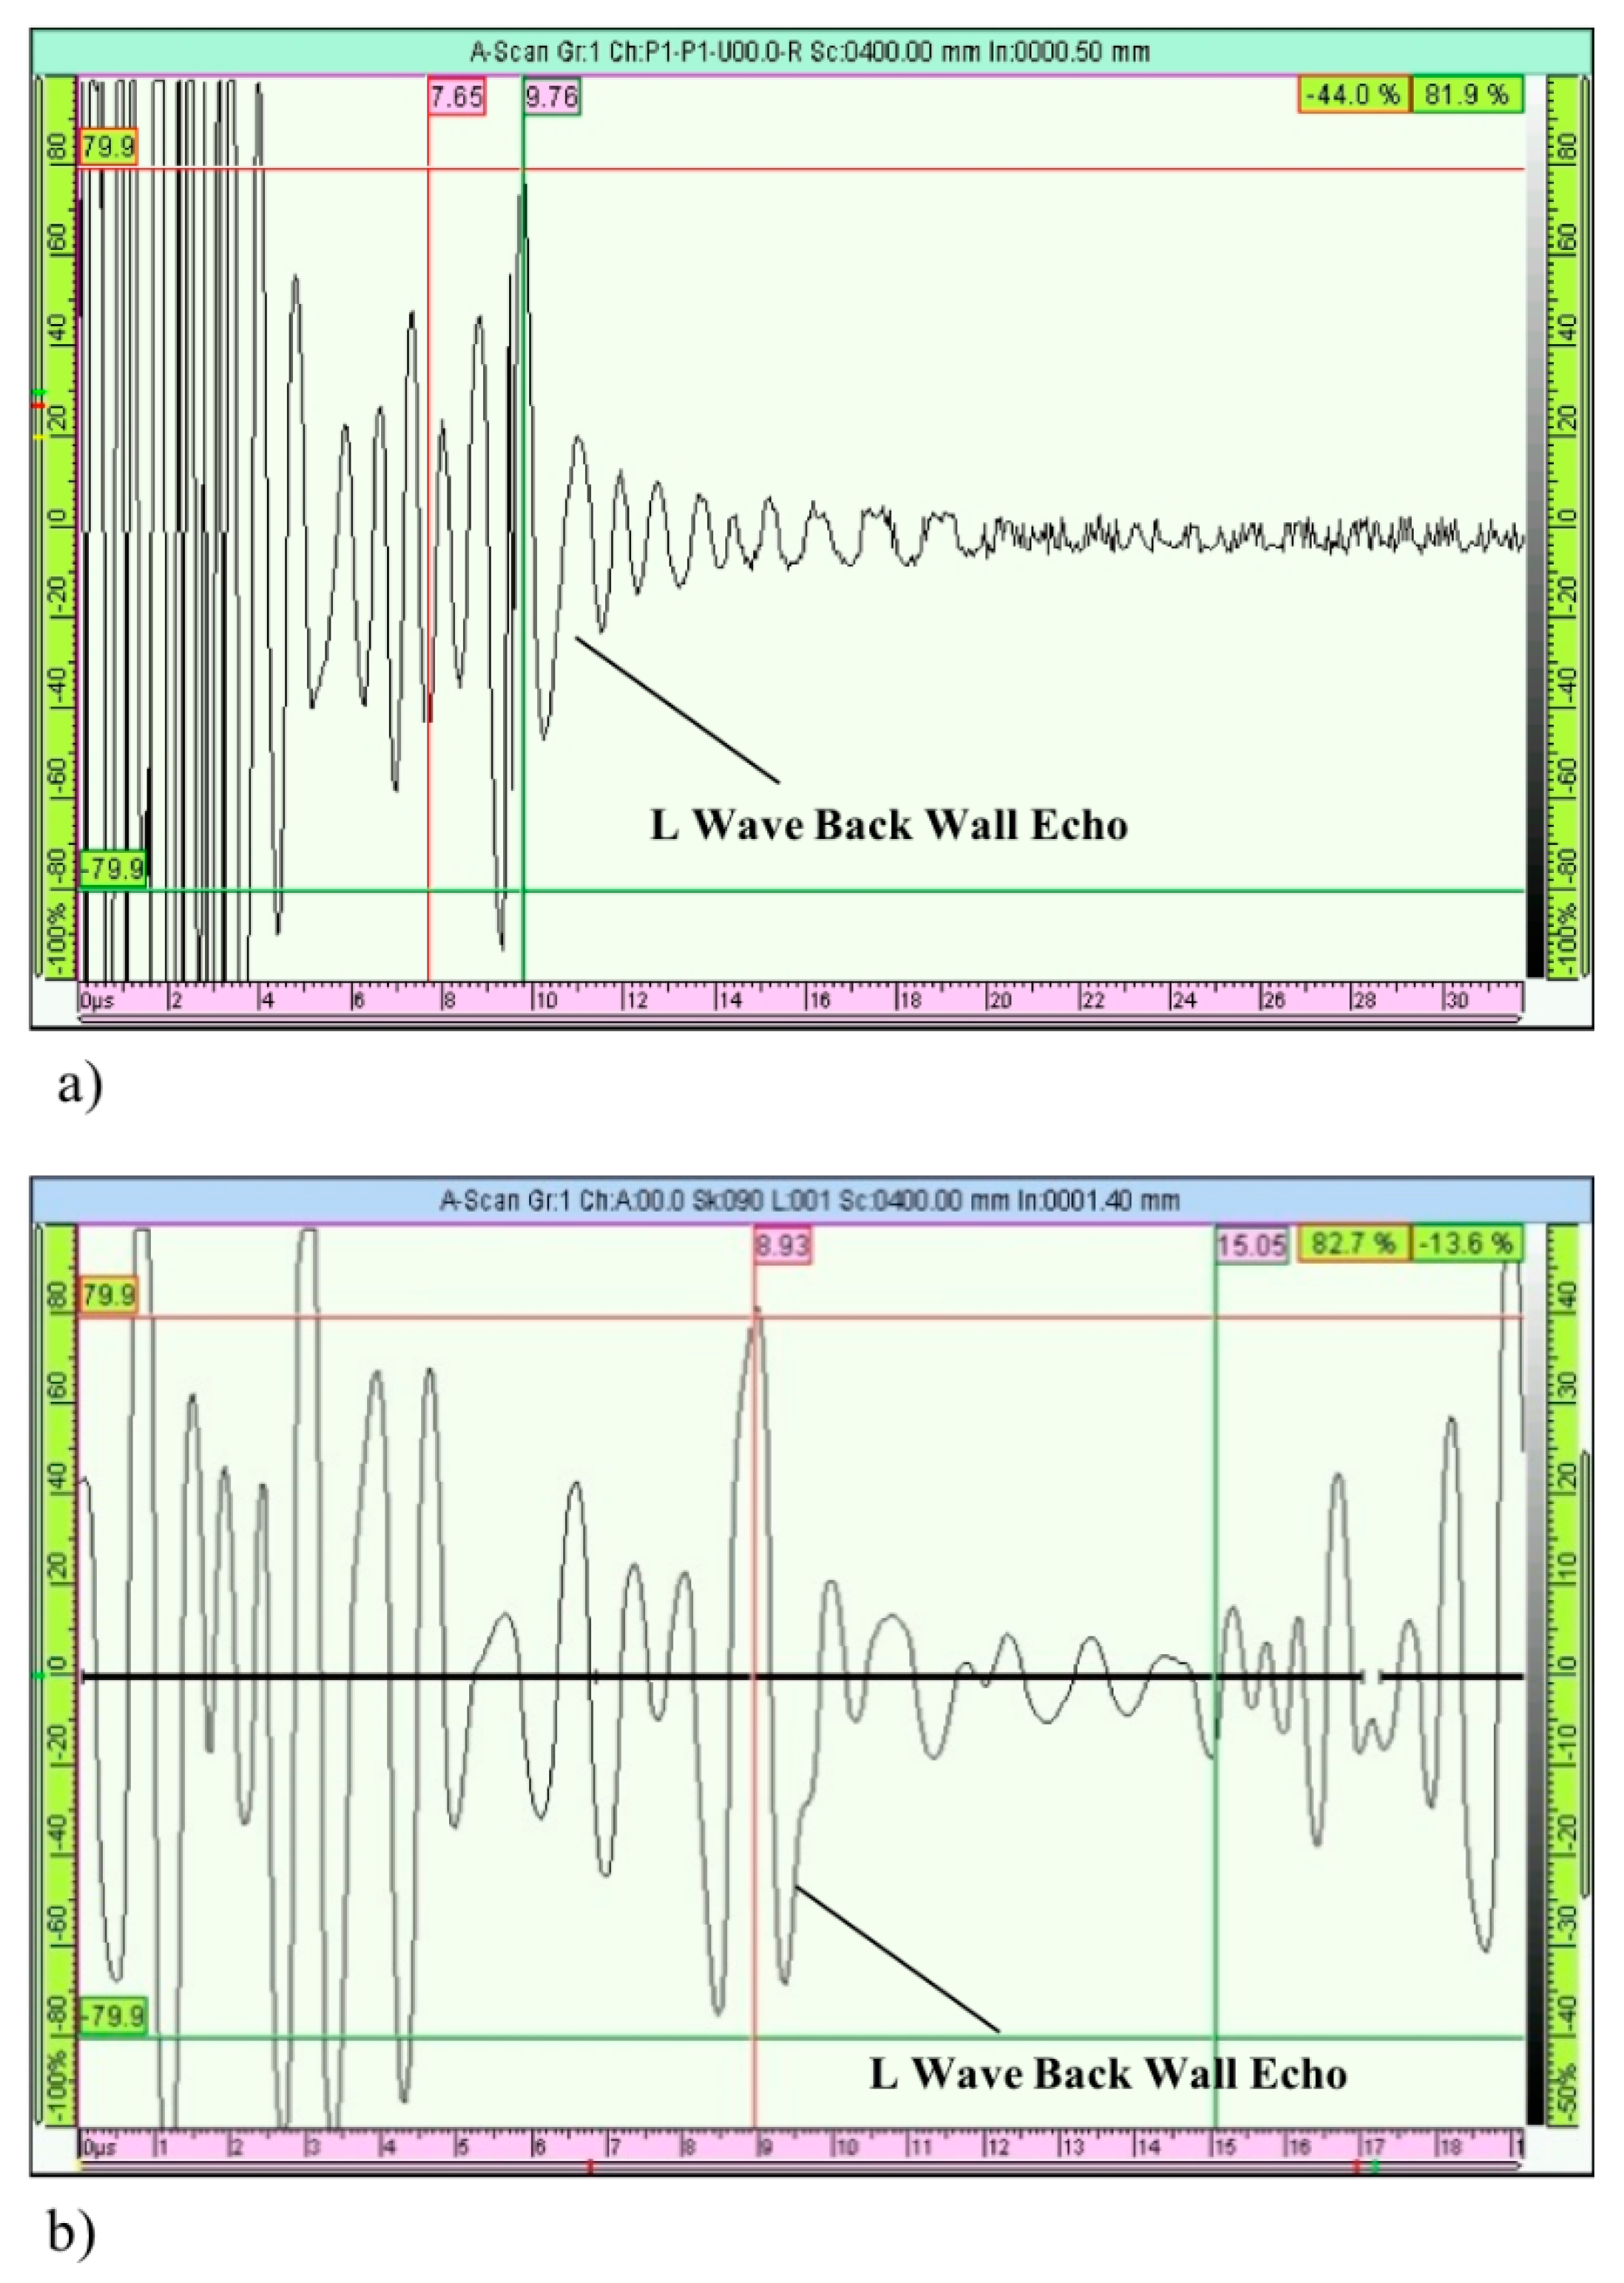
Table 2 shows the signal characteristics in terms of signal-to-noise ratio (SNR) for SEUT and PAUT. Data in Table 2 is plotted in Figure 5 and shows the relationship between the thicknesses of the GFRP plates (i.e., wave traveling distance) and travelling time of ultrasound wave. It can be observed that the velocities in the GFRP plate can be calculated as twice the slope of the graph, which are equal to 2 × 1.57 = 3.15 mm/μs for SEUT and 2 × 1.59 = 3.18 mm/μs for PAUT. Figure 6 shows an example for typical signals for the back wall reflection in SEUT and PAUT methods in the 12-mm-thick composite plate. As can be seen from the results in Table 2 and considering the form of the ultrasound signal shown in Figure 6, the features of the signals are clearer and better detectable using PAUT with lower gain values. The wave velocity is important information in determining the depth and location of the defects according to the ultrasound wave’s traveling time.
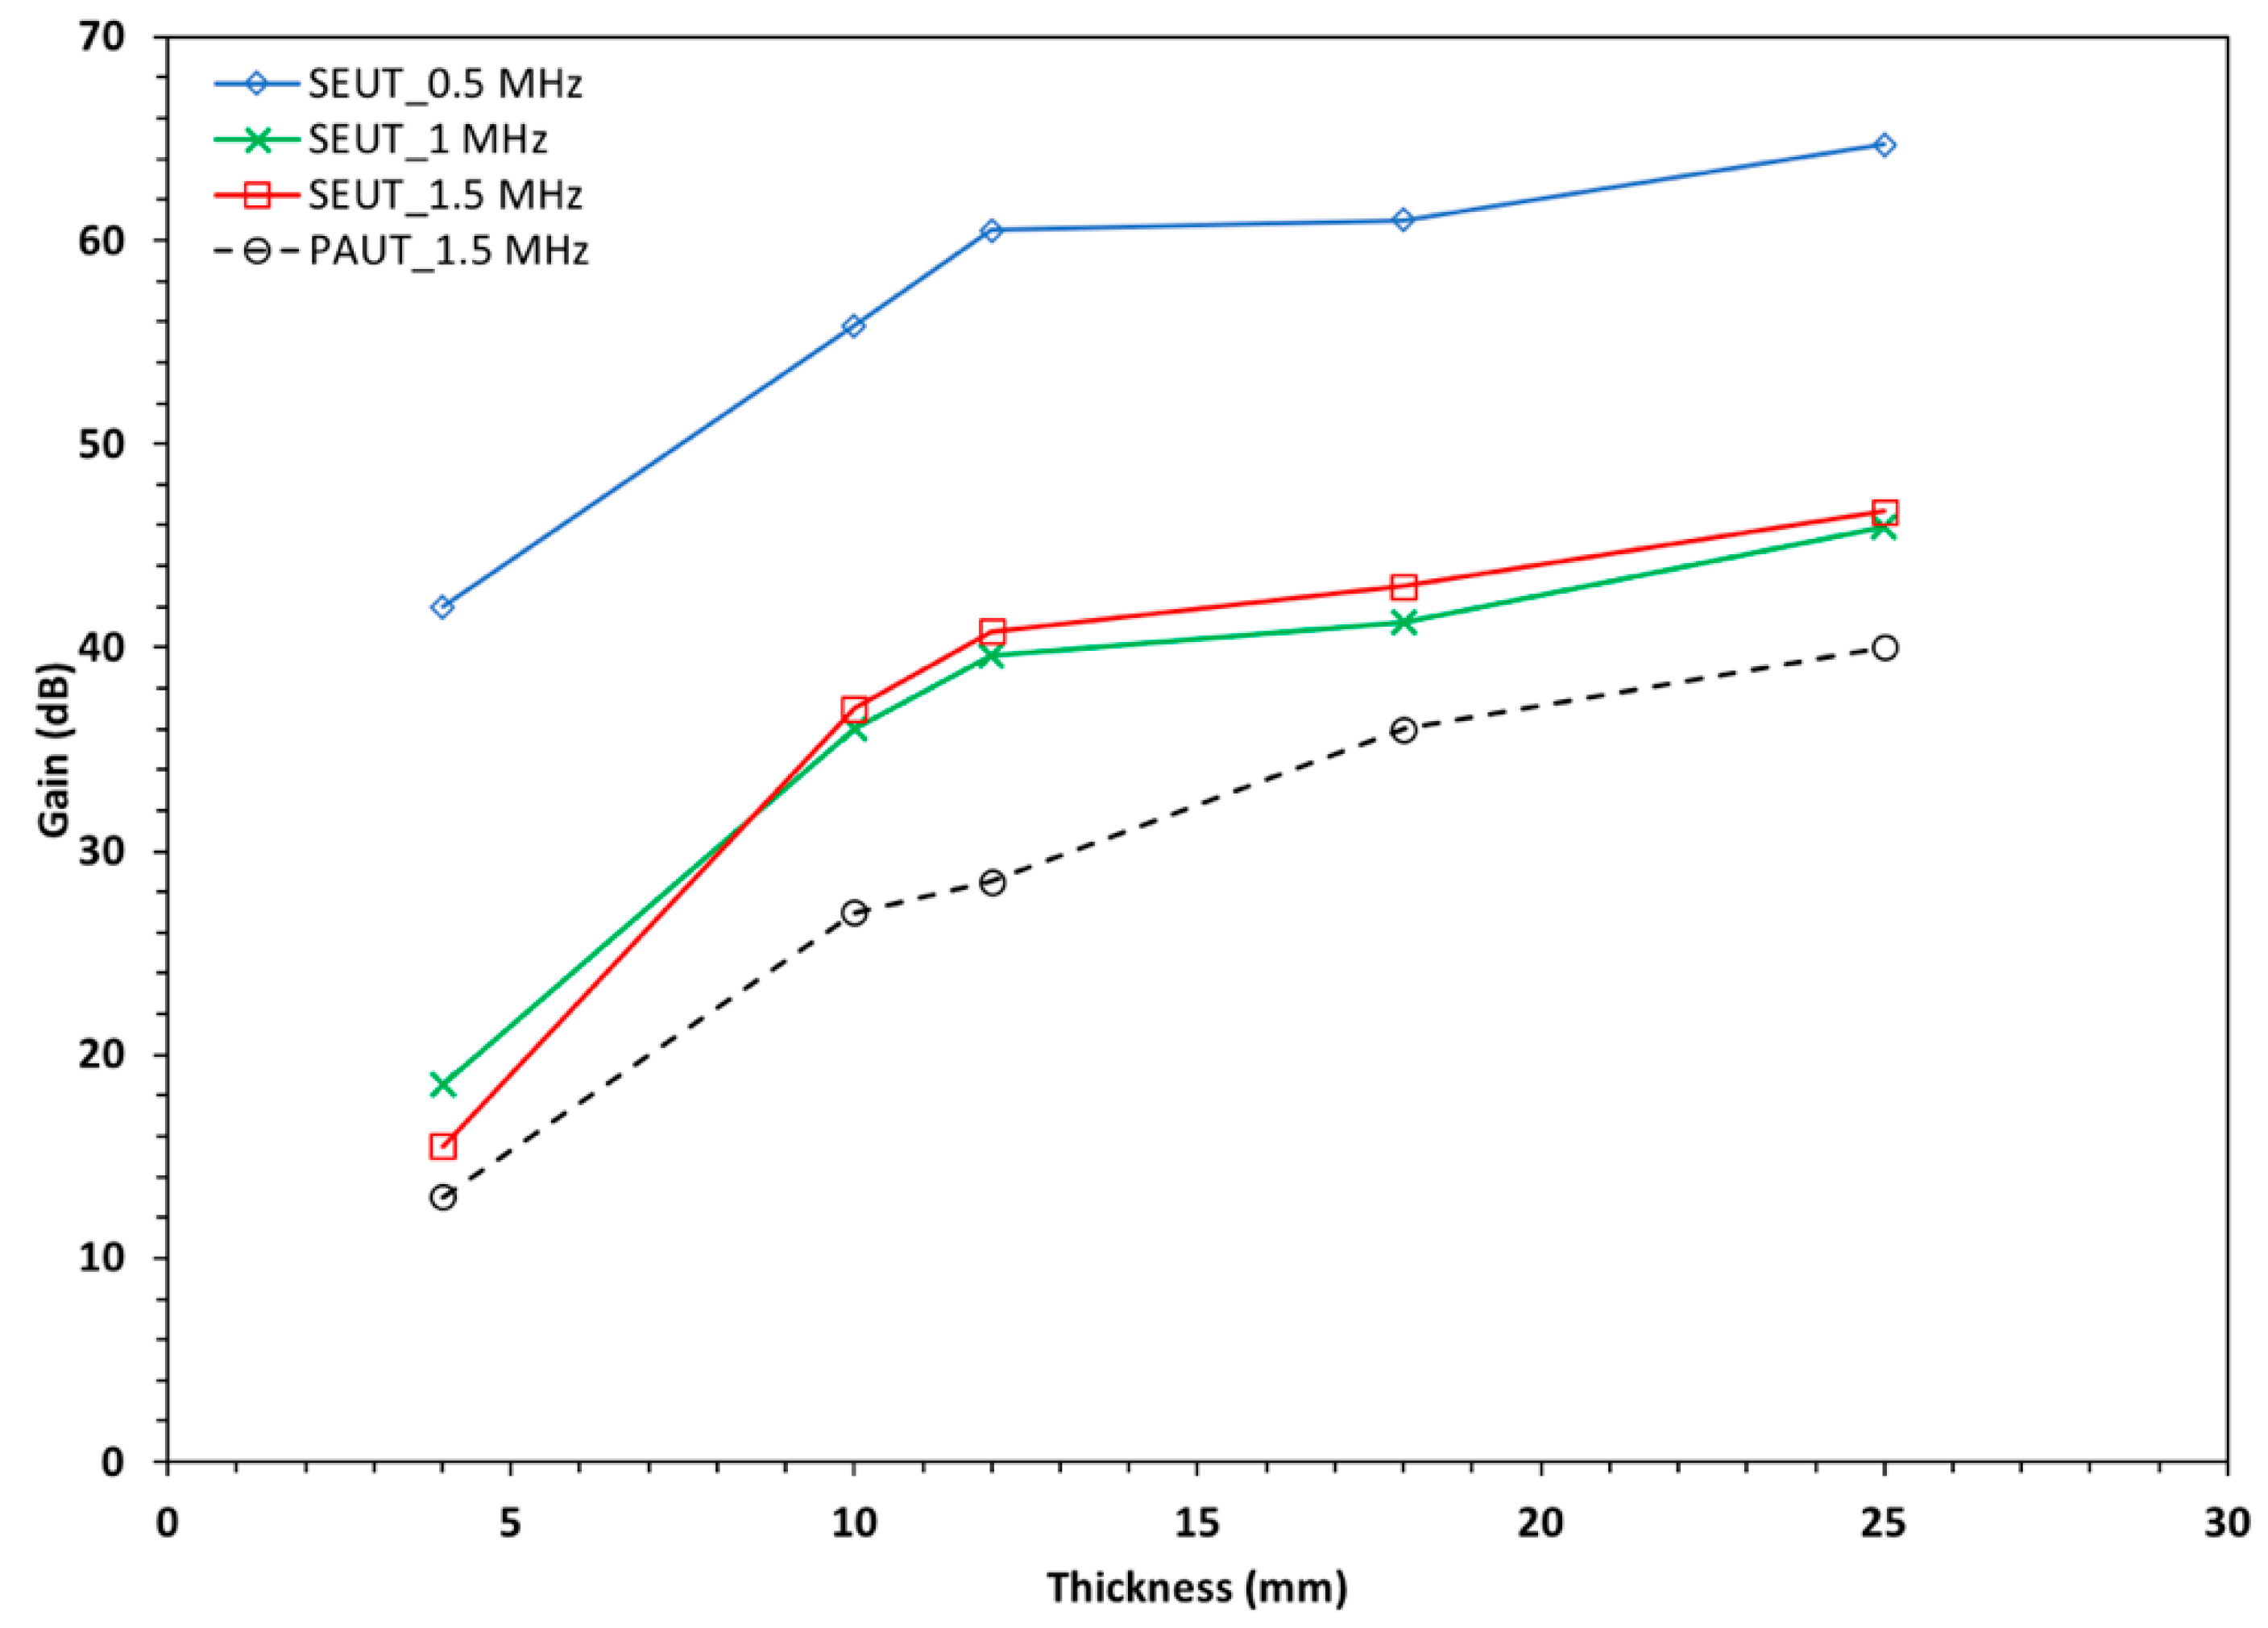
All the measured velocities are very close in value; however, the attenuation (i.e., gain values) is improved for PAUT when compared to SEUT at 1.5 MHz. On the other hand, the quantitative values in Table 2 show that SNR is, on average, two times larger for SEUT when comparing the peak of reflected signal to the background noise. However, it should be mentioned that the resolution of the peak and its location is much lower in SEUT which caused inaccuracy for detection purposes. Higher local value of SNR in SEUT can be attributed to the interference of the signals for each element in PAUT. Qualitatively, PAUT has more uniform and detectable signal with less jitter, specifically at larger thicknesses. Figure 7 shows the gain values (for different inspection frequencies) in order to reach detectable signal in different sample thicknesses. The plot shows that the SNR and signal’s attenuation were improved in PAUT technique when compared to SEUT such that 7–20% less gain in value was required to have detectable signal in case of 1.5 MHz transducers.
4.1.2. Sensitivity Comparison and Defect Detection
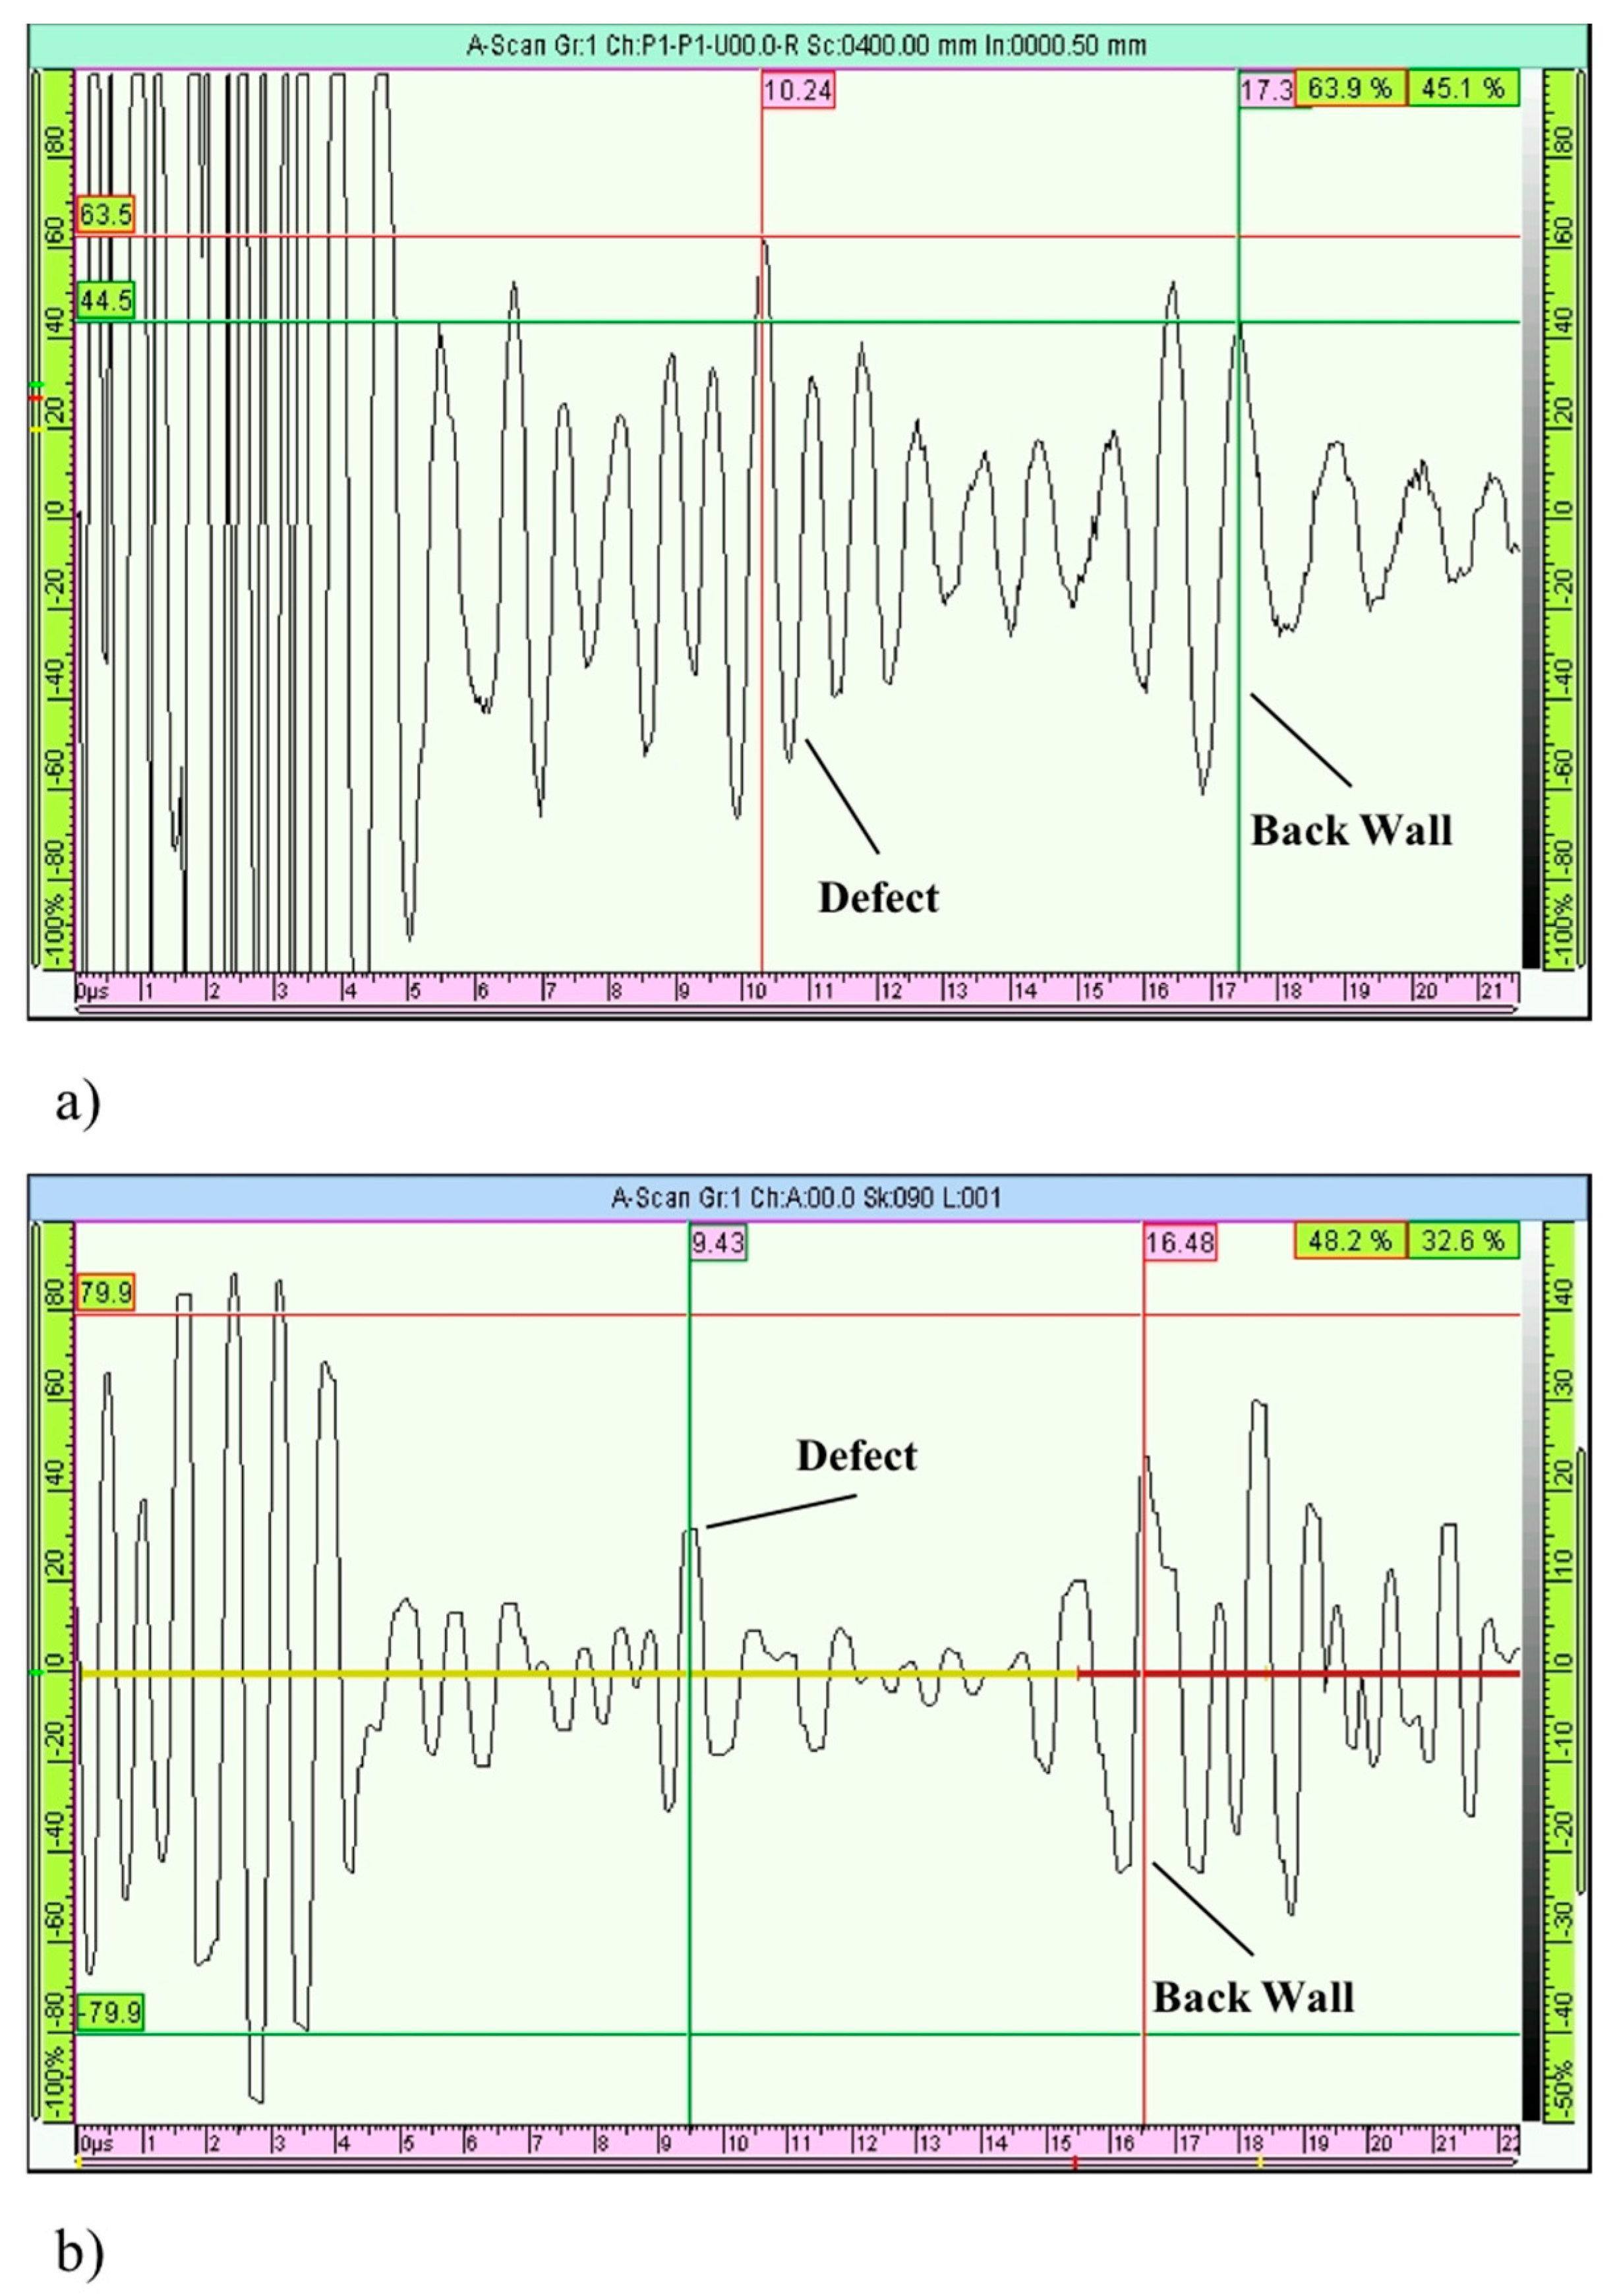
Figure 8 shows the signals associated with the defect (artificially drilled holes) reflections by SEUT and PAUT methods. The depth of the hole can be determined based on the obtained velocity values, as in Equations (1) and (2). Both SEUT and PAUT techniques provided results that are very close to what was obtained by real time x-ray imaging (i.e., 11.175 mm) for validation. It was observed that both SEUT and PAUT techniques can detect a 0.8 mm diameter hole as the minimum size and sensitivity limit; however, PAUT method provides approximately 15% higher SNR for the defect signal. We believe that in PAUT, lower SNR and better signal characteristics, such as higher focusing energy, could assist in detecting smaller-sized defect sizes, and this needs further experimental evaluation.
In Figure 8, PAUT has a clearer and more easily detectable reflection from the defect (reflector), as well as a better detectable back wall reflection. However, when looking at SEUT signal, due to less smoothness in signal from one transducer element, it is more difficult to identify these reflection locations. In addition, as can be seen from the data in Table 2, the gain value is a very important factor. However in some cases the SNR in SEUT looks to be higher, but it was obtained with higher gain value. This happened when a small decrease in the gain value, less than the values in Table 2, did not provide a good detectable signal.
4.2. PAUT Guided Wave Method
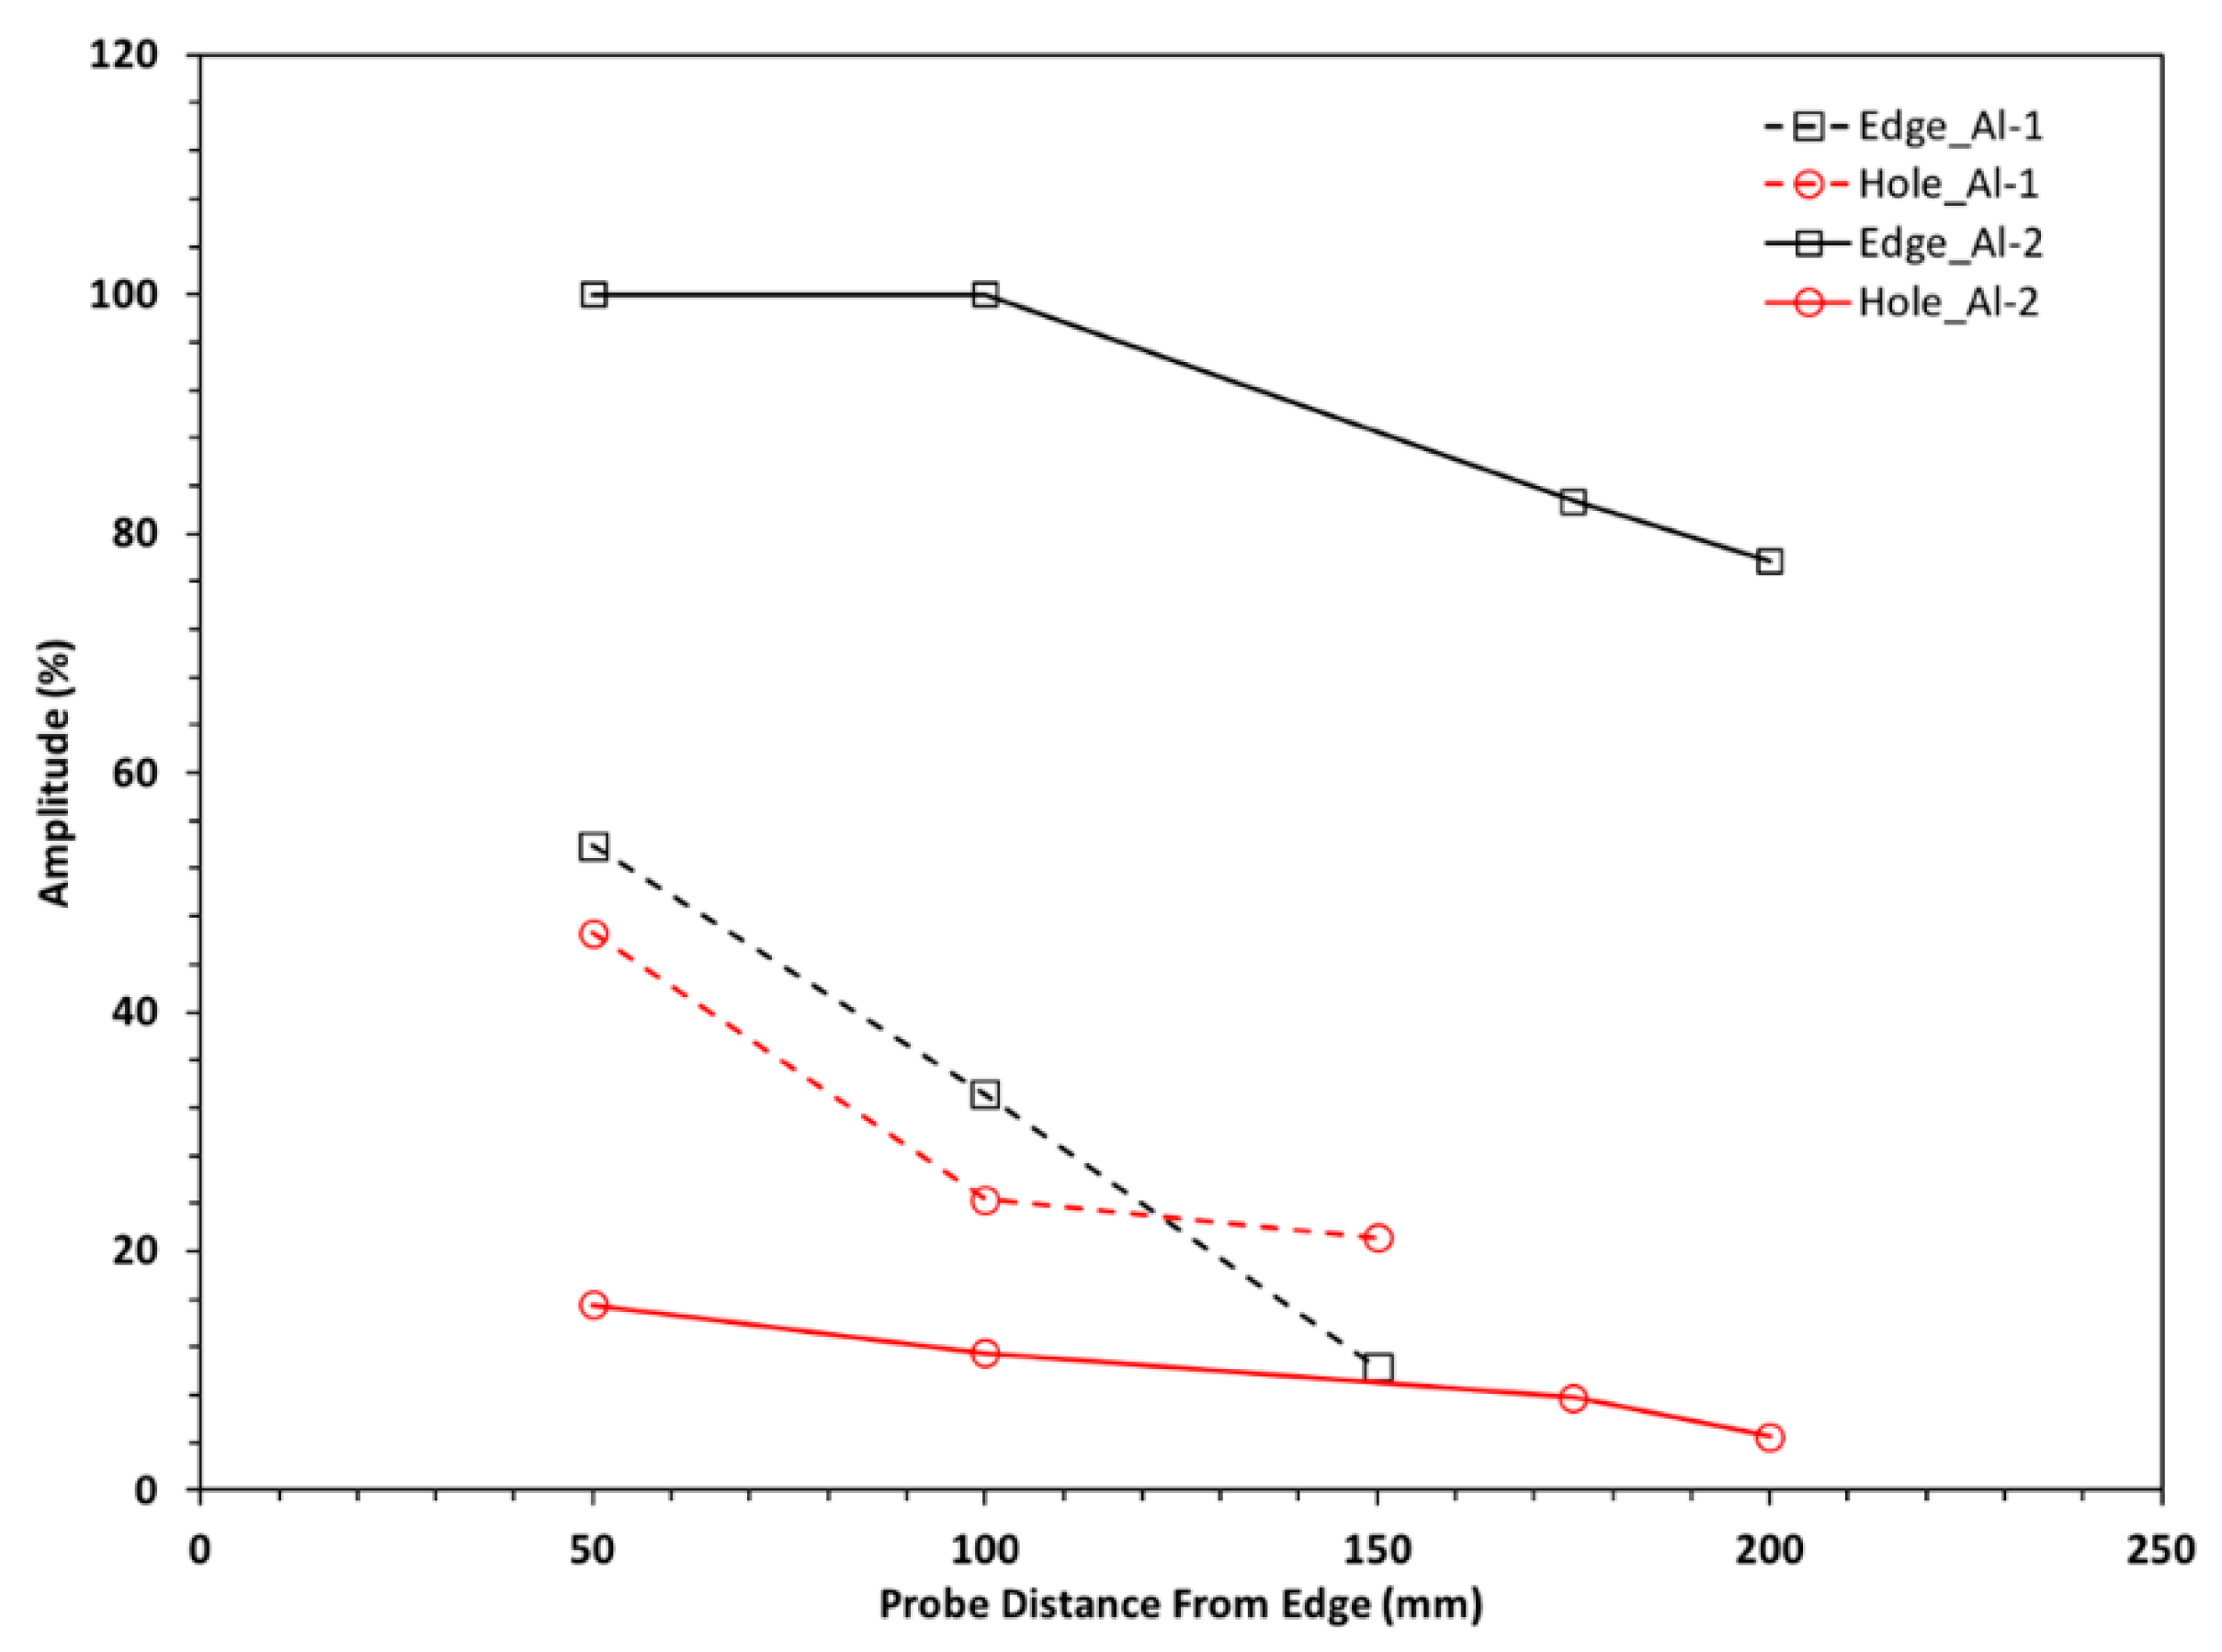
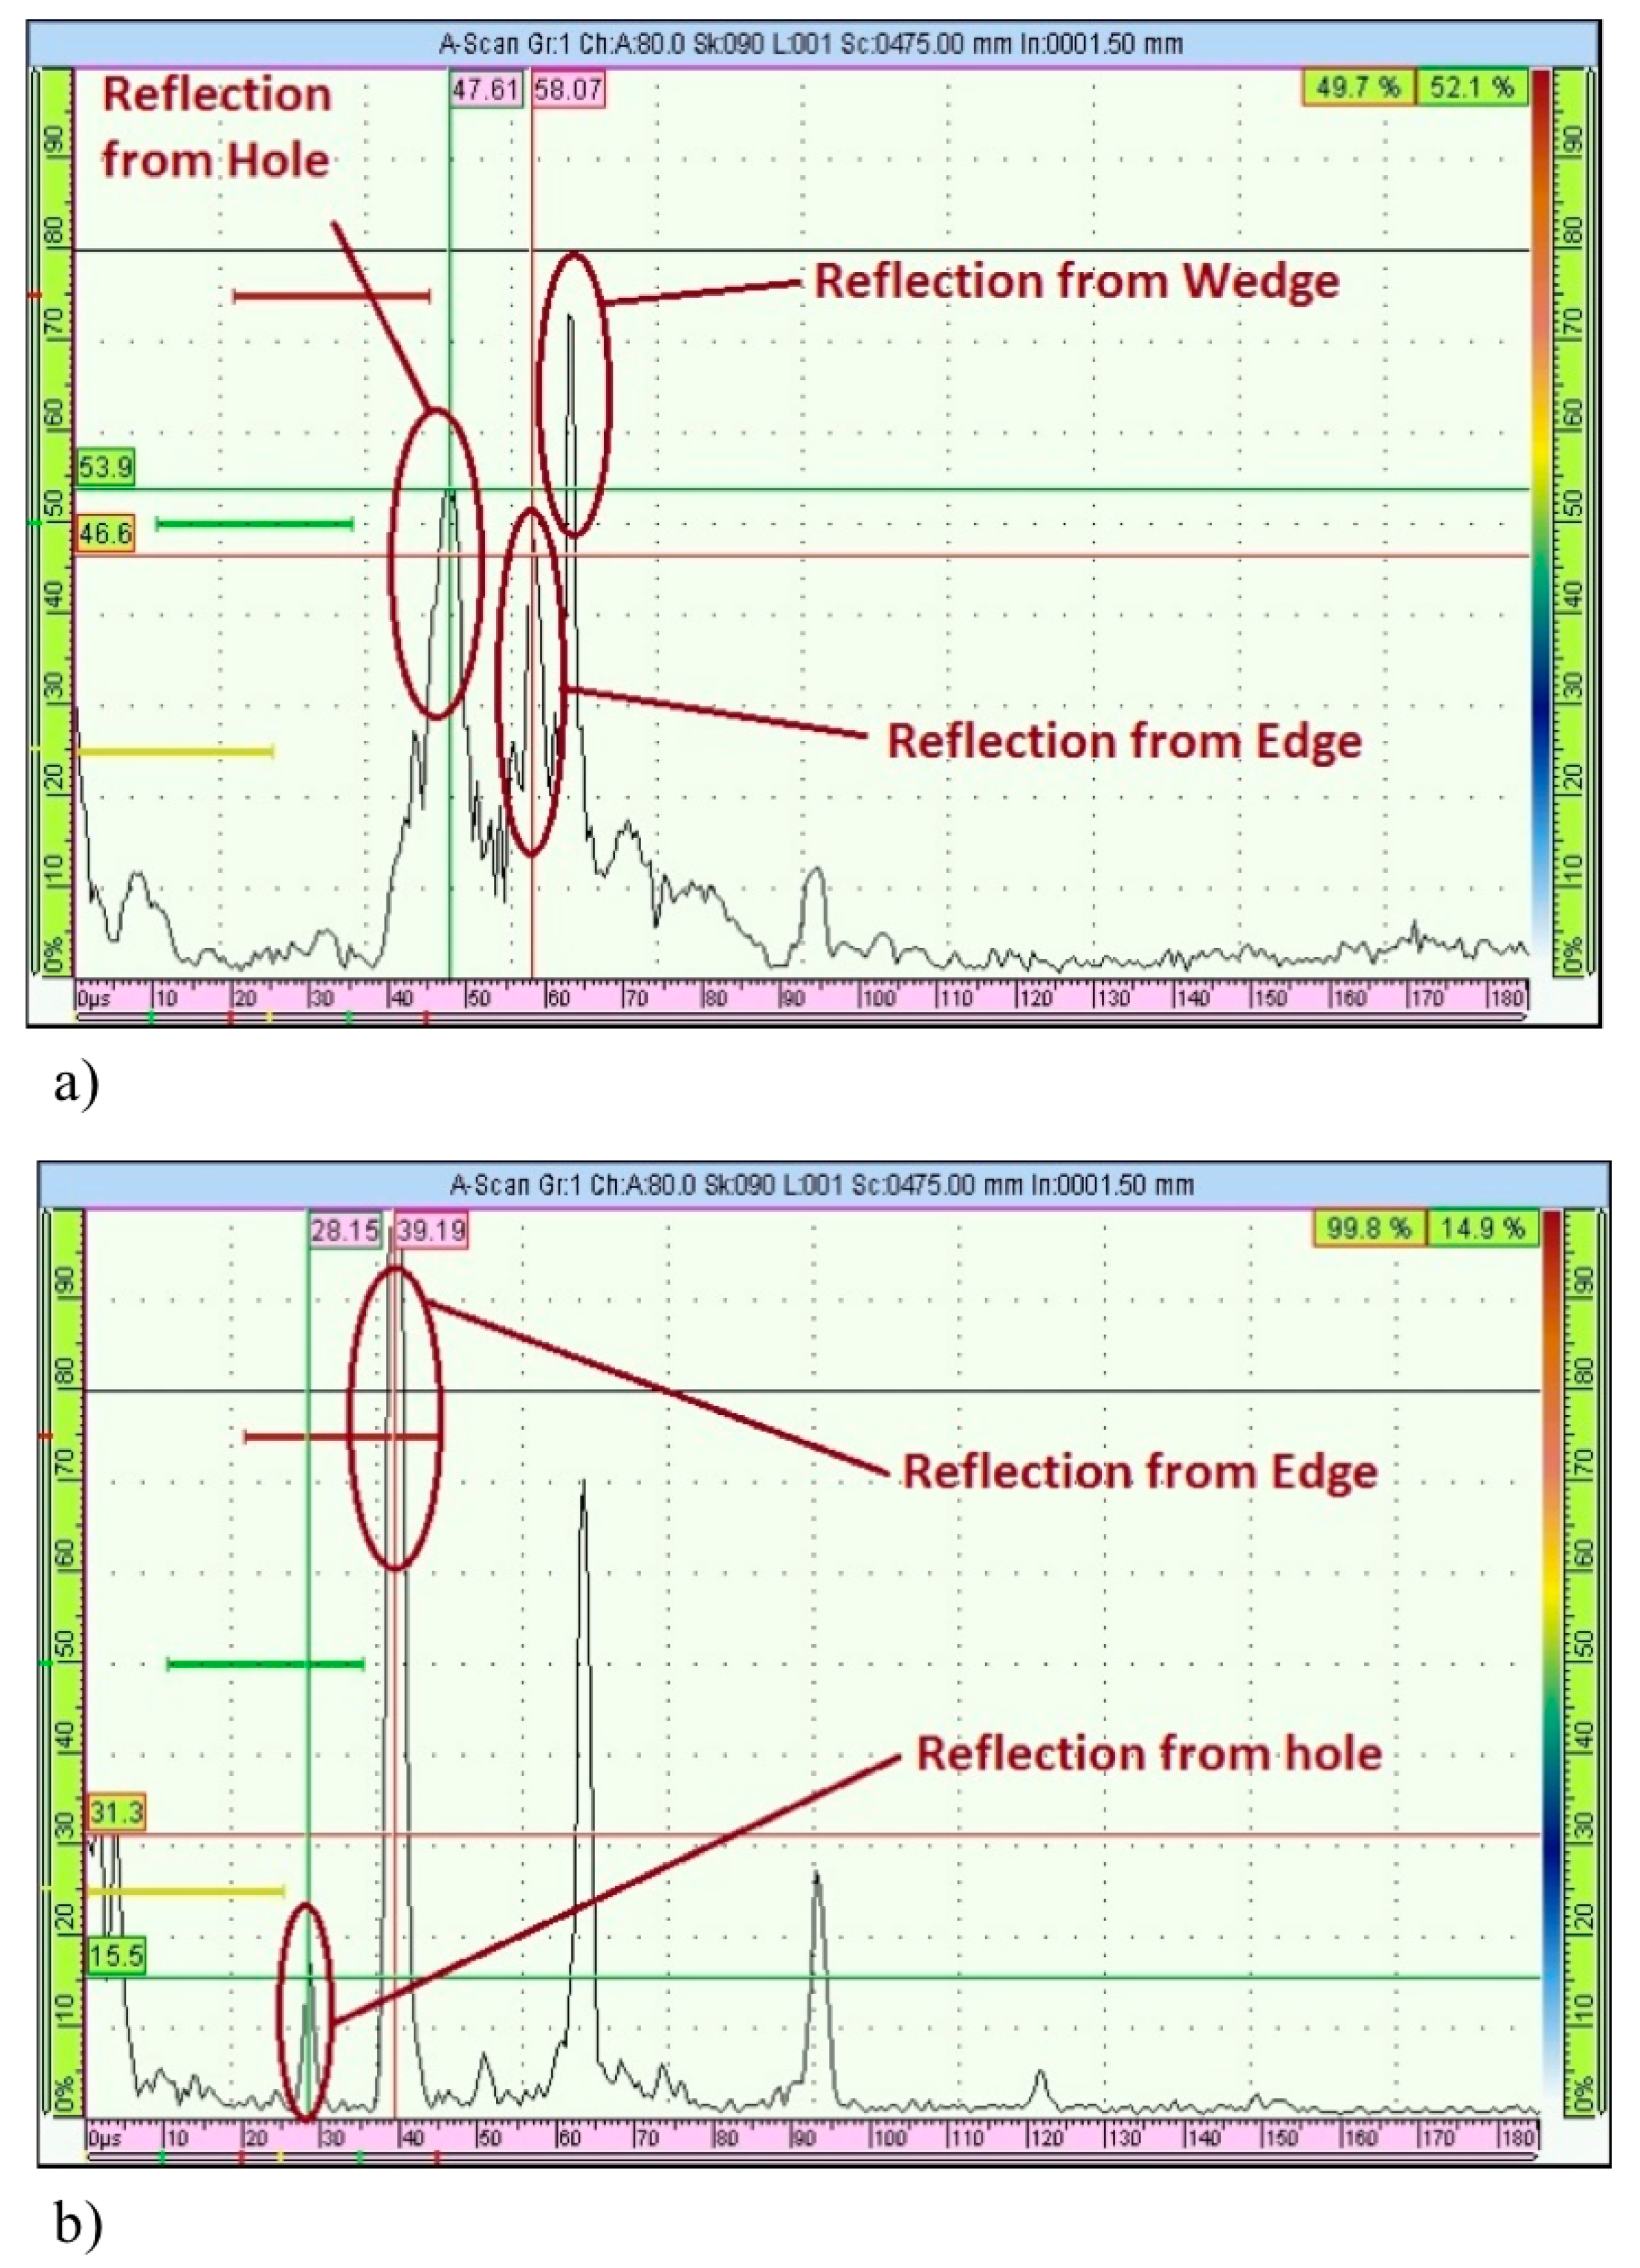
Table 3 and Table 4 show the results for the signal response parameters for Al-1 and Al-2 samples. In the dispersion curve of guided wave modes in plates, the smaller values of “fd” (i.e., frequency x plate thickness) are more distinctive and, consequently, have a higher probability of detection [31]. In practical application specifically when the thickness of the plate structure is a fixed and known value, only the frequency of inspection can be changed. So, for thicker structures, one should use much lower frequencies, while for thinner structures, the range of possible frequencies will be wider and higher frequencies can be used to increase the resolution. The effect of “fd” value in response signals is presented in Table 3 and Table 4. We find that, in lower “fd” values, the distance from which the signal from the defect is still detectable is longer. The phase velocity for the generated guided wave were calculated based on the theory and properties of the angle wedge. Based on these values, S0, A1, and S1 modes were possible for the Al-1 sample (fd = 3.3 MHz.mm), and A0 and S0 modes are possible for Al-2 sample (fd = 0.96 MHz.mm). The strongest reflection which also has the closest phase velocity value to the theory were identified as the dominate wave modes. In this case it was A1 for Al-1 sample, S0 for Al-2 sample, and S0 for CFRP sample. In Table 3 and Table 4, signal parameters from the reflection of the edge of the plate close to the hole, and from the hole are presented. These signal parameters include the arrival time and the amplitude of the signal at the edge of the plate and the defect. Figure 9 shows the change of the signal’s amplitude over the distance of the PAUT transducer from the edge for Al-1 and Al-2. For Al-1 it was noticed that the hole’s signal has larger amplitude at a longer distance compared to Al-2. This is attributed to the interference of the stationary wedge reflection signal and the signal from the hole. Figure 10 shows typical signals for the experiments in Table 3 and Table 4 for Al-1 and Al-2.
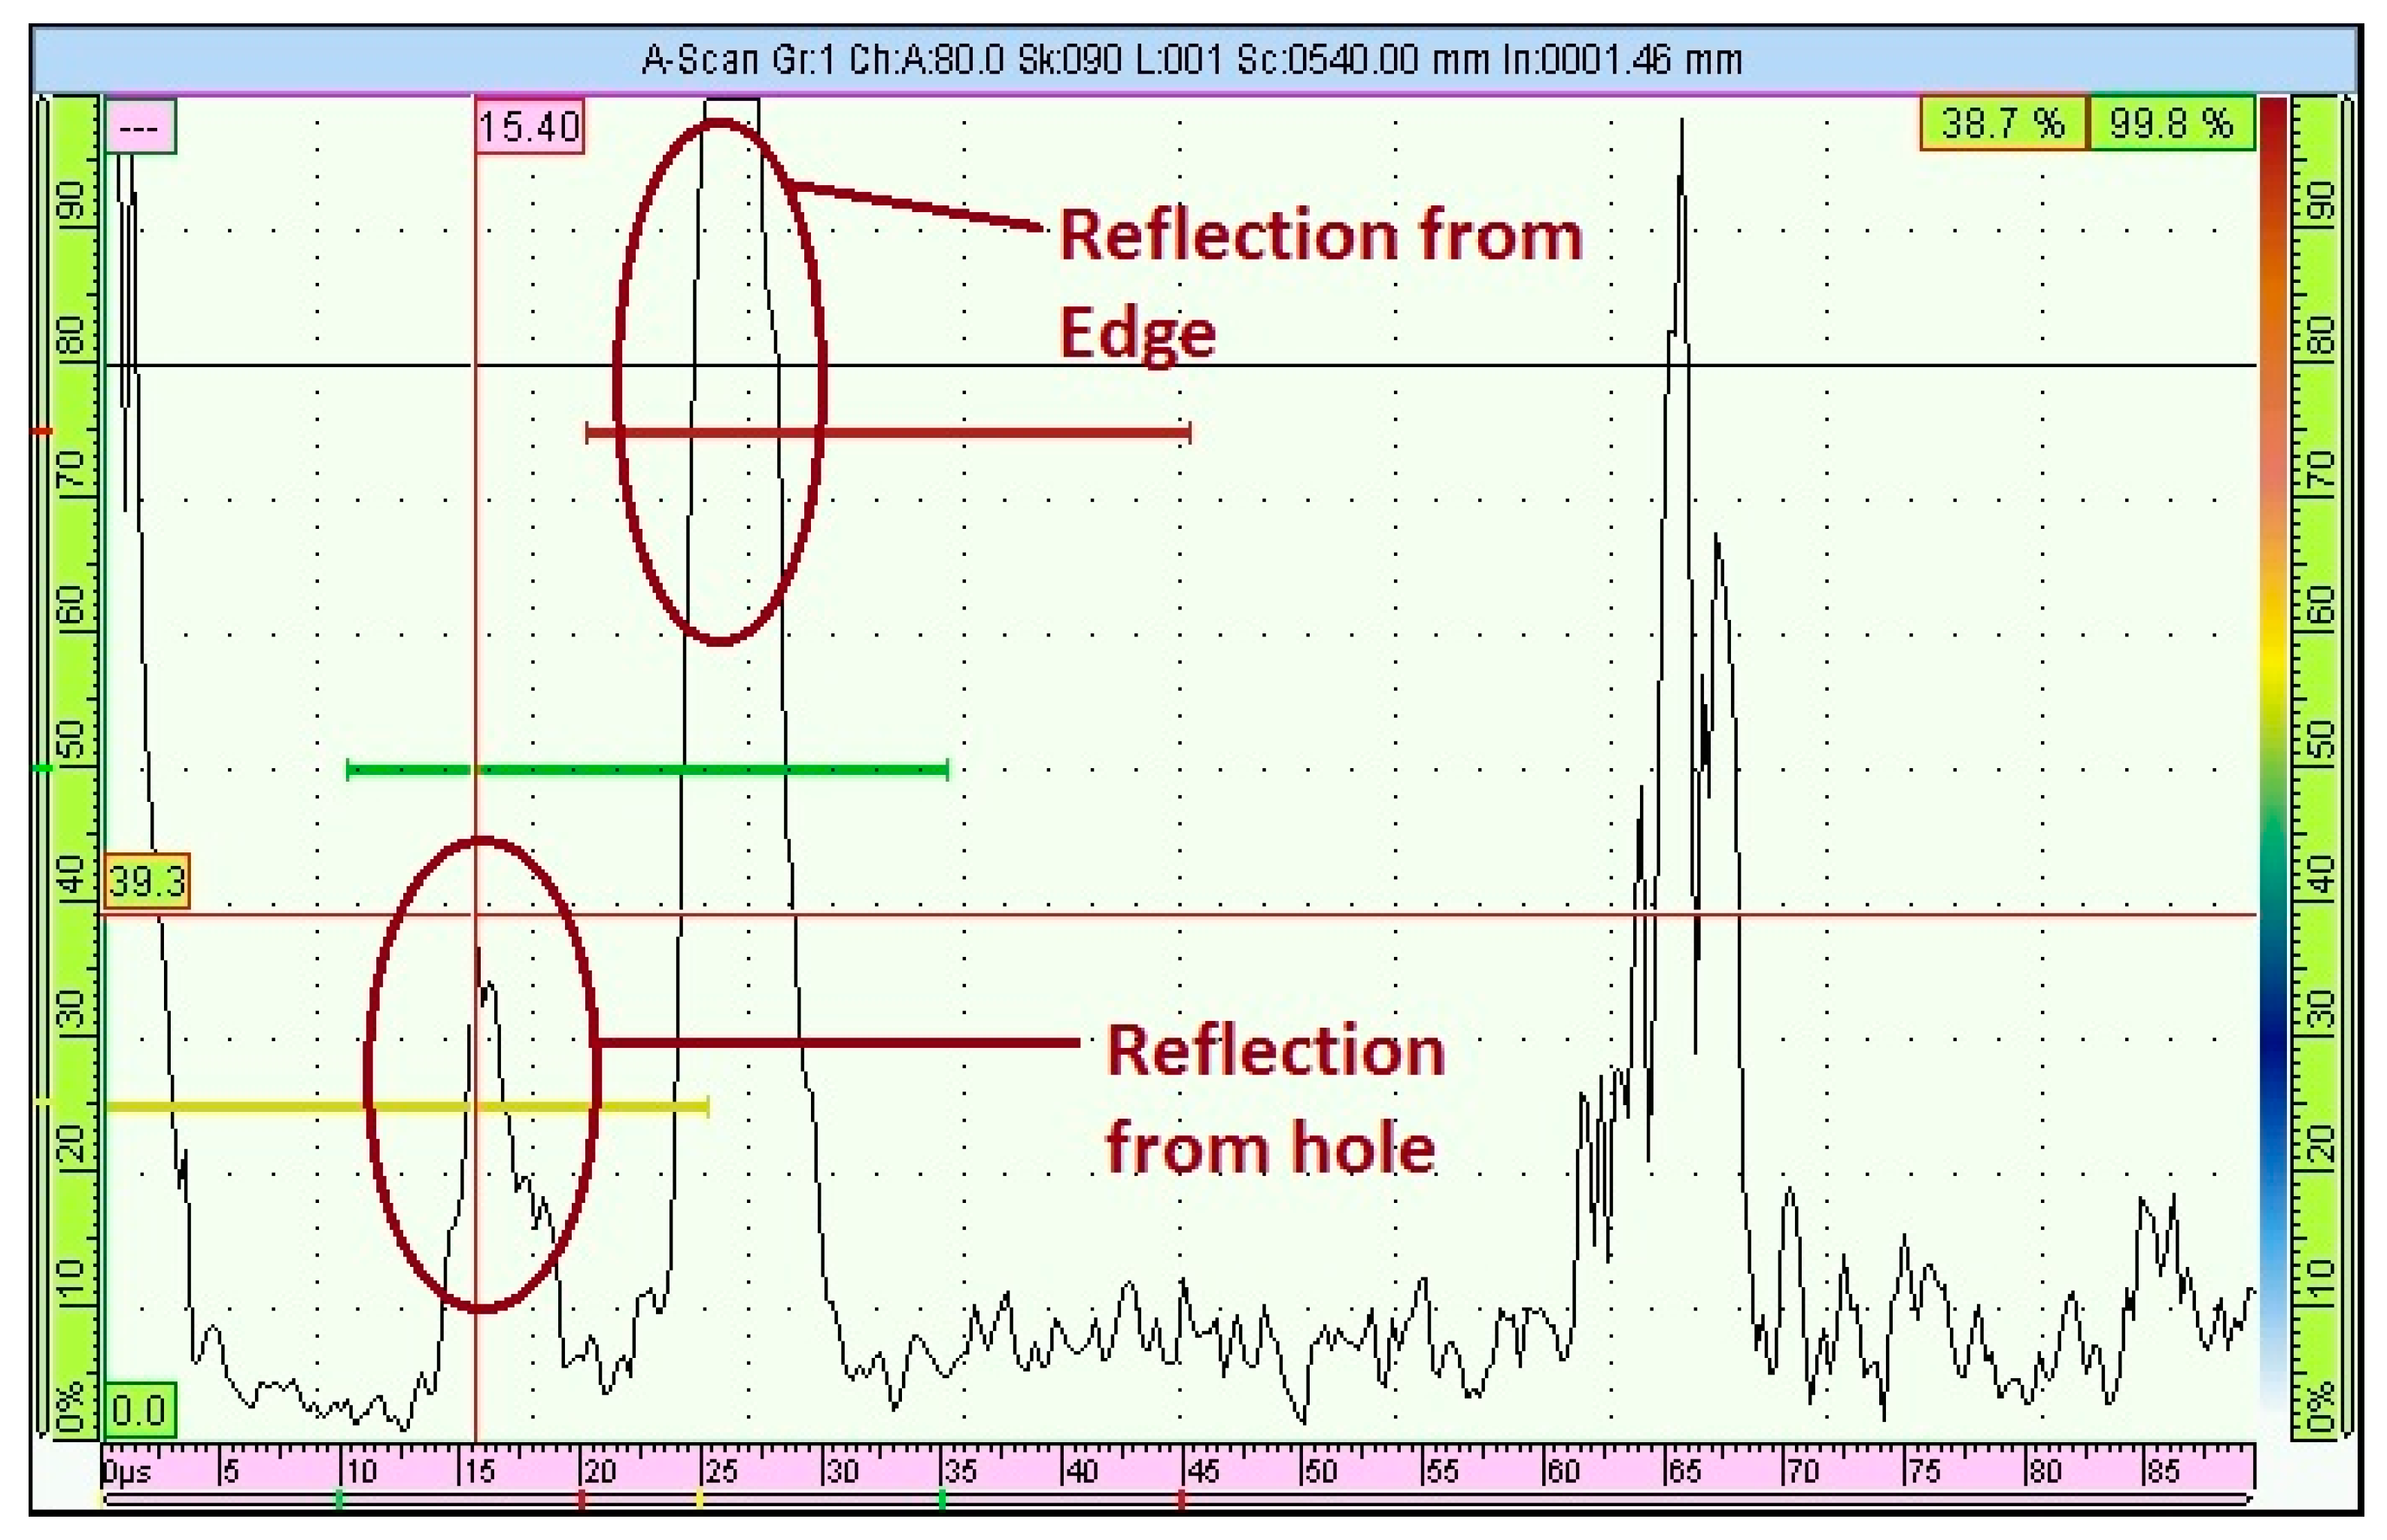
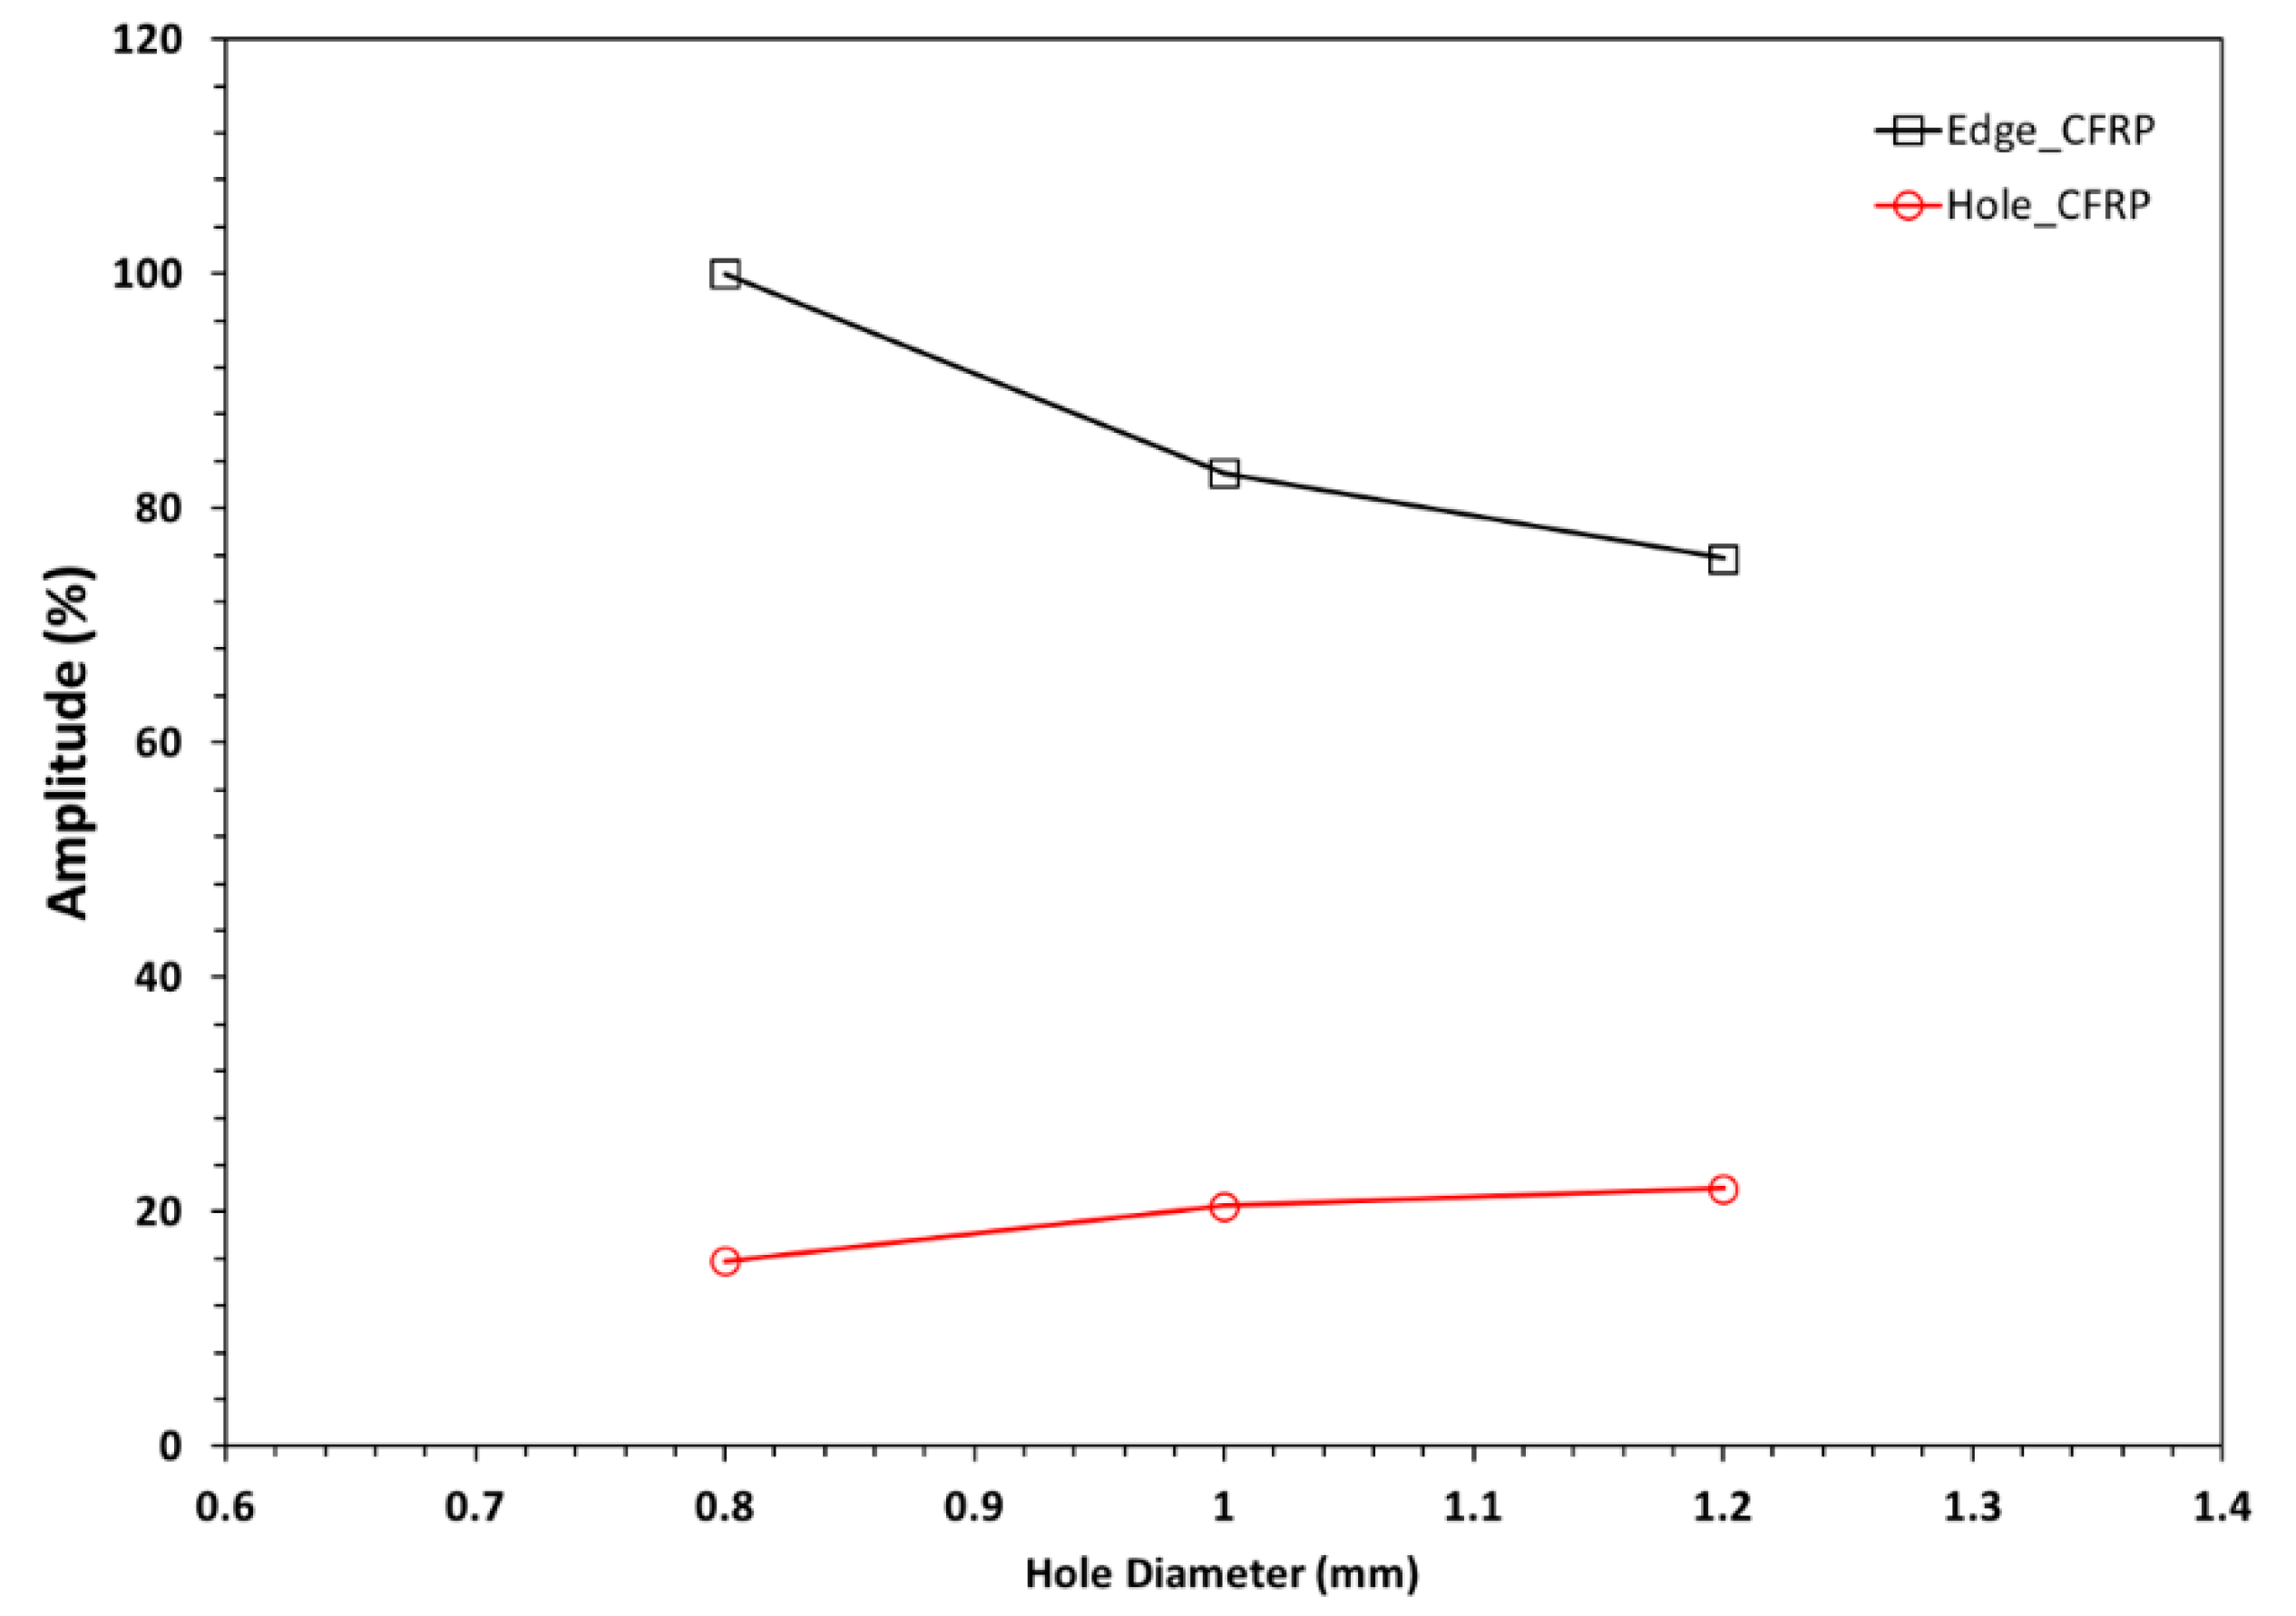
Table 5 shows the results of PAUT guided wave signal parameters for the CFRP sample. In Table 5, the arrival time of the reflection signal from the plate edge and the defect (hole) are presented (See Figure 2 for reference). The difference between the arrival times from the plate edge and from the defect (hole) was calculated. Considering the wave velocity, which was experimentally determined in a previous work [8], the distance between the plate edge and defect (hole) was determined experimentally. Comparing the distance between the plate and the defect (hole) which was determined experimentally with the actual location (as designed = 30 mm) shows that the location of the defect (hole) can be determined using the proposed technique within an acceptable range. When the size of the defect (hole) is larger, there is a better probability of detection, and the accuracy in determining the location of the defect (hole) is higher. In addition, when there is less interference between wave modes, such as in the case of larger distances, there is higher accuracy of detection. Better accuracy at larger distances occurs because, when the travelling distance for the guided waves is short, these wave modes are not stabilized and have many overlaps and low signal-to-noise ratio which cause higher inaccuracy. Figure 11 shows a typical signal for the experimental result listed in Table 5 for CFRP. Figure 12 shows the change in signal amplitude at different defect (hole) sizes for the experiments in Table 5 for CFRP. The amplitude of the signal from the plate edge is inversely proportional to the hole diameter. However, the amplitude of the signal from the hole is directly proportional to the hole diameter. As the hole diameter increases (i.e., larger defect), a larger part of the ultrasonic energy is reflected by the defect (hole), and consequently a smaller part will hit the edge.
5. Conclusions
Conventional (single-element) ultrasonic testing and phased array ultrasonic testing (PAUT) methods are evaluated for inspection of composite materials. The capability comparison tests for waves traveling through the composite materials indicate that thickness of up to 25 mm could be tested in both SEUT and PAUT methods; however, the stability of the signal parameters is higher in PAUT and detectable signal can be observed at lower gain values. The calculated velocity from the capability experimental part was 3.1 mm/μs, which is close to the estimated and expected velocities in composite plates and was used to identify the flaw’s location. From the sensitivity comparison experimental results, it can be seen that a 0.8 mm diameter hole can be detected as the minimum size by both SEUT and PAUT, but PAUT generally has a better signal regarding SNR. However, PAUT does not increase the sensitivity by a big factor, but because of lower noise and jitter and better signal characteristics it may be possible to find smaller defect sizes such as 0.7 or 0.6 mm with PAUT as well. Guided waves can also be generated using phased array ultrasonic probes and wedges with lower frequencies. Experimental results show that the different size of flaw (0.8, 1, and 1.2 mm diameter holes) can be detected by means of generated guided waves with the PAUT method. While the determination of the exact location of the flaw is affected by the dispersion characteristics of the guided waves, PAUT is a promising technique for detecting the size and location of defects in CFRP and GFRP composite materials.
Author Contributions
Conceptualization, H.T. and A.A.H.; Methodology, H.T.; Formal Analysis, H.T.; Investigation, H.T. and A.A.H.; Data Curation, H.T.; Writing—Original Draft Preparation, H.T.; Writing—Review and Editing, A.A.H.; Visualization, H.T. and A.A.H.; Supervision, A.A.H.
Funding
Research sponsored by the U.S. Department of Energy, Office of Energy Efficiency and Renewable Energy, Advanced Manufacturing Office, under contract DE-AC05-00OR22725 with UT-Battelle, LLC.
Acknowledgments
A debt of gratitude is owed to OLYMPUS NDT technical support and sales team for all their contributions to provide required equipment, support, and information.
Conflicts of Interest
The authors declare no conflict of interests. Notice of Copyright: This manuscript has been authored by UT-Battelle, LLC under Contract No. DE-AC05-00OR22725 with the U.S. Department of Energy. The United States Government retains and the publisher, by accepting the article for publication, acknowledges that the United States Government retains a non-exclusive, paid-up, irrevocable, world-wide license to publish or reproduce the published form of this manuscript, or allow others to do so, for United States Government purposes. The Department of Energy will provide public access to these results of federally sponsored research in accordance with the DOE Public Access Plan. (http://energy.gov/downloads/doe-public-access-plan).
References
- Poudel, A.; Shrestha, S.S.; Sandhu, J.S.; Chu, T.P.; Pergantis, C.G. Comparison and Analysis of Acoustography with Other NDE Techniques for Foreign Object Inclusion Detection in Graphite Epoxy Composites. Compos. Part B Eng. 2015, 78, 86–94. [Google Scholar] [CrossRef]
- Raišutis, R.; Jasiuniene, E.; Sliteris, R.; Vladišauskas, A. The review of non-destructive testing techniques suitable for inspection of the wind turbine blades. Ultrasound 2008, 63, 26–30. [Google Scholar]
- Amenabar, I.; Mendikute, A.; López-Arraiza, A.; Lizaranzu, M.; Aurrekoetxea, J. Comparison and analysis of non-destructive testing techniques suitable for delamination inspection in wind turbine blades. Compos. Part B Eng. 2011, 42, 1298–1305. [Google Scholar] [CrossRef]
- Adem, E.; Reddy, G.M.; Koricho, E.G.; Science, A.; Science, A.; Science, A.; Vehicle, C. Experimental Analysis of E-Glass/Epoxy & E-Glass/polyester Composites for Auto Body Panel. Am. Int. J. Res. Sci. Technol. Eng. Math. 2015, 10, 377–383. [Google Scholar]
- Ensminger, D.; Bond, L.J. Ultrasonics: Fundamentals, Technologies, and Applications, 3rd ed.; CRC Press: Boca Raton, FL, USA, 2011. [Google Scholar]
- Hübschen, G.; Altpeter, I.; Tschuncky, R.; Herrmann, H.-G. (Eds.) Materials Characterization Using Nondestructive Evaluation (NDE) Methods; Elsevier: Amsterdam, The Netherlands, 2016. [Google Scholar]
- Taheri, H. Classification of Nondestructive Inspection Techniques with Principal Component Analysis (PCA) for Aerospace Application. In Proceedings of the ASNT 26th Research Symposium, Jacksonville, FL, USA, 13–16 March 2017; pp. 219–227. [Google Scholar]
- Taheri, H. Utilization of Non-Destructive Testing (NDT) Methods for Composite Material Inspection (Phased array Ultrasonic). Master’s Thesis, South Dakota State University, Brookings, South Dakota, 2014. [Google Scholar]
- Wertz, J.; Homa, L.; Welter, J.; Sparkman, D.; Aldrin, J.C. Case Study of Model-Based Inversion of the Angle Beam Ultrasonic Response from Composite Impact Damage. J. Nondestr. Eval. Diagn. Progn. Eng. Syst. 2018, 1, 41001–41010. [Google Scholar] [CrossRef]
- Taheri, H.; Delfanian, F.; Du, J. Ultrasonic phased array techniques for composite material evaluation. J. Acoust. Soc. Am. 2013, 134, 4013. [Google Scholar] [CrossRef]
- Taheri, H.; Ladd, K.M.; Delfanian, F.; Du, J. Phased array ultrasonic technique parametric evaluation for composite materials. In ASME International Mechanical Engineering Congress and Exposition, Proceedings (IMECE); American Society of Mechanical Engineers: New York, NY, USA, 2014; Volume 13, p. V013T16A028. [Google Scholar]
- Caminero, M.A.; García-Moreno, I.; Rodríguez, G.P.; Chacón, J.M. Internal damage evaluation of composite structures using phased array ultrasonic technique: Impact damage assessment in CFRP and 3D printed reinforced composites. Compos. Part B Eng. 2019, 165, 131–142. [Google Scholar] [CrossRef]
- Hassen, A.A.; Taheri, H.; Vaidya, U.K. Non-destructive investigation of thermoplastic reinforced composites. Compos. Part B Eng. 2016, 97, 244–254. [Google Scholar] [CrossRef] [Green Version]
- Aldrin, J.C.; Wertz, J.N.; Welter, J.T.; Wallentine, S.; Lindgren, E.A.; Kramb, V.; Zainey, D. Fundamentals of angled-beam ultrasonic NDE for potential characterization of hidden regions of impact damage in composites. AIP Conf. Proc. 2018, 1949, 120005. [Google Scholar]
- Toyama, N.; Ye, J.; Kokuyama, W.; Yashiro, S. Non-Contact Ultrasonic Inspection of Impact Damage in Composite Laminates by Visualization of Lamb wave Propagation. Appl. Sci. 2018, 9, 46. [Google Scholar] [CrossRef]
- Castellano, A.; Fraddosio, A.; Piccioni, M.D. Quantitative analysis of QSI and LVI damage in GFRP unidirectional composite laminates by a new ultrasonic approach. Compos. Part B Eng. 2018, 151, 106–117. [Google Scholar] [CrossRef]
- Taheri, H.; Delfanian, F.; Du, J. Acoustic Emission and Ultrasound Phased Array Technique for Composite Material Evaluation. In ASME International Mechanical Engineering Congress and Exposition, Proceedings (IMECE): Advances in Aerodynamics; American Society of Mechanical Engineers: New York, NY, USA, 2013; Volume 1, p. V001T01A015. [Google Scholar]
- Bai, Z.; Chen, S.; Xiao, Q.; Jia, L.; Zhao, Y.; Zeng, Z. Compressive sensing of phased array ultrasonic signal in defect detection: Simulation study and experimental verification. Struct. Health Monit. 2017, 17, 434–449. [Google Scholar] [CrossRef]
- Taheri, H.; Du, J.; Delfanian, F. Experimental Observation of Phased Array Guided Wave Application in Composite Materials. Mater. Eval. 2017, 75, 1308–1316. [Google Scholar]
- Bolotina, I.; Borikov, V.; Ivanova, V.; Mertins, K.; Uchaikin, S. Application of phased antenna arrays for pipeline leak detection. J. Pet. Sci. Eng. 2018, 161, 497–505. [Google Scholar] [CrossRef]
- Taheri, H.; Koester, L.; Bigelow, T.; Bond, L.J.; Braconnier, D.; Carcreff, E.; Dao, A.; Caulder, L.; Hassen, A.A. Fast Ultrasonic Imaging with Total Focusing Method (TFM) for Inspection of Additively Manufactured Polymer Composite Component. In Proceedings of the 27th ASNT Research Symposium, São Paulo, Brazil, 27–29 August 2018; pp. 212–220. [Google Scholar]
- Drinkwater, B.W.; Wilcox, P.D. Ultrasonic arrays for non-destructive evaluation: A review. NDT&E Int. 2006, 39, 525–541. [Google Scholar]
- Fromme, P.; Wilcox, P.D.; Lowe, M.J.S.; Cawley, P. On the development and testing of a guided ultrasonic wave array for structural integrity monitoring. IEEE Trans. Ultrason. Ferroelectr. Freq. Control 2006, 53, 777–785. [Google Scholar] [CrossRef] [PubMed] [Green Version]
- Leleux, A.; Micheau, P.; Castaings, M. Long Range Detection of Defects in Composite Plates Using Lamb Waves Generated and Detected by Ultrasonic Phased Array Probes. J. Nondestr. Eval. 2013, 32, 200–214. [Google Scholar] [CrossRef]
- Philtron, J.H.; Rose, J.L. Guided wave phased array sensor tuning for improved defect detection and characterization. In Proc. SPIE 9063, Nondestructive Characterization for Composite Materials, Aerospace Engineering, Civil Infrastructure, and Homeland Security; International Society for Optics and Photonics: San Diego, CA, USA, 2014; p. 906306. [Google Scholar]
- Wang, W.; Zhang, H.; Lynch, J.P.; Cesnik, C.E.S.; Li, H. Experimental and numerical validation of guided wave phased arrays integrated within standard data acquisition systems for structural health monitoring. Struct. Control Health Monit. 2018, 25, e2171. [Google Scholar] [CrossRef]
- Rose, J.L. Ultrasonic guided waves in structural health monitoring. Key Eng. Mater. 2004, 270, 14–21. [Google Scholar] [CrossRef]
- Rose, J.L. Ultrasonic Guided Waves in Solid Media; Ultrasonic Guided Waves in Solid Media; Cambridge University Press: Cambridge, UK, 2014; Volume 9781107048959, pp. 1–512. [Google Scholar]
- Wilcox, P.; Lowe, M.; Cawley, P. Effect of dispersion on long-range inspection using ultrasonic guided waves. NDT E Int. 2001, 34, 1–9. [Google Scholar] [CrossRef]
- Chimenti, D.E. Guided waves in plates and their use in materials characterization. Appl. Mech. Rev. 1997, 50, 247–284. [Google Scholar] [CrossRef]
- Rose, J.L. Successes and Challenges in Ultrasonic Guided Waves for NDT and SHM. In Proceedings of the National Seminar & Exhibition on Non-Destructive Evaluation, Pune, India, 4–6 December 2009. [Google Scholar]
Figure 1.
Samples used to evaluate capability and sensitivity of defect detection in single element ultrasonic (SEUT) versus phased array ultrasonic (PAUT) methods: (a) glass fiber reinforced polymer (GFRP) samples from a wind turbine blade and (b) schematic for the artificial hole locations in GFRP sample with 25mm thickness (Thk.). Sample size is 250 × 100 × 25 (L × W × Thk.) mm. Width of the sample is 100 mm and holes drilled in the middle of the width.

Figure 2.
Schematic for the dimension and artificial holes locations in (a) Al-1 and Al-2 samples and (b) CFRP sample.
Figure 2.
Schematic for the dimension and artificial holes locations in (a) Al-1 and Al-2 samples and (b) CFRP sample.

Figure 3.
Experimental setup for capability and sensitivity evaluation: PAUT (left) and SEUT (right).
Figure 3.
Experimental setup for capability and sensitivity evaluation: PAUT (left) and SEUT (right).

Figure 4.
Experimental setup for flaw detection in CFRP sample using PAUT guided wave method.

Figure 5.
Back wall reflection experiment showing ultrasonic wave velocity evaluation measured by SEUT and PAUT methods.
Figure 5.
Back wall reflection experiment showing ultrasonic wave velocity evaluation measured by SEUT and PAUT methods.

Figure 6.
Back wall reflection signals for GFRP: (a) SEUT method and (b) PAUT method. (Freq. = 1.5 MHz, Thickness = 12 mm).
Figure 6.
Back wall reflection signals for GFRP: (a) SEUT method and (b) PAUT method. (Freq. = 1.5 MHz, Thickness = 12 mm).

Figure 7.
Gain (dB) value for back wall reflection detection in different sample thickness for attenuation characteristics evaluation using SEUT and PAUT techniques.
Figure 7.
Gain (dB) value for back wall reflection detection in different sample thickness for attenuation characteristics evaluation using SEUT and PAUT techniques.

Figure 8.
Response signal for GFRP: (a) SEUT method and (b) PAUT method. (Freq. = 1.5 MHz, Thickness = 25 mm, Hole Diameter = 0.8 mm, Hole Depth = 12mm).
Figure 8.
Response signal for GFRP: (a) SEUT method and (b) PAUT method. (Freq. = 1.5 MHz, Thickness = 25 mm, Hole Diameter = 0.8 mm, Hole Depth = 12mm).

Figure 9.
Change of signal amplitude over distance for Al-1 and Al-2 samples.

Figure 10.
Typical PAUT guided wave signal of flaw detection for (a) Al-1 sample and (b) Al-2 sample.
Figure 10.
Typical PAUT guided wave signal of flaw detection for (a) Al-1 sample and (b) Al-2 sample.

Figure 11.
Typical PAUT guided wave signal of flaw detection for CFRP sample.

Figure 12.
Change of signal amplitude over distance for CFRP samples.


Table 1.
Test samples description used for the phased array ultrasonic (PAUT) guided wave method.
| Sample Name | Material | Thickness (mm) |
|---|---|---|
| Al-1 | Aluminum 6063 (Plate) | 2.2 |
| Al-2 | Aluminum 6063 (Plate) | 0.635 |
| CFRP | Unidirectional Carbon Fiber Composite (5 layers of carbon fiber fabric) | 1.0 |
Table 2.
Signal characteristics of back wall reflection for SEUT method with different frequencies and PAUT method.
Table 2.
Signal characteristics of back wall reflection for SEUT method with different frequencies and PAUT method.
| Frequency | Method | Sample | Thickness (mm) | Gain (dB) | Time | Signal-to-Noise Ratio |
|---|---|---|---|---|---|---|
| 0.5 MHz | SEUT | GFRP | 4 | 42 | 5.01 | 7.95 |
| 10 | 55.8 | 9.87 | 3.99 | |||
| 12 | 60.5 | 11.01 | 3.07 | |||
| 18 | 61 | 14.73 | 2.98 | |||
| 25 | 64.7 | 18.92 | 2.53 | |||
| 1 MHz | SEUT | GFRP | 4 | 18.5 | 4.76 | 5.31 |
| 10 | 36 | 8.56 | 11.93 | |||
| 12 | 39.6 | 9.80 | 11.75 | |||
| 18 | 41.2 | 13.60 | 11.10 | |||
| 25 | 45.9 | 18.35 | 9.57 | |||
| 1.5 MHz | SEUT | GFRP | 4 | 15.5 | 4.67 | 5.14 |
| 10 | 37 | 8.48 | 11.75 | |||
| 12 | 40.8 | 9.76 | 11.10 | |||
| 18 | 43 | 13.55 | 9.51 | |||
| 25 | 46.7 | 18.25 | 9.43 | |||
| 1.5 MHz | PAUT | GFRP | 4 | 13 | 3.64 | 6.10 |
| 10 | 27 | 7.56 | 5.44 | |||
| 12 | 28.5 | 8.93 | 5.81 | |||
| 18 | 36 | 12.49 | 3.39 | |||
| 25 | 40 | 17.41 | 3.22 |
Table 3.
Signal parameters for flaw detection in Al-1 sample.
| Experimental Setup Parameters for PAUT Guided Wave Inspection of Al-1 Sample | ||||||||
| Frequency (MHz) | Thickness (mm) | Gain (dB) | Element Qty.1 | fd2 | Element Step3 | |||
| 1.5 | 2.2 | 30 | 4 | 3.3 | 1 | |||
| 1 Number of active elements at each sequence in phased array ultrasound transducer 2 frequency plate thickness 3 Incremental steps in terms of number of elements at each sequence | ||||||||
| Defect Detection Signal Characteristics | ||||||||
| Experimental Trials # | Hole Diameter (mm) | Signal | Distance of Transducer from The Edge (mm) | Arrival Time (us) | DTime (us) | Amplitude (%) | ||
| Edge | Hole | Edge | Hole | |||||
| 1 | 1 | Edge/Hole | 50 | 58.07 | 47.61 | 10.5 | 53.9 | 46.6 |
| 2 | Edge/Hole | 100 | 87.99 | 70.27 | 17.7 | 33.1 | 24.3 | |
| 3 | Edge/Hole | 150 | 109.77 | 92.34 | 17.4 | 10.3 | 21.1 | |
Table 4.
Signal parameters for flaw detection for Al-2.
| Experimental Setup Parameters for PAUT Guided Wave Inspection of Al-2 Sample | ||||||||
| Frequency (MHz) | Thickness (mm) | Gain (dB) | Element Qty.1 | fd2 | Element Step3 | |||
| 1.5 | 0.635 | 30 | 4 | 0.96 | 1 | |||
| 1 Number of active elements at each sequence in phased array ultrasound transducer 2 frequency plate thickness 3 Incremental steps in terms of number of elements at each sequence | ||||||||
| Defect Detection Signal Characteristics | ||||||||
| Experimental Trial # | Hole Diameter(mm) | Signal | Distance of Transducer from The Edge (mm) | Arrival Time (us) | DTime (us) | Amplitude (%) | ||
| Edge | Hole | Edge | Hole | |||||
| 1 | 1 | Edge/Hole | 50 | 39.19 | 28.15 | 11.0 | 100 | 15.5 |
| 2 | Edge/Hole | 100 | 57.78 | 46.45 | 11.3 | 100 | 11.5 | |
| 3 | Edge/Hole | 175 | 85.08 | 74.34 | 10.7 | 82.7 | 7.8 | |
| 4 | Edge/Hole | 200 | 94.09 | 83.05 | 11.0 | 77.7 | 4.5 | |
Table 5.
Signal parameters for flaw detection for CFRP.
| Experimental Setup Parameters for PAUT Guided Wave Inspection of CFRP | |||||||
| Frequency (MHz) | Thickness(mm) | Gain (dB) | Element Qty.1 | fd2 | Element Step3 | ||
| 1.5 | 1 | 35 | 4 | 1.5 | 1 | ||
| 1 Number of active elements at each sequence in phased array ultrasound transducer 2 frequency plate thickness 3 Incremental steps in terms of number of elements at each sequence | |||||||
| Defect Detection Signal Characteristics | |||||||
| Experimental Trial # | Hole Diameter(mm) | Signal | Distance of Transducer from The Edge(mm) | Arrival Time (us) (Edge/Hole) | DTime (us) | Ddist (mm) | |
| Edge | Hole | ||||||
| 1 | 0.8 | Edge/Hole | 50 | 25.64 | 13.81 | 11.83 | 48.9 |
| 2 | Edge/Hole | 100 | 35.6 | 24.54 | 11.06 | 45.7 | |
| 3 | Edge/Hole | 150 | 46.11 | 37.08 | 9.03 | 37.3 | |
| 1 | 1 | Edge/Hole | 50 | 26.76 | 14.07 | 12.69 | 52.5 |
| 2 | Edge/Hole | 100 | 35.62 | 26.11 | 9.51 | 39.3 | |
| 3 | Edge/Hole | 150 | 45.97 | 37.28 | 8.69 | 35.9 | |
| 1 | 1.2 | Edge/Hole | 50 | 24.52 | 14.11 | 10.41 | 43.0 |
| 2 | Edge/Hole | 100 | 36.24 | 26.89 | 9.35 | 38.6 | |
| 3 | Edge/Hole | 150 | 46.25 | 37.36 | 8.89 | 36.7 | |
© 2019 by the authors. Licensee MDPI, Basel, Switzerland. This article is an open access article distributed under the terms and conditions of the Creative Commons Attribution (CC BY) license (http://creativecommons.org/licenses/by/4.0/).
Share and Cite
MDPI and ACS Style
Taheri, H.; Hassen, A.A. Nondestructive Ultrasonic Inspection of Composite Materials: A Comparative Advantage of Phased Array Ultrasonic. Appl. Sci. 2019, 9, 1628. https://0-doi-org.brum.beds.ac.uk/10.3390/app9081628
AMA Style
Taheri H, Hassen AA. Nondestructive Ultrasonic Inspection of Composite Materials: A Comparative Advantage of Phased Array Ultrasonic. Applied Sciences. 2019; 9(8):1628. https://0-doi-org.brum.beds.ac.uk/10.3390/app9081628
Chicago/Turabian StyleTaheri, Hossein, and Ahmed Arabi Hassen. 2019. "Nondestructive Ultrasonic Inspection of Composite Materials: A Comparative Advantage of Phased Array Ultrasonic" Applied Sciences 9, no. 8: 1628. https://0-doi-org.brum.beds.ac.uk/10.3390/app9081628
Note that from the first issue of 2016, this journal uses article numbers instead of page numbers. See further details here.