Embedded Based Real-Time Monitoring in the High-Pressure Resin Transfer Molding Process for CFRP


1
School of Mechanical Engineering, Pusan National University, 2, Busandaehak-ro 63beon gil, Geumjeong-gu, Busan 46241, Korea
2
Precision Manufacturing & Control R&D Group, Korea Institute of Industrial Technology, Busan 46938, Korea
*
Author to whom correspondence should be addressed.
Appl. Sci. 2019, 9(9), 1795; https://0-doi-org.brum.beds.ac.uk/10.3390/app9091795
Submission received: 15 March 2019
/
Revised: 11 April 2019
/
Accepted: 24 April 2019
/
Published: 29 April 2019
(This article belongs to the Section Mechanical Engineering)
Abstract
:Carbon Fiber Reinforced Plastics (CFRP) is a material developed for its high strength and light weight in a broad variety of industries including aerospace, automotive, and leisure. Due to the rapid molding cycle time, high-pressure resin transfer molding (HP-RTM) processes are prone to molding defects and susceptible to various process variables such as the resin injection rate, pressure and temperature in the mold, vacuum, end-gap, pressing force, and binder. In recent years, process monitoring technology with various sensors has been applied to stabilize the HP-RTM process and control process variables. The field-programmable gate array (FPGA) based embedded monitoring system proposed in this study enabled high-speed real-time signal processing with multiple sensors, namely pressure, temperature, and linear variable differential transformer (LVDT), and proved feasibility in the field. In the HP-RTM process, the impregnation and curing of the resin were predicted from the cavity pressure and temperature variations during the injection and curing stages. In addition, the thickness of the CFRP specimen was deduced from the change in the end-gap through the detection of the LVDT signal. Therefore, the causes of molding defects were analyzed through process monitoring and the influence of molding defects on the molding quality of CFRP was investigated.
1. Introduction
Carbon fiber reinforced plastics (CFRP) are materials that are developed for their high strength and light weight in various industries, including aerospace, automotive, and leisure. The mechanical properties of CFRP such as its strength, allowable stress, and hardness are affected by the type of carbon fiber, resin, and lamination orientation [1,2]. In particular, numerous studies have investigated various molding methods as the application of CFRP has increased in the automotive industry due to greenhouse gas emission regulation and fuel efficiency improvement requirements. Typical CFRP molding methods include hand lay-up, filament winding, pultrusion, autoclaving, and resin transfer molding (RTM) [3,4,5]. Compared to other approaches, RTM molding has the advantages of simplicity and low manufacturing costs. However, it is difficult to apply RTM molding in mass production because it has a long process cycle time and low production efficiency [6,7,8].
In the RTM process, a carbon fiber preform is placed into a mold, which into resin is injected at a low pressure (in the range 1–20 bar) to impregnate the fiber, and vacuum is applied to accelerate the diffusion of the resin. Furthermore, a high-pressure RTM process was reported as improving the classical RTM process for the mass production of CFRP. Unlike classical RTM processes, fast-curing resins are mixed with epoxy resin and hardener at high pressure in the mixing head and are then injected at the maximum pressure of 150 bar. The compression force leads to high cavity pressure in the mold. [9]. The HP-RTM consists of a high-pressure metering pump for precise flow control and a self-cleaning mixing head that has the advantages of high flow rates and short shot times. The molding cycle is completed in approximately 10 min using a thermosetting resin within a short reaction time [10,11].
However, the fast cycle times and the various process variables mean that the HP-RTM process has many limitations. The process variables that affect the CFRP molding quality include the resin injection rate, the pressure and temperature in the mold, the vacuum, end-gap, pressing force, and binder. In recent years, the process condition monitoring of molding using different types of sensors has been extensively studied to stabilize the HP-RTM process and control the process variables. For instance, Schmachtenberg et al. used an ultrasonic sensor to monitor the curing state of resin in the RTM process [12]. Controlling the RTM process, shortening the process cycle time, and optimizing the laminate quality were studied using ultrasonic sensor signals. Furthermore, Henning et al. and Moghaddam et al. used a pressure sensor to analyze the HP-RTM process and monitor the effects of process variables. Specifically, the authors analyzed the relationship between the molding quality and the flow of resin from the signal of the cavity pressure sensor and the mechanical properties according to process variables [13,14,15]. Likewise, Bickerton et al. investigated the relationship between the pressing force and reaction temperature through the degree of cure by detecting the reaction temperature of the laminate [16]. Additionally, Yildiz et al. and Dunkers et al. measured the change in the light refracted by the resin during the curing process with fiber-optic sensors [17,18]. Kikuchi et al. used dielectric and optical sensors installed in the mold to detect the curing state of the resin [19]. Bellini et al. detected the cure degree of laminates by the developed dielectric coplanar plates sensor in glass–epoxy prepregs [20]. Krawczak et al. monitored the flow and the cure of CFRP using the electric and dielectric carbon fiber sensors to provide damage and preventive maintenance [21]. However, the results of the analysis of the HP-RTM process monitoring undertaken in previous studies are limited in terms of their applicability in the field. While the dielectric sensor and electric-resistance sensor can be built-in to the mold, they must be electrically isolated from the conductive carbon fiber. Moreover, this is only applicable in the inside of a mold with uniform pressure and requires an expensive spectrum analyzer. Temperature sensors such as thermocouples are inexpensive to install but have been proposed for one-off research.
The specifications of the monitoring system proposed in the present study were determined based on the design of the mold, mixing head, and metering pump through HP-RTM process analysis. The feasibility of its application was confirmed by developing an FPGA-based embedded system that was capable of high-speed signal processing for real-time onsite monitoring. In addition, the causes of molding defects were analyzed by process monitoring based on pressure, temperature, and LVDT signals. Finally, we also considered what effects could influence the CFRP quality.
2. High-Pressure RTM
2.1. HP-RTM Process Parameter
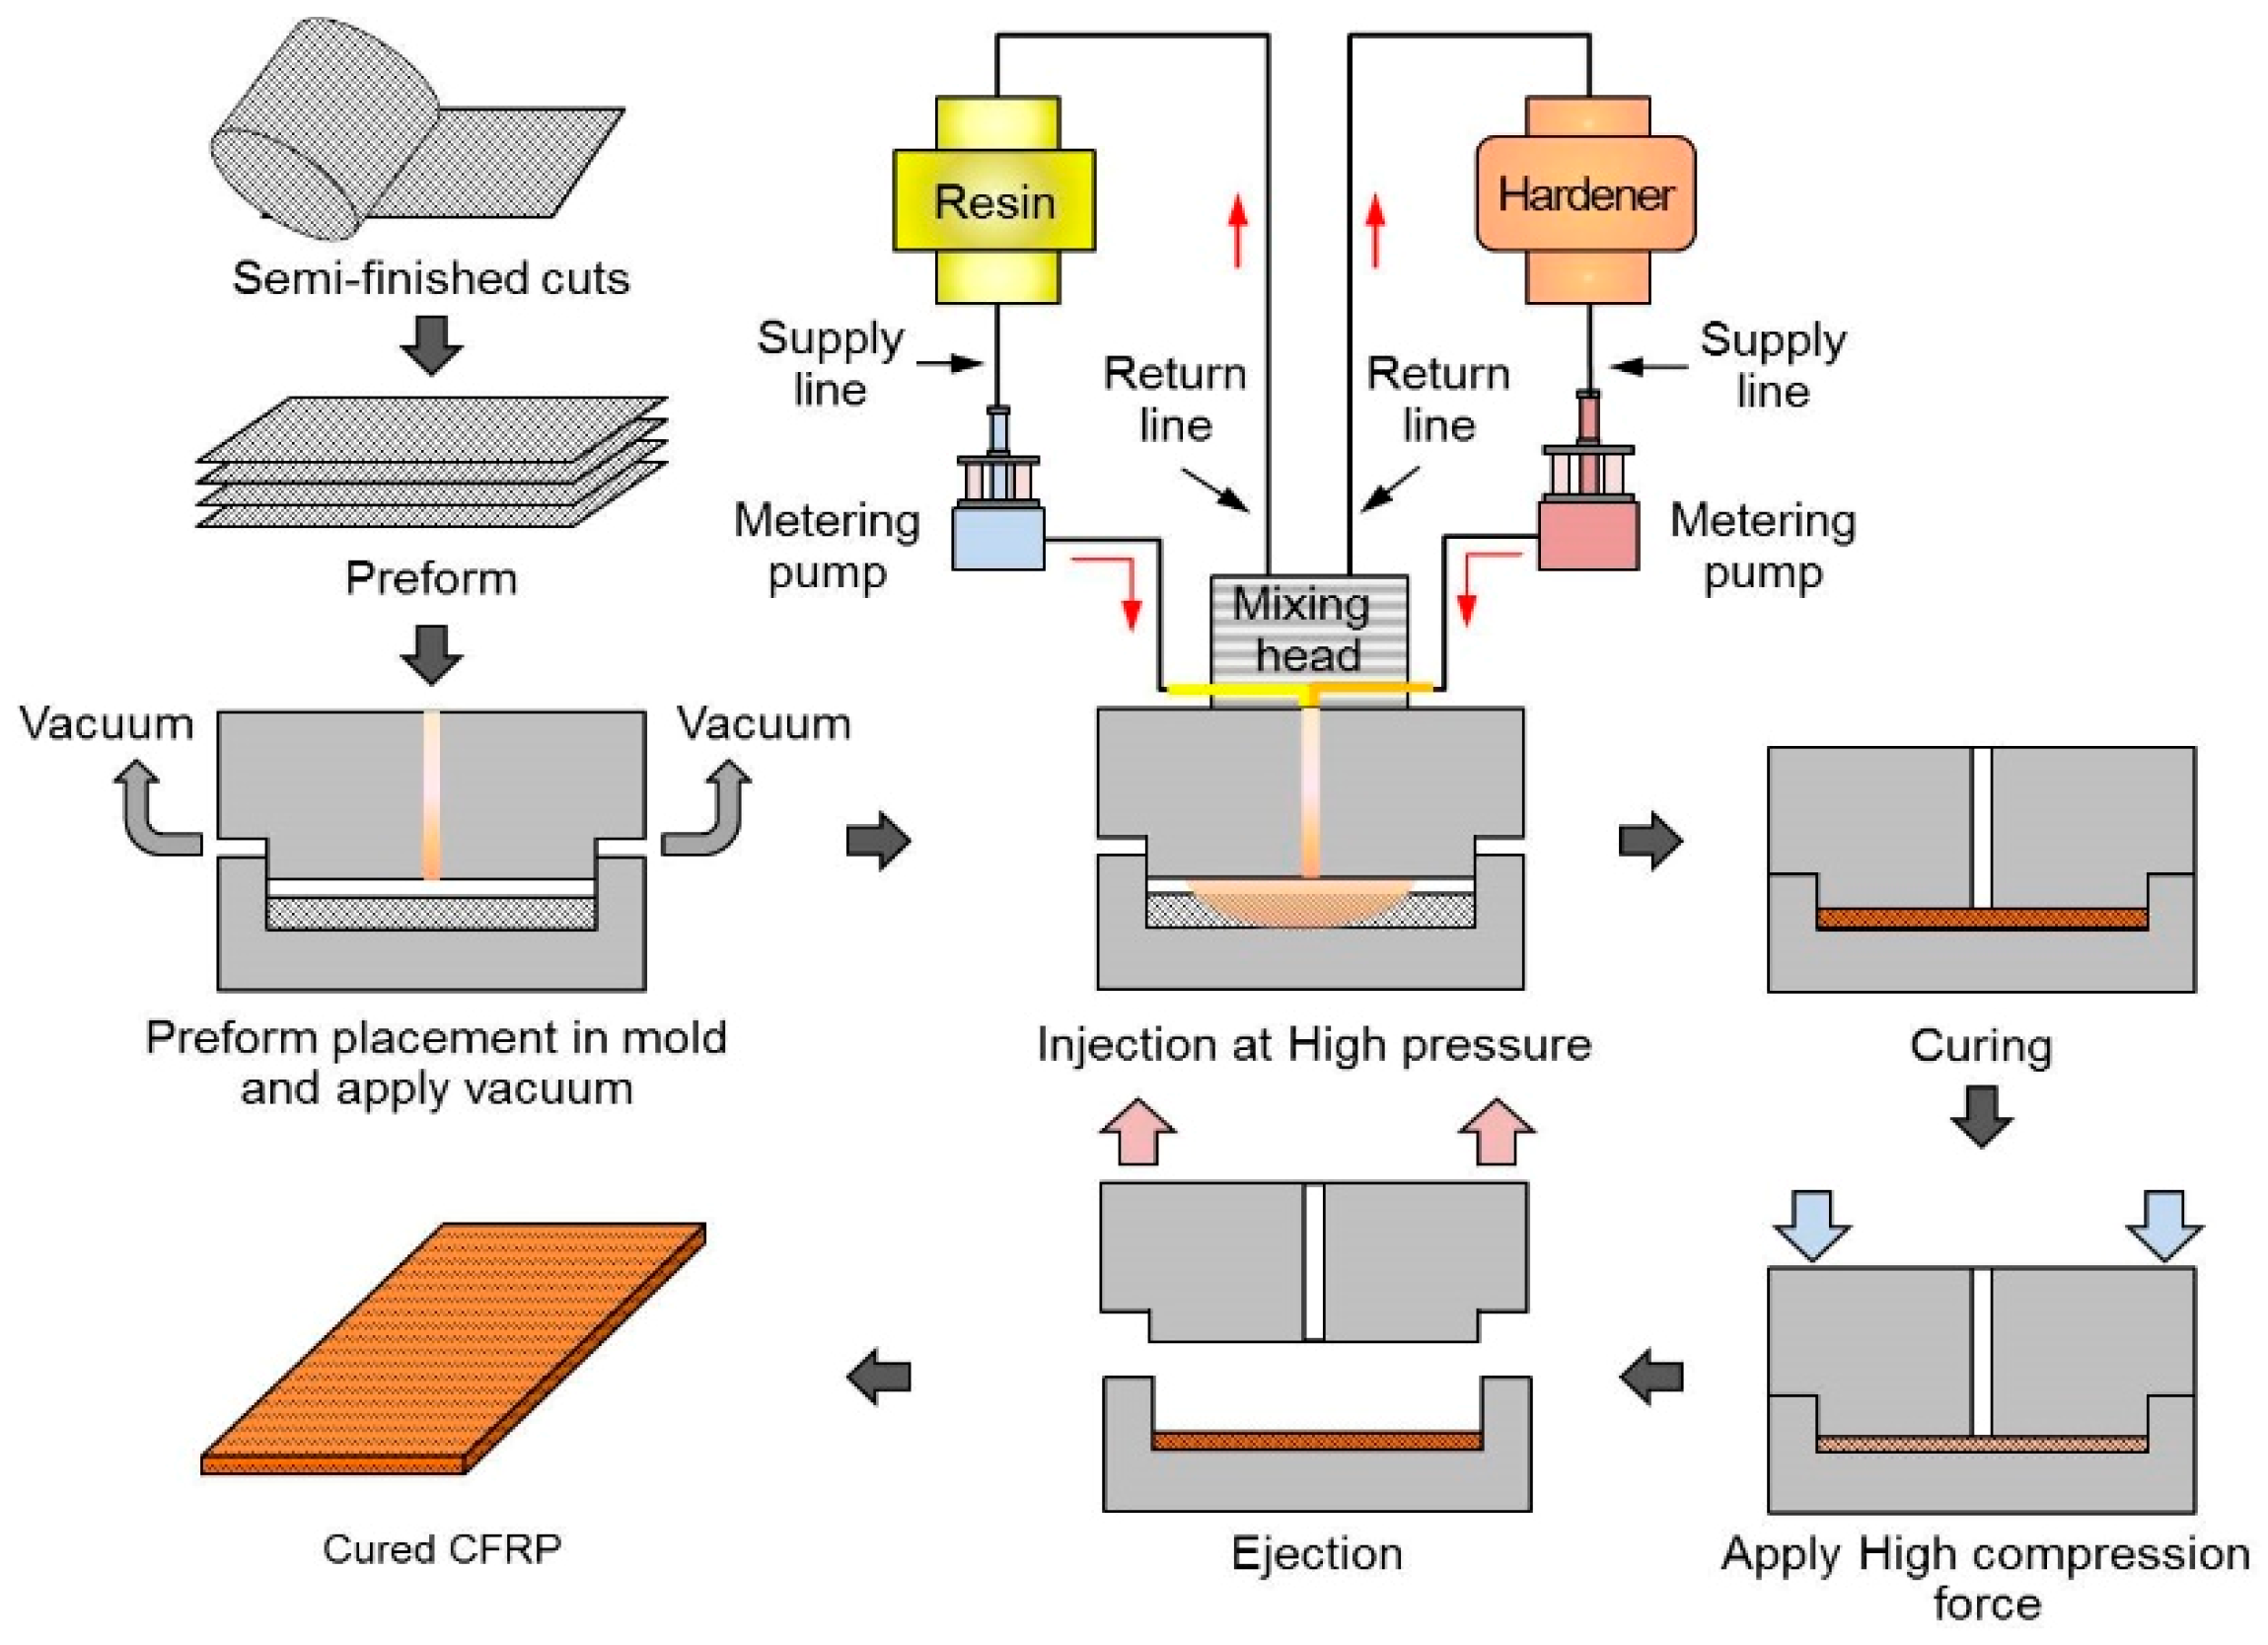
Figure 1 shows a detailed view of the HP-RTM process. Due to the high-pressure force applied to the mold and the high injection pressure in the mixing head, the HP-RTM forms a fast resin flow within the cavity mold. The epoxy resin supply system consists of a temperature-controlled storage tank of resin and hardener, metering pumps, and piping lines. The storage tank maintains the resin at a constant temperature makes the resin in the mixing head to be injected easily. The high-pressure metering pump discharges at a constant flow rate and the piping line minimizes heat loss during the circulation of resin by the hot wire. In the HP-RTM process, a carbon fiber preform is placed on the mold, the mold gap is maintained constant, and the resin and curing agent are mixed at high pressure in the mixing head and then injected into the preform. When the resin is filled, the laminate is compressed by pressing. Here, the resin diffuses from the upper surface to the lower surface (i.e., vertically) by compression force. The impregnation rate can be increased by the vacuum and temperature in the mold, the compression force, the mold opening/closing speed, and so on, when the carbon fiber preform is impregnated with resin.
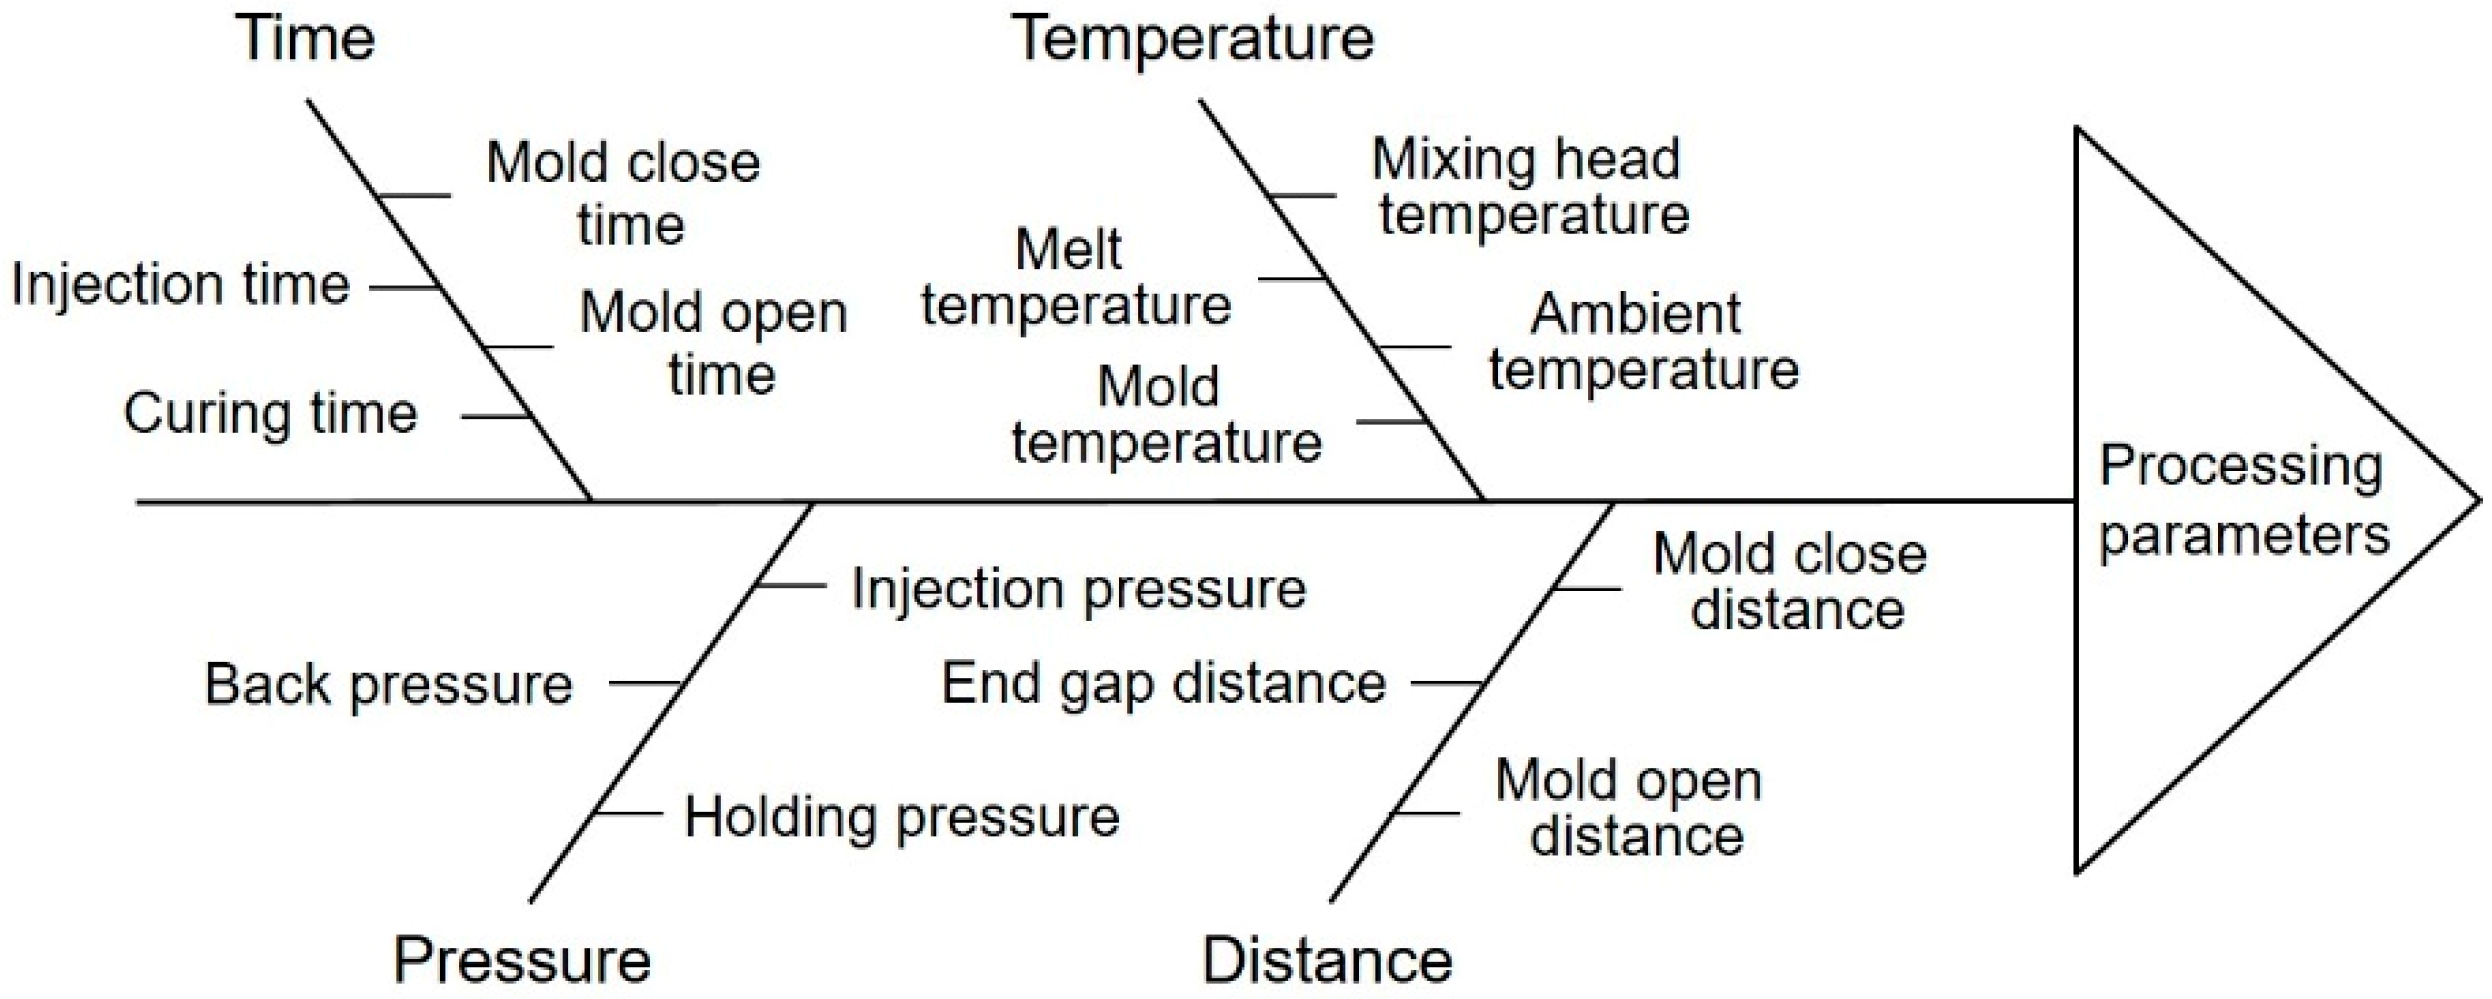
Figure 2 shows the process parameters of HP-RTM. The HP-RTM parameters that affecting the molding quality in the HP-RTM process include the initial temperature of the storage tank, the discharge of resin from the metering pump, the resin temperature and injection pressure of the mixing head, the compression force of the press, the temperature and pressure of the mold, the pressure, end-gap, mold opening/closing time, and vacuum. The temperature factor determines the viscosity of the resin. When the temperature of the resin is low, injection is difficult due to the low viscosity. When the temperature is high, the resin is cured before diffusing throughout the entirety of the carbon fiber preform. When the pressure of the mixing head is low in the HP-RTM injection process, the diffusion rate of the resin decreases and is cured before the impregnation of the resin has completed. When the injection pressure is high, the preform layer is distorted [22]. In the HP-RTM compression and curing step, the mold temperature forms the reaction temperature to cure the resin and the compression force is an important factor in the diffusion and impregnation of the resin, which affects the mechanical properties of CFRP, such as the tensile and flexural strength [23]. The end-gap of the mold and the mold opening/closing time affect the void generation inside the CFRP [24]. The molding cycle time is a factor related to the production efficiency, which includes the injection, compression, and curing time of the resin; furthermore, since the curing time is fast in a high-temperature mold, the forming time is reduced but the resin impregnation is difficult and the bonding force between the fiber layers remains low.
2.2. Effects of Process Parameters
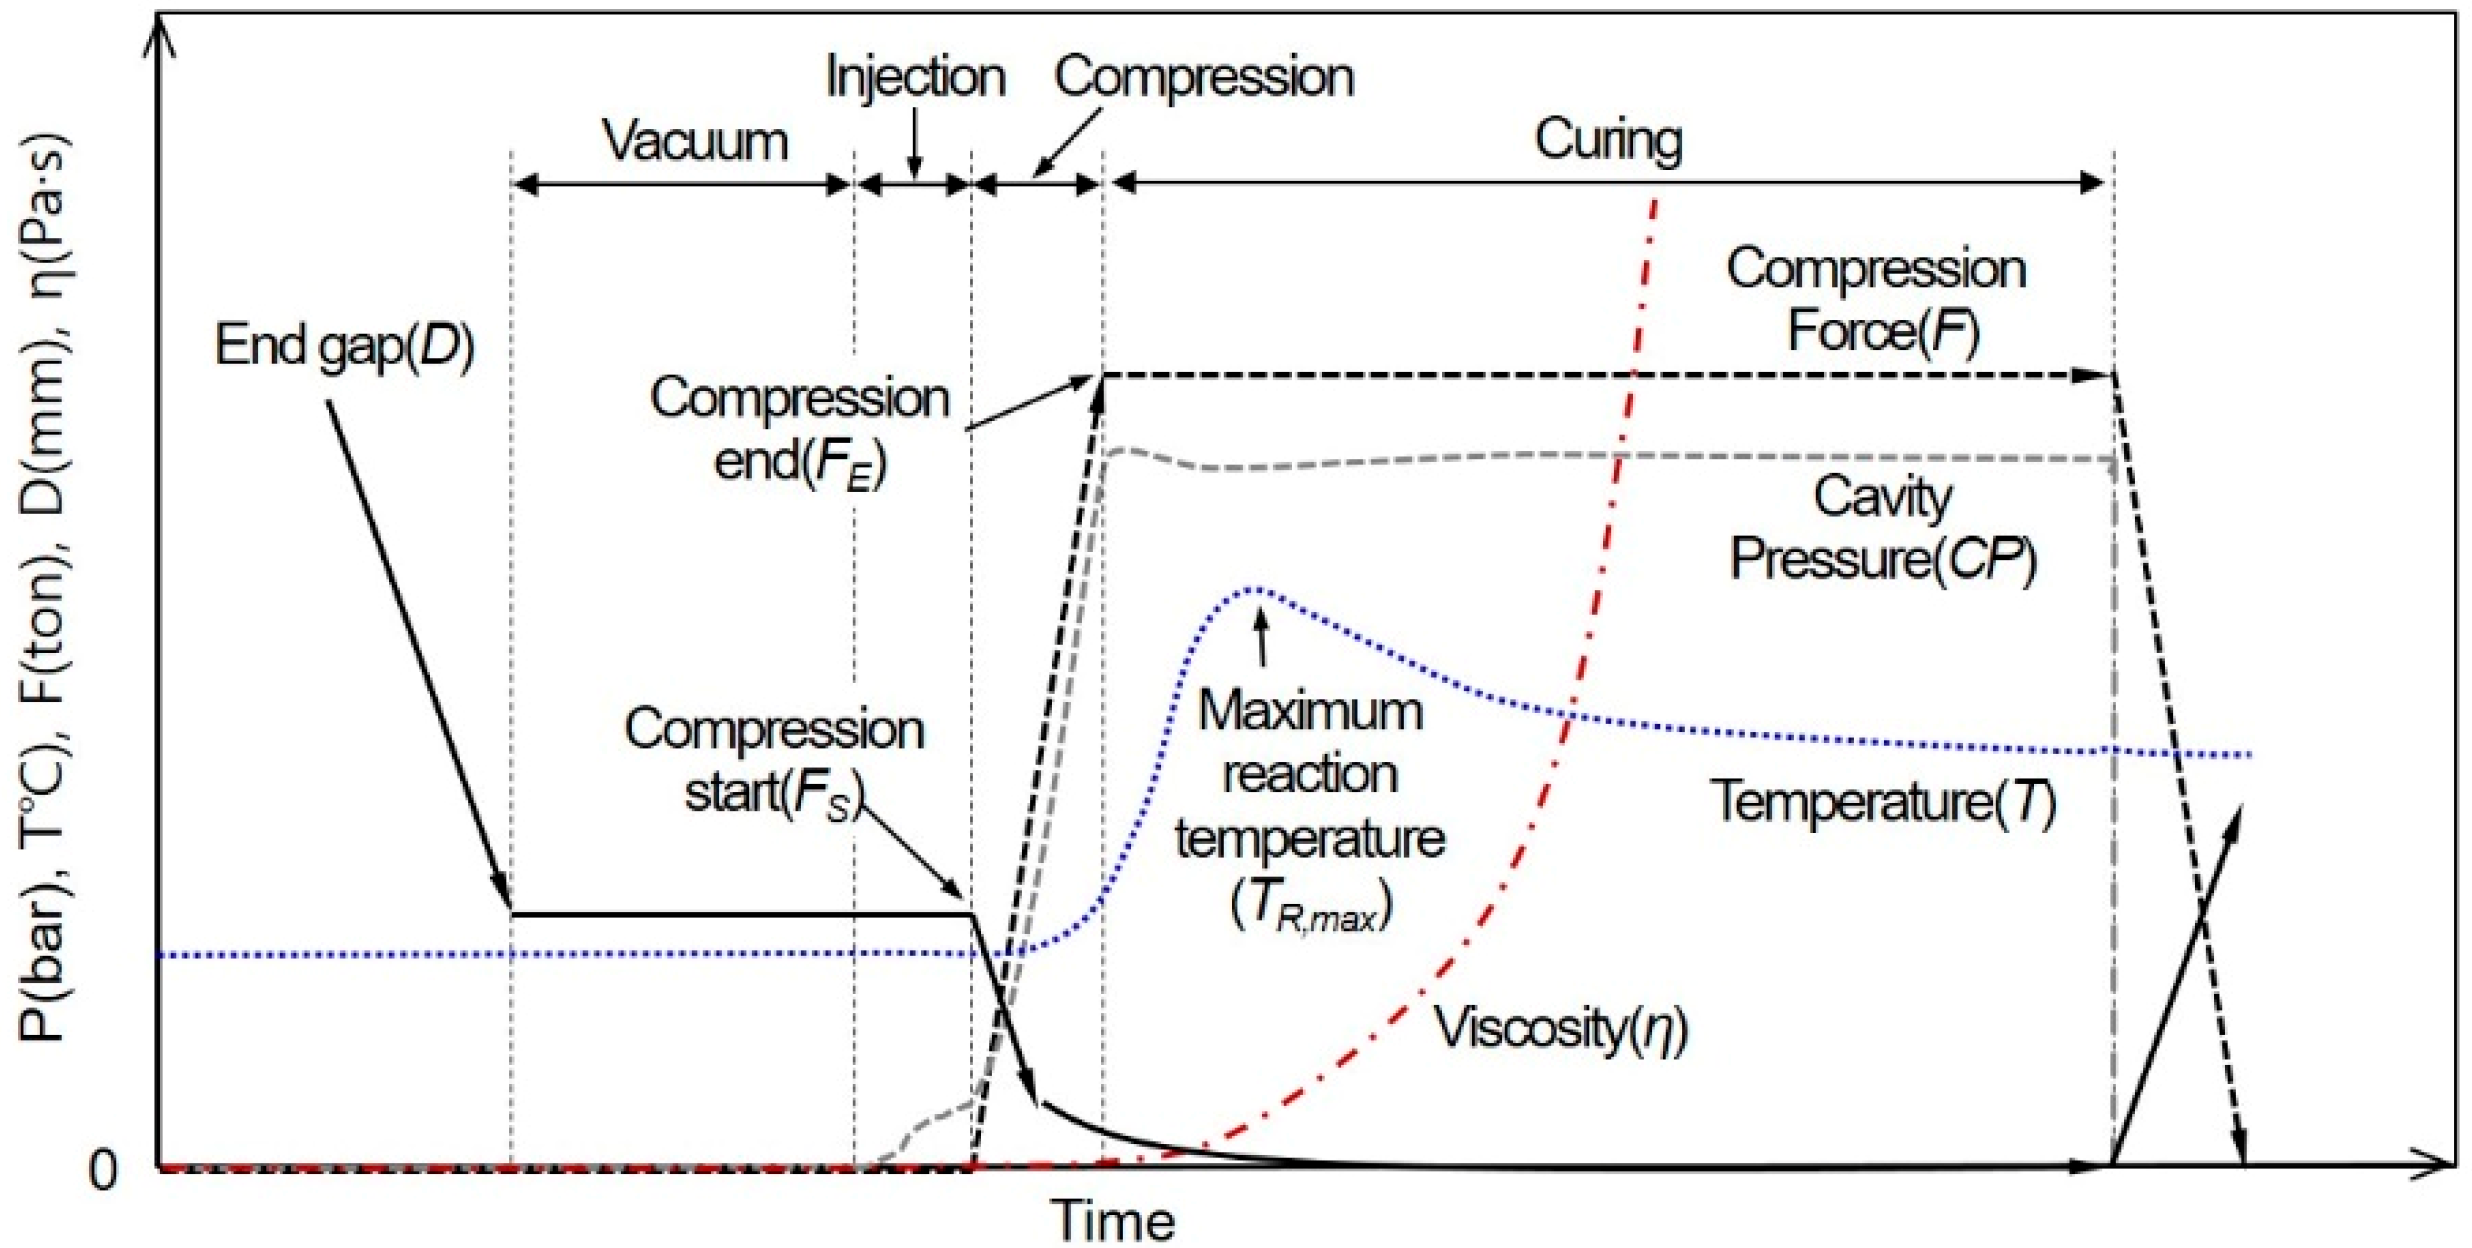
Figure 3 shows the steps in the HP-RTM process that vary according to time. A vacuum is applied inside the mold while the end-gap (D) of the mold is kept constant. The application of the vacuum step creates a significantly better impregnation quality and lower void content. The compression force (F) applied to the mold in the vacuum step is 0 kN and the cavity pressure (CP) is 0 bar due to the end-gap. The injection step is simultaneously impregnated down to the bottom of CFRP preform as high-pressure resin spreads along the preform surface through the end-gap. At the end of the injection step, a complete impregnation is made by applying the compression force. When the pressing force reaches a set value (FE), the cavity pressure reaches its maximum. The increased internal pressure in the molds increases the reaction rate and accelerates the exothermic reaction [25]. When the increase in temperature reaches the maximum reaction temperature (TR,max), the reaction between the resin and the hardener terminates and the degree of cure in the resin increases. The thermoset resin is injected as a liquid and ends as a solid by the curing reaction due to the mold heat. The curing reaction begins and the curing shrinkage varies linearly with the degree of curing. Therefore, the pressure decreases when the resin shrinks in the mold [26]. When the reaction has completed, the cavity pressure is maintained at a constant. The temperature gradually decreases and falls close to the mold temperature and the thickness of the shrunk resin decreases. Thereafter, the press compresses as the same force increases to further shrink the volume of the resin while the force control of the press remains constant. Furthermore, the end-gap decreases in proportion to how much the resin shrinks. After applying the holding pressure to maintain the required CFRP laminate properties and shape, the molding is complete. Therefore, it is possible to monitor the resin filling, impregnation, curing, etc., by detecting the resin temperature and cavity pressure in the mold. In addition, for measuring the end-gap, it is possible to know the balance state of the mold and thus indirectly predict the final thickness of CFRP.
2.3. Sensor Layout
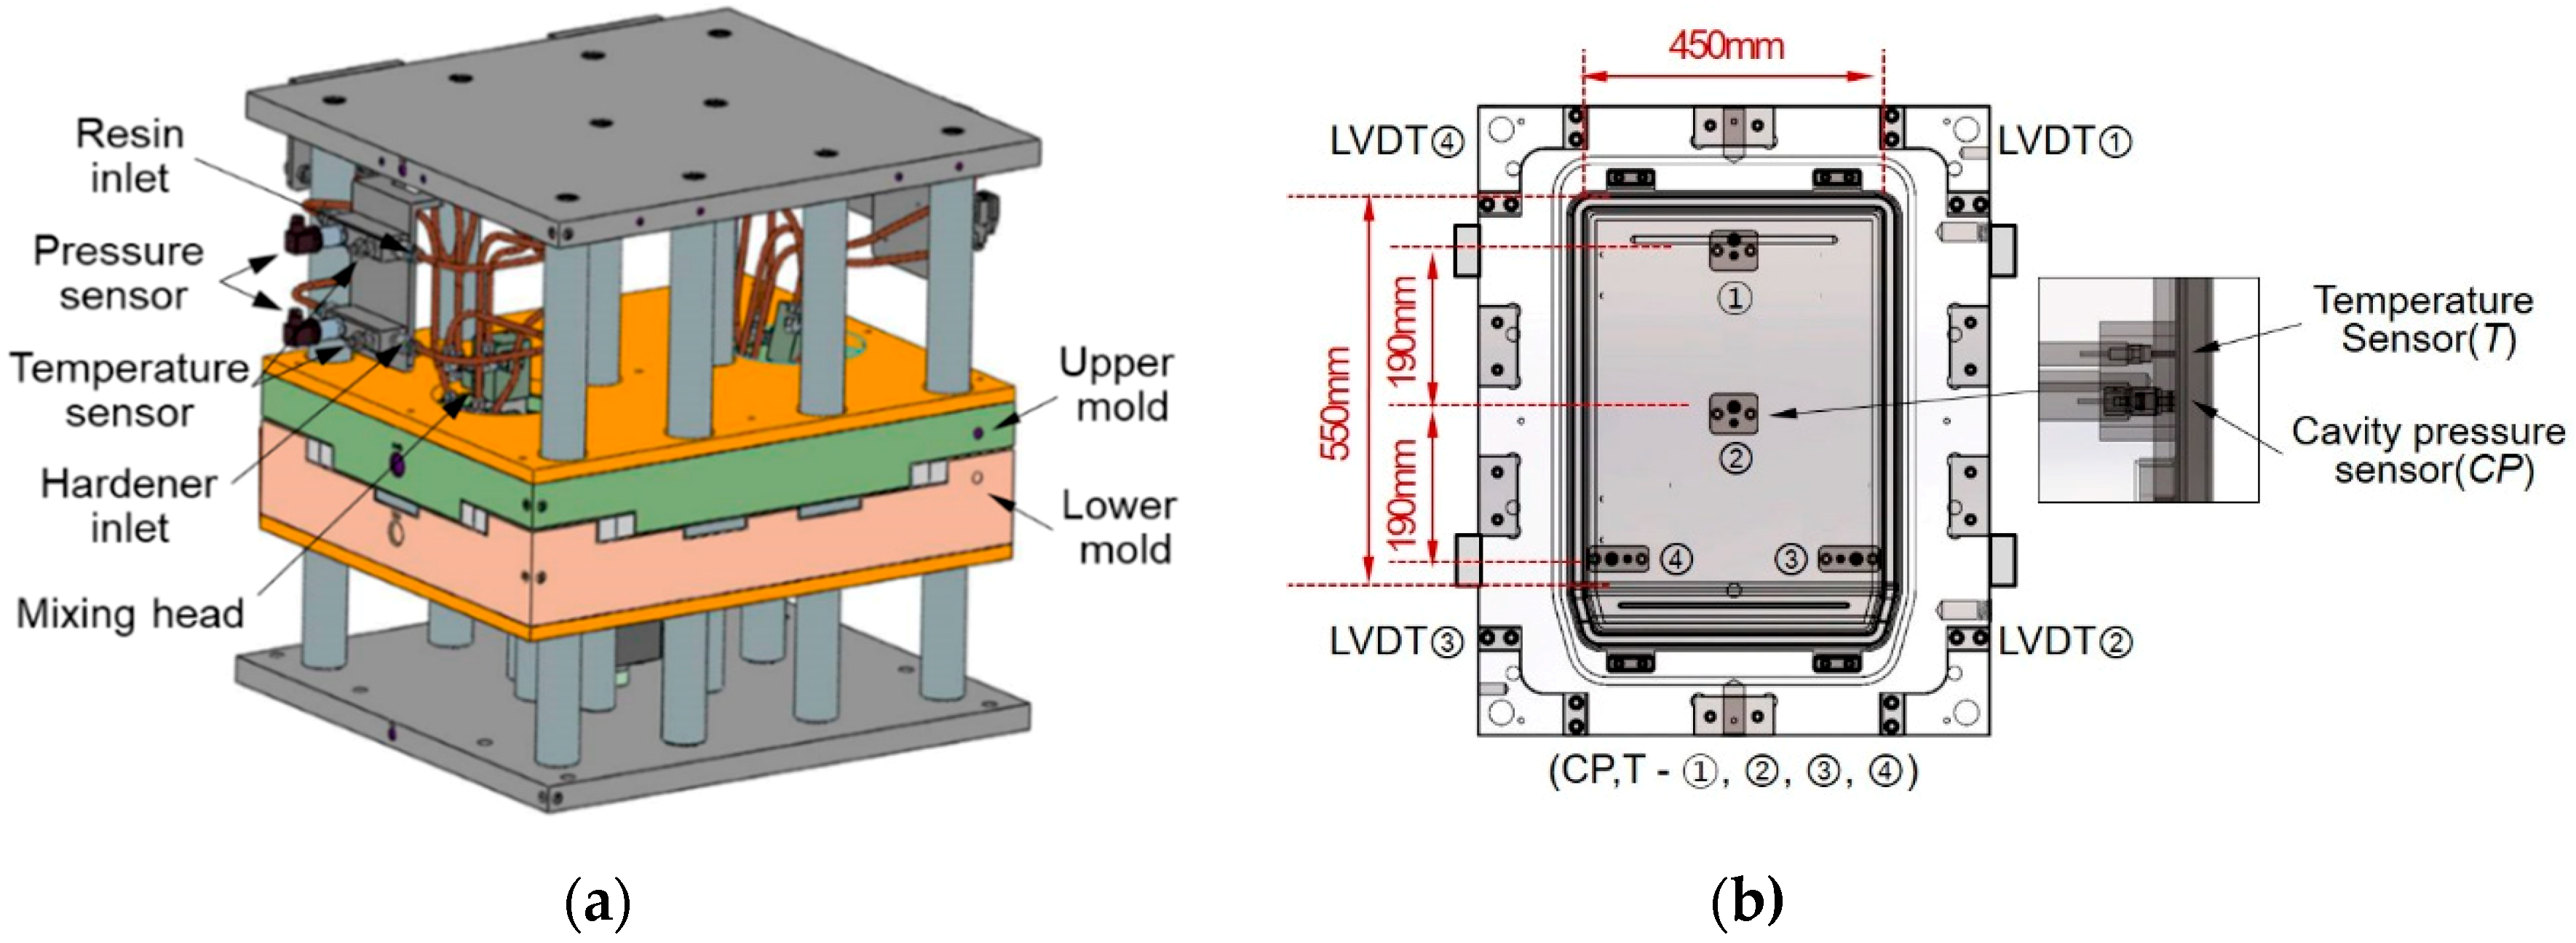
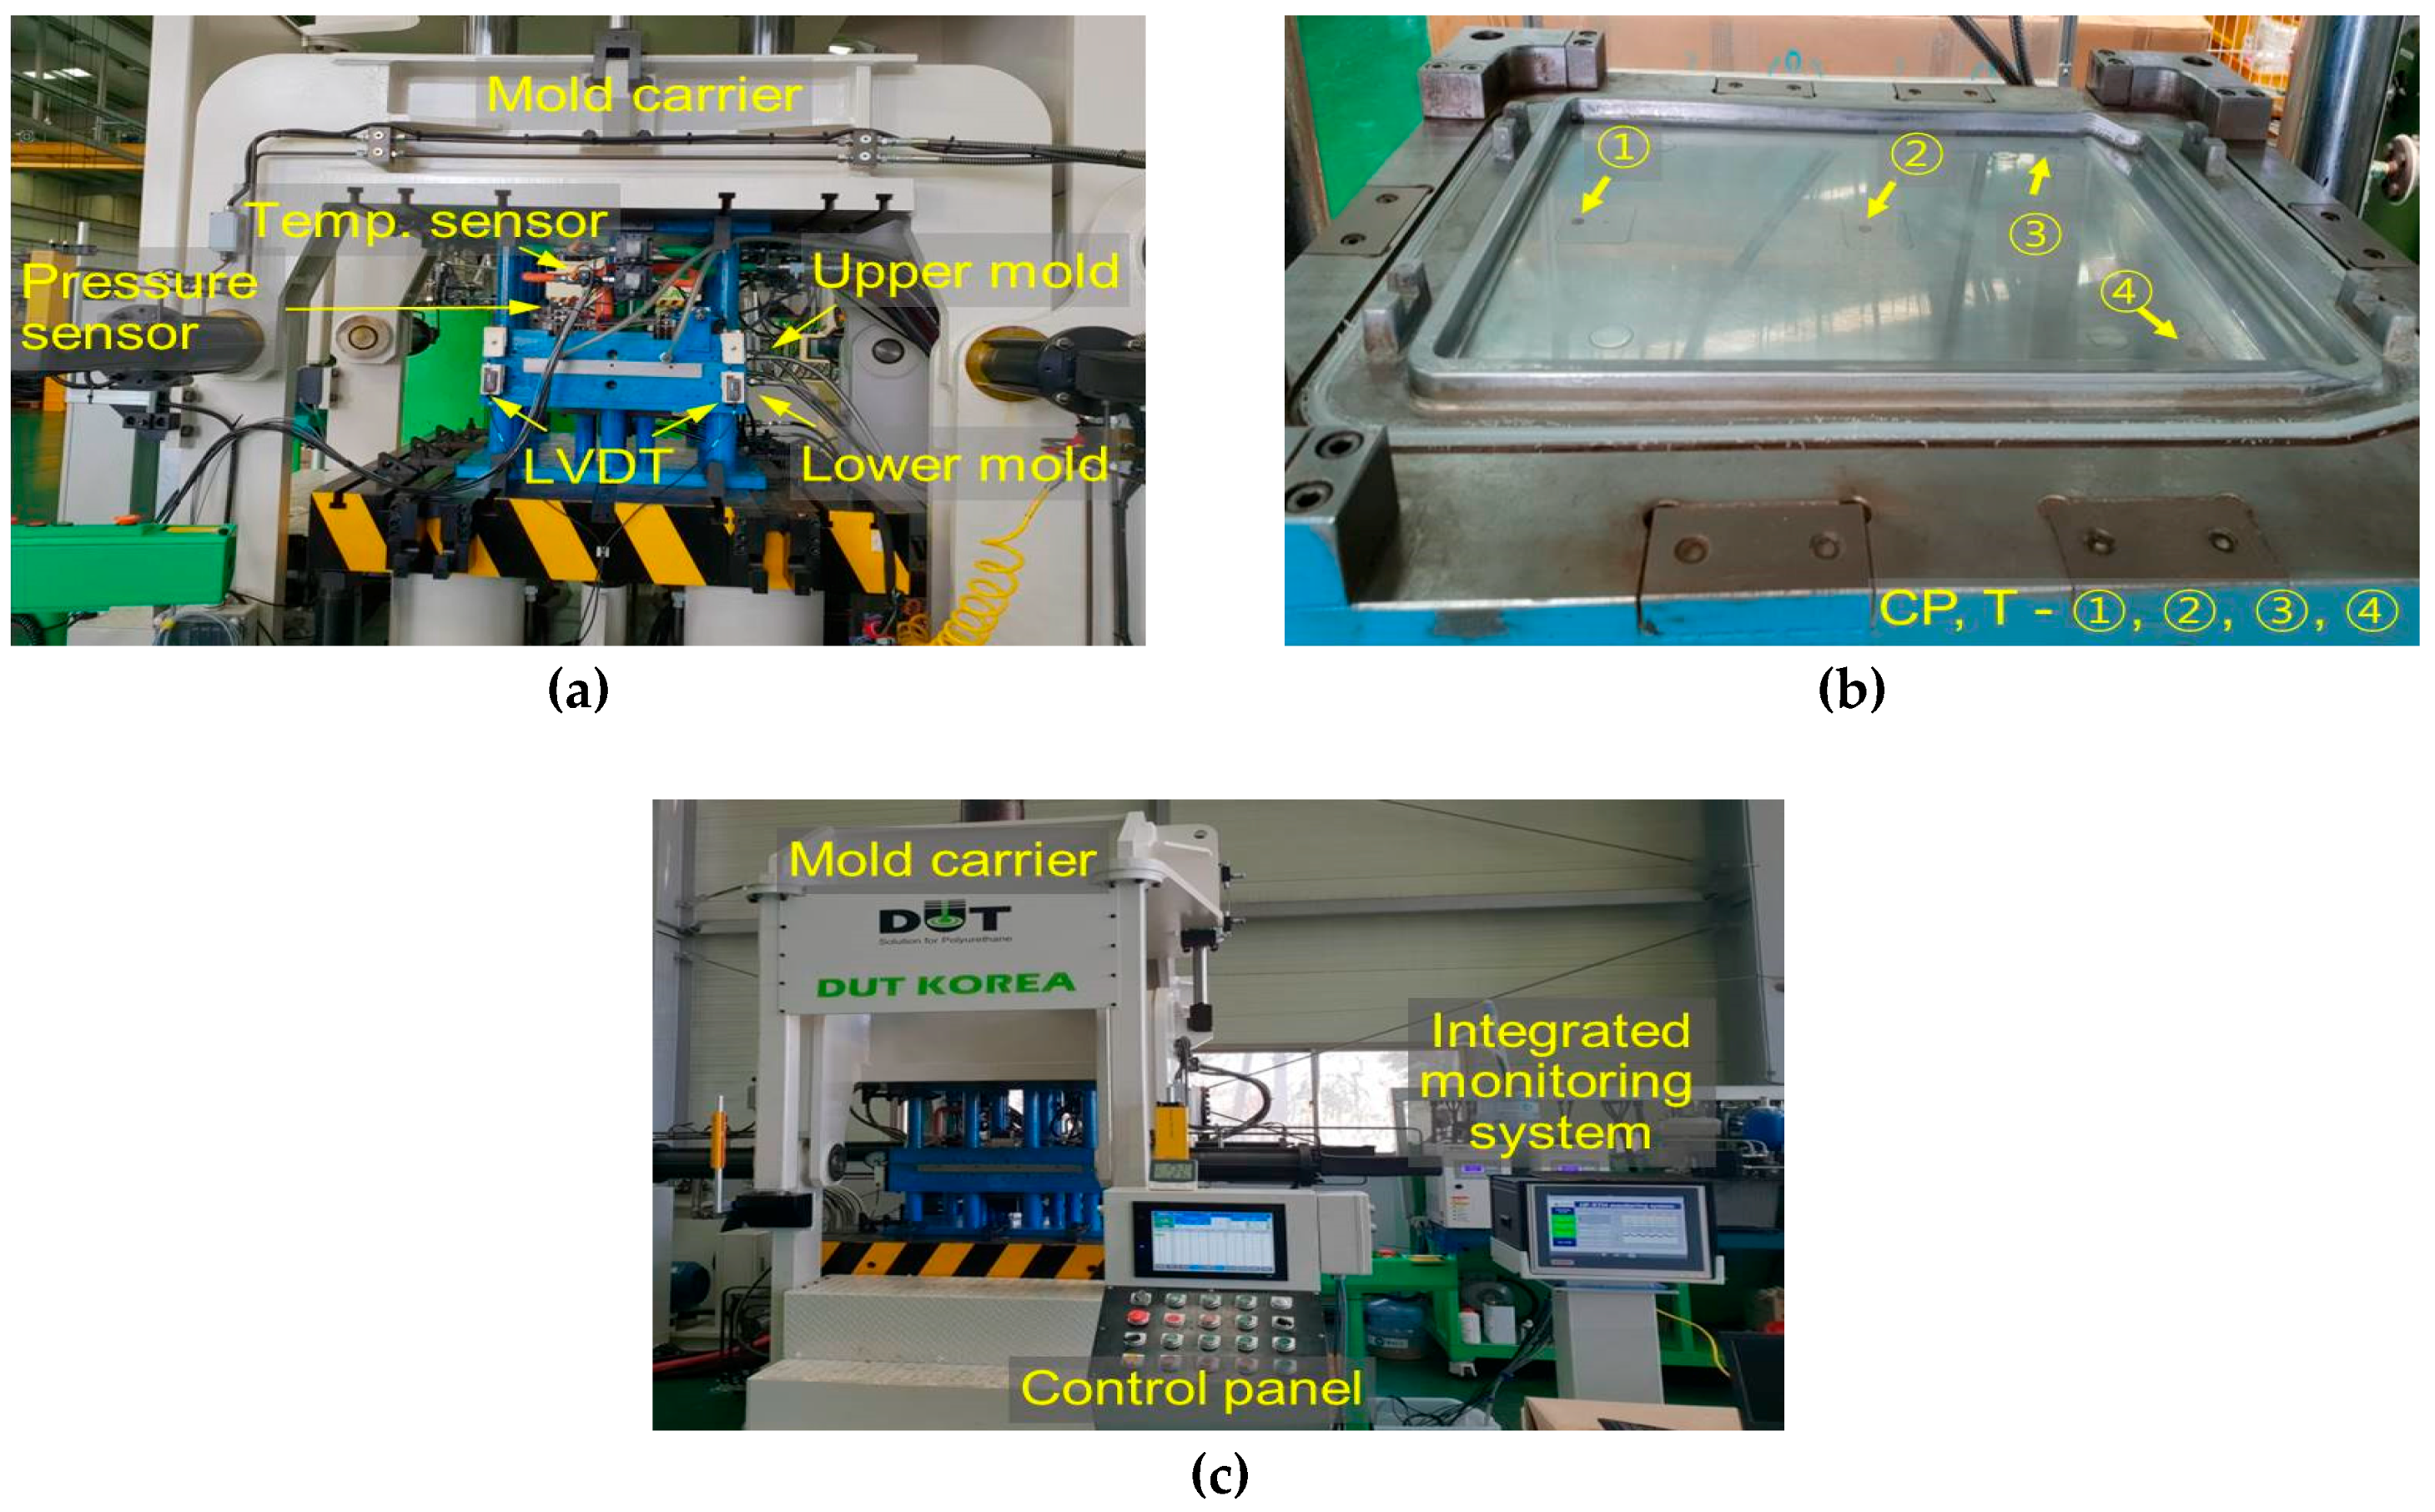
To detect the CFRP molding conditions during the HP-RTM process, pressure and temperature sensors were installed at the inlet of the mixing head and in the mold. Additionally, LVDTs were installed in the mold. Figure 4 shows the position and number of installed sensors. The pressure and temperature sensors installed in the mixing head detected the pressure and temperature immediately before the resin was sprayed. When the resin injected into the mold reached the other end from the injection port of mold, a difference in viscosity occurs due to the temperature of the mold and the exothermic reaction of the resin, which affects the impregnation. The difference in the amount of impregnation causes the reaction temperature to change in the resin. Therefore, four pairs of cavity pressures (CP) and temperature sensors (T) were installed in the mold (see Figure 4b): (1) CP and T ① were installed in the lower part opposite the upper mold; (2) CP and T ② were installed in the center of the mold (at 190 mm from the injection port), and (3) and (4) CP and T ③–④ were installed symmetrically at the end of the mold (at 380 mm from the injection port) to monitor the resin flow and curing. The LVDTs were installed at each corner of the mold to measure the end-gap and uniformity of the CFRP thickness and monitor the controllability of the press.
2.4. Monitoring System Architecture
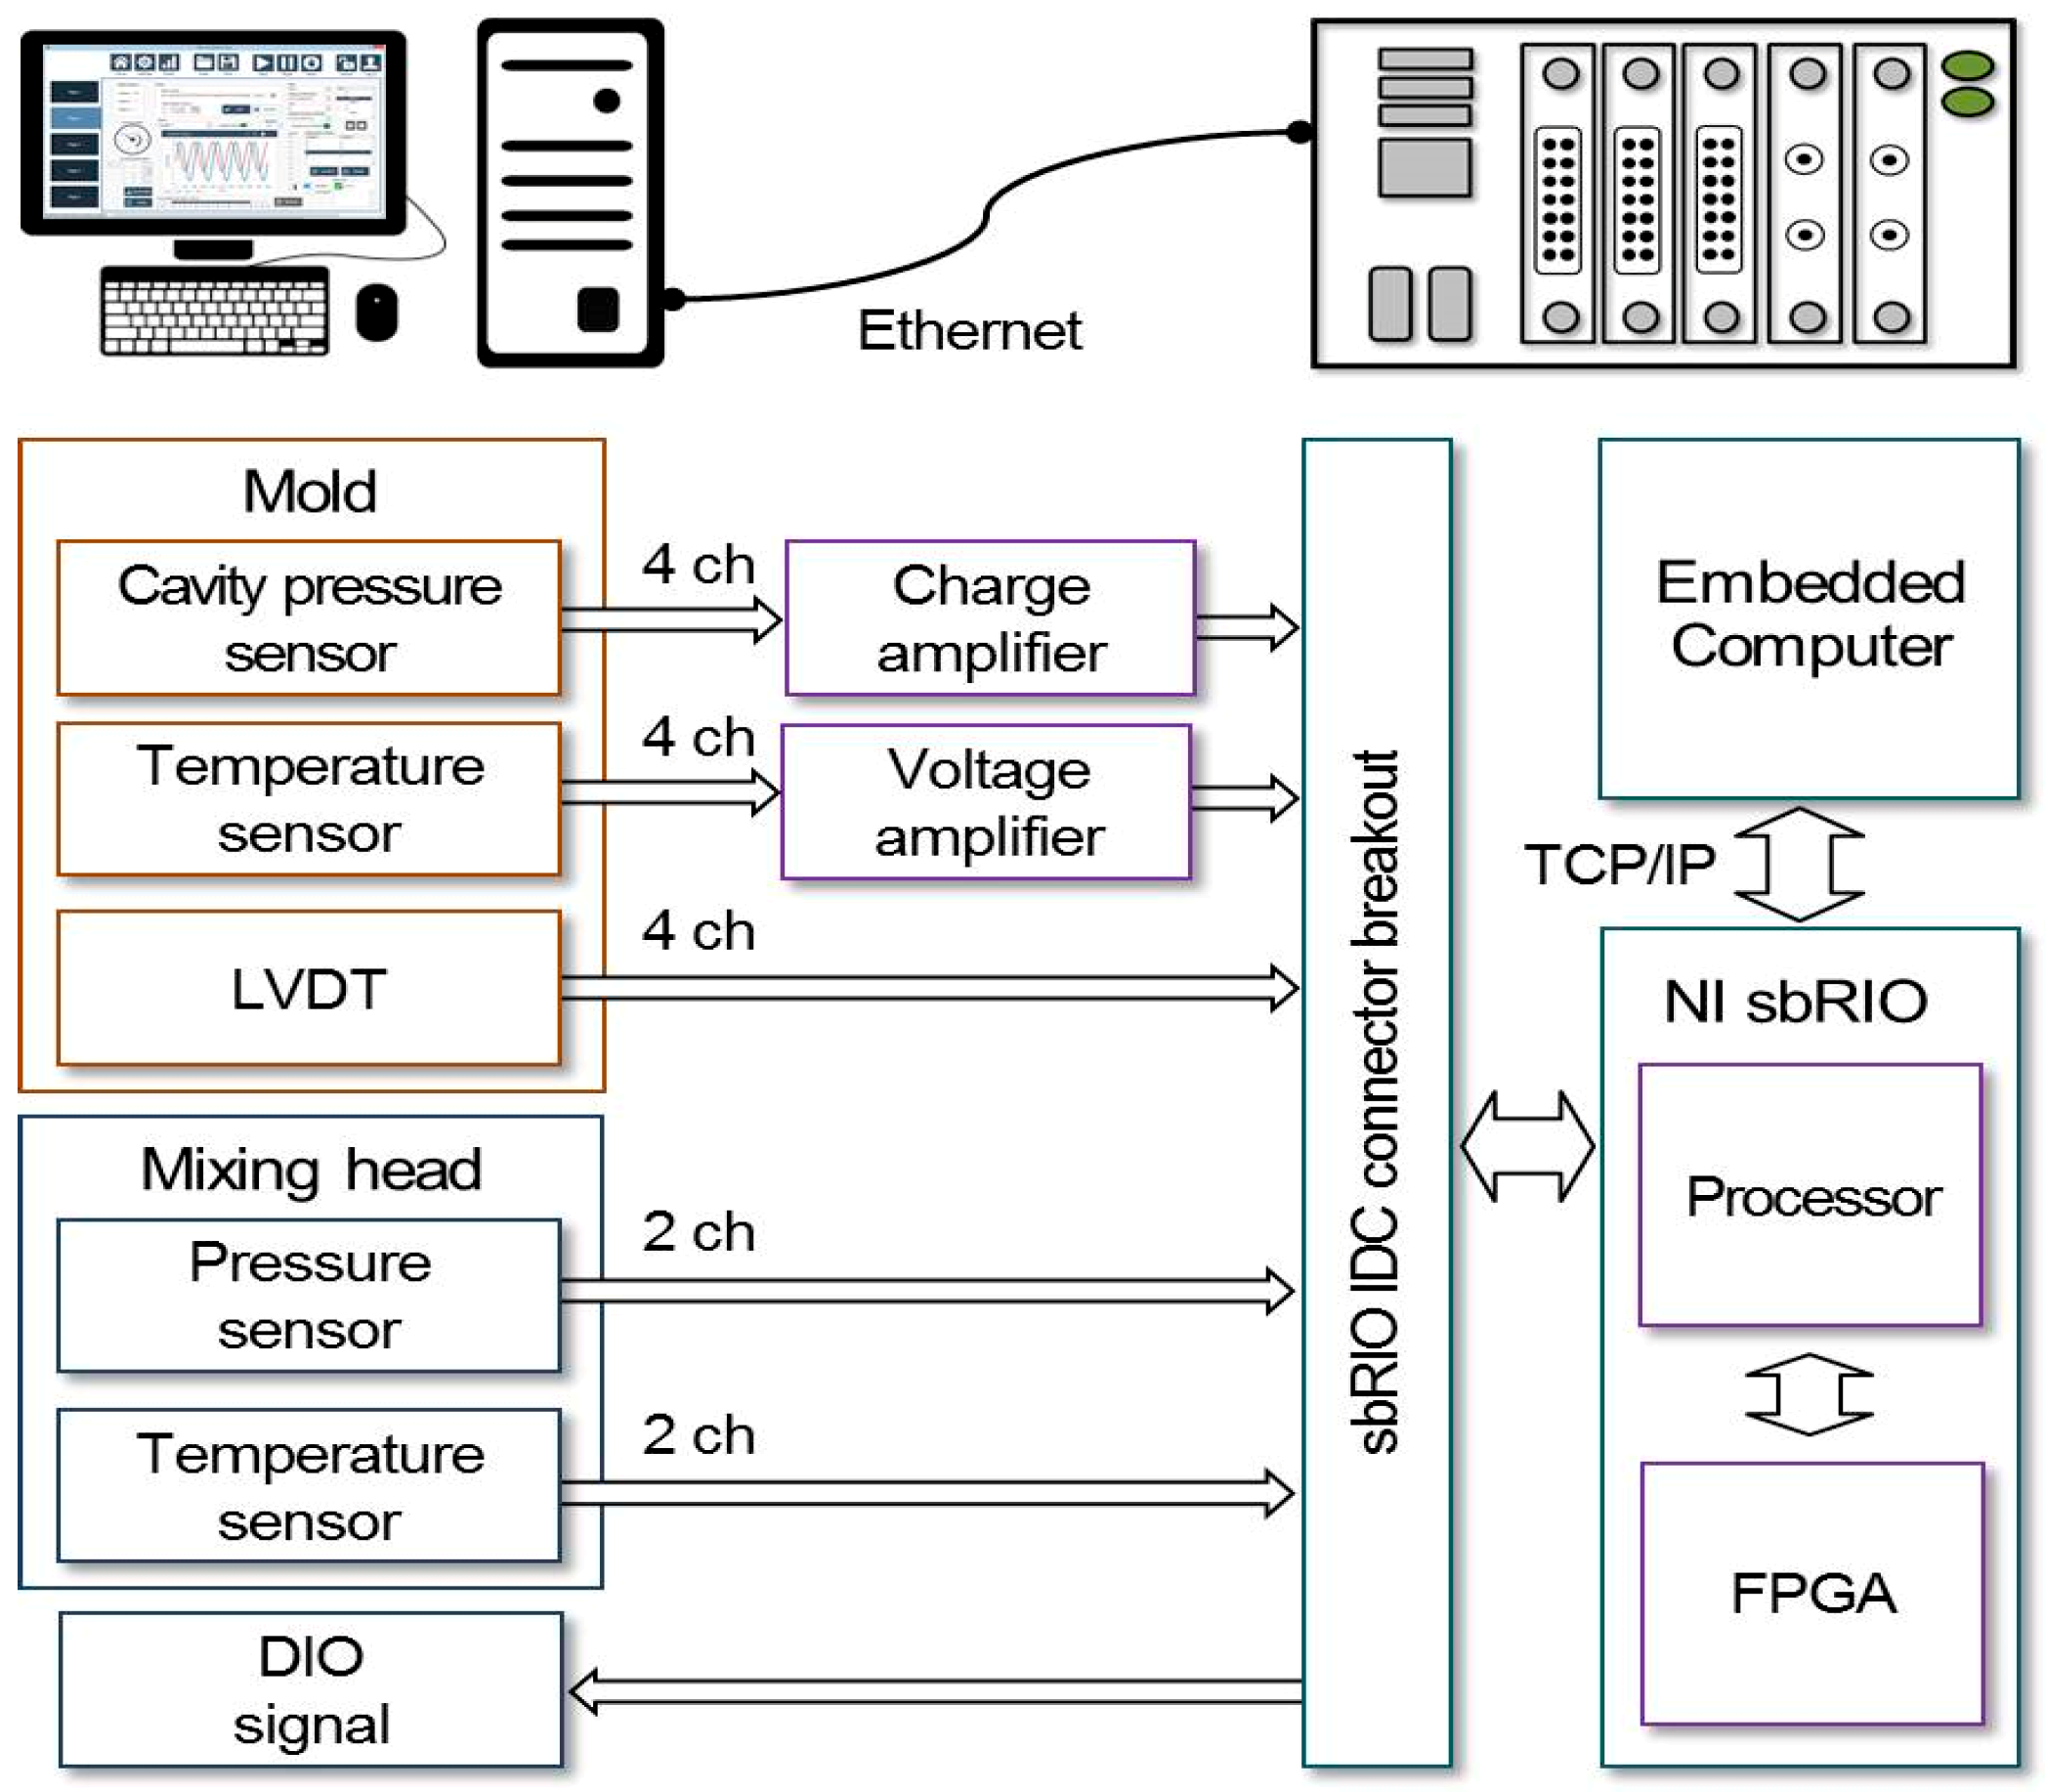
Figure 5 shows the hardware schematic representation of the embedded system for real-time condition monitoring of the HP-RTM. The embedded monitoring system consists of a single board signal processor (sbRIO-9637, National Instruments, Austin, TX, USA), an embedded computer (MIO-5272U, Advantech, Taiwan), amplifiers, and filters. The single-board signal processor is equipped with a Zynq-7020 FPGA and acquires signals with 16 16-bit analog inputs and 28 digital channels. The embedded computer with an Intel Core i7 2.6 GHz processor and 4 GB DDR3 SDRAM was adopted to configure the Human–Machine Interface (HMI). The sensors used in the HP-RTM process are acquired on 16 analog channels in total with a maximum 200 kHz sampling rate, and the operation signals (Range selection and Start operation) of the cavity pressure sensors are controlled using two digital channels. Analog channels are used to monitor the pressure and temperature at the injection of the resin and hardener, the cavity pressure and temperature inside the mold, and the end-gap of the mold. The cavity pressure and temperature sensors installed in the mold use a separate amplifier in order to amplify the signal and the other sensors use built-in amplifiers.
Each signal was transmitted using an analog-to-digital converter via a filter such as high-pass filter (HPF) or low-pass filter (LPF) for noise reduction. The collected signals were used to monitor the states of the HP-RTM process by FPGA-based real-time embedded monitoring system.
3. Experimental Setup and Conditions
3.1. Embedded Based Monitoring System Fabrication
The sensor specifications shown in Table 1 were used to capture the process states of the mixing head and the mold by the developed embedded monitoring system. A pressure sensor (S-11, WIKA Alexander Wiegand SE & Co., Klingenberg am Main, Germany) and a temperature sensor (TM4101,IFM electronic gmbh, Essen, Germany) on the mixing head and cavity pressure sensors (6161AA, Kistler Instrumente GmbH, Sindelfingen, Germany), temperature sensors (6194B, Kistler Instrumente GmbH, Sindelfingen, Germany), and LVDTs (GT2, Keyence corporation., Osaka, Japan) in the mold were installed.
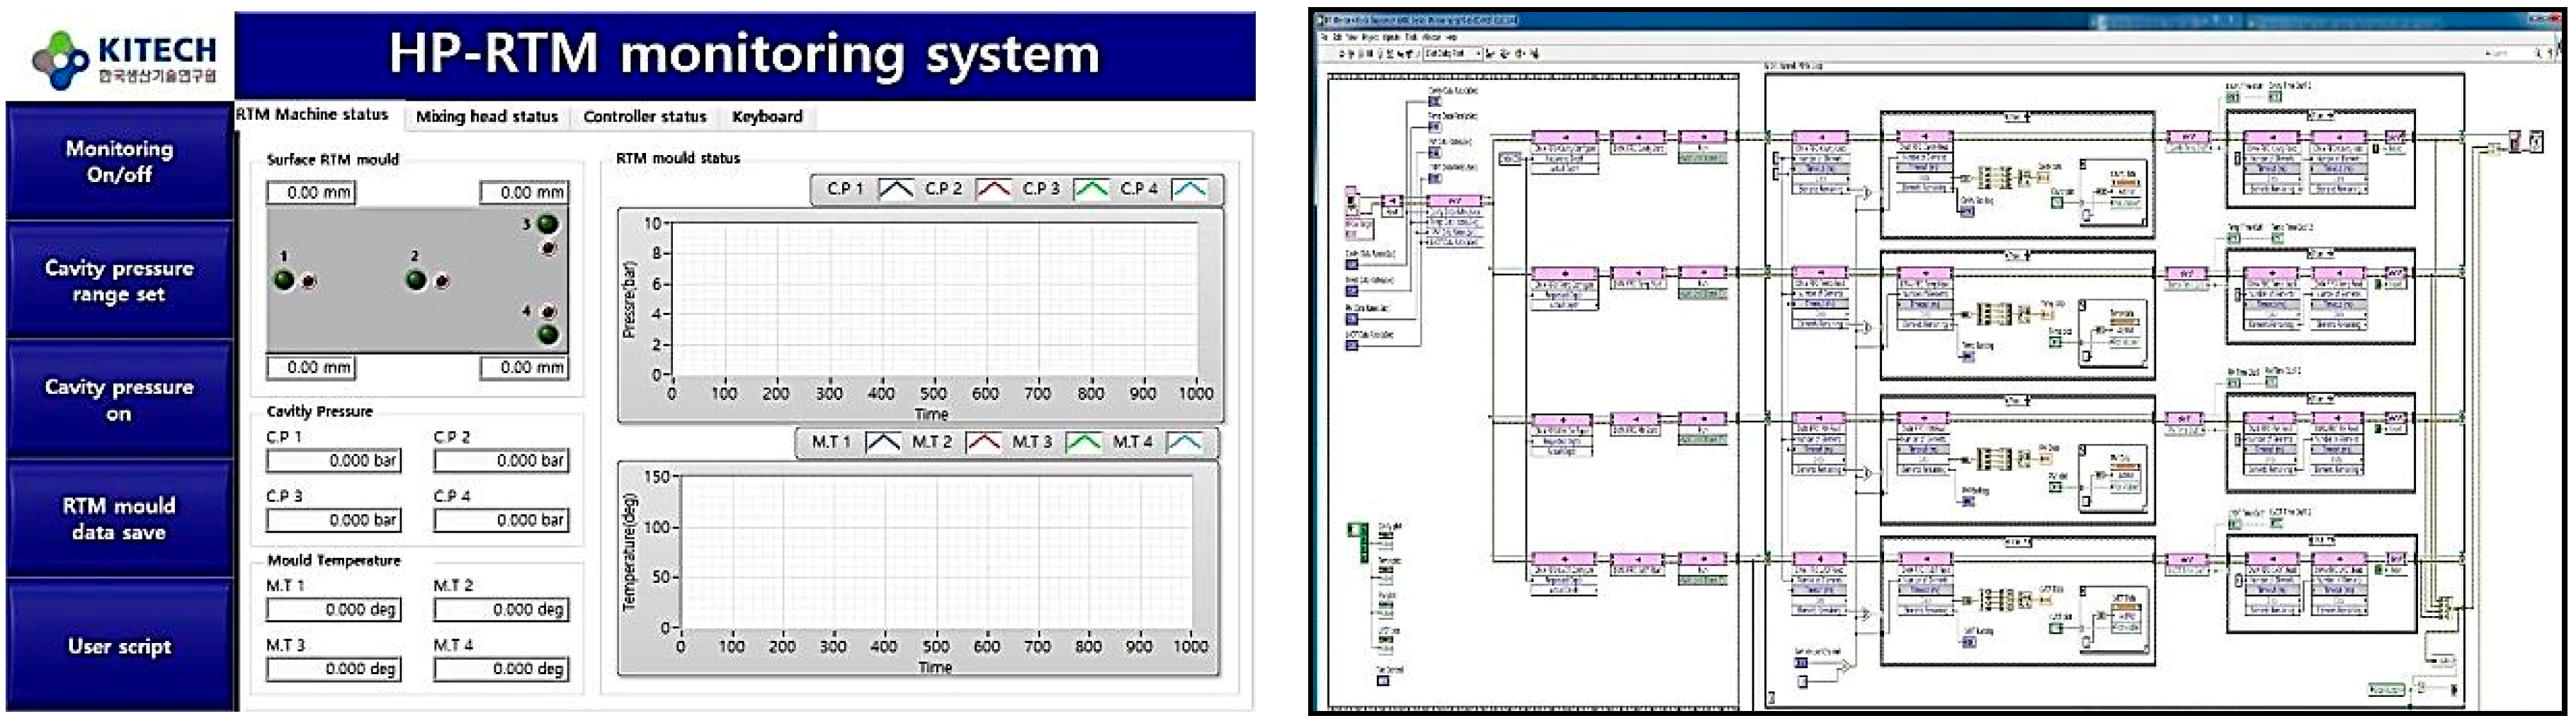
Figure 6 shows the HMI programmed with LabVIEW 2017 (National Instruments, Austin, TX, USA ) for data acquisition. HMI is a Beckhoff panel touch screen (CP6902) connected to the embedded computer that provides all monitoring operator input/output including, particularly data saving. The following signal processing was applied to detect the process conditions of HP-RTM.
The raw signals of the sensors acquired during the operation of the HP-RTM equipment and utilities were analyzed using Fast Fourier transform (FFT) and the filters were designed to eliminate noise components other than signals. The noise-removed signals were sampled at 1 kHz by a trigger signal and processed at high speed using an FPGA.
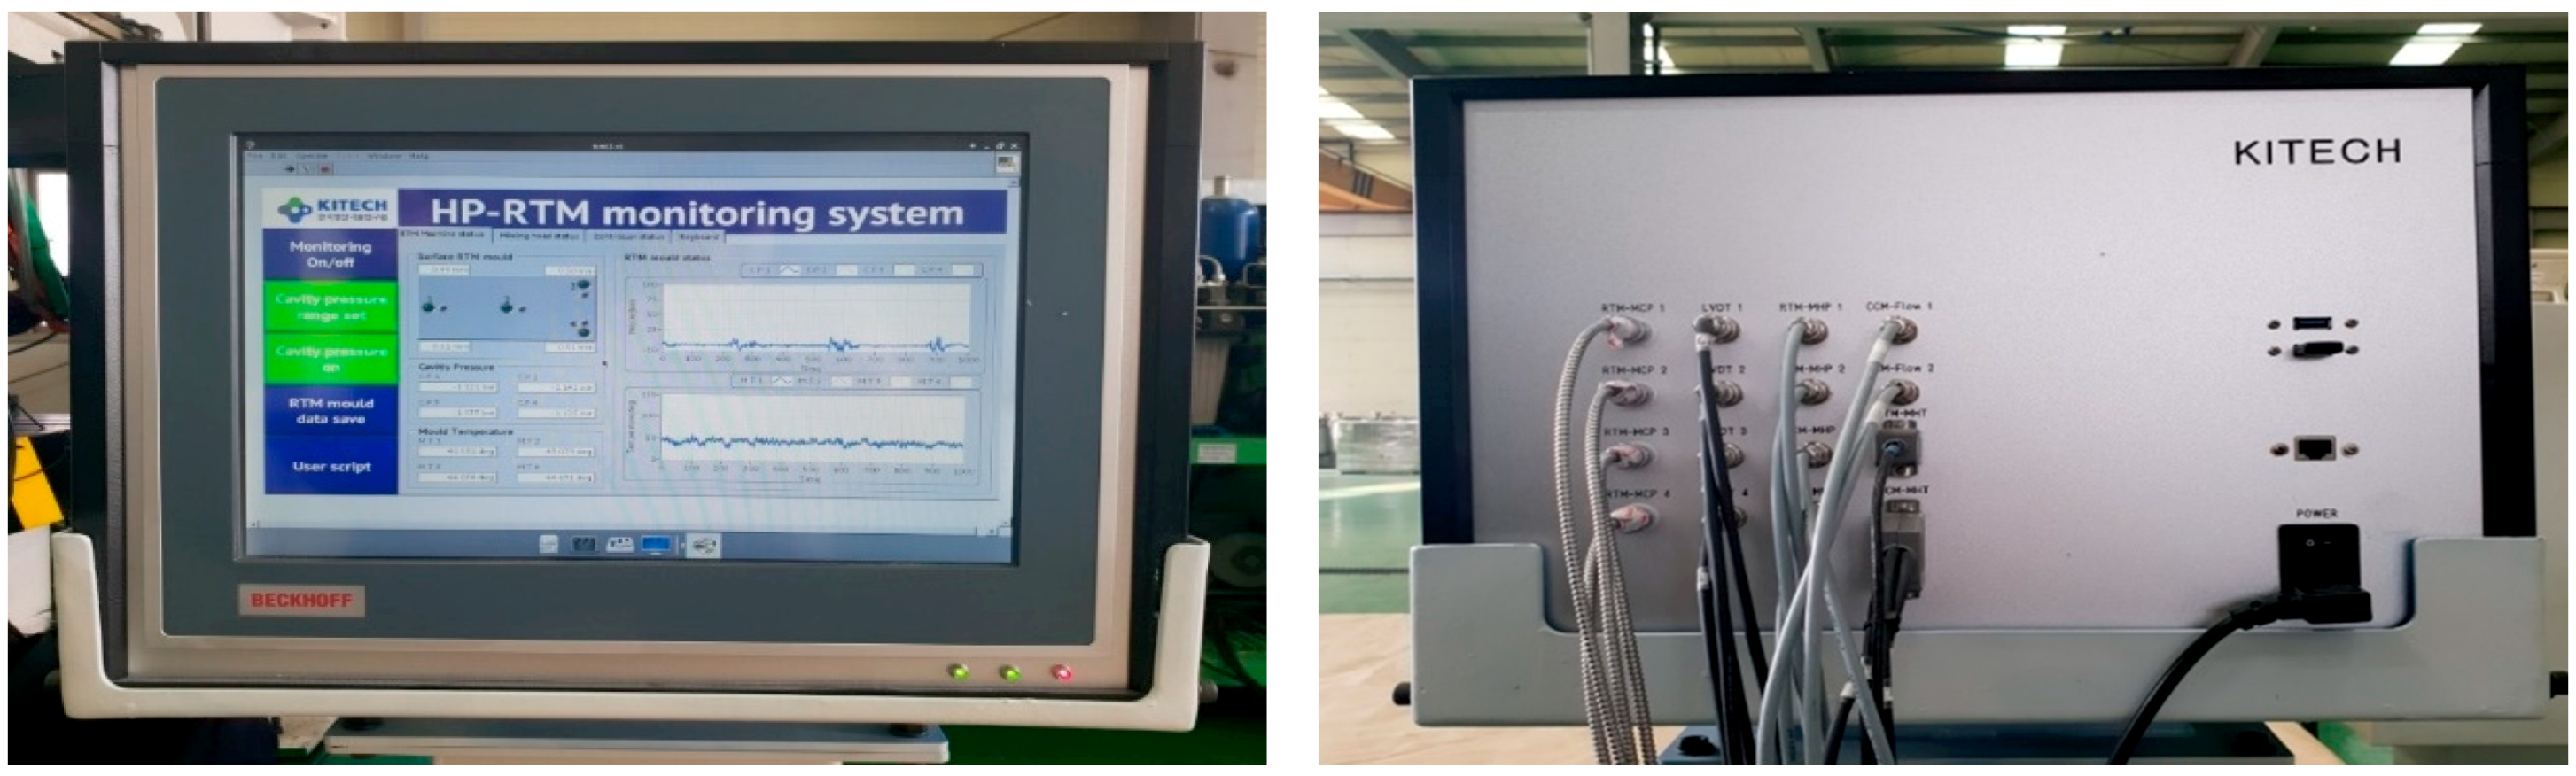
The digitally processed signals were displayed on the HMI through signal processing analysis such as average, moving average, root mean square (RMS), and peak value. Figure 7 shows the embedded monitoring system that can be operated alone without connecting to another computer.
3.2. Experiments
Figure 8 shows the sensors that were installed in the mixing heads and molds and embedded systems for monitoring the HP-RTM processes. The size of the specimen mold was 550 × 450 mm and the carbon fiber fabric used was HPT® 300 C45 (with fiber orientation ±45°) and HPT® 300 C090 (with fiber orientation 0°/90°) from the SGL Carbon group. To enhance the tensile and flexural strength in the X and Y directions, carbon fiber sheets were cross-stacked to 0°/90° and ±45° and carbon fiber sheets were combined with binders to form. Then, CFRP preform was placed in the lower mold.
An epoxy resin (KER-9610) and hardener (KCA9610) made by Kumho petrochemical were used for the HP-RTM process. In the HP-RTM equipment, the epoxy resin was heated to 80 °C and the hardener was processed at 45 °C in the high-pressure supply unit. The mixing head pressure was set to approximately 125 bar so that the resin and hardener were mixed homogeneously. The corresponding fiber volume fraction was 40% (seven layers) and 43% (eight layers) in the present study. After the CFRP preform was placed in the mold and the vacuum step was set to 60 s with 0.5 mm end-gap, the resin was injected at 64.7 g/s for 9.5 s. The end-gap was closed after the injection was completed and the pressing force of 3000 kN was applied for 500 and 600 s. Table 2 shows the experimental conditions.
4. Results and Discussion
4.1. Process Analysis
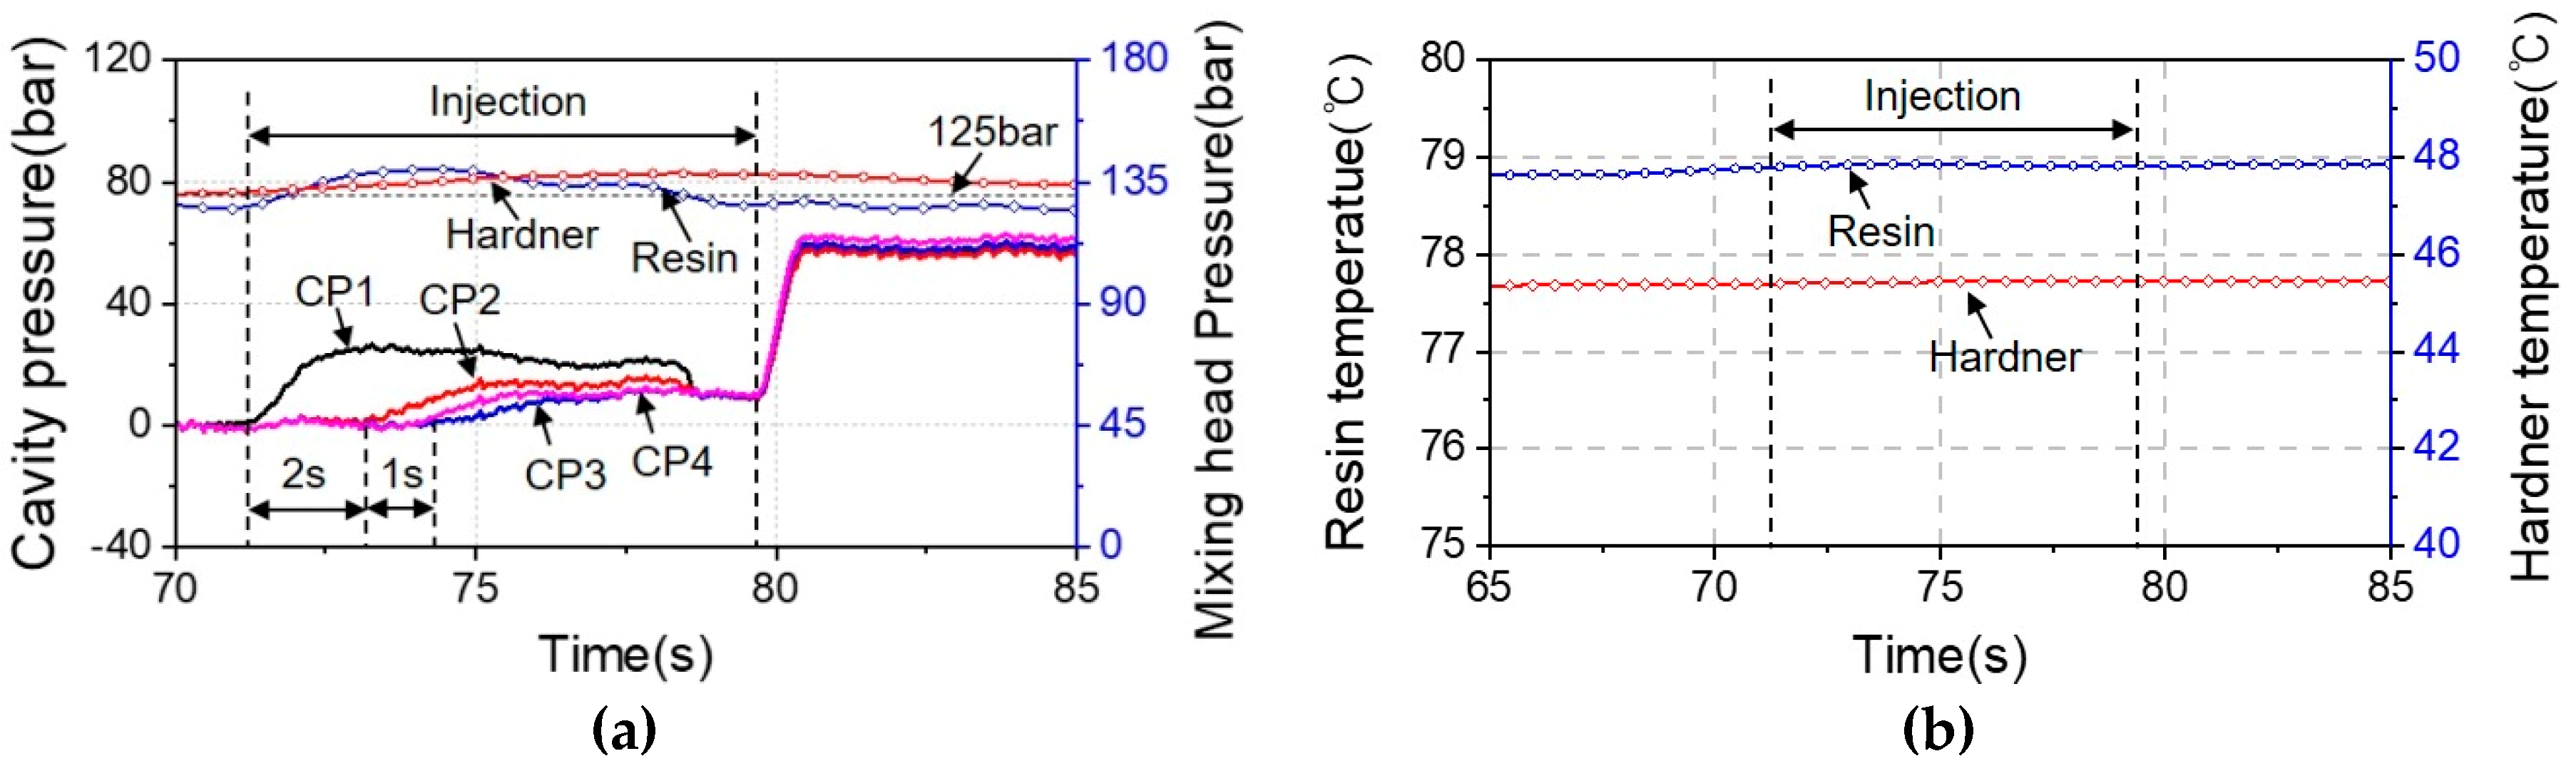
To obtain a uniform CFRP quality, the temperature and pressure of the resin and hardener should be maintained at a constant so that the viscosity of the resin can be kept at a constant. Figure 9 shows the injection pressure and temperature of the mixing head and the cavity pressure of the mold in the injection process. As shown in Figure 9a, the output pressure of the mixing head at the set pressure of 125 bar had changed by about 5% in both the resin and hardener. As soon as the resin of the mixing head was injected into the mold, the cavity pressure CP1 increased. The distances between the cavity pressure CP1, CP2, and CP3–4 were each 190 mm, and the resin reached CP2 after about two seconds and CP3–4 about three seconds after CP1 in the injection step.
As seen in Figure 9b, the temperature of the resin was maintained at 79 °C relative to the set temperature of 80 °C and the hardener was retained at 45.5 °C against the set temperature of 45 °C.
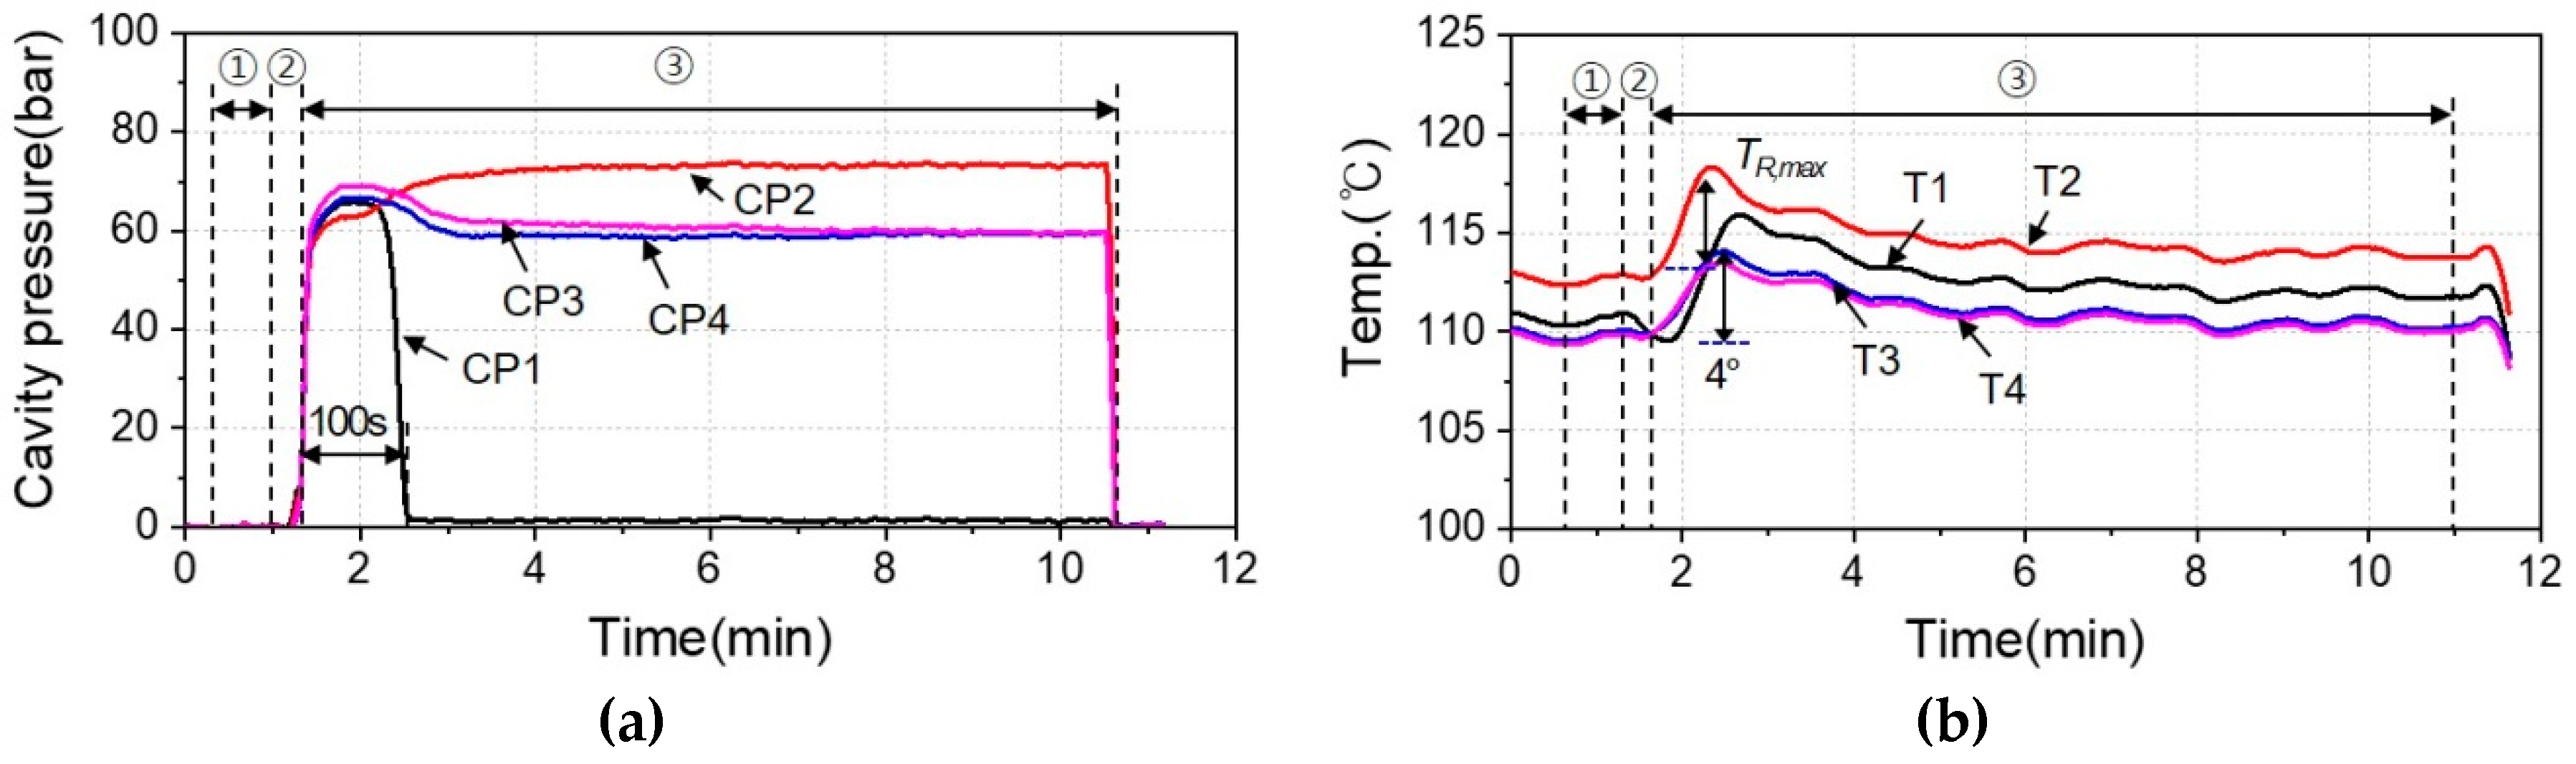
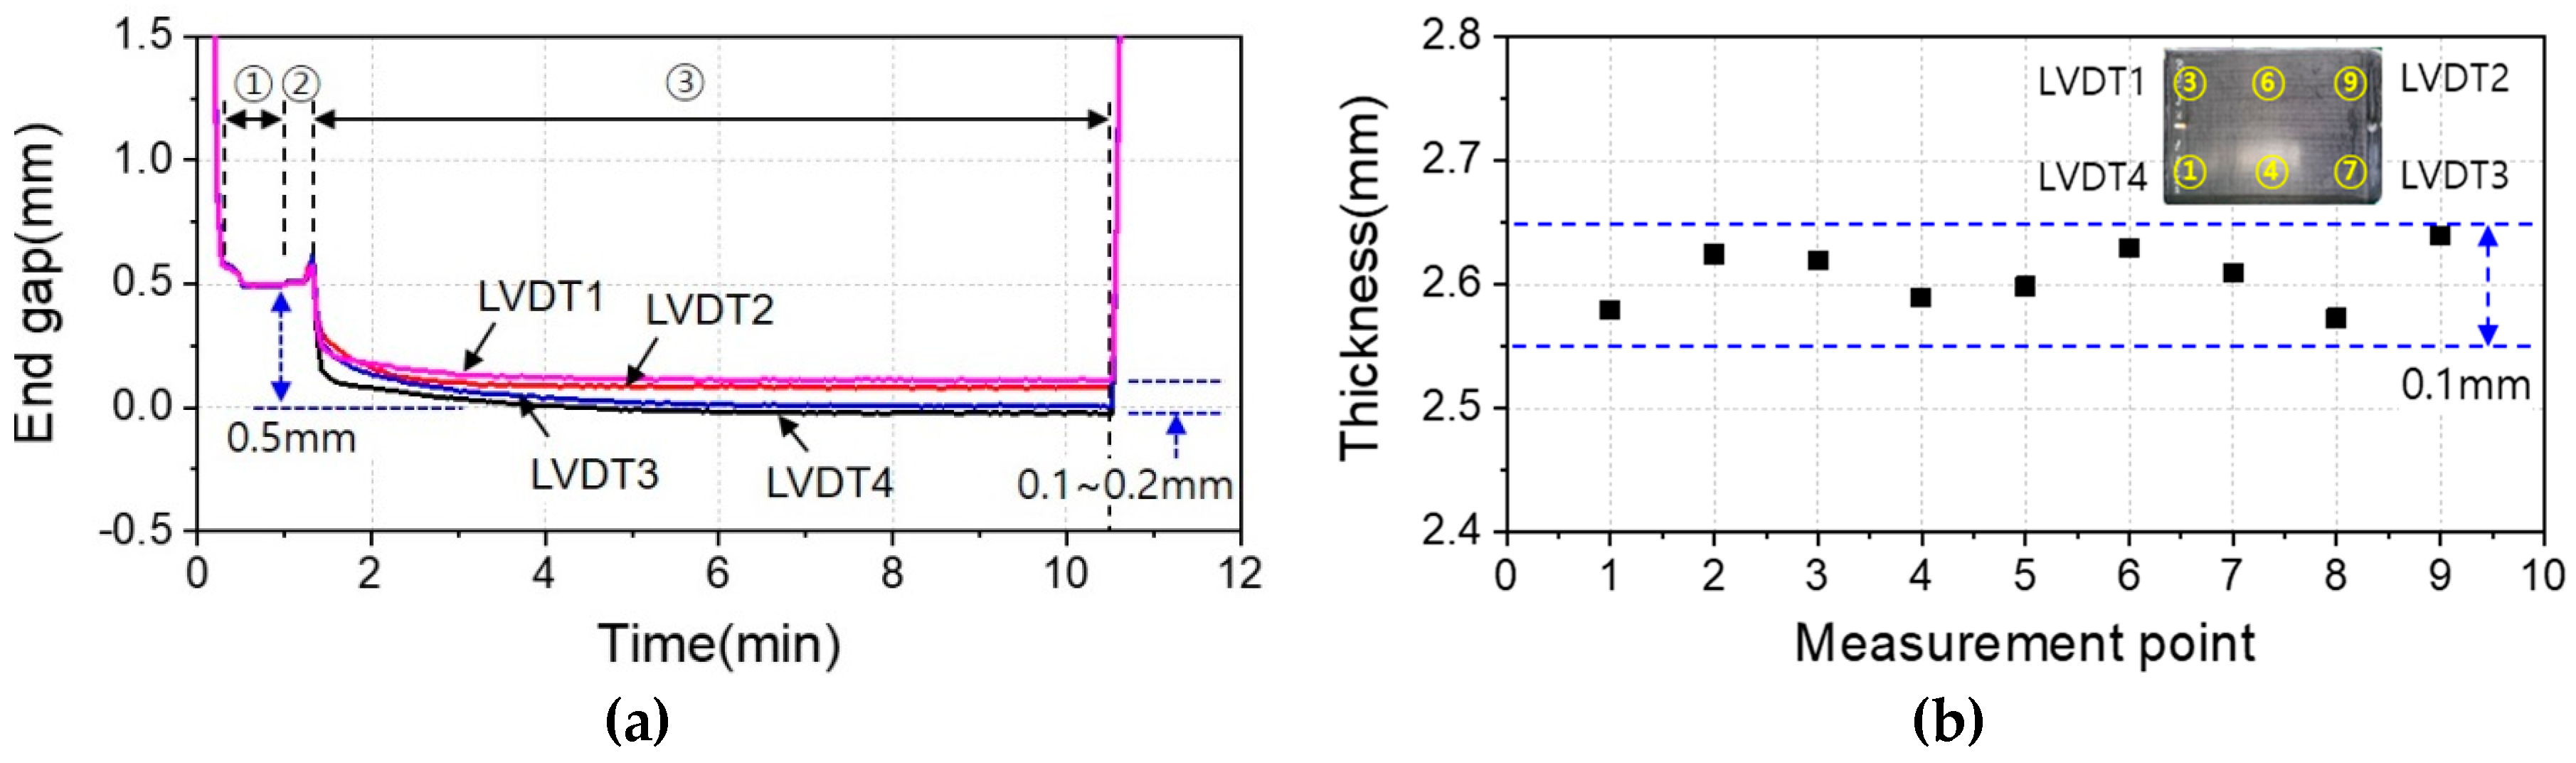
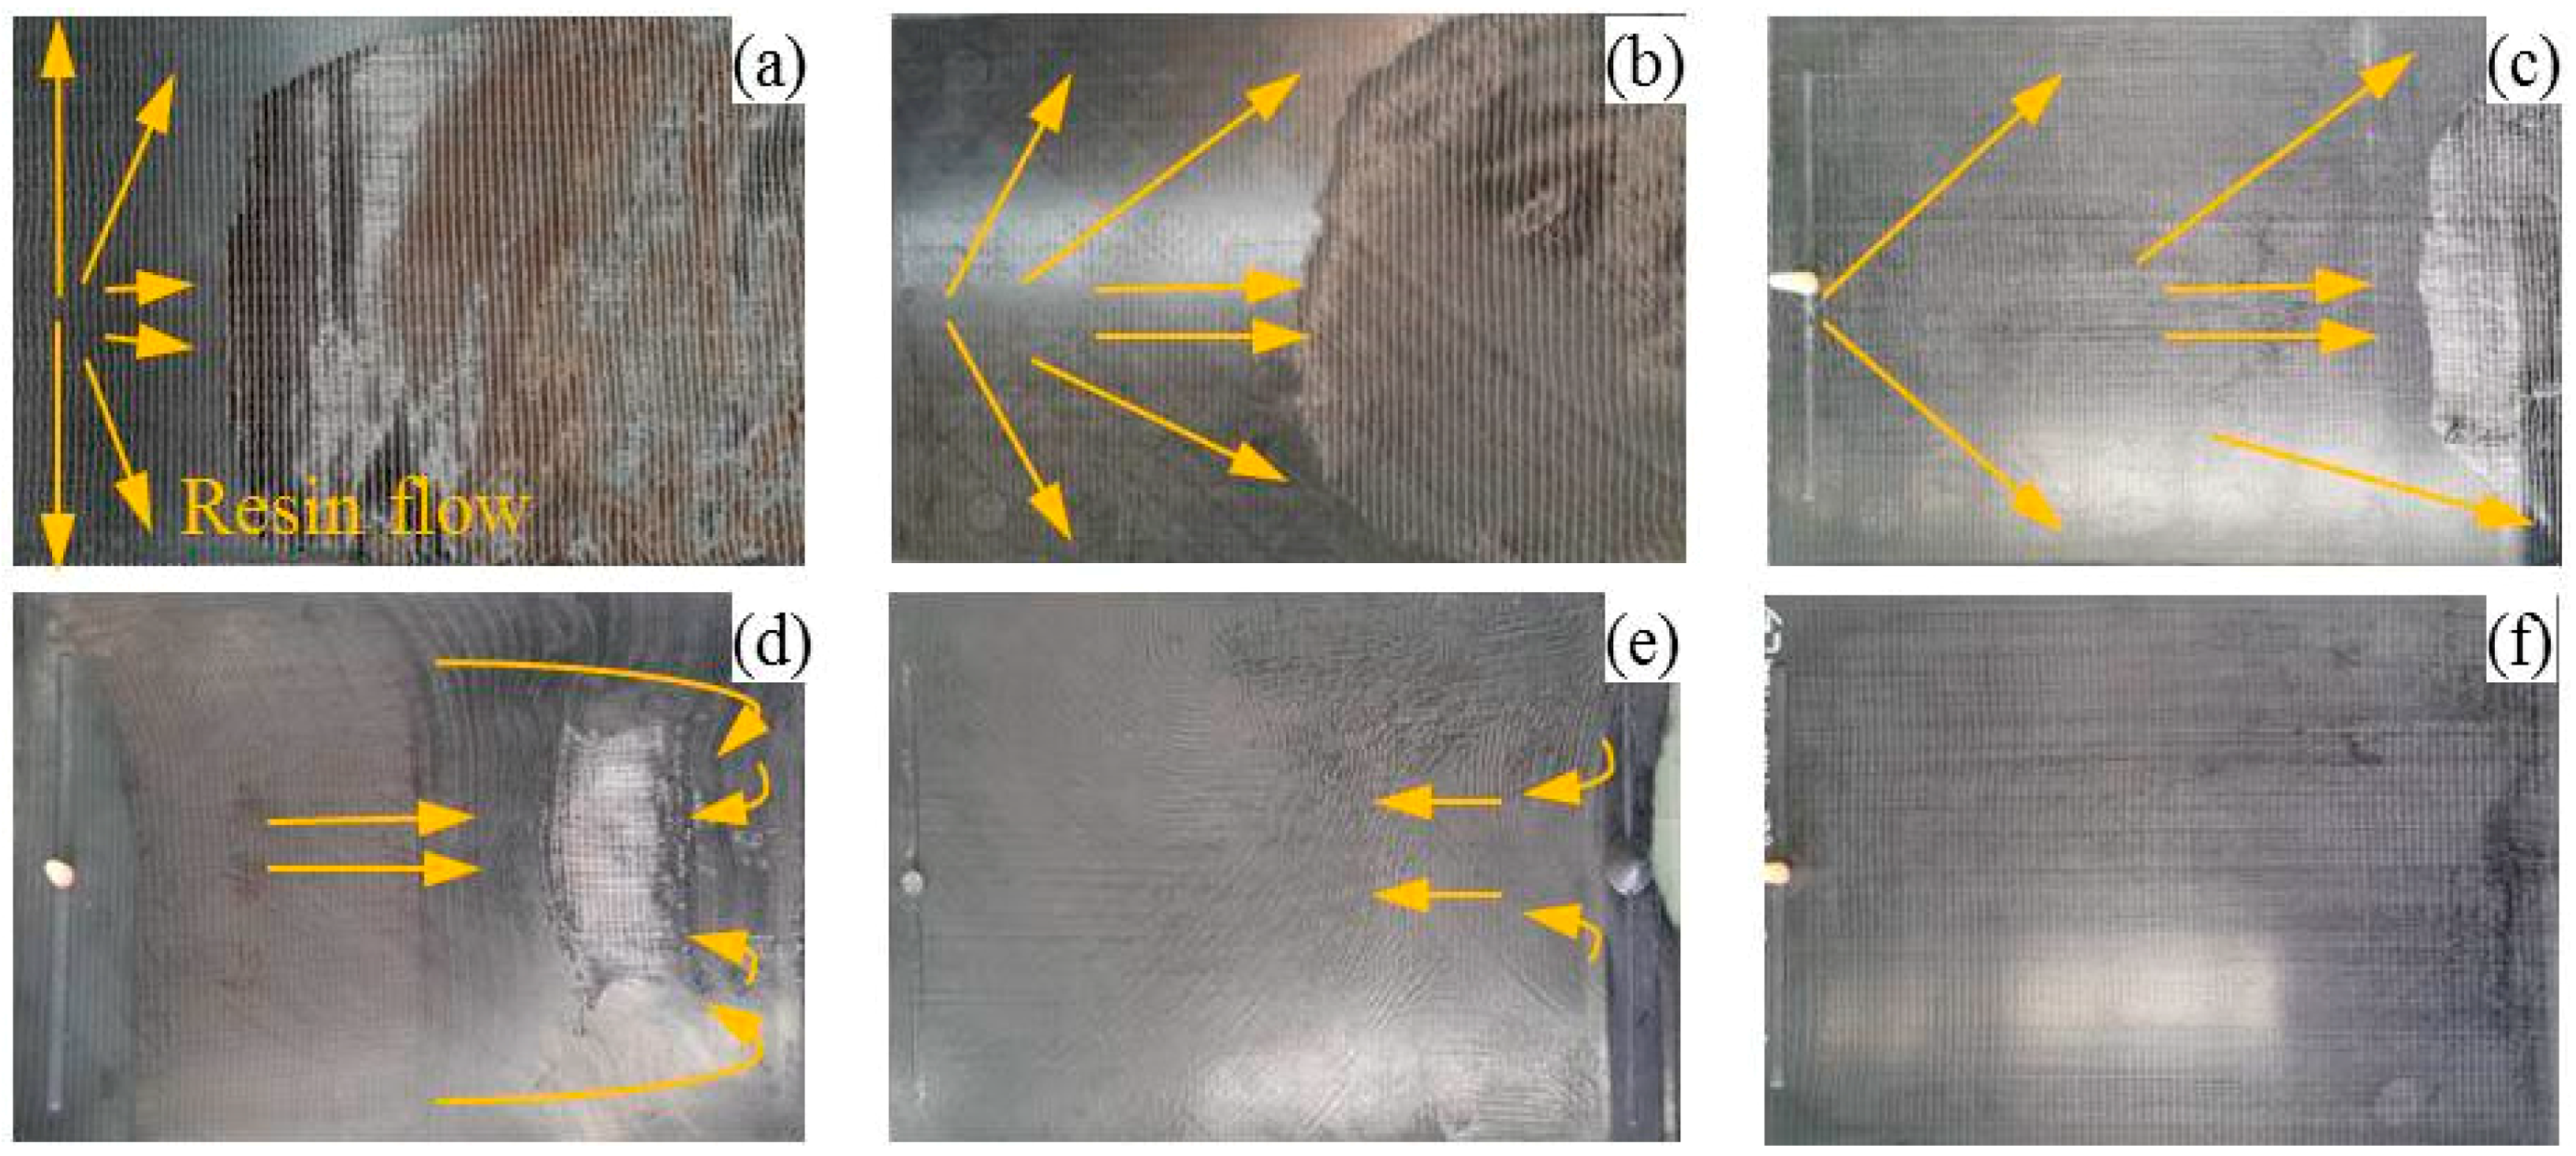
Figure 10 shows the cavity pressure and temperature inside the mold. Figure 10a shows the cavity pressure according to the vacuum (①), injection (②) and curing (③) steps. In the curing step, the pressing force increased from 0 kN to 3000 kN for 20 s. The cavity pressure rose up to 64 bar upon the completion of compression and was maintained at a constant pressure while curing the resin as 100 s passed. In general, the cavity pressure CP1 should be kept constant as in CP2. However, in the HP-RTM equipment used in this experiment, when the resin was cured due to the structure of the mixing head, the specimen adhered to the injection nozzle of the mixing head and reached 0 bar as no pressure was applied to the CP1 pressure sensor in the lower mold opposite the injection port. Figure 10b shows the internal temperature of the mold. The initial temperature in the vacuum process was about 108–113 °C. The reason for this temperature deviation was that the temperature of the mold was influenced by the convection of the outside air due to the end-gap. Since the mold temperature sensor T1 was located on the injection port opposite the mold, it was reduced by about 2 °C due to the supply temperature of the resin (80 °C), the maximum reaction temperature (TR, max) was 4 °C and then gradually decreased. The resin flow reached the position of the temperature sensors T2–4 with the heat reaction and slowly decreased after increasing by 4 °C. The temperature inside the mold increased due to the exothermic reaction of the resin in the curing step rather than in the vacuum step because the temperature change was the same when the resin amount was equal. Figure 11 shows the end-gaps measured with the LVDT and the thickness of the finished CFRP specimen in the HP-RTM process. In Figure 11a, the end-gap of the vacuum step was 0.5 mm and the deviation of the end-gap was 0.1–0.2 mm in the curing step, which maintained a steady pressure after compression. Figure 11b shows the CFRP thickness that was obtained with the average value measured three times at nine positions. The thickness deviation of the CFRP specimen was ±0.05 mm on average. Figure 12 shows a photo of a CFRP specimen in which the resin flow appeared well. The resin injected at a high pressure of 120 bar or greater diffused radially by approximately 200 mm far from the injection port (Figure 12a) to the center (Figure 12b) of CFRP specimen. In Figure 12c, the resin quickly arrived at the edge parts along the wall with a smaller resistance than the central part of mold as the resin viscosity increased due to the mold temperature and frictional resistance of the fiber.
In particular, the mold wall without carbon fiber had almost no resistance; furthermore, in Figure 12d, the resin that had already reached the outer wall bumped against the wall and then flowed back to the center. The CFRP specimen was entirely impregnated by compression force after the resin injection had completed as shown in Figure 12e,f. As described above, the reason the cavity pressure sensor CP2 increased after 100 s in the curing step was that stagnation of the resin flow occurred at the center of the mold and the constant pressure compressed the cured resin. The arrival time of the resin flow was two seconds from the CP1 sensor to the CP2 sensor and three seconds to the CP3–4 sensors. In addition, the maximum reaction temperature uniformly increased for sensors T1–4. Therefore, it is inferable that the resin was completely impregnated in the CFRP laminate from the change in the cavity pressure and the reaction temperature of the resin inside the mold.
4.2. Detection of Abnormal States
The monitoring parameters in the HP-RTM process include the pressure, temperature, and flow rate of the resin, the pressure and temperature of the mixing head, the cavity pressure and temperature inside the mold, and the distance of end-gap and so on. In particular, the molding states of the CFRP can be estimated by detecting the cavity pressure and temperature of the mold in real-time, thus the process parameters can be optimized. The resin injection of the mixing head is stopped by monitoring the sensor signals if the pressure and temperature are not reached the value set for the HP-RTM equipment. The equipment control panel receives feedback from the sensor signals; thus, when the pressure and temperature of the mixing head reach a set value, the signals from the cavity pressure, temperature, and LVDT sensors installed in the mold are detected in real-time to analyze the molding conditions.
4.2.1. Abnormal Curing Condition
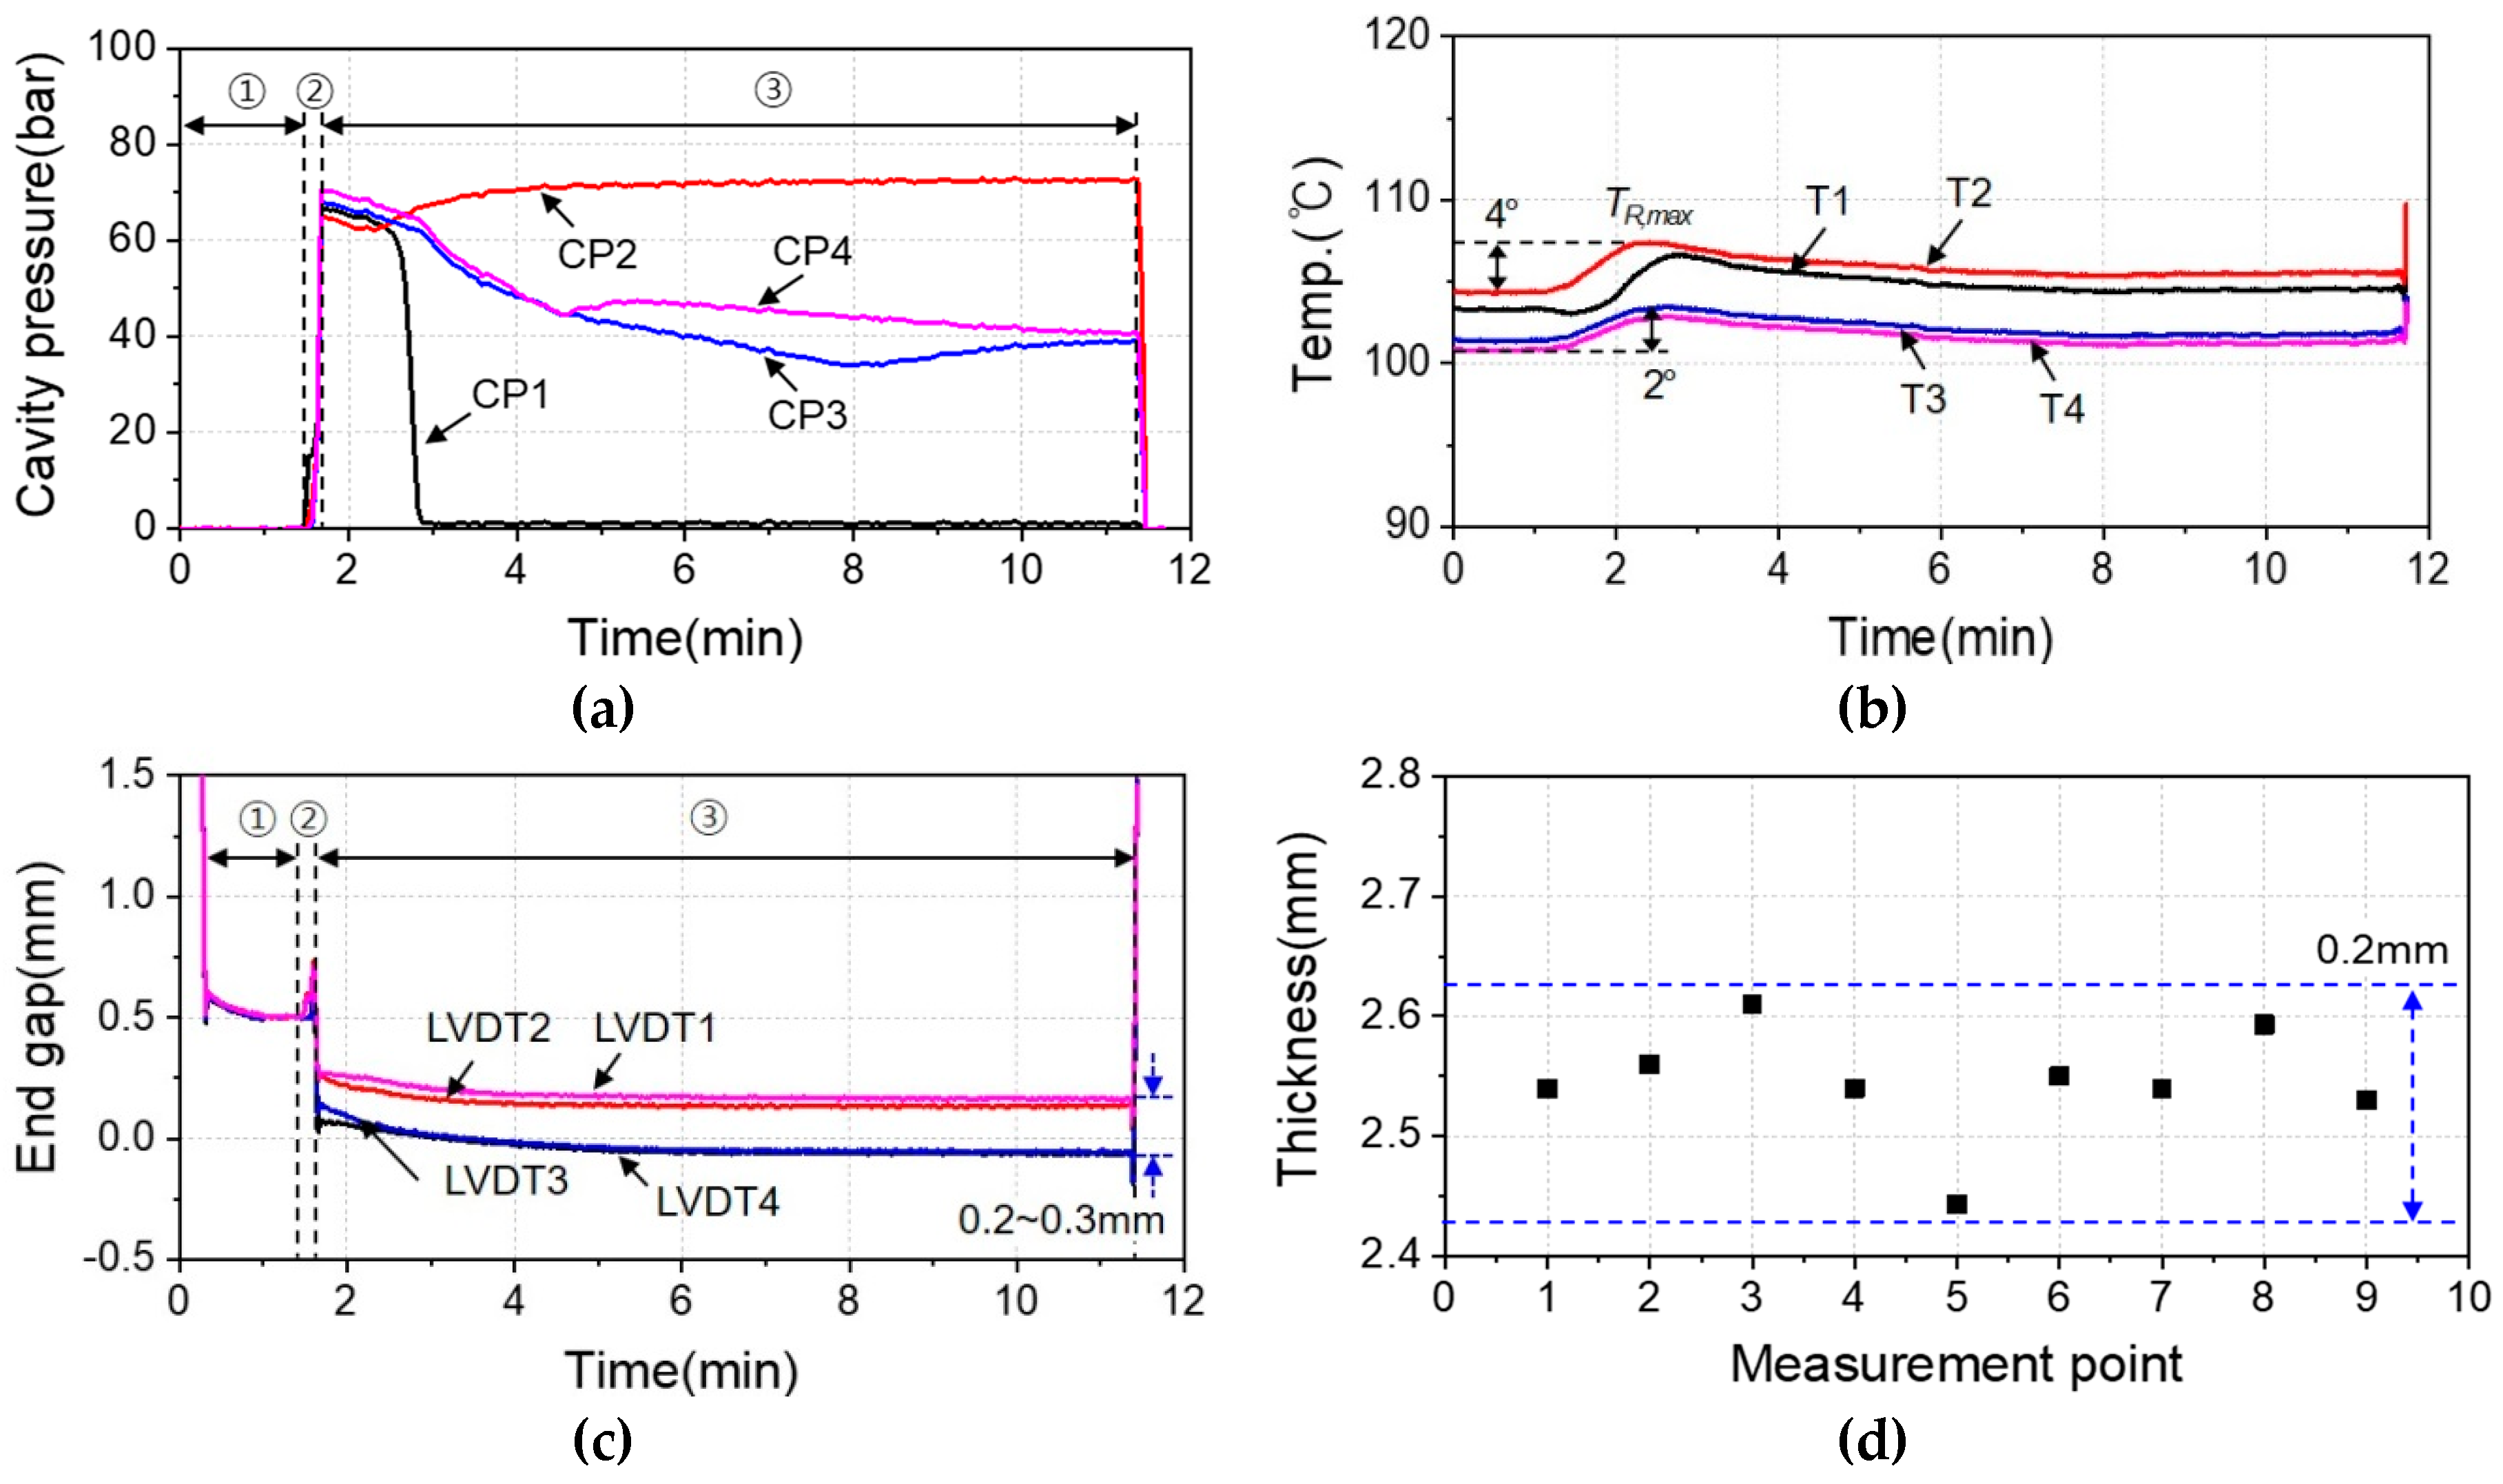
Figure 13 shows the detected sensor signals when the initial temperature of the mold was low. The carbon fiber layups used only eight sheets in identical experimental conditions. The cavity pressure CP2 in Figure 13a was maintained at a constant in the curing step (③) but the cavity pressure CP3–4 was reduced by about 20 bar, as compared to CP2 unlike the normal states in Figure 13a. The cavity pressures CP3 and CP4 also varied at about 480 s and 180 s in the curing step. In Figure 13b, the temperature T1–2 increased to 4 °C and T3–4 to 2 °C compared to the initial temperature after the curing step. The deviation in the end-gap between LVDT1–2 and LVDT3–4 was 0.2–0.3 mm in Figure 13c and the thickness of the CFRP specimen was as shown in Figure 13d. The deviation of the end-gap between LVDT1–2 and LVDT3–4 was 0.2–0.3 mm as shown in Figure 13c. The thickness of the CFRP specimen in Figure 14d was 2.55 mm on average and deviated by 0.2 mm. In the curing step, the temperature T1–2 started to cure at about 105 °C but the maximum reaction temperature was 4 °C despite the slow reaction rate compared to the normal state. The cavity pressure CP2 was maintained at a constant at this time. The temperature T3–4 started at 100 °C due to the initial temperature of the mold, which was lower than the set value of 110 °C. The reaction rate of the resin had slowed, the maximum reaction temperature was not 4 °C, and the pressure had also become unstable. Therefore, curing occurred up to the central portions (CP2 and T2) of the mold but only occurred partially at the end portions (CP3–4 and T3–4). The CFRP specimen was not uniformly compressed because it had some uncured layers and the thickness variation increased. Due to the presence of some uncured layers and the thickness variation increasing, the CFRP specimen was not uniformly compressed.
4.2.2. Partial Impregnation
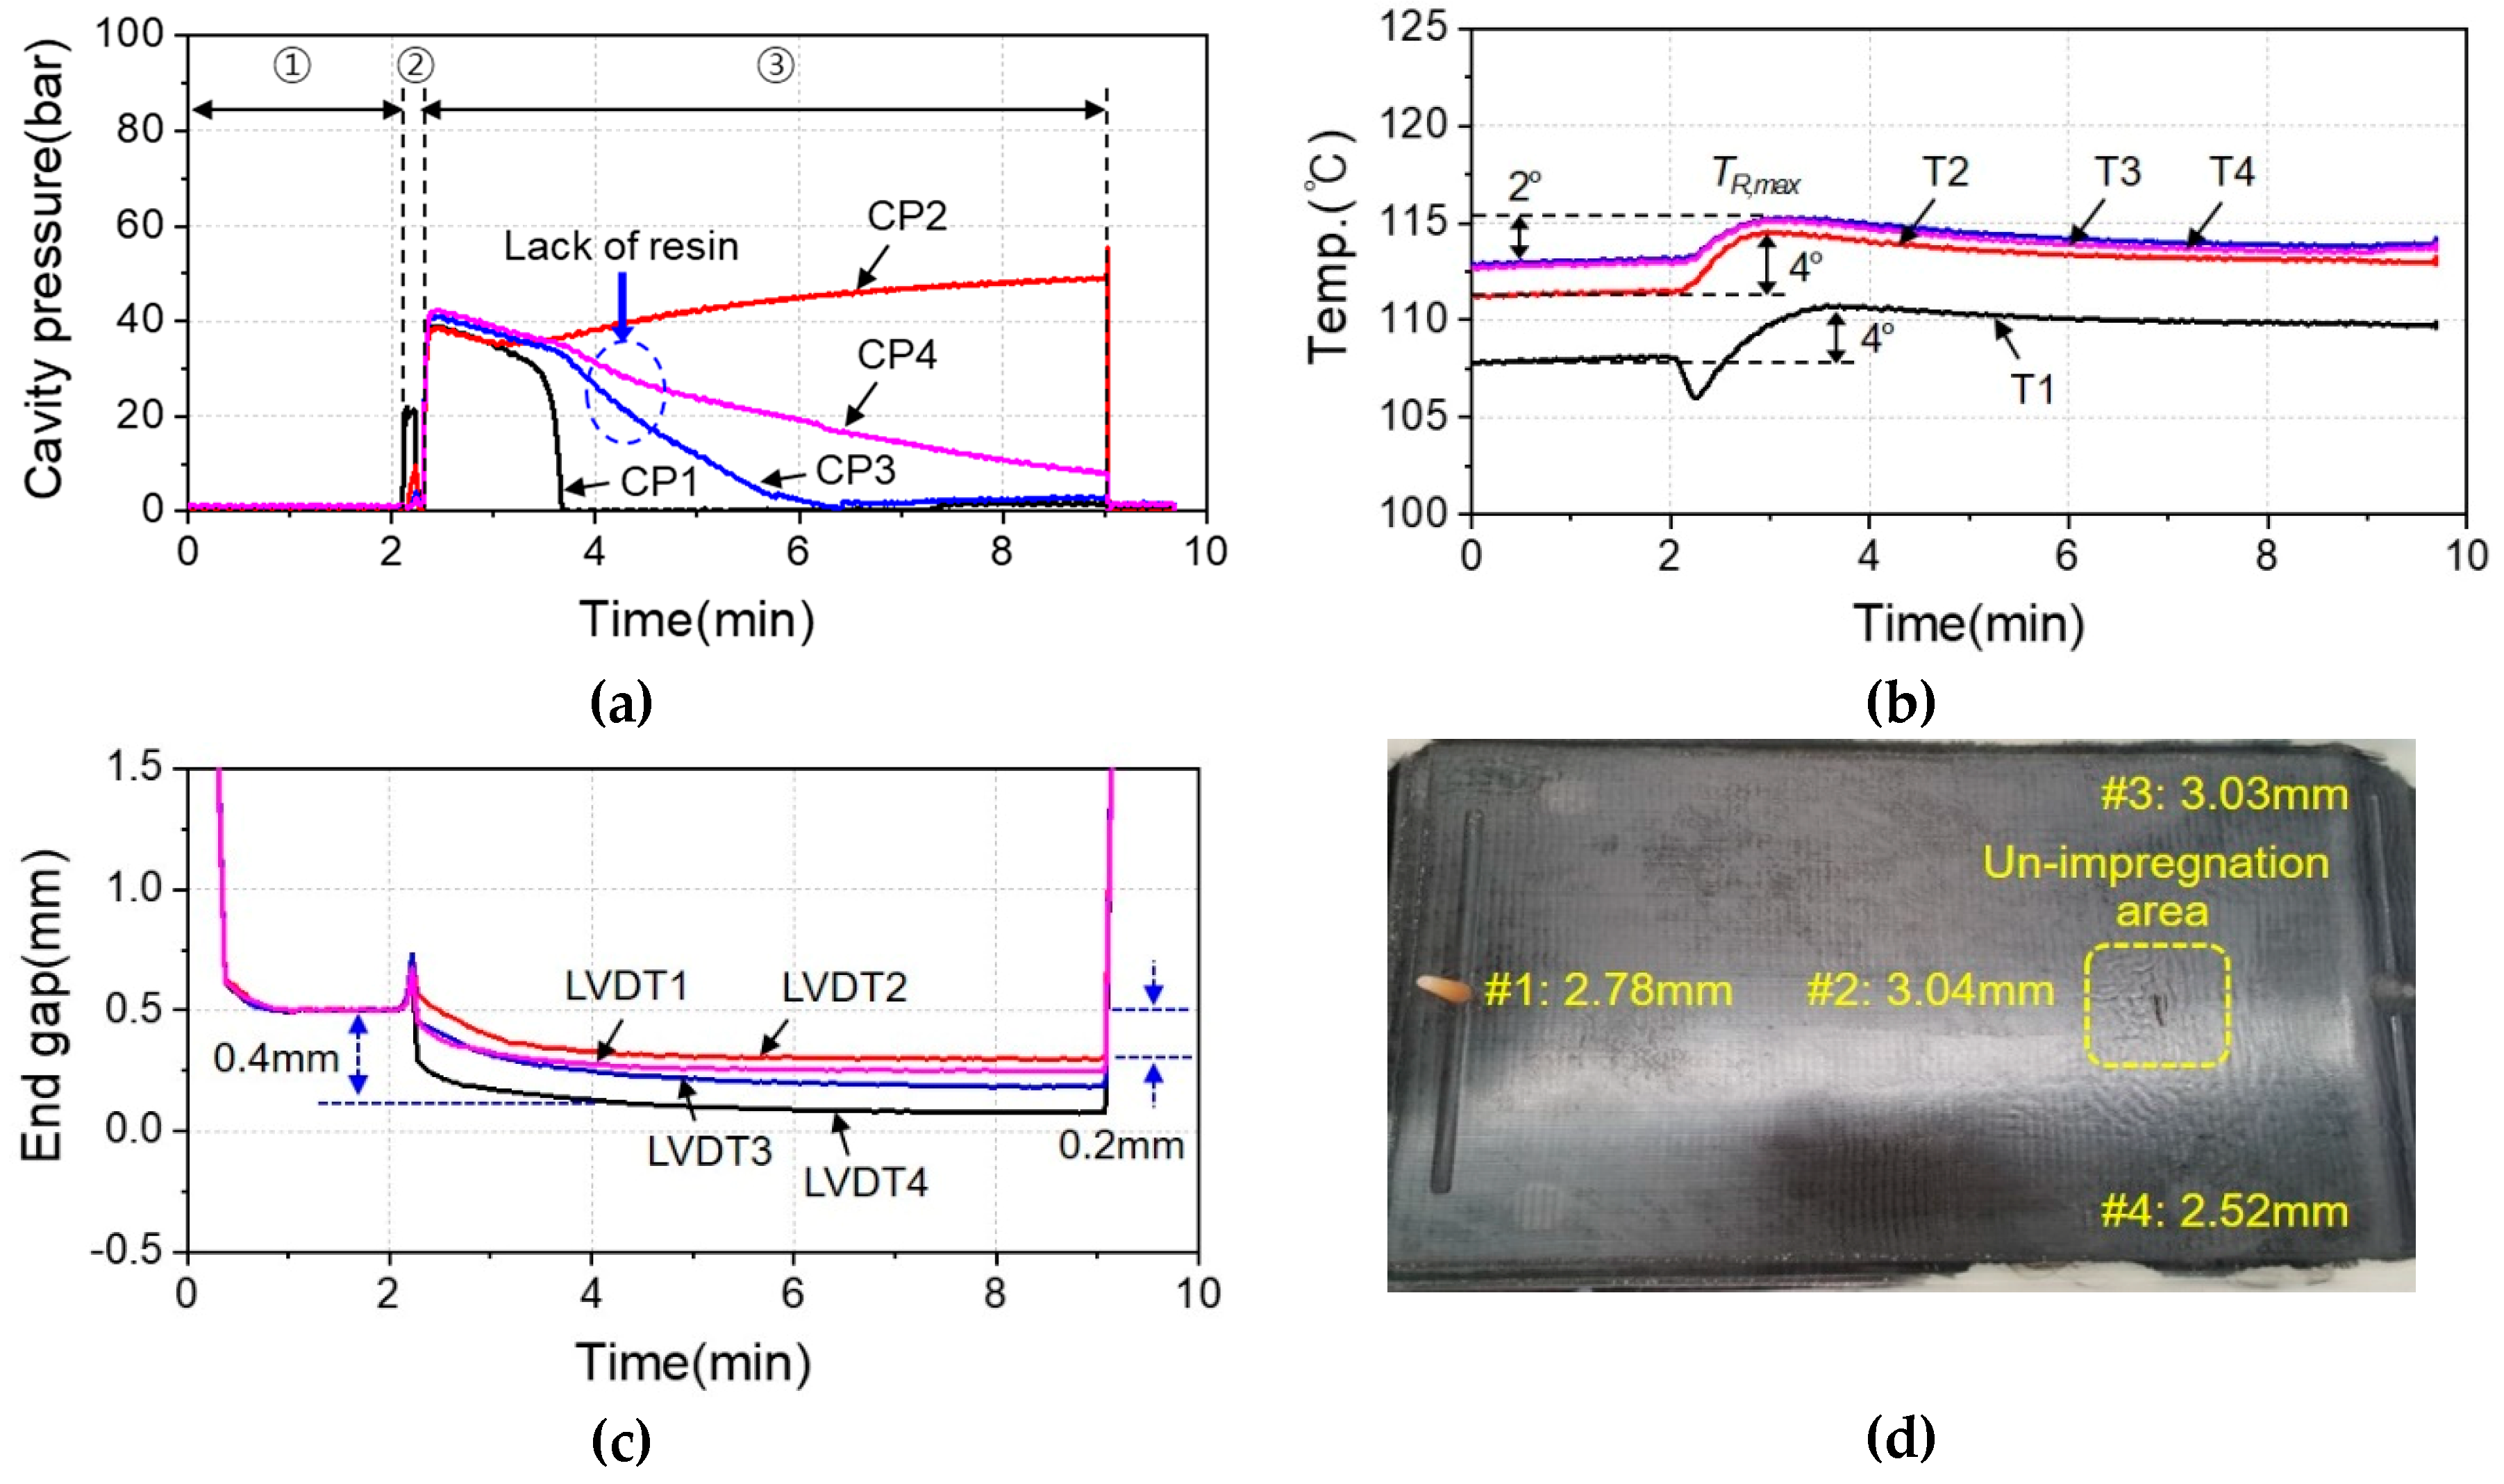
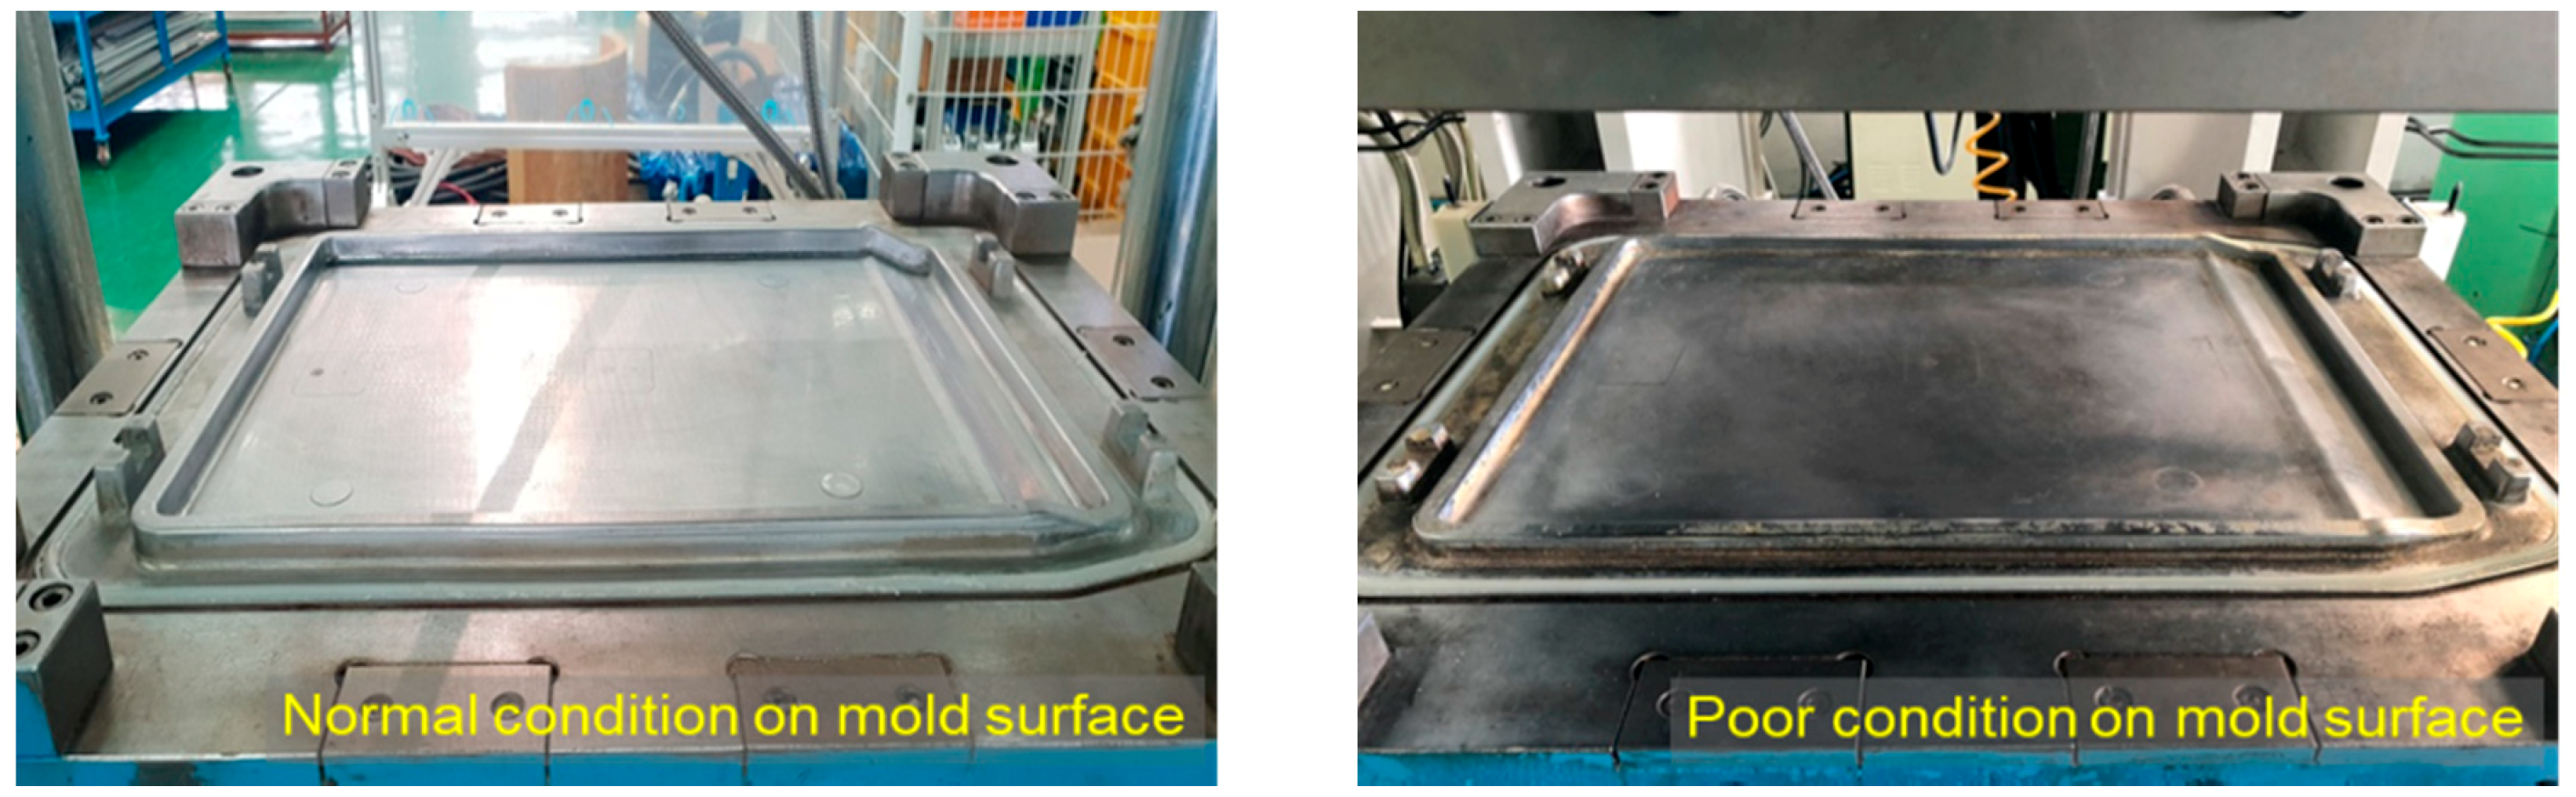
In the HP-RTM process, the most important factor that influences the quality of the CFRP surface is the surface integrity of the mold surface transferred to the surface of the CFRP specimen and the resin flow. Figure 14 shows the signals and CFRP specimen when the un-impregnation occurred due to the mold having a defective surface. The carbon fiber layup used seven sheets and signals were acquired until the curing time of 500 s unlike in other experiments. In the curing step (③) shown in Figure 14a, the cavity pressure CP2 continuously increased but CP3–4 decreased to below 10 bar upon the completion of curing. The maximum reaction temperature of T1–2 was 4 °C and that of T3–4 was 2 °C in shown Figure 14b. In Figure 14c, the end-gap of the mold was set at 0.5 mm but the LVDT measured 0.2–0.4 mm. Figure 14d indicates the CFRP specimen that had the 3.04 mm thickness at the center (#2), the 2.52 mm thickness at the end (#4), and un-impregnation area between #3 and #4. Figure 15 shows a photo of the surface of the mold. In the curing step (②), the flow rate of the resin was decreased by the friction on the mold surface, which made the diffusion more difficult, and the resin stagnated on the mold’s rough surface of the mold. The resin injected at a high pressure was impregnated normally in the region near the injection port but the resin flow was uneven as further from the injection port, so un-impregnation occurred. The stagnation of resin flow is provoked at the central region of the mold, which causes the amount of resin, pressure, and CFRP thickness to increase. Therefore, the resin was not uniformly distributed in the mold and the end-gap was opened 0.3 mm and thus did not reach the set value of 0.5 mm. The cavity pressure CP3–4 decreased because the end-gap did not close completely. The maximum reaction temperature of T3–4 was not attained by the lack of resin and the thickness of the specimen was smaller than the average value.
4.2.3. Broken Seal of Mold
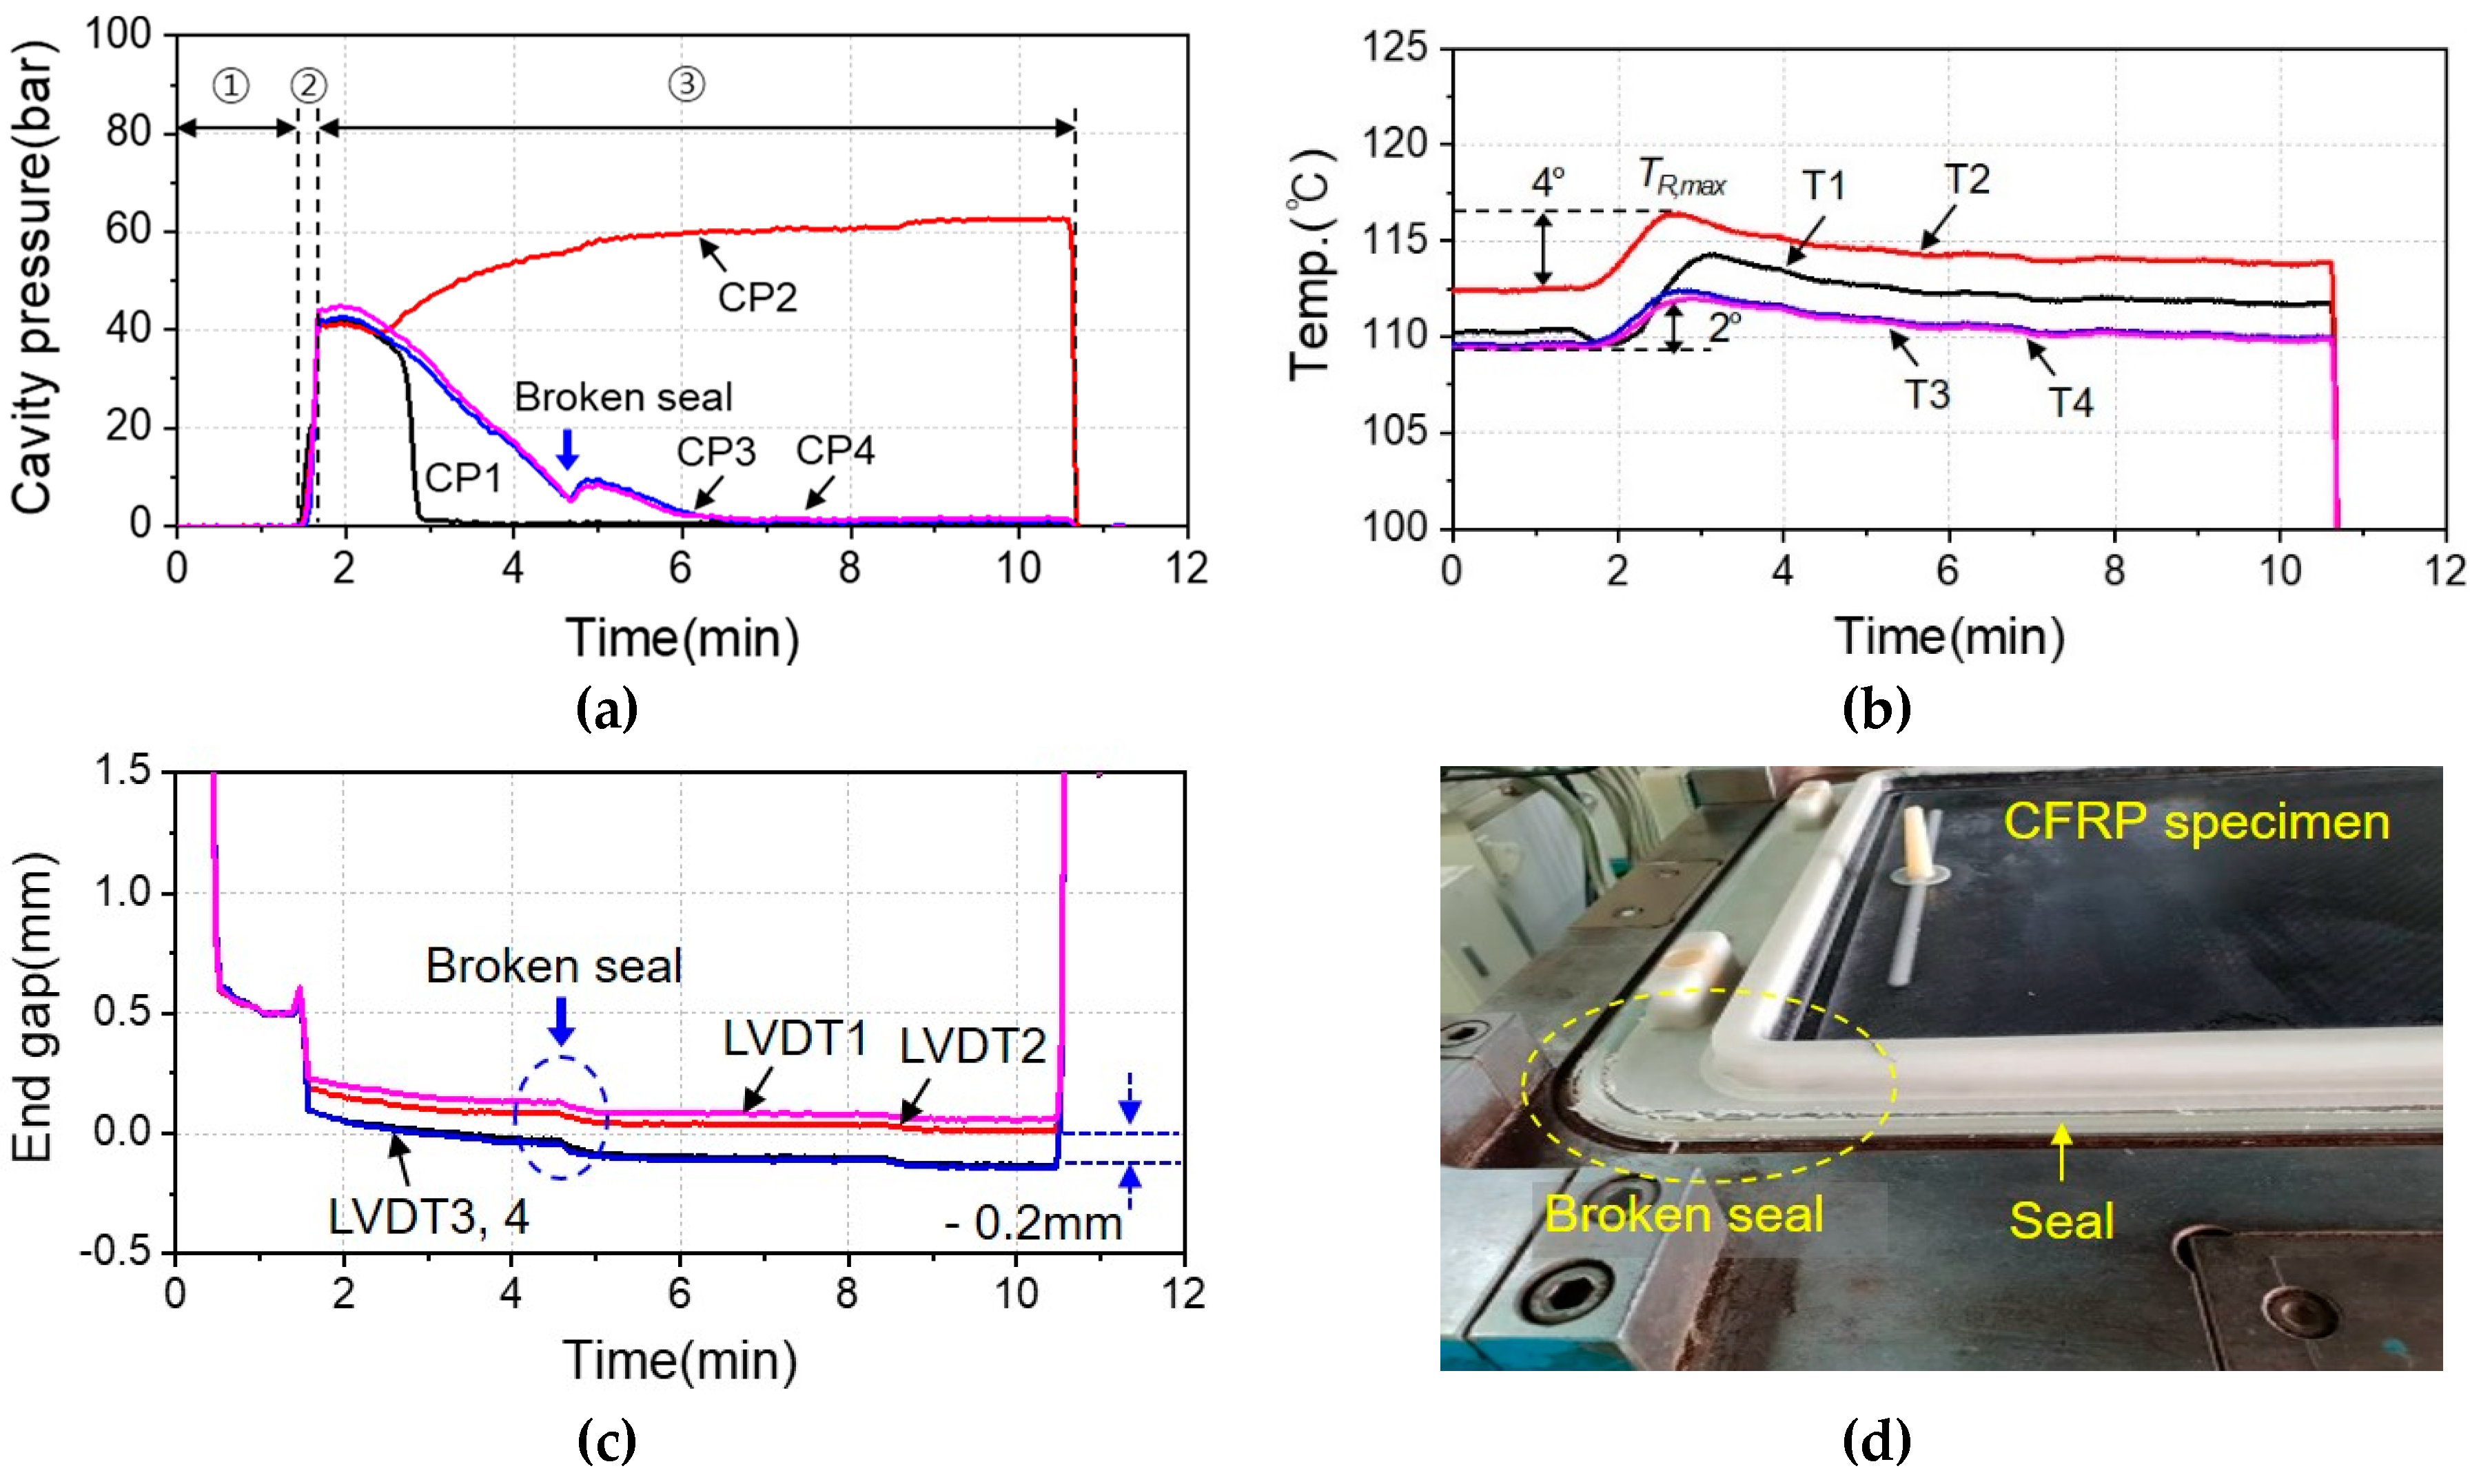
The mold seal both prevents resin leakage and maintains the internal pressure at a constant to maintain the shape of the CFRP specimen until the resin has fully cured. Figure 16 shows the results acquired at the mold with a broken seal when the carbon fiber layup used was seven sheets. In Figure 16a, the cavity pressure CP1–4 increased initially up to approximately 45 bar after compressing in the curing step (③) and in particular, the cavity pressure CP2 increased gradually after three minutes after curing initiated. Meanwhile, the cavity pressure CP3–4 fell rapidly. The maximum reaction temperature of T1–2 was 4 °C and that for of T3–4 was 2 °C as shown in Figure 16b. In Figure 16c, the LVDT signals also varied at the point where the cavity pressure decreased. In particular, the end-gap was completely closed from LVDT1–2 signals. However, LVDT3–4 fell to −0.2 mm, below the set value. Figure 16d shows the photograph of the mold with the broken seal. The seal was broken after three minutes from the initiation of curing but the resin did not leak due to the cured resin. The LVDT signals were reduced to below 0 mm due to the shrinkage of the resin and the broken seal. Therefore, the states of the mold seal could be monitored with the cavity pressure, temperature, and LVDT signals.
5. Conclusions
Monitoring the conditions of the process parameters such as the cavity pressure, temperature, and end-gap plays an important role in the HP-RTM process to produce good-quality CFRP and reduce the cycle time. In addition, it is used to determine the optimal molding process conditions. In the present study, pressure and temperature sensors were installed both at the mixing head and in the mold and LVDTs were attached to the edge of the mold to monitor the process conditions in real-time. The developed embedded monitoring system consisted of a signal processing board, a single board computer, amplifiers, filters and terminal boards. The acquired sensor signals were processed by the monitoring system based on FPGA at high speed and the signals detected and analyzed in the HP-RTM process were displayed through the HMI programmed with LabVIEW. The HP-RTM process was largely divided into the three steps of vacuum, injection, and curing. The pressure and temperature of the resin circulated in the supply line during the vacuum step were monitored. In the injection step, the pressure and temperature in the mixing head were detected in the resin injection. It was possible to monitor the resin flow, impregnation, and curing state with the cavity pressure sensors installed at various distances from the injection port. When the injection step was completed, the impregnated and cured states of the resin could be predicted from the pressure deviation of the cavity pressure sensors (CP1–4) inside the mold. The temperature sensors (T1–4) could also detect the reaction heat generated by the resin that was curing. In the case of the constant mixing ratio of the resin and hardener, the curing reaction state of the resin could be determined by detecting the maximum reaction heat and the reaction rate of the resin. It was, therefore, possible to detect abnormal conditions such as the resin flow, curing state, non-impregnation, and the breakage of the mold seal by monitoring the pressure and temperature. In addition, the compressed state of the press, the balance of the mold, and the thickness of the CFRP specimen could be inferred from the change in the end-gap by the LVDT. In this study, the proposed FPGA-based embedded monitoring system was capable of high-speed real-time signal processing using multiple sensors such as pressure, temperature, and LVDT sensors. In addition, the feasibility of the condition monitoring of HP-RTM molding process was confirmed, all of which affected the CFRP quality in the actual field. Although the monitoring system was designed and manufactured to be suitable for the HP-RTM process, it can be applied to processes such as conventional RTM and Compression RTM.
Author Contributions
Research conceptualization, results analysis, and writing—original draft preparation, R.-W.K.; writing—review and editing, S.-R.K.; data analysis and programming, C.-M.K.; experiment and signal processing; K.-H.H.
Conflicts of Interest
The authors declare no conflict of interest.
References
- Rahmani, H.; Najafi, S.H.; Ashori, A. Mechanical performance of epoxy/carbon fiber laminated composites. J. Reinf. Plast. Compos. 2014, 33, 733–740. [Google Scholar] [CrossRef]
- Dai, Z.; Shi, F.; Zhang, B.; Li, M.; Zhang, Z. Effect of sizing on carbon fiber surface properties and fibers/epoxy interfacial adhesion. Appl. Surf. Sci. 2011, 257, 6980–6985. [Google Scholar] [CrossRef]
- Gutowski, T.G. Advanced Composites Manufacturing; John Wiley & Sons: New York, NY, USA, 1997. [Google Scholar]
- Rufe, P.D. Fundamentals of Manufacturing, 2nd ed.; Society of Manufacturing Engineer Editor: Dearborn, MI, USA, 2002. [Google Scholar]
- Morey, B. Innovation Drives Composite Production Manufacturing. Manuf. Eng. Mag. Soc. Manuf. Eng. Ed. 2009, 142, 49–60. [Google Scholar]
- Han, S.H.; Cho, E.J.; Lee, H.C.; Jeong, K.; Kim, S.S. Study on high-speed RTM to reduce the impregnation time of carbon/epoxy composites. Compos. Struct. 2015, 119, 50–58. [Google Scholar] [CrossRef]
- Kim, P.J.; Lee, D.G. Surface quality and shrinkage of the composite bus housing panel manufactured by RTM. Compos. Struct. 2002, 57, 211–220. [Google Scholar] [CrossRef]
- Naik, N.K.; Sirisha, M.; Inani, A. Permeability characterization of polymer matrix composites by RTM/VARTM. Prog. Aerosp. Sci. 2014, 65, 22–40. [Google Scholar] [CrossRef]
- Rosenberg, P.; Chaudhari, R.; Karcher, M.; Henning, F.; Elsner, P. Investigating cavity pressure behavior in high-pressure RTM process variants. AIP Conf. Proc. 2014, 1593, 463–466. [Google Scholar]
- Henning, F.; Kärgera, L.; Dörra, D.; Schirmaiera, F.; Seufferta, J.; Bernatha, A. Fast processing and continuous simulation of automotive structural composite components. Compos. Sci. Technol. 2019, 171, 261–279. [Google Scholar] [CrossRef]
- Liu, B.; Bickerton, S.; Advanit, S.G. Modelling and simulation of resin transfer moulding (RTM)-gate control, venting and dry spot prediction. Composites Part A 1996, 27, 135–141. [Google Scholar] [CrossRef]
- Schmachtenberg, E.; Schulte zur Heide, J. Application of ultrasonics for the process control of Resin Transfer Moulding (RTM). Polym. Test. 2005, 24, 330–338. [Google Scholar] [CrossRef]
- Rosenberg, P.; Thoma, B.; Henning, F. Chracterization of epoxy and polyurethane resin systems for manufacturing of high-performance composites in high-pressure RTM process. In Proceedings of the 15th-Annual SPE Automotive Composites Conference & Exhibition, Novi, MI, USA, 9–11 September 2015. [Google Scholar]
- Chaudhari, R.; Rosenberg, P.; Karcher, M.; Schmidhuber, S.; Elsner, P.; Henning, F. High pressure RTM process variants for manufacturing of carbon fiber reinforced composites. In Proceedings of the 19th International Conference on Composite Materials, Montreal, QC, Canada, 28 July–2 August 2013. [Google Scholar]
- Moghaddam, M.K.; Breede, A.; Brauner, C.; Lang, W. Embedding Piezoresistive Pressure Sensors to Obtain Online Pressure Profiles Inside Fiber Composite Laminates. Sensors 2015, 15, 7499–7511. [Google Scholar] [CrossRef]
- Gupta, A.; Kelly, P.A.; Ehrgott, M.; Bickerton, S. A surrogate model based evolutionary game-theoretic approach for optimizing non-isothermal compression RTM processes. Compos. Sci. Technol. 2013, 84, 92–100. [Google Scholar] [CrossRef]
- Yildiz, M.; Ozdemir, N.G.; Bektas, G.; Keulen, C.J.; Boz, T.; Sengun, E.F.; Ozturk, C.; Menceloglu, Y.Z.; Suleman, A. An Experimental Study on the Process Monitoring of Resin Transfer Molded Composite Structures Using Fiber Optic Sensor. J. Manuf. Sci. Eng. 2012, 134, 044502. [Google Scholar] [CrossRef]
- Dunkers, J.P.; Lenhart, J.L.; Kueh, S.R.; van Zanten, J.H.; Advani, S.G.; Parnas, R.S. Fiber optic flow and cure sensing for liquid composite molding. Opt. Lasers Eng. 2001, 35, 91–104. [Google Scholar] [CrossRef]
- Kikuchi, A. An Experimental Investigation of Real-Time Product Quality Sensing During Molding Processes. Master’s Thesis, Lehigh University, Bethlehem, PA, USA, 1993; p. 99. [Google Scholar]
- Sorrentino, L.; Bellini, C. In-process monitoring of cure degree by coplanar plate sensors. Int. J. Adv. Manuf. Technol. 2016, 86, 2851–2859. [Google Scholar] [CrossRef]
- Laurent-Mounier, A.; Binétruy, C.; Krawczak, P. Multipurpose carbon fiber sensor design for analysis and monitoring of the resin transfer molding of polymer composites. Polym. Compos. 2005, 26, 717–730. [Google Scholar] [CrossRef]
- Kaynak, C.; Kas, Y.O. Effects of Injection Pressure in Resin Transfer Moulding (RTM) of Woven Carbon Fibre/Epoxy Composites. Polym. Polym. Compos. 2006, 14, 55–61. [Google Scholar] [CrossRef]
- Chang, C.; Hourng, L. Effect of Process Variables on the Quality of Compression Resin Transfer Molding. J. Reinf. Plast. Compos. 2006, 25, 1027–1037. [Google Scholar] [CrossRef]
- Ikegawa, N.; Hamada, H.; Maekawa, Z. Effect of compression process on void behavior in structural resin transfer molding. Polym. Eng. Sci. 1996, 36, 953–962. [Google Scholar] [CrossRef]
- Lundström, T.S.; Gebart, B.R. Influence From Process Parameters on Void Formation in Resin Transfer Molding. Polym. Compos. 1994, 15, 25–33. [Google Scholar] [CrossRef]
- Ramos, J.A.; Pagani, N.; Riccardi, C.C.; Borrajo, J.; Goyanes, S.N.; Mondragon, I. Cure kinetics and shrinkage model for epoxy-amine systems. Polymer 2005, 46, 3323–3328. [Google Scholar] [CrossRef]
Figure 1.
Flow diagram of the HP-RTM process.

Figure 2.
Process parameters of HP-RTM.

Figure 3.
Schematic diagram of the HP-RTM parameters according to time.

Figure 4.
Sensor layout: (a) The HP-RTM equipment; (b) Mold.

Figure 5.
Schematic representation of the monitoring system.

Figure 6.
HMI of the HP-RTM monitoring.

Figure 7.
Embedded monitoring system.

Figure 8.
Experimental setup for (a) Mixing head; (b) Mold; (c) The HP-RTM equipment and monitoring system.
Figure 8.
Experimental setup for (a) Mixing head; (b) Mold; (c) The HP-RTM equipment and monitoring system.

Figure 9.
Results of the HP-RTM injection process: (a) Cavity pressures and injection pressure; (b) Resin temperature.
Figure 9.
Results of the HP-RTM injection process: (a) Cavity pressures and injection pressure; (b) Resin temperature.

Figure 10.
Results of the HP-RTM complete process: (a) Cavity pressures; (b) Temperature.

Figure 11.
Results of the HP-RTM complete process: (a) End-gap; (b) The CFRP thickness.

Figure 12.
The resin flow front during the HP-RTM process: (a) The initial injection process; (b) The resin flow principally in the gap and CFRP specimen; (c) Resin flowing from the upper part into the lower part and mold edge; (d) The resin flow goes through the mold wall; (e) The end-gap closes and compresses; (f) The impregnation is complete and cures.

Figure 13.
Results of the HP-RTM process: (a) Cavity pressure; (b) Temperature; (c) End-gap; (d) The CFRP thickness.
Figure 13.
Results of the HP-RTM process: (a) Cavity pressure; (b) Temperature; (c) End-gap; (d) The CFRP thickness.

Figure 14.
Results of partially impregnated in the HP-RTM process: (a) Cavity pressure; (b) Temperature; (c) End-gap; (d) The CFRP thickness and specimen.
Figure 14.
Results of partially impregnated in the HP-RTM process: (a) Cavity pressure; (b) Temperature; (c) End-gap; (d) The CFRP thickness and specimen.

Figure 15.
Comparison of the mold in the good and poor conditions.

Figure 16.
Results of broken sealing in the HP-RTM process: (a) Cavity pressure; (b) Temperature; (c) End-gap; (d) Broken sealing of the mold.
Figure 16.
Results of broken sealing in the HP-RTM process: (a) Cavity pressure; (b) Temperature; (c) End-gap; (d) Broken sealing of the mold.


Table 1.
Sensor specification.
| Monitoring Parts | Sensors | Specifications | Number of Sensors | ||
|---|---|---|---|---|---|
| Mixing head | Pressure (S-11, WIKA) | Range | bar | 0~250 | 2 ea |
| Accuracy | % | 0.5 | |||
| Analog output | mA | 4~20 | |||
| Temperature (TM4101, IFM) | Type | - | Pt 100 | 2 ea | |
| Range | °C | 0~150 | |||
| Mold | Cavity pressure (6161A, Kistler) | Range | bar | 0~200 | 4 ea |
| Sensitivity | pC/bar | 18.5 | |||
| Analog output | V | 0~10 | |||
| Temperature (6194B, Kistler) | Type | - | K | 4 ea | |
| Range | °C | 0~200 | |||
| Analog output | V | 0~10 | |||
| LVDT (GT2-Keyence) | Range | mm | 0~12 | 4 ea | |
| Accuracy | μm | 1 | |||
| Analog output | mA | 4~20 | |||
Table 2.
Experimental conditions.
| Parameter | Conditions |
|---|---|
| Press force (kN) | 3000 |
| Mixing head pressure (bar) | 125 |
| Resin temperature (°C) | 80 |
| Hardener temperature (°C) | 45 |
| Mixing ratio | 100:20 |
| Mold temperature (°C) | 110 |
| Injection rate (g/s) | 64.7 |
| Injection time (s) | 9.5 |
| End-gap (mm) | 0.5 |
| Curing time (s) | 500, 600 |
| Carbon sheet number | 7, 8 |
© 2019 by the authors. Licensee MDPI, Basel, Switzerland. This article is an open access article distributed under the terms and conditions of the Creative Commons Attribution (CC BY) license (http://creativecommons.org/licenses/by/4.0/).
Share and Cite
MDPI and ACS Style
Kim, R.-W.; Kim, C.-M.; Hwang, K.-H.; Kim, S.-R. Embedded Based Real-Time Monitoring in the High-Pressure Resin Transfer Molding Process for CFRP. Appl. Sci. 2019, 9, 1795. https://0-doi-org.brum.beds.ac.uk/10.3390/app9091795
AMA Style
Kim R-W, Kim C-M, Hwang K-H, Kim S-R. Embedded Based Real-Time Monitoring in the High-Pressure Resin Transfer Molding Process for CFRP. Applied Sciences. 2019; 9(9):1795. https://0-doi-org.brum.beds.ac.uk/10.3390/app9091795
Chicago/Turabian StyleKim, Roh-Won, Churl-Min Kim, Kyung-Hwan Hwang, and Sung-Ryul Kim. 2019. "Embedded Based Real-Time Monitoring in the High-Pressure Resin Transfer Molding Process for CFRP" Applied Sciences 9, no. 9: 1795. https://0-doi-org.brum.beds.ac.uk/10.3390/app9091795
Note that from the first issue of 2016, this journal uses article numbers instead of page numbers. See further details here.