GIS-Based Solar Radiation Mapping, Site Evaluation, and Potential Assessment: A Review


1
Department of Energy Resources Engineering, Pukyong National University, Busan 48513, Korea
2
Department of Energy Engineering, Kangwon National University, Samcheok 25913, Korea
*
Author to whom correspondence should be addressed.
Appl. Sci. 2019, 9(9), 1960; https://0-doi-org.brum.beds.ac.uk/10.3390/app9091960
Submission received: 11 February 2019
/
Revised: 6 April 2019
/
Accepted: 8 May 2019
/
Published: 13 May 2019
(This article belongs to the Special Issue Solar Power System Planning & Design: Resource Assessment, Site Evaluation, System Design, Production Forecasting and Feasibility Studies)
Abstract
:In this study, geographic information system (GIS)-based methods and their applications in solar power system planning and design were reviewed. Three types of GIS-based studies, including those on solar radiation mapping, site evaluation, and potential assessment, were considered to elucidate the role of GISs as problem-solving tools in relation to photovoltaic and concentrated solar power systems for the conversion of solar energy into electricity. The review was performed by classifying previous GIS-based studies into several subtopics according to the complexity of the employed GIS-based methods, the type of solar power conversion technology, or the scale of the study area. Because GISs are appropriate for handling geospatial data related to solar resource and site suitability conditions on various scales, the applications of GIS-based methods in solar power system planning and design could be expanded further.
1. Introduction
With growing concerns about greenhouse gas emissions, the security of conventional energy supplies, and the environmental safety of conventional energy production techniques, renewable energy systems are becoming increasingly important and are receiving a great deal of political attention [1]. In particular, photovoltaic (PV) and concentrated solar power (CSP) systems for the conversion of solar energy into electricity have been found to be technologically robust, scalable, and geographically dispersed and possess enormous potential as sustainable energy sources [2] (The full terms and their abbreviations referred to in the paper are summarized on the last page of this paper). Despite the advances in PV and CSP technology, inappropriate planning and design could impede the extensive penetration of solar energy. Systematic planning and design considering various factors and constraints are necessary to deploy PV and CSP systems successfully.
To achieve these objectives, geographic information system (GIS)-based methods have been applied effectively for rational solar power system planning and design. GISs have often been combined with analytical models and methods (e.g., probability/statistical, machine learning, and data mining methods) to complement the inherent capabilities of GISs in evaluating the spatial patterns or characteristics of events and their attributes.
The objective of this study was to review the GIS-based methods and applications currently used for solar radiation mapping, site evaluation, and potential assessment associated with PV and CSP systems. The scope of this review was confined to published literature related to GIS-based methods and applications in solar radiation mapping, site evaluation, and potential assessment of PV and CSP systems. There are numerous recent review papers dealing with solar potential [3,4]. The distinct difference between the aforementioned studies and this paper is the scope of GIS applications. In this study, we tried to investigate and summarize overall roles and applications of GIS to research associated with solar energy (not only focused to solar potential). Keywords (i.e., GIS, solar or PV or CSP, modeling or radiation or mapping or evaluation, or assessment) were inputted into the Google Scholar website to search the published literature, and 92 articles were selected for review. Specifically, three different keywords (A, B, and C) were combined and inputted to search papers (e.g., GIS, PV, and modeling). Then, 92 articles were selected for review by analyzing the title of the searched papers by authors. Even so, it should be noted that the number of papers included in this topic is not necessarily 92. Articles concerning remote sensing technologies for solar radiation mapping were excluded from this study if they did not involve any GIS-based methods.
This paper is organized into five sections. Section 1 introduced the main concept. Section 2 reviews the literature dealing with solar radiation mapping using GISs. Section 3 and Section 4 describe the GIS-based methods and applications for solar site evaluation (geospatial suitability) and solar potential assessment (electricity production), respectively. Finally, the conclusions are summarized in Section 5.
2. Solar Radiation Mapping Using GISs
2.1. Overview
Solar radiation is the most important consideration when installing PV or CSP plants. Therefore, it is necessary to identify areas where solar radiation is abundant and to predict the spatial and temporal distribution of solar radiation for effective solar resource utilization. GISs are very useful in spatial and temporal analyses of solar resources while implementing location-specific technologies.
Solar radiation analysis can be performed for points such as stations as well as for many pixels over a large area. It may also be conducted for specific administrative districts. In addition to spatial mapping of solar radiation, analysis and visualization over time are performed. The spatial and temporal considerations are summarized in Table 1 based on the reviewed literature.
The solar radiation analysis methods using GISs can be classified according to the type of data employed. If solar radiation data are obtained at certain stations, it is useful to estimate the solar radiation through interpolation in the areas in which it is not measured. In addition, there have been some studies on solar radiation prediction at stations that acquire other weather information but do not obtain solar radiation information. If there are no data for stations at which observations are made, solar radiation models can be employed considering various geographical and terrain information. These methods are focused on predicting or mapping solar radiation. On the other hand, there have been many studies on analysis or simply visualization of the information about the solar resources in the area using the existing solar radiation map as a database (DB). The methods and types of data used for solar radiation analysis are summarized in Table 1 based on the reviewed literature.
2.2. Solar Radiation Map as a Spatial DB
There have been several studies that analyze the solar energy information in the area using the existing solar radiation map. These studies do not directly perform solar radiation mapping but use existing solar radiation maps to predict sunshine hours per year or to predict and compare regional solar radiation [5].
Some studies have compared the solar data extracted from the solar radiation map with the surface-measured data such as global horizontal irradiance (GHI), direct normal irradiance (DNI), diffuse horizontal irradiance (DHI), and the daily average clearness index to verify the accuracy and applicability of these solar radiation maps [6,7]. The solar radiation maps constructed by various sources such as Solargis (Slovakia), the National Renewable Energy Laboratory (NREL) in the US, and the Energy Sector Management Assistance Program (ESMAP) of the World Bank are used as the spatial database of solar energy information.
Some studies were conducted for further analysis using solar radiation maps as DBs. The PV potential, power production, and economic effects can be estimated from a solar resource map using the software like RETScreen (Natural Resources Canada, Canada) shown in Figure 1 [8]. In addition, the impact of climate change can be analyzed using the solar radiation map [9]. In these studies, solar radiation maps constructed by the institution of each target country such as Korea Meteorological Administration (Seoul, Korea) and Met office (Exeter, UK) were used. Interactive web applications have also been developed that can assess the potential PV electricity generation in Europe, taking into account the solar energy data and climatic parameters from the solar radiation map [10].
2.3. Spatial Solar Radiation Mapping Using Interpolation Methods
GIS maps facilitate the assessment of radiation at various locations and times without measurement equipment. Because solar data are not available for all potential sites, there have been some attempts to estimate the spatial distributions of solar radiation or other parameters.
Probable relationships among the radiation-related parameters can be used to map the global solar radiation at sites where data were not available [11]. The interpolation method based on inverse distance weight or spatial autocorrelation is a very useful tool for solar radiation mapping. The interpolation methods have been widely used in many studies in various countries [12,13]. These methods have the advantage of predicting the entire area of the solar radiation in the form of grids based on the data of the stations where observations are made. In addition, solar radiation mapping based on satellite image can be performed using the certified method and it can be verified through observation data. For example, a solar atlas for Pakistan was made using Meteosat-7 satellite data by validating it with ground measurements based on the ESMAP approach. To adapt the radiation data to the measured datasets, the impacts of different aerosol models were evaluated [14].
2.4. Solar Radiation Estimation for Stations with No Solar Radiation Records
Because some nations have limitations on the number of stations recording solar radiation, due to the expense of acquiring data using precise sensors at all sites, the extent to which the accuracy of solar radiation mapping can be improved is limited. Therefore, attempts have been made to predict solar radiation at stations without solar radiation data by using the solar radiation measurements of other stations. This approach has the advantage that the accuracy of a specific point can be improved over that achievable using a mapping method in which spatial prediction is only performed via interpolation.
ANN is used to perform training in areas where data are present and to perform testing on areas without solar radiation records. It is important to know which input variables other than solar radiation are used for training. Variables such as average temperature, average relative humidity, average sunshine duration, average wind speed, average precipitation, longitude, latitude, and month of the year can be considered to estimate the monthly solar radiation [15]. To increase the accuracy of ANN, a multi-regression analysis and a genetic algorithm can be combined to develop a monthly average daily solar radiation (MADSR) estimation model for locations without measured data [16]. This method can also be combined with the Kriging interpolation to improve the prediction accuracy [17,18].
2.5. Solar Radiation Model
Solar radiation models integrated with GISs are also employed to generate spatial DBs. Solar radiation information over large territories can be provided by these models by considering surface inclination, aspect, and shadowing effects. In particular, these models can be useful for predicting solar radiation in areas without measured data.
The r.sun solar radiation model was developed for an open source environment of the geographic resources analysis support system GIS [19]. The model computes three components (i.e., the beam, diffuse, and reflected components) of global solar radiation for clear-sky or overcast conditions. The model can be applied to large regions, and the shadowing effects of the terrain can be modeled using a shadowing algorithm. In a case study, the model was applied to PV system planning in Central and Eastern Europe and for solar radiation modeling in mountainous terrain in Slovakia.
By integrating the clear-sky index based on a multivariate interpolation method with the r.sun model, the radiation estimation ability was improved [20]. This method can be especially helpful for data at higher resolutions and in regions lacking ground measurements. A study that models solar radiation considering the interaction over topographic and plant canopies was performed using both a GIS (SOLARFLUX) and an image processing system (ATM Model) [21]. The effects of topography and plant canopies on solar radiation were analyzed with various options for obtaining the data. Design issues, computational problems, and error propagation were considered to implement the model for mountainous areas.
An algorithm was presented for calculating the slope gradient, aspect, and cell surface area as a normal vector using the DEM [22]. Based on this algorithm, the sun position, the direct component of insolation, and the hillshade can be calculated. In addition, the horizon angles and sky view factor can be calculated more economically than they could with previous algorithms. A 3D urban solar model was developed for the calculation and visualization of building potential [23]. Light detection and ranging (LiDAR) data were used to build a DSM of an urban region (the University of Lisbon campus), and a shadow algorithm was developed to calculate shadow maps and sky view factors both for roofs and facades. In this study, climatic observations based on the typical meteorological year data were utilized for direct and diffuse solar radiation mapping at each point on the ground, roof, and facades.
3. Solar Site Evaluation Using GISs
3.1. Overview
As regulations for environmental pollution are becoming stricter, there is a growing need to install generating plants using solar energy. To increase the effects of installing such plants, it is necessary to prioritize and select suitable locations to maximize the electricity generation and to minimize the damage that may occur. The results of this site analysis can help solar utility companies, energy companies, and policy makers select potential sites for the construction of solar power plants.
Solar power generating plants are heavily influenced by solar radiation, and the distribution of solar resources varies considerably by location. In most studies in which GISs have been used for site selection, this solar radiation has been considered as an input layer.
Depending on the type of solar power plant, the type of solar radiation used for analysis can be distinguished. Solar power plants can be divided into PV plants and CSP plants. Unlike PV plants where diffuse radiation is also important, direct radiation plays an important role in CSP plants. Therefore, GHI is mainly used for studies on PV plants, and DNI is mainly used for studies on CSP plants. In some site evaluation studies, only general solar energy distributions have been analyzed, without classifying PV and CSP plants. The types of power plants are summarized in Table 2 based on the reviewed literature.
GIS-based methods of evaluating suitable locations for solar power plants can be largely classified depending on whether they are applied on a regional or local scale. Site selection studies using GISs have been widely conducted on the regional scale, and the results have been usefully applied for policy and installation planning. When performing site evaluation on the regional scale, it is necessary to consider various factors such as economic, environmental, technical, social, and risk factors related to the installation of solar power plants, as well as solar radiation. For example, it is difficult to install large-scale solar power plants in the center of cities, so land availability must be considered. In addition, solar power plants must be accessible for installation, so it is necessary to consider the distance to the road network. Solar power plants also should not be far from the power grid to transmit the electricity produced. Many other factors must be considered, and some of these factors serve as constraints to exclude areas where solar power plants should not be installed or as suitability criteria to quantify suitability. Even if the same GIS layer is used, it can be employed in different ways depending on the research.
GIS-based multi-criteria analysis basically relies on two main approaches: Boolean overlay operators and weighted summations procedures. Although there are some differences in the definition of the term multi-criteria decision analysis (MCDA) according to the literature, MCDA is specified as a method of quantifying suitability using weights (i.e., weighted summation procedures) in this paper. The term multi-criteria decision making (MCDM) is also used instead of MCDA in some literature.
The Boolean overlay simply determines whether any conditions are satisfied, and analyzes the suitable area that satisfies all conditions. These results can be used as constraints in weighted summation analysis methods. Weighted summation can be subdivided according to the method of weighting each factor. In this study, we use the term weighted sum when we use the same weight or a very simple weight. The Analytic Hierarchy Process (AHP) method is the most widely used method to quantify the weight according to the expert opinion. Fuzzy AHP (FAHP), which combines fuzzy theory with AHP, is used to mitigate the uncertainty that may arise in this process. A typical flow chart of these GIS-based MCDA methods is shown in Figure 2.
3.2. Boolean Overlay
Although various MCDA techniques in which GISs are employed are useful for site selection for solar power plants, several studies have also been performed to find suitable sites by considering constraints using Boolean overlay operators.
The potential of large-scale CSP has been mainly studied in Africa, which has strong solar energy [24,25]. Conditions such as solar radiation, proximity to transmission lines, terrain, land cover, and hydrology can be considered to select a suitable area for CSP plant installation. Although the detailed constraints are different for each study, the suitable area for large-scale PV plant installation can be analyzed using similar approaches [26,27]. The constraints such as population areas and infrastructures are also important for evaluating suitability as well as the geographic factors such as slope, aspect, and land cover. Some studies have used GHI and DNI to analyze both PV and CSP [28]. After selecting a suitable area, the installation capacity or power generation of the area can be analyzed. This Boolean overlay method has the advantage that it is the simplest method for solar site evaluation, but it has a disadvantage that it cannot quantify the relative suitability for the appropriate region.
3.3. Weighted Sum
These methods, based on the Boolean overlay, can elucidate suitable areas for solar power plant installation, but are limited in that they cannot prioritize suitable areas. To quantify suitability, various MCDA approaches have been developed, and the results have been presented mostly as suitability indices.
The simplest way to quantify the suitability indices for a solar power plant installation is to normalize and add each factor linearly. At the method, the same or a very simple weight is given. To produce the suitability indices, scaled solar radiation maps can be multiplied times a land capability map or the environmental risk map [31]. There are studies that have analyzed solar power plant suitability indices for various regions using a similar method. The geographical factors such as slope, land use, urban extent, population distribution, and proximity to the power grid, as well as solar radiation are combined to generate a suitability map [32,33]. In addition, by considering not only several spatial factors, but also social acceptance data collected through surveys regarding the potential public resistance to development, solar energy suitability can be assessed [36]. However, these studies are logically limited in determining scaling and weighting criteria.
3.4. Analytic Hierarchy Process (AHP)
Evaluating the relative importance between different factors and calculating the overall suitability is a controversial and difficult task. Some techniques have been applied to reflect the opinions of experts in order to reasonably calculate and quantify the weight of each of these factors.
As a method of the expert system, SWARA and WASPAS were integrated with the MCDA method to determine the relative significance of every effective criterion and to evaluate specified alternatives [37]. The AHP is the most widely used and useful systematic expert tool for handling MCDA. In the AHP, hierarchical structures are used to represent a problem and make judgments based on experts to derive priority scales. The overall weights and importance of each input parameter are obtained using a pair-wise comparison matrix.
There have been a number of studies evaluating appropriate sites for CSP or PV power plant installations using AHP [38,39,40,41,42,43,44]. In the process of AHP, solar radiation, transmission lines, water bodies, slope, land use, the possible electricity generation, and various economic and technical factors can be considered as assessment factors. In most MCDA studies using the AHP, the unsuitable area is first excluded considering the constraints and then the suitability for each analysis unit (pixel or administrative district) is calculated considering the weights determined via the AHP.
3.5. Fuzzy AHP (FAHP)
Although the AHP is broadly utilized to deal with the complexity of many problems by prioritizing the alternatives, the AHP does not consider the uncertainty associated with the process. To alleviate this issue, fuzzy set theory has been combined with the AHP. The FAHP considers the vagueness, imprecision, and uncertainty associated with the process.
The FAHP has been widely applied in Asia to locate the most appropriate sites for PV or CSP power plants [46,47,48]. In these studies, various criteria for climatology, location, environment, and meteorology related to solar power plant installation were considered. In addition, the annual electricity production for solar energy plant was estimated in some studies. The FAHP has also been applied to the PV plant installation suitability analysis for Ulleung Island, Korea [49]. PV solar farm criteria were evaluated for an island-based case region having complex topographic and regulatory criteria (Figure 3a), along with high demand for low-carbon local electricity production. Six factor variables (solar radiation, sunshine hours, average temperature in summer, proximity to transmission lines, proximity to roads, and slope) (Figure 4) were normalized via a fuzzy theory to calculate an on-site suitability index (Figure 3b).
3.6. Other Approaches
The AHP and specific models have also been used together, and new attempts have been made to support reasonable decision making.
To evaluate PV plant location alternatives, the alternatives were assessed through the AHP and TOPSIS method based on the concept that the chosen alternative should have the shortest distance from the positive ideal solution and the farthest from the negative ideal solution [50]. The final ranking is obtained using a closeness index. An MCDA model was developed by applying the ELECTRE-TRI method and the decision support system IRIS to classify the suitable areas for PV solar farms, into ordered categories of merit according to multiple evaluation criteria [51]. ELECTRE-TRI was used to classify the alternatives by utilizing IRIS, which implements the most common variant of the ELECTRE-TRI method (pessimistic variant). This approach involves classification of each location based on its absolute merits and drawbacks and does not require setting a precise numerical value to express the importance of each criterion. In addition, ANN was applied to identify suitable areas for the installation of PV systems [52]. The final index was determined by combining the quantitative criteria using an ANN trained with values corresponding to the sites of existing PV plants in the region.
3.7. Solar Site Evaluation for Specific Objects
As mentioned above, most solar site evaluation studies involving GISs have been focused on selecting and prioritizing suitable areas from a macroscopic view. These studies were conducted mainly from the regional scale to the national scale and rarely on the continental scale, because solar site evaluation studies using GISs can play an important role in decision making. However, some studies have been performed on more specific objects, rather than land for solar power plant installation.
Choi and Song [54] assessed the PV potential at abandoned mine reclamation sites in Korea. A spatial DB was constructed for 218 abandoned mine reclamation sites (Figure 5) according to reclamation type. By combining the solar energy resource and mine reclamation maps using overlay analysis, mine sites with high annual GHI were selected and energy simulations were conducted based on the system advisor model (SAM) by NREL in the US. Kim et al. [55] estimated the priorities and potential of floating PV for 3,401 reservoirs in Korea. To select a suitable reservoir for floating PV installation, a water depth DB of reservoirs was constructed using OpenAPI (Figure 6a). The annual power production for all possible reservoirs was calculated by considering solar radiance, topographical information (Figure 6b), and solar panel parameters.
Lukac et al. [56] rated roof surfaces in terms of solar potential and suitability for PV systems. The solar potential was determined by combining the urban topography extracted from LiDAR data with pyranometer measurements and analyzing the shadowing effect. After the roofs were split into segments, a filtering process was conducted to identify buildings unsuitable for PV installation. Then, the solar potential rating was employed for the suitable buildings. Lee et al. [57] evaluated the rooftop solar PV suitability of a building from a microscopic view. To consider not only its technical performance, but also its economic performance, hillshade analysis and life cycle cost analysis were conducted. To develop a rooftop solar PV rating system, cluster analysis based on the technical and economic suitability criteria was performed. The rating system was applied to 21,681 buildings in the Gangnam district in Seoul, South Korea by dividing them into four grades according to their rooftop solar PV potentials, investment returns, and payback periods.
Because only one type of renewable energy system cannot provide continuous power generation, there have been site selection studies for two or more renewable energy systems including solar PV or CSP energy. When multiple renewable energy sources are used in combination, they can compensate for each other when one of them is not available.
In some studies, a Boolean overlay method or weighted sum method was applied to find suitable locations for hybrid solar-wind power station construction by considering factors such as the resources, topography, and environmental and economic viewpoints [29,30,34,45]. In addition, an MCDA framework incorporating an FAHP was applied for hybrid solar-wind renewable energy system site selection [35]. The OR-SAGE tool was developed to analyze the impacts of future energy technology while balancing competing resource use [36]. The tool considers population growth, water availability, environmental indicators, and tectonic and geological hazards and was applied to the western US. The final map categorized and showed the most suitable region for each energy source (solar, nuclear, advanced coal, and CAES).
4. Solar Potential Assessment Using GISs
4.1. Overview
Solar potential can essentially be categorized into three different types [30]. First, physical potential is the total amount of solar energy reaching the target surface, which can be referred to as the total solar radiation on the surface or rooftop. Second, geographic potential is the spatial availability of the surface or building rooftop where solar energy can be obtained, which can be referred to as the available area for solar PV installation. Third, technical potential is the total amount of electricity considering the technical characteristics of the solar PV system (e.g., module efficiency, inverter capacity, and system design), which can be referred to as electricity generation. A GIS can be used for physical potential and geographic potential.
In this study, 39 published articles on GIS-based solar potential assessment were reviewed. Table 3 summarizes the classification and number of articles according to the role of the GIS, solar type, or scale. GISs were utilized for various purposes in solar potential assessment, such as DB and visualization, rooftop extraction, radiation modeling, shading analysis, and spatial analysis tools. Regarding solar type, most studies were focused on PV or both PV and CSP, while few dealt with CSP. In terms of analysis scale, most of the solar potential assessment studies were conducted on national or regional scales, while few were performed on global, continental, or object (building) scales.
This section consists of five sub-sections corresponding to the roles of GISs in research as DB and visualization, rooftop extraction, radiation modeling, shading analysis, and spatial analysis tools.
4.2. DB and Visualization Tools
This sub-section discusses the use of GISs as solar potential DB (map) or solar potential visualization (map production) tools.
A few researchers have used GISs as only solar DB maps in solar potential assessment. Song et al. [58] employed a georeferenced raster-formatted solar resource map (i.e., annual mean daily global horizontal radiation at the surface) in Kangwon province, created by the Korea Meteorological Administration, to assess the PV potential at three mines (Figure 7). By overlapping the solar resource map with a mine map, the annual mean daily global horizontal radiation at the three mines was extracted. Then, these values were entered into RETScreen software to analyze the electricity production and greenhouse gas emission reduction.
Many researchers have used GISs as both solar DB maps and visualization tools in solar potential assessment. Tarigan et al. [59] performed a SolarGIS-pvPlanner simulation to assess PV power generation for household in Surabaya, Indonesia. This simulator provides assessment results at any selected site online by integrating numerical simulation models generated from the latest climate DB. Specifically, the SolarGIS method is based on using statistically aggregated solar and temperature data stored in the DB with a time step of 15 min. The simulator provides meteorological and geographical data as inputs to assess power generation from PV systems.
A GIS plays a role in the web-based simulator as both a DB system and a visualization system. Besarati et al. [60] generated solar radiation maps for five different tracking modes to compare the applicability of PV and CSP power plants. Then, a 5 MW PV power plant was considered for 50 cities in Iran to investigate the viability of PV power plants for each city. The capacity factors, electricity generated, and annual greenhouse gases emission reductions were compared. Fichter et al. [61] considered a DNI map sourced from the German Aerospace Center to extract CSP hotspots in Northeast Brazil. Using these data, the optimal CSP plant configuration was derived and the potential of CSP for the northeast power system of Brazil was assessed. Lukač et al. [62] utilized rooftop LiDAR point cloud data to generate a grid-type map with 1 m resolution to assess the PV potential of building roofs considering the nonlinear efficiency characteristics of a given PV module type and the solar inverter.
Bergamasco and Asinari [63] generated a solar resource map showing the yearly sum of global irradiation in the Piedmont region by performing interpolation among all of the cell values of the solar radiation map within the municipality. Using this map, the roof surface area available for installation was calculated, and the PV energy potentials of the rooftop integrated PV systems were assessed. Malagueta et al. [64] explored a DNI map and meteorological data for the northeastern region of Brazil to assess incentive policies for integrating CSP generation into the Brazilian electric power system. As a result, subsystems and interchanges in the model in the national grid were proposed. Martĭn-Pomares et al. [65] generated GHI and DNI average monthly sum maps (2003–2013) in Qatar by improving satellite-derived data using ground measurement data. By considering the characteristics of reference solar power plants and the aforementioned solar resource map using the SAM software, various solar potential electricity generations in Qatar were calculated according to plant type.
Milbrandt et al. [66] assessed and mapped renewable energy potential, including PV, CSP, wind, geothermal, and biomass energy and landfill gas-to-energy on marginal lands (e.g., abandoned, disturbed, under-utilized, wasteland, limbo-land, degraded, and idle) in the US, representing about 11% of the US mainland. Solar technologies exhibited the highest potentials. It was estimated that about 4.5 PWh and 4 PWh of electricity could be produced from PV and CSP energy, respectively, on marginal lands in the contiguous US.
4.3. Rooftop Extraction Tool
A rooftop solar PV system is a PV system in which electricity-generating solar panels are mounted on the rooftop of a residential or commercial building or structure. With the ever-increasing population and unavailability of large-scale solar power plant installation in urban areas, interest in rooftop solar systems that can be installed on buildings in urban area is increasing. GISs have been utilized to extract rooftops to assess their solar potentials on the national and regional scales.
Khan and Arsalan [67] extracted rooftops from Google Earth satellite imagery of the Karachi region of Pakistan using a feature extraction tool of ENVI EX software employing object-based image recognition. From the extracted rooftop data and their characteristics (i.e., building orientation, shading effect, and other roof uses), the PV energy and power output were assessed. The characteristics of previous GIS-based rooftop PV potential studies were also summarized.
Izquierdo et al. [68] calculated roof surface area using vector-type roof data compiled throughout Spain. The installation of solar hot water systems (SHWSs) and PV systems was considered. With assumptions for SHWS demand coverage and payback evaluation, the results showed that SHWSs could contribute up to 1662 ktoe/year of primary energy. In addition, the PV potential of each rooftop was calculated by multiplying the area of the roof times simple constants derived from technical parameters, and it was found that PV systems would provide 10 TWh/year of electricity.
4.4. Radiation Modeling Tool
Solar radiation modeling enables prediction of the average daily and hourly global horizontal radiation, beam radiation, and diffuse radiation. GISs were utilized to map and analyze the effects of the sun over a geographical area for specific time periods. In general, GIS-based radiation modeling was implemented, on the national or regional scales to calculate the insolation across an entire landscape (area) or to calculate the amount of radiant energy for a given location (point).
Charabi and Gastli [69] discussed solar power prospects to assess a large CSP plant in Wilayat Duqum, Oman in a geospatial context. A solar radiation map of Wilayat Duqum was generated by employing solar radiation tools in ArcGIS software and DEM data. Subsequently, the yearly electric power generation potential was calculated according to the type of CSP technology. In a similar manner, Gastli et al. [70] mapped the solar radiation over Wilayat Duqum by employing the aforementioned identical tools and data to investigate the potential of implementing a combined CSP electric power and seawater desalination plant. This study dealt with two options (i.e., the combination of a CSP plant with a thermal desalination unit and exploitation of only the electricity output of a CSP plant with a reverse osmosis desalination unit) and showed where each concept is preferable considering local conditions. Hofierka and Kaňuk [71] estimated the annual PV electricity production in kilowatt-hours per building in the urban areas of Bardejov in eastern Slovakia. In this study, 3D city model input data, the r.sun solar radiation model, and PVGIS estimation utility, an open-source solar radiation tool, were utilized to assess the PV potential of each building. The analysis revealed a high PV potential that could cover about two-thirds of the current electricity consumption of the city.
Meanwhile, Catita et al. [72] modeled the vertical facades of buildings as well as solar radiation on roofs to inspect the potential of building an integrated PV system in the region of the University of Lisbon, Portugal. To achieve this objective, a 3D building model and DSM data were employed as input data for the self-developed software. The DSM data indicated the digital surface height, including objects (e.g., buildings, facilities, and trees), while the DEM data excluded the built (e.g., power lines, buildings, and towers) and natural (trees and other types of vegetation) elements. Izquierdo et al. [73] listed hierarchical methodologies for potentials such as the physical, geographic, technical, economic, and social potentials. The horizontal irradiance on roofs was derived by using radiation computed based on the geometry of the sun–earth system, land use maps, and building maps. Subsequently, considering the PV arrangement and model, the technical potential of a roof-integrated PV system in Spain was estimated. Polo et al. [74] presented maps of the solar resources in Vietnam and the solar potential for CSP and grid-connected PV technology. GHI and DNI maps were derived from the Meteosat Indian Ocean Data Coverage satellite imagery based on the Heliosat method. Subsequently, the solar potential was assessed by performing simple simulations. GISs were used to combine the solar potential with the land availability determined based on the slope conditions and to map the technical solar potential.
4.5. Shading Analysis Tool
Surfaces and rooftops are shaded if the direct path of the light from the sun is obstructed. Shading of PV modules is a common phenomenon that can affect the performances of PV systems. As such, shading analysis is essential during solar PV project design or analysis since it is associated with solar access or unobstructed solar gains. In PV systems, it is important to analyze shading caused by surrounding objects (buildings) and/or vegetation.
Several authors have employed the hillshade algorithm and analysis to compute shadow areas and sunshine hours. Ko et al. [75] determined the shadow areas on rooftops to obtain the hourly sun and shade grayscale values to evaluate rooftop solar PV potential in Taiwan. A national-scale hillshade map was generated as a sun–shadow model showing the illuminance of each grid of the surface by setting the location of the assumed light source and calculating the related illuminance value between each grid and its neighboring grids. The preset conditions ranged from 0 (black; more shadowing) to 255 (white; less shadowing). The grayscale values were then integrated into binary images to calculate the shadow areas on rooftops. Lee et al. [76] and Hong et al. [77] analyzed shadows based on the location of the sun via hillshade analysis to examine the available building rooftop areas for solar PV installation. The altitude and azimuth of the sun were calculated every hour from 6 a.m. until 7 p.m. (when the sun is over the horizon) on the 15th (when the sun is at the average position for the present month) of each month from January until December in Seoul. Using these input data, hillshade analysis was conducted on 12 days (on the 15th of each month from January until December) in hourly intervals (from 6 a.m. to 7 p.m.), for a total of 156 times. Thereby, the unshaded rooftop area in which the solar PV system could perform at the optimal level without any disturbances by building shadows was extracted.
Many researchers have used DSMs (or 3D building models) to examine regional shadow characteristics. Song and Choi [78] conducted a simple shadow analysis to evaluate rooftop PV electricity generation systems to establish a green campus in a GIS environment. Prior to shadow analysis, 3D modeling of the study area was performed using a DEM (0.1 m grid spacing) easily accessed and building height data. As mentioned above, since the DEM data only describe the relief of the natural terrain, the DEM and building height data were integrated to create 3D building data. Subsequently, shadow analysis was conducted using the solar radiation tools in ArcGIS to analyze the yearly shadow patterns based on the changes in the angle of the sun (Figure 8). Locations, that were unaffected by shadows for more than 9 h/day, were regarded as usable areas for a rooftop PV system at the university. Choi et al. [1] developed a PV analyst that couples ArcGIS with a transient systems simulation (TRNSYS) to assess the distributed PV potential in urban areas. In this study, a DSM was input into the area solar radiation model of the solar radiation tools in ArcGIS to calculate the sun hours, which is the duration (in hours) of direct solar irradiation at each grid cell in the DSM. The duration of direct incoming solar irradiance from 9 a.m. until 3 p.m. (solar time) at the winter solstice was analyzed to fulfill the requirement that the PV systems to be installed in the study area would work solar time throughout the year without shading effects. The areas satisfying this requirement were regarded as usable areas for rooftop PV systems on each building in the study.
In a few studies, detailed field investigations using fish-eye lens cameras as well as regional shadow analysis using DSMs were performed. Choi and Song [79] analyzed the usable area for installing a PV system, considering the surrounding topography, for PV potential assessment at the tailing dam of an abandoned mine. For this purpose, two-step shading analysis, including local shading analysis and detailed field investigation, were conducted. In the first step, the study area was represented in 3D using a DEM with 10 m grid spacing in ArcGIS. To assess the shading effects on the surface of the tailing embankment for a conservative perspective, the daily hours of sunshine on the surface were analyzed at the winter solstice using the DEM and solar radiation analysis tool in ArcGIS. The number of sunshine hours was found to range from 6.1 h/day to 7.9 h/day without interference from shadows (Figure 9). In the second step, the detailed shade effects associated with nearby light barriers such as trees and plants were evaluated by performing a field investigation. By using a fish-eye lens camera, a skyline image at the solar site was captured, and the image was used to analyze on-site barriers to light reception (Figure 10). From the results generated by checking the distribution of light obstructions from on-site barriers, a shading matrix was generated (Table 4). The shading matrix stored month-by-hour shading data for the shading elements surrounding the solar site, expressed by values ranging from 0.0 (complete shielding of direct radiation from the PV system) to 1.0 (no shading effects).
Song and Choi [80] performed shading analysis to identify the area suitable for installing a floating PV system on a mine pit lake in Korea. A four-step procedure was suggested to assess the potential of a floating PV system, including solar site assessment, design of the PV system, simulation of the PV system, and evaluation of economic feasibility. In the first step, shading analysis was performed in a GIS environment using a method similar to that described above. The maximum amount of sunshine was 6.5 h/day. The area of the pit lake surface with more than 6 h/day of sunshine was found to be 87,650 m2, accounting for 38.9% of the total water surface area. Moreover, small obstructions around the pot lake were captured from the east and west of the skyline images. Based on these results, a month-by-hour shading matrix was generated.
4.6. Spatial Analysis Tool
Spatial analysis in a GIS environment is a concept in contrast to general analysis, which does not take into account spatial characteristics. Spatial analysis includes any of the formal techniques used to investigate entities based on their topological, geometric, or geographic properties. These techniques include various approaches such as rooftop extraction and solar radiation modeling. However, the roles of GISs for spatial analysis discussed in this sub-section are confined to simple geospatial analysis tools such as map algebra, overlaying, reclassification, slope, orientation, distance, and so on.
In some studies, map algebra analysis (including filtering) or overlaying of two or more maps was employed to generate new maps. Clifton and Boruff [81] identified the potential of using CSP to generate electricity in a rural region of Western Australia. Potential CSP sites were defined by overlaying environmental variables and electricity infrastructure on a high-resolution grid using widely available datasets and ArcGIS. The CSP potential map regions were classified as high potential, medium potential, and low potential, and the statistics of each class were calculated. Wong et al. [82] generated transmissivity and diffuse proportion maps by applying map algebra analysis to maps showing the proportions of clear days, partly cloudy days, and cloudy days in Hong Kong. Moreover, the slope of the terrain was analyzed and rooftops with angles of more than 40°, which is regarded as maximum for installing PV modules, were excluded. Subsequently, building footprint and solar potential maps were spatially joined, within a GIS environment, to calculate the rooftop PV potential in Hong Kong. Massimo et al. [83] overlapped solar radiation in the areas exploitable for solar energy production. Subsequently, the electricity consumption and potential production were investigated for each district in Central Italy. Sun et al. [84] generated a map showing the spatial distributions of geographical constraint areas such as built-up, non-built-up, and unsuitable areas. Then, technical potential and unit generation cost maps for each area were created by using a few equations. Furthermore, the simple payback period value, net present value, and carbon reduction potential for each area were calculated and visualized via map algebra analysis based on several equations.
Bayrakci et al. [85] generated two TRNSYS-based solar power output maps, one in which temperature was ignored and one in which it was considered, to examine the effects of temperature on PV systems. The power output differences for 236 cities across the US were used to generate contour maps indicating a continuous surface of differences between these two approaches via map algebra analysis. Mahtta et al. [86] included wasteland areas for solar potential calculation using a filtering approach in a GIS environment. Conversely, areas with average slopes greater than 2.1% and those with less than minimum thresholds of 4.0 kWh/m2/day for GHI and 5.47 kWh/m2/day for DNI, were excluded to calculate the solar potential for suitable areas. Lopez et al. [87] proposed GIS-based approaches to analyze various renewable energy technical potentials in the US. Various spatial analysis tools were utilized to estimate the system performance and for mapping, including various solar PV and CSP systems.
Several researchers applied spatial joining of two maps (of different types) or spatial comparison of maps. Monforti et al. [88] spatially compared solar and wind potential maps to calculate hourly, daily, and monthly wind and solar electricity correlation coefficients in Italy for 2005. Based on the results, the complementarity of wind and solar resources for energy production in Italy was assessed using a Monte Carlo approach. Niblick and Landis [89] assessed five different renewable energy potentials on US marginal and contaminated sites that could be re-used. For this purpose, point data for three different types of marginal land (i.e., Brownfield, Landfill, and abandoned mine lands) and grid cell data for five different renewable energy sources were spatially joined to map energy resources to regions of interest in a GIS environment.
Many researchers examined surface characteristics, including slope, aspect, orientation, and curvature. Choi et al. [90] analyzed the slope of terrain using the surface toolset and DEM data in ArcGIS to identify regions with slopes of less than 10° for a fixed-type PV system. The purpose of setting this terrain condition was to minimize the environmental damage caused by constructing a solar power plant in an abandoned mine area. Buffat et al. [91] computed the slope, orientation, and horizontal angles of each building, using a DSM coupled with building footprints, to assess solar irradiation on building rooftops, because shadows occur when the elevation angle of the sun is less than the angle of the local horizon of the observer. Gastli and Charabi [92] analyzed the slope in Oman to calculate the yearly electricity generation potential for different CSP technologies, such as parabolic trough, parabolic dish, tower, and concentrated PV. It was determined that if only the land of Oman with a slope less than 1%, which constitutes 10% of the total land area, is considered to be exploitable for parabolic trough CSP technology, then the total potential yearly electricity generation would be about 7.6 million GWh. He and Kammen [93] calculated the available land for solar development in each province by applying the following filters in the GIS modeling: DEM with an elevation less than 3000 m and a slope less than 1% and land use categorized as barren land, as defined in the land use data available for solar development. Forests, cropland, wetlands, water, woody savannas, shrub lands, savannas, grasslands, snowy and glacial areas, and protected land were excluded from this study for stationary PV.
In a few studies, distance or buffer analysis was performed to derive specific regions or values related to distance. Köberle et al. [94] generated two worldwide maps showing the cost of electricity by PV systems with and without transmission lines to analyze the effects of the cost of building new transmission lines to the nearest load center on the cost of PV electricity. At this point, distance analysis and map algebra were employed to estimate the cost derived from the length of the transmission line (distance to the nearest load center). Peterseim et al. [95] identified regions with DNI of more than 18 MJ/m2/day to determine the most promising regions for CSP systems. In addition, transmission lines with more than 66 kV were considered as they can technically absorb the output of 5–60 MWe CSP-biomass hybrid plants. In addition, 50 km buffer analysis was conducted around transmission lines as biomass transport for 50 km is possible. These two conditions were integrated to generate a map showing the areas within 50 km of the existing transmission lines, overlapped with different DNI values.
5. Discussion and Conclusions
In this paper, numerous published articles on GIS-based methods and applications for the planning and design of solar power systems were reviewed. For solar radiation mapping, site evaluation, and potential assessment of PV and CSP systems, GISs have been used for purposes ranging from simple to complex, such as (i) DB and visualization, (ii) rooftop extraction, (iii) shading analysis, (iv) solar radiation modeling, (v) spatial analysis, and (vi) MCDA. In addition, GIS-based methods can be applied differently according to the scale of study area, as well as the type of solar energy conversion technology. Based on the detailed literature review, the following conclusions were drawn.
- (1)
- Solar radiation maps can be useful spatial DBs in spatial and temporal analyses of solar resources. Interpolation methods can be employed for solar radiation mapping in areas with sufficient measured data. The results are presented as solar maps over large areas in pixels. In the absence of sufficient measured solar radiation data, other weather information can be used to predict solar radiation. This method is performed for a specific point, such as a station, by predicting the solar radiation relatively accurately based on various parameters. In recent years, machine learning techniques such as ANNs have been used. After accurately estimating the solar radiation for additional stations, more accurate solar radiation mapping can be achieved via interpolation. Solar radiation models using topography were also developed to predict solar radiation where there is no measured data. Various algorithms and shadow analysis based on GISs are mainly utilized in these models. The solar radiation maps produced using these methods can facilitate the identification of solar resources in specific areas and the determination of suitable areas for solar power plants. Validation using measured data is necessary to verify the accuracy of such maps.
- (2)
- GISs are useful for site evaluation when installing solar power plants for PV or CSP. While diffuse radiation is also an important factor in PV suitability analysis, only direct radiation is considered in CSP suitability analysis. In most site evaluation studies, solar radiation is the primary consideration and is obtained in various ways depending on the presence or absence of data. In particular, site evaluation by employing a GIS is useful for supporting decision making on the regional scale, and it is necessary to consider economic, environmental, technical, social, and risk factors in addition to solar radiation. These factors can be used to exclude unsuitable regions through Boolean overlay. They can also be employed in various MCDA methods to estimate suitability indices. Some researchers have performed suitability analysis for buildings, mines, and reservoirs.
- (3)
- The assessment of solar PV potential is critical in the development of planning policies and financing schemes for successful PV system deployment. Most of the reviewed literature focused on assessing the technical potential in the region of interest among the three types of solar potential. GISs are effective for assessing physical potential (total solar radiation on the surface/rooftop) and geographic potential (available surface/rooftop area considering the shadow), serving various purposes such as DB and visualization, rooftop extraction, radiation modeling, shading analysis, and spatial analysis tools. In addition, GISs can be utilized to visualize and interpret solar energy-based power output or economic values in the geospatial context in technical potential assessment.
Despite the advances of PV and CSP technology, a lack of information regarding the feasibility of solar power systems among installers and consumers, financial groups that broker large installations, policymakers who enable the deployment of technology, and even scientists and engineers from other complementary disciplines, has become a formidable barrier to their extensive penetration. The widespread use of GISs has provided information to various social groups with the modeling and assessment capabilities of solar power systems associated with resource mapping, site evaluation, and potential assessment. The roles of GISs have extended beyond data inventory and visualization to sophisticated modeling, evaluation, assessment, and interdisciplinary studies of solar energy.
Nonetheless, a gap is still present between the solar energy related maps generated by researchers and their practical use in solar energy system design and management works by engineers, planners, and designers. Consequently, greater efforts are required to minimize this gap by maximizing the applicability and practicality of future modeling and assessment results. All the solar energy’s potential, economic, environmental aspects are associated with geospatial context and thus GIS can be used as a basis platform. Therefore, it is necessary to conduct convergence research or to develop to couple GIS technology and solar energy related potential/economic/environmental analysis software.
In the future, related research will continue to improve and develop via the use of high-resolution geospatial data, advancement of spatial data analysis techniques, and coupling of GIS technology with various (empirical, theoretical, and analytical) models and methods. Furthermore, the future of solar PV energy is in going to a distributed power system or a smart grid that reflects a spatial perspective. Therefore, it is necessary to conduct research on the optimization of solar energy system design using GIS in the future.
Author Contributions
Y.C. gathered published literature; all the authors reviewed and analyzed the published literature; all the authors wrote the paper. J.S. implemented the final work for the paper submission.
Acknowledgments
This work was supported by the Basic Science Research Program through the National Research Foundation of Korea (NRF) funded by the Ministry of Education (2018R1D1A1A09083947).
Conflicts of Interest
The authors declare no conflict of interest.
Abbreviations and Symbols
The following abbreviations are used in this manuscript:
| AHP | analytic hierarchy process |
| ANN | artificial neural network |
| ATM | atmospheric and topographic model |
| CAES | compressed air energy storage |
| CBR | case based reasoning |
| CSP | concentrated solar power |
| DB | database |
| DEM | digital elevation model |
| DHI | diffuse horizontal irradiance |
| DNI | direct normal irradiance |
| DSM | digital surface model |
| ESMAP | energy sector management assistance program |
| FAHP | fuzzy analytic hierarchy process |
| FEM | finite element method |
| FLOWA | fuzzy logic ordered weight averaging |
| GHI | global horizontal irradiance |
| GIS | geographic information system |
| IODC | Indian Ocean Data Coverage |
| IRIS | Interactive robustness analysis and parameters’ inference for multicriteria sorting problems |
| LiDAR | Light Detection and Ranging |
| MADSR | monthly average daily solar radiation |
| MCDA | multi-criteria decision analysis |
| MCDM | multi-criteria decision making |
| NREL | National Renewable Energy Laboratory |
| OR-SAGE | Oak ridge siting analysis for power generation expansion |
| PV | photovoltaics |
| SAM | system advisor model |
| SHWS | solar hot water systems |
| SWARA | step-wise weight assessment ratio analysis |
| TOPSIS | technique for order preference by similarity to ideal solution |
| TRNSYS | transient systems simulation |
| US | United States |
| WASPAS | weighted aggregates Sum Product Assessment |
References
- Choi, Y.; Rayl, J.; Tammineedi, C.; Brownson, J.R.S. PV Analyst: Coupling ArcGIS with TRNSYS to assess distributed photovoltaic potential in urban areas. Sol. Energy 2011, 85, 2924–2939. [Google Scholar] [CrossRef]
- Zekai, S. Solar energy in progress and future research trends. Prog. Energy Combust. Sci. 2014, 30, 367–416. [Google Scholar]
- Yang, D.; Kleissl, J.; Gueymard, C.A.; Pedro, H.T.C.; Coimbra, C.F.M. History and trends in solar irradiance and PV power forecasting: A preliminary assessment and review using text mining. Sol. Energy 2018, 168, 60–101. [Google Scholar] [CrossRef]
- Freitas, S.; Catita, C.; Redweik, P.; Brito, M.C. Modelling solar potential in the urban environment: State-of-the-art review. Renew. Sustain. Energy Rev. 2015, 41, 915–931. [Google Scholar] [CrossRef]
- Bahrami, M.; Abbaszadeh, P. An overview of renewable energies in Iran. Renew. Sustain. Energy Rev. 2013, 24, 198–208. [Google Scholar] [CrossRef]
- Tahir, Z.R.; Asim, M. Surface measured solar radiation data and solar energy resource assessment of Pakistan: A review. Renew. Sustain. Energy Rev. 2018, 81, 2839–2861. [Google Scholar] [CrossRef]
- Zawilska, E.; Brooks, M.J. An assessment of the solar resource for Durban, South Africa. Renew. Energy 2011, 36, 3433–3438. [Google Scholar] [CrossRef]
- Song, J.; Choi, Y.; Yoon, S. Analysis of photovoltaic potential at abandoned mine promotion districts in Korea. Geosyst. Eng. 2015, 18, 168–172. [Google Scholar] [CrossRef]
- Burnett, D.; Barbour, E.; Harrison, G.P. The UK solar energy resource and the impact of climate change. Renew. Energy 2014, 71, 333–343. [Google Scholar] [CrossRef]
- Šúri, M.; Huld, T.A.; Dunlop, E.D. PV-GIS: A web-based solar radiation database for the calculation of PV potential in Europe. Int. J. Sust. Energy 2005, 24, 55–67. [Google Scholar] [CrossRef]
- Ramachandra, T.; Shruthi, B. Spatial mapping of renewable energy potential. Renew. Sustain. Energy Rev. 2007, 11, 1460–1480. [Google Scholar] [CrossRef]
- Nematollahi, O.; Kim, K.C. A feasibility study of solar energy in South Korea. Renew. Sustain. Energy Rev. 2017, 77, 566–579. [Google Scholar] [CrossRef]
- Alamdari, P.; Nematollahi, O.; Alemrajabi, A.A. Solar energy potentials in Iran: A review. Renew. Sustain. Energy Rev. 2013, 21, 778–788. [Google Scholar] [CrossRef]
- Stökler, S.; Schillings, C.; Kraas, B. Solar resource assessment study for Pakistan. Renew. Sustain. Energy Rev. 2016, 58, 1184–1188. [Google Scholar] [CrossRef]
- Rumbayan, M.; Abudureyimu, A.; Nagasaka, K. Mapping of solar energy potential in Indonesia using artificial neural network and geographical information system. Renew. Sustain. Energy Rev. 2012, 16, 1437–1449. [Google Scholar] [CrossRef]
- Koo, C.; Hong, T.; Lee, M.; Park, H.S. Estimation of the Monthly Average Daily Solar Radiation using Geographic Information System and Advanced Case-Based Reasoning. Environ. Sci. Technol. 2013, 47, 4829–4839. [Google Scholar] [CrossRef]
- Lee, M.; Koo, C.; Hong, T.; Park, H.S. Framework for the Mapping of the Monthly Average Daily Solar Radiation Using an Advanced Case-Based Reasoning and a Geostatistical Technique. Environ. Sci. Technol. 2014, 48, 4604–4612. [Google Scholar] [CrossRef]
- Koo, C.; Hong, T.; Jeong, K.; Kim, J. Development of the monthly average daily solar radiation map using a-CBR, FEM, and Kriging method. Technol. Econ. Dev. Econ. 2018, 24, 489–512. [Google Scholar] [CrossRef]
- Hofierka, J.; Šúri, M. The solar radiation model for Open source GIS: Implementation and applications. In Proceedings of the Open Source GIS—GRASS Users Conference 2002, Trento, Italy, 11–13 September 2002; pp. 51–70. [Google Scholar]
- Šúri, M.; Hofierka, J. A New GIS-based Solar Radiation Model and Its Application to Photovoltaic Assessments. Trans. GIS 2004, 8, 175–190. [Google Scholar] [CrossRef]
- Dubayah, R.; Rich, P.M. Topographic solar radiation models for GIS. Int. J. Geogr. Inf. Syst. 1995, 9, 405–419. [Google Scholar] [CrossRef]
- Corripio, J.G. Vectorial algebra algorithms for calculating terrain parameters from dems and solar radiation modelling in mountainous terrain. Int. J. Geogr. Inf. Sci. 2003, 17, 1–23. [Google Scholar] [CrossRef]
- Redweik, P.; Catita, C.; Brito, M. Solar energy potential on roofs and facades in an urban landscape. Sol. Energy 2013, 97, 332–341. [Google Scholar] [CrossRef]
- Fluri, T.P. The potential of concentrating solar power in South Africa. Energy Policy 2009, 37, 5075–5080. [Google Scholar] [CrossRef]
- Merrouni, A.A.; Mezrhab, A.; Mezrhab, A. CSP sites suitability analysis in the Eastern region of Morocco. Energy Procedia 2014, 49, 2270–2279. [Google Scholar] [CrossRef]
- Merrouni, A.A.; Mezrhab, A.; Mezrhab, A. PV sites suitability analysis in the Eastern region of Morocco. Sustain. Energy Technol. Assess. 2016, 18, 6–15. [Google Scholar] [CrossRef]
- Wang, S.; Zhang, L.; Fu, D.; Lu, X.; Wua, T.; Tong, Q. Selecting photovoltaic generation sites in Tibet using remote sensing and geographic analysis. Sol. Energy 2016, 133, 85–93. [Google Scholar] [CrossRef]
- Hott, R.; Santini, R.; Brownson, J.R.S. GIS-based Spatial Analysis for Large-Scale Solar Power and Transmission Line Issues: Case Study of Wyoming, U.S. In Proceedings of the 41st American Solar Energy Society Meeting, Denver, CO, USA, 13–17 May 2012; pp. 1–6. [Google Scholar]
- Jahangiri, M.; Ghaderi, R.; Haghani, A.; Nematollahi, O. Finding the best locations for establishment of solar-wind power stations in Middle-East using GIS: A review. Renew. Sustain. Energy Rev. 2016, 66, 38–52. [Google Scholar] [CrossRef]
- Anwarzai, M.A.; Nagasaka, K. Utility-scale implementable potential of wind and solar energies for Afghanistan using GIS multi-criteria decision analysis. Renew. Sustain. Energy Rev. 2017, 71, 150–160. [Google Scholar] [CrossRef]
- Gherboudj, I.; Ghedira, H. Assessment of solar energy potential over the United Arab Emirates using remote sensing and weather forecast data. Renew. Sustain. Energy Rev. 2016, 55, 1210–1224. [Google Scholar] [CrossRef]
- Castillo, C.P.; Silva, F.B.E.; Lavalle, C. An assessment of the regional potential for solar power generation in EU-28. Energy Policy 2016, 88, 86–99. [Google Scholar] [CrossRef]
- Janke, J.R. Multicriteria GIS modeling of wind and solar farms in Colorado. Renew. Energy 2010, 35, 2228–2234. [Google Scholar] [CrossRef]
- Cevallos-Sierra, J.; Ramos-Martin, J. Spatial assessment of the potential of renewable energy: The case of Ecuador. Renew. Sustain. Energy Rev. 2018, 81, 1154–1165. [Google Scholar] [CrossRef]
- Aydin, Y.N.; Kentel, E.; Duzgun, H.S. GIS-based site selection methodology for hybrid renewable energy systems: A case study from western Turkey. Energy Convers. Manag. 2013, 70, 90–106. [Google Scholar] [CrossRef]
- Brewer, J.; Ames, D.P.; Solan, D.; Lee, R.; Carlisle, J. Using GIS analytics and social preference data to evaluate utility-scale solar power site suitability. Renew. Energy 2015, 81, 825–836. [Google Scholar] [CrossRef]
- Vafaeipour, M.; Zolfani, H.S.; Mohammad, H.M.V.; Derakhti, A.; Eshkalag, M.K. Assessment of regions priority for implementation of solar projects in Iran: New application of a hybrid multi-criteria decision-making approach. Energy Convers. Manag. 2014, 86, 653–663. [Google Scholar] [CrossRef]
- Ziuku, S.; Seyitini, L.; Mapurisa, B.; Chikodzi, D.; Kuijk, K. Potential of Concentrated Solar Power (CSP) in Zimbabwe. Energy Sustain. Dev. 2014, 23, 220–227. [Google Scholar] [CrossRef]
- Al Garni, H.Z.; Awasthi, A. Solar PV power plant site selection using a GIS-AHP based approach with application in Saudi Arabia. Appl. Energy 2017, 206, 1225–1240. [Google Scholar] [CrossRef]
- Uyan, M. GIS-based solar farms site selection using analytic hierarchy process (AHP) in Karapinar region, Konya/Turkey. Renew. Sustain. Energy Rev. 2013, 28, 11–17. [Google Scholar] [CrossRef]
- Yushchenko, A.; de Bono, A.; Chatenoux, B.; Patel, M.K.; Ray, N. GIS-based assessment of photovoltaic (PV) and concentrated solar power (CSP) generation potential in West Africa. Renew. Sustain. Energy Rev. 2018, 81, 2088–2103. [Google Scholar] [CrossRef]
- Merrouni, A.A.; Elalaoui, F.E.; Mezrhab, A.; Mezrhab, A.; Ghennioui, A. Large scale PV sites selection by combining GIS and Analytical Hierarchy Process. Case study: Eastern Morocco. Renew. Energy 2018, 119, 863–873. [Google Scholar] [CrossRef]
- Aly, A.; Jensen, S.S.; Pedersen, A.B. Solar power potential of Tanzania: Identifying CSP and PV hot spots through a GIS multicriteria decision making analysis. Renew. Energy 2017, 113, 159–175. [Google Scholar] [CrossRef]
- Tahri, M.; Hakdaoui, M.; Maanan, M. The evaluation of solar farm locations applying Geographic Information System and Multi-Criteria Decision-Making methods: Case study in southern Morocco. Renew. Sustain. Energy Rev. 2015, 51, 1354–1362. [Google Scholar] [CrossRef]
- Watson, J.J.W.; Hudson, M.D. Regional Scale wind farm and solar farm suitability assessment using GIS-assisted multi-criteria evaluation. Landsc. Urban Plan. 2015, 138, 20–31. [Google Scholar] [CrossRef]
- Asakereh, A.; Omid, M.; Alimardani, R.; Sarmadian, F. Developing a GIS-based Fuzzy AHP Model for Selecting Solar Energy Sites in Shodirwan Region in Iran. Int. J. Adv. Sci. Technol. 2014, 68, 37–48. [Google Scholar] [CrossRef]
- Noorollahi, E.; Fadai, D.; Shirazi, M.A.; Ghodsipour, S.H. Land Suitability Analysis for Solar Farms Exploitation Using GIS and Fuzzy Analytic Hierarchy Process (FAHP)-A Case Study of Iran. Energies 2016, 9, 643. [Google Scholar] [CrossRef]
- Charabi, Y.; Gastli, A. PV site suitability analysis using GIS-based spatial fuzzy multi-criteria evaluation. Renew. Energy 2011, 36, 2554–2561. [Google Scholar] [CrossRef]
- Suh, J.; Brownson, J.R.S. Solar farm suitability using geographic information system fuzzy sets and analytic hierarchy processes: Case study of Ulleung Island, Korea. Energies 2016, 9, 648. [Google Scholar] [CrossRef]
- Sánchez-Lozano, J.M.; Teruel-Solano, J.; Soto-Elvira, P.L.; García-Cascales, M.S. Geographical Information Systems (GIS) and Multi-Criteria Decision Making (MCDM) methods for the evaluation of solar farms locations: Case study in south-eastern Spain. Renew. Sustain. Energy Rev. 2013, 24, 544–556. [Google Scholar] [CrossRef]
- Sánchez-Lozano, J.M.; Antunes, H.C.; García-cascales, M.S.; Dias, L.C. GIS-based photovoltaic solar farms site selection using ELECTRE-TRI: Evaluating the case for Torre Pacheco, Murcia, Southeast of Spain. Renew. Energy 2014, 66, 478–494. [Google Scholar] [CrossRef]
- Mondino, E.B.; Fabrizio, E.; Chiabrando, R. Site Selection of Large Ground-Mounted Photovoltaic Plants: A GIS Decision Support System and an Application to Italy. Int. J. Green Energy 2015, 12, 515–525. [Google Scholar] [CrossRef]
- Omitaomu, O.A.; Blevins, B.R.; Jochem, W.C.; Mays, G.T.; Belles, R.; Hadley, S.W.; Harrison, T.J.; Bhaduri, B.L.; Neish, B.S.; Rose, A.N. Adapting a GIS-based multicriteria decision analysis approach for evaluating new power generating sites. Appl. Energy 2012, 96, 292–301. [Google Scholar] [CrossRef]
- Choi, Y.; Song, J. Assessment of Photovoltaic Potentials at Abandoned Mine Reclamation Sites in Korea using Renewable Energy Resource Maps. New Renew. Energy 2016, 12, 44–52. [Google Scholar] [CrossRef]
- Kim, S.M.; Oh, M.; Park, H.D. Analysis and Prioritization of the Floating Photovoltaic System Potential for Reservoirs in Korea. Appl. Sci. 2019, 9, 395. [Google Scholar] [CrossRef]
- Lukac, N.; Žlaus, D.; Seme, S.; Žalik, B.; Štumberger, G. Rating of roofs’ surfaces regarding their solar potential and suitability for PV systems, based on LiDAR data. Appl. Energy 2013, 102, 803–812. [Google Scholar] [CrossRef]
- Lee, M.; Hong, T.; Jeong, J.; Jeong, K. Development of a rooftop solar photovoltaic rating system considering the technical and economic suitability criteria at the building level. Energy 2018, 160, 213–224. [Google Scholar] [CrossRef]
- Song, J.; Choi, Y.; Jang, M.; Yoon, S. A Comparison of Wind Power and Photovoltaic Potentials at Yeongok, Mulno and Booyoung Abandoned Mines in Kangwon Province, Korea. J. Korean Soc. Miner. Energy Resour. Eng. 2014, 51, 525–536. [Google Scholar] [CrossRef]
- Tarigan, E.; Djuwari; Purba, L. Assessment of PV Power Generation for Household in Surabaya Using SolarGIS—PvPlanner Simulation. Energy Procedia 2014, 47, 85–93. [Google Scholar] [CrossRef]
- Besarati, S.M.; Padilla, R.V.; Goswami, D.Y.; Stefanakos, E. The potential of harnessing solar radiation in Iran: Generating solar maps and viability study of PV power plants. Renew. Energy 2013, 53, 193–199. [Google Scholar] [CrossRef]
- Fichter, T.; Soria, R.; Szklo, A.; Schaeffer, R.; Lucena, A.F.P. Assessing the potential role of concentrated solar power (CSP) for the northeast power system of Brazil using a detailed power system model. Energy 2017, 121, 695–715. [Google Scholar] [CrossRef]
- Lukač, N.; Seme, S.; Žlaus, D.; Štumberger, G.; Žalik, B. Buildings roofs photovoltaic potential assessment based on LiDAR (Light Detection and Ranging) data. Energy 2014, 66, 598–609. [Google Scholar] [CrossRef]
- Bergamasco, L.; Asinari, P. Scalable methodology for the photovoltaic solar energy potential assessment based on available roof surface area: Application to Piedmont Region (Italy). Sol. Energy 2011, 85, 1041–1055. [Google Scholar] [CrossRef]
- Malagueta, D.; Szklo, A.; Borba, B.S.M.C.; Soria, R.; Aragão, R.; Schaeffer, R.; Dutra, R. Assessing incentive policies for integrating centralized solar power generation in the Brazilian electric power system. Energy Policy 2013, 59, 198–212. [Google Scholar] [CrossRef]
- Martín-pomares, L.; Martínez, D.; Polo, J.; Perez-astudillo, D.; Bachour, D.; San, A. Analysis of the long-term solar potential for electricity generation in Qatar. Renew. Sustain. Energy Rev. 2017, 73, 1231–1246. [Google Scholar] [CrossRef]
- Milbrandt, A.R.; Heimiller, D.M.; Perry, A.D.; Field, C.B. Renewable energy potential on marginal lands in the United States. Renew. Sustain. Energy Rev. 2014, 29, 473–481. [Google Scholar] [CrossRef]
- Khan, J.; Arsalan, M.H. Estimation of rooftop solar photovoltaic potential using geo-spatial techniques: A perspective from planned neighborhood of Karachi Pakistan. Renew. Energy 2016, 90, 188–203. [Google Scholar] [CrossRef]
- Izquierdo, S.; Montanẽś, C.; Dopazo, C.; Fueyo, N. Roof-top solar energy potential under performance-based building energy codes: The case of Spain. Sol. Energy 2011, 85, 208–213. [Google Scholar] [CrossRef]
- Charabi, Y.; Gastli, A. GIS assessment of large CSP plant in Duqum, Oman. Renew. Sustain. Energy Rev. 2010, 14, 835–841. [Google Scholar] [CrossRef]
- Gastli, A.; Charabi, Y.; Zekri, S. GIS-based assessment of combined CSP electric power and seawater desalination plant for Duqum—Oman. Renew. Sustain. Energy Rev. 2010, 14, 821–827. [Google Scholar] [CrossRef]
- Hofierka, J.; Kaňuk, J. Assessment of photovoltaic potential in urban areas using open-source solar radiation tools. Renew. Energy 2009, 34, 2206–2214. [Google Scholar] [CrossRef]
- Catita, C.; Redweik, P.; Pereira, J.; Brito, M.C. Extending solar potential analysis in buildings to vertical facades. Comput. Geosci. 2014, 66, 1–12. [Google Scholar] [CrossRef]
- Izquierdo, S.; Rodrigues, M.; Fueyo, N. A method for estimating the geographical distribution of the available roof surface area for large-scale photovoltaic energy-potential evaluations. Sol. Energy 2008, 82, 929–939. [Google Scholar] [CrossRef]
- Polo, J.; Bernardos, A.; Navarro, A.A.; Fernandez-Peruchena, C.M.; Ramírez, L.; Guisado, M.V.; Martínez, S. Solar resources and power potential mapping in Vietnam using satellite-derived and GIS-based information. Energy Convers. Manag. 2015, 98, 348–358. [Google Scholar] [CrossRef]
- Ko, L.; Wang, J.; Chen, C.; Tsai, H. Evaluation of the development potential of rooftop solar photovoltaic in Taiwan. Renew. Energy 2015, 76, 582–595. [Google Scholar] [CrossRef]
- Lee, M.; Hong, T.; Jeong, K.; Kim, J. A bottom-up approach for estimating the economic potential of the rooftop solar photovoltaic system considering the spatial and temporal diversity. Appl. Energy 2018, 232, 640–656. [Google Scholar] [CrossRef]
- Hong, T.; Lee, M.; Koo, C.; Jeong, K.; Kim, J. Development of a method for estimating the rooftop solar photovoltaic (PV) potential by analyzing the available rooftop area using Hillshade analysis. Appl. Energy 2017, 194, 320–332. [Google Scholar] [CrossRef]
- Song, J.; Choi, Y. Evaluation of rooftop photovoltaic electricity generation systems for establishing a green campus. Geosyst. Eng. 2015, 18, 51–60. [Google Scholar] [CrossRef]
- Choi, Y.; Song, J. Sustainable development of abandoned mine areas using renewable energy systems: A case study of the photovoltaic potential assessment at the tailings dam of abandoned Sangdong mine, Korea. Sustainability 2016, 8, 1320. [Google Scholar] [CrossRef]
- Song, J.; Choi, Y. Analysis of the Potential for Use of Floating Photovoltaic Systems on Mine Pit Lakes: Case Study at the Ssangyong Open-Pit Limestone Mine in Korea. Energies 2016, 9, 102. [Google Scholar] [CrossRef]
- Clifton, J.; Boruff, B.J. Assessing the potential for concentrated solar power development in rural Australia. Energy Policy 2010, 38, 5272–5280. [Google Scholar] [CrossRef]
- Wong, M.S.; Zhu, R.; Liu, Z.; Lu, L.; Peng, J.; Tang, Z.; Lo, C.H.; Chan, W.K. Estimation of Hong Kong’ s solar energy potential using GIS and remote sensing technologies. Renew. Energy 2016, 99, 325–335. [Google Scholar] [CrossRef]
- Massimo, A.; Dell’Isola, M.; Frattolillo, A.; Ficco, G. Development of a Geographical Information System (GIS) for the Integration of Solar Energy in the Energy Planning of a Wide Area. Sustainability 2014, 6, 5730–5744. [Google Scholar] [CrossRef]
- Sun, Y.; Hof, A.; Wang, R.; Liu, J.; Lin, Y.; Yang, D. GIS-based approach for potential analysis of solar PV generation at the regional scale: A case study of Fujian Province. Energy Policy 2013, 58, 248–259. [Google Scholar] [CrossRef]
- Bayrakci, M.; Choi, Y.; Brownson, J.R.S. Temperature dependent power modeling of photovoltaics. Energy Procedia 2014, 57, 745–754. [Google Scholar] [CrossRef]
- Mahtta, R.; Joshi, P.K.; Jindal, A.K. Solar power potential mapping in India using remote sensing inputs and environmental parameters. Renew. Energy 2014, 71, 255–262. [Google Scholar] [CrossRef]
- Lopez, A.; Roberts, B.; Heimiller, D.; Blair, N.; Porro, G.; Lopez, A.; Roberts, B.; Blair, N.; Porro, G.U.S. Renewable Energy Technical Potentials A GIS-Based Analysis. Available online: https://www.nrel.gov/docs/fy12osti/51946.pdf (accessed on 24 December 2018).
- Monforti, F.; Huld, T.; Bódis, K.; Vitali, L.; D’Isidoro, M.; Lacal-arántegui, R. Assessing complementarity of wind and solar resources for energy production in Italy. A Monte Carlo approach. Renew. Energy 2014, 63, 576–586. [Google Scholar] [CrossRef]
- Niblick, B.; Landis, A.E. Assessing renewable energy potential on United States marginal and contaminated sites. Renew. Sustain. Energy Rev. 2016, 60, 489–497. [Google Scholar] [CrossRef]
- Choi, Y.; Choi, Y.; Suh, J.; Park, H.; Jang, M.; Go, W.R. Assessment of Photovoltaic Potentials at Buguk, Sungsan and Younggwang Abandoned Mines in Jeollanam-do, Korea. J. Korean Soc. Miner. Energy Resour. Eng. 2013, 50, 827–837. [Google Scholar] [CrossRef]
- Buffat, R.; Grassi, S.; Raubal, M. A scalable method for estimating rooftop solar irradiation potential over large regions. Appl. Energy 2018, 216, 389–401. [Google Scholar] [CrossRef]
- Gastli, A.; Charabi, Y. Solar electricity prospects in Oman using GIS-based solar radiation maps. Renew. Sustain. Energy Rev. 2010, 14, 790–797. [Google Scholar] [CrossRef]
- He, G.; Kammen, D.M. Where, when and how much solar is available? A provincial-scale solar resource assessment for China. Renew. Energy 2016, 85, 74–82. [Google Scholar] [CrossRef]
- Köberle, A.C.; Gernaat, D.E.H.J.; van Vuuren, D.P. Assessing current and future techno-economic potential of concentrated solar power and photovoltaic electricity generation. Energy 2015, 89, 739–756. [Google Scholar] [CrossRef]
- Peterseim, J.H.; Herr, A.; Miller, S.; White, S.; O’Connell, D.A. Concentrating solar power/alternative fuel hybrid plants: Annual electricity potential and ideal areas in Australia. Energy 2014, 68, 698–711. [Google Scholar] [CrossRef]
Figure 1.
Locations of seven abandoned mine promotion districts in Korea (modified from Song et al. [8]).
Figure 1.
Locations of seven abandoned mine promotion districts in Korea (modified from Song et al. [8]).

Figure 2.
A representative flow chart of GIS-based MCDA methods for solar site evaluation. (Circle: goals, rectangle: GIS layer, and parallelogram: method).
Figure 2.
A representative flow chart of GIS-based MCDA methods for solar site evaluation. (Circle: goals, rectangle: GIS layer, and parallelogram: method).

Figure 3.
PV solar farm evaluation for Ulleung Island, Korea using the FAHP method: (a) Distribution of constraint areas; (b) Suitability index for a PV solar farm (Suh and Brownson [49]).
Figure 3.
PV solar farm evaluation for Ulleung Island, Korea using the FAHP method: (a) Distribution of constraint areas; (b) Suitability index for a PV solar farm (Suh and Brownson [49]).

Figure 4.
Factor layer inputs to identify a suitable area for PV installation on Ulleung Island (Suh and Brownson [49]).
Figure 4.
Factor layer inputs to identify a suitable area for PV installation on Ulleung Island (Suh and Brownson [49]).

Figure 5.
Spatial DB for abandoned mine reclamation sites in Korea: (a) Locations of abandoned mine reclamation sites; (b) Composition according to reclamation type in each administrative district (Choi and Song [54]).
Figure 5.
Spatial DB for abandoned mine reclamation sites in Korea: (a) Locations of abandoned mine reclamation sites; (b) Composition according to reclamation type in each administrative district (Choi and Song [54]).

Figure 6.
Floating PV analysis for reservoirs in Korea using a GIS: (a) Map of average water depth for each reservoir; (b) Solar radiance map considering terrain (Kim et al. [55]).
Figure 6.
Floating PV analysis for reservoirs in Korea using a GIS: (a) Map of average water depth for each reservoir; (b) Solar radiance map considering terrain (Kim et al. [55]).

Figure 7.
GIS DB map showing annual mean daily global horizontal radiation (kWh/m2/day) at the surface (Song et al. [58]).
Figure 7.
GIS DB map showing annual mean daily global horizontal radiation (kWh/m2/day) at the surface (Song et al. [58]).

Figure 8.
Shadow analysis. (a) Satellite image of the study area; (b) Shadow analysis of the overall study area; (c) Satellite image of a building; (d) Shadow analysis of the rooftop area of a building (modified from Song and Choi [78]).
Figure 8.
Shadow analysis. (a) Satellite image of the study area; (b) Shadow analysis of the overall study area; (c) Satellite image of a building; (d) Shadow analysis of the rooftop area of a building (modified from Song and Choi [78]).

Figure 9.
Daily sunshine hours on the surface of the tailing embankment on the winter solstice (Choi and Song [79]).
Figure 9.
Daily sunshine hours on the surface of the tailing embankment on the winter solstice (Choi and Song [79]).

Figure 10.
Results of shading analysis using a fish-eye lens camera (Sun Eye 210) (Choi and Song [79]).
Figure 10.
Results of shading analysis using a fish-eye lens camera (Sun Eye 210) (Choi and Song [79]).


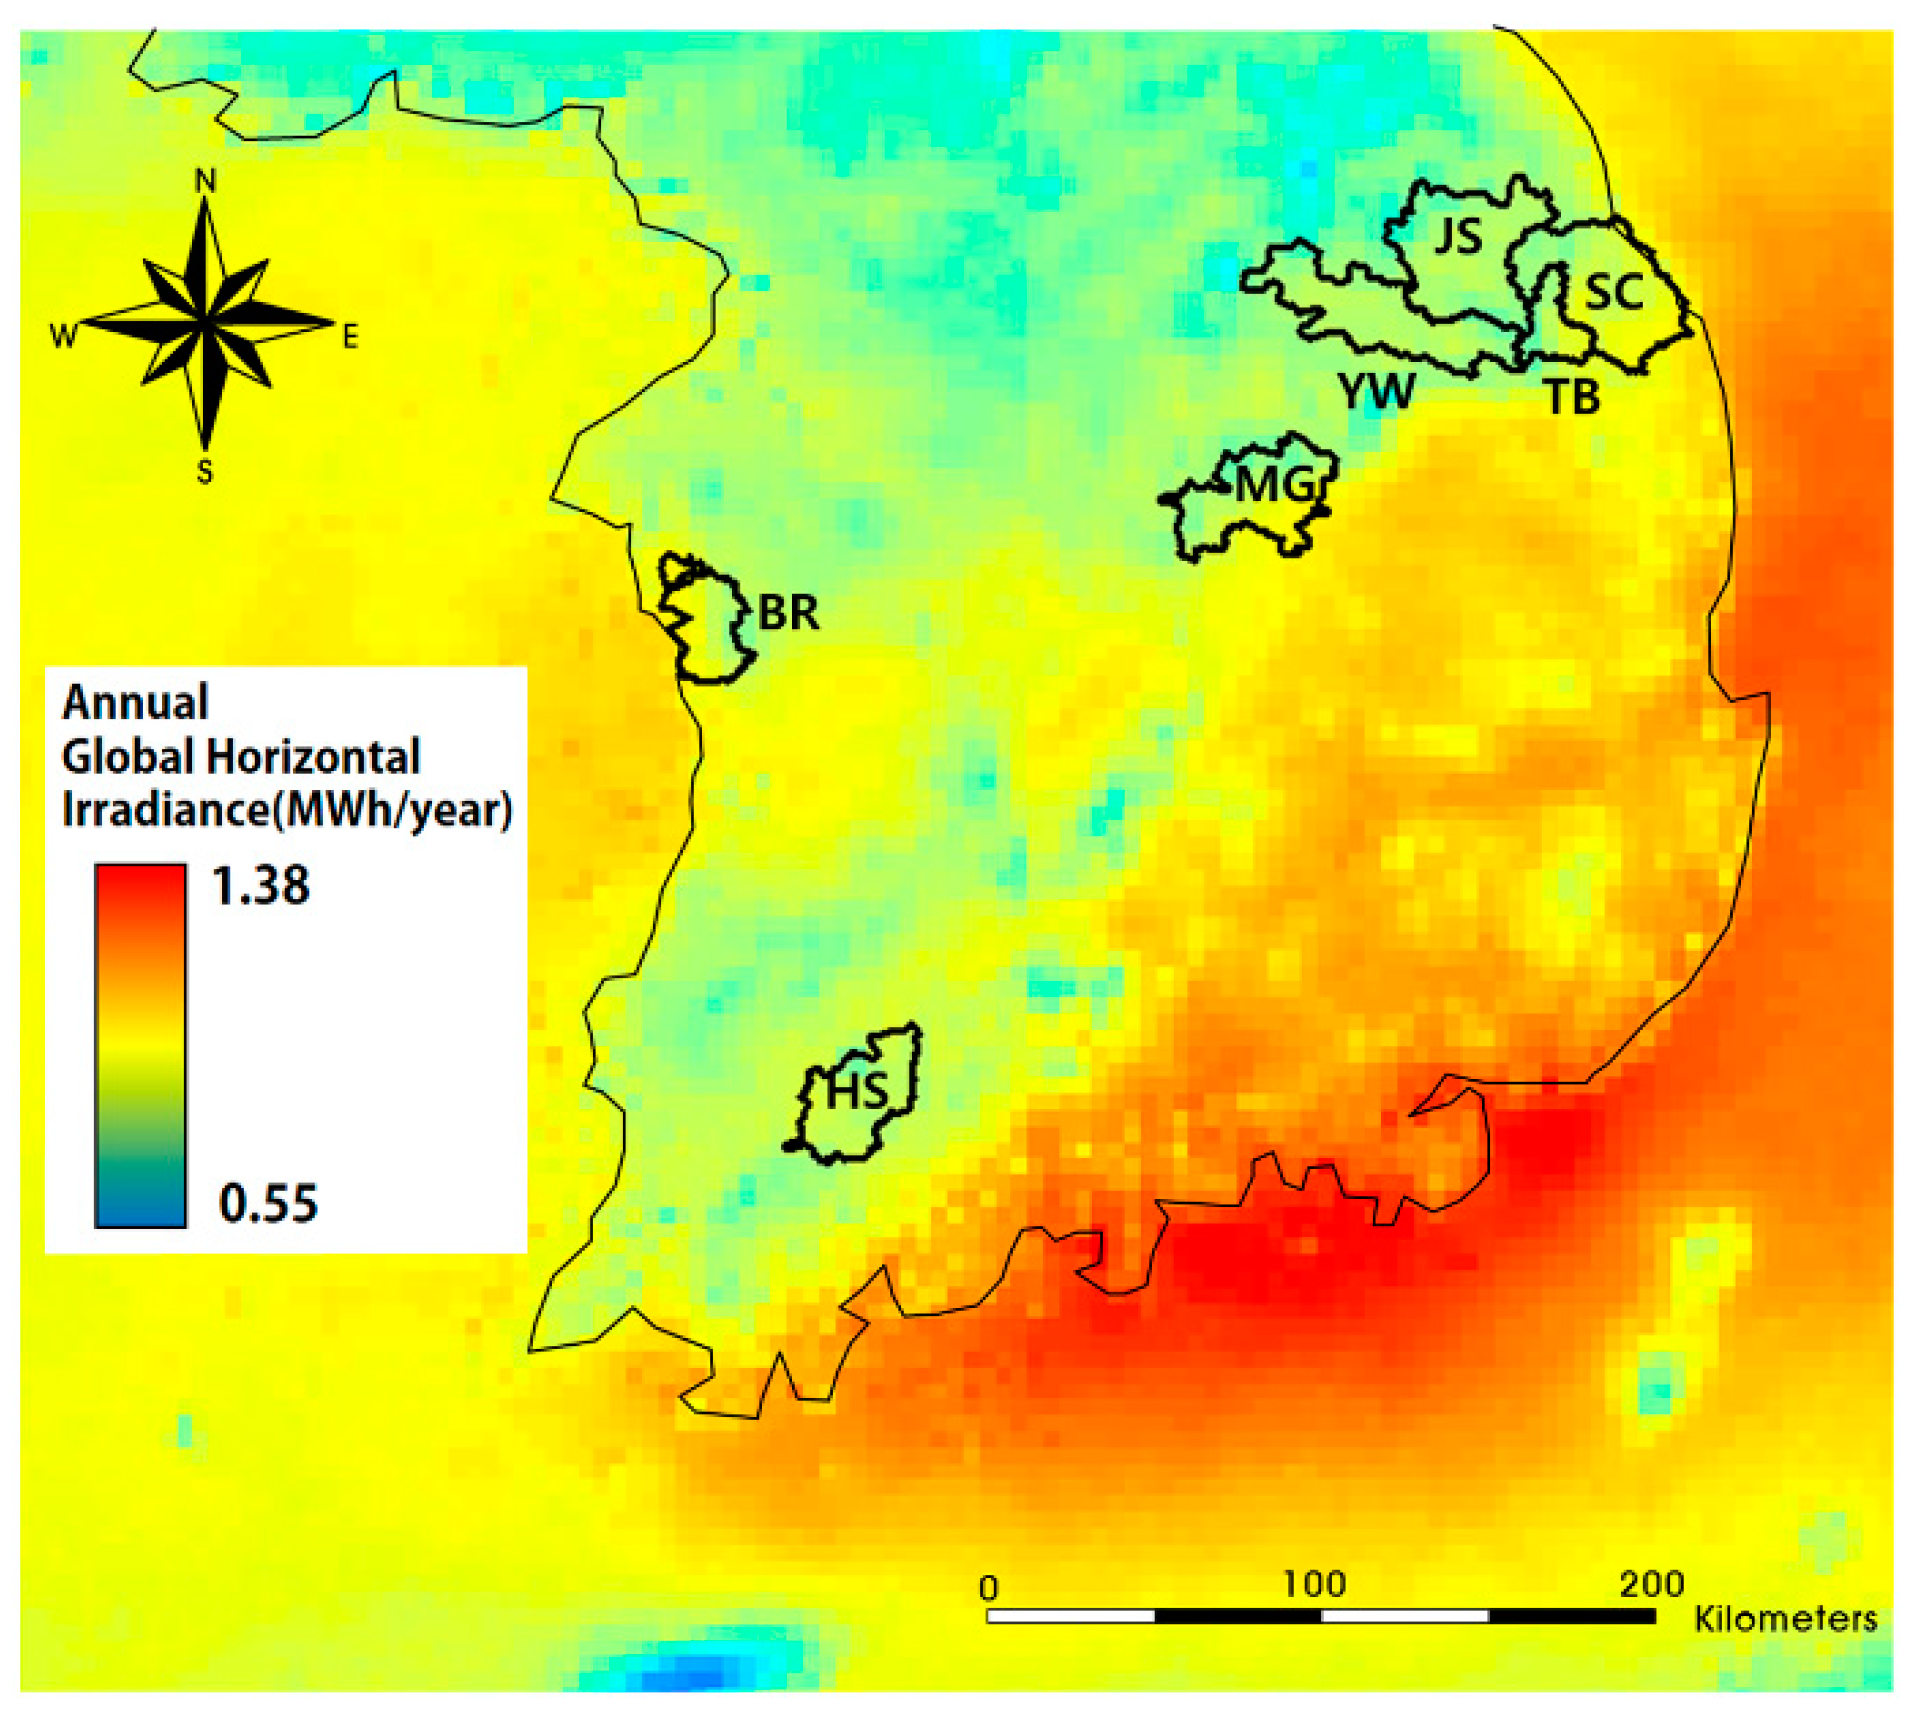
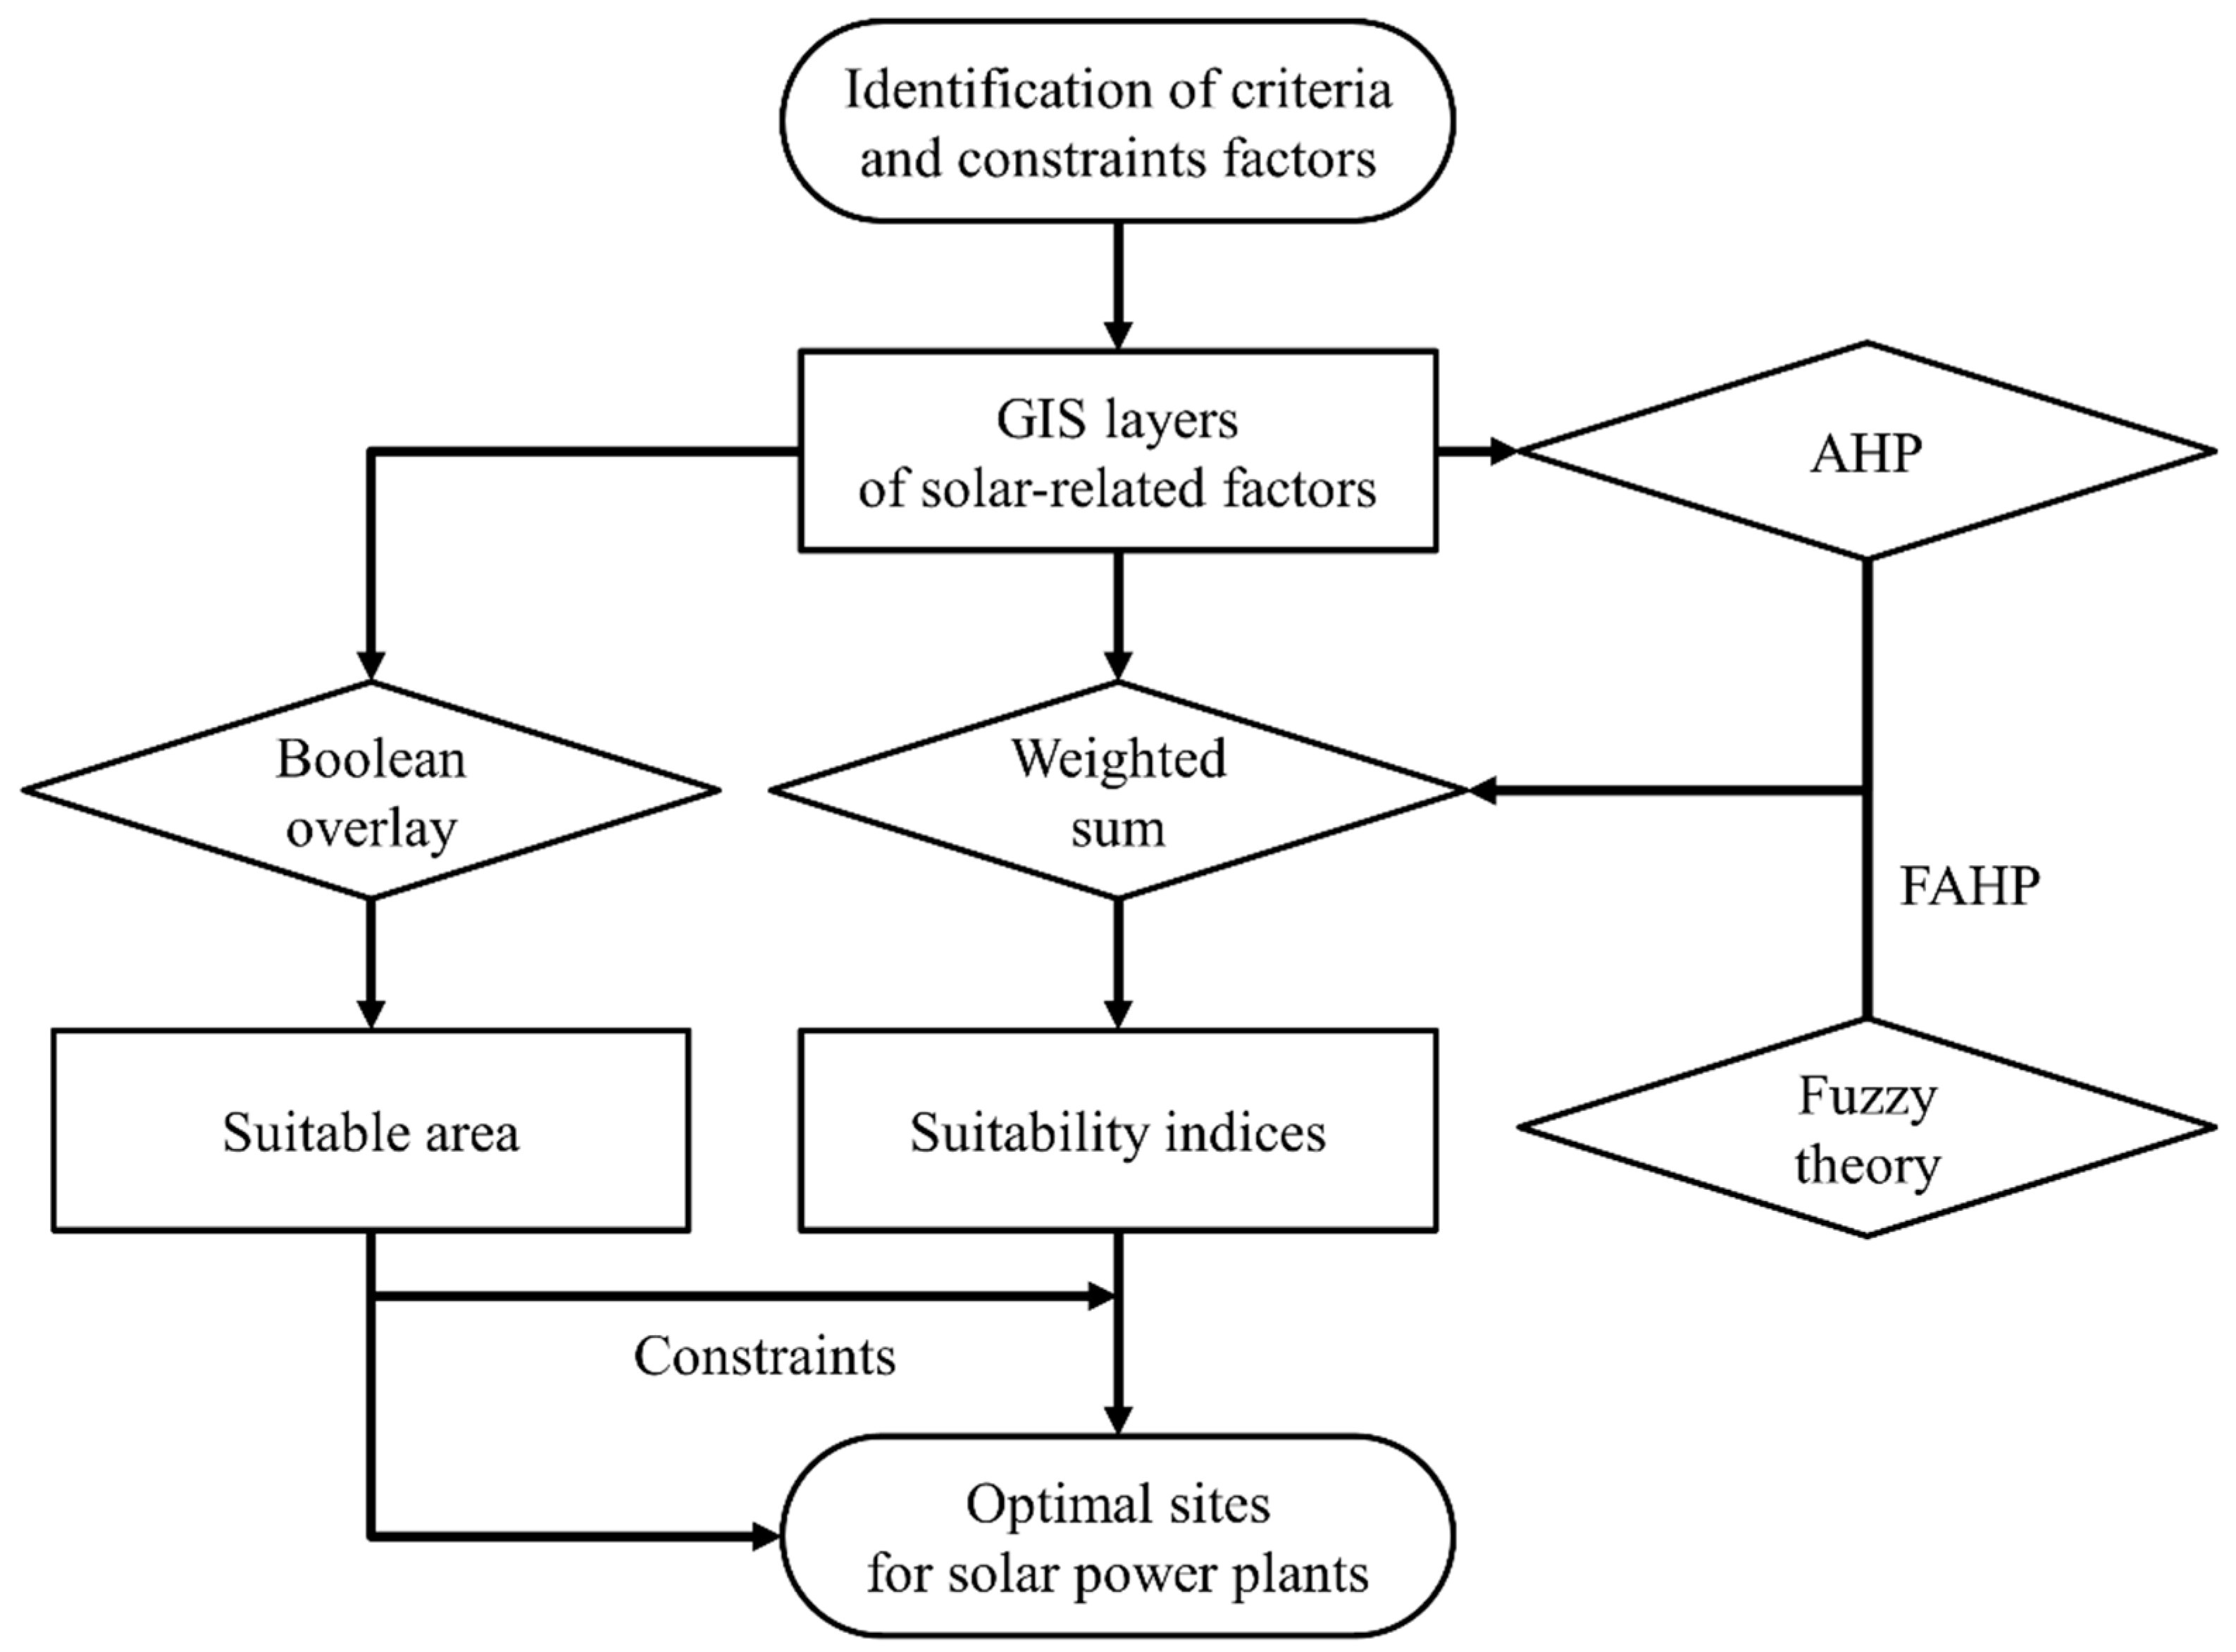
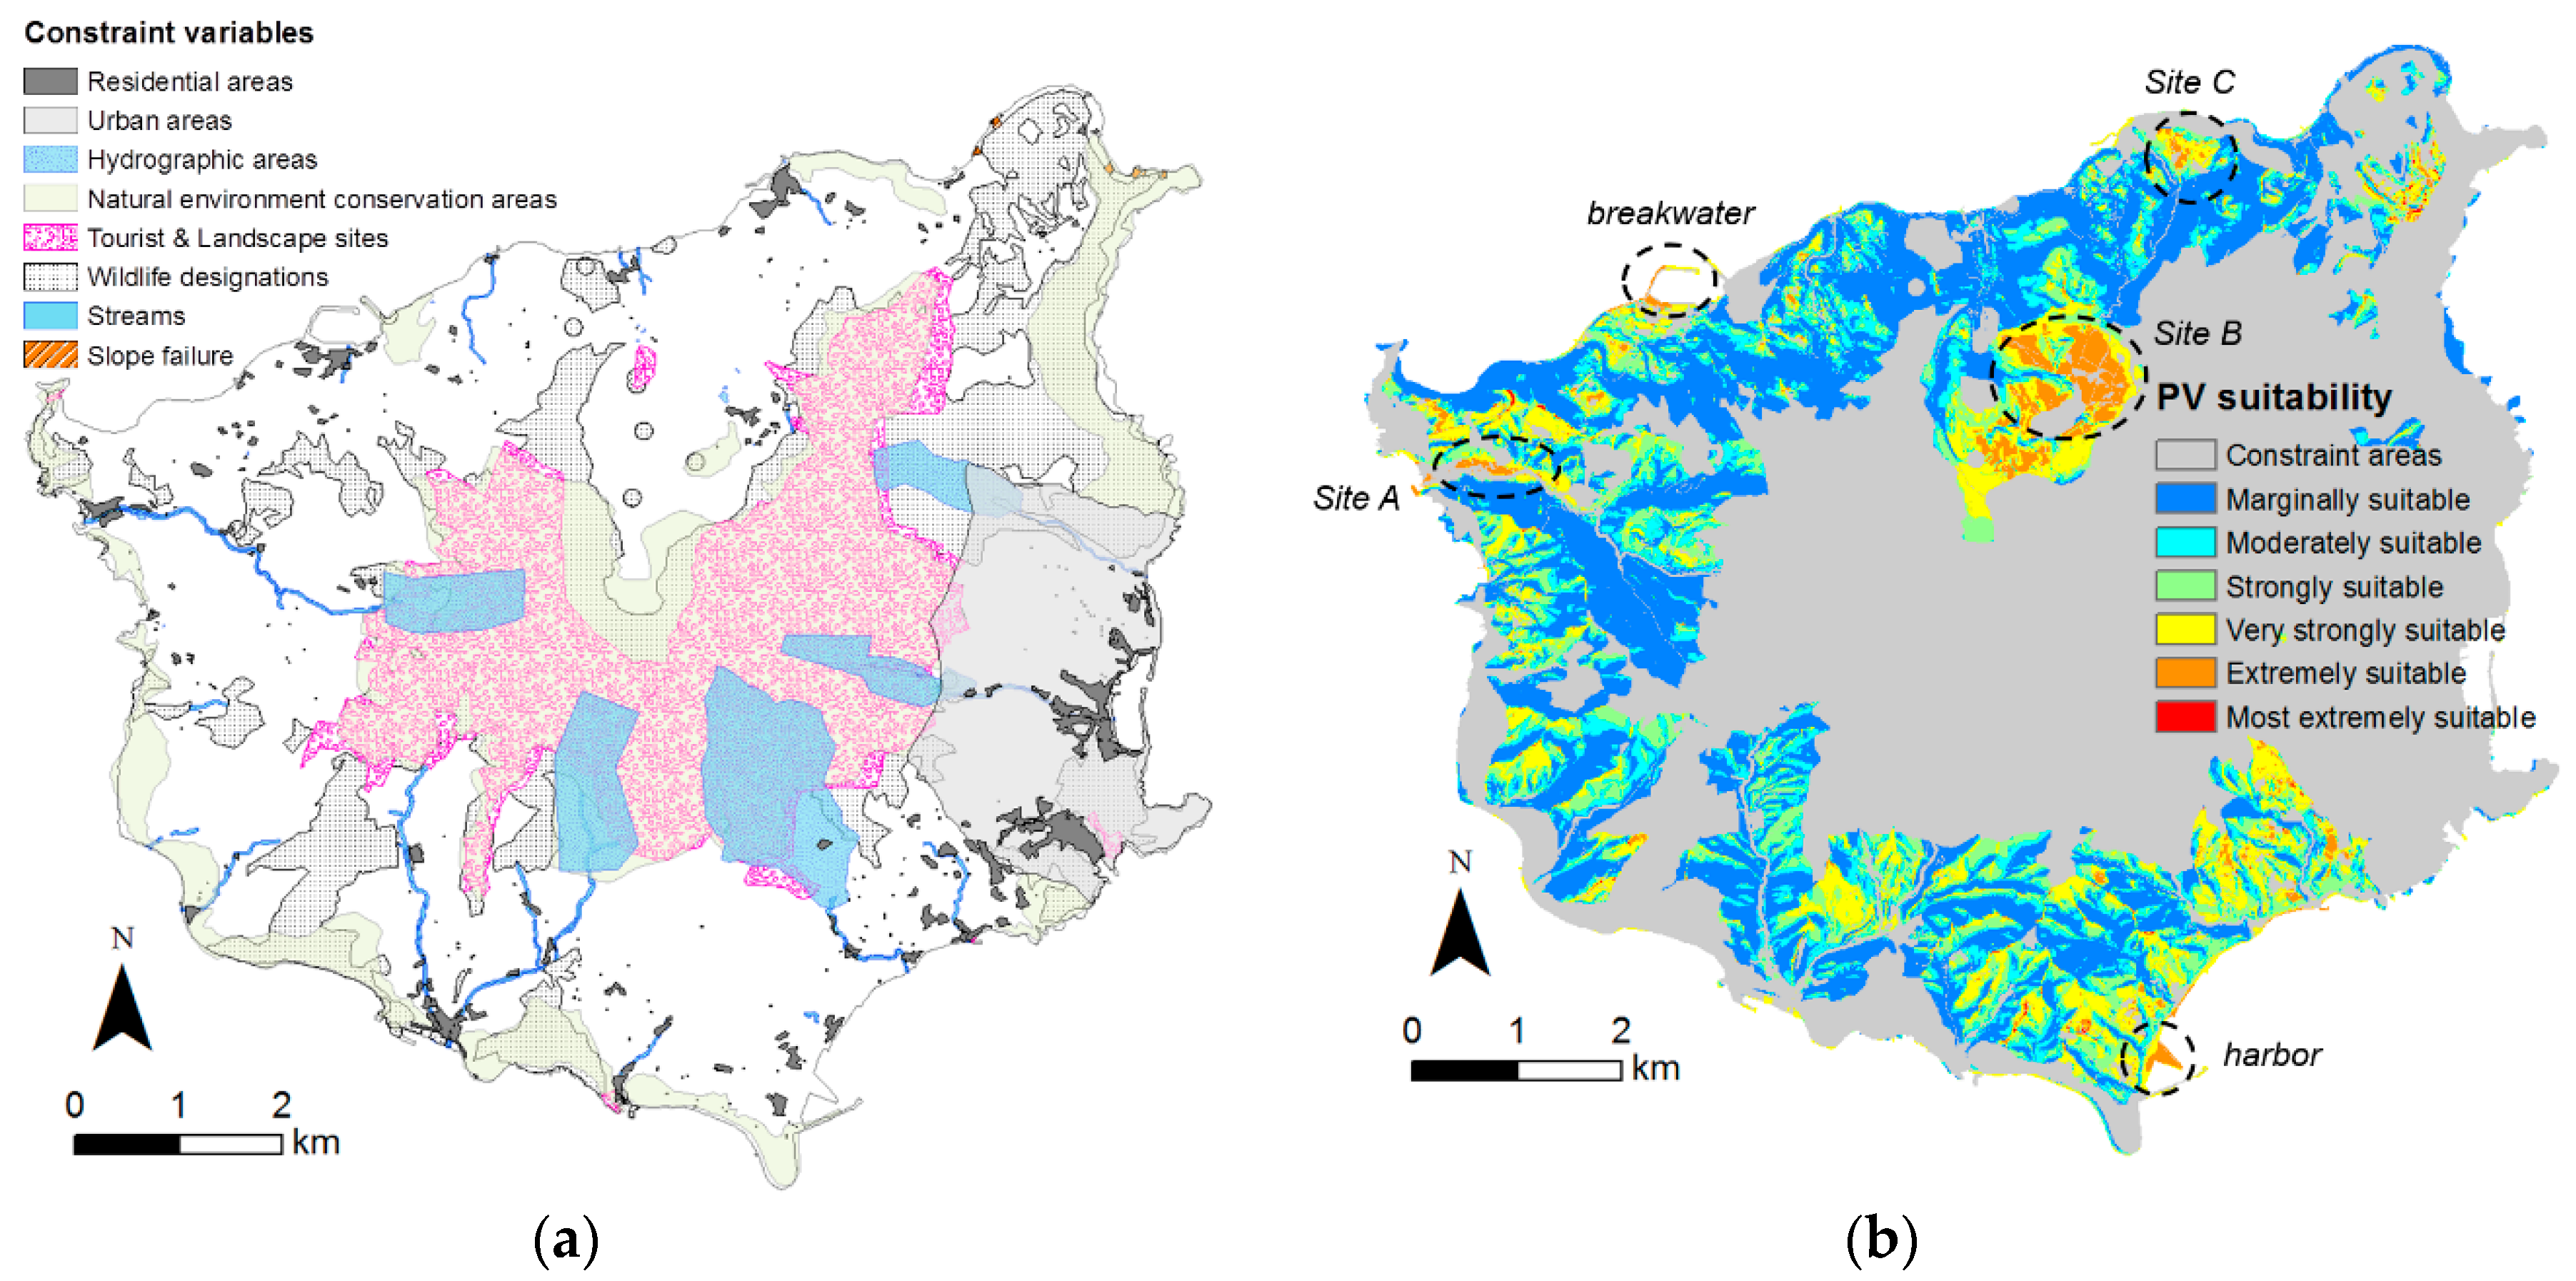
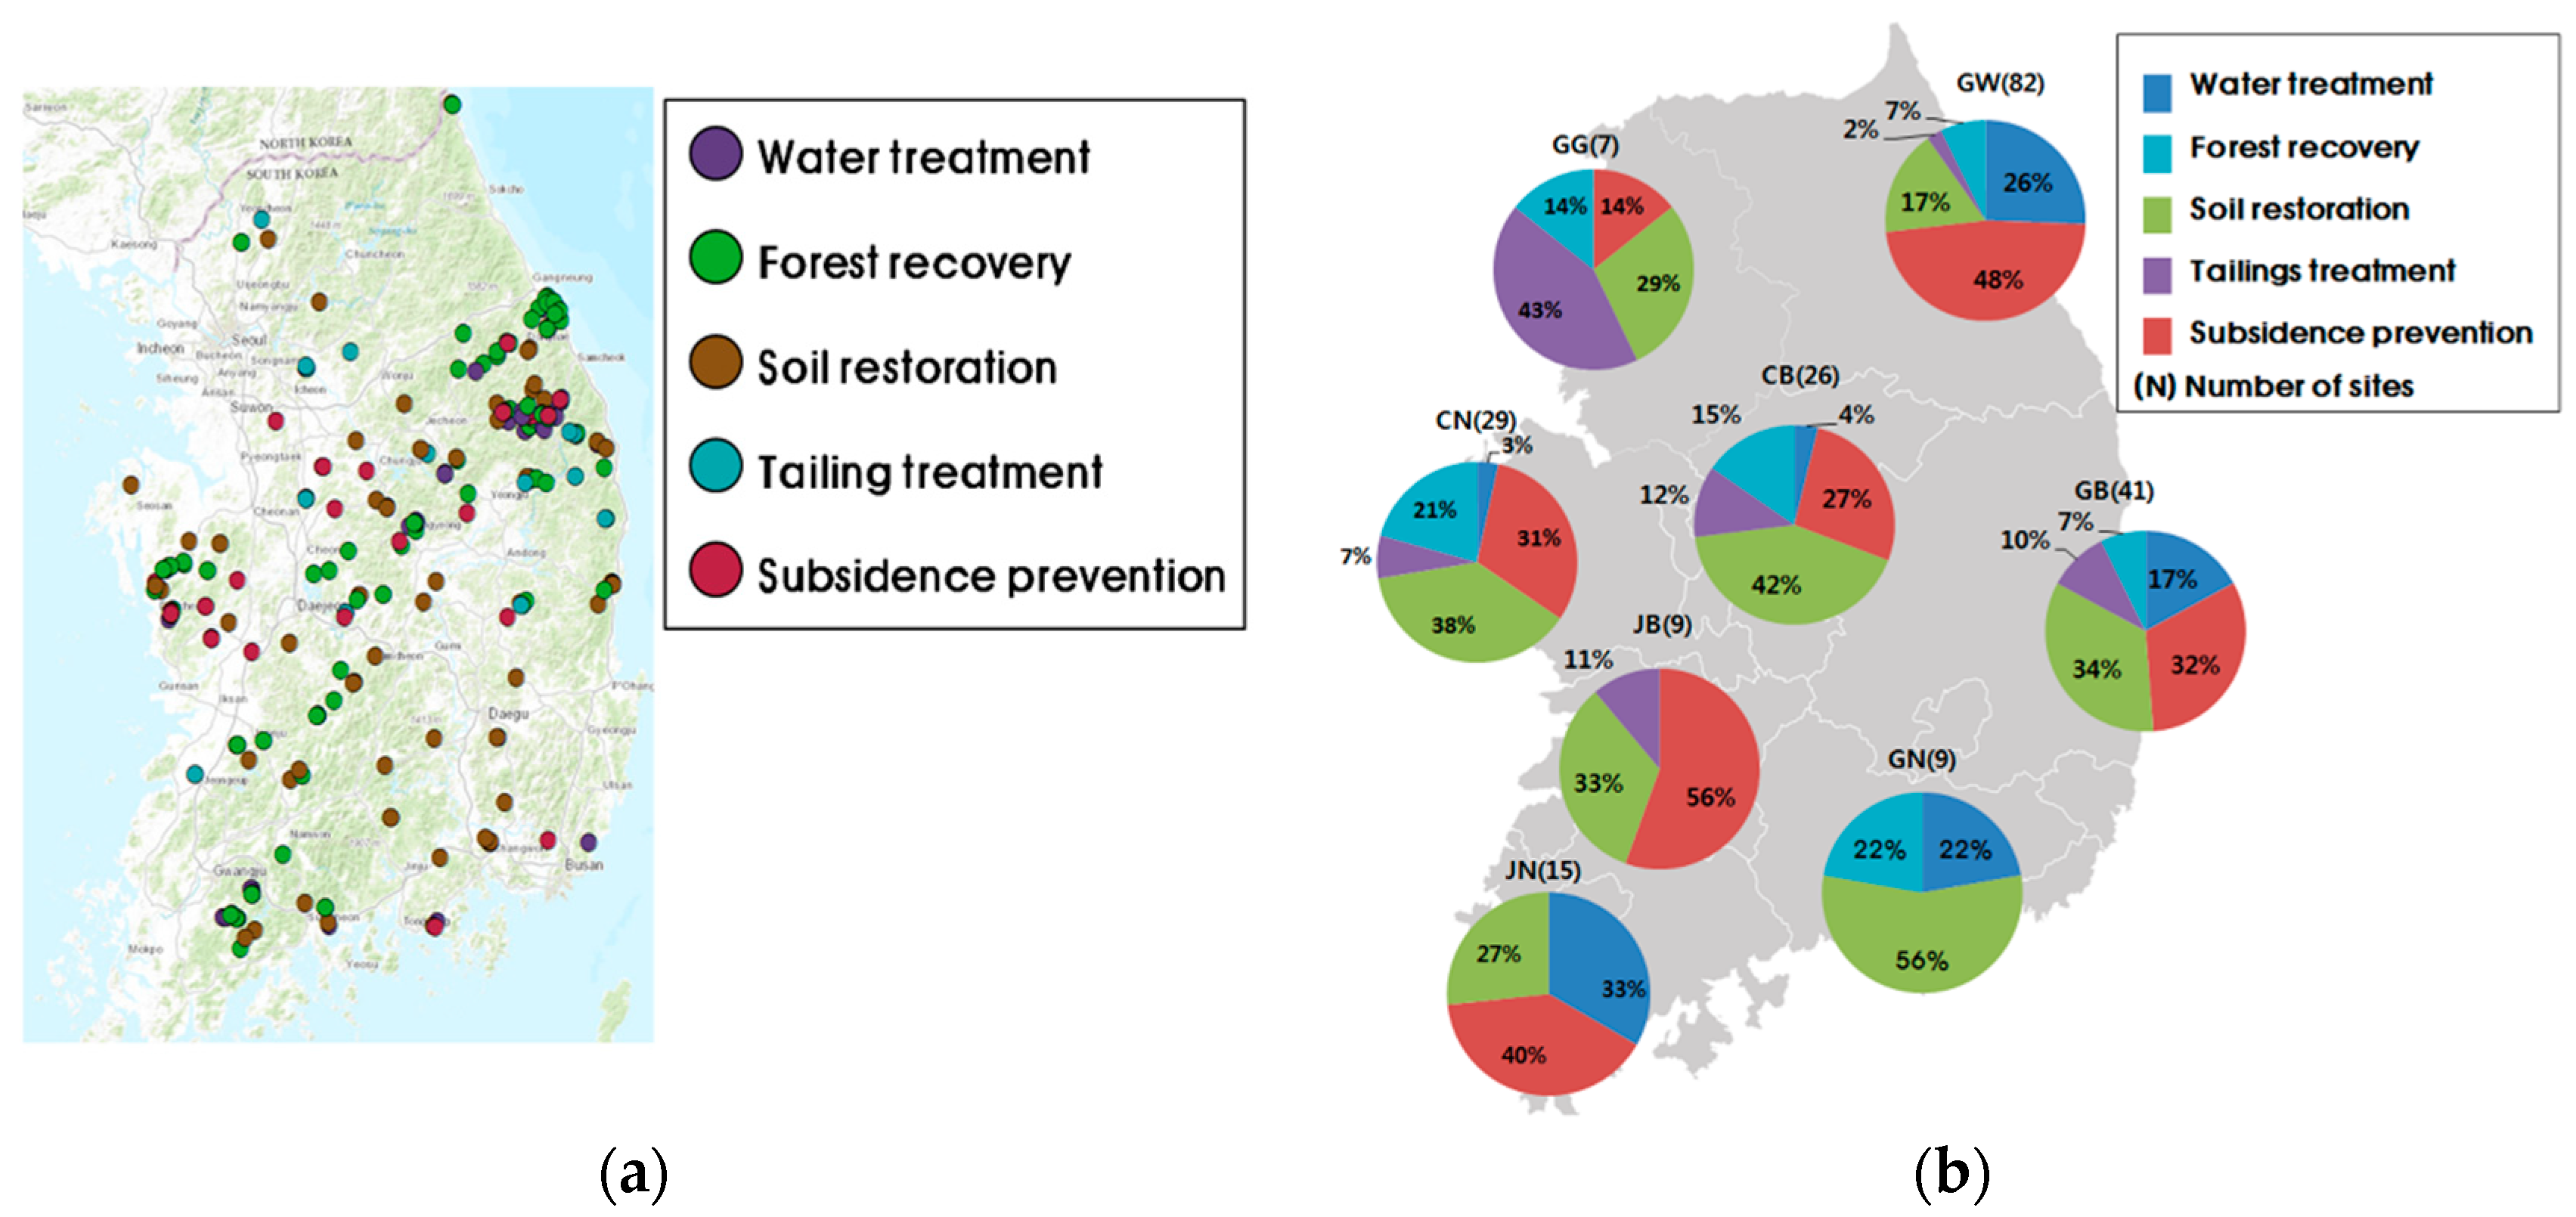
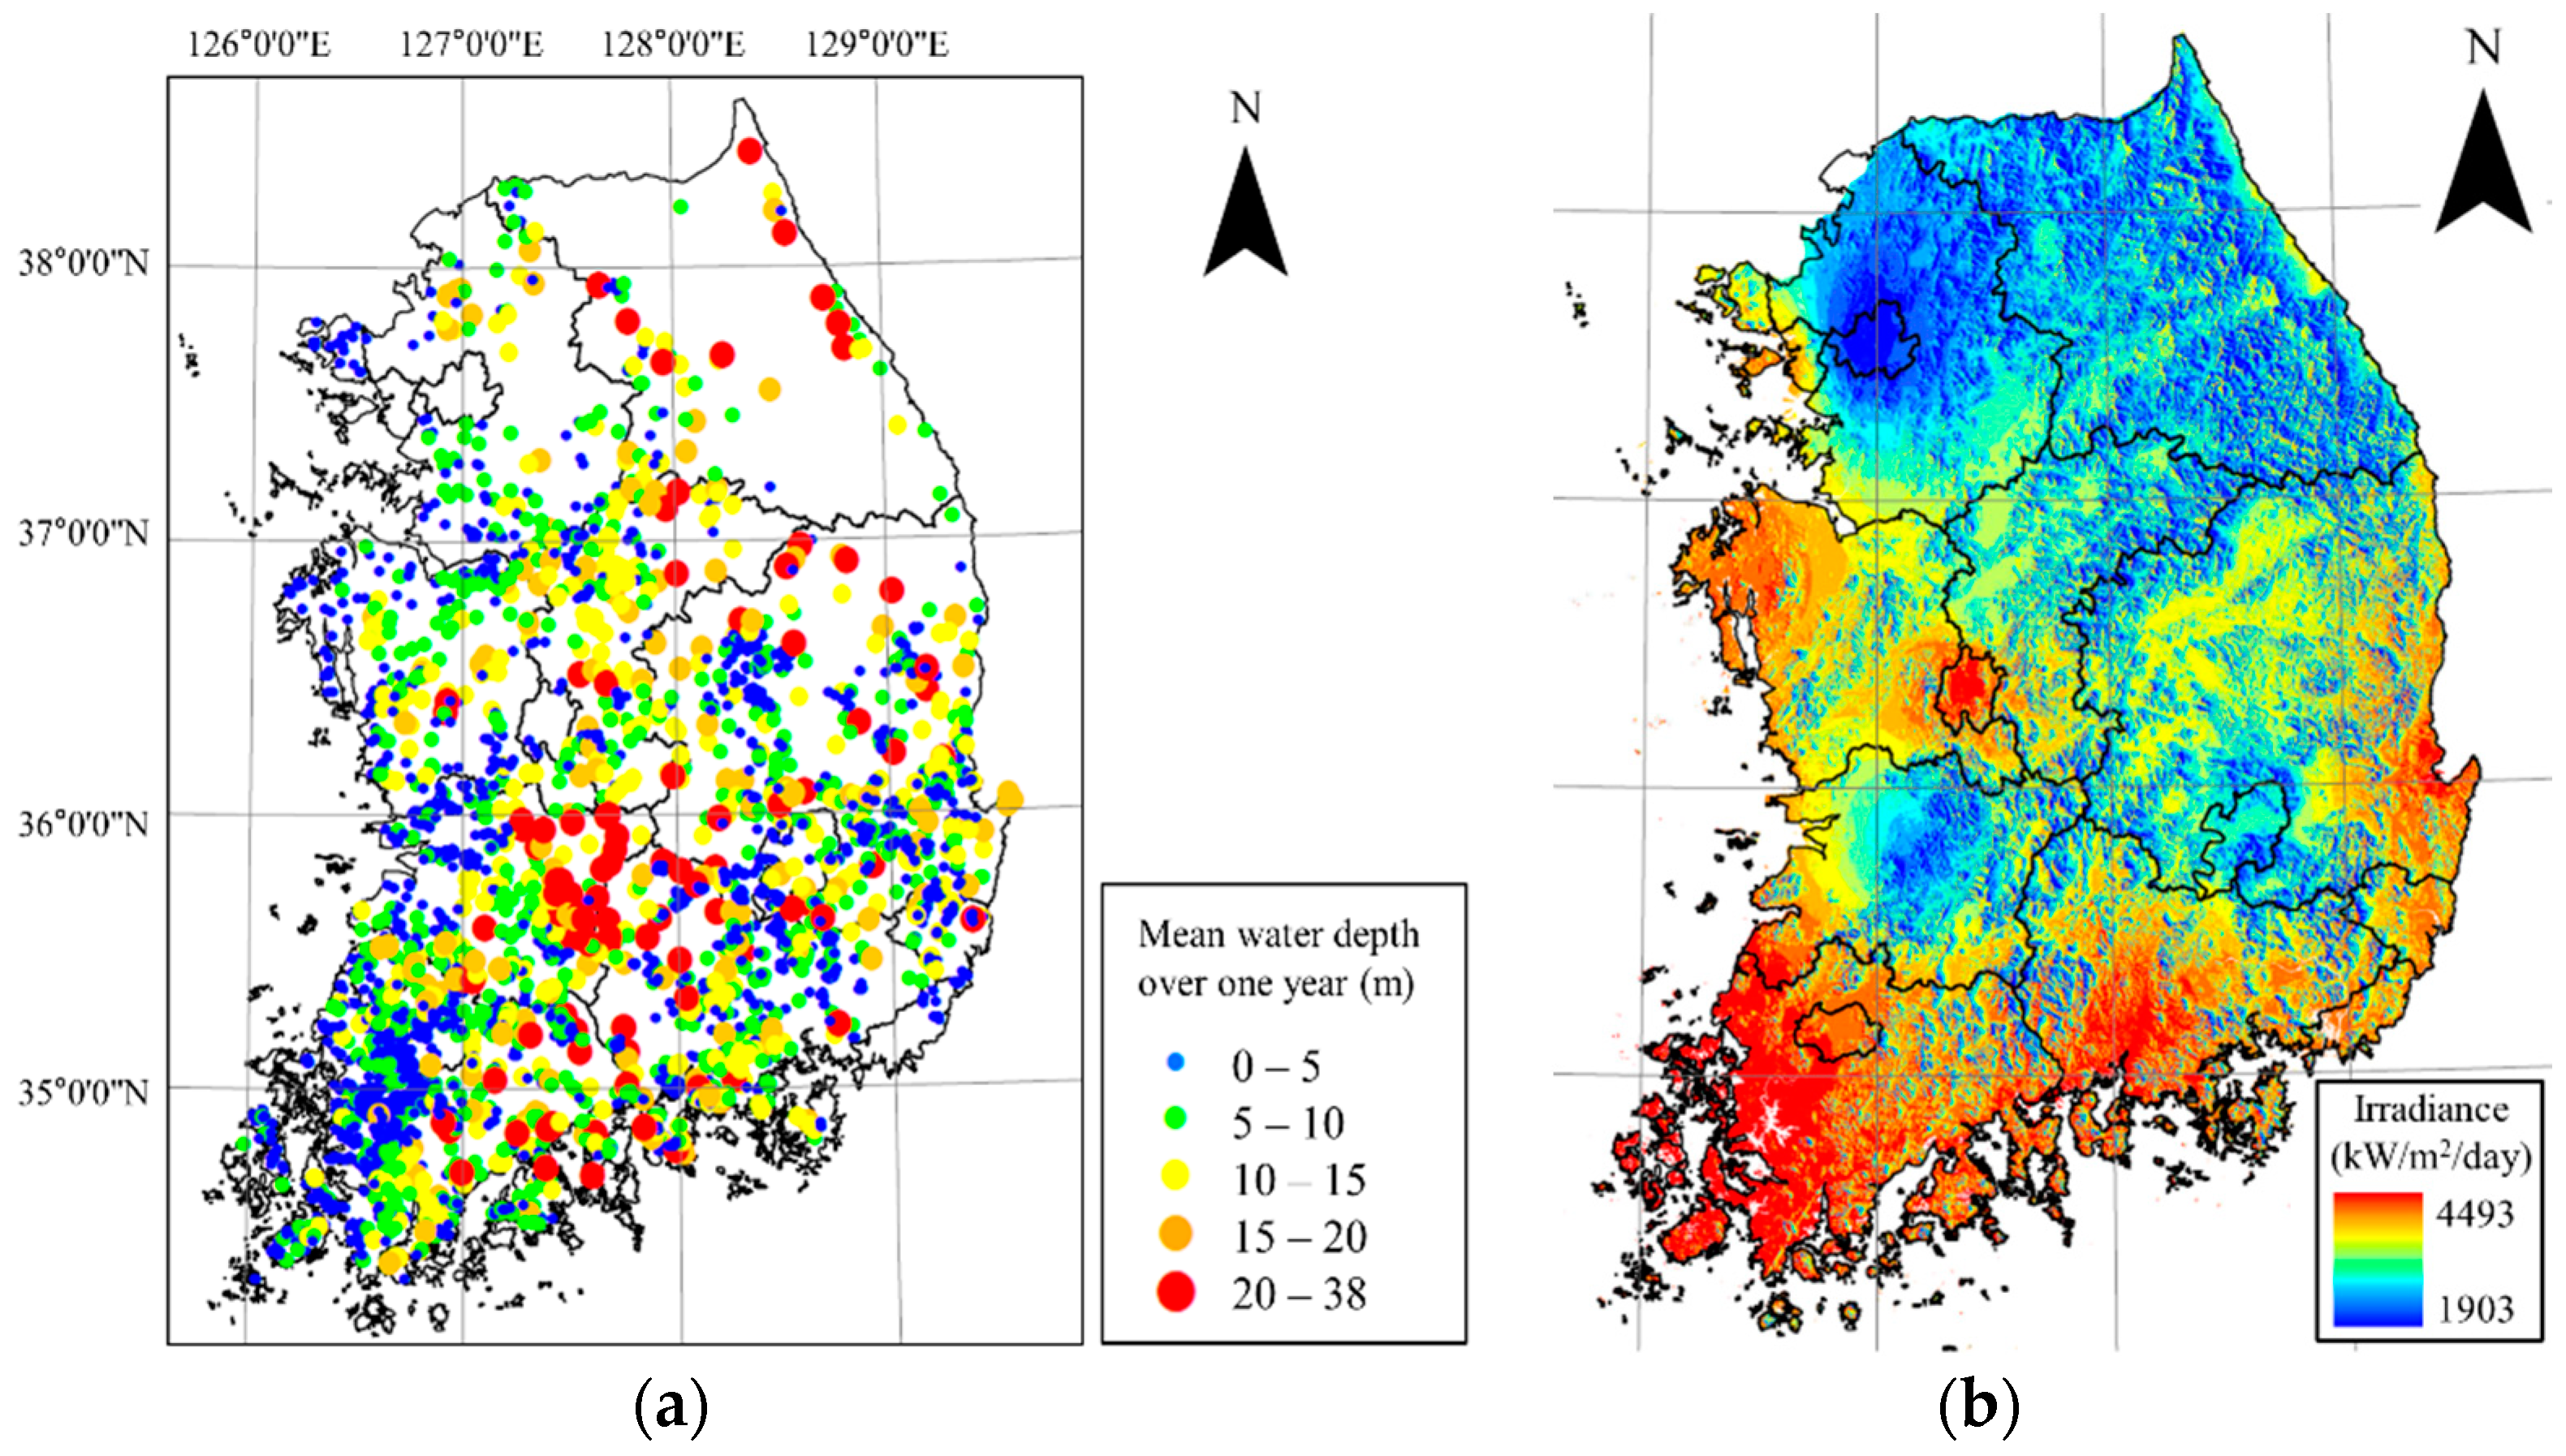
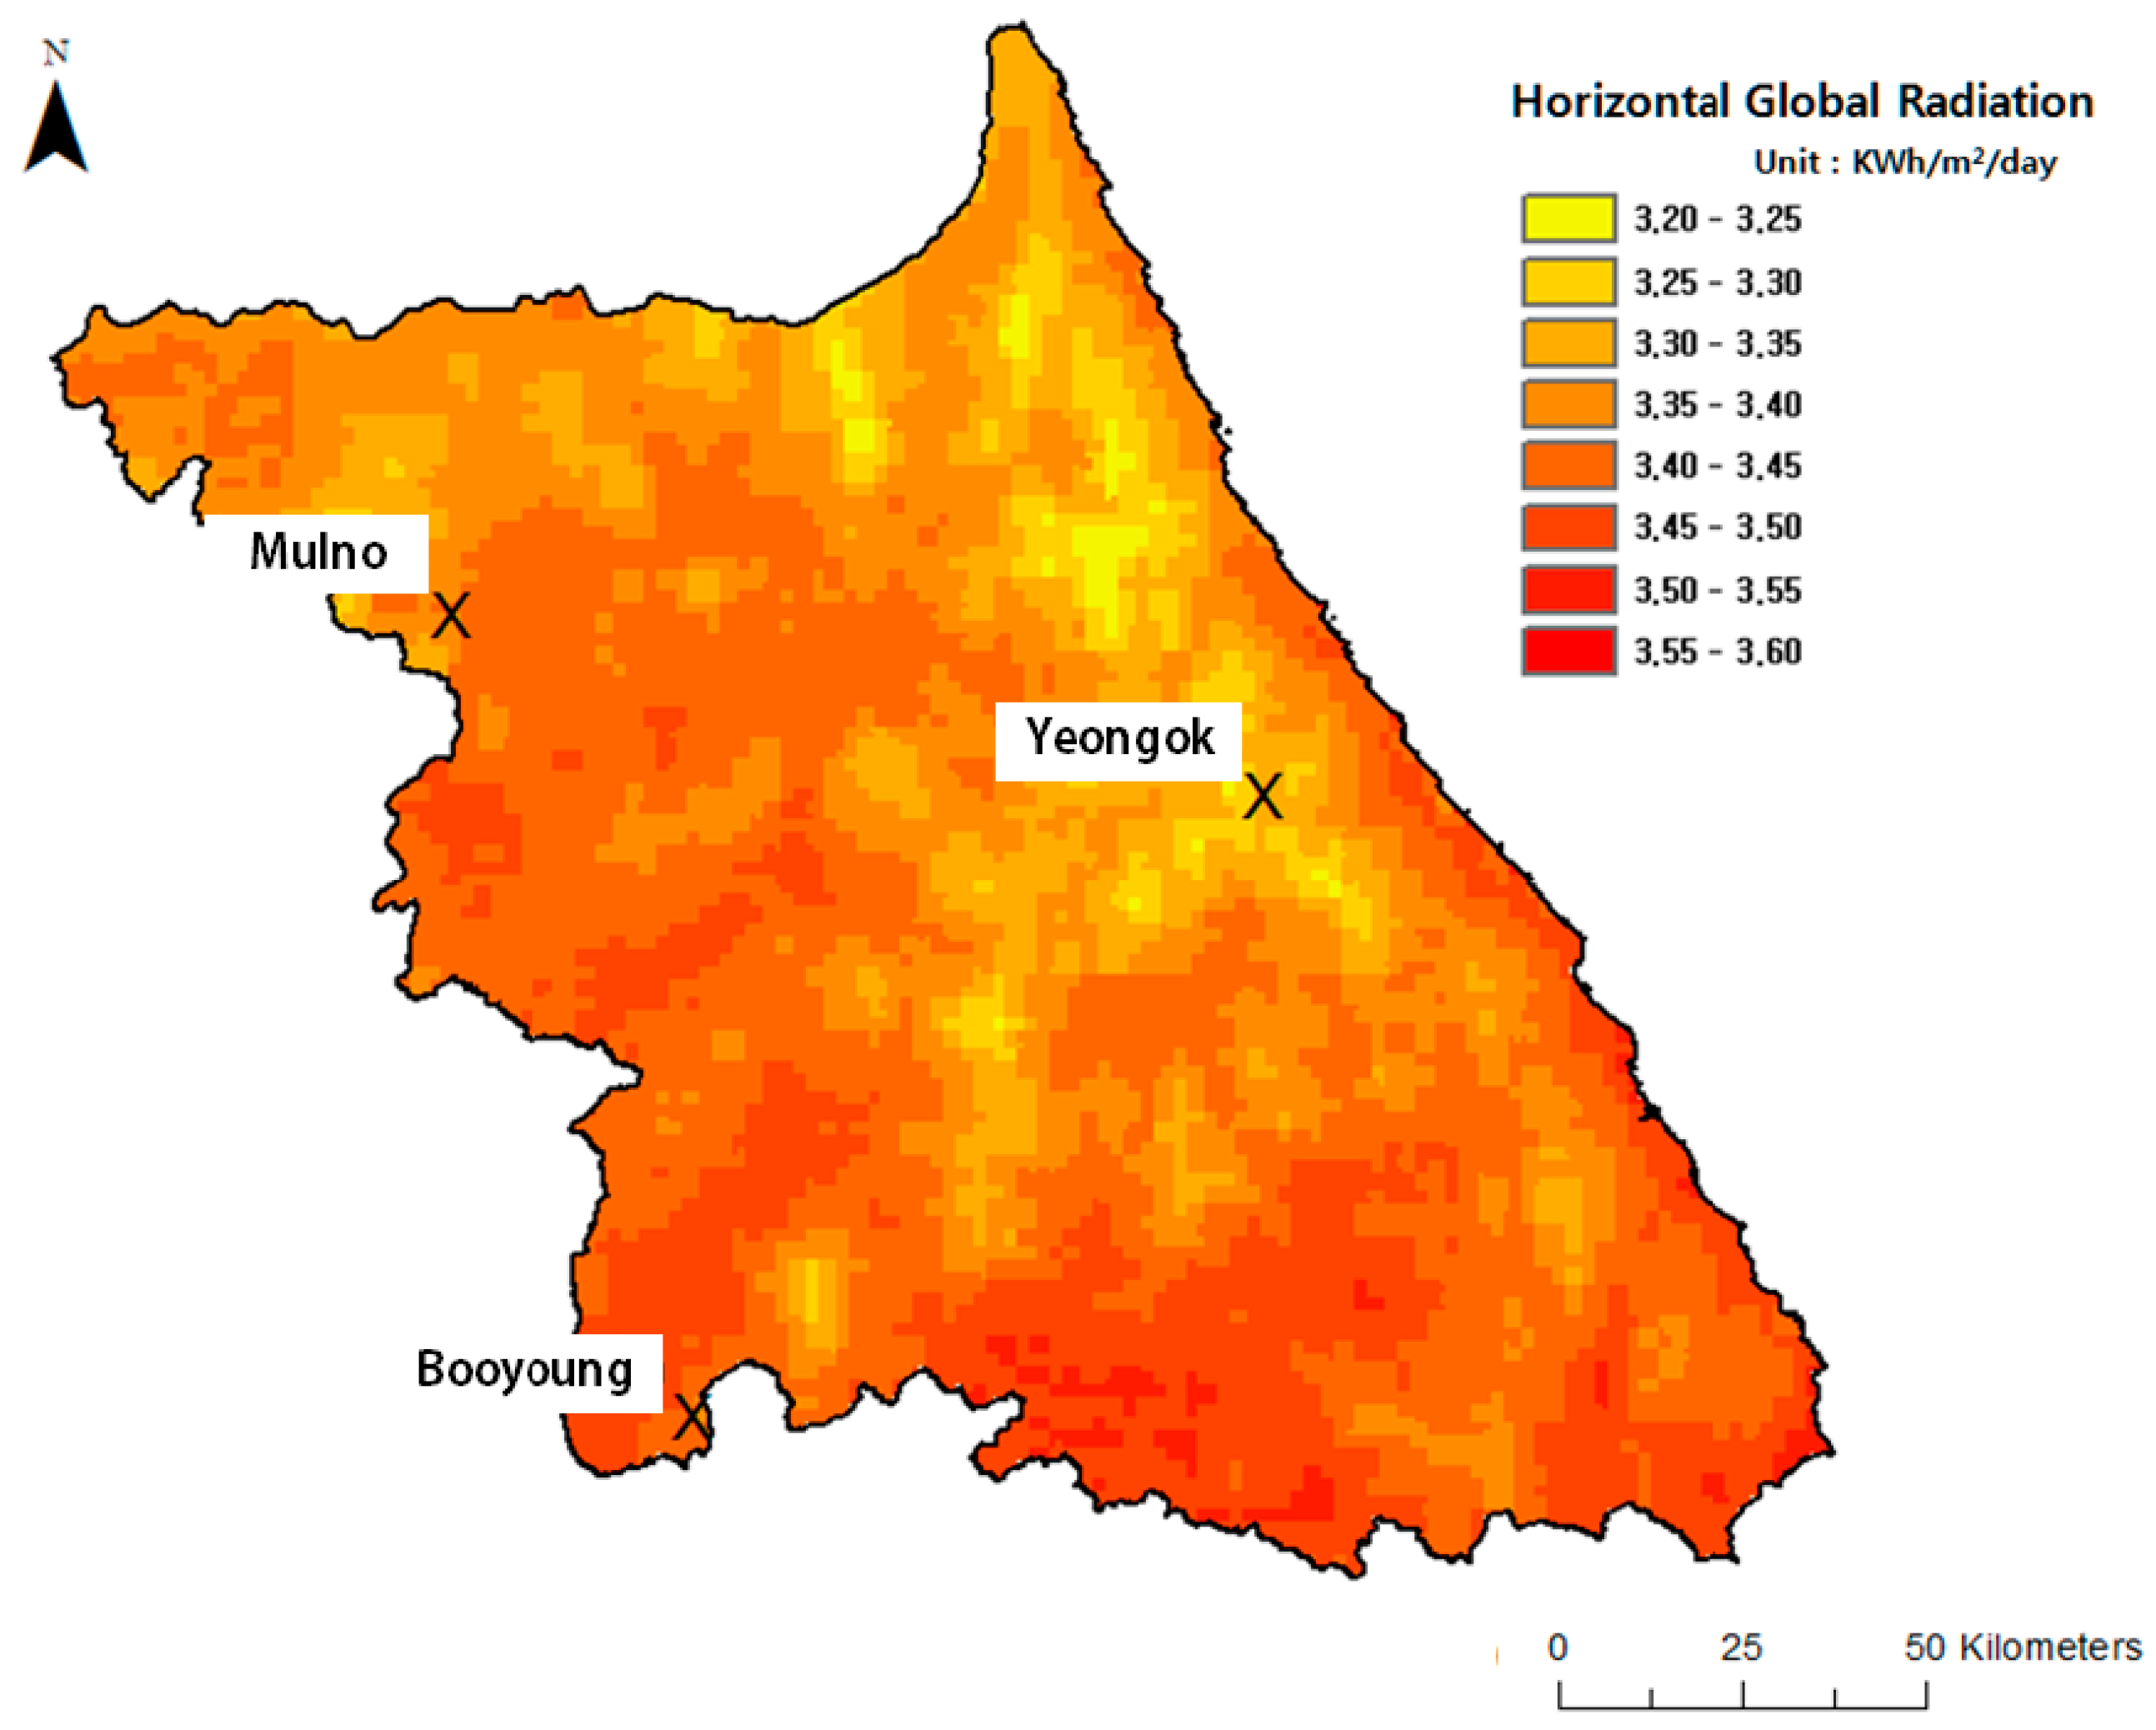
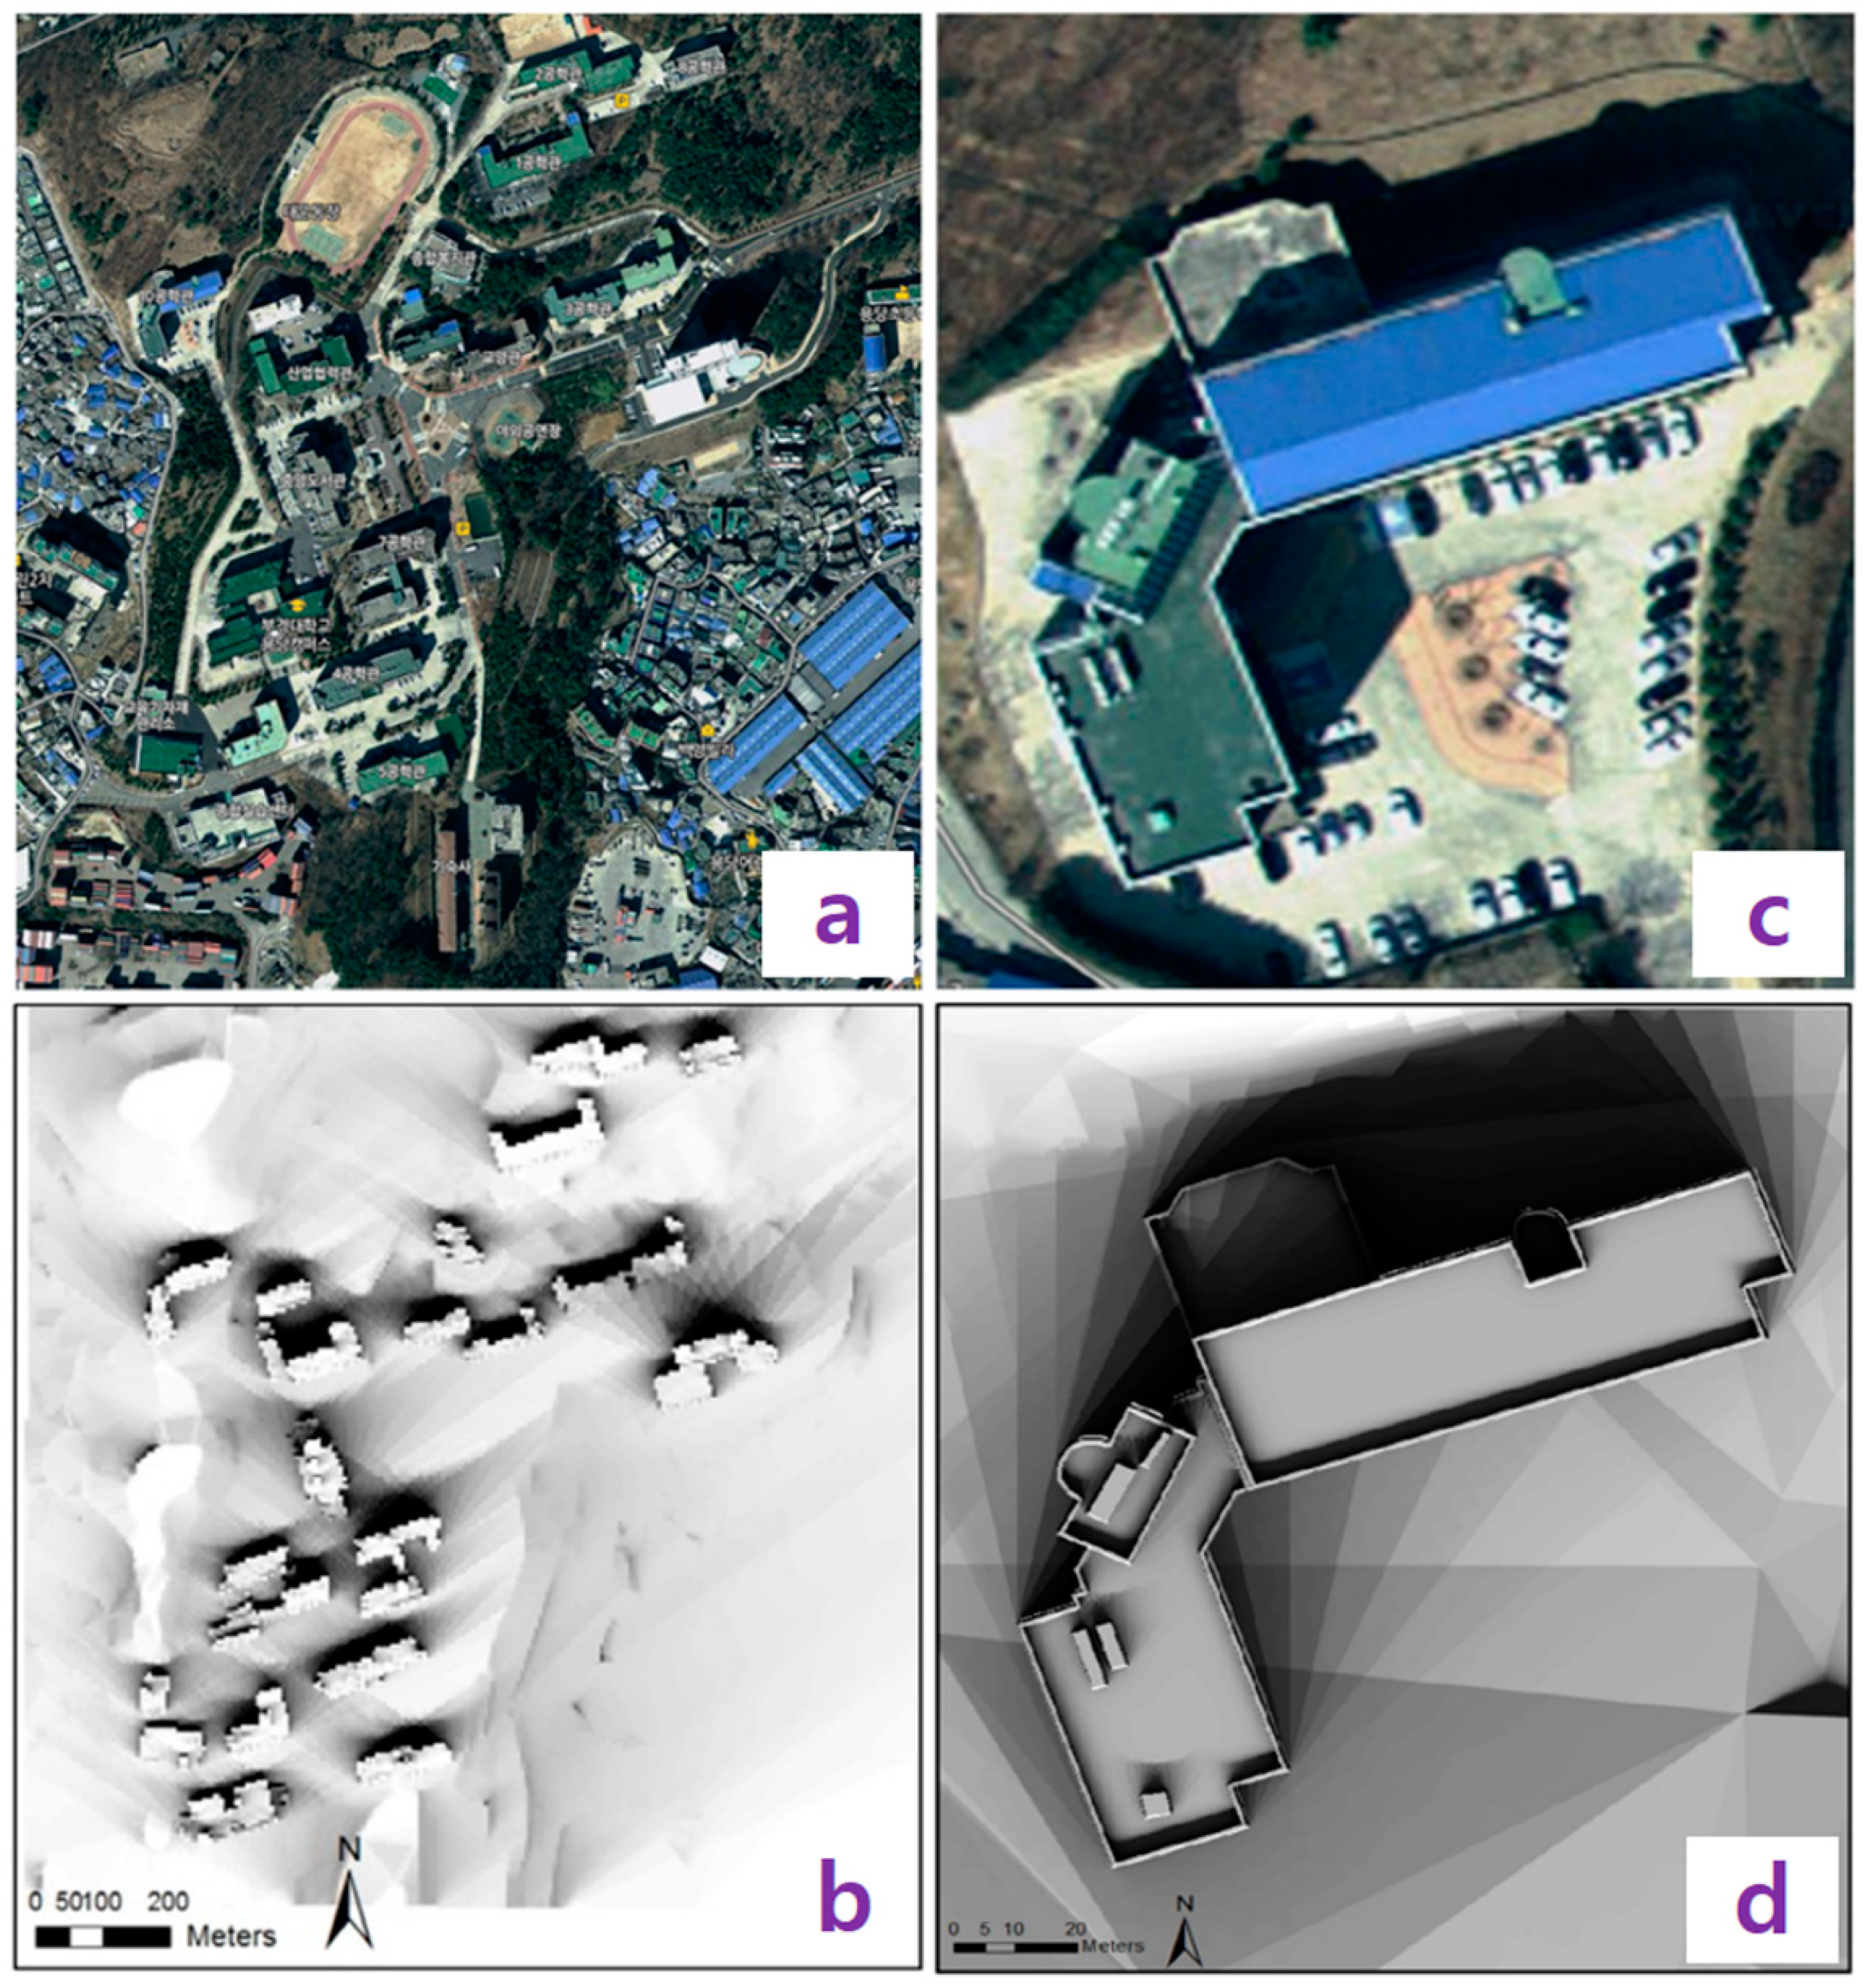
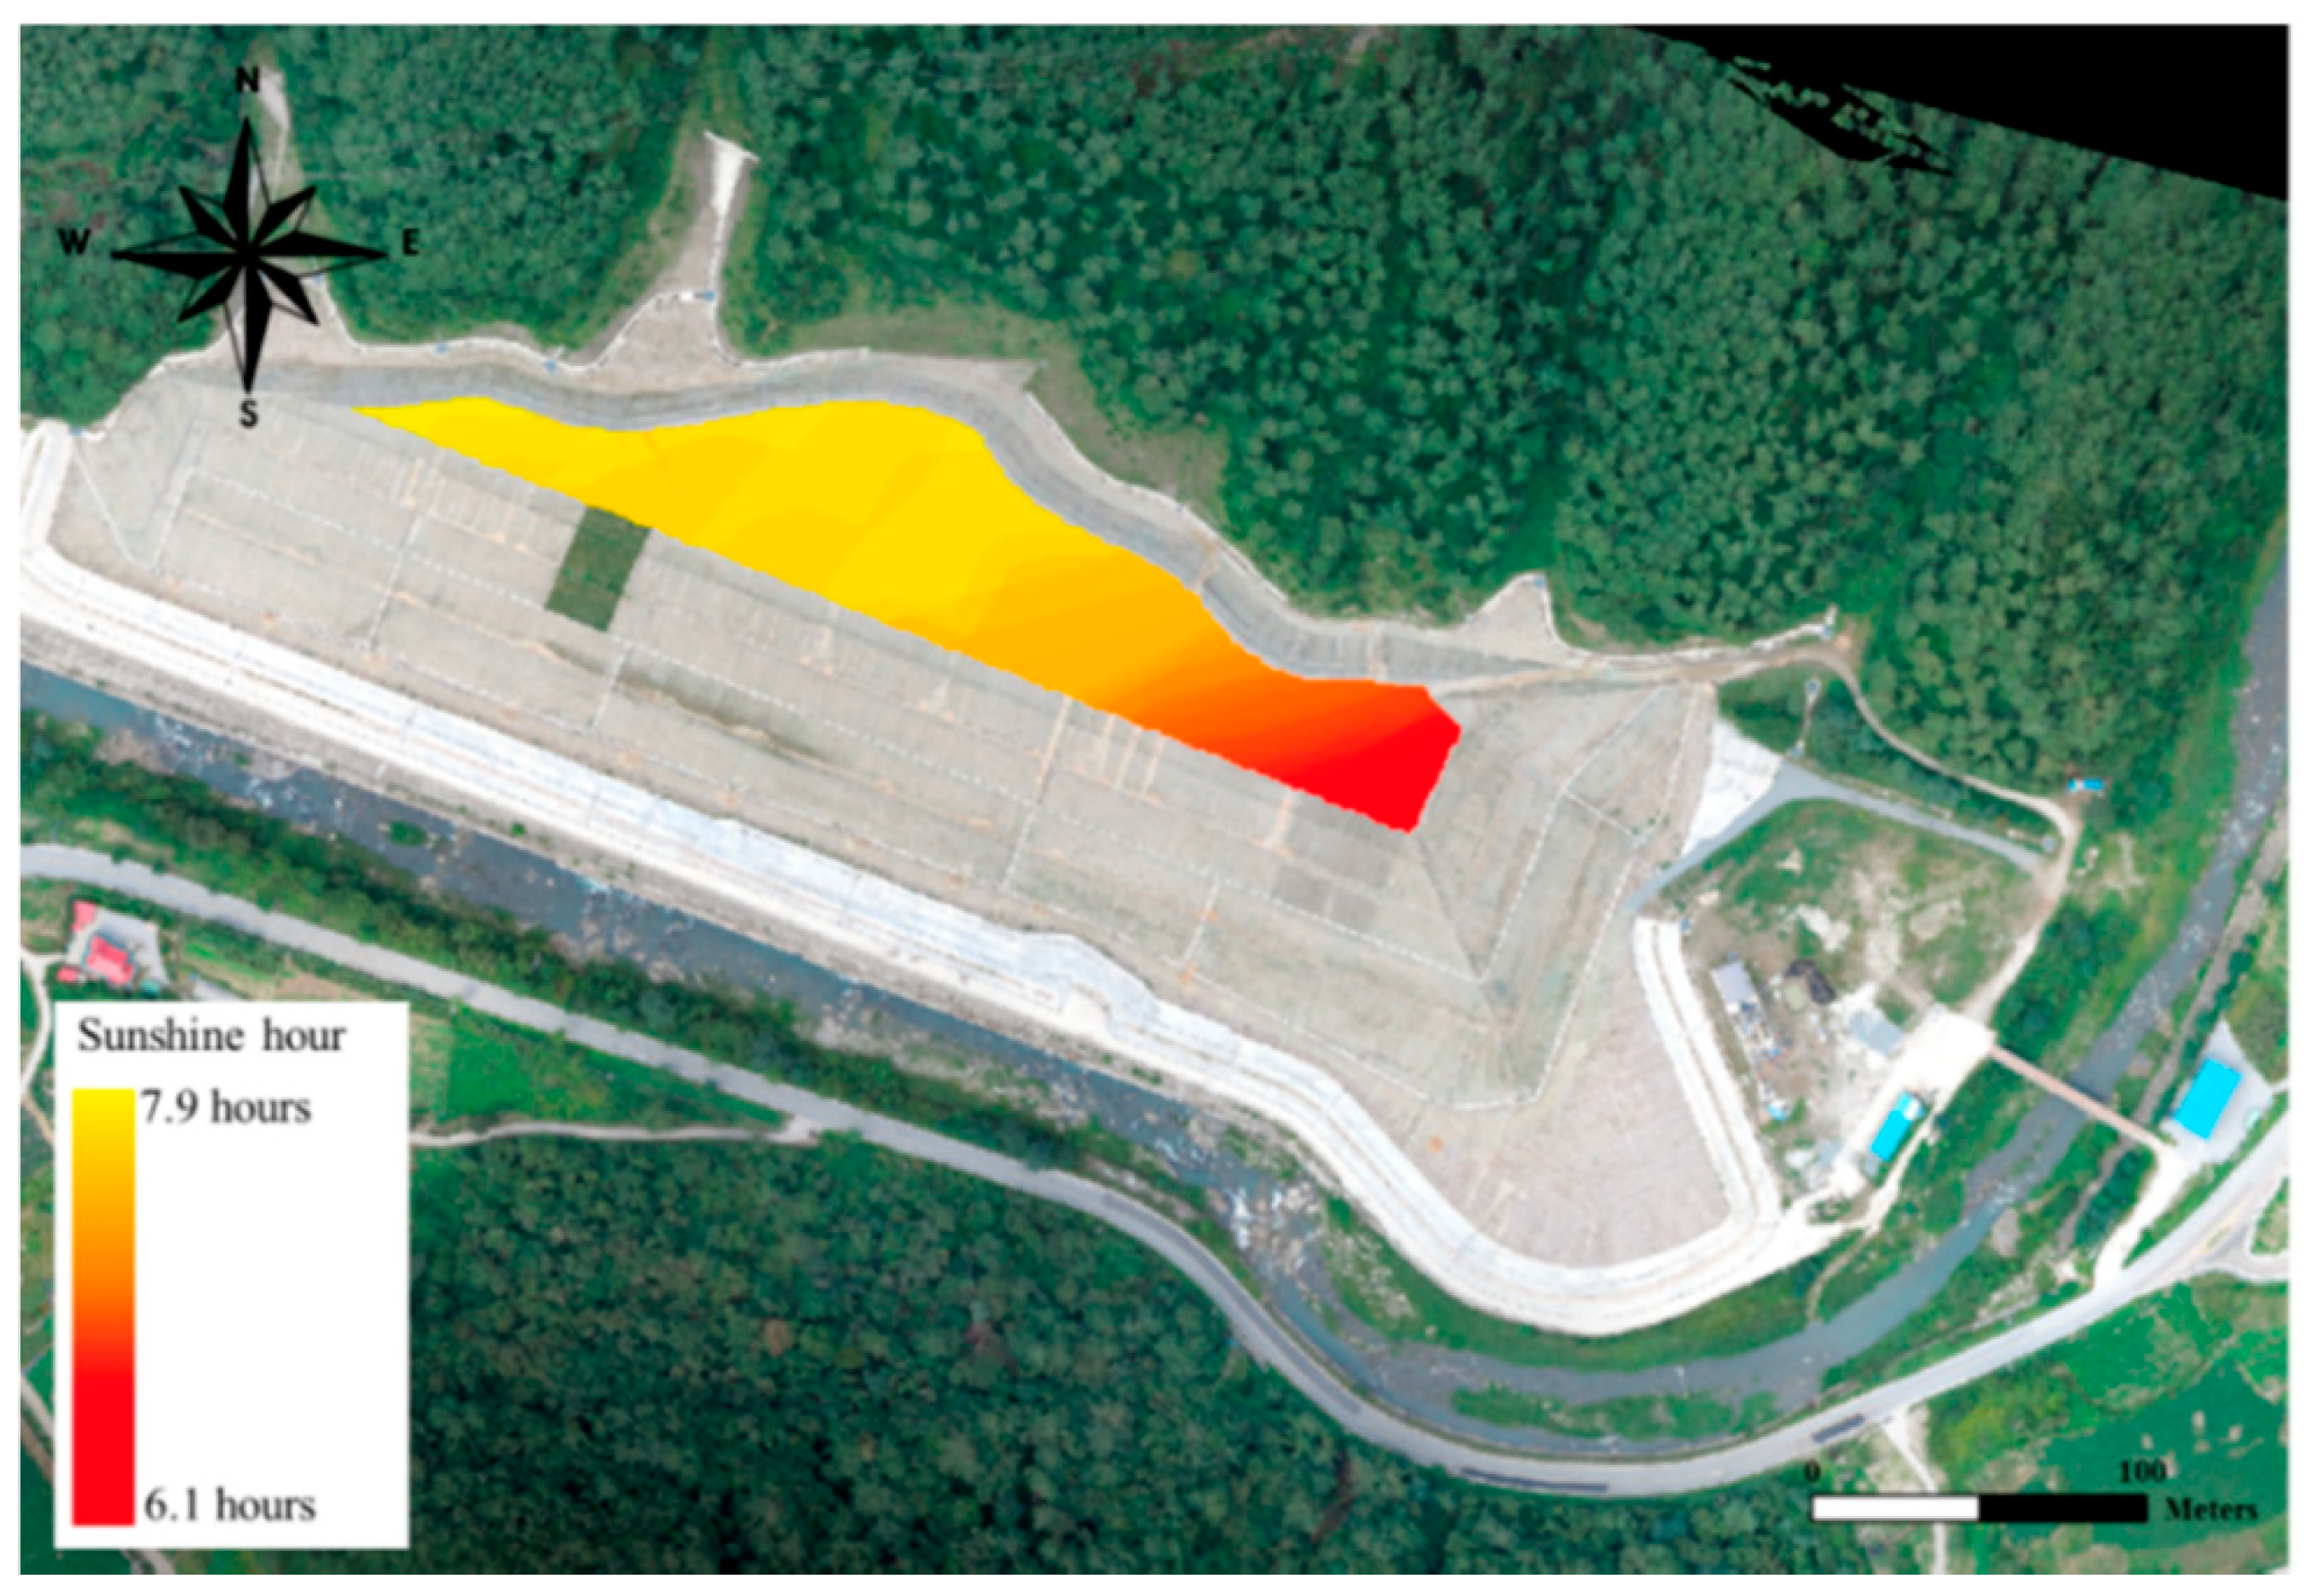
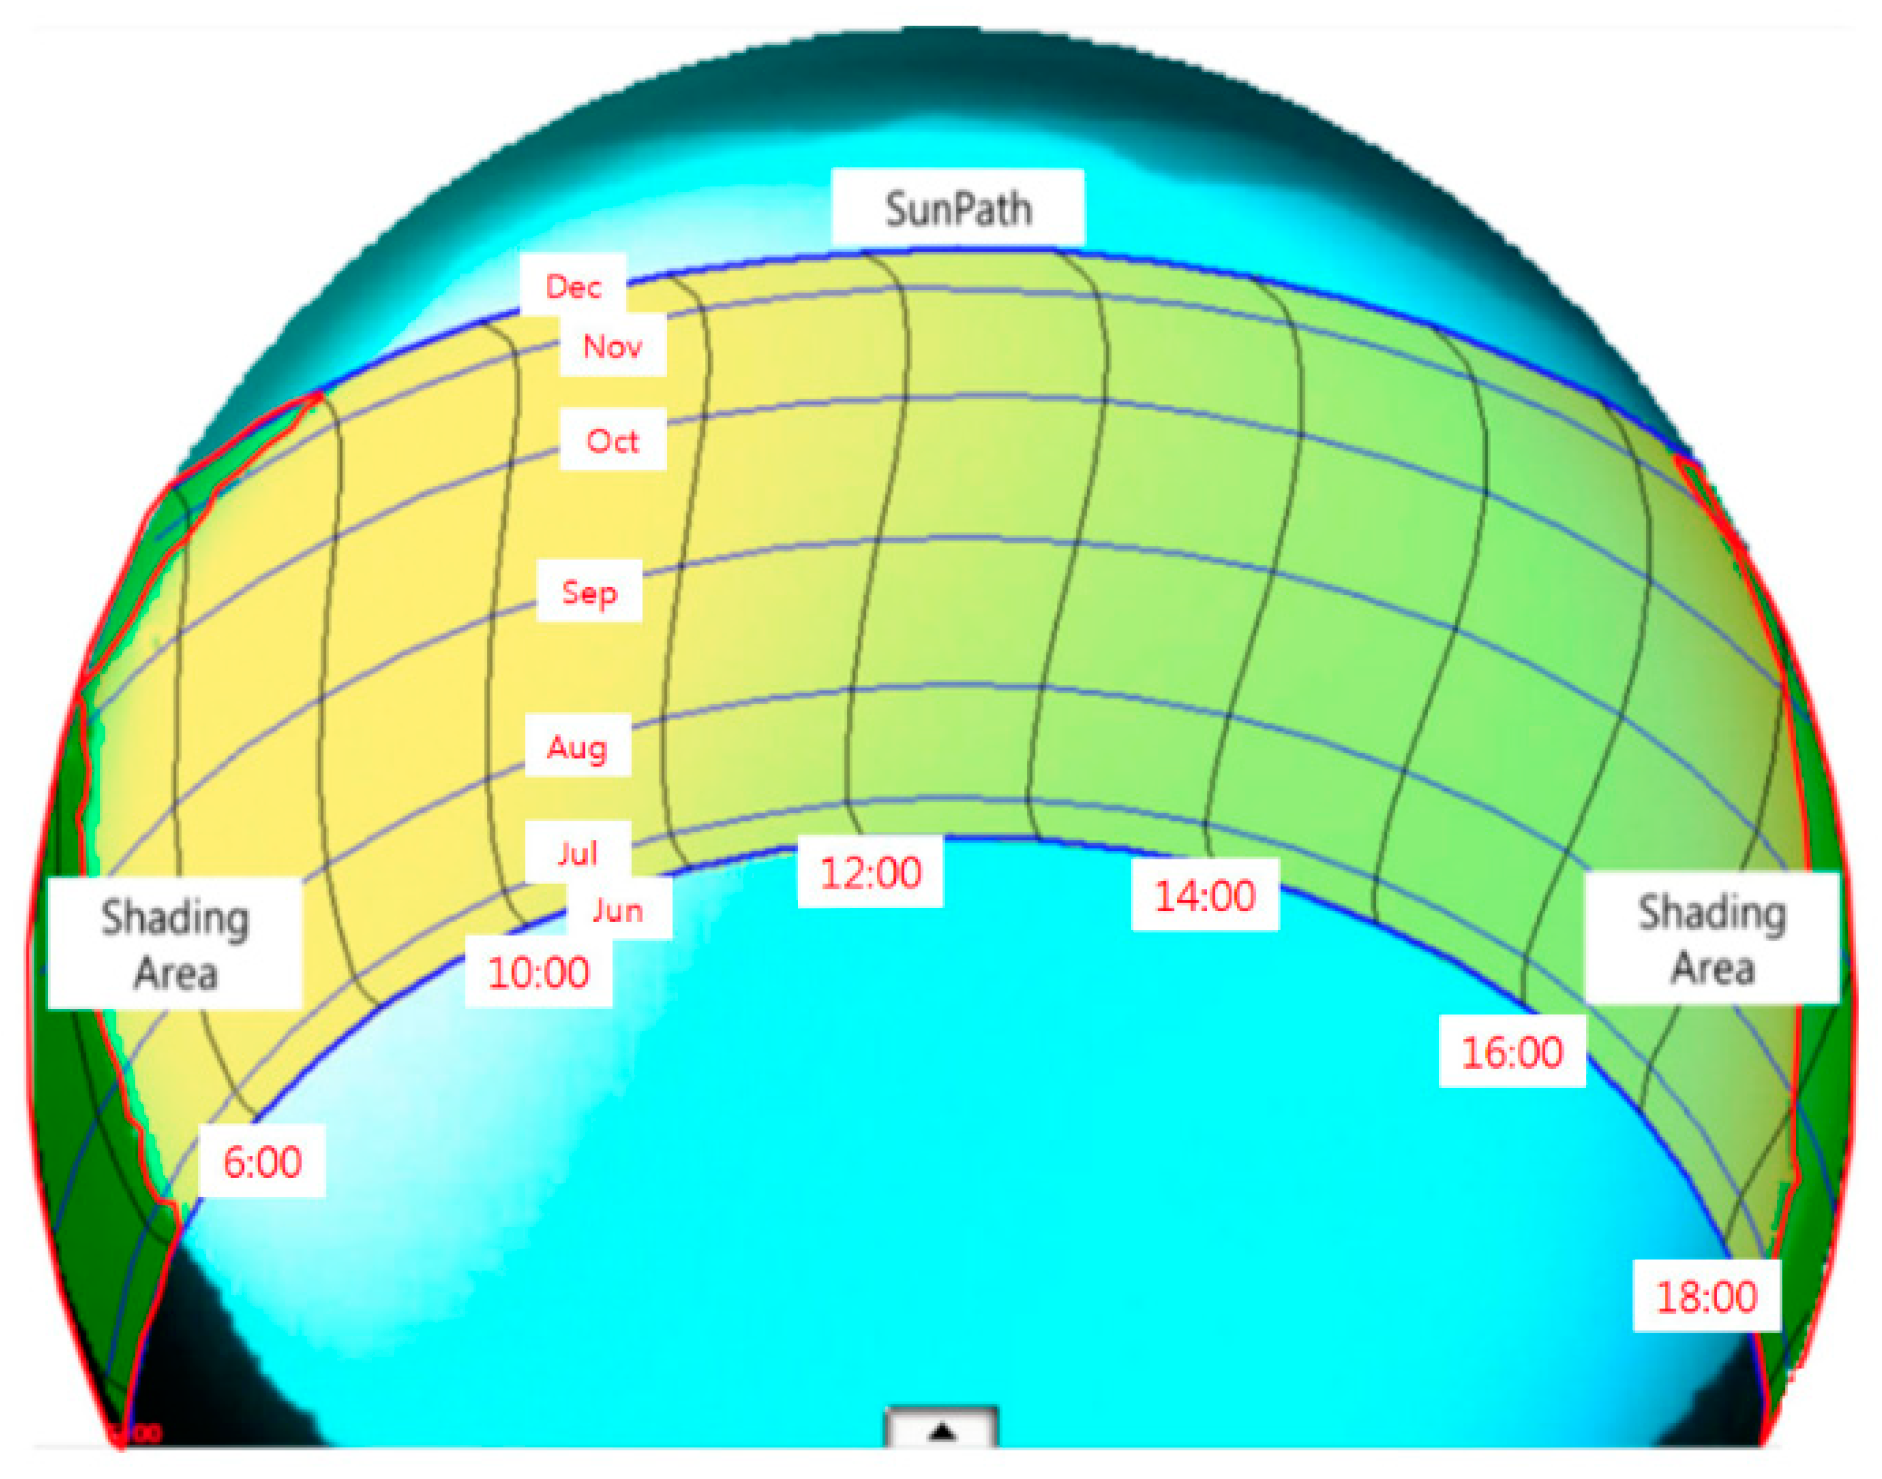
Table 1.
Summary of previous solar radiation mapping studies using GISs.
| References | Usage or Method | Scale | Location | Used Data Type | Spatial Unit | Temporal Unit |
|---|---|---|---|---|---|---|
| Bahrami and Abbaszadeh [5] | DB | National | Iran | Solar map | - | - |
| Tahir and Asim [6] | DB | National | Pakistan | Solar map | - | - |
| Zawilska and Brooks [7] | DB | Regional | Durban, South Africa | Solar map | - | - |
| Song et al. [8] | DB | Regional | Korea (mines) | Solar map | - | - |
| Burnett et al. [9] | DB | National | United Kingdom | Solar map | - | - |
| Šúri et al. [10] | DB | Continental | Europe | Solar map | - | - |
| Ramachandra and Shruthi [11] | Multivariate relationship | Regional | Karnataka, India | Station measurement | Administrative district | Seasonal |
| Nematollahi and Kim [12] | Interpolation | National | Korea | Station measurement | Pixel | Monthly, Annual |
| Alamdari et al. [13] | Interpolation | National | Iran | Station measurement | Pixel | Monthly, Annual |
| Stökler et al. [14] | Model validation | National | Pakistan | Satellite image, Station measurement | Pixel | Annual |
| Rumbayan et al. [15] | ANN 1 | National | Indonesia | Station measurement | Administrative district | Monthly |
| Koo et al. [16] | Advanced CBR 2 | National | Korea | Station measurement | Point | Monthly |
| Lee et al. [17] | Advanced CBR, Interpolation | National | Korea | Station measurement | Point, Pixel | Monthly |
| Koo et al. [18] | Advanced CBR, FEM 3, Interpolation | National | Korea | Station measurement | Point, Pixel | Monthly |
| Hofierka and Šúri [19] | r.sun | Continental, National | Central and Eastern Europe, Slovakia | DEM 4, Various parameters | Pixel | Daily, Monthly, Annual |
| Šúri and Hofierka [20] | r.sun | Continental | Central and Eastern Europe | DEM, Various parameters | Pixel | Monthly |
| Dubayah and Rich [21] | SOLARFLUX, ATM 5 | Regional | Tiefort Mountains and Grand Canyon, US | DEM, Plant canopies | Pixel | Monthly |
| Corripio [22] | Shadow analysis | Regional | Mont Blanc Massif, France | DEM | Pixel | 15 min intervals |
| Redweik et al. [23] | Shadow analysis | Local | The University of Lisbon, Portugal (buildings) | DSM 6, Station measurement | Pixel | Hourly, Seasonal, Annual |
1 ANN: artificial neural network. 2 CBR: case based reasoning. 3 FEM: finite element method. 4 DEM: digital elevation model. 5 ATM: atmospheric and topographic model. 6 DSM: digital surface model.
Table 2.
Summary of previous solar site evaluation studies using GISs.
| References | Methods | Scale | Location | Solar Map | Result | Energy Type |
|---|---|---|---|---|---|---|
| Fluri [24] | Boolean overlay | National | South Africa | Institution | Suitable area | CSP |
| Merrouni et al. [25] | Boolean overlay | Regional | Eastern Morocco | Analyst tool | Suitable area | CSP |
| Merrouni et al. [26] | Boolean overlay | Regional | Eastern Morocco | Interpolation | Suitable area | CSP |
| Wang et al. [27] | Boolean overlay | National | Tibet, China | Satellite image | Suitable area | PV |
| Hott et al. [28] | Boolean overlay | Regional | Wyoming, US | Institution | Suitable area | PV, CSP |
| Jahangiri et al. [29] | Boolean overlay | Continental | Middle-East | Interpolation | Suitable area | Solar, Wind |
| Anwarzai and Nagasaka [30] | Boolean overlay | National | Afghanistan | Institution | Suitable area | PV, CSP, Wind |
| Gherboudj and Ghedira [31] | Weighted sum | National | United Arab Emirates | Satellite image | Suitability map | PV, CSP |
| Castillo et al. [32] | Weighted sum | Continental | Europe | Institution | Suitability map | PV |
| Janke [33] | Weighted sum | Regional | Colorado | Institution | Suitability map | Solar, Wind |
| Cevallos-Sierra and Ramos-Martin [34] | Weighted sum | National | Ecuador | Institution | Suitability map | PV, CSP, Wind |
| Aydin et al. [35] | Weighted sum, Fuzzy | Regional | Western Turkey | Institution | Suitability map | PV |
| Brewer et al. [36] | Weighted sum, PVMapper | Regional | Southwestern US | Institution | Suitability map | PV |
| Vafaeipour et al. [37] | SWARA 1, WASPAS 2 | National | Iran | Institution | Suitability for cities | PV |
| Ziuku et al. [38] | AHP 3 | National | Zimbabwe | Interpolation | Suitability map | CSP |
| Al Garni and Awasthi [39] | AHP | National | Saudi Arabia | Analyst tool | Suitability map | PV |
| Uyan [40] | AHP | Regional | Karapinar, Turkey | Institution | Suitability map | Solar |
| Yushchenko et al. [41] | AHP | Continental | West Africa | Institution | Suitability map | PV, CSP |
| Merrouni et al. [42] | AHP | Regional | Eastern Morocco | Institution | Suitability map | PV |
| Aly et al. [43] | AHP | National | Tanzania | Institution | Suitability map | PV, CSP |
| Tahri et al. [44] | AHP | Regional | Southern Morocco | Analyst tool | Suitability map | PV |
| Watson and Hudson [45] | AHP | Regional | Southern England | Analyst tool | Suitability map | Solar, Wind |
| Asakereh et al. [46] | FAHP 4 | Regional | Shodirwan, Iran | Interpolation | Suitability map | PV |
| Noorollahi et al. [47] | FAHP | National | Iran | Institution | Suitability map | PV |
| Charabi and Gastli [48] | FLOWA 5 | National | Oman | Analyst tool | Suitability map | PV, CSP |
| Suh and Brownson [49] | FAHP | Regional | Ulleung Island, Korea | Analyst tool | Suitability map | PV |
| Sánchez-Lozano et al. [50] | AHP, TOPSIS 6 | Regional | Cartagena, Spain | Analyst tool | Suitability map | PV |
| Sánchez-Lozano et al. [51] | ELECTRE-TRI, IRIS 7 | Regional | Torre Pacheco, Spain | Analyst tool | Suitability map | PV |
| Mondino et al. [52] | ANN | Regional | Piedmont, Italy | Analyst tool | Suitability map | PV |
| Omitaomu et al. [53] | OR-SAGE 8 | Regional | Western US | Institution | Suitable area for each energy | CSP, Nuclear, Advanced coal, CAES 9 |
| Choi and Song [54] | Overlay | National | Korea (Mines) | Institution | Suitable mines | PV |
| Kim et al. [55] | Shadow analysis | National | Korea (Reservoirs) | Interpolation | Suitable reservoirs | Floating PV |
| Lukac et al. [56] | Shadow analysis | Local | Maribor, Slovenia (Buildings) | Measurement | Rooftop suitability | PV |
| Lee et al. [57] | Shadow analysis, Cluster analysis | Local | Gangnam, Korea (Buildings) | Institution | Rooftop suitability | PV |
1 SWARA: step-wise weight assessment ratio analysis. 2 WASPAS: weighted aggregates Sum Product Assessment. 3 AHP: analytic hierarchy process. 4 FAHP: fuzzy analytic hierarchy process. 5 FLOWA: fuzzy logic ordered weight averaging. 6 TOPSIS: technique for order preference by similarity to ideal solution. 7 IRIS: Interactive robustness analysis and parameters’ inference for multi-criteria sorting problems. 8 OR-SAGE: Oak ridge siting analysis for power generation expansion. 9 CAES: compressed air energy storage.
Table 3.
Classification and number of articles according to the role of the GIS, solar type, or scale.
Table 3.
Classification and number of articles according to the role of the GIS, solar type, or scale.
| Role of GIS | No. | Solar Type | No. | Analysis Scale | No. |
|---|---|---|---|---|---|
| DB & Visualization tools | 9 | PV | 23 | Global | 1 |
| Rooftop extraction tool | 2 | CSP | 6 | National | 16 |
| Radiation modeling tool | 6 | General | 1 | Region | 20 |
| Shading analysis tool | 7 | PV & CSP | 9 | Object | 2 |
| Spatial analysis tool | 15 | ||||
| Sum | 39 | Sum | 39 | Sum | 39 |
Table 4.
Shading matrix generated from the onsite solar assessment (Choi and Song [79]).
Table 4.
Shading matrix generated from the onsite solar assessment (Choi and Song [79]).
| Month | Time | ||||||||||||||
|---|---|---|---|---|---|---|---|---|---|---|---|---|---|---|---|
| 5 | 6 | 7 | 8 | 9 | 10 | 11 | 12 | 13 | 14 | 15 | 16 | 17 | 18 | 19 | |
| January | 0 | 0 | 0 | 0.02 | 0.63 | 1 | 1 | 1 | 1 | 1 | 0.96 | 0.72 | 0.02 | 0 | 0 |
| February | 0 | 0 | 0.04 | 0.64 | 0.99 | 1 | 1 | 1 | 1 | 1 | 1 | 0.99 | 0.44 | 0.06 | 0 |
| March | 0 | 0.10 | 0.56 | 1 | 1 | 1 | 1 | 1 | 1 | 1 | 1 | 1 | 0.84 | 0 | 0 |
| April | 0 | 0.09 | 0.83 | 1 | 1 | 1 | 1 | 1 | 1 | 1 | 1 | 1 | 0.92 | 0.03 | 0 |
| May | 0 | 0.24 | 0.92 | 1 | 1 | 1 | 1 | 1 | 1 | 1 | 1 | 1 | 1 | 0.33 | 0 |
| June | 0 | 0.25 | 0.92 | 1 | 1 | 1 | 1 | 1 | 1 | 1 | 1 | 1 | 1 | 0.65 | 0 |
| July | 0 | 0.15 | 0.89 | 1 | 1 | 1 | 1 | 1 | 1 | 1 | 1 | 1 | 1 | 0.69 | 0 |
| August | 0 | 0.10 | 0.84 | 1 | 1 | 1 | 1 | 1 | 1 | 1 | 1 | 1 | 0.99 | 0.21 | 0 |
| September | 0 | 0.17 | 0.84 | 1 | 1 | 1 | 1 | 1 | 1 | 1 | 1 | 1 | 0.73 | 0 | 0 |
| October | 0 | 0.04 | 0.64 | 1 | 1 | 1 | 1 | 1 | 1 | 1 | 1 | 1 | 0.26 | 0 | 0 |
| November | 0 | 0 | 0.02 | 0.54 | 0.98 | 1 | 1 | 1 | 1 | 1 | 0.97 | 0.60. | 0 | 0 | 0 |
| December | 0 | 0 | 0 | 0.01 | 0.61 | 1 | 1 | 1 | 1 | 1 | 0.89 | 0.42 | 0 | 0 | 0 |
© 2019 by the authors. Licensee MDPI, Basel, Switzerland. This article is an open access article distributed under the terms and conditions of the Creative Commons Attribution (CC BY) license (http://creativecommons.org/licenses/by/4.0/).
Share and Cite
MDPI and ACS Style
Choi, Y.; Suh, J.; Kim, S.-M. GIS-Based Solar Radiation Mapping, Site Evaluation, and Potential Assessment: A Review. Appl. Sci. 2019, 9, 1960. https://0-doi-org.brum.beds.ac.uk/10.3390/app9091960
AMA Style
Choi Y, Suh J, Kim S-M. GIS-Based Solar Radiation Mapping, Site Evaluation, and Potential Assessment: A Review. Applied Sciences. 2019; 9(9):1960. https://0-doi-org.brum.beds.ac.uk/10.3390/app9091960
Chicago/Turabian StyleChoi, Yosoon, Jangwon Suh, and Sung-Min Kim. 2019. "GIS-Based Solar Radiation Mapping, Site Evaluation, and Potential Assessment: A Review" Applied Sciences 9, no. 9: 1960. https://0-doi-org.brum.beds.ac.uk/10.3390/app9091960
Note that from the first issue of 2016, this journal uses article numbers instead of page numbers. See further details here.