Experimental Study on Hydraulic Fracturing of High Asphalt Concrete Core Rock-Fill Dam


1
China Institute of Water resource and Hydro Power Research, Beijing 100038, China
2
State Key Laboratory of Simulation and Regulation of Water Cycle in River Basin, Beijing 100038, China
3
Powerchina Beijing Engineering Corporation Limited, Beijing 100038, China
*
Author to whom correspondence should be addressed.
Appl. Sci. 2019, 9(11), 2285; https://0-doi-org.brum.beds.ac.uk/10.3390/app9112285
Submission received: 5 May 2019
/
Revised: 25 May 2019
/
Accepted: 30 May 2019
/
Published: 3 June 2019
(This article belongs to the Special Issue Asphalt Materials)
Abstract
:In this paper, we experiment on the hydraulic fracturing of asphalt concrete with a voids content higher than 3%, which has arisen from the possible local shear dilatancy of Quxue asphalt’s core wall of concrete core dam, the highest one of the sort constructed in the world. The model test has shown that under the sole water pressure 0.13 MPa—relevant to the pressure where the dilatancy could appear at core wall of Quxue dam—the asphalt concrete with a voids content of 3.5% underwent hydraulic fracturing. Furthermore, the asphalt concrete with a voids content of 3.0% was tested for nearly 500 h and no sign of hydraulic fracturing was found, which again confirmed the threshold requirement for a 3% voids content to the impervious asphalt concrete to the hydraulic fracture concern. According to the analysis of the test result, the theory of fracture mechanics could be applied to the hydraulic fracture of asphalt concrete with a voids content between 3.4~4.0%, which behaved during hydraulic fracturing like a quasi-brittle material, similar to concrete. Because the hydraulic fracturing could occur in the shear dilatant asphalt concrete, a proper mix proportion of asphalt concrete to a project with adverse stress state should be carefully designed to rule out the possibility of shear dilatancy.
1. Introduction
Asphalt concrete has excellent anti-seepage and deformation properties and is widely used in hydraulic anti-seepage engineering [1,2]. One of the forms used is asphalt concrete core rock-fill dam. With the development of dam technology, the height of the asphalt concrete core rock-fill dam (ACRD) has already reached more than 160 m. In the construction of ACRD with such a height, hydraulic fracturing in the core wall has often been queried by the engineer. Hydraulic fracturing could occur under the action of the seepage pressure created by the external water pressure within the structure. The engineering first learned about hydraulic fracturing in the 1960s, during the practice of foundation splitting grouting [3,4]. Since the 1970s, the hydraulic fracturing problem of embankment dams has gradually attracted attention. The failure of Stockton and Wister dams in the United States are thought to be due to hydraulic fracturing. An investigation of the leakage occurred at Viddalsvatn dam in Norway, indicating that hydraulic fracturing might be the cause [5,6]. According to analytical studies, the failure of the Teton Dam in the United States was found to be a result of hydraulic fracturing (initial breaching) of the key-trench fill at the right abutment [7,8], which has a relationship with the arching effect of the dam core. According to these studies, it is proposed that hydraulic fracturing occurs in areas where the sum of the normal stress and tensile strength is less than the pore water pressure [9,10,11].
However, Jaworski [12] used uniform samples to simulate hydraulic fracturing under the above conditions, but hydraulic fracturing did not occur, which indicates that these conditions were not necessarily sufficient. Furthermore, during the study of the failure of Wister dam, Sherard [13] noticed that concentrated leaks could enter cracks in the impervious core, as the reservoir level is rising only a meter or two above the elevation of the entrance to the crack. This shows that no significant excess pressure is needed to initiate the fracturing action. It is considered that all impervious sections of embankment dams contain a multitude of cracks (fissures), which are formed through either drying during construction, deformation under wheels of compact equipment, or the incomplete bonding of layers. These cracks are squeezed shut by the weight of the overlying embankment but they remain nevertheless as closed cracks in the fabric of the compacted soil that the reservoir water can enter when the pressure is greater than the earth pressure, starting the hydraulic fracturing process. After the initial penetration of the water into these centimeter-sized, closed cracks or fissures at the upstream face of the impervious section, the water pressure starts to act on the surface of least resistance (which has total stress acting on it less than the water pressure) and the advancing water jacks open a crack (fissure) that had not existed before the reservoir was raised. Therefore, it has been speculated that internal defects of the impervious soil (such as closed cracks) may also be a precondition for the occurrence of hydraulic fracturing. Based on this conjecture, Zhang Bingyin [14] has developed a soil sample containing an infiltrated weak surface in a hydraulic fracturing test. The test showed that if there is an initial infiltrated weak surface in the soil sample, the applied water pressure will induce hydraulic fracturing. Moreover, Bingyin believed that in addition to the arching effect of rock-fill to the core wall, the defect factors can lead to hydraulic fracturing of the core wall, such as the infiltrated weak surface that may exist in the core wall, and the wedge effect of water pressure that is due to the rapid impounding of the reservoir.
The properties of asphalt concrete core walls are quite different from those of clay core walls. In comparison to an earth core with a water content of 10% and a voids content between 10 and 20% vol, there is no system of pores (less than 3%) inside the asphaltic concrete core wall that would allow the entrance of water and thus the generation of a pore pressure. In the earth’s core, the fluid medium of water is present from the beginning and has a very low viscosity. However, the “fluid medium” of bitumen in the asphaltic concrete core at normal temperatures has a viscosity so high that it does not behave like a fluid. Tests performed by Haas have shown that the bitumen, even at a temperature of 200 °C (which is well above temperatures possible in a core wall, around 10 °C) and under a pressure of 115 bar (equivalent to a head of 1150 m), does not move inside a hydraulic asphaltic concrete specimen. At 10 °C bitumen, viscosity is hardly measurable. Since the main preconditions of pore water pressure and pressure transmission do not exist, the hydraulic fracturing of asphalt concrete can generally be ignored [15].
Despite the above fact, hydraulic fracturing tests have been carried out in the constructions of some high ACRDs in China due to cautious considerations, such as the Maopingxi dam and Quxue dam. In these tests, cylindrical models with diameters of 100–150 mm and heights of 200–250 mm were adopted and water pressures were applied to the inner cavity of the specimen to verify whether it will be cracked under project loading [16,17] However, without considering the seepage characteristics in the process of hydraulic fracturing, these test results had little difference from those of failure tests by mechanical loading.
The asphalt concrete core wall has low voids content (less than 3%) and there is no interconnected pore inside. Therefore, the seepage cannot be formed under the external water pressure. However, the voids content can be changed by shear stress. The tri-axial test results have shown that asphalt concrete sample tends to dilatancy with decreasing bitumen content and decreasing lateral pressure. When the bitumen content is increased to 8%, dilatation does not occur, even when at a lower confining pressure [18]. Generally, the voids content of the core wall asphalt concrete is less than 3% and the construction test result is generally between 2% and 3%. However, if dilatation occurs, the voids content will increase and when the dilatation is large it may exceed 3%, which is a critical value of hydraulic asphalt concrete in view of its imperviousness.
In practice, the low voids content of the core wall may also be increased during operation. Finstertal ACRD in Austria is 150 m high, the core wall is 96 m high, and the wall thickness is 50 cm at the top, 70 cm at the bottom. The aggregate of the core wall asphalt concrete has a maximum particle size of 16 mm and the content of the B65 bitumen is 6.3%. During construction, observation instruments were installed at three elevations of the main section of the core wall to measure the thickness change. After four years of operation, the three thicknesses were found to be increased by 4.8 cm, 2.4 cm, and 4.0 cm, respectively [19]. An indoor model test was conducted to study the effect of the increase on core wall thickness. The model was a cylinder with a diameter of 76 cm and a height of 96 cm. An asphalt concrete slab with a thickness of 15 cm was placed in the cylinder to simulate the core wall and the upstream and downstream transition zones materials were filled on both sides of the asphalt concrete slab to simulate the real situation of the upstream and downstream. Water pressure was applied in the upstream transition zone and 3.5 MPa compressive stress was applied on the top of the asphalt concrete slab. The horizontal displacement of the core wall was simulated by adjusting the support baffle at the downstream side. This test reproduced the thickness increasing phenomenon. After the experiment, the asphalt concrete slab was taken out for slicing and the voids content of the thickened core wall were tested. It was discovered that the voids content increased; the maximum value was 4%. The voids content of the center of the wall were still less than 3%. Therefore, the boundary area of the asphalt concrete core wall could be affected by the dilatation and the voids content could increase. However, whether a hydraulic fracturing will occur under such dilatation, no further research could be found in references.
With the increasing voids content of asphalt concrete on the upstream surface, the impounding water could seep into the core wall and injure its resistance to hydraulic fracturing. The maximum height of Quxue ACRD in China is 164.2 m, which seats in a narrow valley with a steep left abutment of 1 V: 0.33 H. The maximum height of the core is 132 m. According to the numerical stress analysis of the Quxue dam, it has been found that the shear stress level could reach as high as 0.67 in the left upper zone of the core wall during the full impounding period, where the local water pressure is 0.13 MPa. Having taken the wetting deformation and the rheological deformation of the rockfill into account, the minor principal stress in this area could appear to be in tension of about 0.12 MPa. Furthermore, according to the tri-axial test of the asphalt concrete of the Quxue core wall, as the minor principal compressive stress is less than 0.1 MPa and the shear stress level is greater than 0.65, the shear dilatation to the volumetric strain will occu when the voids content is greater than 3%. In this paper, we use a model test to study if under this shear dilatation the hydraulic fracturing occurs in the core wall of the Quxue ACRD.
2. Hydraulic Fracture Feasibility Test
According to the triaxial test results of asphalt concrete of the Quxue project, the increment of the voids content for asphalt concrete after dilatation was selected to be 0.5%, which includes some excess as a safety margin. Using a voids content of 3.0% as the base value, the voids content was selected to be 3.5% in this test, with the maximum water head applied at 15 m, which was relevant to the left upper part of core wall of the Quxue dam, where the dilatation could appear due to the numerical stress analysis of the Quxue dam.
2.1. Test Device and Specimen Preparation
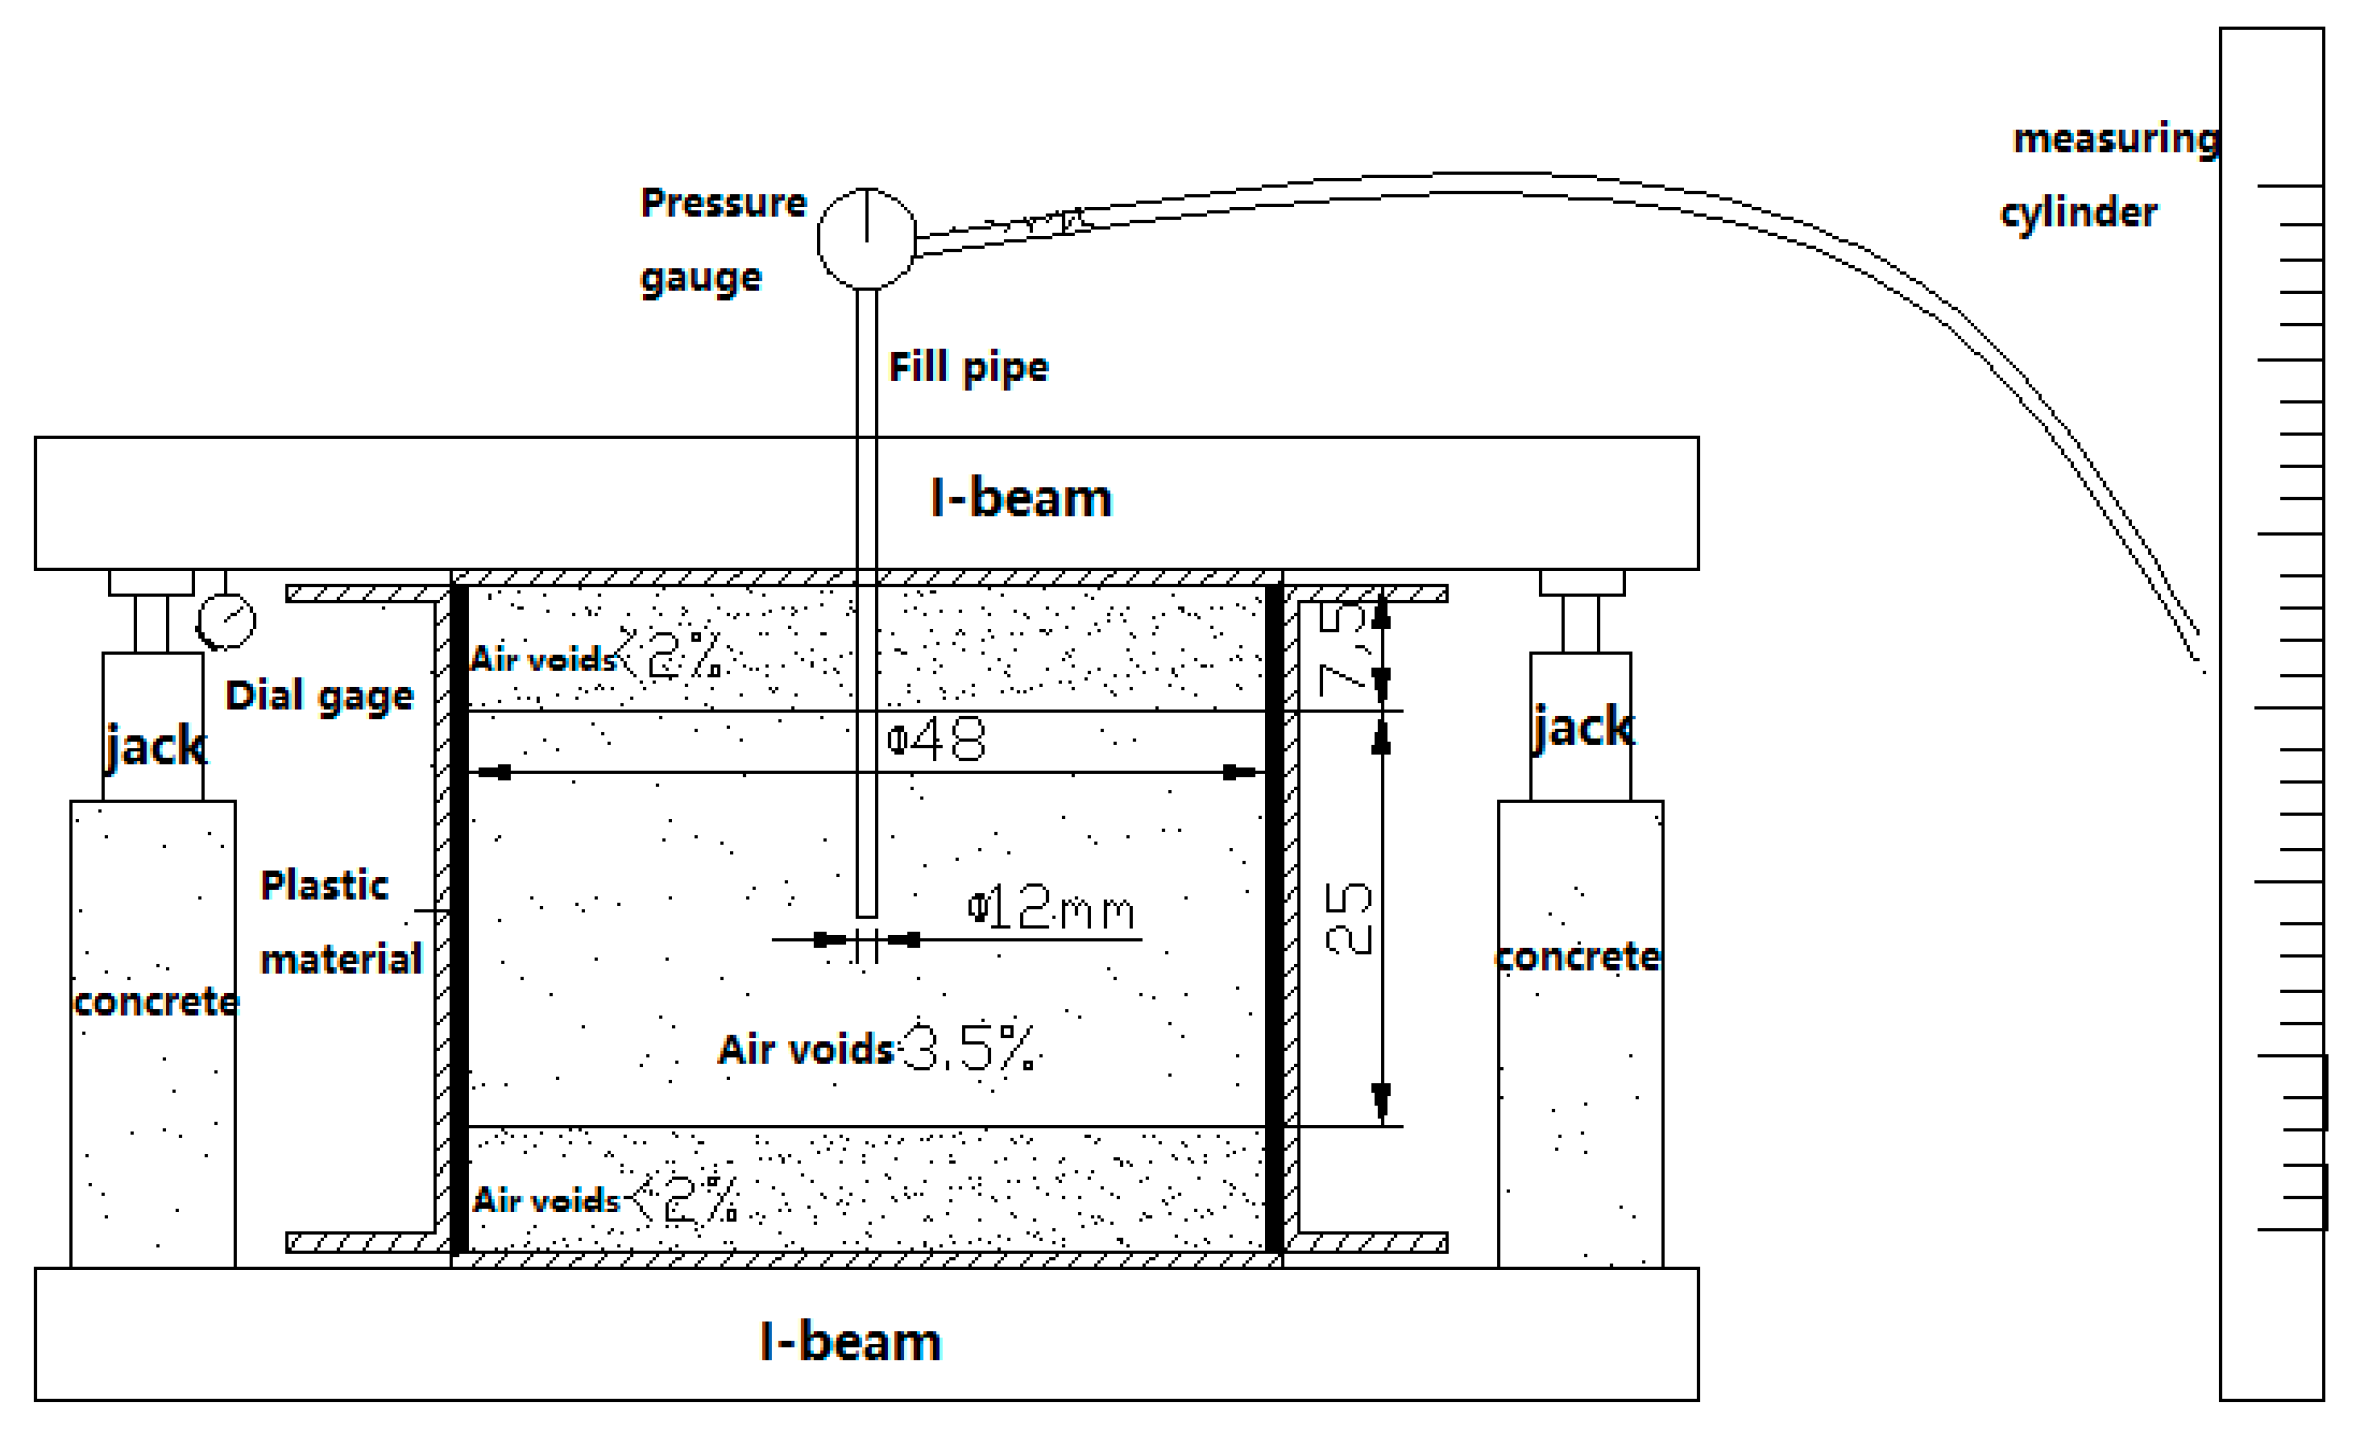
The model test device is shown in Figure 1. The size of the steel cylinder is Φ 50 × 40 cm. The inner wall of the steel cylinder is glued with a 1 cm thick plastic putty to prevent water leakage and asphalt concrete from sticking to the inner wall. The asphalt concrete specimen in the model is divided into three layers. The normal compacted asphalt concrete had a height of 7.5 cm and was placed on the upper and lower layer (voids content less than 2%), as well as on the middle layer (25 cm height). The required voids content of 3.5% asphalt concrete was formed by controlling the weight of the asphalt concrete. A 12 mm diameter water fill pipe was installed in the center of the specimen. Deep into the middle layer, water can be injected by pipe into the middle layer whose voids content is 3.5%. The amount of water entering the specimen can be measured by the water’s height in the measuring cylinder, which was pressured by the compressed nitrogen and measured by a pressure gauge. When the water level in the measuring cylinder was lower than the control level, the water injection switched to the specimen was closed and the water was replenished into the cylinder. The test water was boiled and cooled to an ambient temperature to get rid of the air in it. The top and bottom surfaces of the asphalt concrete were stuck to steel plates with industry glue and the tensile force was applied to the specimen with four jacks between the steel plates. Three dial gauges were installed to measure the vertical displacement of the top steel plate.
The asphalt mixture used in this test was produced by the asphalt mixing plant on the site of Quxue project and the mix ratio is given in Table 1.
2.2. Control of Voids Content
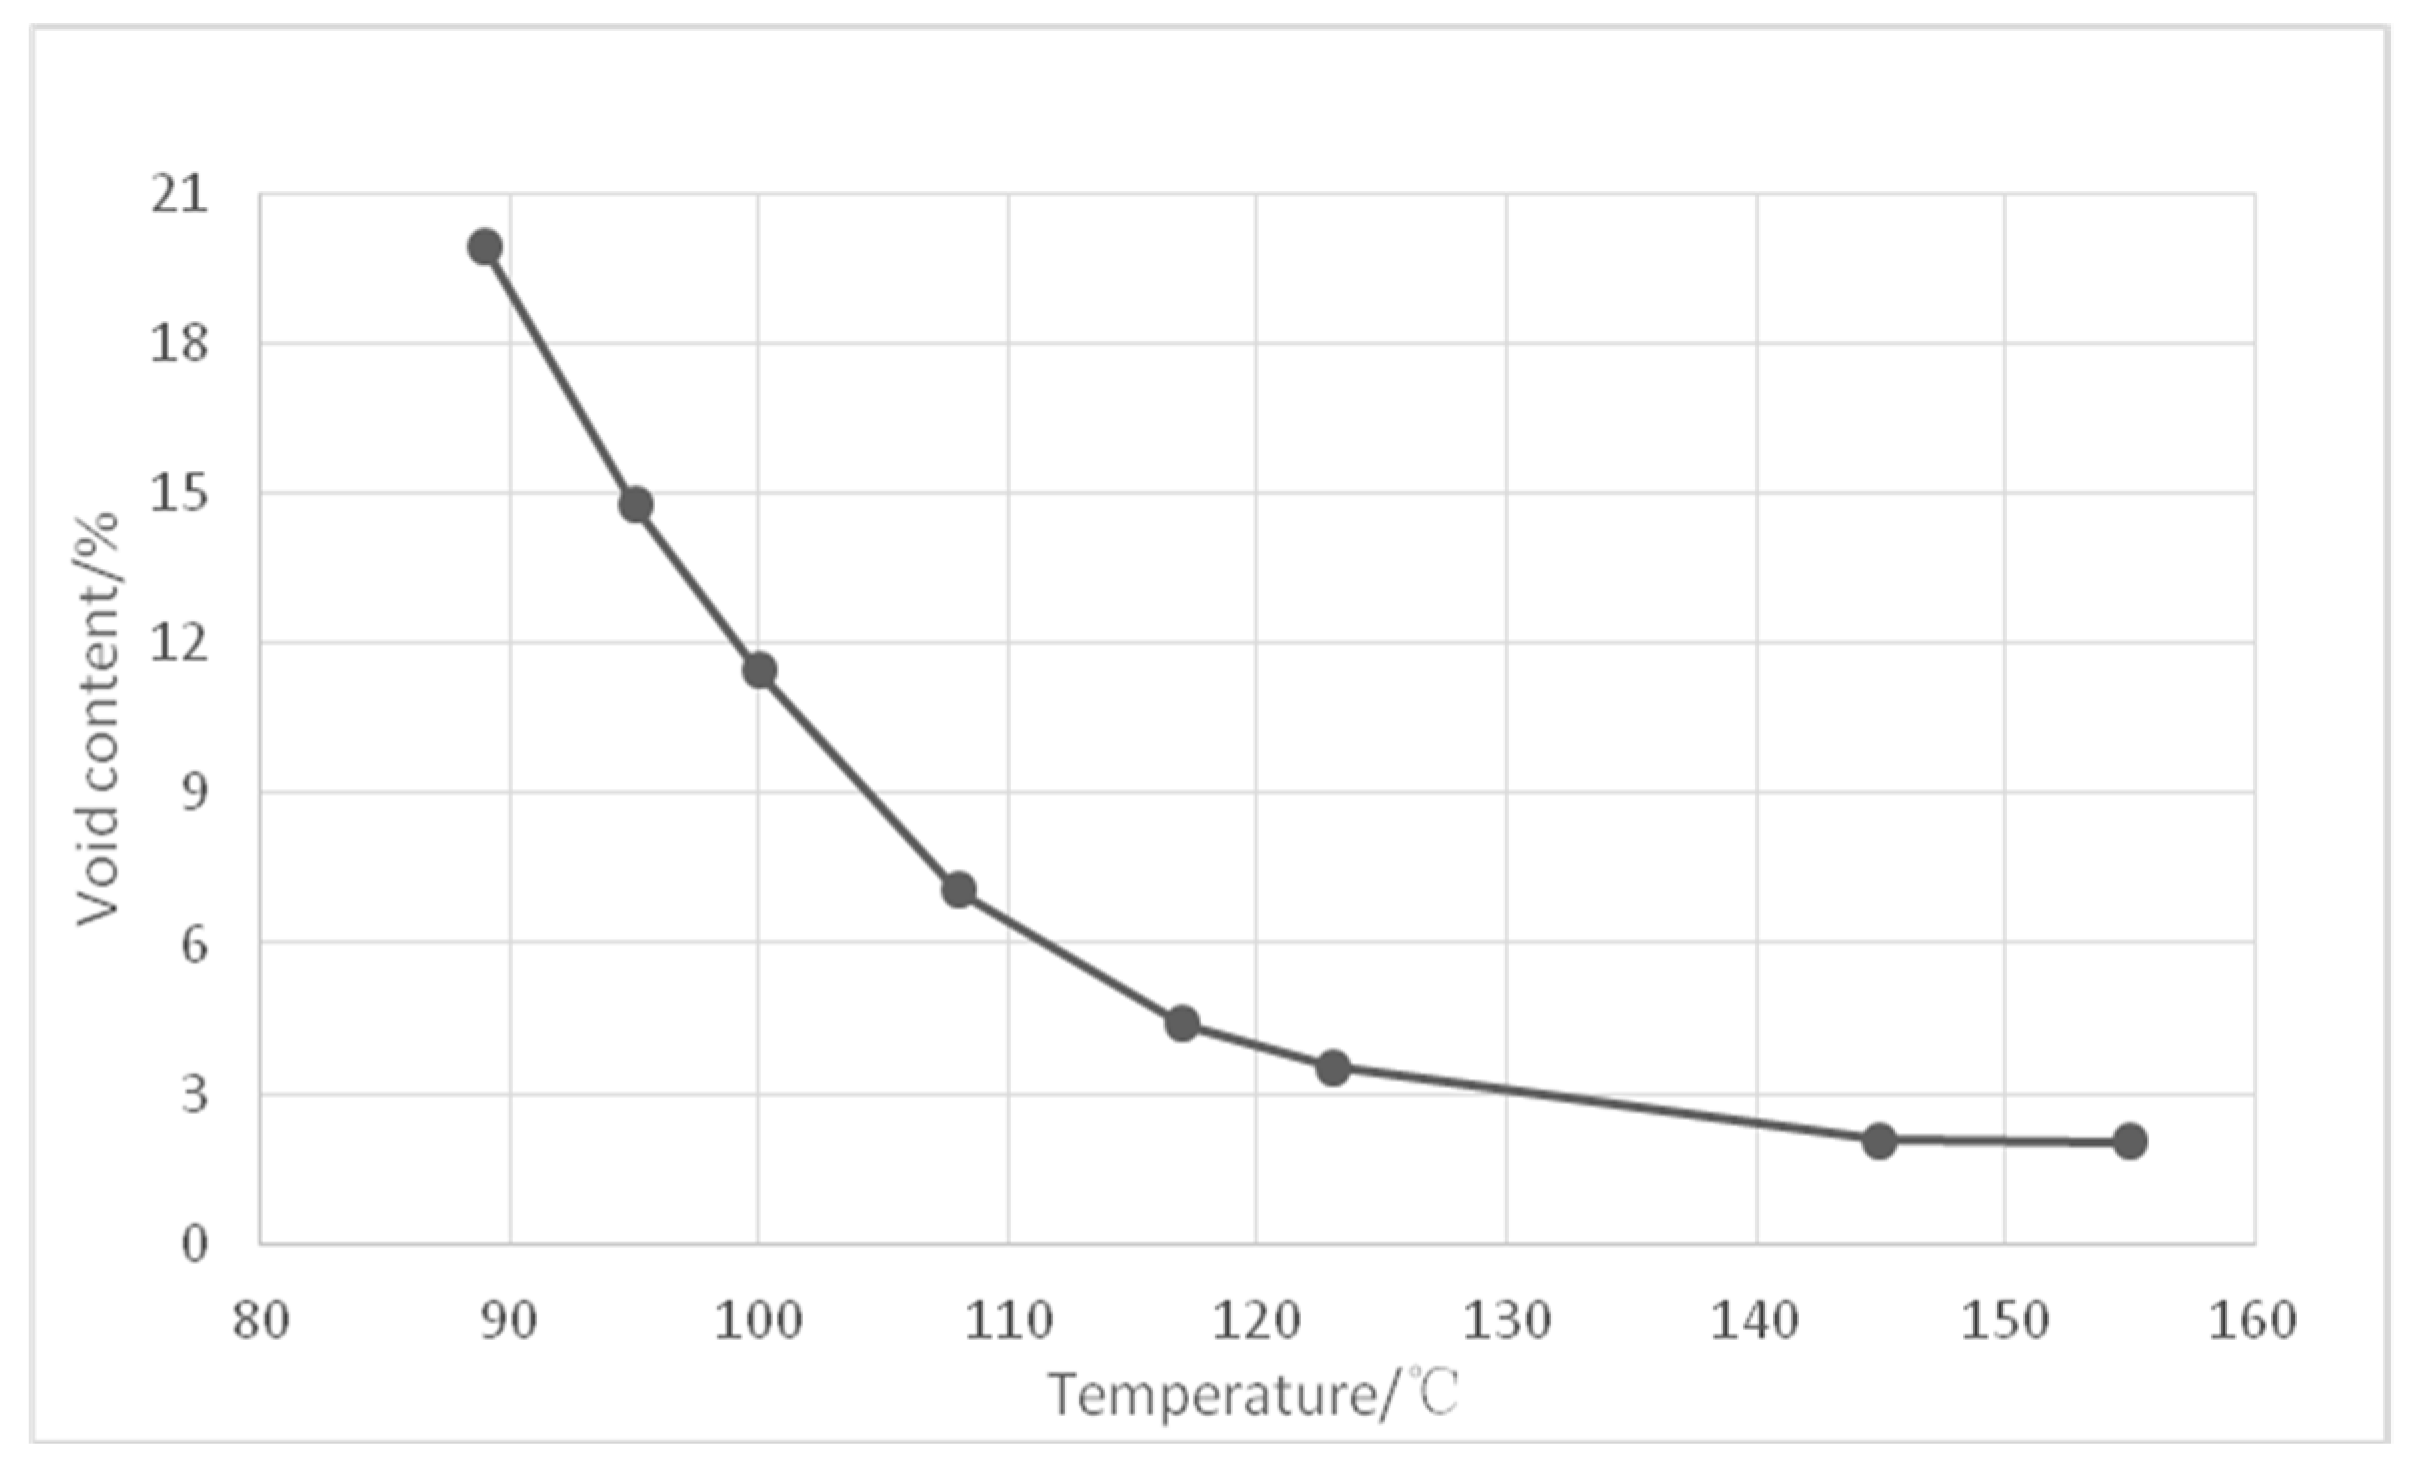
In order to correctly obtain the voids content required, the Marshall specimen of the asphalt concrete were formed under different temperatures and each Marshall specimen was compacted with only one stroke on the top and the bottom. The relationship between the voids content and the temperature is shown in Figure 2, which shows that the voids content of the Marshall specimen can be controlled to be greater than 3% when the temperature is lower than 130 °C. Therefore, specimen used in the model test was made by the selected temperature of 120 °C and the controlled compaction to the designed filling volume of asphalt mixture. The demanded voids content of 3.5% was verified after a test using the sample inspection drilled from the specimen.
2.3. Test Parameters
The model test was conducted in four stages, with the specified tensile stress and water pressure shown in Table 2. If the injected water amount or the vertical deformation of the top steel plate in a stage became relatively stable, the test process went to the next stage. The model test was conducted in an environment chamber where the temperature was controlled at 14.6 °C, which was the same as the mean annual temperature at the Quxue dam site.
2.4. Test without Tensile Loading of Stage One and Stage Two
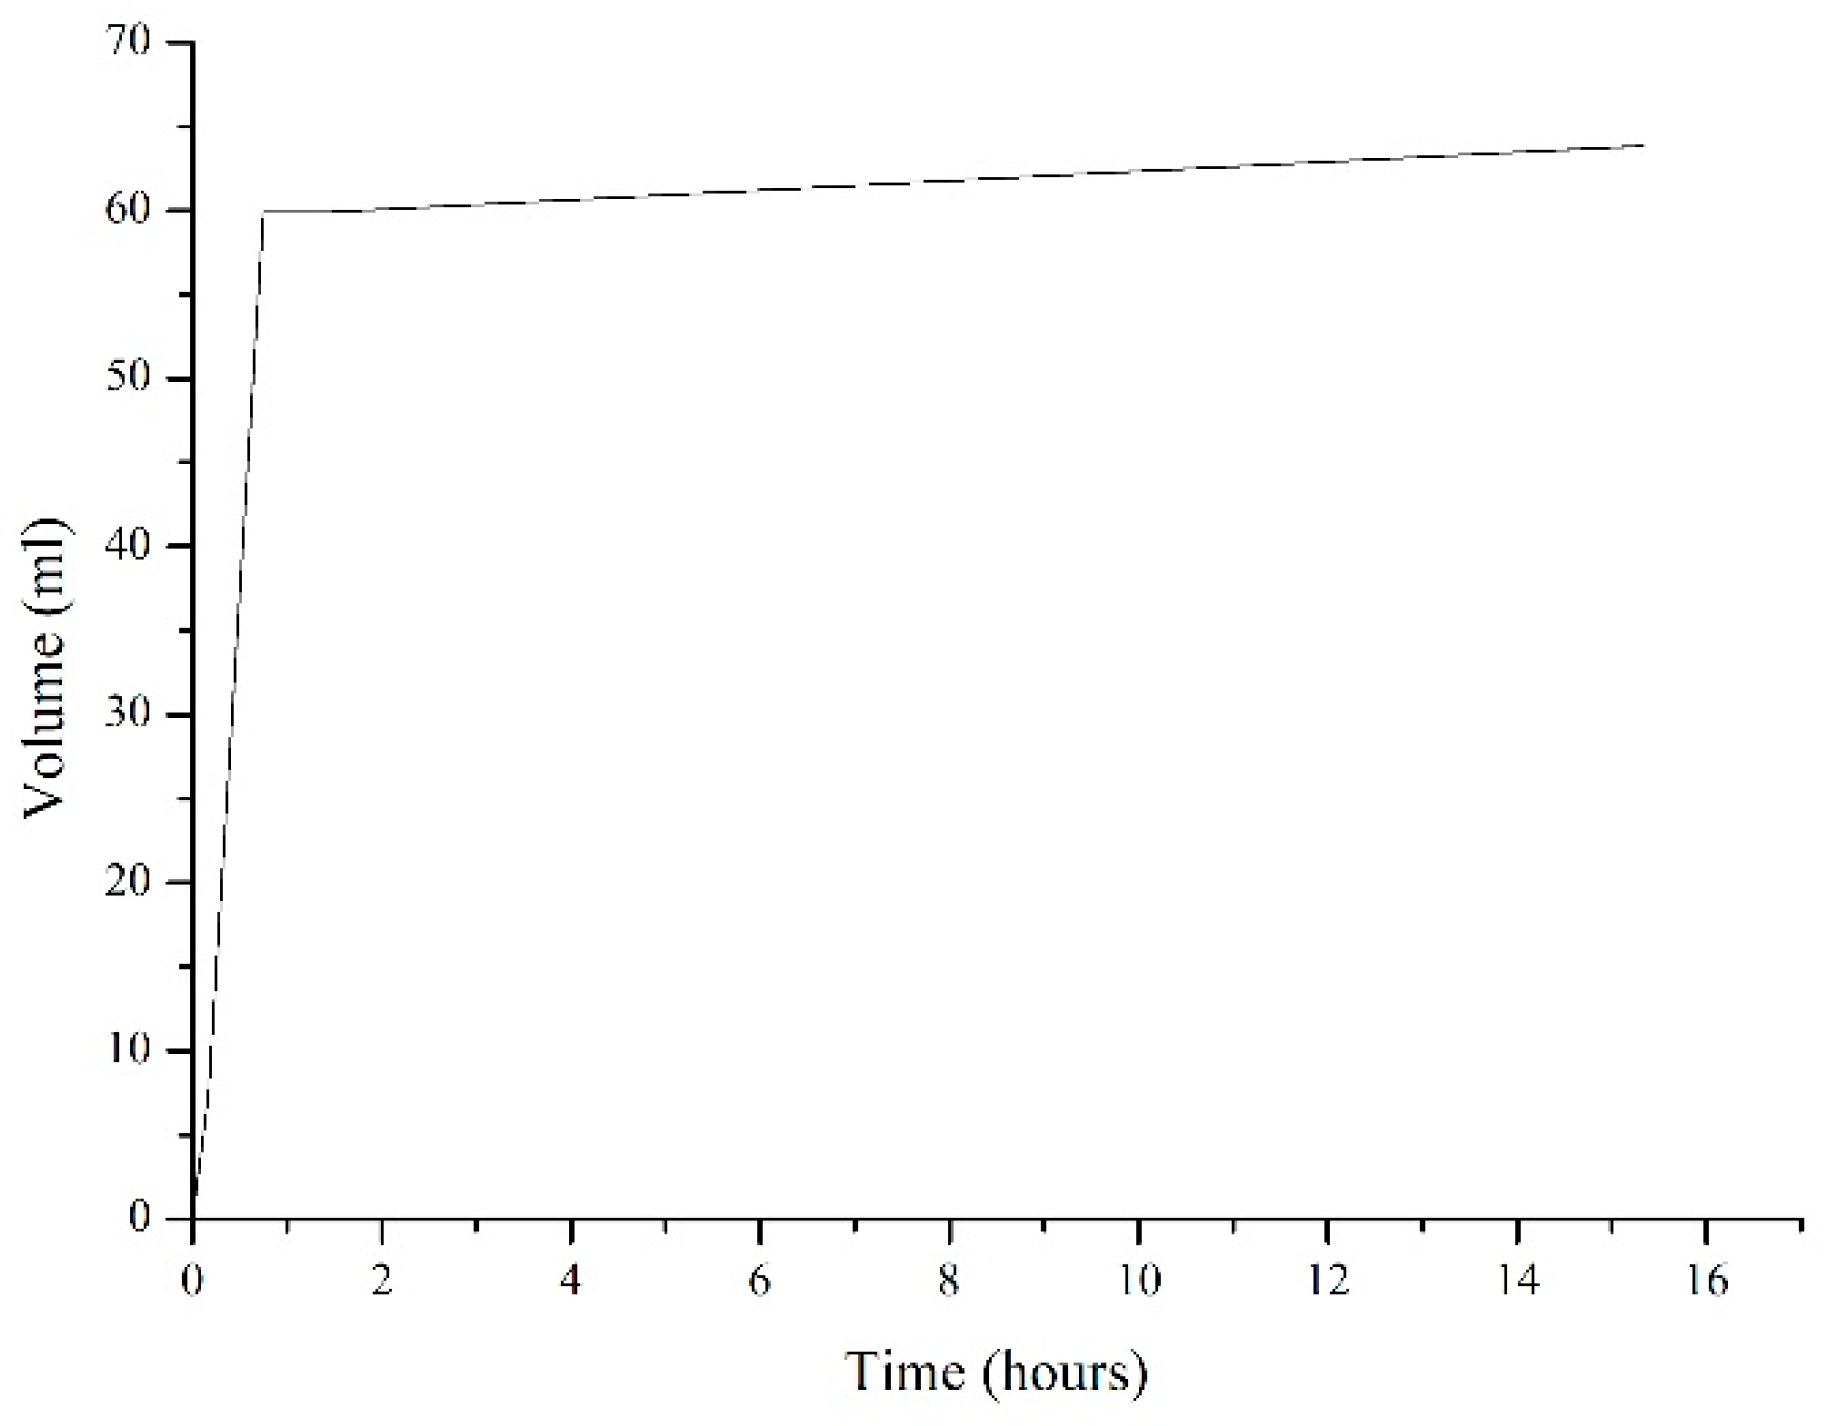
In the first stage, water with a pressure of 0.05 MPa was injected to the center of the specimen and the volume of the entering water and the vertical displacement of the top surface of the steel plate were measured, as shown in Figure 3. The maximum volume of injected water was 63.8 mL. The stage one test lasted for 15.33 h. The vertical displacement of the top surface stayed at zero and no sign of hydraulic fracture appeared.
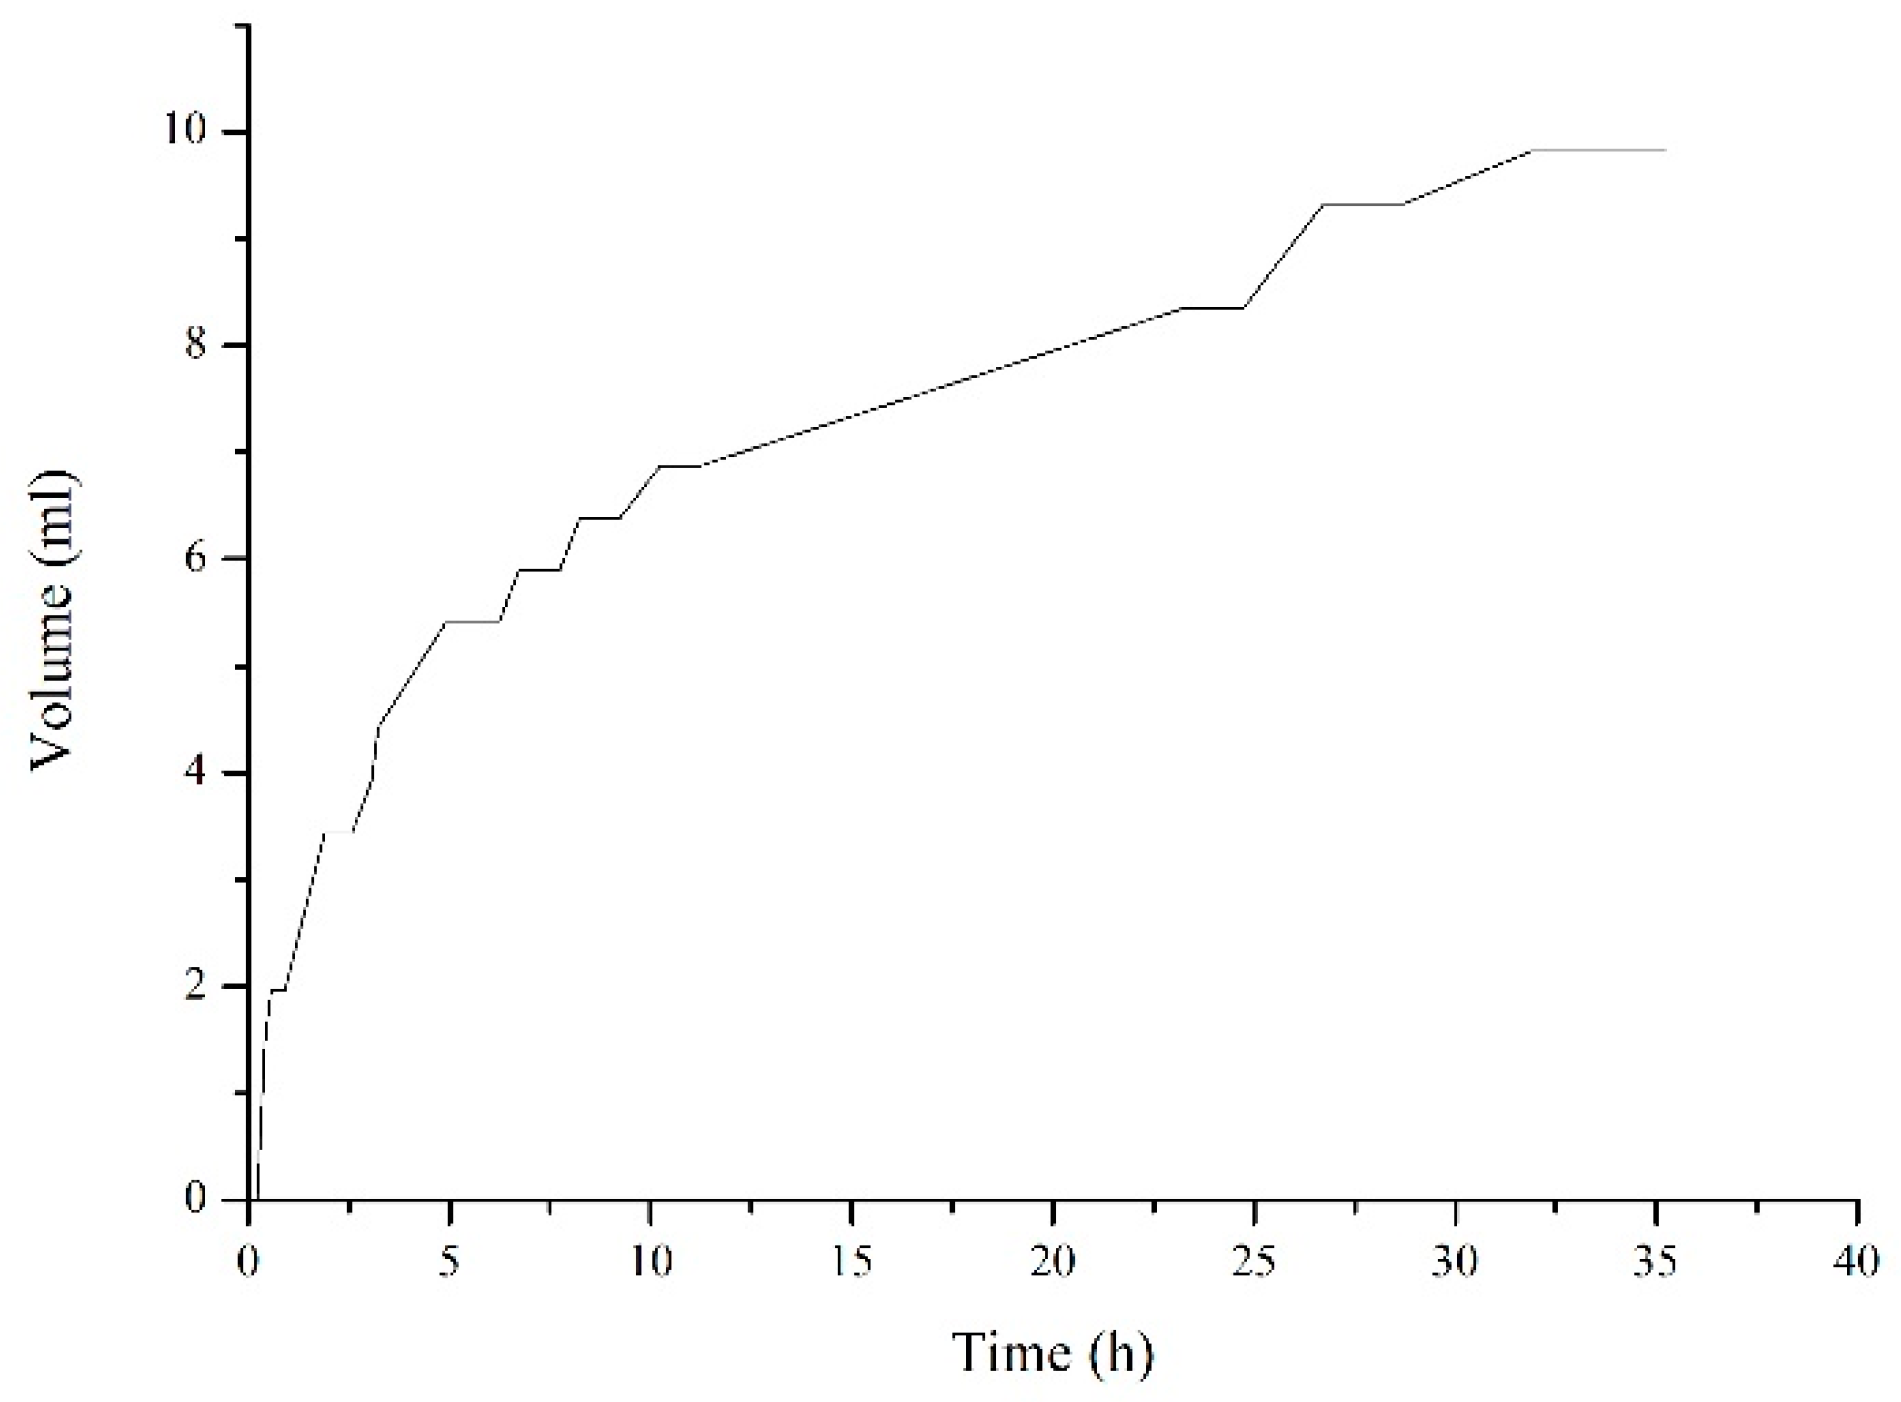
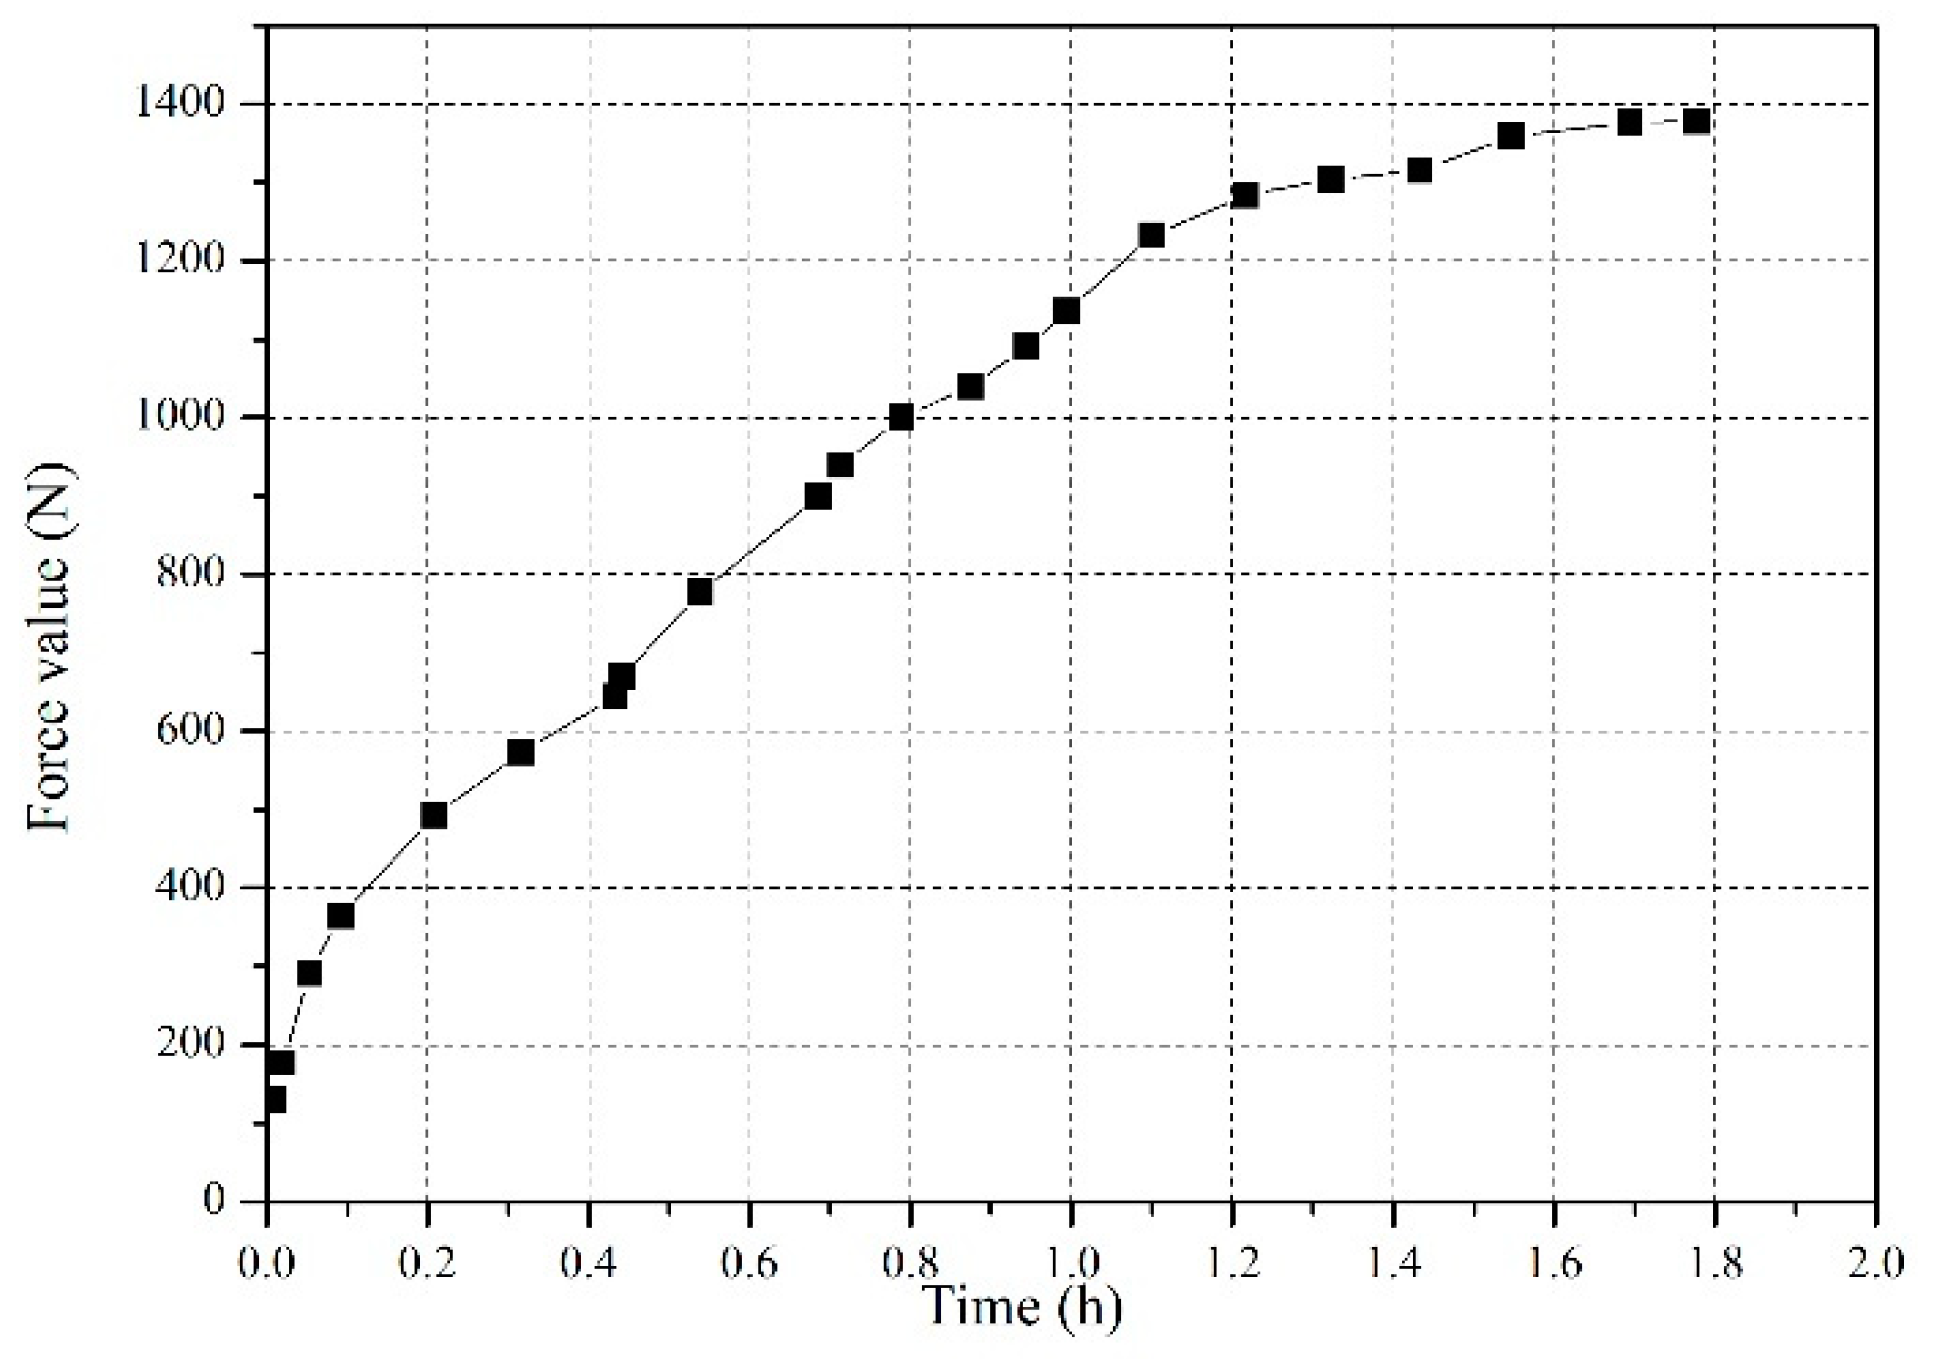
In the second stage, the water pressure was raised to 0.13 MPa. The volume process of injected water is shown in Figure 4. The total amount of water injected was 9.8 mL. The vertical displacement of the specimen was zero and lasted for 35.23 h. The water volume did not change in the last 3.33 h and no hydraulic fracture occurred.
2.5. Test with Tensile Loading of Stage Three
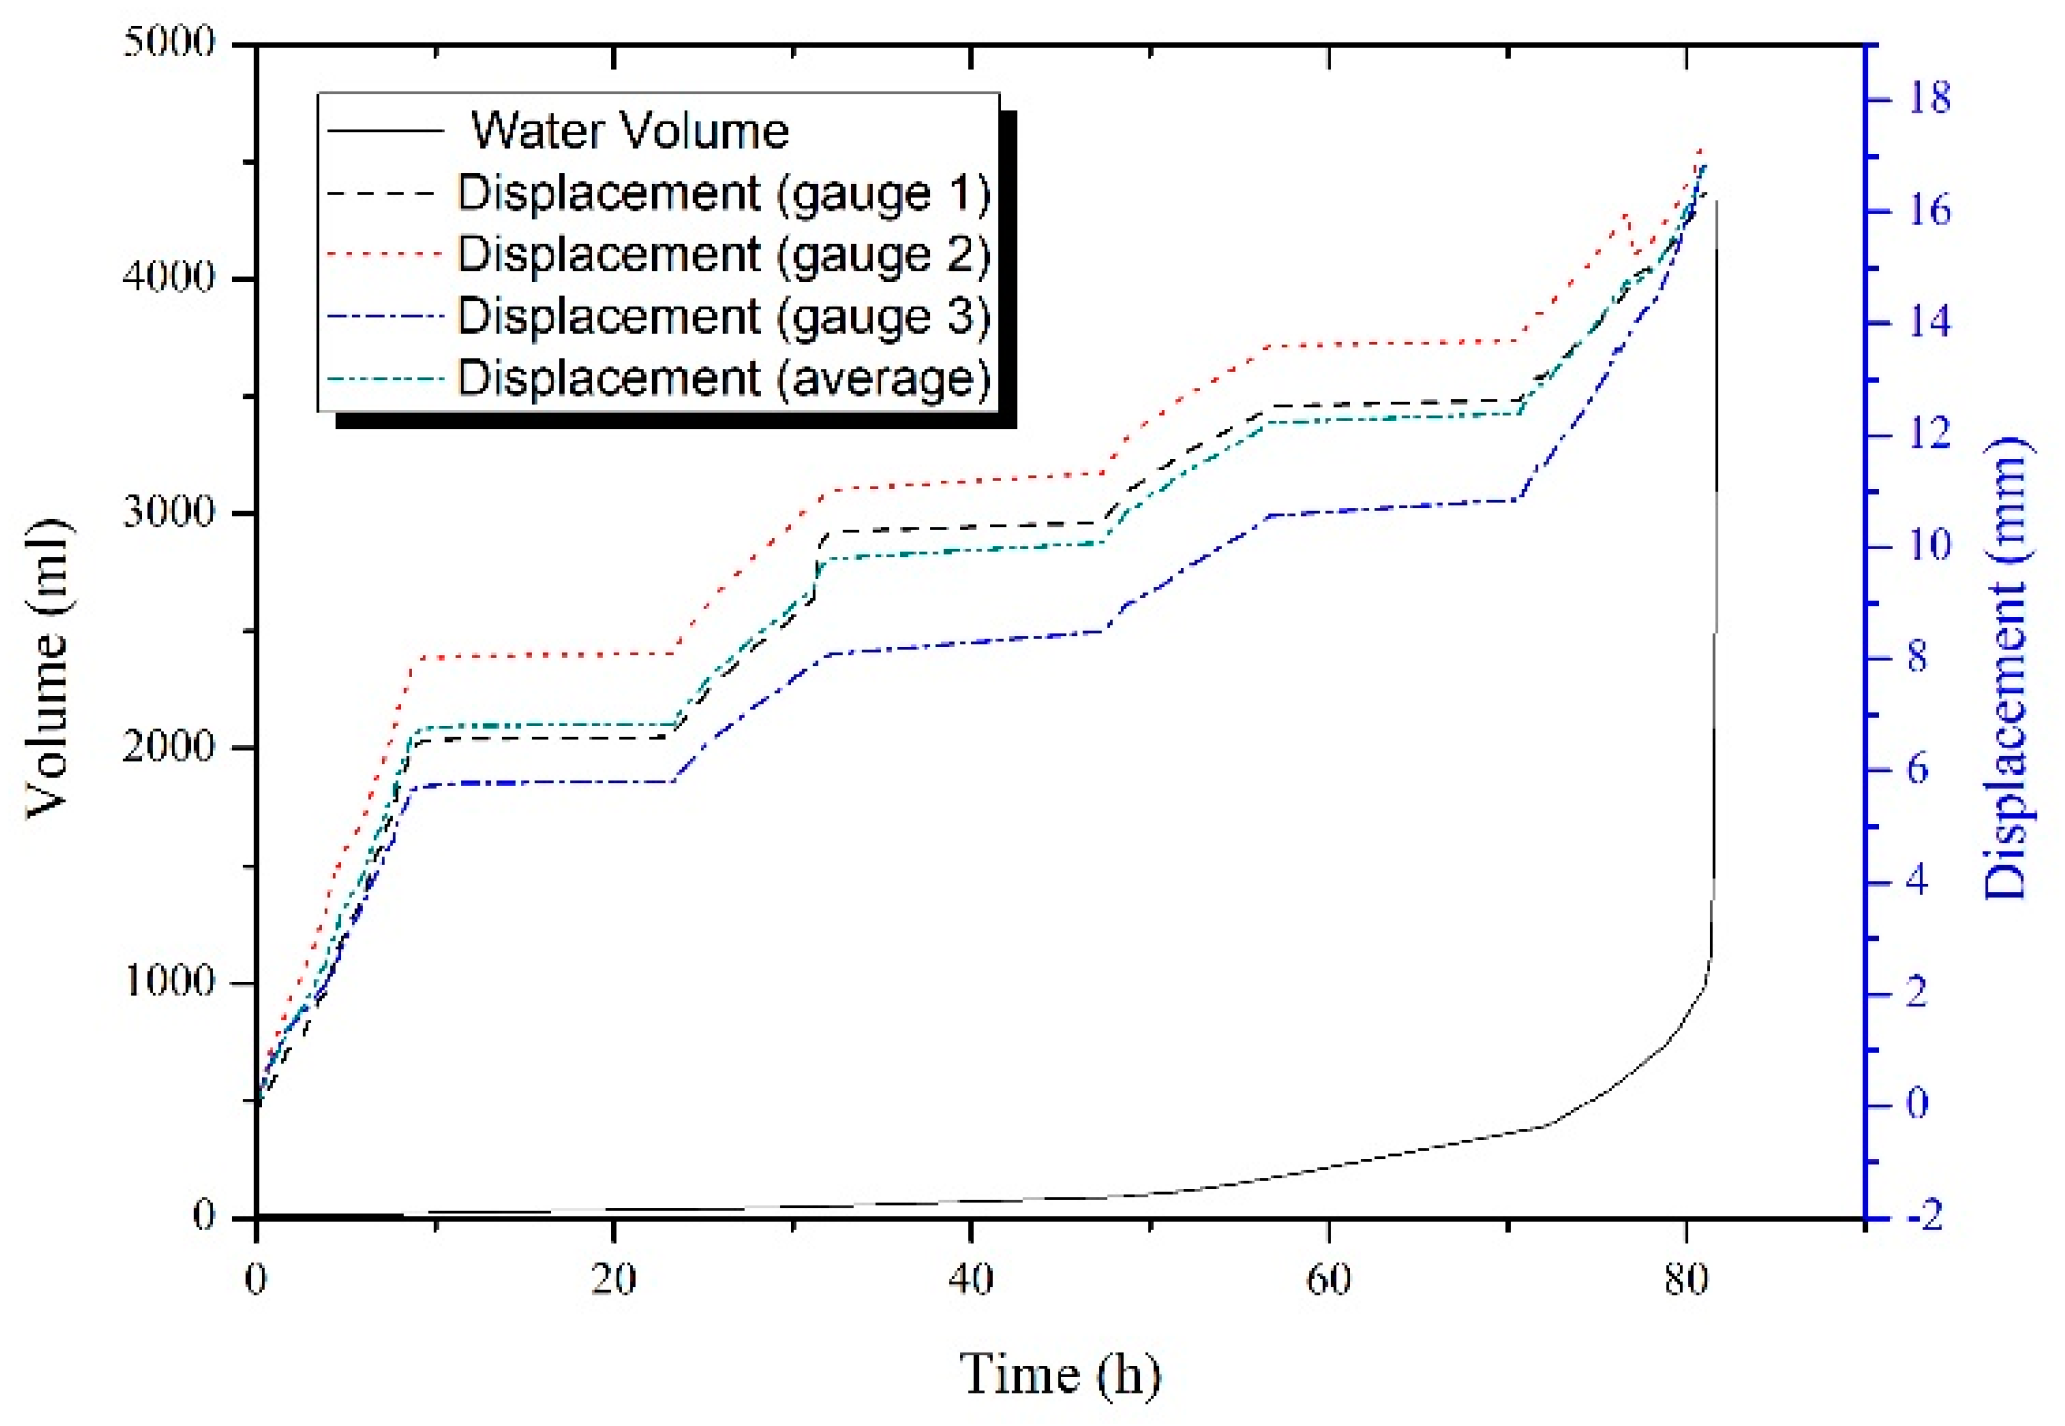
In the third stage, a tensile stress of 0.06 MPa was applied to the specimen through jacks between the steel plates and the water pressure was maintained at 0.13 MPa. The processes of injected water volume and vertical displacement are shown in Figure 5.
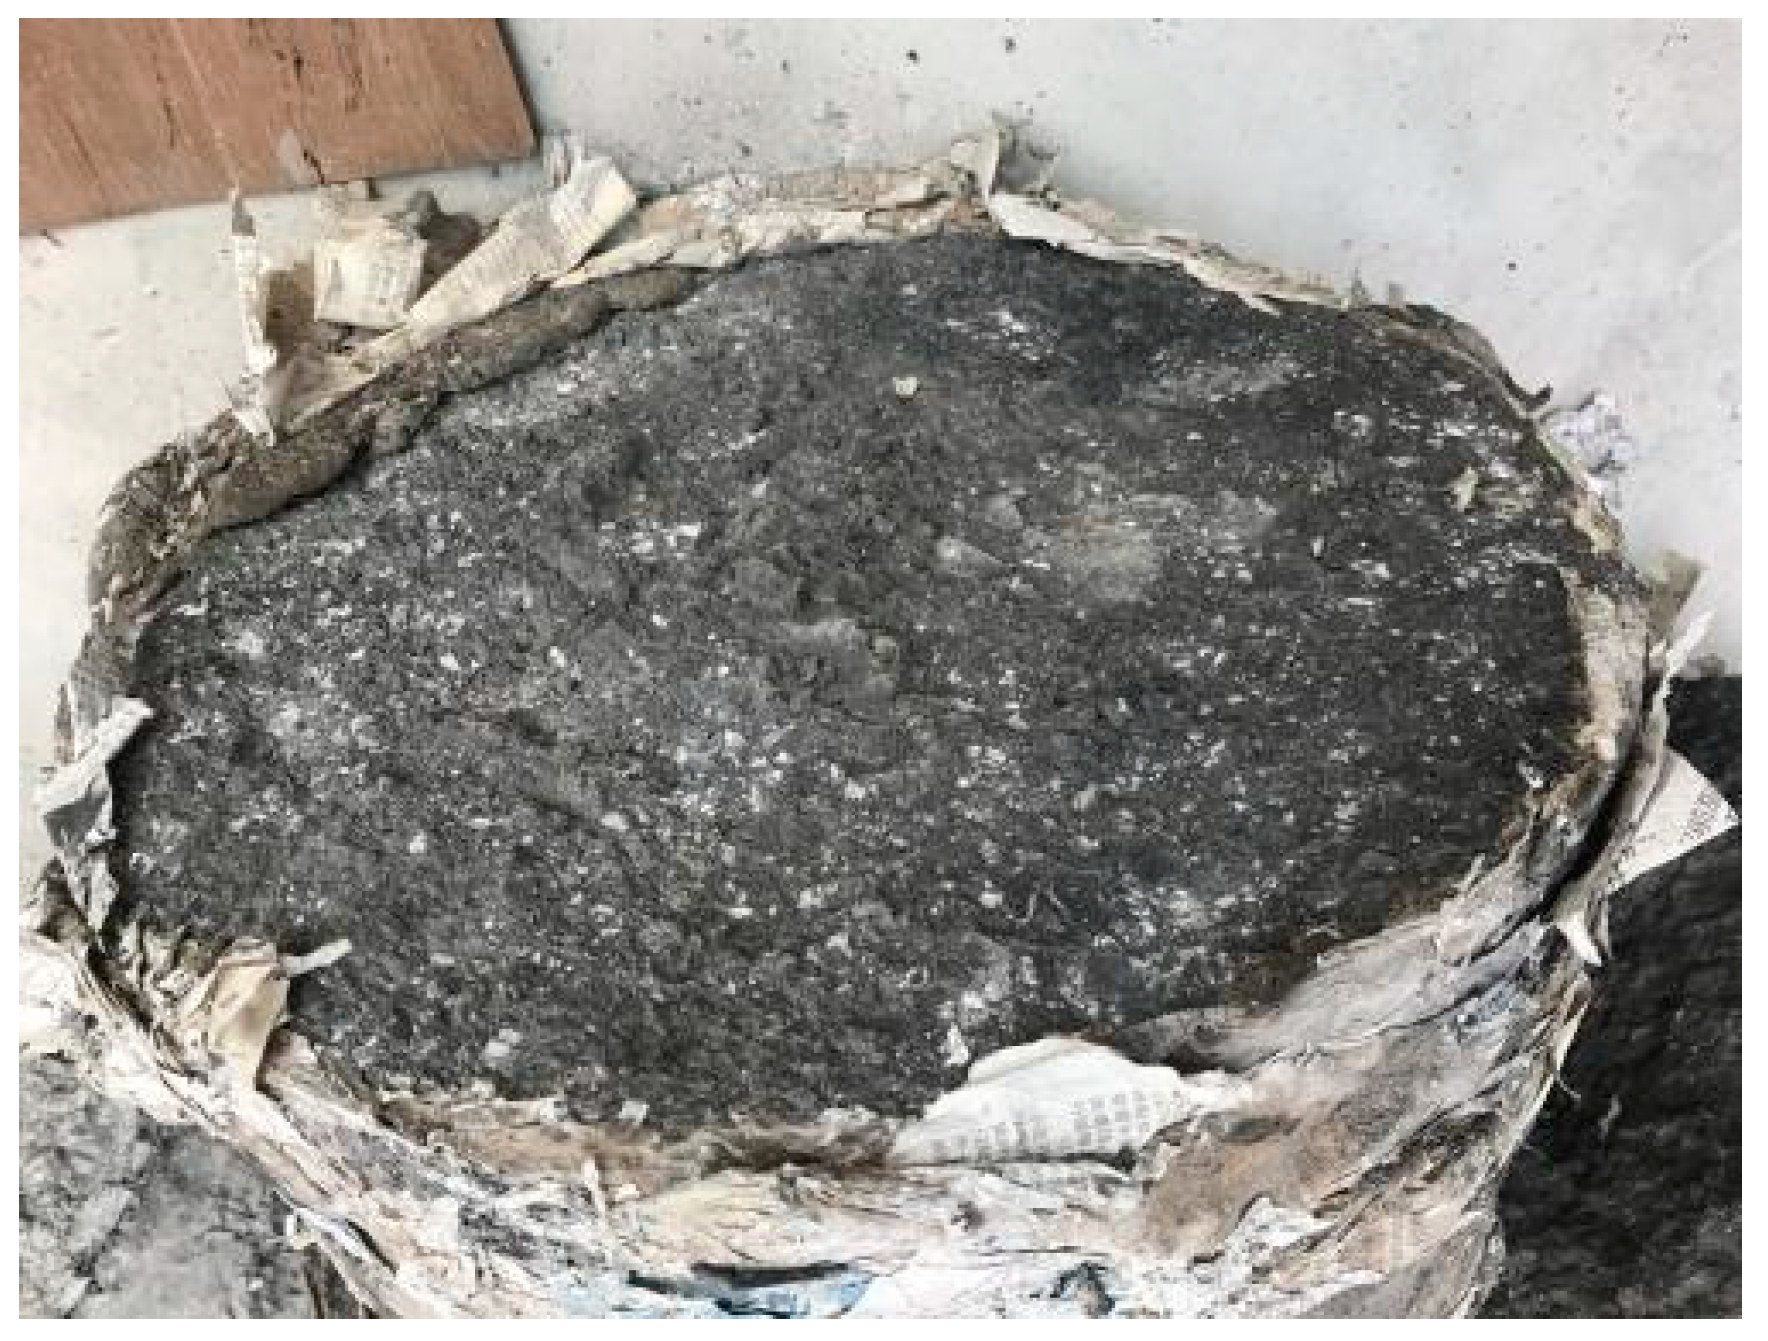
In the stage three test, it was discovered that water leakage occurred at the model edge. The test lasted for 81 h and the injected water volume was close to 1000 mL; both began to increase sharply. At this moment, the average vertical displacement was 16.7 mm and the averaged tensile strain was estimated to be 0.042. Afterwards, the upper halve of the specimen was pushed out by jacks and the specimen was broken into two halves, as shown in Figure 6. The fracture occurred at the specimen center and the fracture surface was rough, as the aggregate of the asphalt concrete revealed.
For the asphalt concrete with a 3.5% voids content, the hydraulic fracture will eventually occur under the action of 0.13 MPa of water pressure and 0.06 MPa of tensile stress. Furthermore, in the stage two test, the volume increase process was ceased completely and became sufficiently stable, as shown in Figure 4. If the stage two test continued, hydraulic fracturing would eventually be possible, even under a water pressure of 0.13 MPa. Further tests of asphalt concrete with a 3.5% voids content should be conducted to understand the characteristics of hydraulic fracturing.
3. Model Test with Press Sensor
In the above test, the vertical stress was not measured during hydraulic fracturing, which is useful to the structural design of the core wall. In the model test of this section, the top pressure of the specimen was measured, by which the fracture area was estimated to understand the process of hydraulic fracturing.
3.1. Test Device and Specimen Preparation
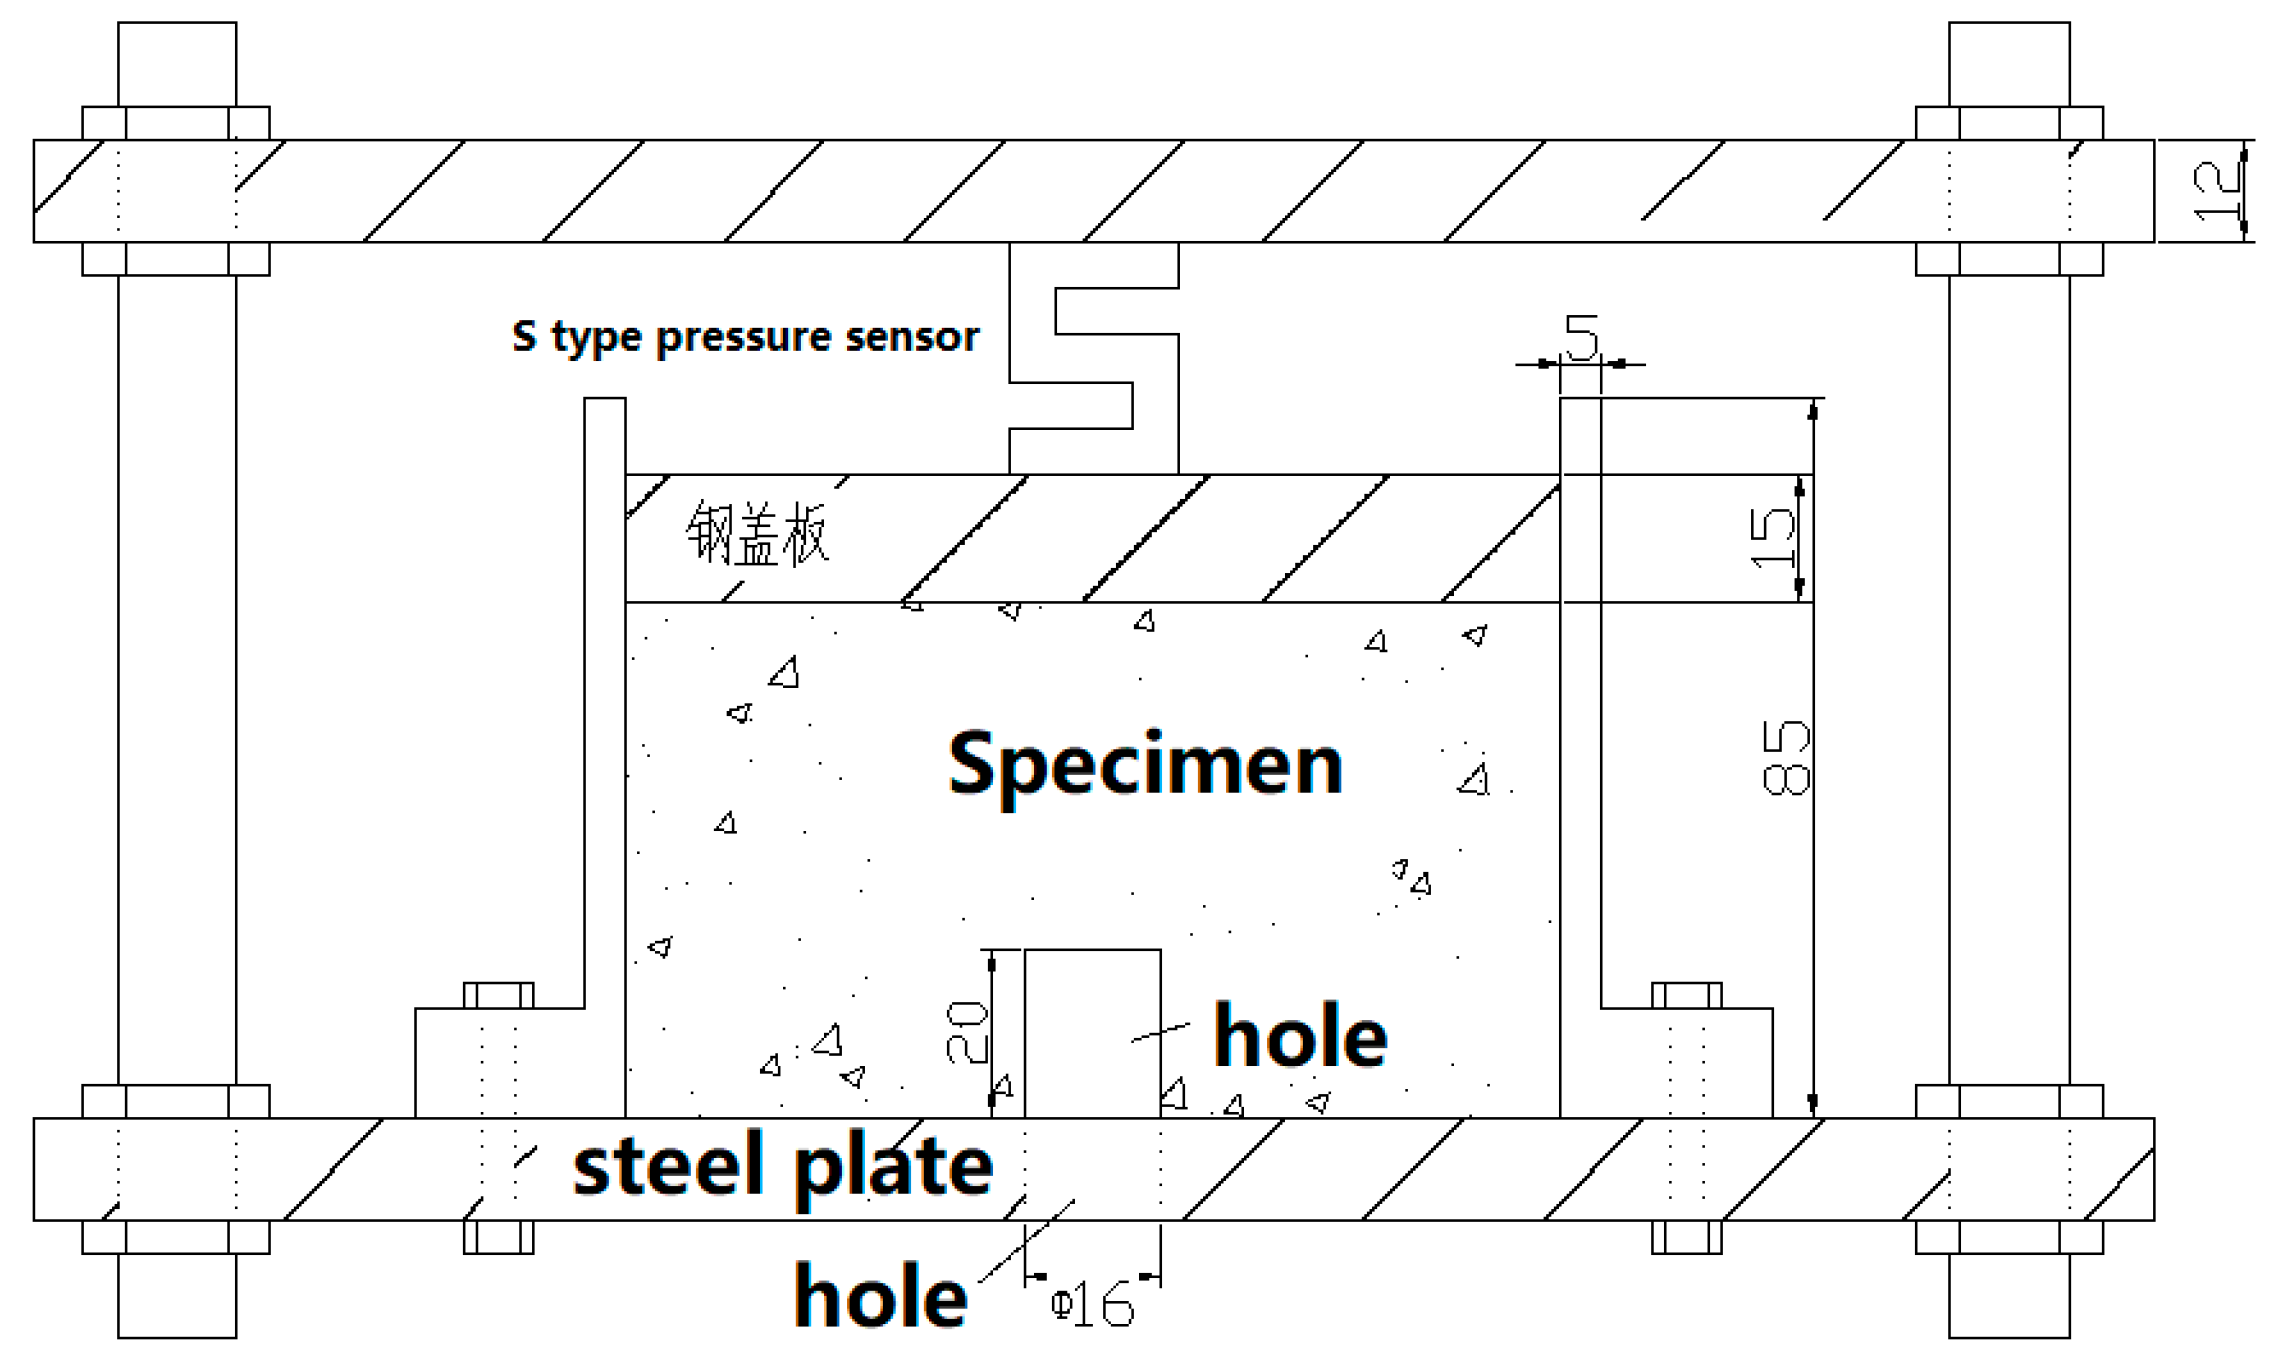
The cross-sectional view of the test device is shown in Figure 7. The top and bottom of the test device were steel plates, fixed by four bolts. The position of the top and bottom steel plates were adjusted by the screw nut. There was a Φ 16 mm hole at the center of the bottom steel plate. The steel cylinder had a thickness of 5 mm, a height of 85 mm, and an inner diameter of Φ 110 mm. There was a round steel cover plate of 15 mm thick on the specimen, with its diameter being the same to the inner diameter of the steel cylinder, on which a dial gauge and an S-type pressure sensor were fixed. The steel cylinder flange was connected with the bottom steel plate by bolts with a rubber ring of water stop; pressure water could be applied through the reserved hole of the bottom steel plate. The surface of the asphalt concrete specimen was adhered to the bottom steel plate and the round cover plate. The gap between the specimen and the steel cylinder was filled with asphalt mastic to stop lateral leakage, allowing the specimen to move freely in a vertical direction.
During specimen preparation, the voids content was controlled by the same method described in Section 2.2. The standard Marshall specimen of Φ 100 × 63.5 mm was adopted for the model test and a water inlet hole was reserved at the bottom during the specimen compaction by a Φ 16 × 20 mm steel rod on the mold plate. After compacted, the upper and lower surfaces of the specimen were cut polished to expose aggregate by a hand grinder, leveled by epoxy putty, and stuck by epoxy to the steel plates. After the flange fixed to the bolts, hot bitumen was poured between the specimen and the steel cylinder. The mixing ratio of the asphalt mixture is the same as shown in Section 2.1.
3.2. Test Parameters and Procedure
The temperature during the test was 20 °C. The voids contents of the specimen were uniformly 3.0%, 3.4%, 3.5%, 4.0%, 5.2% etc. The applied water pressure was 0.13 MPa in the reserved hole of the specimen and stabilized during the test using a manual pump. The 0.13 MPa water pressure generated a 26 N upward force in the Φ 16 mm hole of the specimen. The compressive forces on the upper surface of the specimen are provided in Figure 8, Figure 9, Figure 10, Figure 11 and Figure 12.
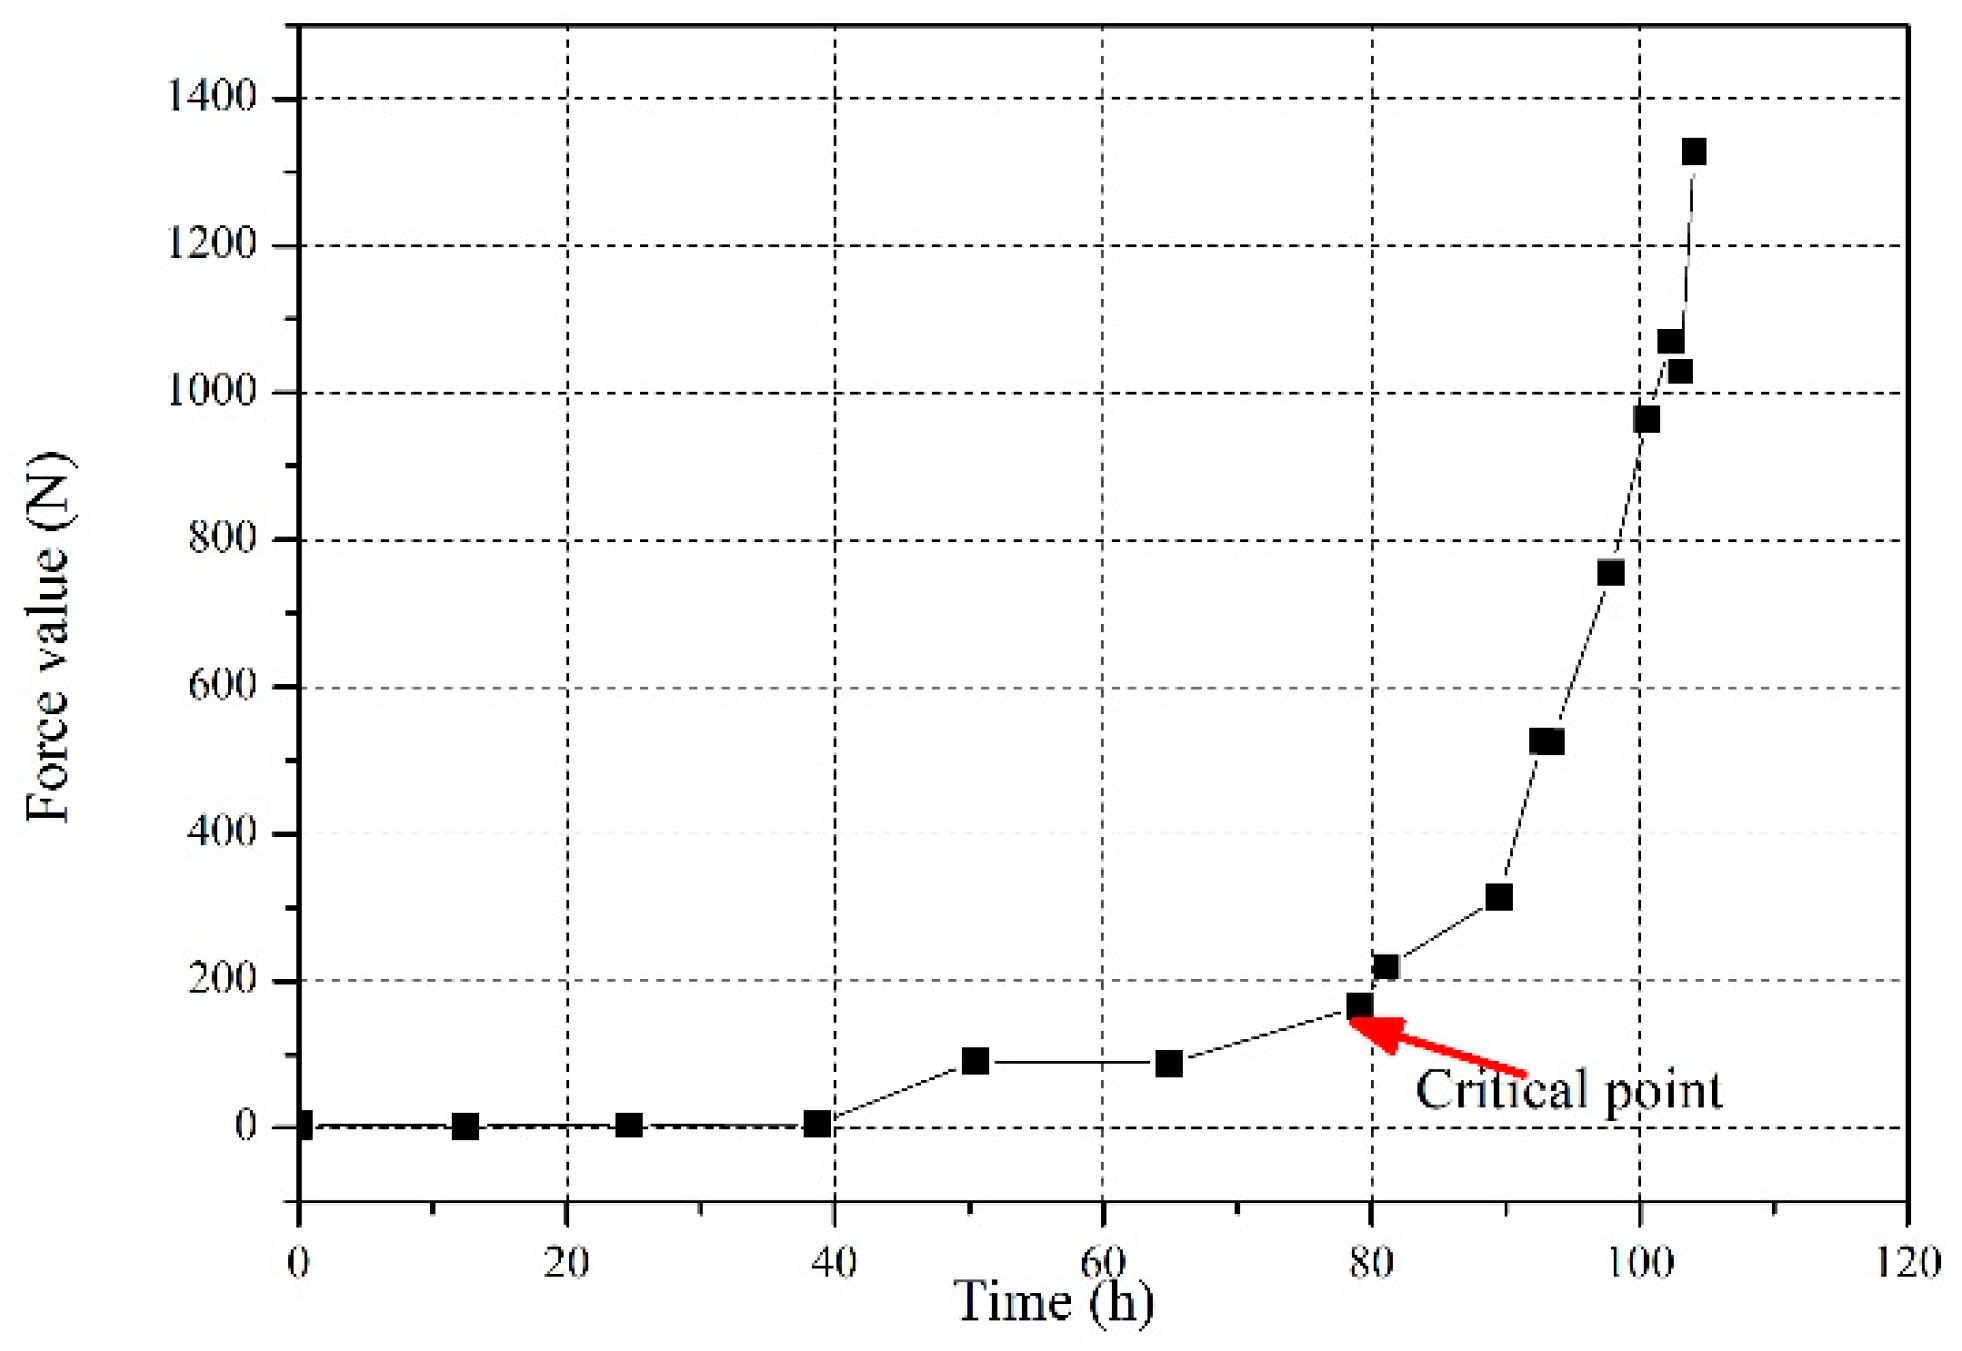
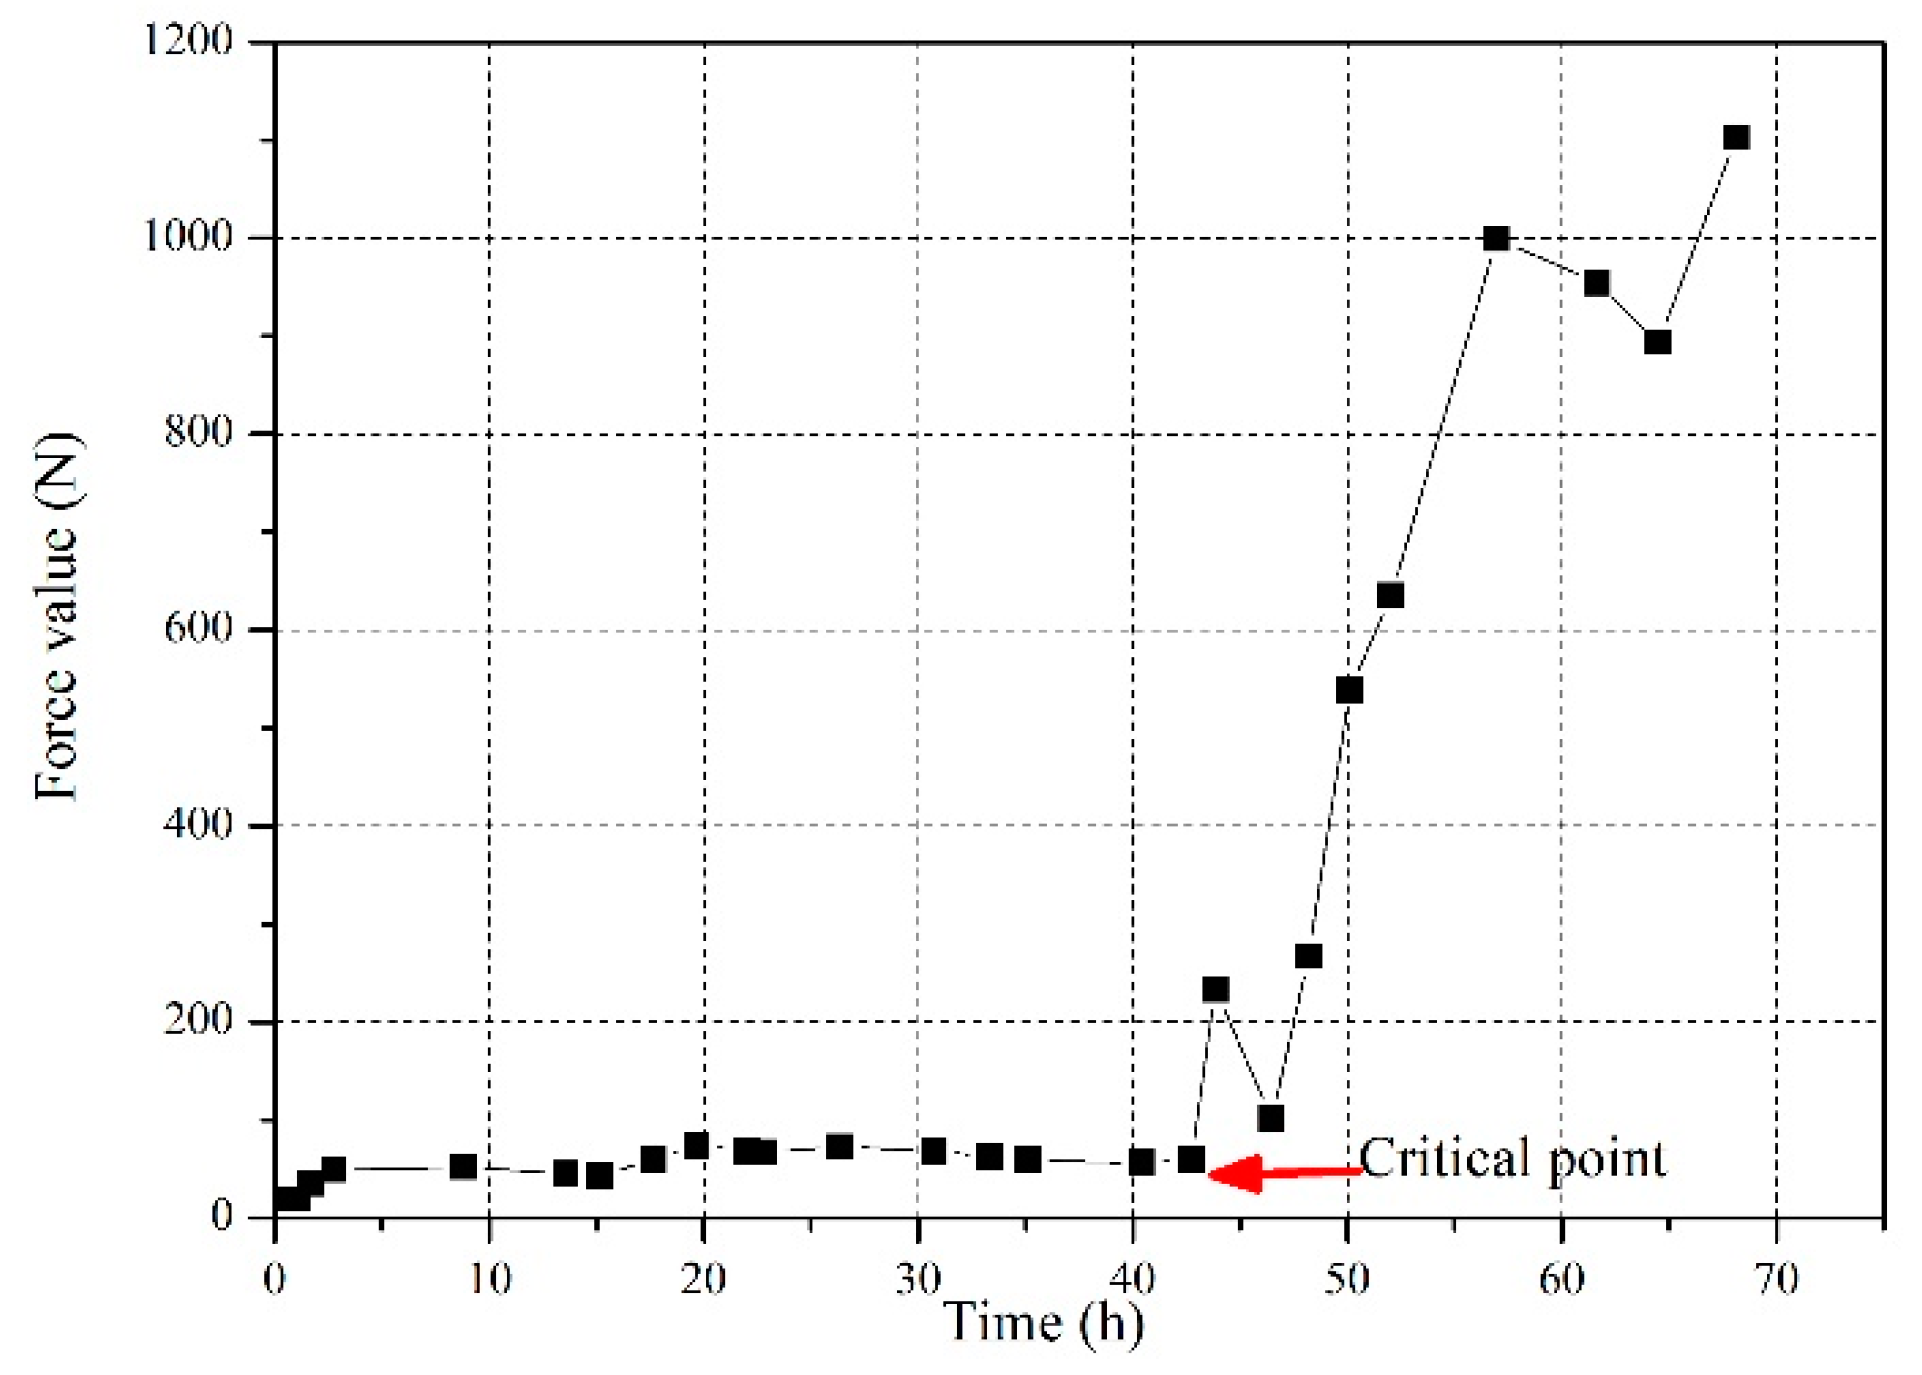
For the specimen with a voids content of 3.4%, the test process can be divided into two stages (Figure 8). The first is the steady process, where the force value gradually increased from 26 N to 131 N in 77.7 h, which afterward the specimen was still intact. In the second stage of the rapid fracturing, the force value increased rapidly to 1021 N within 23 h, wherein hydraulic fracturing damage occurred. If a point with maximum curvature was defined as the critical point of the test process curve, the critical time was 77.7 h and the critical force was 131 N. The inspection after the test showed that the specimen was horizontally broken; 2 to 3 mm thick remains stuck to the lower steel plate.
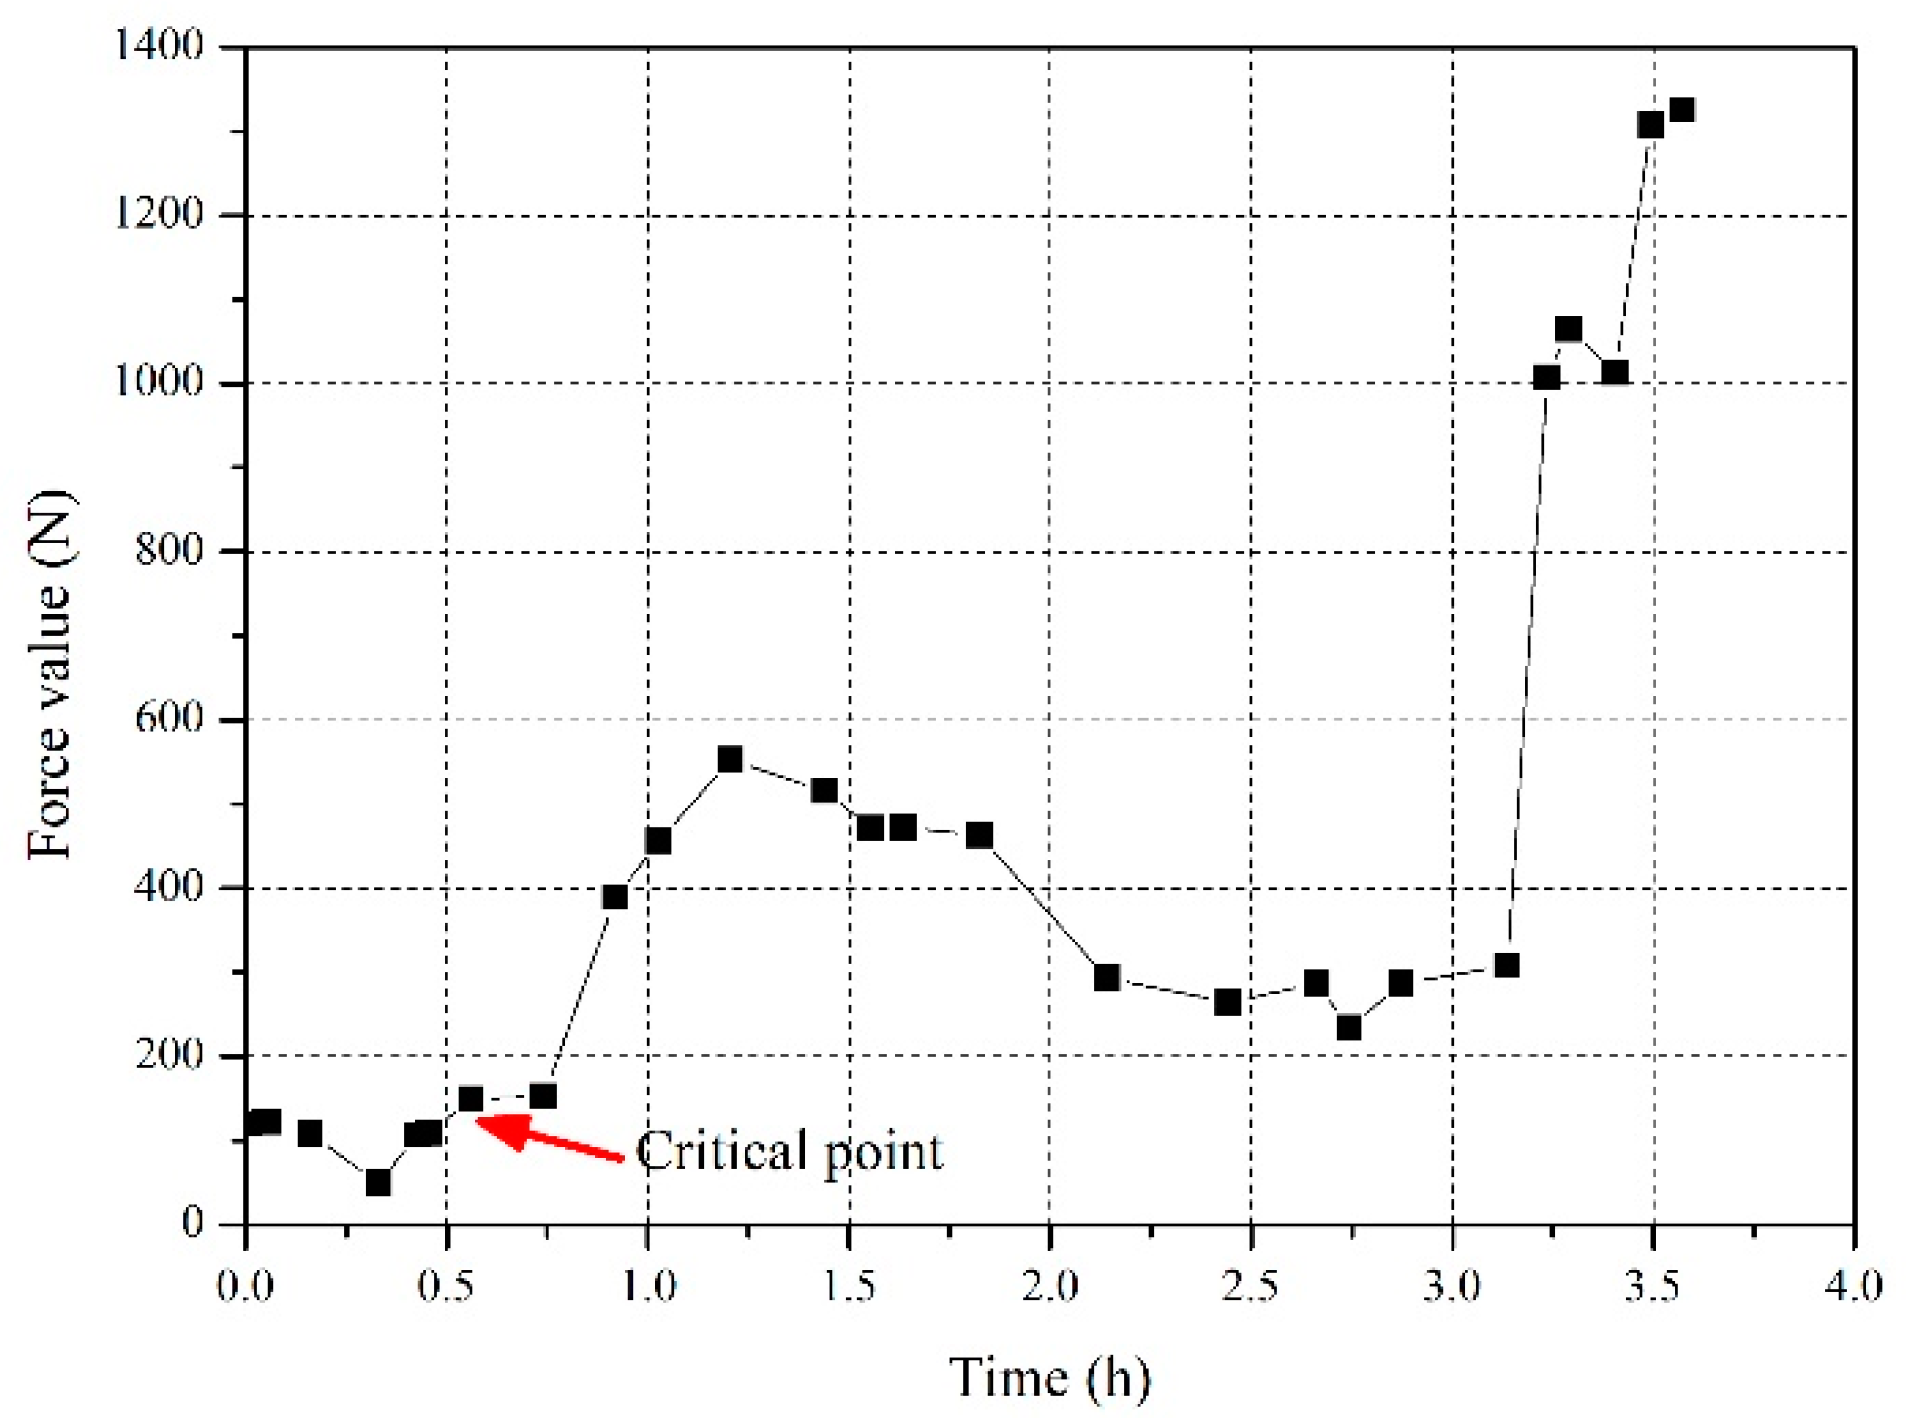
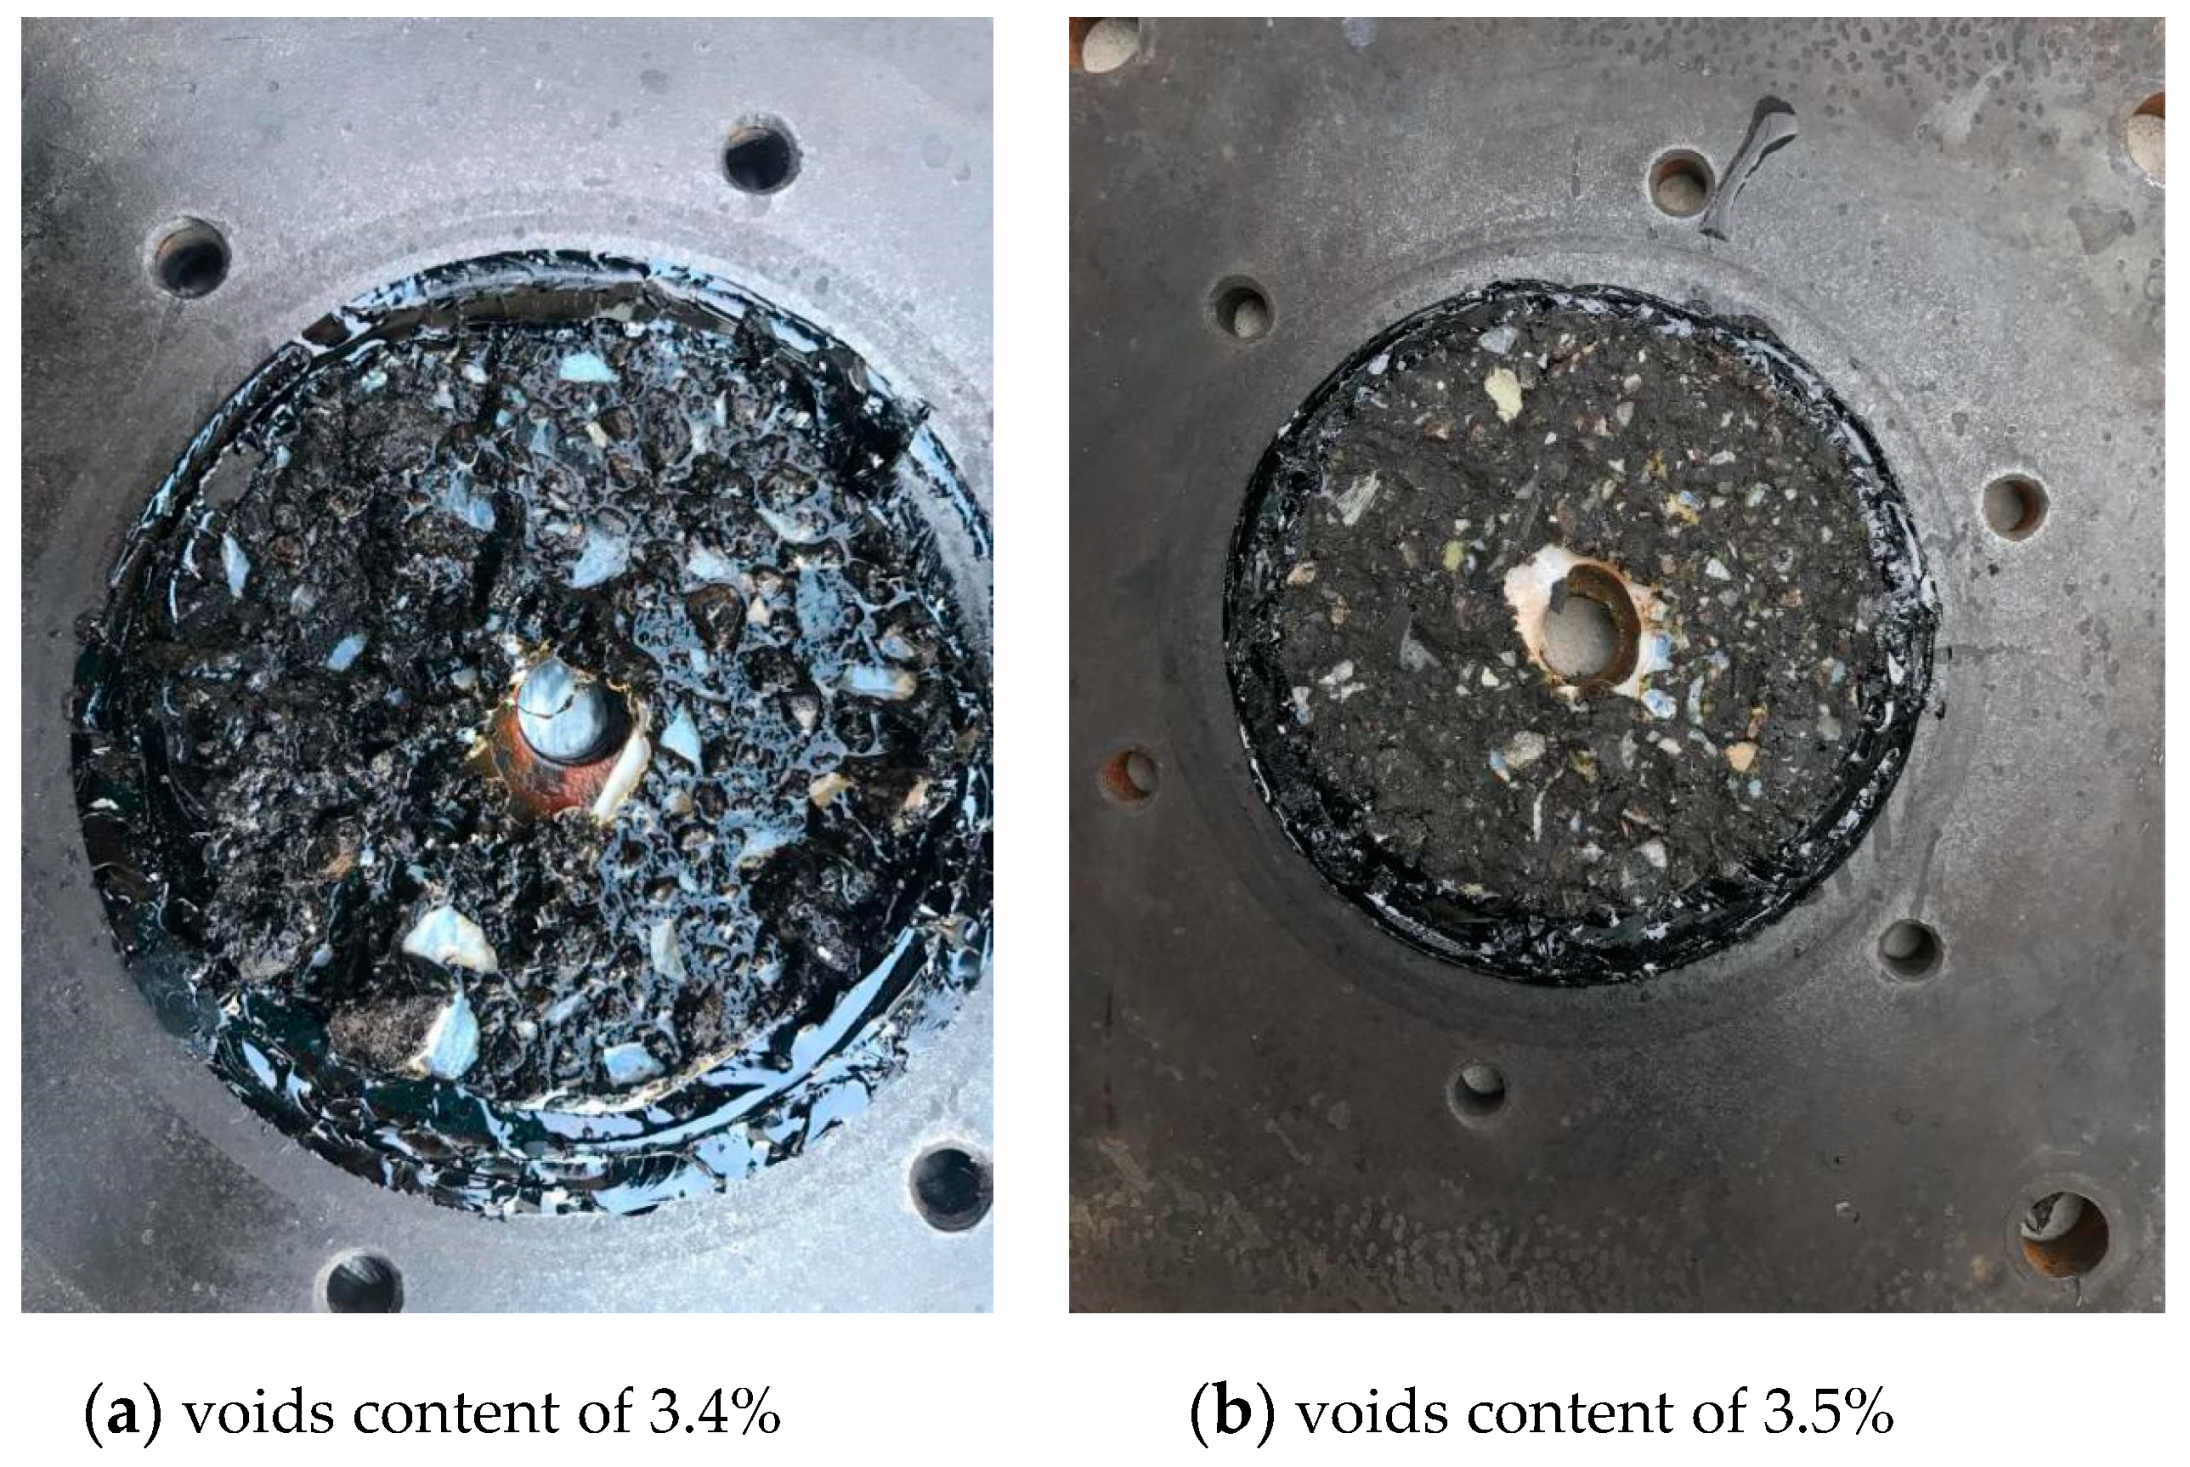
In the first stage, for specimens with a voids content of 3.5%, the compressive force was increased from 49 N to 152 N in 0.56 h and the specimen was not damaged. In the second stage, the pressure value increased rapidly. After an up-and-down fluctuation, the compressive force increased sharply at 3.2 h from 327 N to 1014 N in less than 20 min and hydraulic fracturing occurred (as shown in Figure 9). The critical time was 0.56 h and the critical force was 152 N. Moreover, the inspection after the test showed that the specimen was horizontally broken. More importantly, there were 2 to 3 mm thick remains stuck to the lower steel plate. A more careful inspection to the fracture’s appearance showed less marks of coarse aggregate on the surface remains of the 3.5% voids content than those of the voids content of 3.4% (Figure 10). This may explain the less critical time of this test, which compared the voids content of 3.4% to the test.
Similarly to the test with a 3.4% voids content, the test with a 4.0% voids content had a compressive force increase to 1021 N at 56.9 h. The critical time was 43.3 h and the critical force was 93 N, as shown in Figure 11.
In the test with a 5.2% voids content, the specimen was quickly broken in 1.8 h. There was no critical point in the whole process, as shown in Figure 12.
The voids content of 3.0% was a critical value to the impervious asphalt concrete. For the test specimen with a voids content of 3.0%, the initial compressive force fluctuated greatly and gradually stabilized after 187 h. The stable value stayed around 30 N, as shown in Figure 13. During the first period of fluctuation, the maximum compressive force was 99 N and the minimum was 19 N. The test with a 3% voids content lasted for 477 h (nearly 20 days) and terminated with no sign of hydraulic fracturing. During the installation of the specimen before the test, the bolt nuts were intentionally screwed more tightly in order to give 50 N of force value. This ensured the full contact of the specimen to the pressure sensor, causing the initial fluctuation of force in the test for 187 h.
The relationships between the critical time (tc) or force (Fc) and the voids content are given in Figure 14 and Figure 15, and Table 3, from which the larger of the voids content and the smaller of the critical time or force. For the voids content of 3.5%, the critical time was about 70 h. Comparing this to the model test of the preceding Section 2.4, if the test shown in Figure 4 continued, the specimen would eventually fracture without the applied tensile stress of 0.06 MPa.
It is noteworthy that the hydraulic fracturing may not occur to the asphalt concrete with a voids content of 3.0% (Figure 13). The test period lasted nearly 20 days without any sign of increase tendency to the reactive force of the test. The threshold requirement of a 3% voids content to the impervious asphalt concrete may again confirm the concern of hydraulic fracturing.
4. Analysis of Model Test Result
4.1. Strain Rate and Tensile Strength
In the hydraulic fracture feasibility test provided in Section 2.4 and Section 2.5, there was no vertical deformation restriction to the top surface of the specimen. Assuming that all of the recorded deformation came from the middle part of the specimen, the tensile strain rate of the middle asphalt concrete with a lower voids content was obtained to be about 1.4 × 10⁻⁵/min from Figure 5. In the model test given in Section 3.2, the top surface of the specimen was restricted to deform vertically by the pressure sensor. According to the recorded vertical deformation from the top dial gauge (not given in this paper for abbreviation) and the recorded force value, the deformation rigidity of the pressure sensor can be estimated to be 625 N/mm. As described in the above section, the hydraulic fracturing process can be divided into two stages. Taking the test with a 3.4% voids content (i.e., Figure 8), the tensile strain rate of the two stages are 5.7 × 10⁻⁷/min and 1.0 × 10⁻³/min based, respectively, on the recorded force value and estimated rigidity; the second strain rate is much larger than that from Figure 5. Here, the average strain rate of 7.3 × 10⁻⁶/min of the feasibility test and the first stage model test was selected to make the following analysis. The tensile strength under this train rate was obtained from the following test.
The tensile specimens of 220 × 40 × 40 mm were cut from an asphalt concrete slab compacted by tamping a plate under the specific temperature (less than 130 °C). The mass of the asphalt mixture was carefully weighed according to the required voids content, selected to be 3.5% ± 0.5%. The test was carried out under the temperature of 14.6 °C on a UTM-100 test device. The displacement was measured using an Linear Variable Differential Transformer (LVDT) displacement sensor. Four tensile rates were selected for the test according to the possible lowest tensile rate of the device; those were 0.01/min, 0.001/min, 0.0005/min, and 0.0001/min. The test results are shown in Table 4.
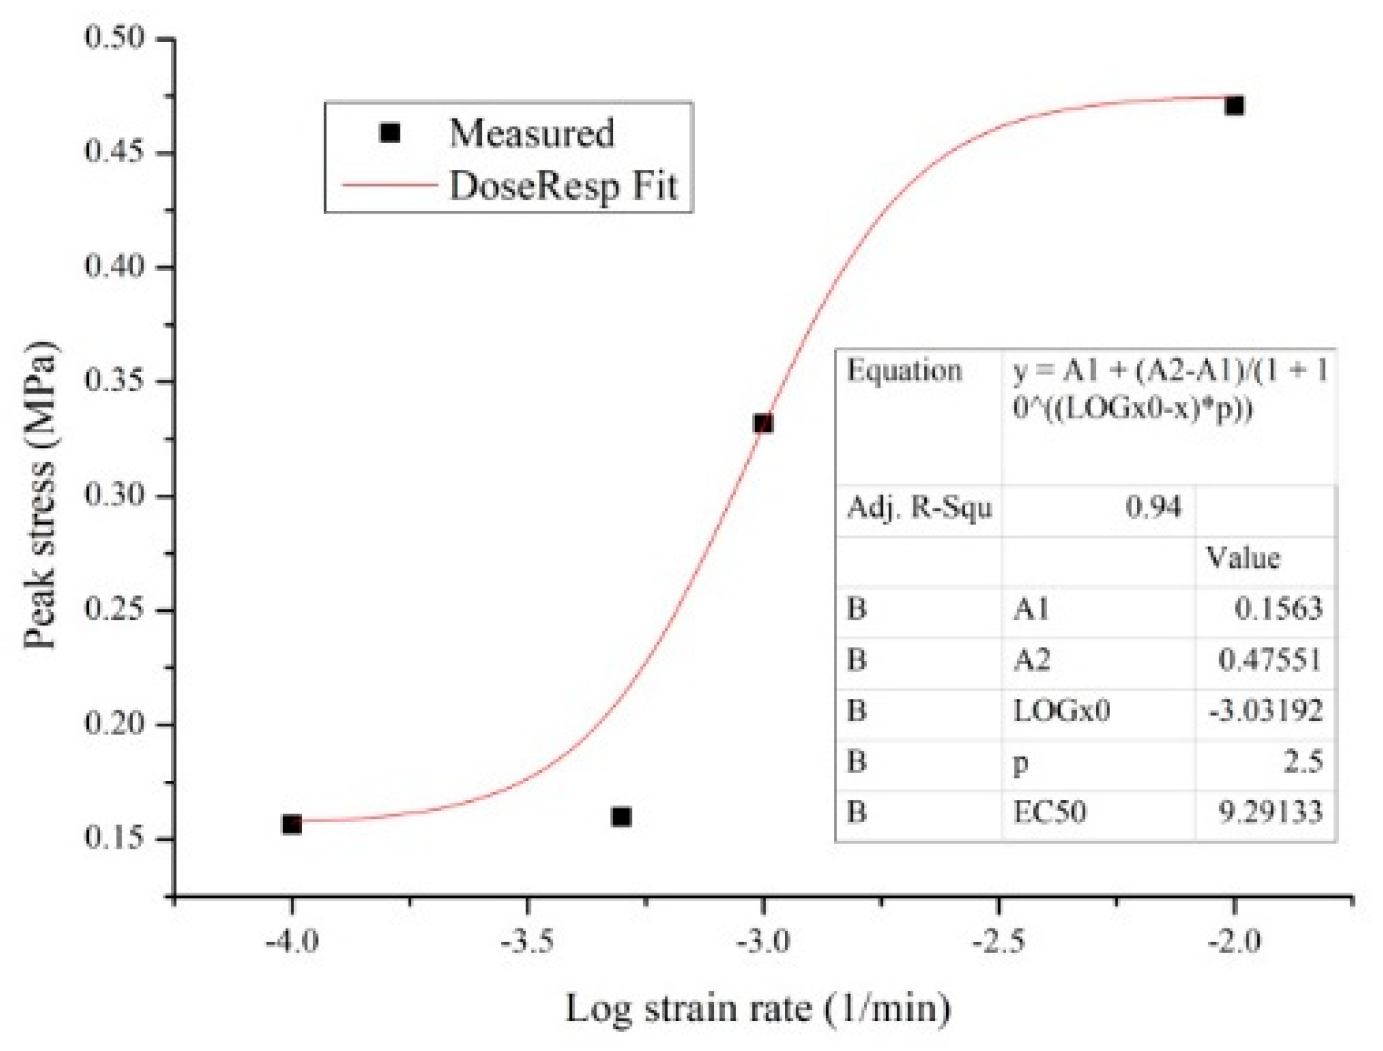
Due to the scarcity of Table 4’s test data, the tensile strength result of asphalt concrete of the Chenhab [20] is referenced, as shown in Figure 16. According to the result of the LVDT strain rate of Chenhab [20], a function shown in Equation (1) is adopted to fit the test data in Table 4. The function is a built-in function of origin software (a software for drawing curves). It has an upper and a lower limit that is compliant with our test results. It is used to describe the process of something growing from one limit to another. The fitting result is given in Equation (1), shown in Figure 17, where is tensile strength (MPa), and is tensile strain rate (1/min); the Correlation coefficient (R2) is 0.94. According to Equation (1), if the tensile strain rate is 7.3 × 10⁻⁶/min, the tensile strength will be 0.1563 MPa.
5. Fracture Mechanics Analysis
It can be seen from the model test that when the asphalt concrete’s voids content is larger than 3%, a fracture surface will be formed and expanded until failure under the action of water pressure. Due to the stress concentration at the crack tip, fracture mechanics method could be used.
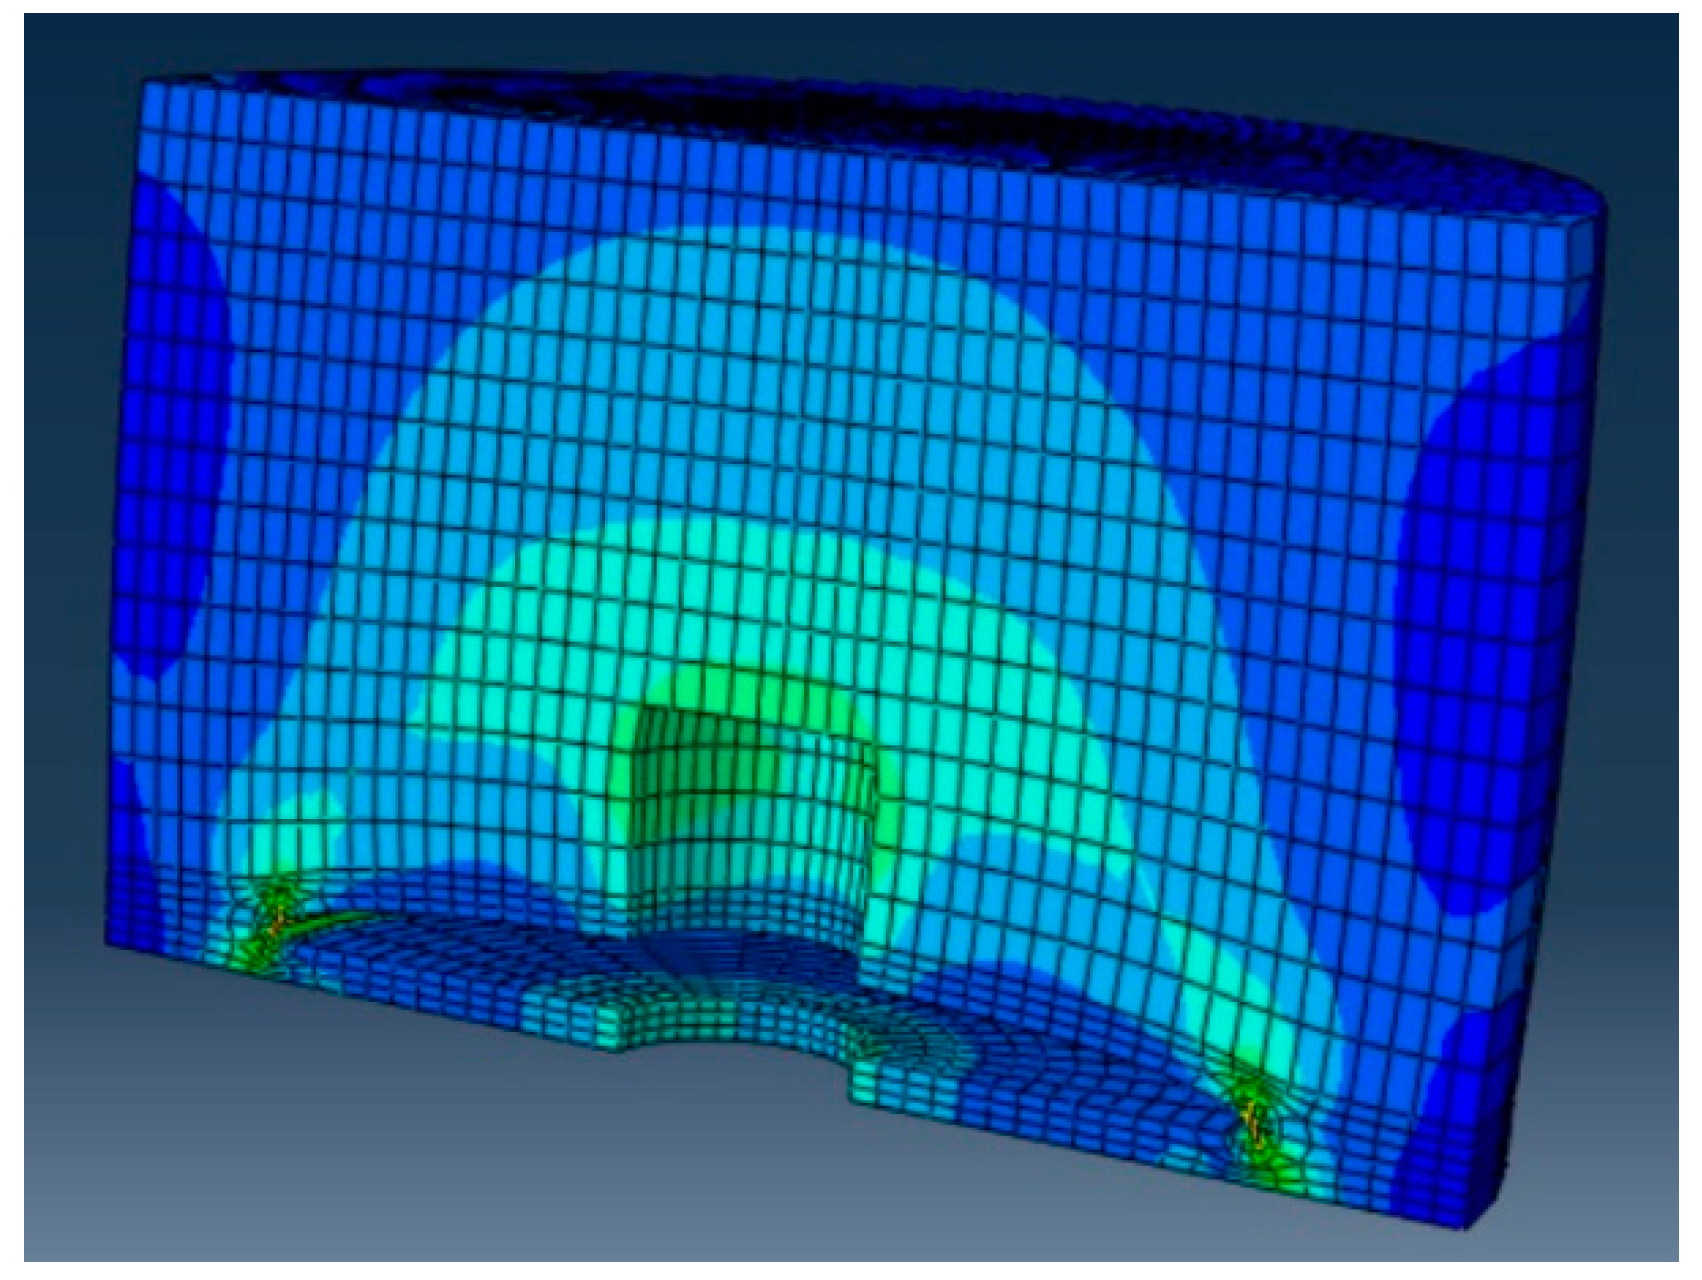
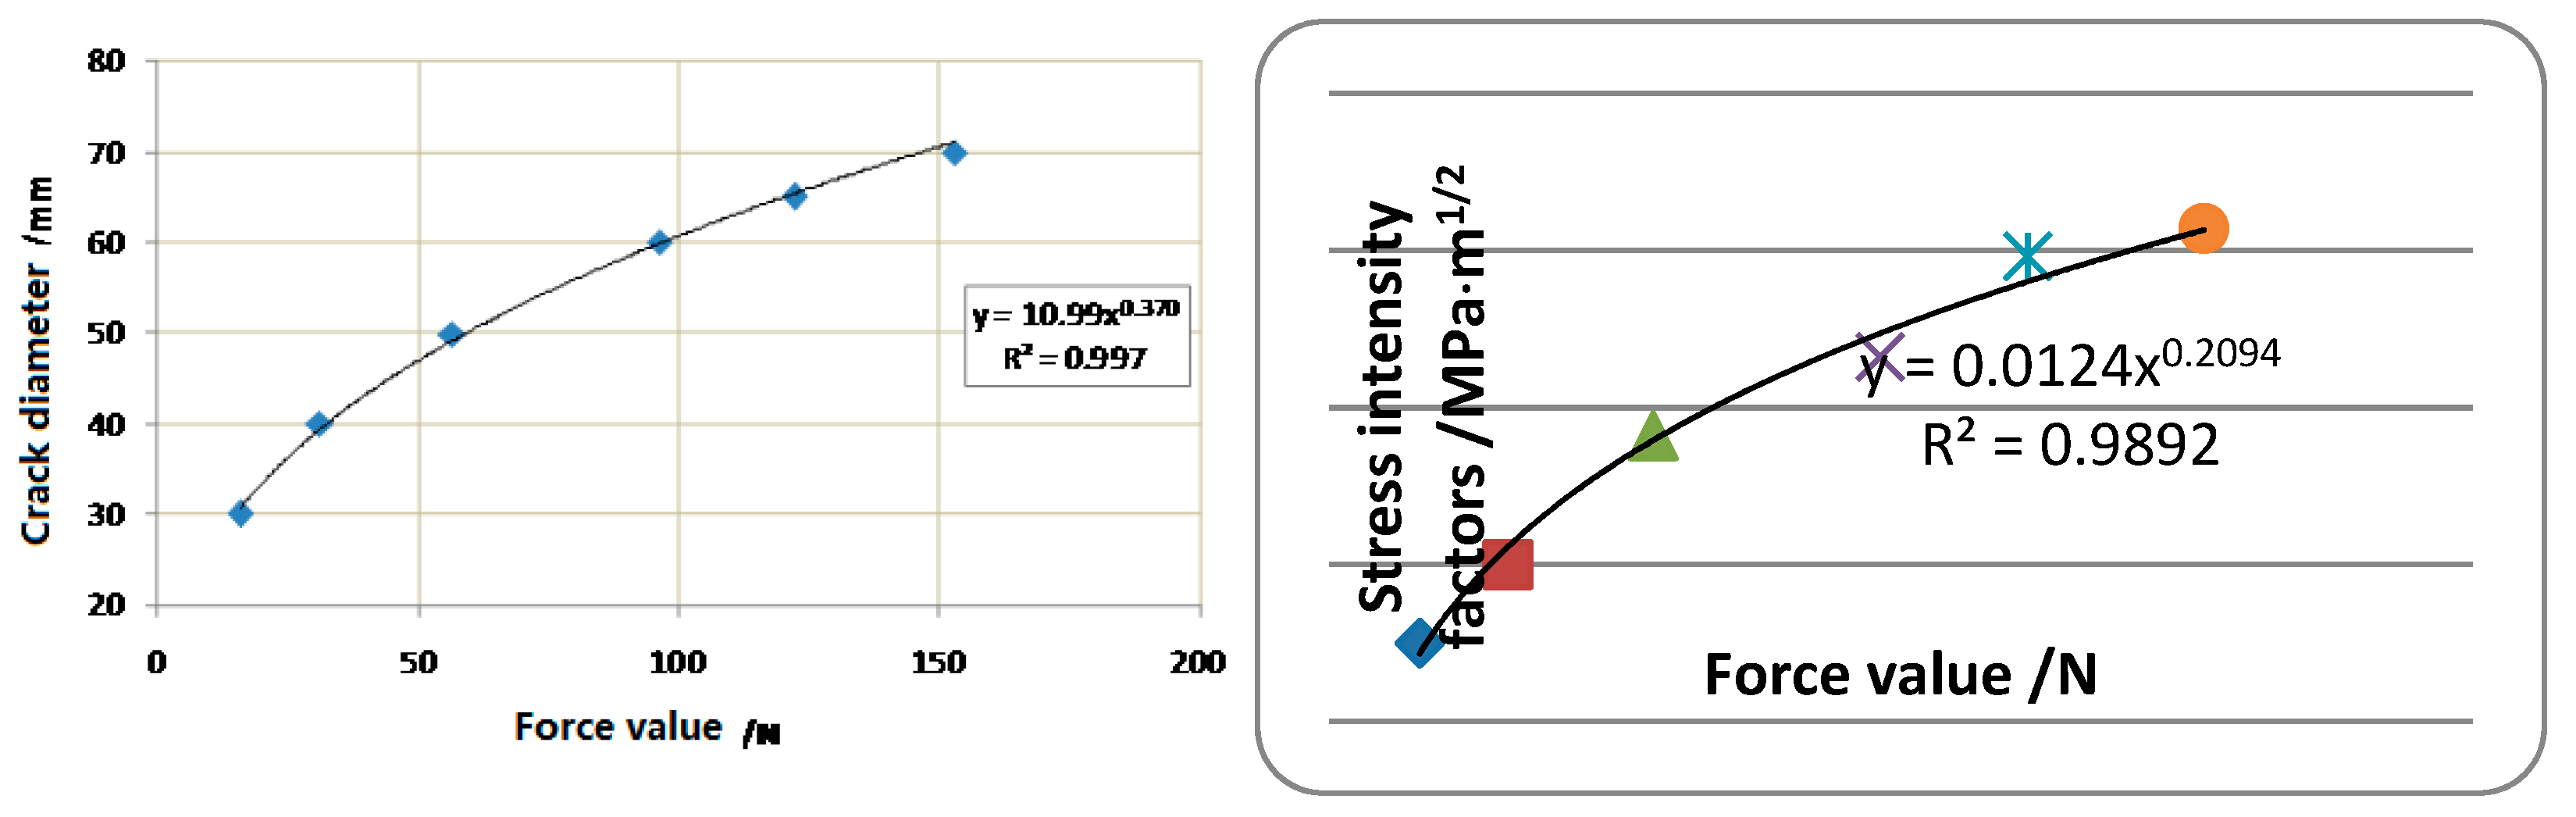
The stress intensity factor (SIF) was calculated using ABAQUS software. The numerical model was consistent with the test model described in Section 3.1 and shown in Figure 18. There was a crack disc 3 mm from the bottom. The applied water pressure in the bottom hole and the crack disc was 0.13 MPa. The model bottom had a vertical rigid displacement boundary. The force sensor on the steel plate was simulated using a spring unit with a stiffness of 625 N/mm. The elastic modulus of the steel plate was selected to be 210 GPa and the asphalt concrete was determined to be 6 MPa, according to the low tensile strain rate of 7.3 × 10⁻⁶/min and tensile test results described in Section 4.1. According to the numerical analysis, the calculated reaction force of the pressure sensor and the SIF were obtained to the specified crack disc diameter and given in Table 5, where the ligament area is the area excluding the crack disc. The corresponding relationships are shown in Figure 19.
Taking the test results of the 3.4% and 4.0% voids content, the respective parameters are obtained according to above results. The radius R of the plastic zone ahead of the crack tip was calculated according to Equation (2), in which σt is the tensile strength and KIC is the fracture toughness corresponding to the critical force. Because the averaged stress of the ligament area was smaller than the above tensile strength, the theory of fracture mechanics should be applied to explain the hydraulic fracture of asphalt concrete of this paper. Like the plastic zone radius R of the different materials in Table 6, the asphalt concrete with a voids content between 3.4~4.0% behaved during hydraulic fracturing like a quasi-brittle material, similar to the concrete listed in Table 7.
6. Conclusions
The scarcity of voids in the impervious asphalt concrete will not allow the entrance of reservoir water to the core wall, thus creating a pore pressure. Meanwhile, the fluid medium of bitumen in the asphalt concrete under normal temperatures has a viscosity so high that it does not behave like a fluid and does not move inside hydraulic asphalt concrete. Since the main preconditions of pore water pressure and pressure transmission do not exist, the hydraulic fracturing of asphalt concrete can be ignored [15].
However, some impervious asphalt concrete tends to dilatancy under the applied shear stress, thus increasing its voids content. This shear dilatancy has occurred in Finstertal ACRD with the behavior of the widening of its core wall during operation [19]. According to the numerical analysis of the Quxue ACRD, the shear dilatancy may also appear in the left upper zone of its core wall. Whether the hydraulic fracturing will occur under such shear dilatancy, no research result could be found in the references at present.
In this paper, a feasibility model test was first made to the dilatant asphalt concrete of Quxue ACRD with a 3.5% voids content. This confirmed the occurrence of hydraulic fracturing in the core wall under the action of local tensile stress and water pressure. Furthermore, detailed model tests under water pressure have been conducted to investigate the hydraulic fracturing of the asphalt concrete with different voids contents. Conclusions can be drawn as follows:
- (1)
- For asphalt concrete with a voids content not smaller than 3.4%, hydraulic fracturing will occur under the action of 0.13 MPa water pressure. The smaller the voids content, the longer it will take to hydraulic fracture.
- (2)
- For asphalt concrete with a voids content of 3.0%, hydraulic fracturing will not appear under 0.13 MPa water pressure. The test period lasted for 477 h without any sign of a hydraulic fracture. The threshold requirement of a 3% voids content to the impervious asphalt concrete may be confirmed to the concern of hydraulic fracturing.
- (3)
- Because the averaged stress of the ligament area of the specimen is smaller than its tensile strength during fracturing, the theory of fracture mechanics should be applied to explain the hydraulic fracture of the asphalt concrete with a 3.4%~4.0% voids content, which behaves during hydraulic fracturing like a quasi-brittle material, similar to a concrete with compressive strength of 56 MPa.
Based on the above test and numerical analysis results, the hydraulic fracturing of an asphalt concrete with a void content higher than 3.0% could be the result of a series of gradual fracturing. If this fracturing process could be hindered by a vertical compressive stress, even though it is smaller than the applied water pressure, the hydraulic fracturing would not happen as a result. This conjecture can be further verified by future studies.
Because the hydraulic fracturing could occur in the shear dilatant asphalt concrete, a proper and proportionate mix of asphalt concrete in a project with adverse stress state should be carefully designed to rule out the tendency of shear dilatancy.
Author Contributions
Funding Acquisition, J.H.; Conceptualization, J.H. and Z.W.; Methodology, Z.W.; Formal Analysis, J.Y.; Investigation, S.L.; Data Curation, X.L. and Y.C.; Writing, Z.W.
Funding
This research was funded by State Key Laboratory of Simulation and Regulation of Water Cycle in River Basin, grants number SM0112B242018, and was funded by China Institute of Water resource and Hydropower Research, grant number SM0145B442016 and SM0145B632017.
Acknowledgments
The authors would like to appreciate the anonymous reviewers for their constructive suggestions to improve the quality of the paper.
Conflicts of Interest
The authors declare no conflict of interest.
References
- Hao, J.; Cao, P.; Liu, Z.; Wang, Z. Developingof a SBS polymer modified bitumen to avoid low temperature cracks in the asphalt facing of a reservoir in a harsh climate region. Constr. Build. Mater. 2017, 150, 105–113. [Google Scholar] [CrossRef]
- Xia, S.F.; Lu, Y.H.; Wang, Z.X.; Zhang, F.C. Studies on the key technical problems of asphalt concrete facing slabs in upper reservoir of Huhhot Pump Storage. In Proceedings of the 4th International Conference on Concrete Repair, Rehabilitation and Retrofitting, Leipzig, Germany, 5–7 October 2015; pp. 540–545. [Google Scholar]
- Gandossi, L. An Overview of Hydraulic Fracturing and Other Formation Stimulation Technologies for Shale Gas Production; Institute for Energy and Transport, European Commission Joint Research Centre: Ispra, Italy, 2013. [Google Scholar]
- Zhao, Z.; Li, X.; Wang, Y.; Zheng, B. A Laboratory Study of the Effects of Interbeds on Hydraulic Fracture Propagation in Shale Formation. Energies 2016, 9, 556. [Google Scholar] [CrossRef]
- Khanna, R. Hydraulic Fracturing in Core of Earth and Rock-fill Dams. Int. J. Eng. Innov. Res. 2016, 5, 136–142. [Google Scholar]
- Teton Dam Failure Case Study. Summarized from Solava and Delatte, Lessons from the Failure of the Teton Dam. In Proceedings of the 3rd ASCE Forensics Congress, San Diego, CA, USA, 19–21 October 2003.
- Vallejo, S.A.N. Hydraulic Engineering Failure of Large Dams; Graz University of technology: Graz, Austria, 2016. [Google Scholar]
- Waters, R.D.; Crawford-Flett, K.; Stringer, M.; Haskell, J.J.M. Hydraulic Fracturing in Widely-Graded Dam Core Material; American Society of Civil Engineers: Reston, VA, USA, 2019. [Google Scholar]
- Wang, J.-J.; Zhu, J.-G.; Mroueh, H.; Chiu, C.F. Hydraulic fracturing of rock-fill dam. Int. J. Multiphysics 2007, 1, 199–219. [Google Scholar] [CrossRef]
- Ghanbari, A.; Rad, S.S. Development of an empirical criterion for predicting the hydraulic fracturing in the core of earth dams. Acta Geotech. 2015, 10, 243–254. [Google Scholar] [CrossRef]
- Wang, Y.; Jia, J. Experimental study on the influence of hydraulic fracturing on high concrete gravity dams. Eng. Struct. 2017, 132, 508–517. [Google Scholar] [CrossRef]
- Jaworski, G.W.; Duncan, J.M.; Seed, H.B. Laboratory study of hydraulic fracturing. J. Geotech. Eng. Div. Am. Soc. Civ. Eng. 1981, 1, 107. [Google Scholar]
- Sherard, J.L. Hydraulic fracturing in embankment dams. J. Geotech. Eng. ASCE 1986, 112, 905–927. [Google Scholar] [CrossRef]
- Bingyin, Z.; Na, L.; Quanming, L.; Xun, S. Mechanism and model test of hydraulic fracturing of earth-rock dams. Chin. J. Geotech. Eng. 2005, 27, 1277–1281. [Google Scholar]
- International Commission on Large Dams. Bituminous Cores for Fill Dams, State of the Art; Bulletin 84; International Commission on Large Dams: Paris, France, 1992. [Google Scholar]
- Rao, X.; Gong, B.; Ding, H.; Zhou, W. Experimental study on hydraulic concrete splitting of asphalt concrete. Practice and development of geotechnical testing technology. In Proceedings of the 24th National Geotechnical Testing Symposium, ZhengZhou, China, 13 October 2005; pp. 141–145. [Google Scholar]
- Zhang, Y.; Wang, W.; Zhu, Y. Investigation on conditions of hydraulic fracturing for asphalt concrete used as impervious core in dams. Constr. Build. Mater. 2015, 93, 775–781. [Google Scholar] [CrossRef]
- Hoeg, K. Asphaltic Concrete Cores for Embankment Dams; Norwegian Geotechnical Institute: Oslo, Norway, 1993. [Google Scholar]
- Pircher, W.; Schwab, H. Design, Construction and Behaviour of the Asphaltic Concrete Core Wall on the Finstertal Dam. In Proceedings of the Sixteenth Congress on Large Dams, San Francisco, CA, USA, 13–17 June 1988; pp. 901–923. [Google Scholar]
- Chehab, G.R. Characterization of Asphalt Concrete in Tension Using a Viscoelastic Plastic Model. Ph.D. Thesis, North Carolina State University, Raleigh, NC, USA, 2002. [Google Scholar]
- Anderson, T.L. Fracture Mechanics Fundamentals and Applications; Taylor & Francis Group, LLC: Didcot, UK, 2005. [Google Scholar]
Figure 1.
Model device of hydraulic fracture feasibility test.

Figure 2.
Relation between the voids content and preparation temperature.

Figure 3.
Volume process of injected water of stage one.

Figure 4.
Volume process of injected water of stage two.

Figure 5.
Volume process of injected water of stage three (Water pressure 0.13 MPa, tensile stress 0.06 MPa).
Figure 5.
Volume process of injected water of stage three (Water pressure 0.13 MPa, tensile stress 0.06 MPa).

Figure 6.
Specimen after test.

Figure 7.
Cross-section of the model test device with pressure sensor.

Figure 8.
Test process for a specimen with a voids content of 3.4%.

Figure 9.
Test process for the specimen with a voids content of 3.5%.

Figure 10.
Fracture appearance of remains on the bottom steel plate.

Figure 11.
Test process for the specimen with a voids content of 4.0%.

Figure 12.
Test process of the specimen with a voids content of 5.2%.

Figure 13.
Test process of the specimen with voids a content of 3.0%.

Figure 14.
Relationship between the critical force and voids content.

Figure 15.
Relationship between the critical time and voids content.

Figure 16.
Strength master curve [20].
Figure 16.
Strength master curve [20].

Figure 17.
Fitting curve of strength and strain rate.

Figure 18.
The finite element model.

Figure 19.
Relationships between crack disc diameter, stress intensity factor (SIF), and reaction force.
Figure 19.
Relationships between crack disc diameter, stress intensity factor (SIF), and reaction force.


Table 1.
Mix ratio of asphalt concrete in the test.
| Sieve Size (mm) | 19 | 16 | 13.2 | 9.5 | 4.75 | 2.36 | 1.18 | 0.6 | 0.3 | 0.15 | 0.075 | Bitumen Content/% |
|---|---|---|---|---|---|---|---|---|---|---|---|---|
| Passing rate (%) | 100 | 93.7 | 87.2 | 77.1 | 59.4 | 45.8 | 39.1 | 28.9 | 20.8 | 17.4 | 13 | 7.5 |
Table 2.
Stage test parameters of the model test.
| Stage 1 | Stage 2 | Stage 3 | Stage 4 | |
|---|---|---|---|---|
| Tensile stress (MPa) | 0 | 0 | 0.06 | 0.12 |
| Water pressure (MPa) | 0.05 | 0.13 | 0.13 | 0.13 |
| Temperature (°C) | 14.6 | 14.6 | 14.6 | 14.6 |
Table 3.
The relationship between the critical fracturing time, the critical fracturing pressure, and the voids content of the specimen.
Table 3.
The relationship between the critical fracturing time, the critical fracturing pressure, and the voids content of the specimen.
| Voids Content/% | Critical Force/N | Critical Time/h | Failure Time/h |
|---|---|---|---|
| 3.0 | (477 h, no fracture) | ||
| 3.4 | 131 | 77.7 | 104 |
| 3.5 | 152 | 0.56 (outlier) | 3.4 |
| 4 | 93 | 43.3 | 56.9 |
| 5.2 | 0 | 0 | 1.8 |
Table 4.
Result of tensile test (voids content of 3.5%).
| Strain Rates/1/min | Tensile Strength/MPa |
|---|---|
| 0.01 | 0.4708 |
| 0.001 | 0.3318 |
| 0.0005 | 0.1597 |
| 0.0001 | 0.1563 |
Table 5.
Result of numerical analysis by Finite Element Method.
| Crack Disc Diameter/mm | KI/MPa·m1/2 | Reaction Force F/N | Averaged Stress of Ligament Area/MPa |
|---|---|---|---|
| 30 | 0.0225 | 15.8 | 0.011 |
| 40 | 0.0250 | 31.2 | 0.020 |
| 50 | 0.0291 | 56.6 | 0.034 |
| 60 | 0.0316 | 96.4 | 0.054 |
| 65 | 0.0348 | 122.2 | 0.068 |
| 70 | 0.0357 | 153 | 0.089 |
Table 6.
Plastic zone radius R of different materials.
| Material | σt/MPa | KIC/MPa⋅m1/2 | R/mm |
|---|---|---|---|
| High-strength steel-12Ni [21] | 1500 | 142 | 1 |
| No.45 forging steel | 299 | 89.6 | 10 |
| Concrete (compressive strength of 56 MPa) | 3.65 | 0.803 | 5 |
| Asphalt concrete of this paper | 0.156 | 0.032~0.034 | 4.6~5.3 |
Table 7.
Mechanical parameters of the model test.
| Voids Conten/% | Critical Force/N | Crack Disc Diameter/mm | KIC/MPa·m1/2 | Averaged Stress of Ligament Area/MPa | Plastic Zone Radius/mm |
|---|---|---|---|---|---|
| 3.4 | 131 | 66.7 | 0.0344 | 0.074 | 5.33 |
| 4.0 | 93 | 58.8 | 0.0321 | 0.051 | 4.64 |
© 2019 by the authors. Licensee MDPI, Basel, Switzerland. This article is an open access article distributed under the terms and conditions of the Creative Commons Attribution (CC BY) license (http://creativecommons.org/licenses/by/4.0/).
Share and Cite
MDPI and ACS Style
Wang, Z.; Hao, J.; Yang, J.; Cao, Y.; Li, X.; Liu, S. Experimental Study on Hydraulic Fracturing of High Asphalt Concrete Core Rock-Fill Dam. Appl. Sci. 2019, 9, 2285. https://0-doi-org.brum.beds.ac.uk/10.3390/app9112285
AMA Style
Wang Z, Hao J, Yang J, Cao Y, Li X, Liu S. Experimental Study on Hydraulic Fracturing of High Asphalt Concrete Core Rock-Fill Dam. Applied Sciences. 2019; 9(11):2285. https://0-doi-org.brum.beds.ac.uk/10.3390/app9112285
Chicago/Turabian StyleWang, Zhengxing, Jutao Hao, Jian Yang, Yan Cao, Xiulin Li, and Shijia Liu. 2019. "Experimental Study on Hydraulic Fracturing of High Asphalt Concrete Core Rock-Fill Dam" Applied Sciences 9, no. 11: 2285. https://0-doi-org.brum.beds.ac.uk/10.3390/app9112285
Note that from the first issue of 2016, this journal uses article numbers instead of page numbers. See further details here.