1. Introduction
Biochar is charcoal produced by burning biomass under controlled temperature and oxygen conditions, mainly for the purpose of soil amendment [
1,
2,
3,
4]. As a porous material with active functional groups, high pH and cation exchange capacity [
5], biochar can serve as a natural pool of organic carbon and plant nutrient in the soil [
6,
7,
8]. There is a widespread interest in biochar research because of its rediscovered potential to mitigate climate change, amend soils and increase crop productivity [
9,
10]. However, this potential is strongly influenced by biochar production (temperature, oxygen supply, etc.), application (rate, mode, time, soil type, etc.) and feedstock (plant, animal, domestic waste, etc.) conditions [
11,
12,
13,
14,
15].
The highly fertile dark earths (the so-called
terra preta) left behind centuries ago by the prehistoric Amerindians are characteristically rich in carbon [
16,
17,
18]. The origin of the rich dark earths is traced to as far back as 1542 when Orellana first reported to the Spanish Court on the well-established networks of agricultural settlements along a tributary of the Amazon River [
19,
20]. Unlike the predominantly
terra mulata (brown earths), which is the natural soil in the Amazon,
terra preta dark earths is anthropogenic or anthropic creation of humans [
20,
21,
22]. Typically,
terra preta has three or more times total soil organic carbon and far more phosphorus, calcium and humus than the surrounding
terra mulata brown soils. The Amazonian
terra preta has remained highly fertile centuries after its formation.
In addition to the potential to sequester carbon, the porous structure, large surface area, and high particle charge of biochar [
23] interact with the soil [
24,
25,
26] that results in beneficial effects on the ecosystem [
27]. Among the countless benefits of the use of biochar are enhanced plant growth [
28], improved soil water-holding capacity [
29], reduced crop diseases [
30], limited bioavailability of heavy metals [
31], reduced soil nitrogen oxide emission [
32], and reduced leaching of nutrients and fertilizers [
29]. Schmidt et al. [
33] and Schmidt [
34] have documented a more exhaustive list of the beneficial uses of biochar. Biochar is hailed as an all-win solution to global energy, food, and environmental challenges [
11].
In the tropics where soil fertility is depleted soon after cultivation in the predominantly slash-burn shifting cultivation [
8,
20,
35], there is the need to switch to slash-char sedentary farming for sustainable crop production [
32,
36]. Slash-burn shifting cultivation destroys up to 97% of soil organic carbon as against less than 50% under slash-char farming, of which most is retained as highly stable organic carbon [
16,
24]. With an average residence time of over 1000 years [
37], biochar can sustain crop productivity for as long as it remains active in the soil [
38].
In a meta-analysis including 116 studies from 21 countries around the world, Liu et al. [
39] noted that biochar increases crop productivity by 11% on average. In another meta-analysis including 371 independent studies, Biederman and Harpole [
40] noted considerable variations in the degree of enhancement of crop yield components and soil properties. Biochar application rates below 30 tons/ha typically result in 30% more productivity of legume and 29% more of vegetable crops than of cereal crops such as corn (8%) and rice (7%) [
38,
40]. Studies, including literature data analyses, also show that biochar application rates above 55 tons/ha can lead to reductions in crop productivity [
16,
40].
The
terra preta soil, which has so much reignited biochar research, occurs in varying depths and rates across the Amazon [
20]. This forms the basis for investigation of the variations in soil/crop response to biochar application rates in terms of biochar–soil mixture, activation mode and/or application depth. In this study, a field experiment was conducted to determine the effect of biochar application depth on rice crop productivity under tropical rainfed conditions. The results of the study will add to the efforts in understanding the potential of biochar to sustainable crop production, improve soil properties and mitigate global climate change.
2. Materials and Methods
2.1. Study Area
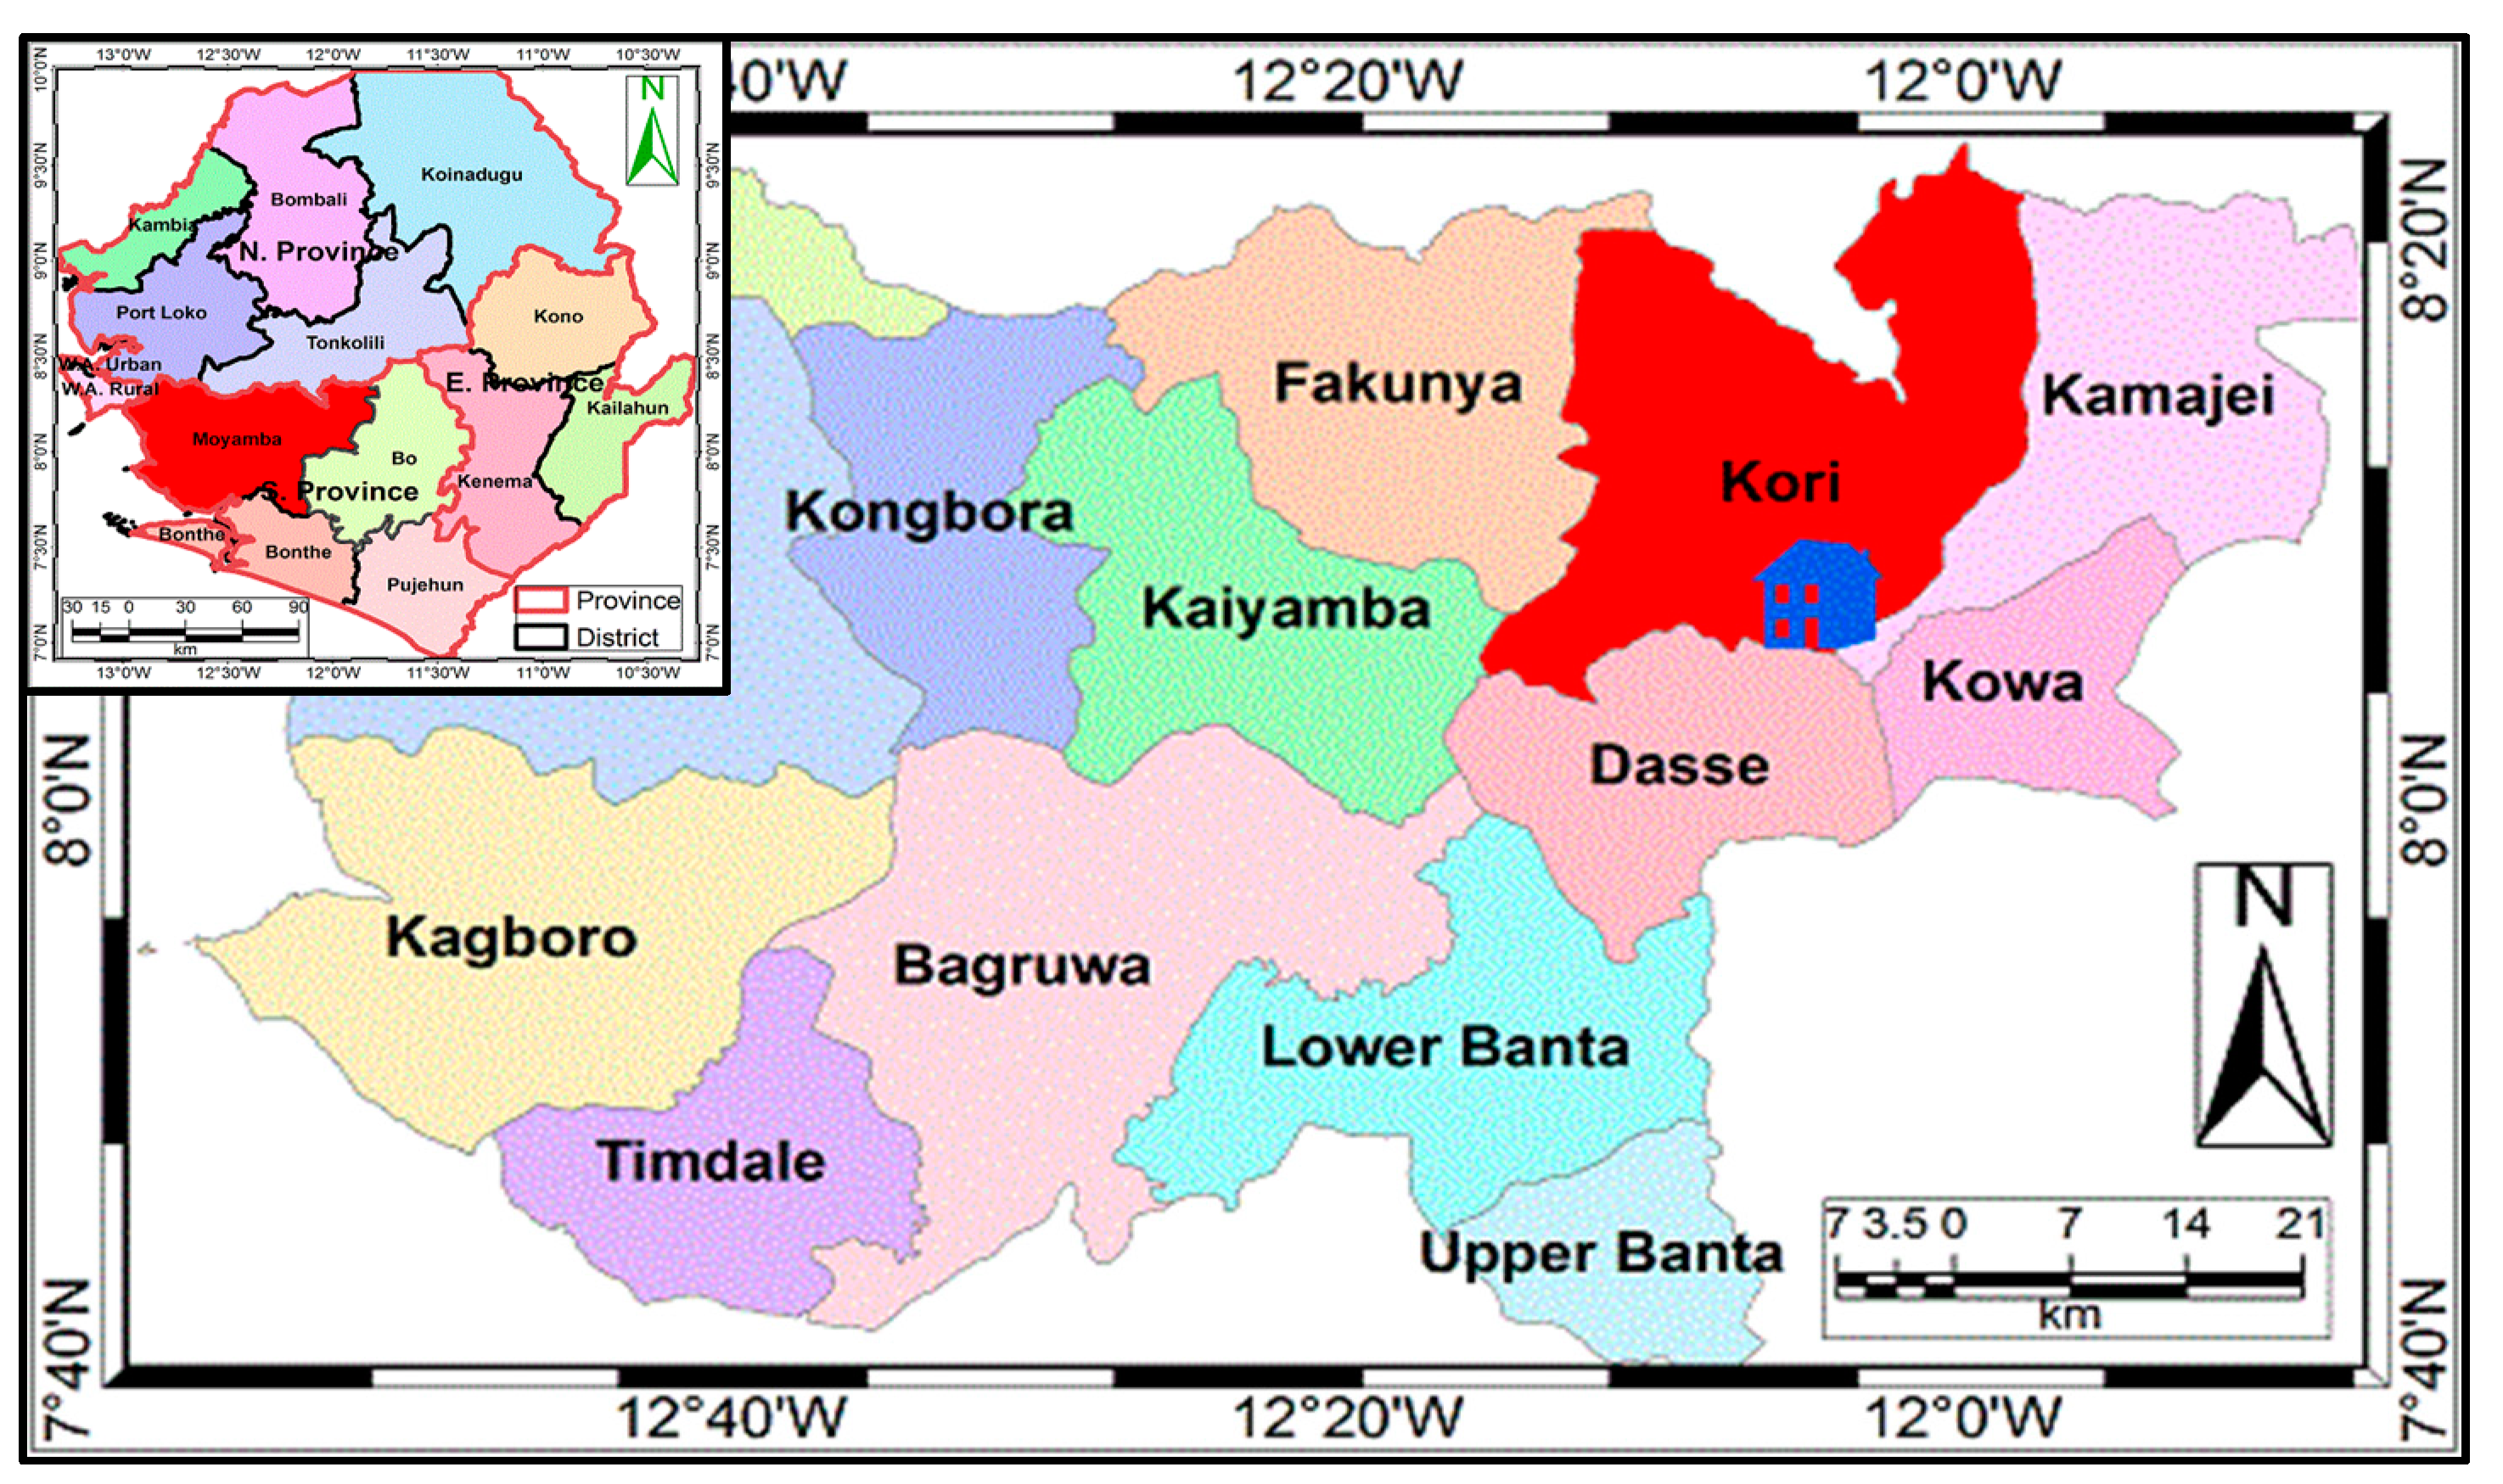
This study was conducted at the experimental site at the Department of Agricultural Engineering, Njala University. The site is located at 012.07762° W, 08.10958° N and is 80 m +MSL (above mean sea level); which is in Kori Chiefdom in the southern province of Sierra Leone (
Figure 1). The study area has a typical tropical climate, with gravelly brown soil and shrub vegetation [
32,
41].
Here, there are two distinct seasons—the wet season (WS) and dry season (DS). The WS (May to Oct.) is characterized by cloudiness, heavy rains, and by low temperatures, solar radiation, photoperiod, and sunshine hours, but high humidity. In the DS (Nov. to Apr.), the climatic condition is the near-reverse of that of the WS. The unimodal average annual rainfall is 2526 mm and the temperature is 31 °C. While over 80% of the rain falls in the WS, solar radiation is highest in March (604 MJ/m2/day).
The soils at the experimental site are typical Oxisols and Ultisols and therefore generally slightly acidic [
42], but nonetheless good for rice cultivation. Biochar is reported to have pH range of 10–12 [
43] and therefore suitable for application in such soils.
2.2. Biochar Preparation
The wood biomass used in the biochar production was a random collection in the bush nearby (1–2 km) the experimental site. The random wood mix was as much as possible similar to the normal conditions under which charcoal is unintentionally added to the soil under the conventional slash-burn shifting cultivation practiced in the region [
35]. The dry wood biomass was fed into a locally-built Elsa Stove (retort kiln) of 55 cm in diameter and 90 cm in height and allowed to burn at 350–550 °C under low oxygen condition [
32]. The pyrolyzed wood biomass (called biochar) was then collected, ground into fine dust and stored for later application in the field.
2.3. Site Preparation
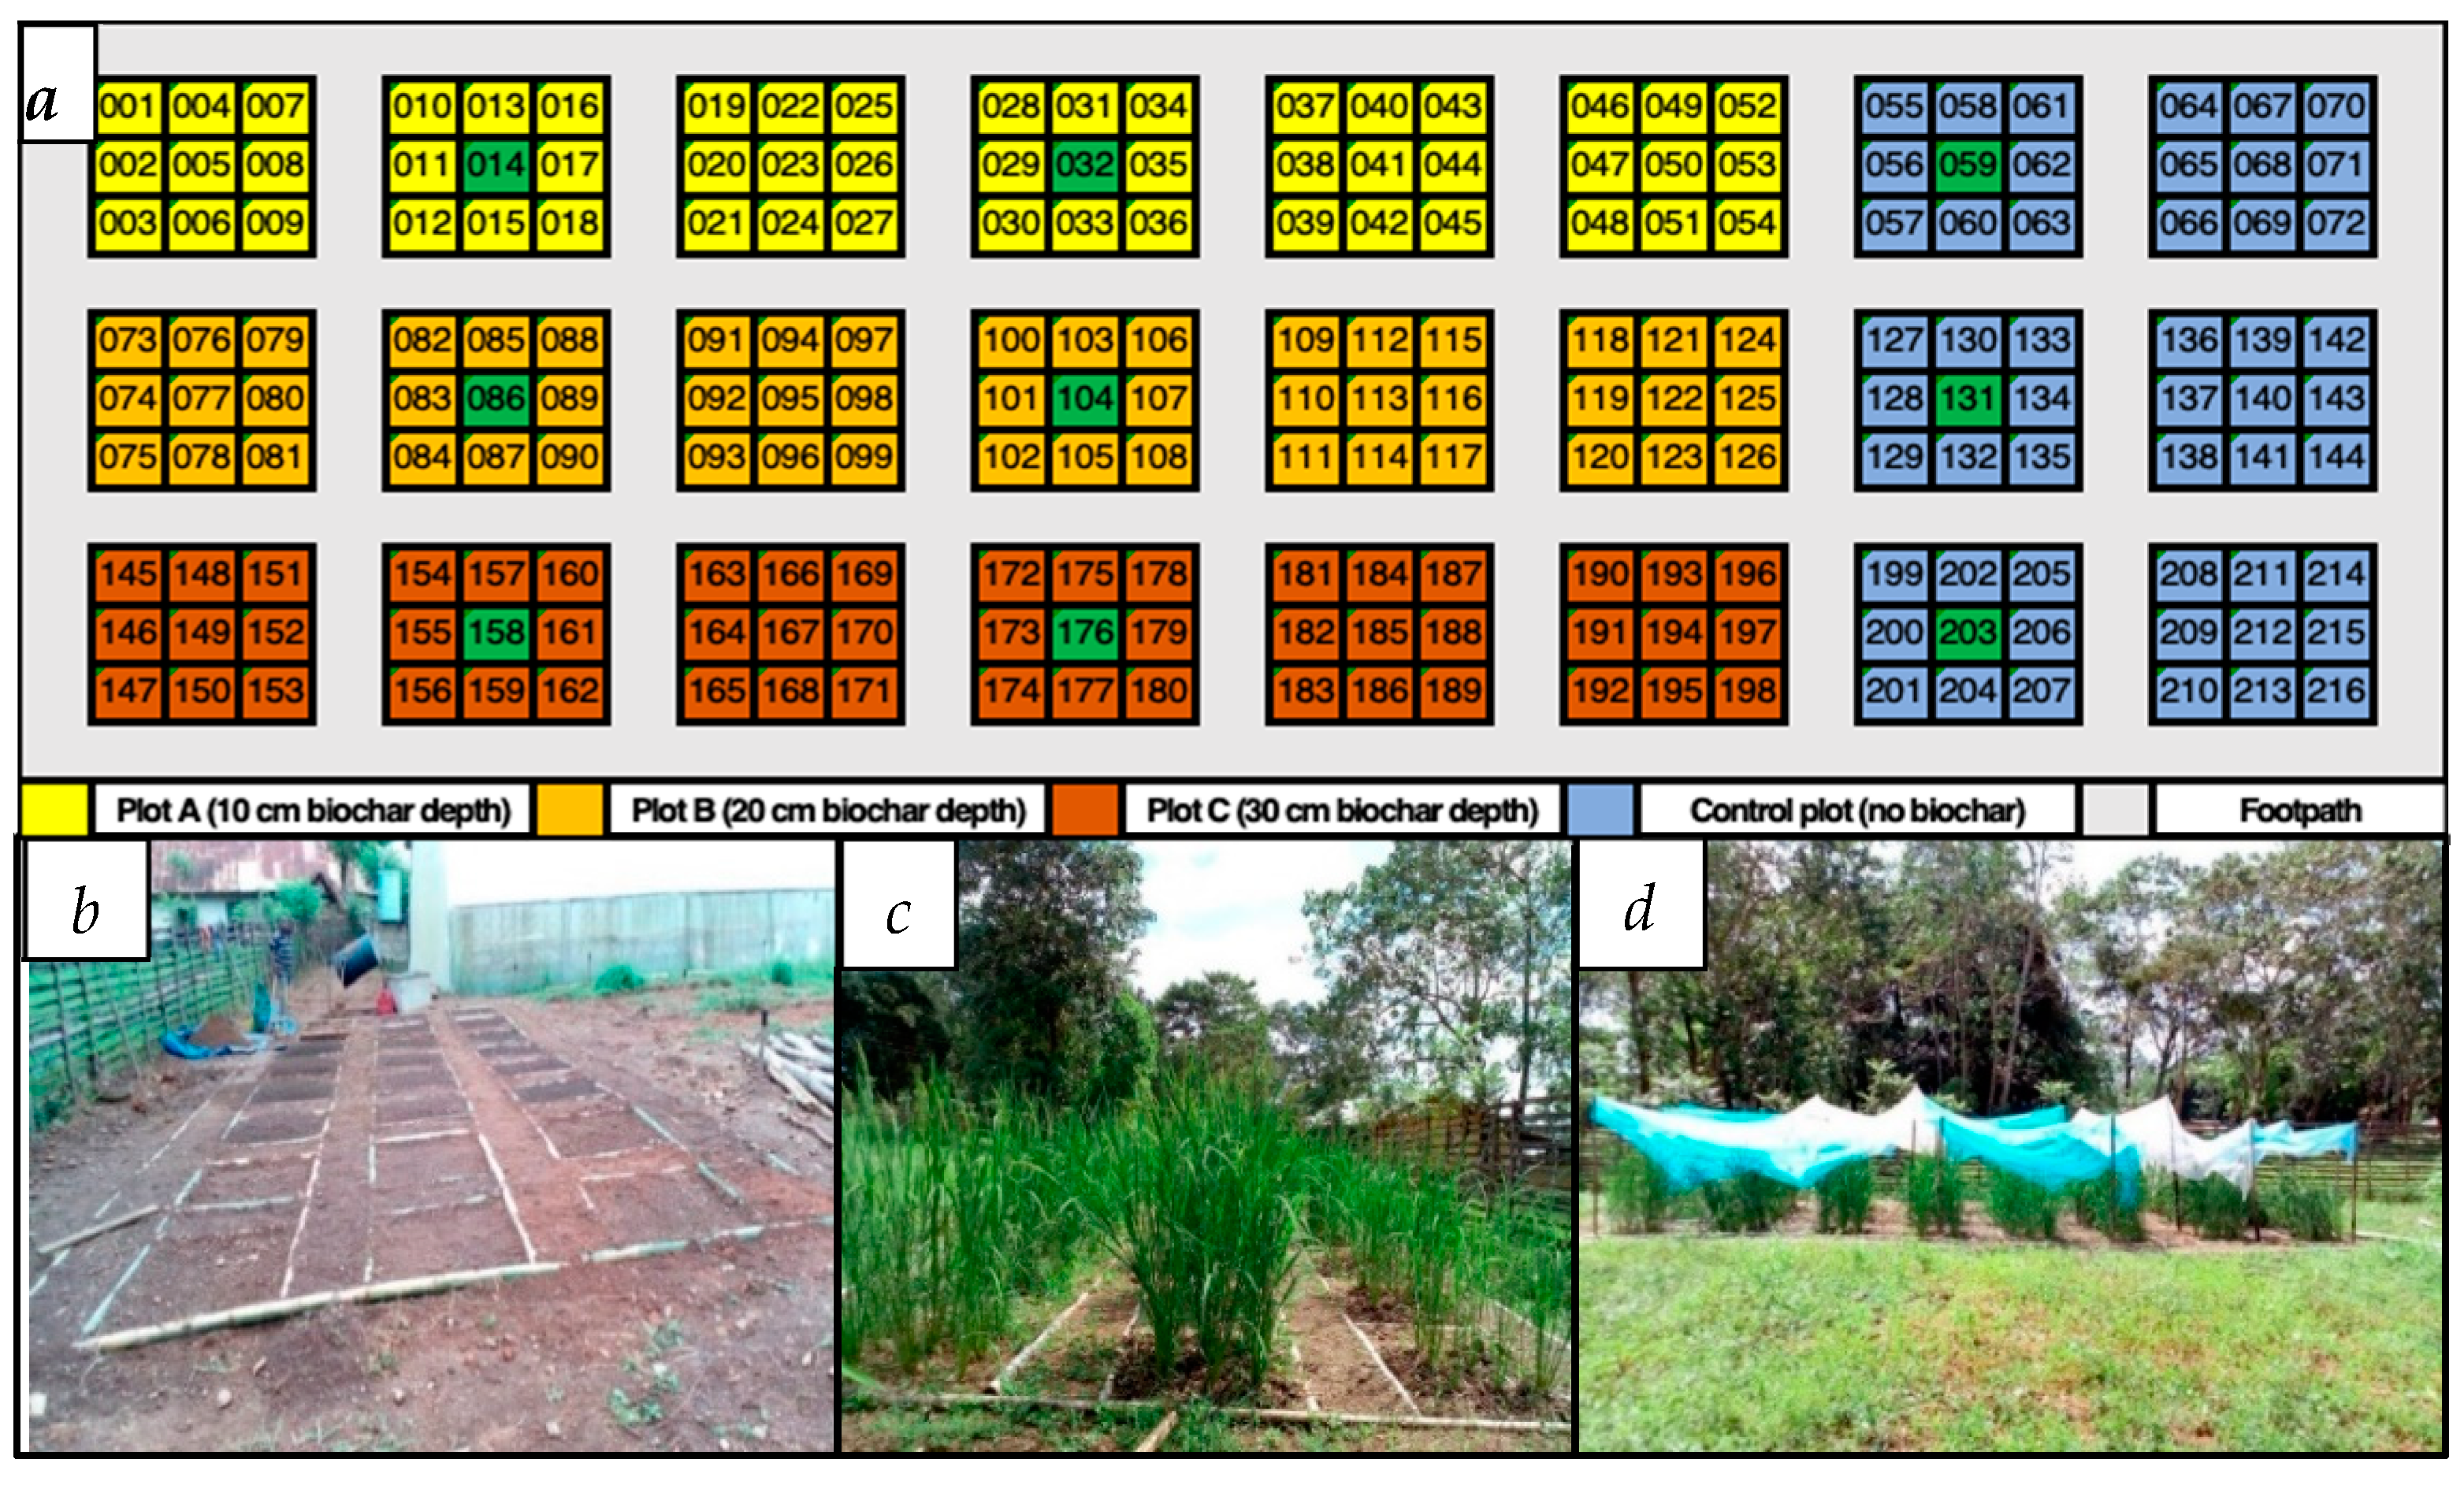
The experimental site was cleared and leveled in July 2016 using simple farm tools including machete, hoe and shovel. A total of 24 plots (each 1.0 m × 1.0 m with 0.5 m footpath) were constructed and separated out by bamboo canes to prevent flow of water, soil and nutrient across the plots (
Figure 2). Also, a drainage was constructed around the entire field site to prevent runoff on to the plots. The dimension of the experimental field site was 12.5 m × 5.0 m (length by width), with a total area of 62.5 m
2.
2.4. Biochar-Soil Mixture and Depth Application
In a previous experiment involving biochar treatment of the same soil, the 1:20 (5%) biochar–soil ratio had the best effect on rice yield [
32]. Thus in this study, the 5% biochar–soil ratio (by volume) was used for three different application depths: 0‒10 cm (TA), 0‒20 cm (TB), and 0‒30 cm (TC). These depths were used because rice root hardly penetrates beyond 30 cm in the soil. Also the plow depth and depth of application of fertilizers or organic manure are mostly within this depth range.
For TA, the soil in the 1.0 m × 1.0 m plot was dug out to the depth of 0.1 m; i.e., a soil volume of 0.1 m
3. The dug-out 0.1 m
3 of soil was mixed with 0.005 m
3 of biochar dust to have the 5% (1:20) biochar–soil mixture. The process was repeated for TB, where 0.2 m
3 of soil dug out from the pit was mixed with 0.010 m
3 biochar dust to have 5% (1:20) biochar–soil ratio. It was again repeated for TC, where 0.3 m
3 of soil dug out from the pit was mixed with 0.015 m
3 of biochar dust to get 1:20 (5%) biochar–soil ratio. No biochar was used in the control treatment (CK). Each treatment was replicated 6 times to get a total of 24 treatment plots and each plot planted in 9 hills of rice (a total of 216 hills). This meant that the study was a 1 × 3 factorial treatment (with one biochar–soil mixture applied in three depth variations) for a total of 3 treatments and then the control (
Figure 2a).
2.5. Agronomic Practices
New Rice for Africa (NERICA) is a cultivar group of interspecific hybrid rice developed from the African
Oryza glaberrima (high biomass) and Asian
Oryza sativa (high yield) varieties by the Africa Rice Center (WARDA) to improve the yield of African rice cultivars. NERICA-4 rice cultivar is a high-tillering and high-yielding upland rice hybrid. Its strong vigor at seedling and vegetative stages with moderate tillering, intermediate height, high water logging resistance, and short duration (120 days) helps to successfully suppress weed. The seed rice was manually planted at equal row and column spacing of 25 cm and planting depth of 2 cm (
Figure 2b). The experiment was done under rainfed conditions and therefore irrigation was not at any point considered in the study. The seed rice was planted on the 21st of July 2016 at 16:00 pm (Sierra Leone local time) and at a seeding rate of 4 seeds per hill and planting density of 9 hills per plot for each of the 24 plots. Then 4 weeks after planting, an organic growth booster (trade named D. I. Grow Fertilizer with N1.85%:P1.85%:K3.31% + Te) and the insecticide (Lara Force) were applied on the rice seedlings to boost growth and prevent pest infestation. The growth-booster fertilizer and pesticide treatments were repeated in the 6th and 8th weeks after planting.
Hand weeding was done at the end of the 5th week and then tinning done to one seedling per hill in the 6th week. During thinning, only the most vigorous seedling was retained in each hill. Then NPK (15:15:15) fertilizer was applied in the row method, followed by mulching with grass straw. Because the experiment was conducted under rainfed condition, mulching moderated soil water loss through evaporation, suppressed weed growth, and prevented soil hardening and cracking during intermittent spells of no rainfall. Also fertilizers were applied to further boost the generally porous and poor soil for good crop growth, especially for the control treatment. The pesticide was also used to prevent pest damage because pests extremely strive under hot, humid tropical conditions.
Booting started at the end of the 9th week, followed by heading at the end of the 10th week (
Figure 2c). During milking, the entire rice field was covered with mosquito tent (knitted together) by hooking it over bamboo cane poles to prevent bird damage and grain loss (
Figure 2d). The rice was not ready for harvest until the end of the 14th week, probably due the cloudy and raining weather conditions.
At harvest, the panicle was first cut at the sheath point of the last leaf using penknife. Then the remaining rice stalk was uprooted from the soil for further treatment (including measurement of the various parameters).
2.6. Data Collection
Data were collected for various growth and yield parameters of the Nerica-4 rice plant, including both belowground (root length and weight) and aboveground (shoot height and weight, tiller number, panicle length, and grain weight) parameters. All the variables were measured at hill-scale. Soil moisture was gravimetrically measured at harvest, with samples taken from 2 plots per treatment, except for the control treatment where 3 plots were used (
Figure 2a).
For crop height, measurements started at the end of the 4th week (using a graduated PVC box pipe) and repeated every 2 weeks until harvest at the end of the 14th week (which was on 4th November 2016). Tiller number count started at the end of the 6th week and also repeated every 2 weeks until harvest. With tillering, only the height of the tallest tiller in a hill was recorded. For the measurement involving weight, both fresh and dry weights were taken after harvest, although only dry weight was presented in this work. Again the data were taken at hill scale and since there was a large number of treatment hills (216 hills), samples were taken from the weighed fresh variables for dry weighing. The samples were tagged serially from 001 to 216, corresponding to the hill sequence in
Figure 2a. The samples (of root, stem, panicle and grain) were again weighed fresh, oven-dried at 105 °C for 92 h (to a constant weight) and then reweighed to get the dry weight. Then the per-hill dry weight was calculated (by wet weight) from the sample as:
where
is variable dry weight per hill [g];
is sample dry weight [g];
is sample fresh weight [g]; and
is variable fresh weight per hill [g].
2.7. Data Analysis
The results were reported as mean and standard deviations (SD) of the variables. For statistical analysis, the data were first screened using the Dixon Outlier Test [
44] and all outliers removed before processing for the mean and SD [
45]. The SPSS (Statistical Package for Social Sciences) software, now renamed PASW (Predictive Analytics SoftWare), was used to analyze the data. The PASW software has powerful and efficient focal statistics and a wide global application [
46].
Two-way analysis of variance (ANOVA) along with Student–Newman–Keuls (SNK) tests were conducted to isolate treatment (biochar depth) effects on crop productivity at the 99% (
p = 0.01) confidence level [
47,
48]. ANOVA F-statistic was used to measure variations within samples and ANOVA
p-value to test the significance of the independent on the dependent variables. SNK, a stepwise multi-comparison procedure, was used to identify sample means with significant differences [
49]. Furthermore, the interdependence of the crop parameters (grain yield against biomass yield, plant height against tiller number, tillers with panicle against tillers without panicle, etc.) was tested using regression analysis and the equations and determination coefficients (
R2) shown on the plots. Also a table was dedicated to the correlativity of the variables.
3. Results and Analysis
3.1. Crop Tiller and Length Dynamics
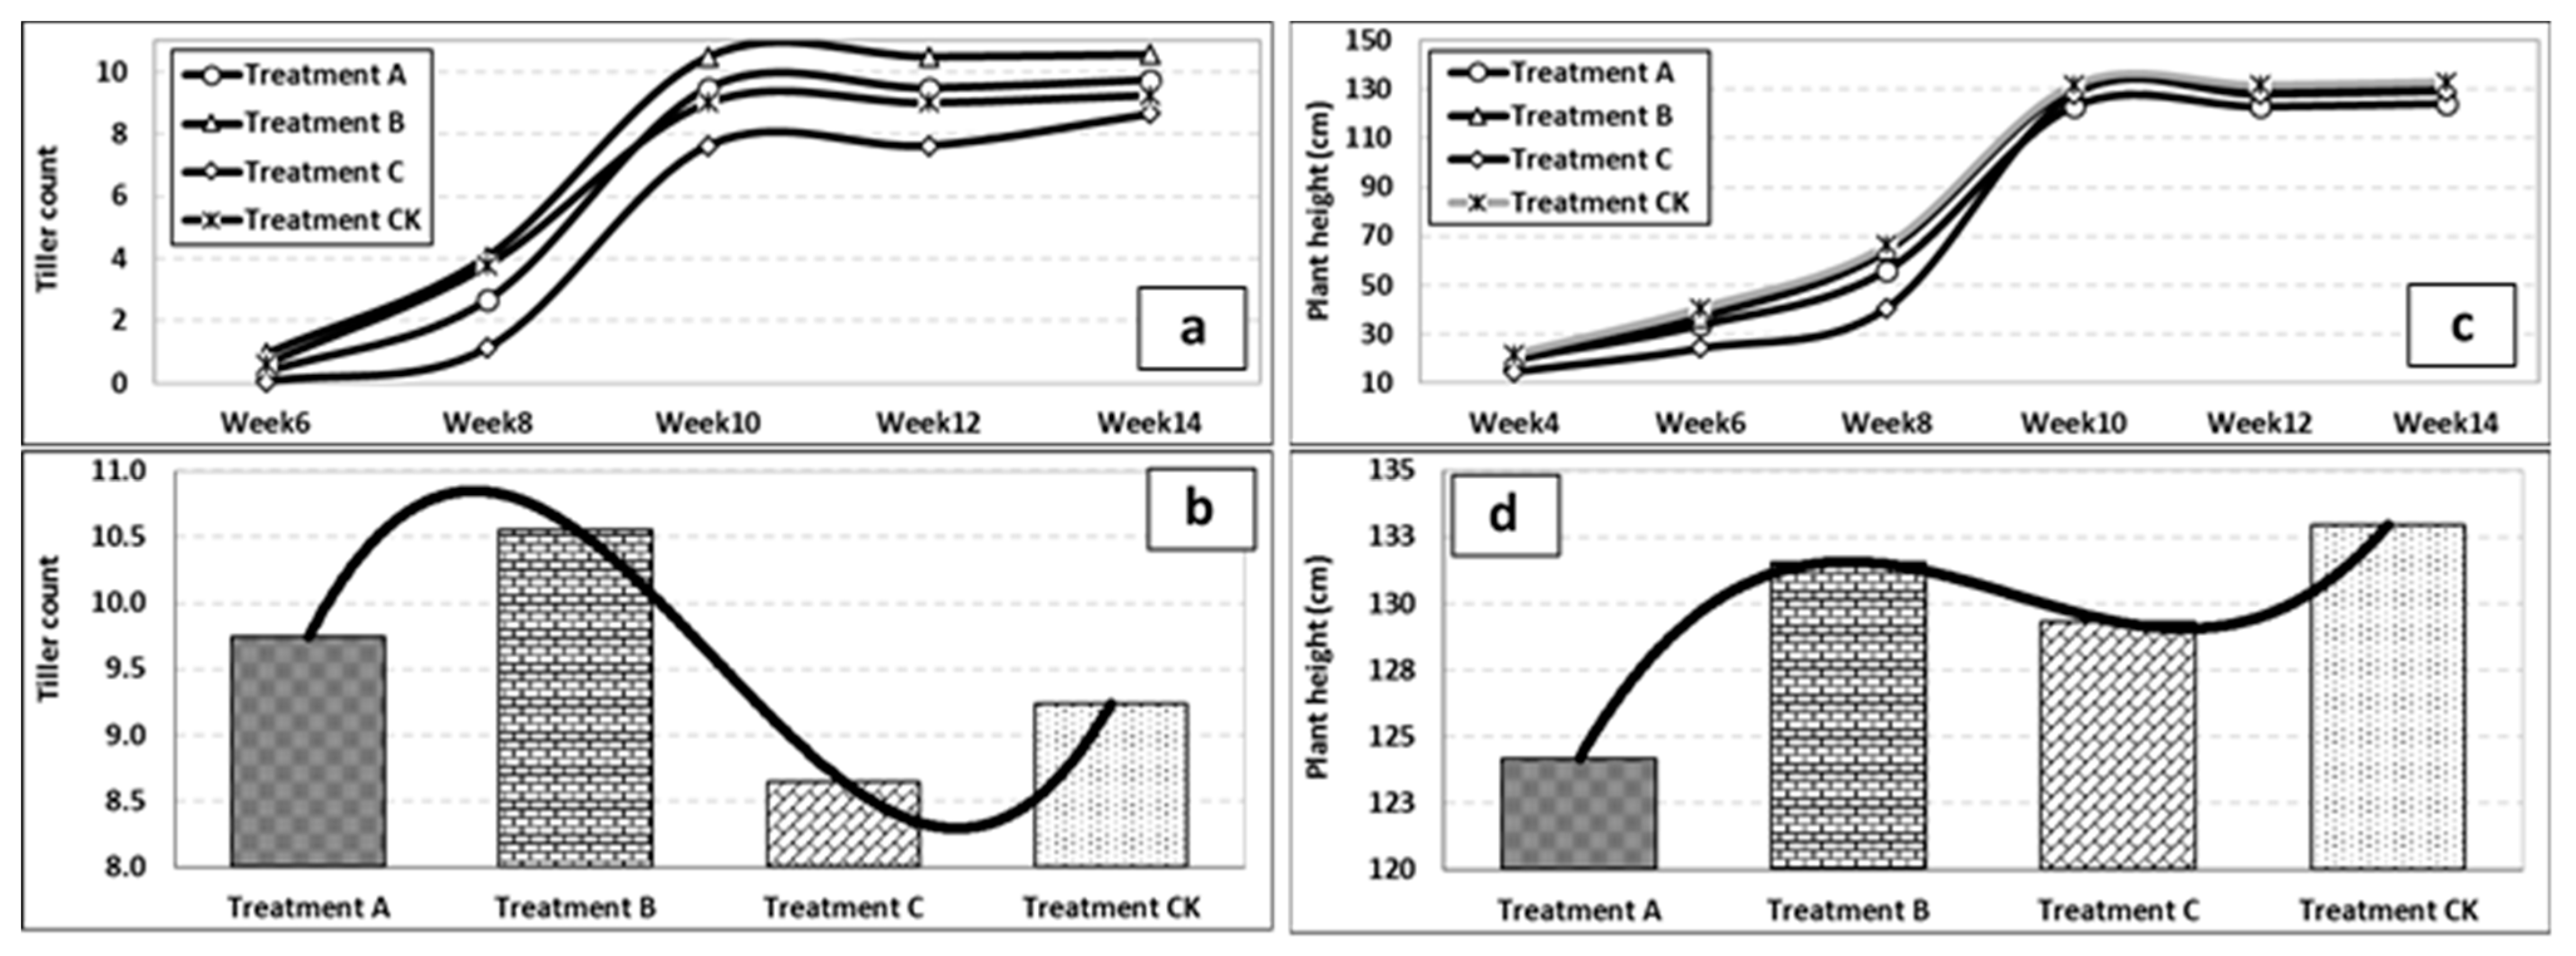
Tiller count started at the end of the 6th week and was repeated every 2 weeks until the 14th week, which was the week of harvest. As in
Figure 3a, the number of tillers increased with time from week 6 to week 10, after which it dropped. The number of tillers per hill was highest for TB (average of 10.56 tillers/hill), followed by TA, CK, and then TC treatment, in that order (
Figure 3b). The average rate of tillering for all the treatments was 0.17 tillers/day, which was also highest for TB (0.19 tillers/day) and lowest for TC (0.15 tillers/day). Based on ANOVA and 2-tailed T-test analysis at
p = 0.05 confidence level, there was significant correlation (
r > 0.97) between every paired combinations of the treatments but with significant difference, except for TA and CK. Generally, NERICA rice can grow 7‒26 tillers per plant. Specifically, NERICA-4 (which is an upland rice cultivar) grown under rainfed conditions can produce an average of 12 tillers per plant [
32,
50]. The number of tillers in this study was 3‒27, with an average of 10 tillers per plant.
The length of the NERICA-4 rice plant was measured along with that of the yield components, including root, shoot and panicle.
Figure 3c plots the measured plant growth from the 4th to the 14th week after planting. Similar to tillering, growth was rapid until the 10th week and almost stagnated until the 14th week. Unlike tillering, however, growth was strongest in CK (132.96 cm), followed by TB (131.56 cm), TC (129.30 cm) and then TA (124.19 cm) in that order (
Figure 3d). The average height of the NERICA-4 rice cultivar is 120 cm [
50], meaning the performance of the rice in terms of height was above average. The average growth rate was 1.85 cm/day and all the treatments strongly correlated (
r > 0.99), but significantly different at the 0.05 confidence level (2-tailed T-test); except for TA/TC and TB/TC. From the plots on tiller number and plant height, it was not exactly clear that biochar application depth significantly improved the productivity of the rice crop under tropical rainfed conditions.
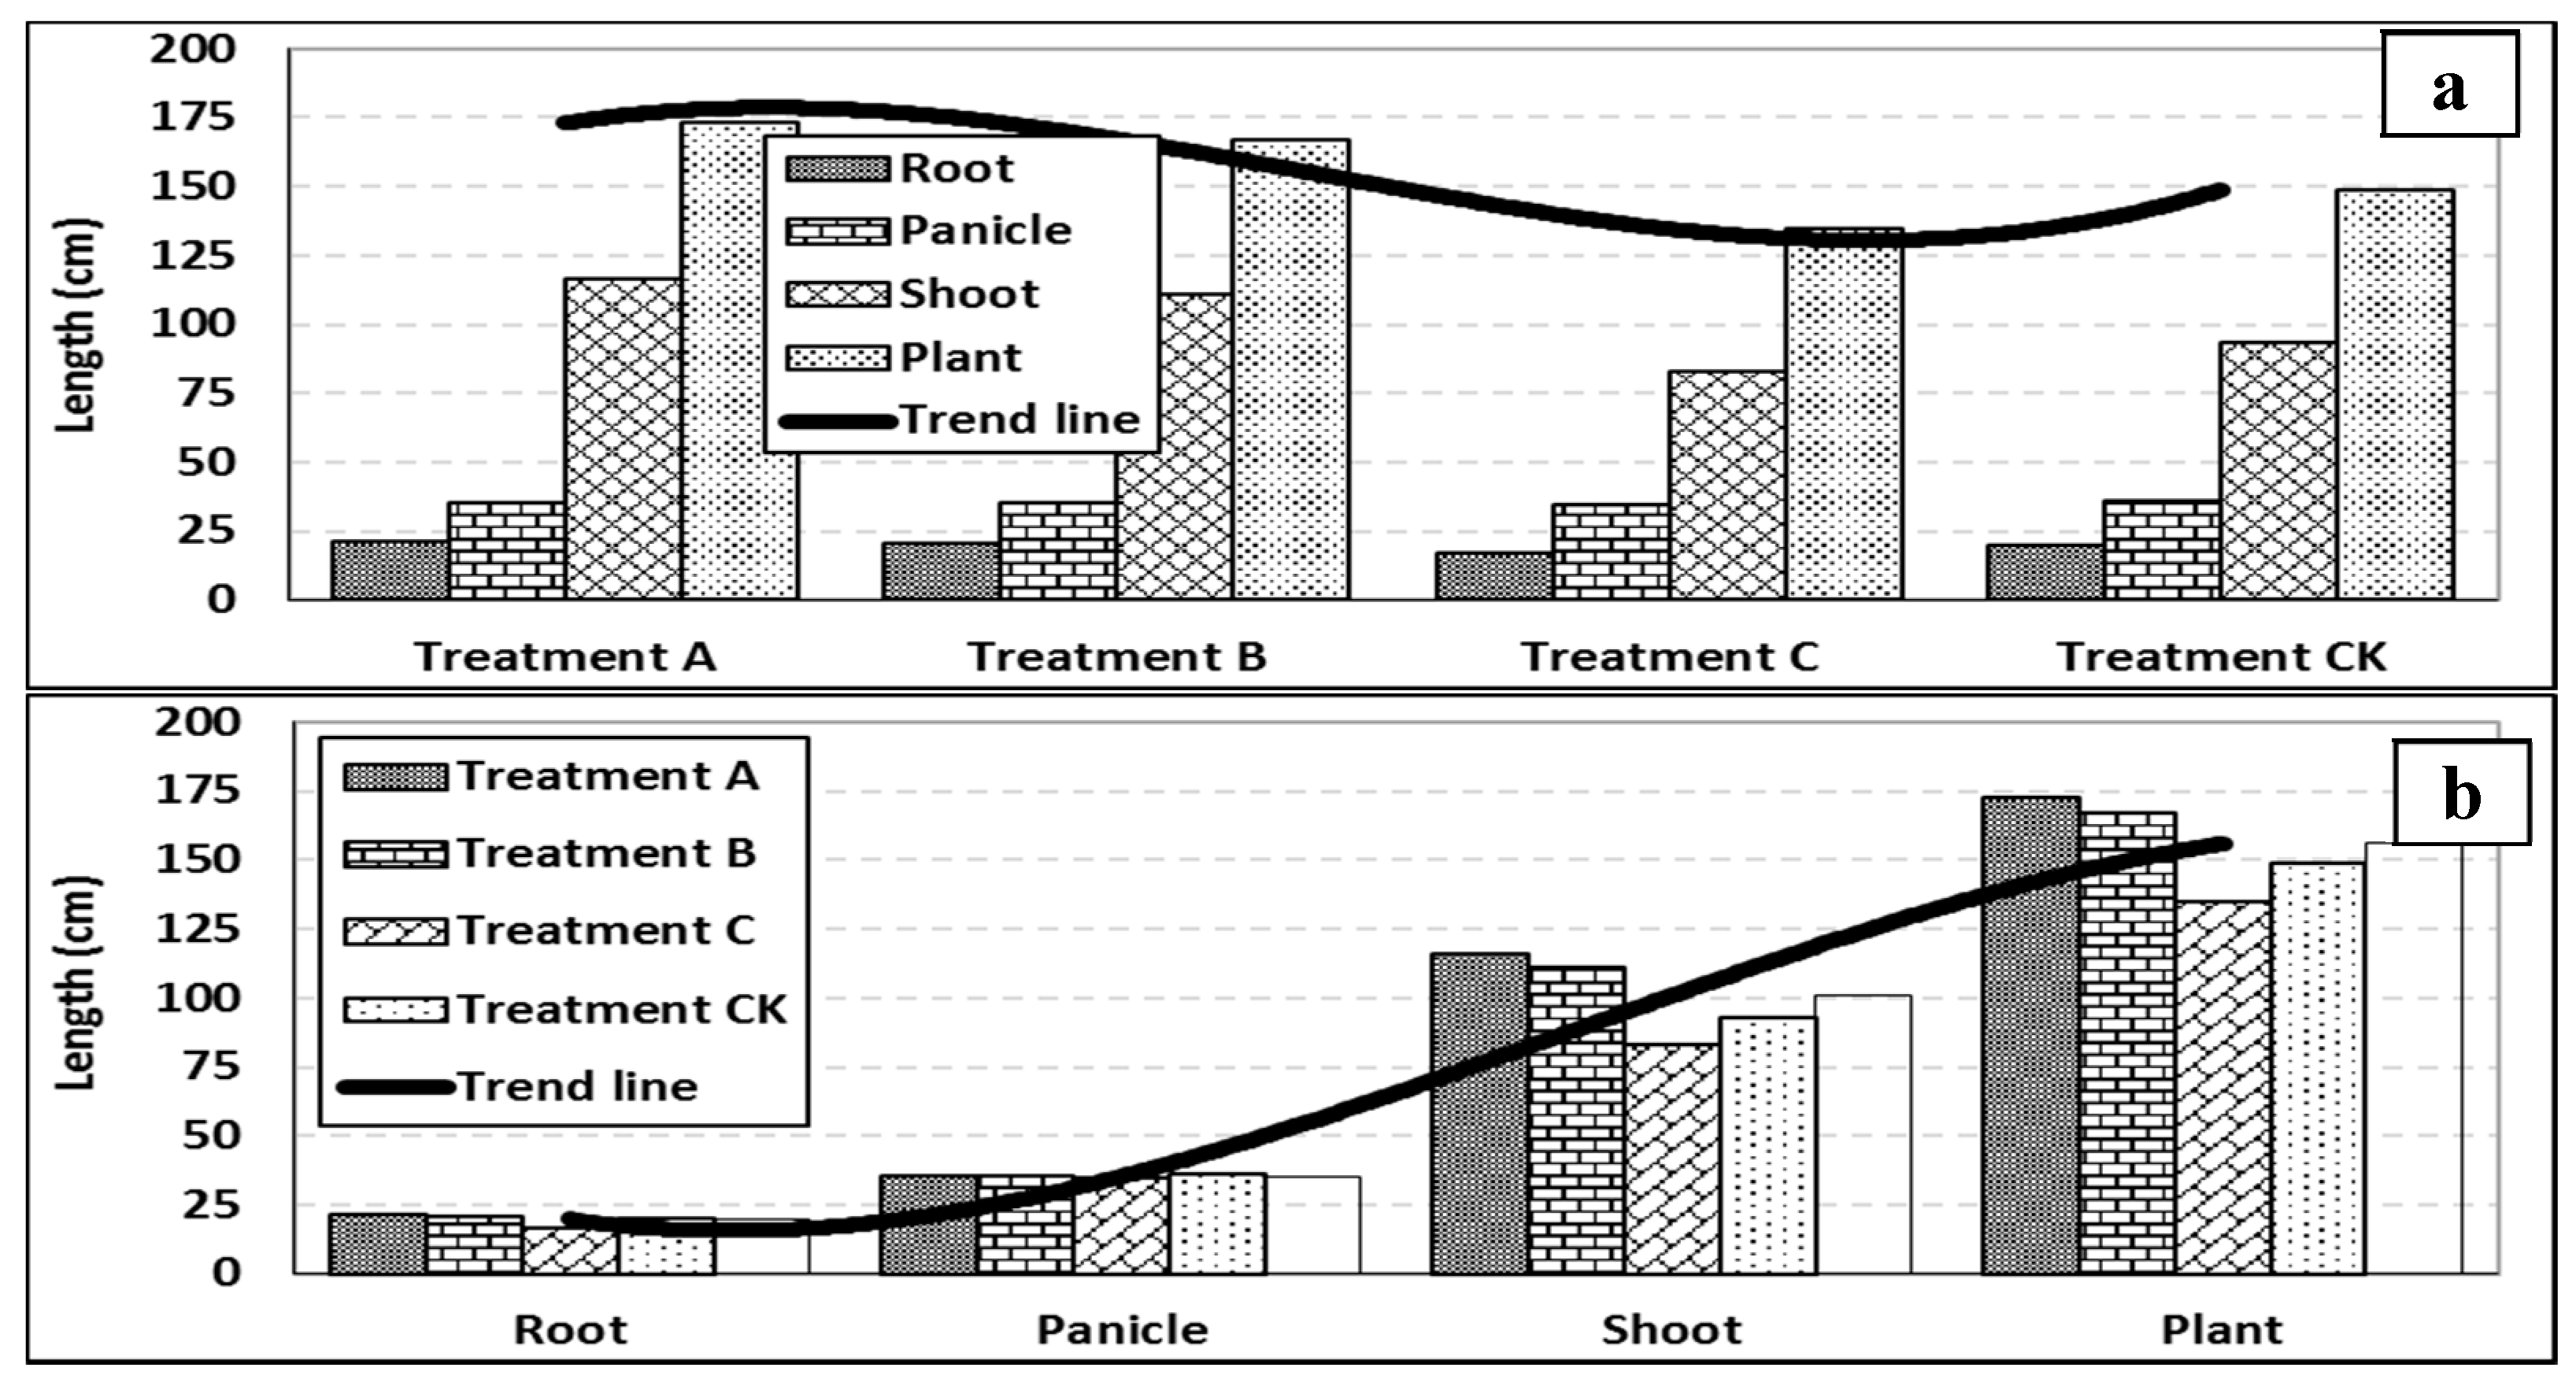
To understand the growth dynamics further, the lengths of some of the yield components were measured at harvest and plotted in
Figure 4. Note that the trend line in
Figure 4a is the sum of all the measured yield components, and that (which is the same as the value for plant length) in the bottom plate is the average across the treatments. From the plot, it was clear that with root length added, TA had the highest productivity in terms of plant length (172.90 cm). This was followed by TB, CK, and then TC had the shortest length (134.48). Generally, root length decreased with increasing biochar application depth, and root length under CK was higher than that under TC (the 30 cm biochar depth treatment). Also along the yield components, TA performed the best and TC the worst (
Figure 4b). The length increased across the yield components from the root to the panicle, to the shoot and then to the entire plant (which was the sum of the other 3 yield components). TC had the shortest length, and it was the treatment most affected by insect/pests in the study. There was also mounding in TC, resulting from mixing the biochar with excavated soil to the depth of 30 cm. This affected water infiltration and with possible negative effect on the performance of TC.
3.2. Crop Weight Dynamics
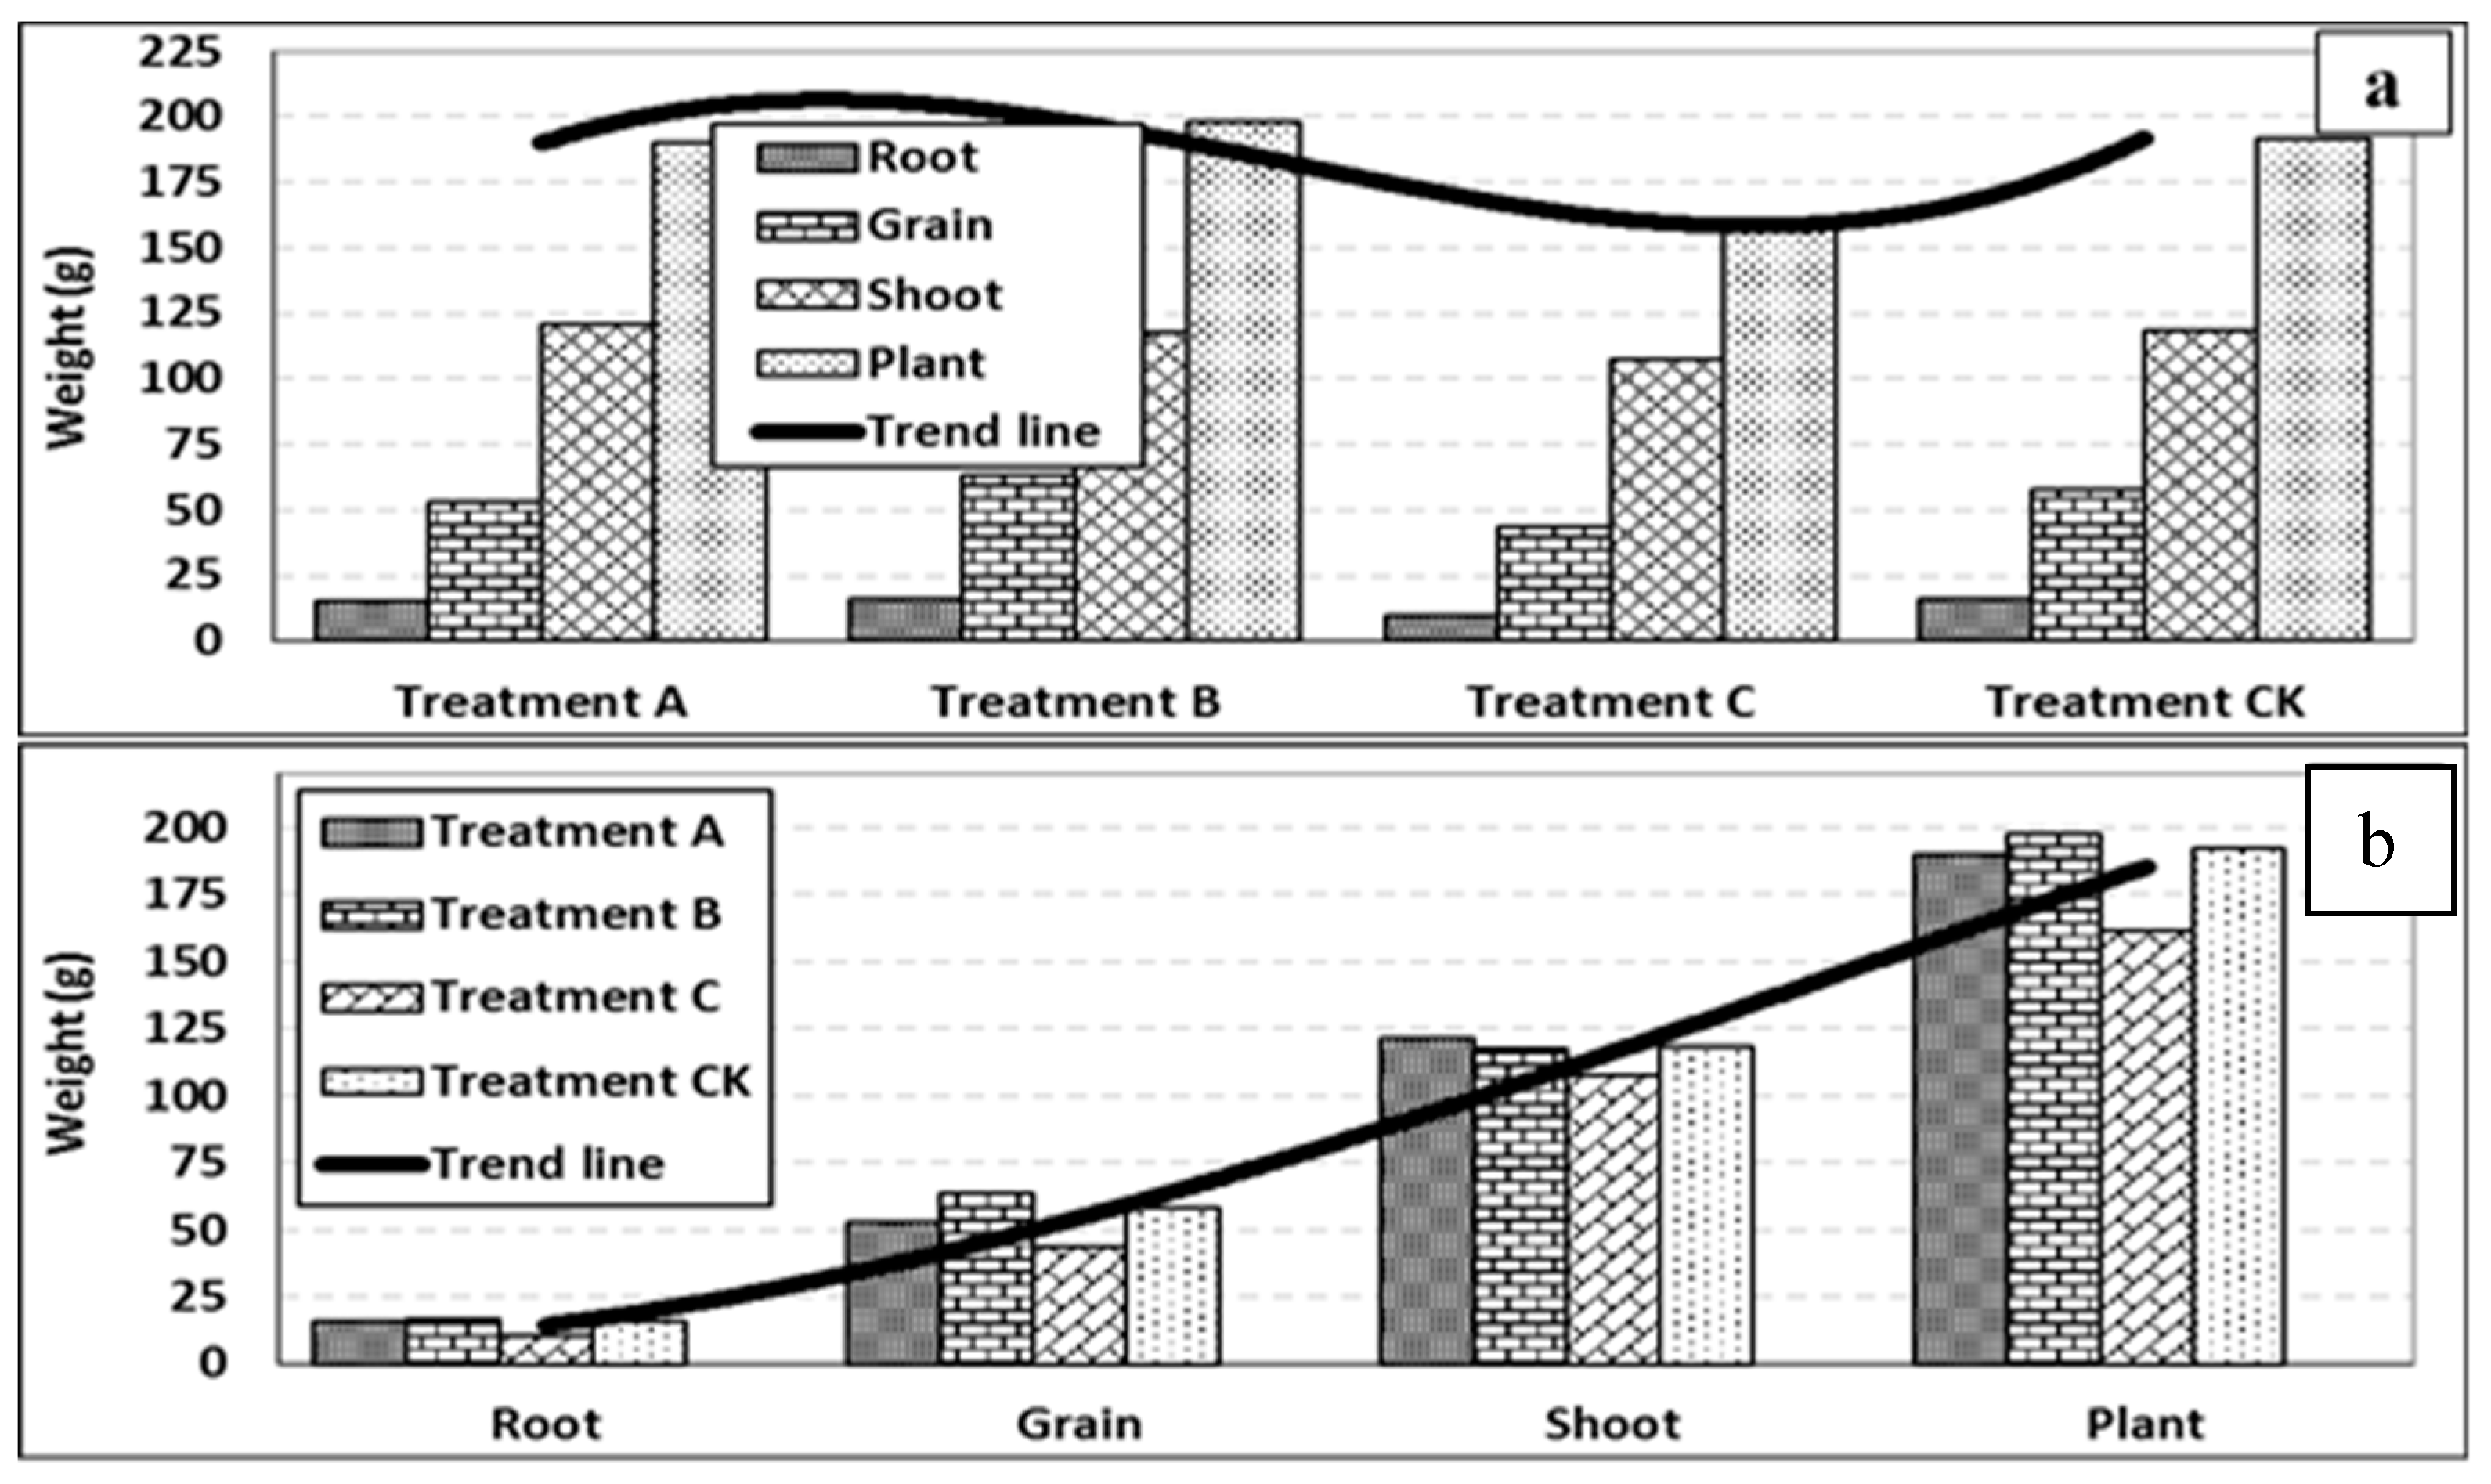
The weights of the various yield components of the NERICA-4 rice plant were taken at harvest, dried, reweighed, and the dry weight plotted in
Figure 5. Note that the trend line in
Figure 5a is the sum for the yield components (which is the same as the value for the plant), and that in the bottom plate (of
Figure 5) is the average across the treatments. Based on the plot in
Figure 5, yield weight was smallest at the root scale (1302.56 kg/ha) and highest at the plant scale (16,673.07 kg/ha). At the treatment scale, yield weight was highest under TB (17,799.57 kg/ha) and lowest under TC (14,521.25 kg/ha). Grain weight, which is among the most important yield components of rice, was highest under TB (5704.45 kg/ha), followed by CK (5222.32 kg/ha) and TA (4791.87 kg/ha), and it was lowest under TC (3,910.07 kg/ha). For NERICA-4 rice cultivar, average grain weight is 5000 kg/ha [
32,
50]. This suggested that the plant performed above average for TB and CK, but below average for TA and TC. While the below-average performance of TA could be attributed to the shallow biochar application depth (10 cm, far below rice root penetration depth), that for TC was likely due to pest damage and mounding effect on the yield. In terms of dry weight, root accounted for 7.81%, grain 29.43% and then shoot 62.76% of the NERICA-4 rice plant.
Despite the good correlation (r > 0.74), 2-tailed T-test analysis showed significant differences (at p = 0.05) among all paired combinations of the parameters along crop yield components. However, there was strong correlation (r > 0.99) and no significant differences (at p = 0.05) among paired combinations of the treatments for the yield weights. Based on ANOVA analysis, the treatments did not have any significant effect on yield weight, but the yield components were indeed significantly different in terms of weight. It is good to note, however, that yield component is partly a genetic factor that controls root, shoot and grain ratio, irrespective of the treatment.
3.3. Crop and Soil Moisture Dynamics
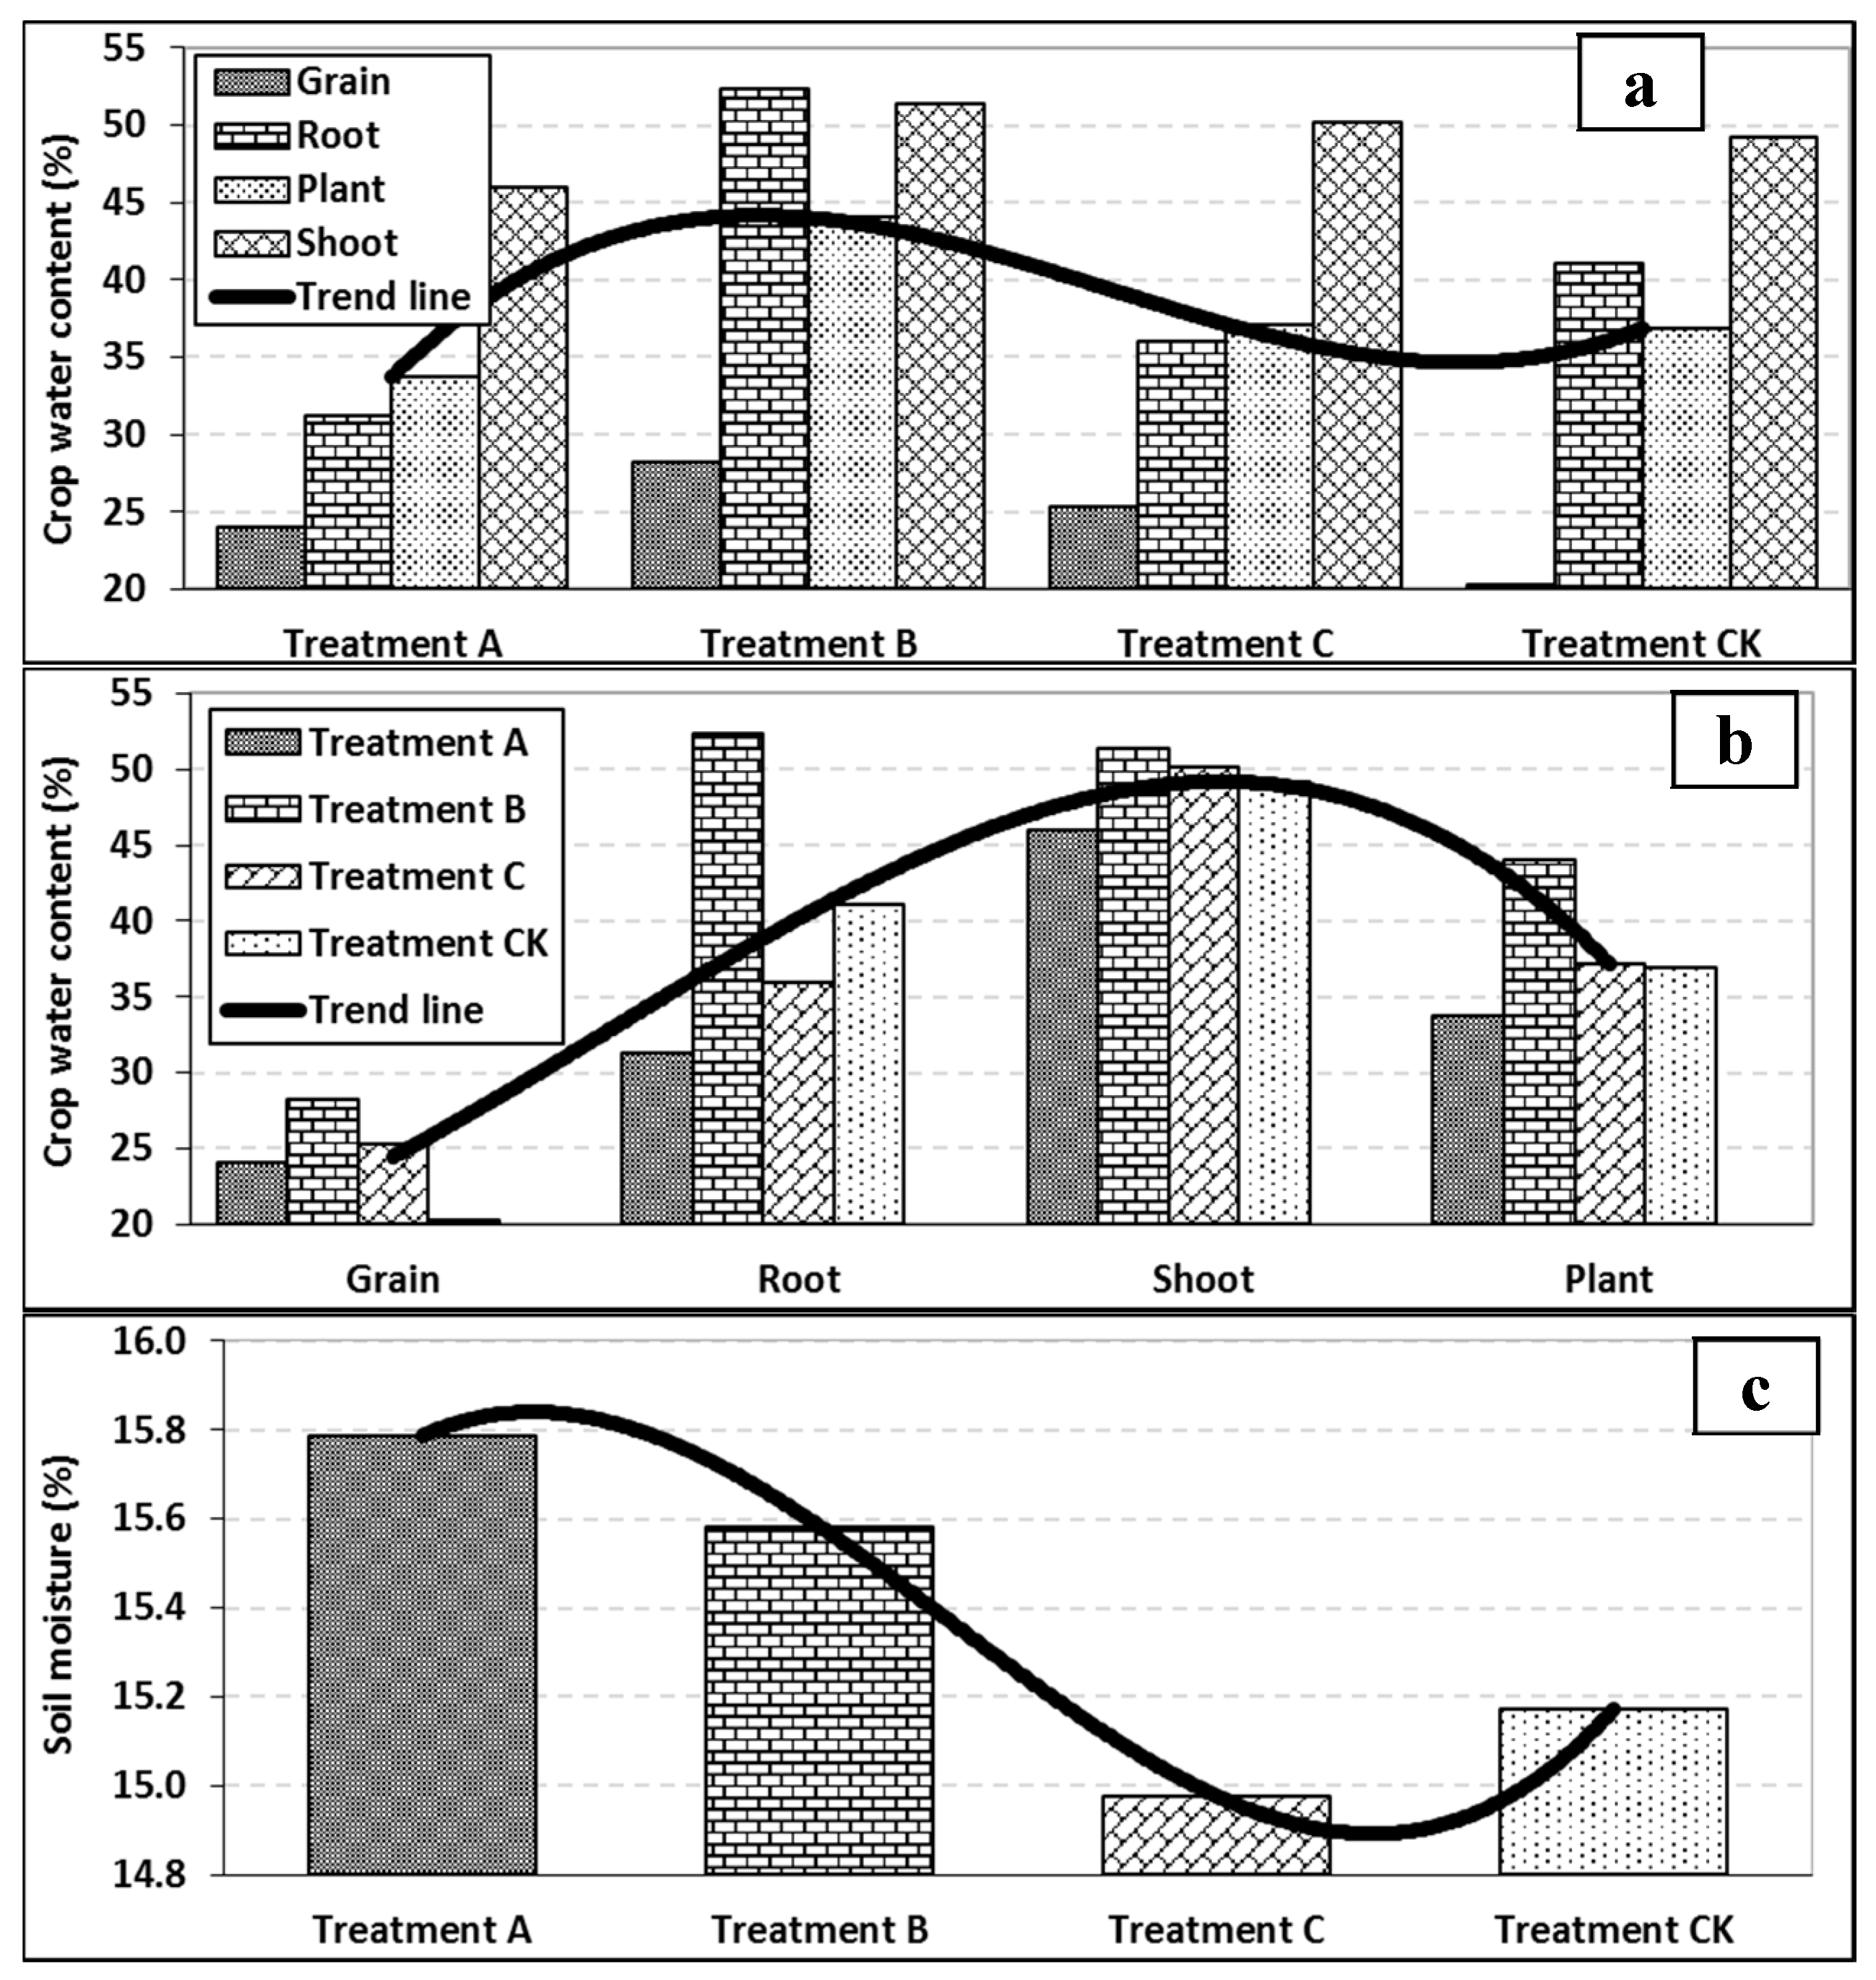
From the measured fresh and dry weights of the yield components of the NERICA-4 rice cultivar, crop moisture content was determined using Equation (1) and plotted in
Figure 6a,b. Also in
Figure 6c is the soil moisture content calculated from soil samples taken from the treatment plots (see the materials and method section). Note that the trend lines in
Figure 6 depict the average values across either the treatments or the yield components.
For crop moisture content across the treatments (
Figure 6a), moisture content was highest under TB (44.01%), followed by TC (37.14%), CK (36.87%), and then TA (33.75%). Also for crop moisture content across yield components (
Figure 6b), it was highest for shoot (49.18%), followed by root (40.18%), the whole plant (37.94%), and then the grain (24.47%). Then for soil moisture content across the treatments (
Figure 6c), it was highest under TA (15.79%), followed by TB (15.58%), CK (15.17%), and then TC (14.98%).
For crop moisture content across treatment combinations, there was strong correlation (r > 0.99) between every paired combination of the treatments. However, none of the correlations was significant at p = 0.05. For crop moisture content across yield component combinations, there was no correlation (r = 0.45‒0.47) between 2 of the paired yield component combinations (grain, root and grain, shoot) but there was correlation (r = 0.67‒0.87) between the other paired yield-component combinations. ANOVA analysis showed that except for the root, shoot and root, plant yield-component combinations, there were significant (p = 005) differences in crop moisture content at the yield scale. Then at treatment scale for soil moisture content, all the paired combinations were correlated (r = 0.73‒0.99) but none was significant at p = 0.05; except for the TA, TC (p = 0.02), and TB, CK (p = 0.03) treatment combinations.
While the differences in both the crop and soil moisture contents was attributable to treatment and genetic factors, also field conditions (that were not part of the treatment) possibly contributed to the differences. For instance, the separation of the treatment plots by bamboo canes caused water logging in TA and CK treatments during rainfall events. Also mixing biochar with dug-out soil caused mounding after backfilling under TC (the treatment with the highest depth, 30 cm), limiting infiltration during rainfall events. These field conditions in combination with treatment effects and genetic factors contributed to the differences in both the soil and crop moisture contents in the study. This necessitated screening for the three factors (genetic, treatment, and field condition) with the highest impact on the observed discrepancies.
3.4. Parameter Correlativity
The coefficients of determination (
R2) for paired combinations of the yield components are given in
Table 1. With the exception of just 4 paired combinations (TN, SL; TN, RL; TN, PL, and TN, CM; where TN is tiller number, SL shoot length, RL root length, PL panicle length, and CM crop moisture content), all the measured yield components were strongly correlated. In fact, perfect correlations (
R2 = 1.00) existed between 9 of the paired yield components. Despite the strong correlations, however, 2-tailed T-test showed that some of the variables (italicized values) had significant differences (and that was mostly with panicle weight, PW). This suggested that the yield components were largely interdependent. Only 2 of the paired variables (TN, RL and TN, CM; underlined in
Table 1) had negative correlation. For instance, the number of tillers (and especially tillers with grains) influenced the quantity of grains produced (
R2 = 0.89).
4. Discussions
4.1. Biochar Research
Maintaining appropriate levels of nutrient cycle is key for successful soil management efforts in humid tropical regions. Cover crop, mulch, compost or manure additions supply nutrients to crops, shorten nutrient cycle by increasing microbial biomass activity and hold onto applied mineral fertilizers [
51,
52]. However, none of these seem to have a long-term effect like biochar. Biochar research regained momentum with the discovery of the Amazonian
terra preta soils in the endless search for sustainable agriculture and worsening climate change. The
terra preta soil is today widely studied for reproduction and application in soil amendment because of its huge potential for nutrient/carbon capture and storage [
16]. The biochar-rich
terra preta soils in the Amazon occur in various depths and spatial extents and are also highly potent in nutrient and carbon, and can therefore support strong vegetation growth. While biochar studies have mostly focused on the production modes and application rates, little has been done on the application depth. This study was set up to determine the effect of biochar application depth on crop productivity under tropical rainfed conditions. A fixed soil-biochar volume ratio of 1:20 (5% biochar) was applied in 3 depths—TA (10 cm), TB (20 cm), and TC (30 cm)—and investigated against a control treatment (CK) with no biochar.
4.2. Treatment Effect on Yield
Based on the results, the number of tillers per hill was highest under TB, followed by TA, CK, and then TC. The increase in the number of tillers in successive time periods (2 weeks in this case) were strongly correlated (
r > 0.85), but only significantly different (
p = 0.05) for the period from the 6th to the 8th week and then from the 8th to the 10th week (
Figure 3a,b). Tillering was not completely consistent with biochar application depth, probably due to field contingencies (pest damage and water logging) under the tropical rainfed condition.
For the shoot system, increase in plant height in successive time periods (also 2 weeks in this study) was strongly correlated (
r > 0.96), except for the period between the 8th and 10th weeks (
r = 0.41). Also 2-tailed T-test showed that the differences in the increase in height between the successive time periods were significant at the 0.05 confidence interval. On average, plant height was highest under CK (control treatment), followed by TB, TC, and TA (
Figure 3c,d). Like tillering, plant height was not completely consistent with biochar application depth and probably affected by the same contingent field conditions.
For plant length (which is the total length for root, shoot and panicle), it decreased with increasing biochar application depth (
Figure 4). However, plant length under CK (no biochar) was higher than that under TC (30 cm biochar depth). On average, the rice plant increased from root to panicle (cut from the last leaf base) and then to shoot (without panicle). Genetically, rice shoot is longest, followed by panicle and then root (
Figure 4). The approximate ratio of panicle-to-root was 1:2, shoot-to-panicle was 1:3, and panicle-to-shoot was 1:5.
The observed field contingencies included water logging, which was highest in CK (where there was no tillage), followed by TA (10 cm tillage depth plus biochar), but no water logging in TB (20 cm tillage depth plus biochar), but even mounding in TC (30 cm tillage depth plus biochar). The differential water logging condition was because with no tillage (CK), the bamboo canes around the plots caused sunken beds to develop. Under TA, the addition of only 1 part of biochar to 20 parts of dug-out soil to the depth of 10 cm increased little the backfill volume and therefore sunken beds also formed after using separation bamboo canes. Under TB, the increase in volume due to the mixing of the 20-cm depth of soil with biochar caused the bed to just level out with the separation canes and there was therefore no water logging. Finally, under TC, the increase in volume due to the mixing of 30 cm depth of excavated soil with biochar cause mounding above the separation canes, causing runoff. As a key factor for rice growth, the differential water conditions of the treatment plots affected the crop yield. Also, because no buffer plots were put around the treatment plots, pest out outbreak affected more the peripheral TA (which bordered on vegetable plots) and TC (which bordered on bush) treatment plots. Pest outbreak was highest in TC, followed by TA, but almost not in TB and CK treatments. The pest damage also contributed to the inconsistencies in the measured plant height and length along the experimental treatments.
The total plant weight (i.e., root, shoot with panicle and grain) was highest for TB, followed by CK, then TA and finally TC (
Figure 5). In terms of the measured yield components, weight increased from root to grain and then to shoot. Root accounted for 7.81% of the total plant weight, grain 29.43% and then shoot (with panicle) 62.76%. Especially for grain (which is the most important yield component for rice), it was highest for TB, followed by CK, TA, and then TC. While shoot weight was highest for TA, grain weight and root weight were highest for CK. Weight was not consistent along the treatments (either way from TA to TB to TC) probably because of the negative effect of the contingent field conditions explained above.
For crop moisture content, it was highest under TB, followed by TC, CK, and then TA. For the measured yield components, it was highest under TB and lowest under TA for root and shoot. Then for grain, moisture content was highest under TB and lowest under CK. The percent contributions of grain, root and shoot (plus panicle) to the total moisture content of the rice plant were 21.50%, 35.30%, and 43.21%, respectively. For soil moisture content, it was simply highest for TA, followed by TB, then CK and lowest for TC. Irrespective of the inconsistencies in the measured variables along the treatments (probably due to the contingent field conditions), there were strong correlations among most of the paired combinations of the variables (
Table 1).
4.3. Field Contingency Effect on Yield
To further understand the effect of the contingent field conditions on the performance of the measured yield variables, a table of the best- and worst-performing treatments was constructed (
Table 2). Note that plant weight (PW) and height (PH) constituted of the sum of the values of all the measured yield components (root, shoot, panicle and grain), and therefore not separately given. Thus, from
Table 2, it was apparent that under high soil moisture (SM) content, water was not a factor for the performance of the measured yield variables (MYV), except plant length (PL). Conversely under low soil moisture content, water became critical for the performance of all the measured yield variables, except crop water content (CW). This suggested that rice plant always adjusted its own tillering (TN), growth (measured as PL) and dry matter accumulation (measured as PW) to maintain a certain level of water to keep alive. Soil moisture content was lowest under TC because of mounding (raised bed), implying that most of the soil moisture was absorbed to sustain growth under TC. Furthermore, large plant length was influenced only by soil moisture, whereas small plant length was a function of soil moisture, tiller number, and plant weight. While low tiller number was affected by all the measured yield variables, except crop water content, high tiller number was a function of both crop water content and plant weight.
When related with the contingent field conditions, it was clear that TC (the 30-cm depth treatment with mounding runoff and high pest damage) had the lowest value for the measured yield variables, except crop water content (
Table 2). Also, while low crop water content was not really a growth and yield factor, high crop water content influenced both tiller number and plant weight, but not plant length. Here again, soil moisture content had no effect on crop water content.
Table 2 also showed that while TA (10-cm depth treatment with high water logging and limited pest damage) was lowest only for crop water content, TB (20-cm depth treatment with no water logging or pest damage) was highest for all the measured yield components, except plant length. This reaffirmed the point that the contingent field conditions affected the results of the experiment. Deductively therefore, it was possible that biochar application depth had a boosting effect on the performance of NERICA-4 rice cultivar. This was because for most of the time, TB (20-cm biochar depth treatment with no pest damage) performed better than CK (control treatment with water logging and no biochar or pest damage).
4.4. Contingent Field Condition and Biochar Treatment Effects
To quantify the effects of the contingent field conditions and the biochar application depth on the measured yield components, simple relational equations were developed. For this purpose, it was assumed that the effect of water logging, wherever it occurred, was the same. Similarly, the effect of pest damage, wherever it occurred, was the same too. Then while water logging and biochar application were yield-gain factors, pest damage was a yield-loss factor. With this, we then take the effect of water logging on the crop performance to be , that of pest damage be and that of biochar depth be . Based on field observations, there was water logging in CK (), water logging, biochar use and pest damage in TA (), biochar use in TB () and then biochar use and pest damage in TC (). It then becomes apparent that and that (where is crop yield without the effects of water logging, biochar use and pest damage). Also (where is a yield loss factor and therefore negative). With and known, then can be derived from ; thus . Note that TA, TB, TC and CK are used as defined earlier.
Using the above relations for plant weight (PW), there was 20.30% yield loss under TA due to pest damage, 36.84% yield loss under TB due to runoff (which indicates no water logging), 86.74% yield loss under TC due both to pest damage and runoff and then 14.86% yield gain under CK due to water logging. Similarly for plant length (PL), there was 4.98% yield loss under TA due to pest damage, 38.98% yield loss under TB due to runoff, 83.29% yield loss under TC due both to pest damage and runoff, and then 25.73% yield gain under CK due to water logging. Then finally for tiller number (TN), there was 14.45% yield loss under TA due to pest damage, 36.14% yield loss under TB due to runoff, 73.02% yield loss under TC due both to pest damage and runoff and then 11.82% yield gain under CK due to water logging. Yield loss or gain for crop water content (CW) was not quantified because
Table 2 suggested that it had no effect on the output of the rice crop. This implied that the minimum crop water requirement for growth was available throughout the experimental study.
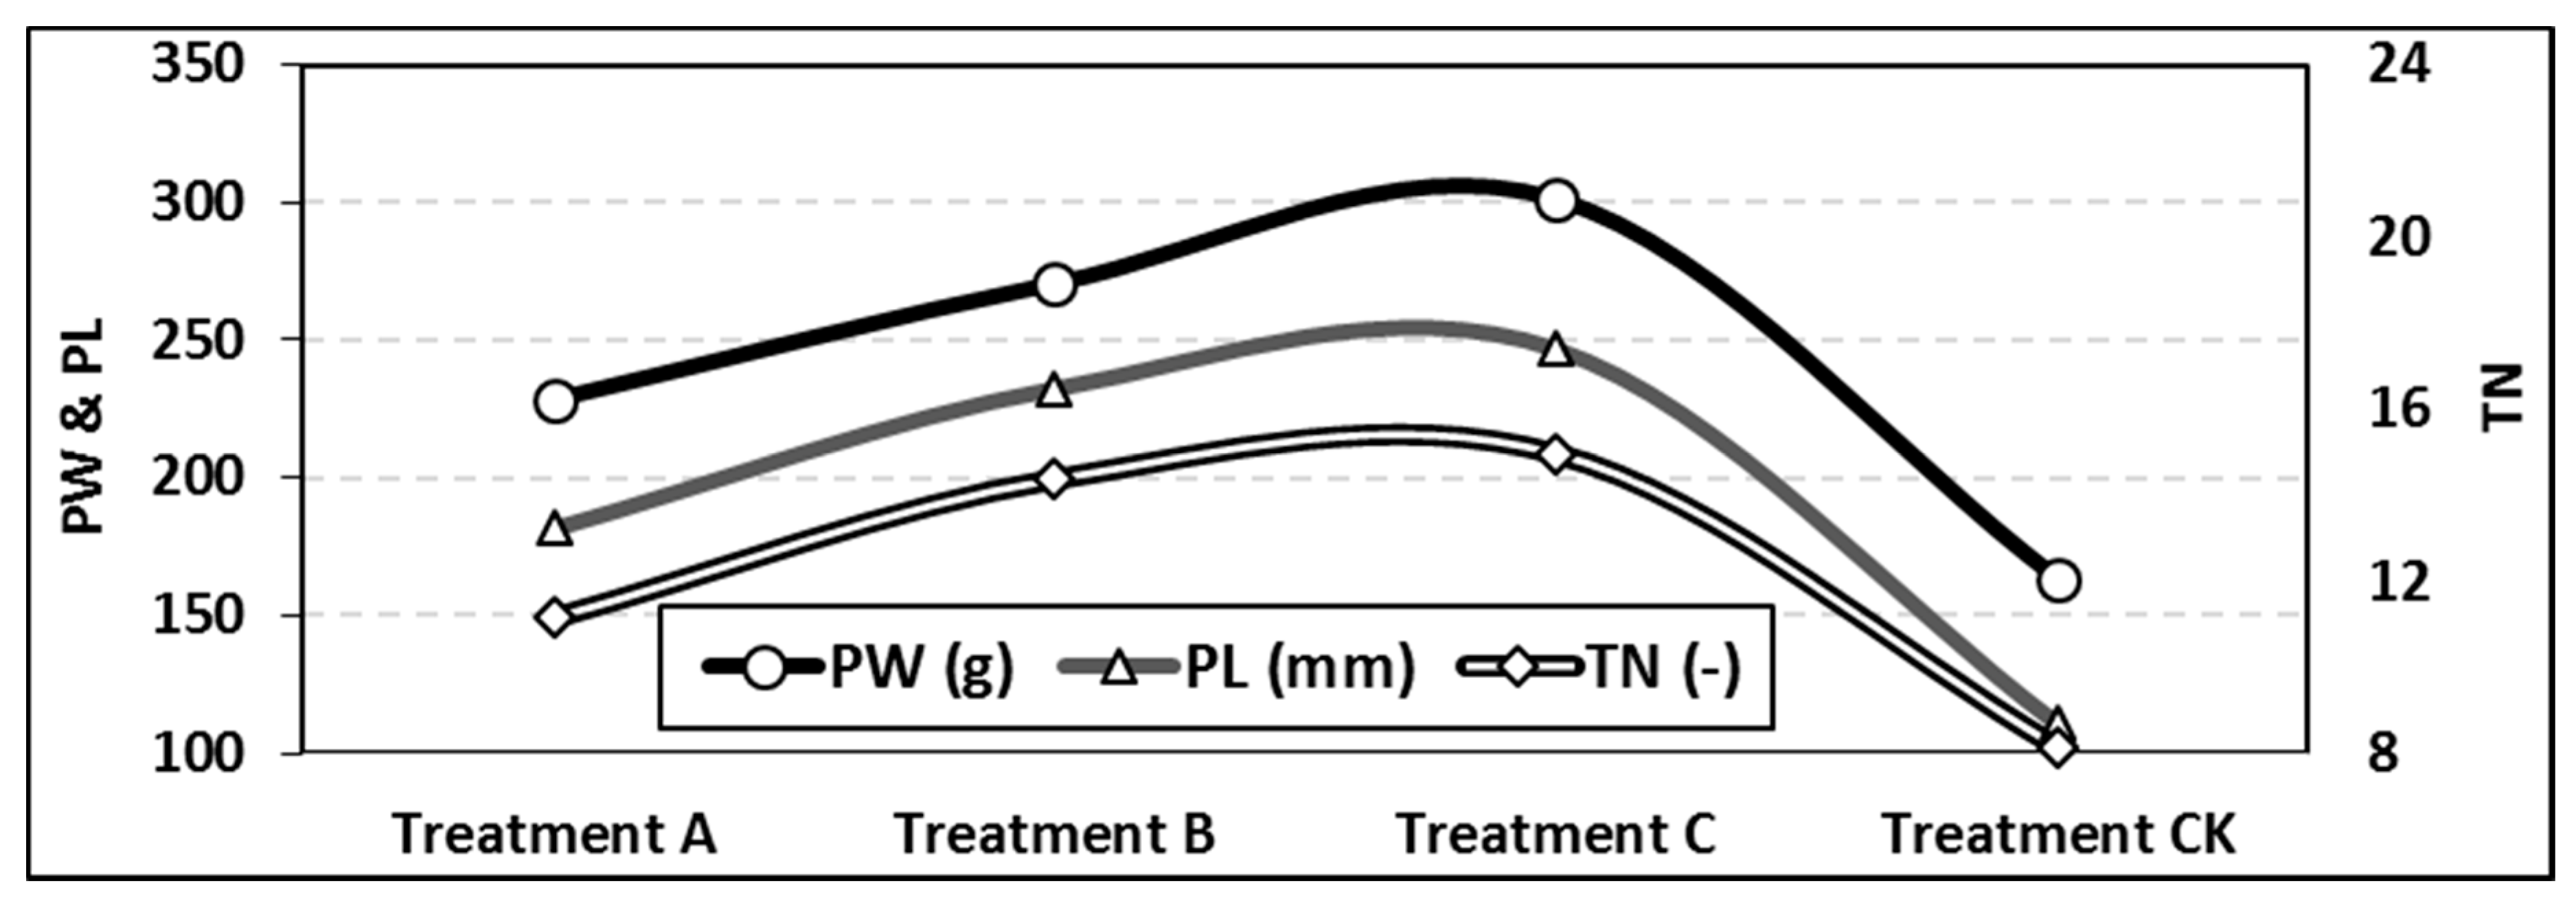
After adjustment for the calculated values (i.e., after removal of the effects of pest damage and water logging on the biochar depth treatments), the effects of only the different biochar application depth treatments on the NERICA-4 rice yield are plotted in
Figure 7 for the yield components including plant weight, plant length and tiller number. The plot showed that the rice crop yield increased with increasing biochar application depth and it was generally higher in biochar than in non-biochar treatments. From
Figure 4, the measured root length was lowest in TC (19.77 cm) and longest in TA (21.54 cm). It then suggested that the rice root penetrated far beyond the 10-cm depth of biochar in TA, but that only halfway through the 30-cm biochar depth in TC. Thus, biochar generally limited root penetration depth, probably because of sufficient availability of nutrients in the upper layers of the soil where the biochar was concentrated.
5. Conclusions
This study was set up to investigate the effect of biochar application depth on NERICA-4 upland rice cultivar under tropical rainfed conditions. Based on the study, biochar application not only boosted rice growth, but also increased rice yield with increasing application depth. There were different modes of biochar application, either as dust or lump or surface broadcasting or deep tillage. The results of the pilot study reconstructed from the formula developed suggested that the effects of biochar on crop growth and productivity also vary with the mode of application. Based on this study, the appropriate depth of application (which can vary with crop type) was critical for desired effects of biochar on crop productivity. With sufficient biochar in the soil, crop rooting depth can be reduced as biochar can create sufficient reserve of nutrients within the zone of application.
Importantly, however, contingent field conditions (including water logging, runoff, and pest damage) can variously affect rice plant growth. Although contingent field conditions were quantified in this study, sound experimental designs were needed to preclude damage due to any such conditions. For instance, since disease and pest outbreaks often start at peripheral plots, it is necessary to keep reasonable buffers around experimental plots to have sufficient time for effective action in the event of any such outbreaks. Despite all of this, the study showed that deep soil tillage with biochar was a more productive mode of cultivation than shallow or even surface applications under tropical rainfed conditions.

 ,
, 


