Electronic Properties of Electron-Deficient Zn(II) Porphyrins for HBr Splitting

 , , , and
Abstract
:
1. Introduction
2. Experimental
2.1. Materials
2.2. Syntheses
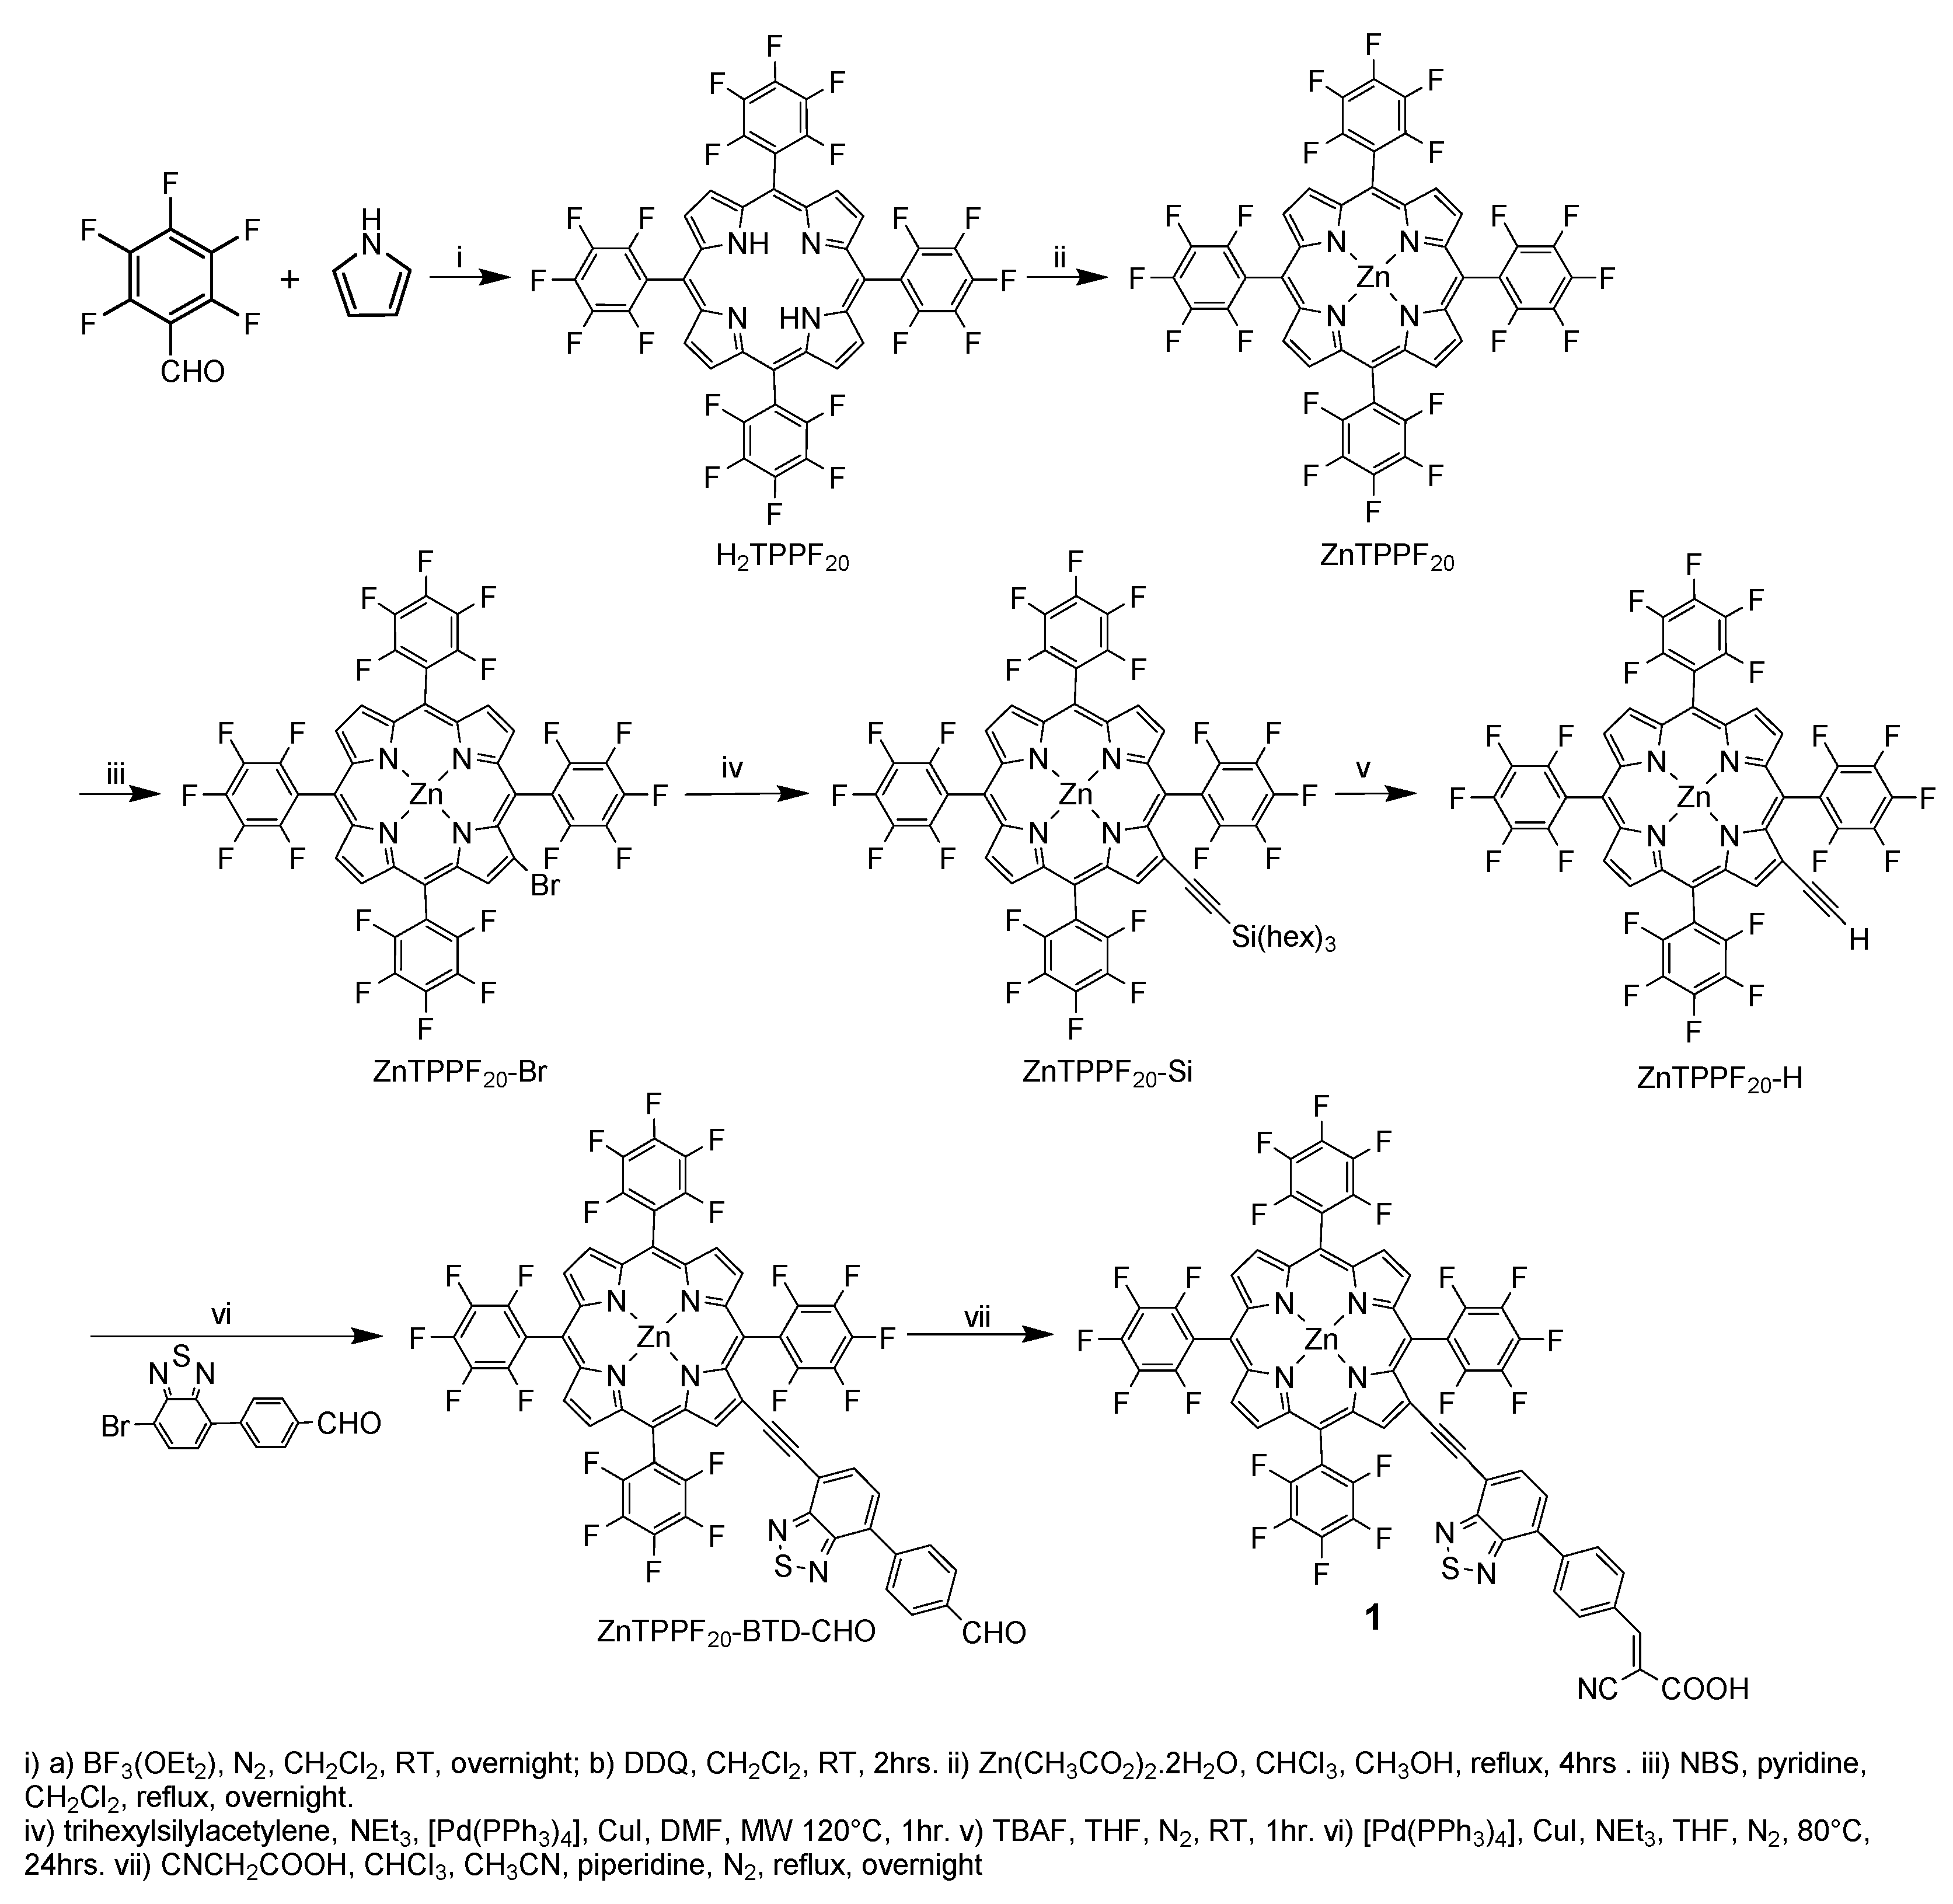
2.2.1. H2TPPF20
2.2.2. ZnTPPF20
2.2.3. ZnTPPF20-Br
2.2.4. ZnTPPF20-Si
2.2.5. ZnTPPF20-H
2.2.6. ZnTPPF20-BTD-CHO
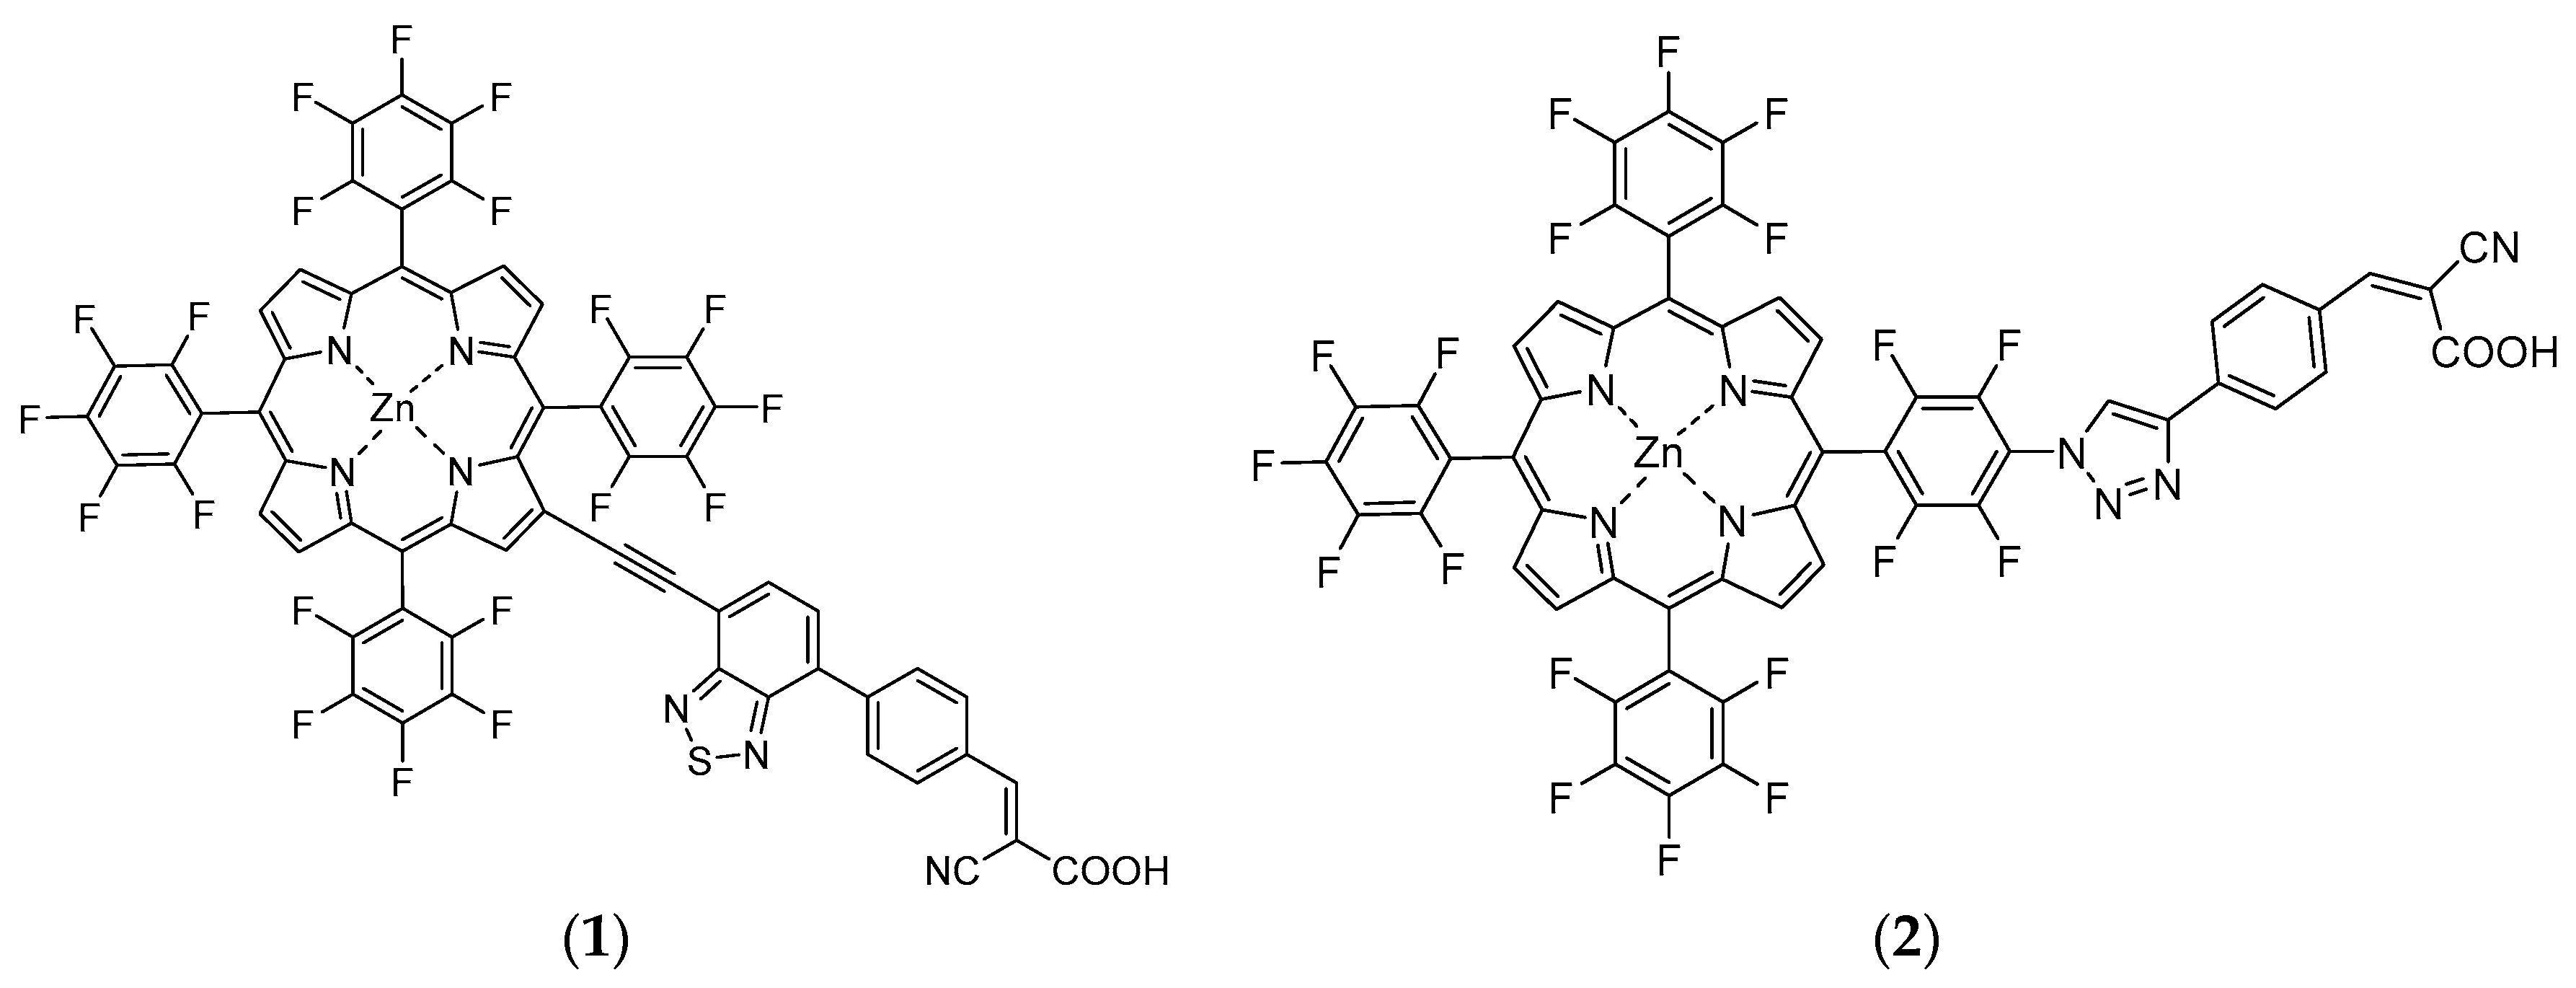
2.2.7. Porphyrin 1
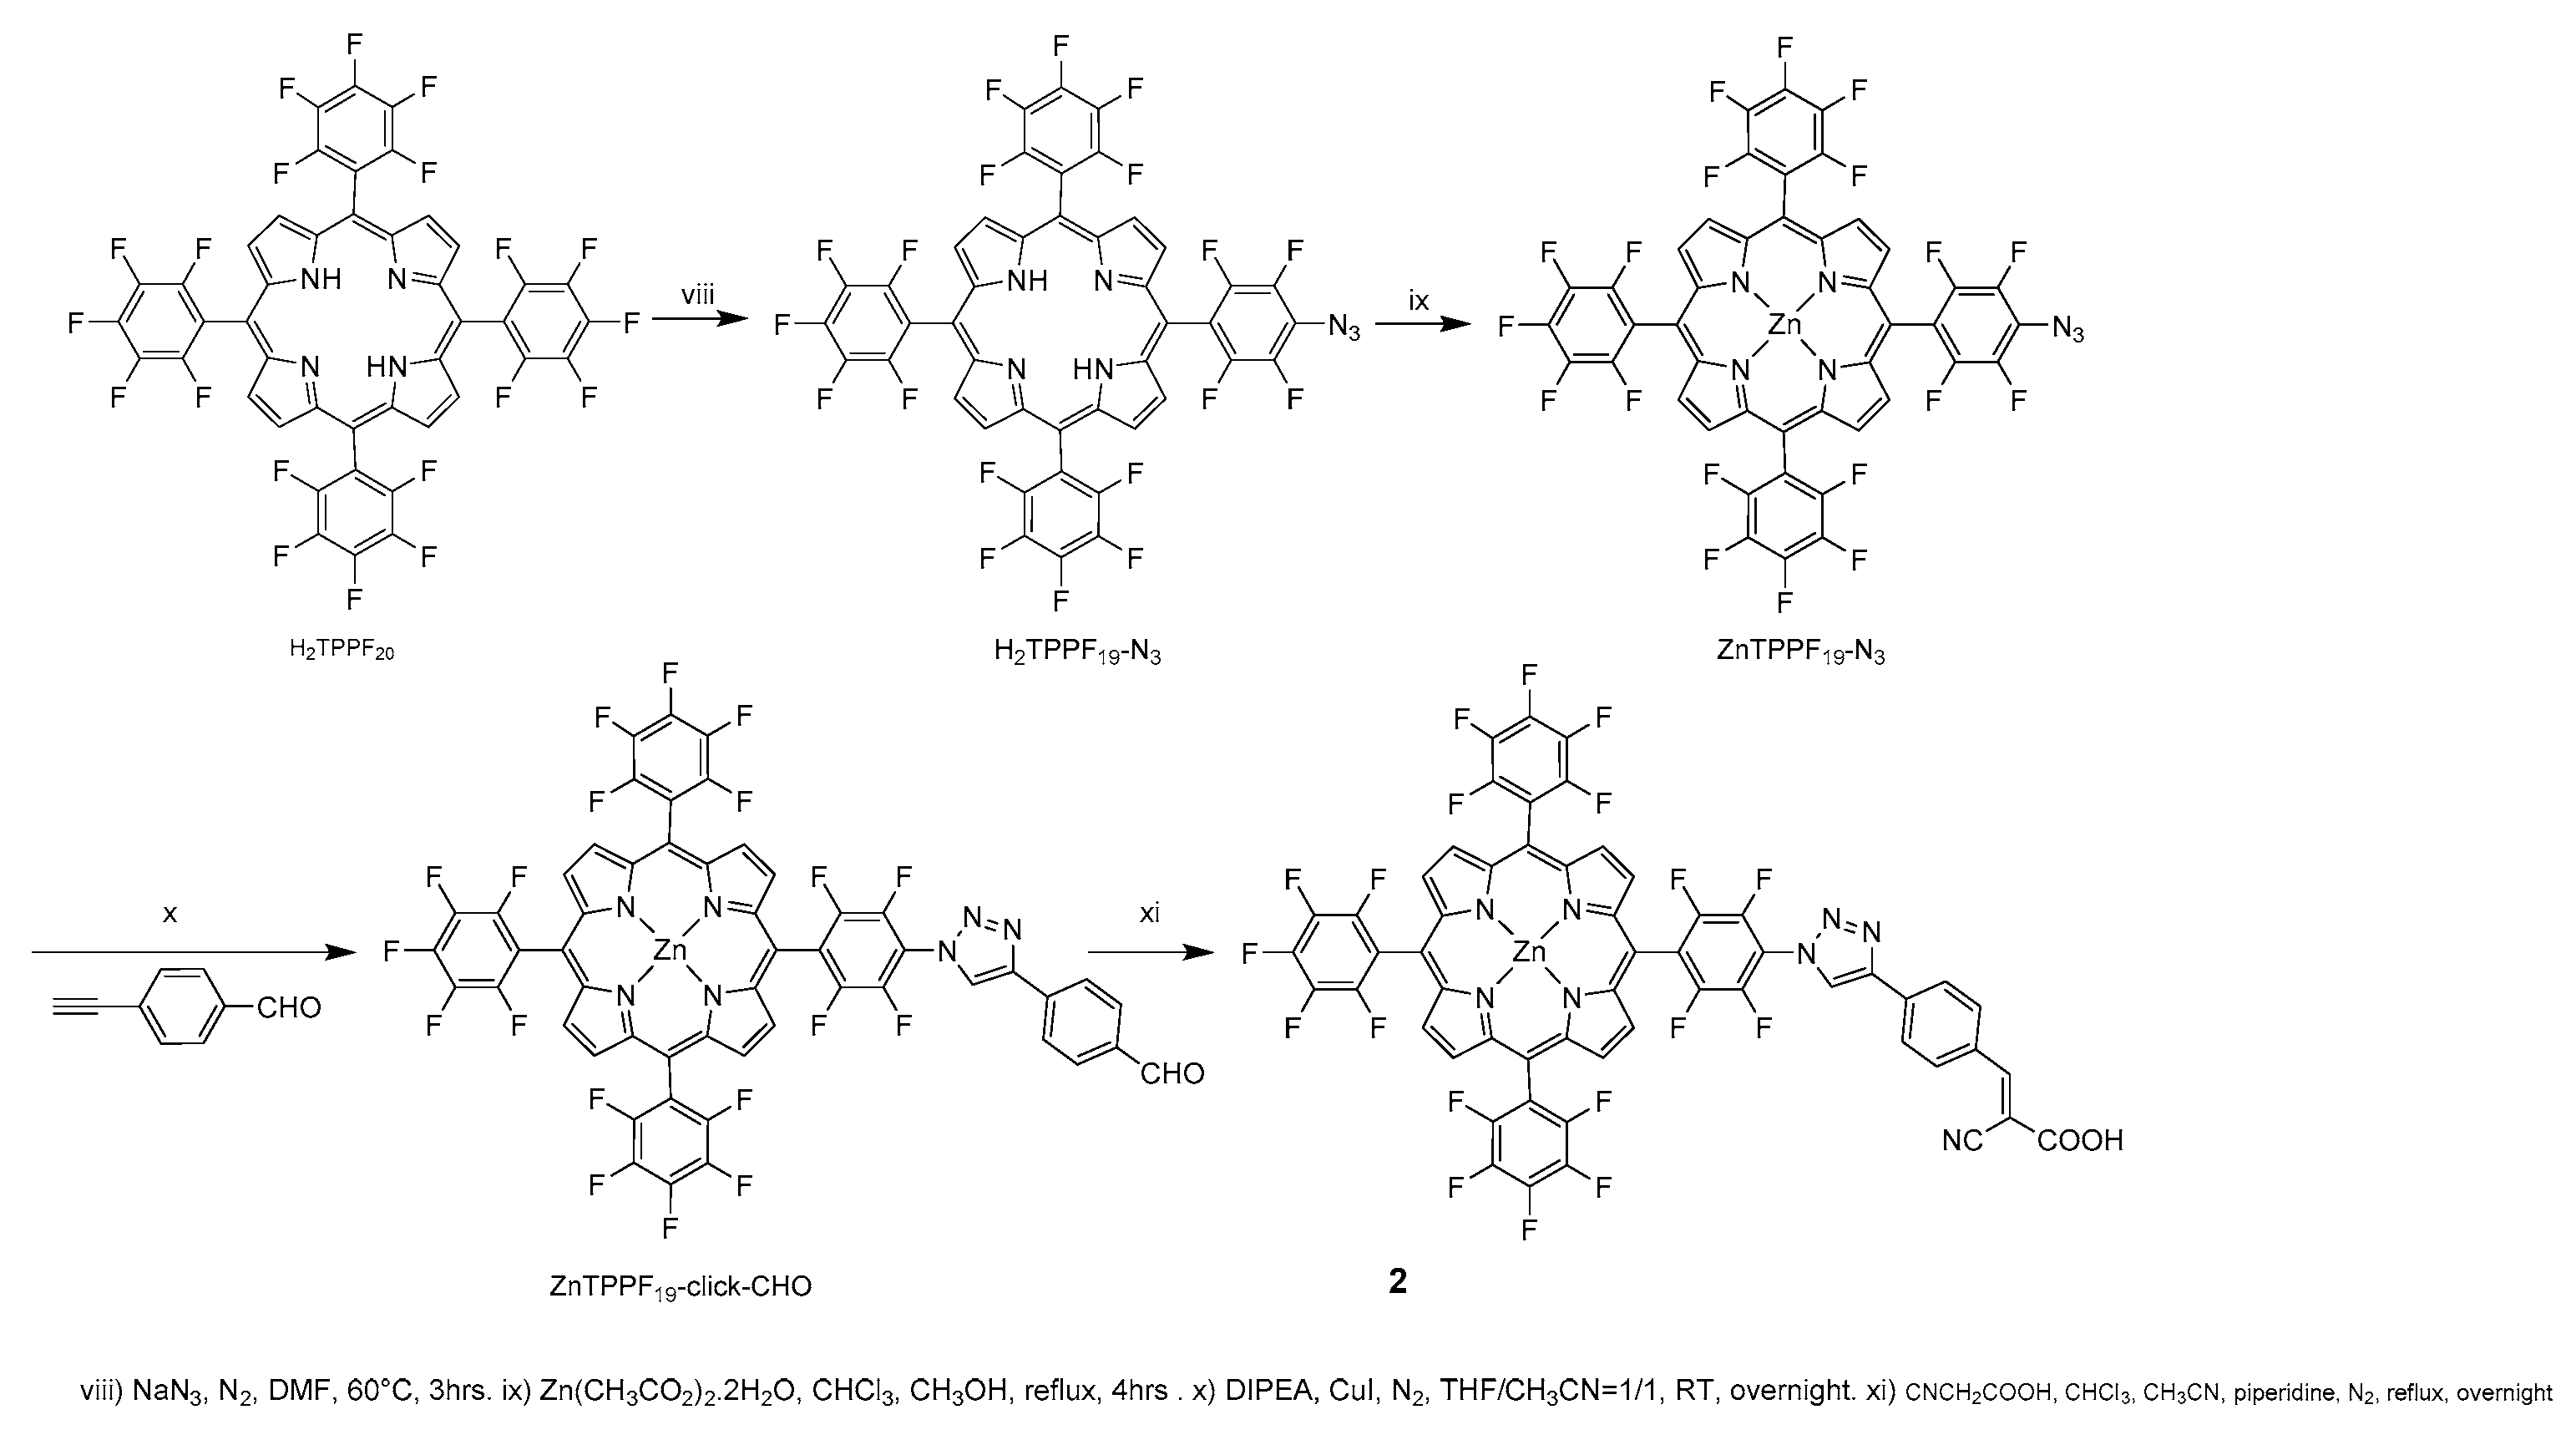
2.2.8. H2TPPF19-N3
2.2.9. ZnTPPF19-N3
2.2.10. ZnTPPF19-click-CHO
2.2.11. Porphyrin 2
Photoanode Preparation
Spectroscopic and Electrochemical Measurements in Solution
Photoelectrochemical Measurements
Transient Absorption Spectroscopy
Computational Chemistry
3. Results and Discussion
3.1. Syntheses
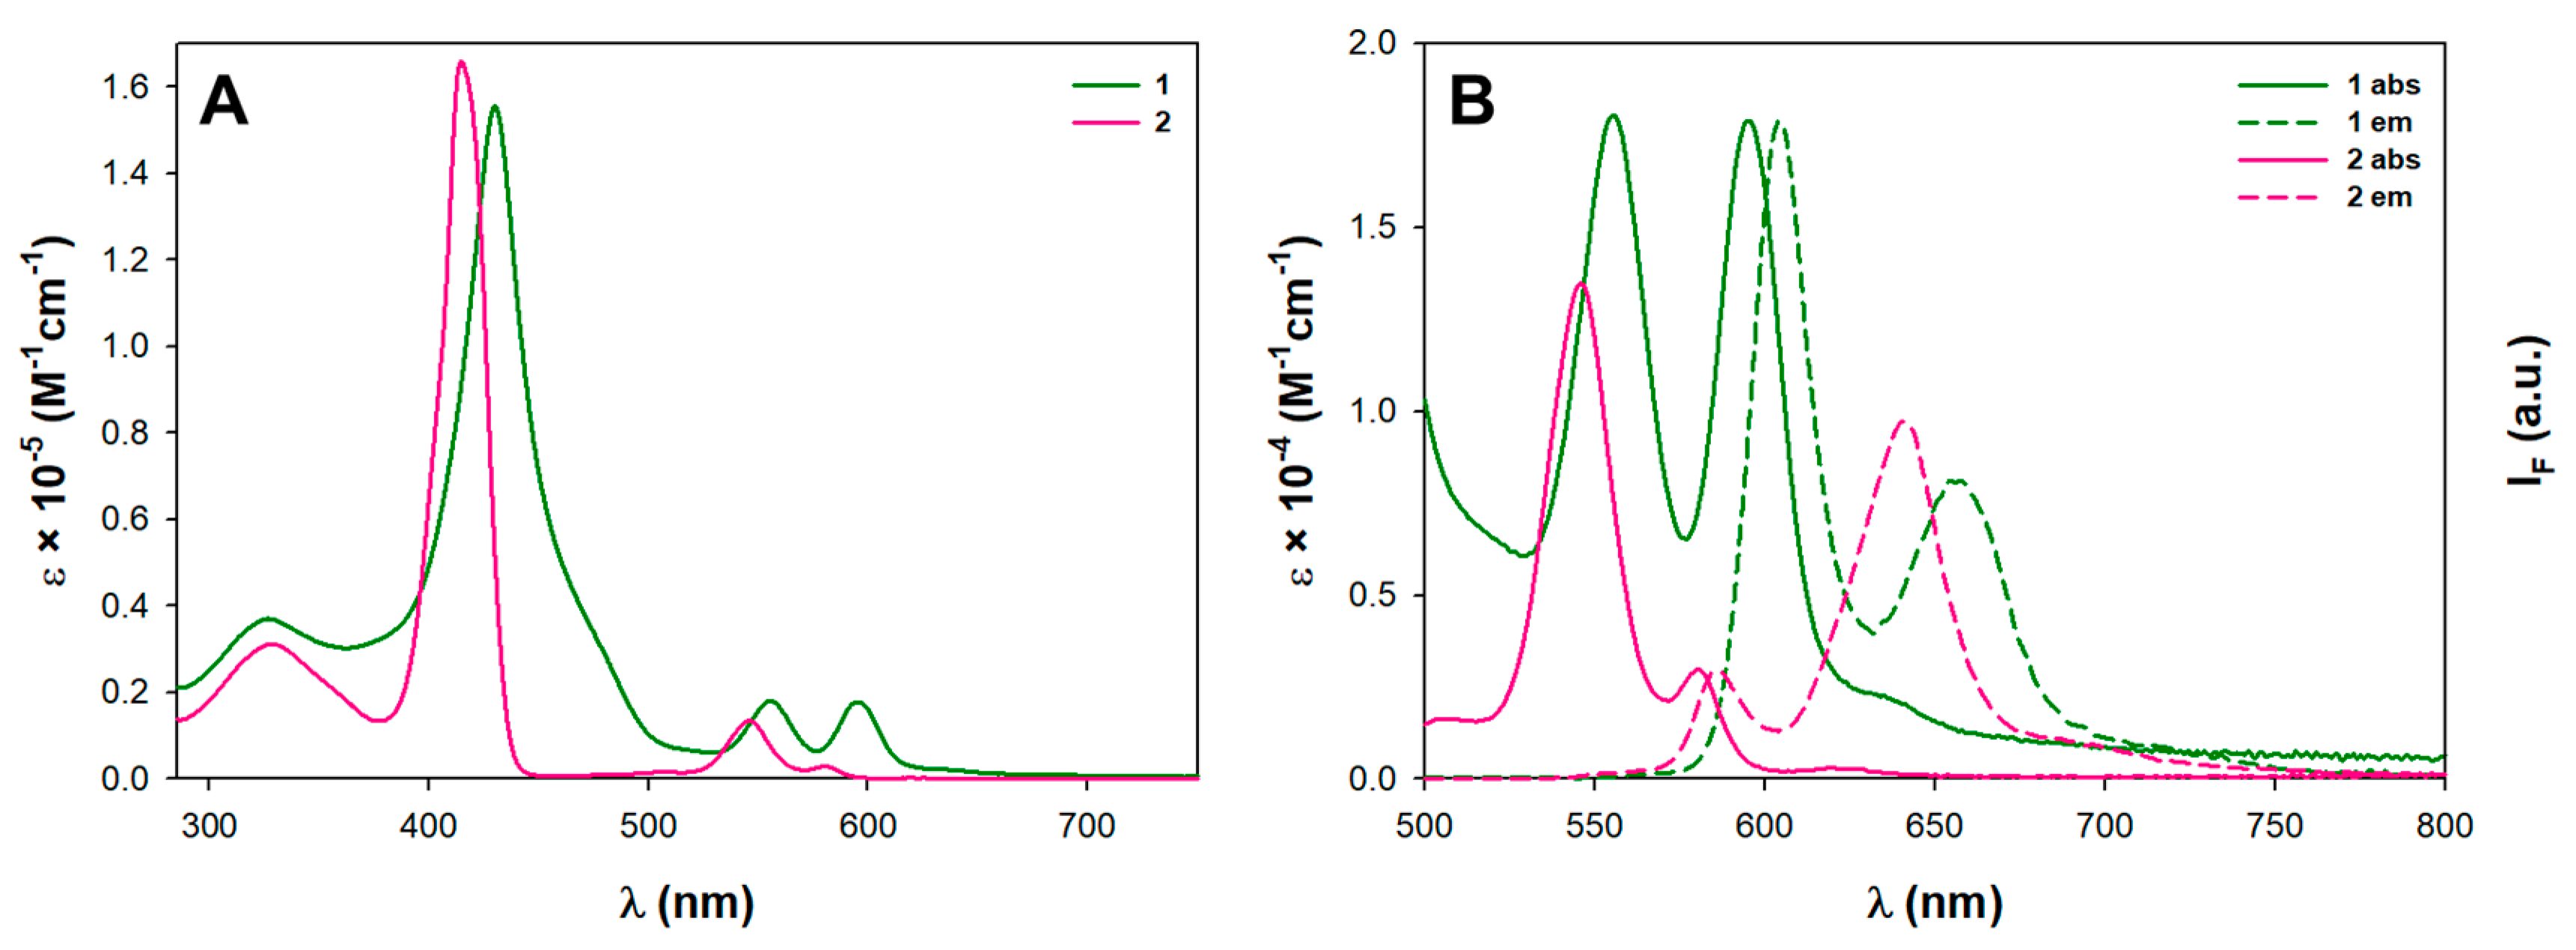
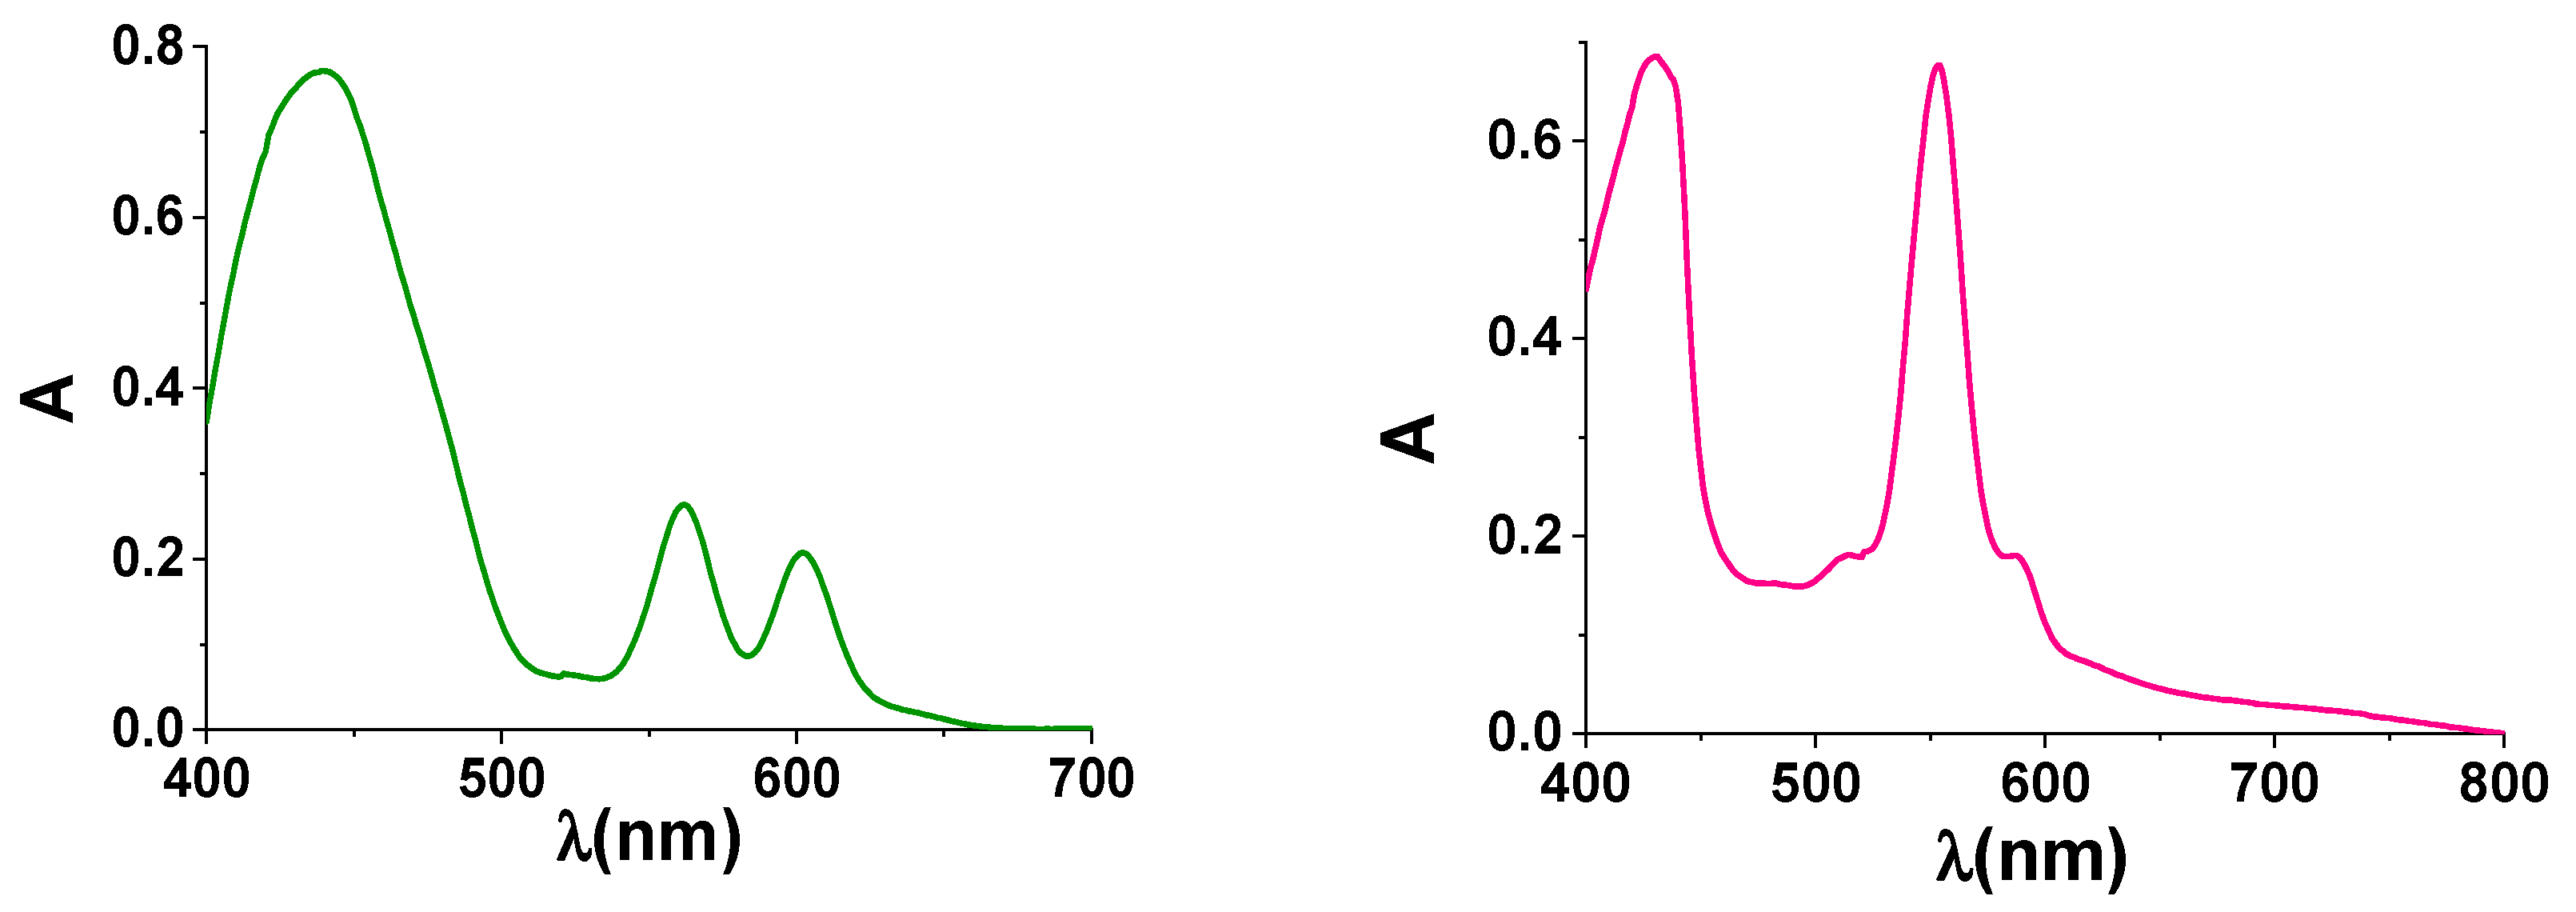
3.2. Spectroscopic and Electrochemical Properties in Solution
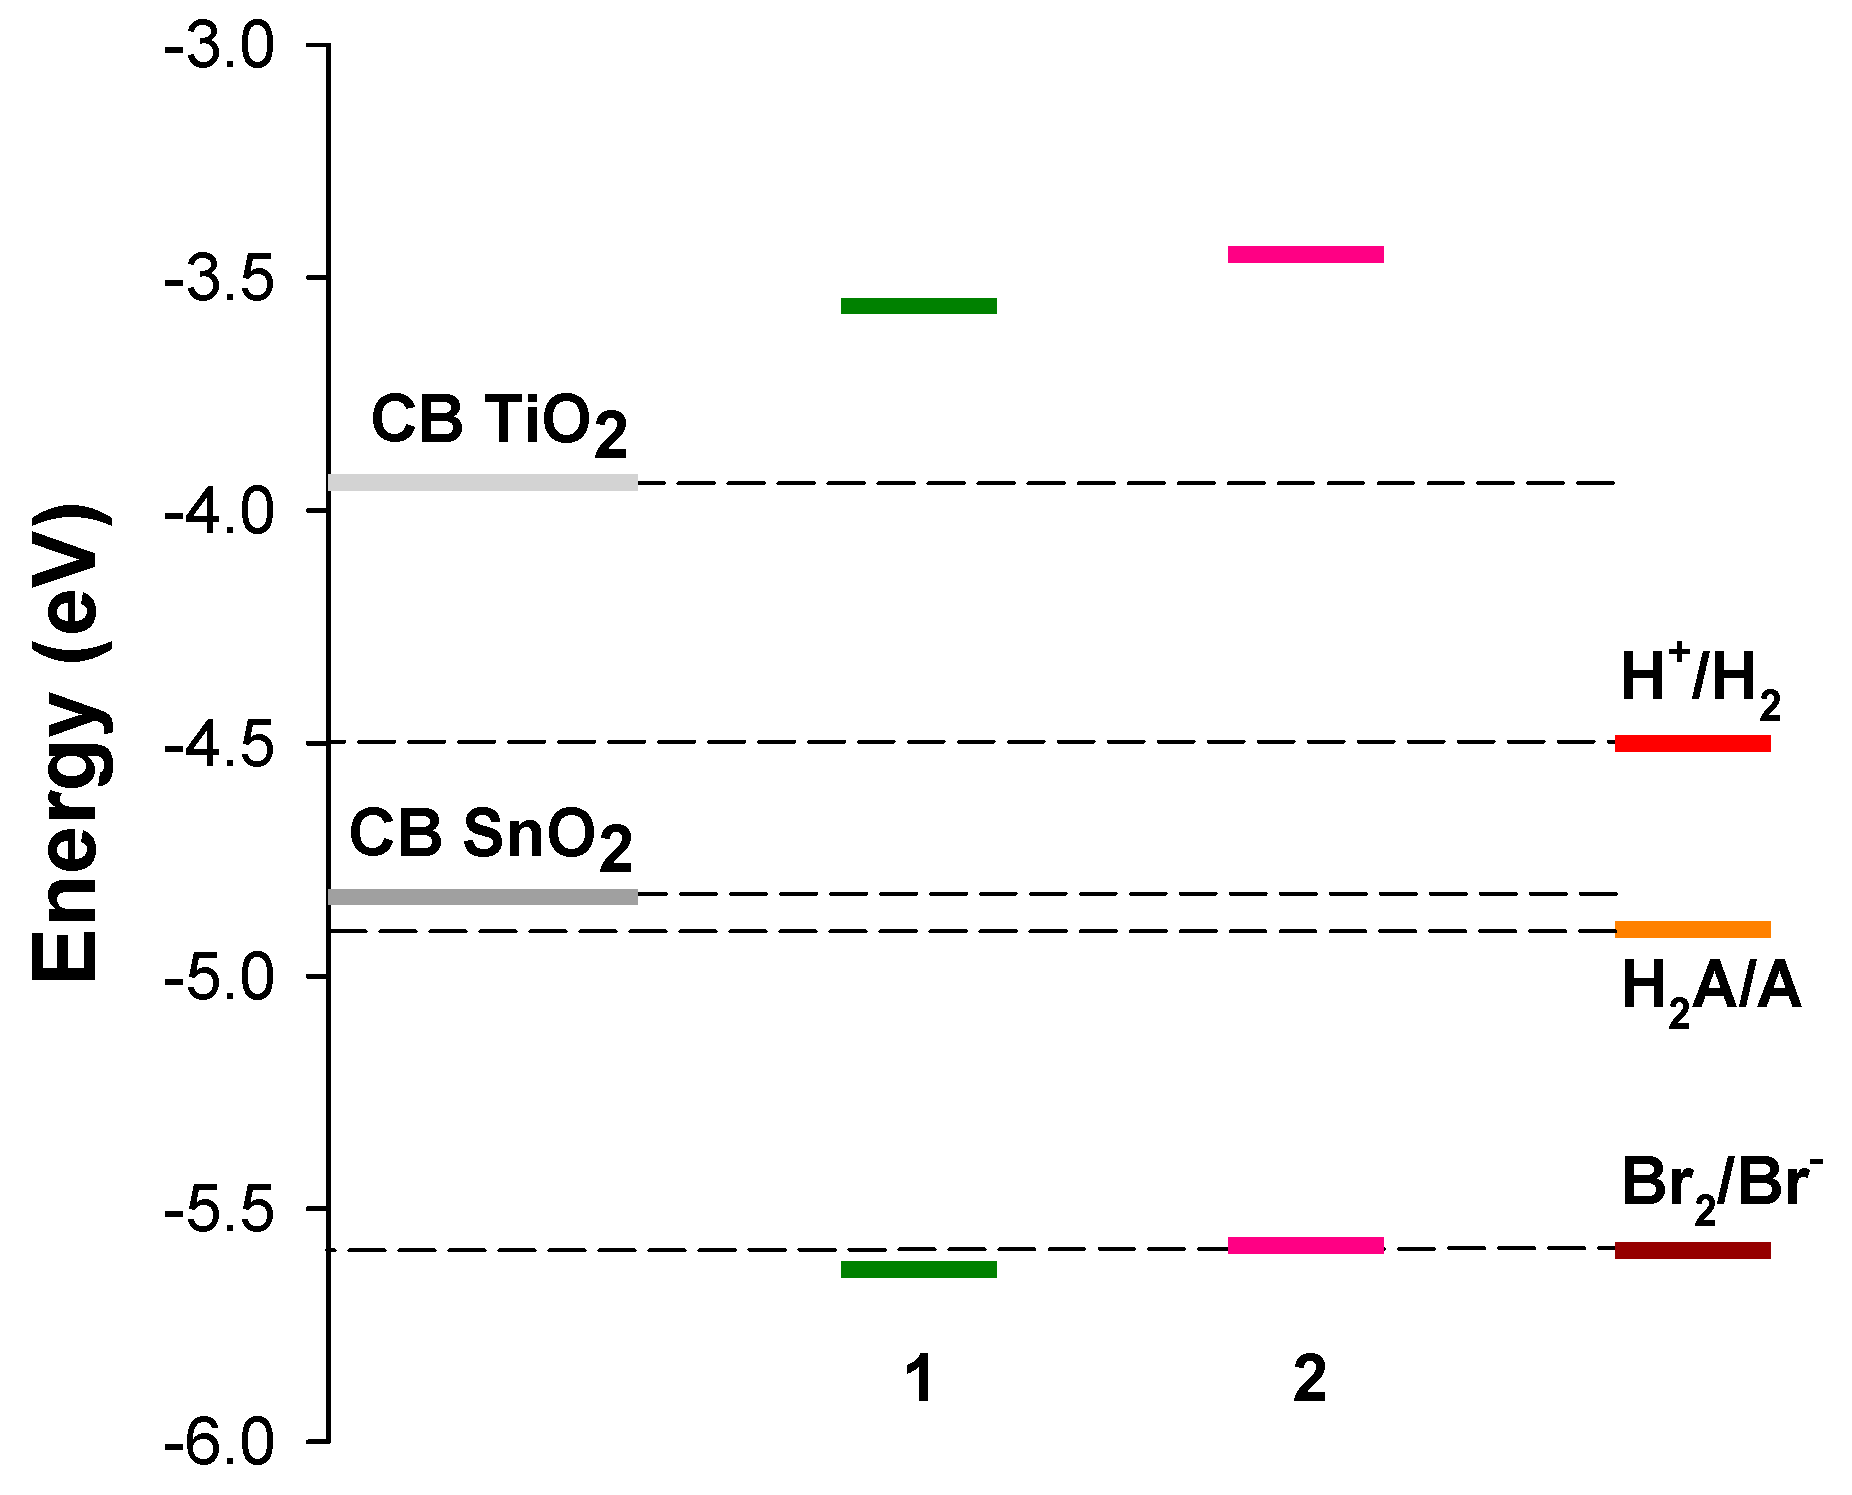
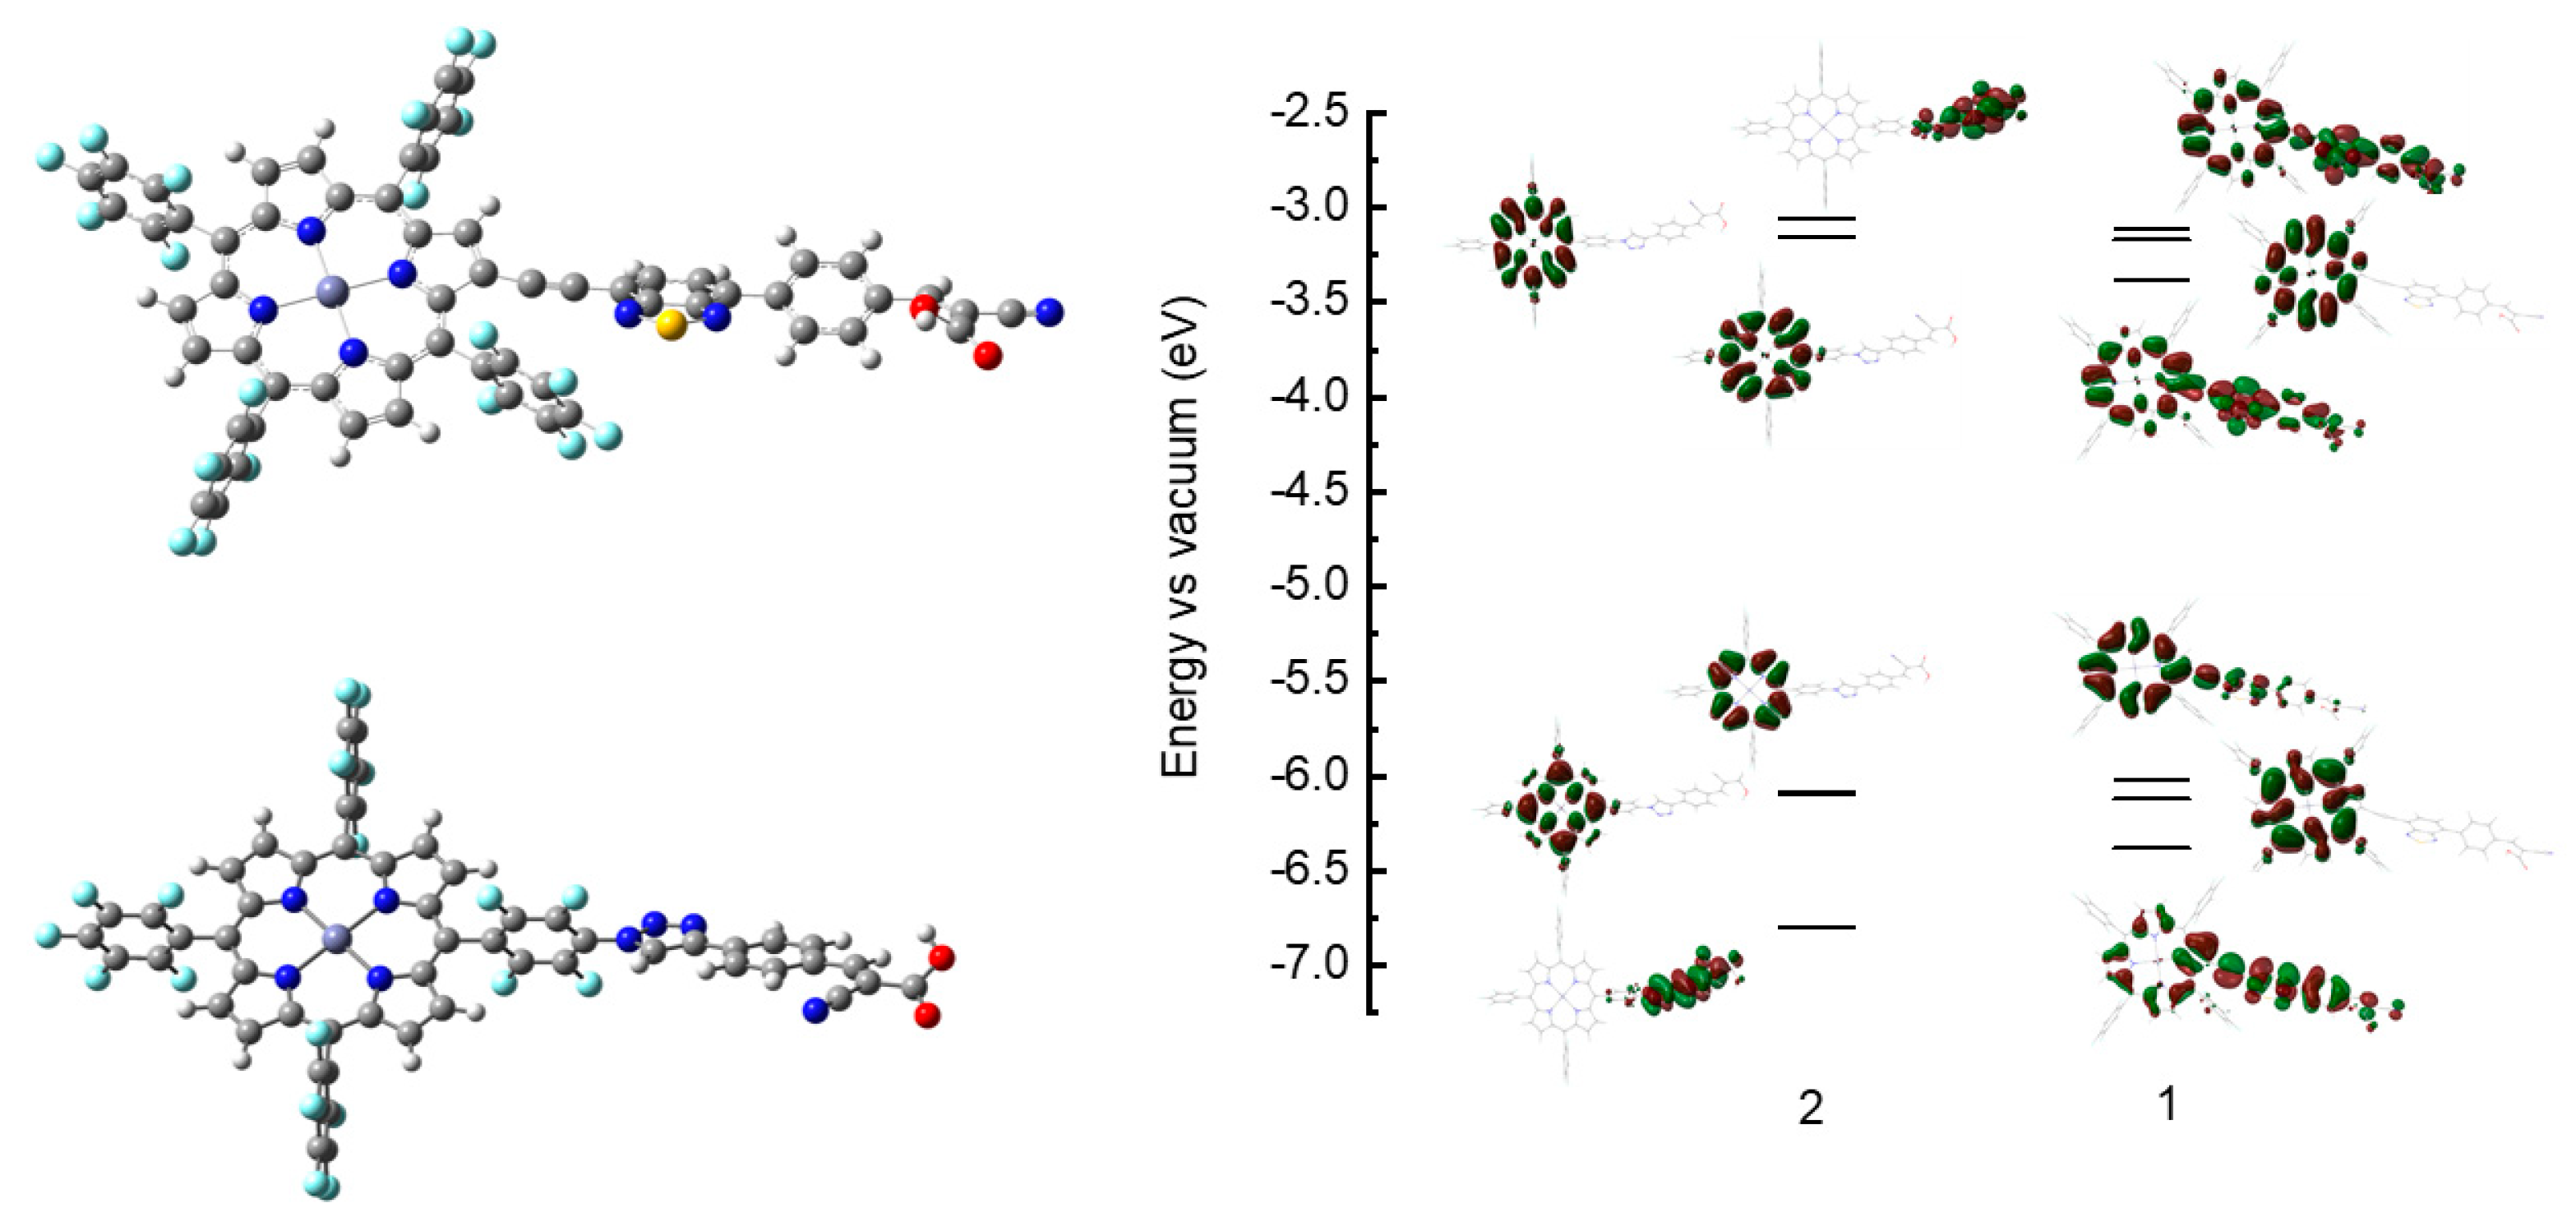
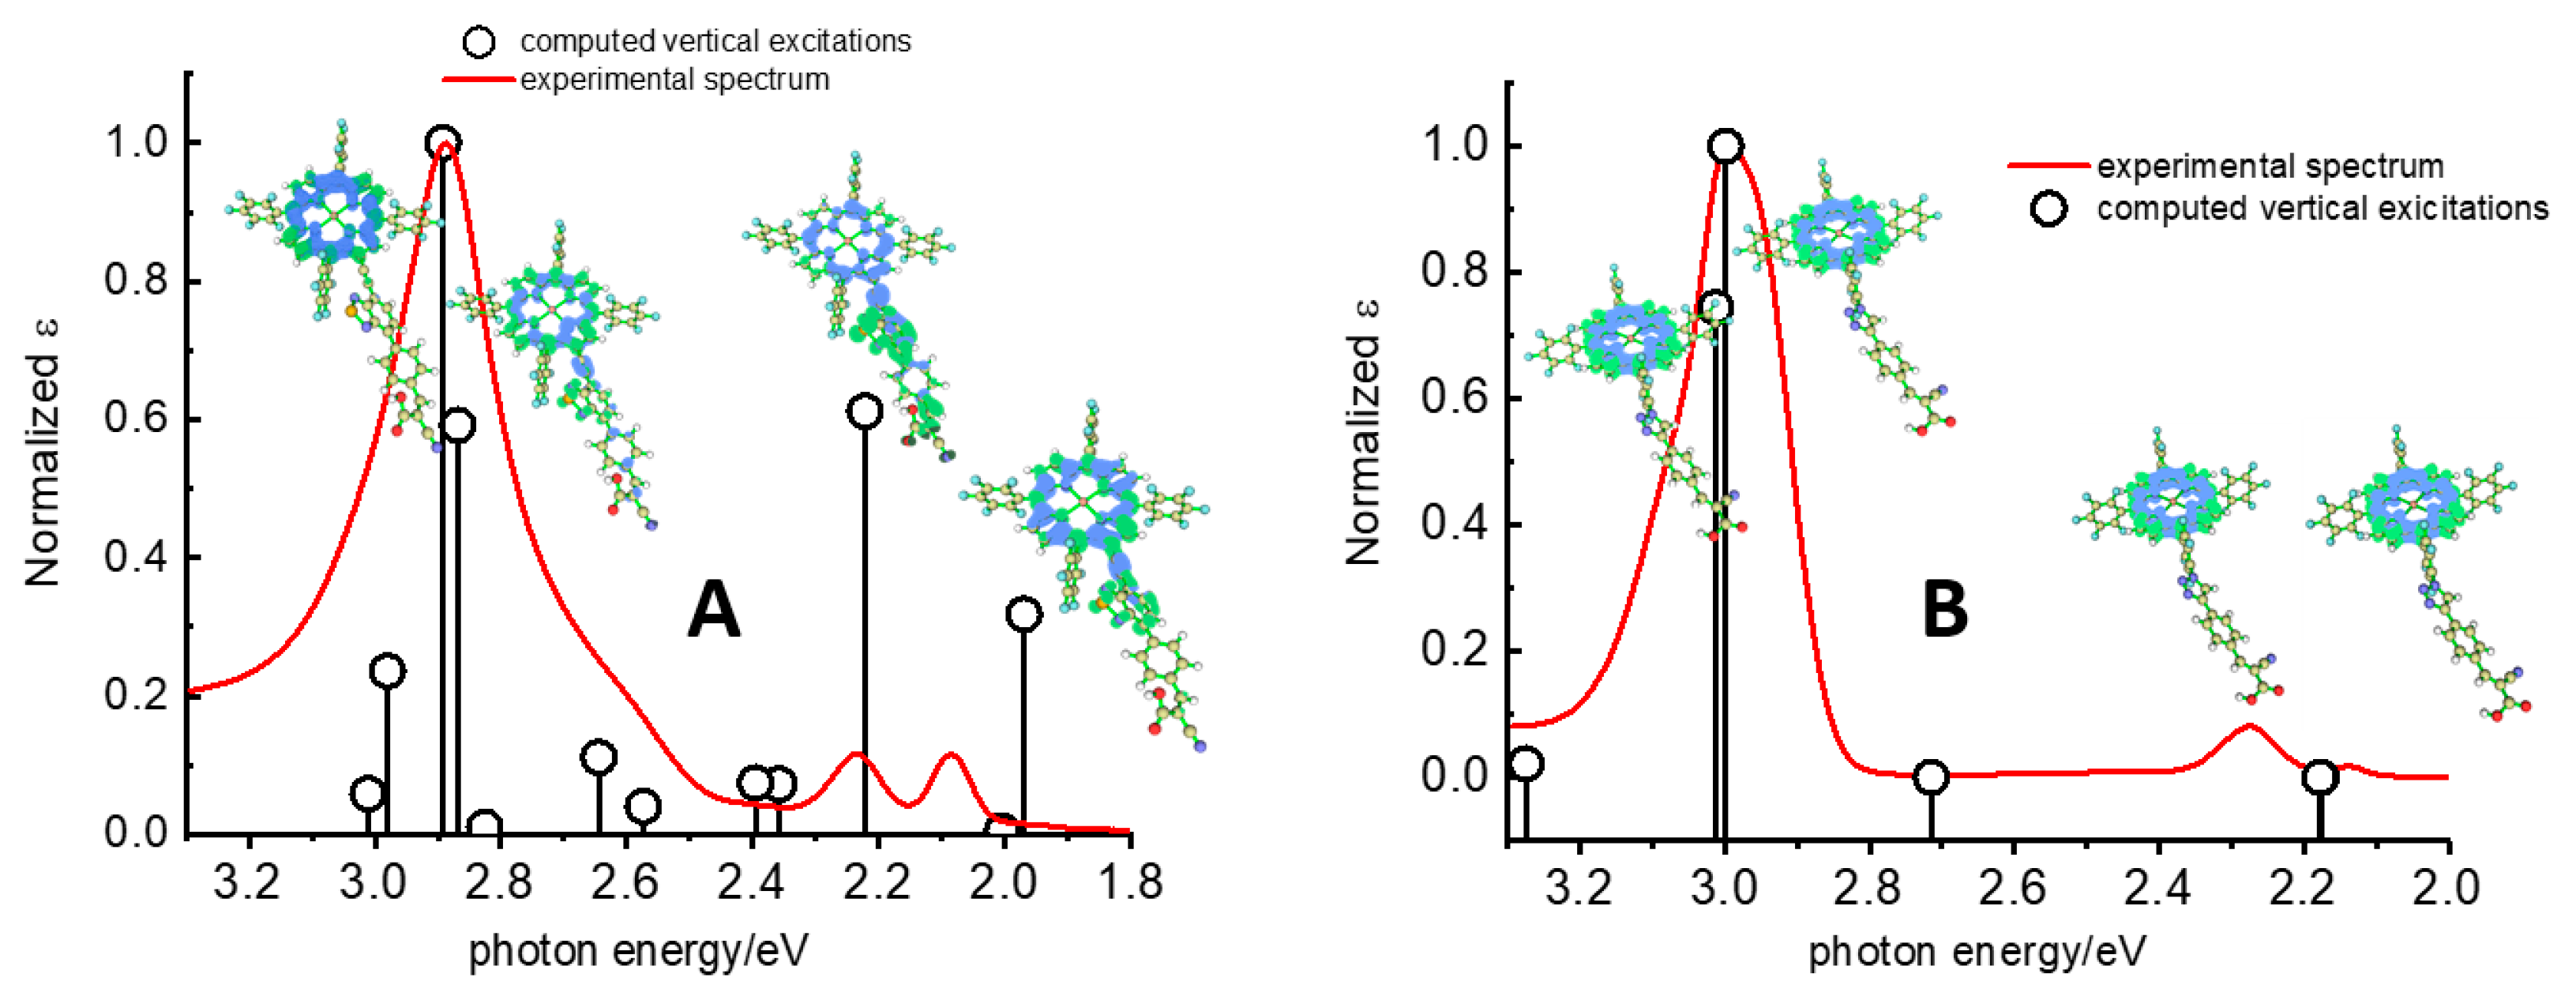
3.3. Computational Results
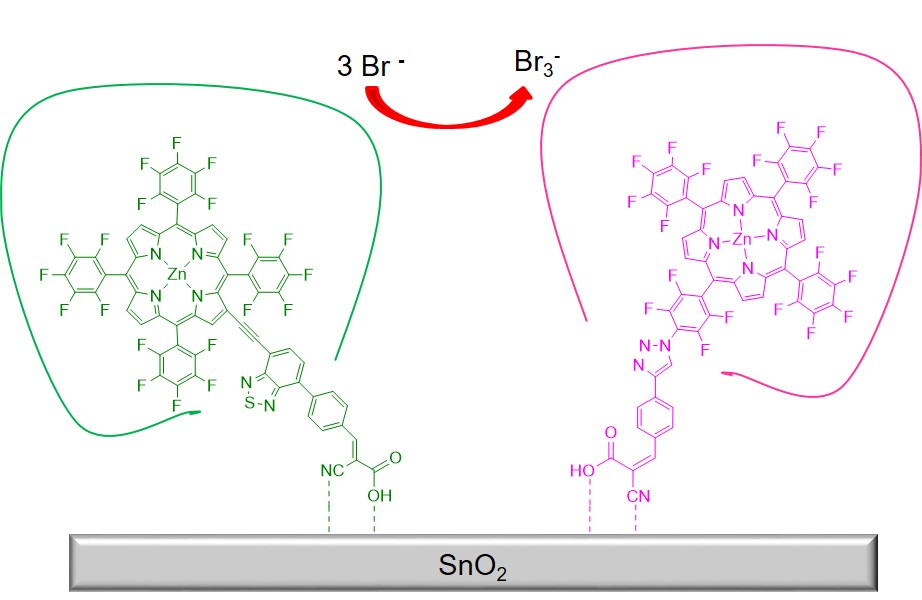
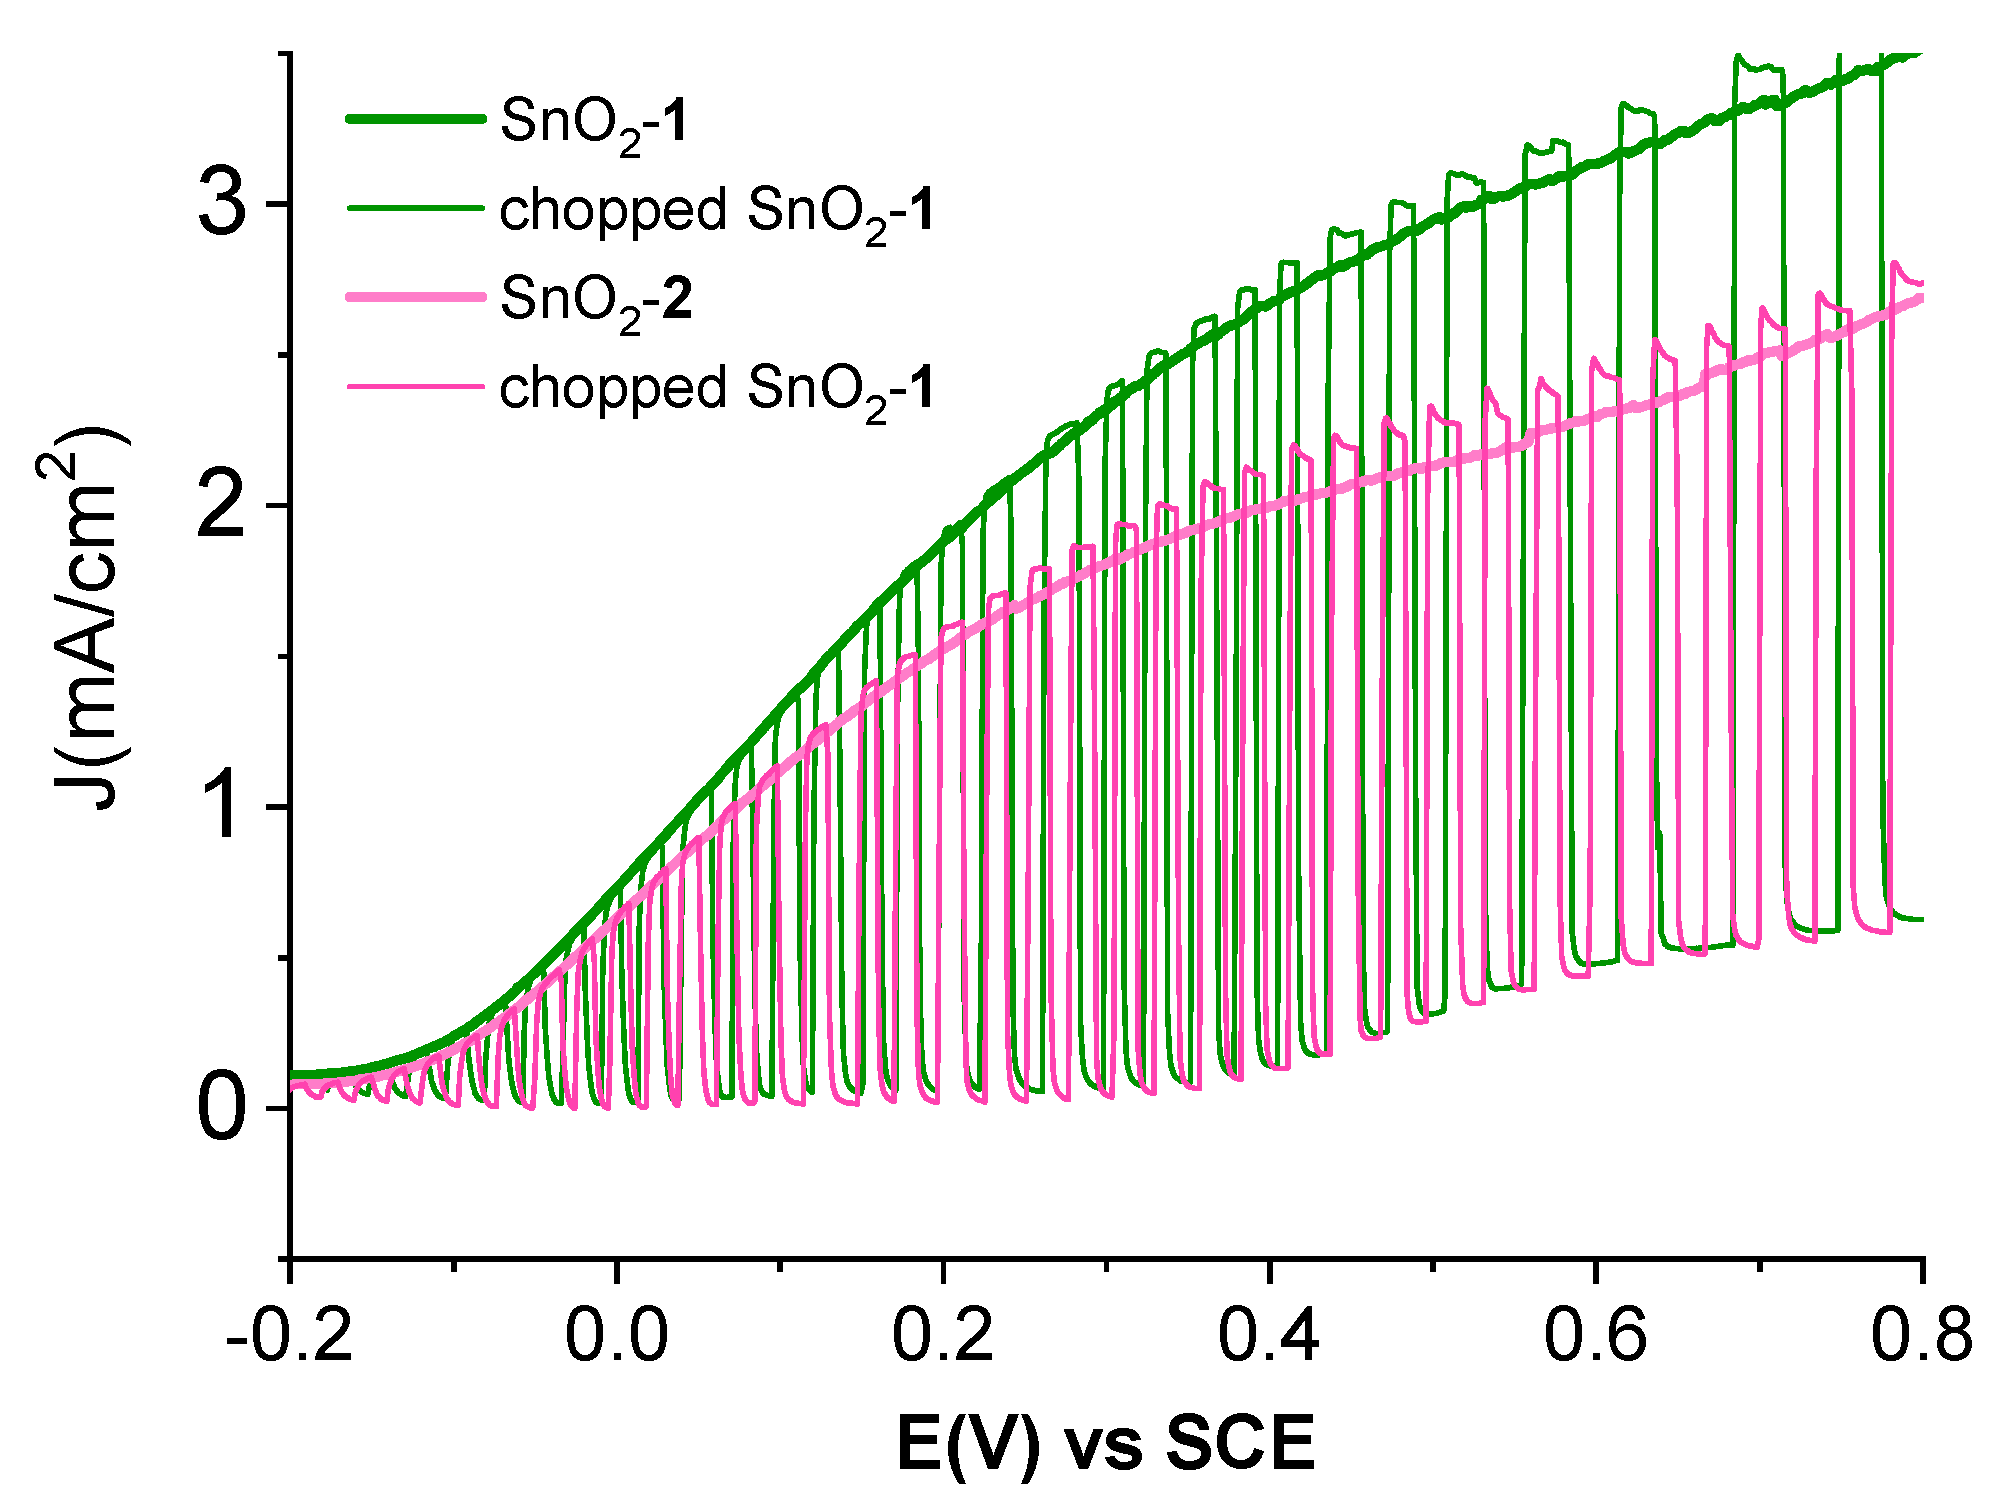
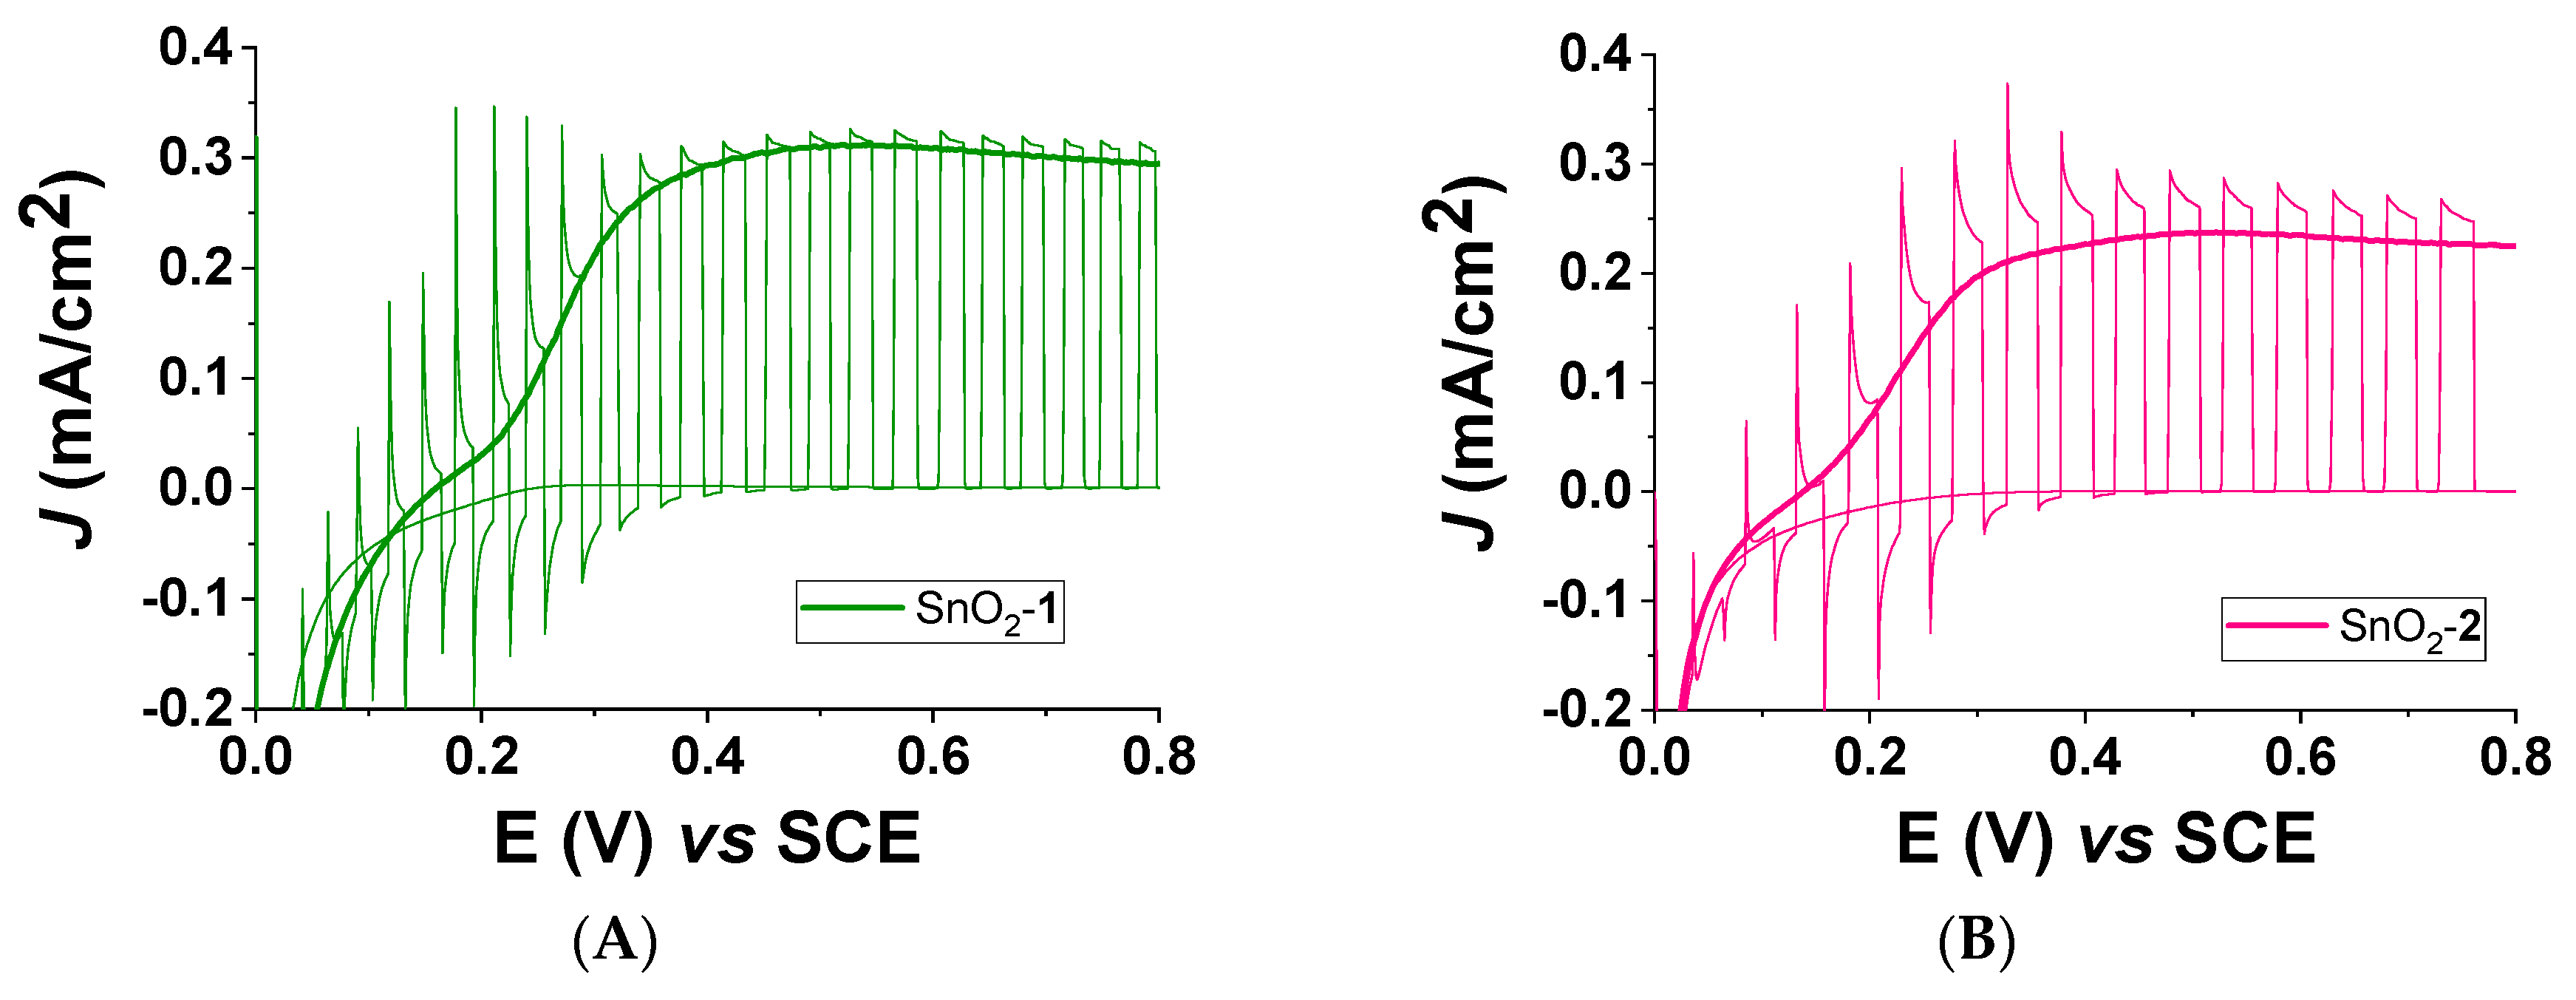
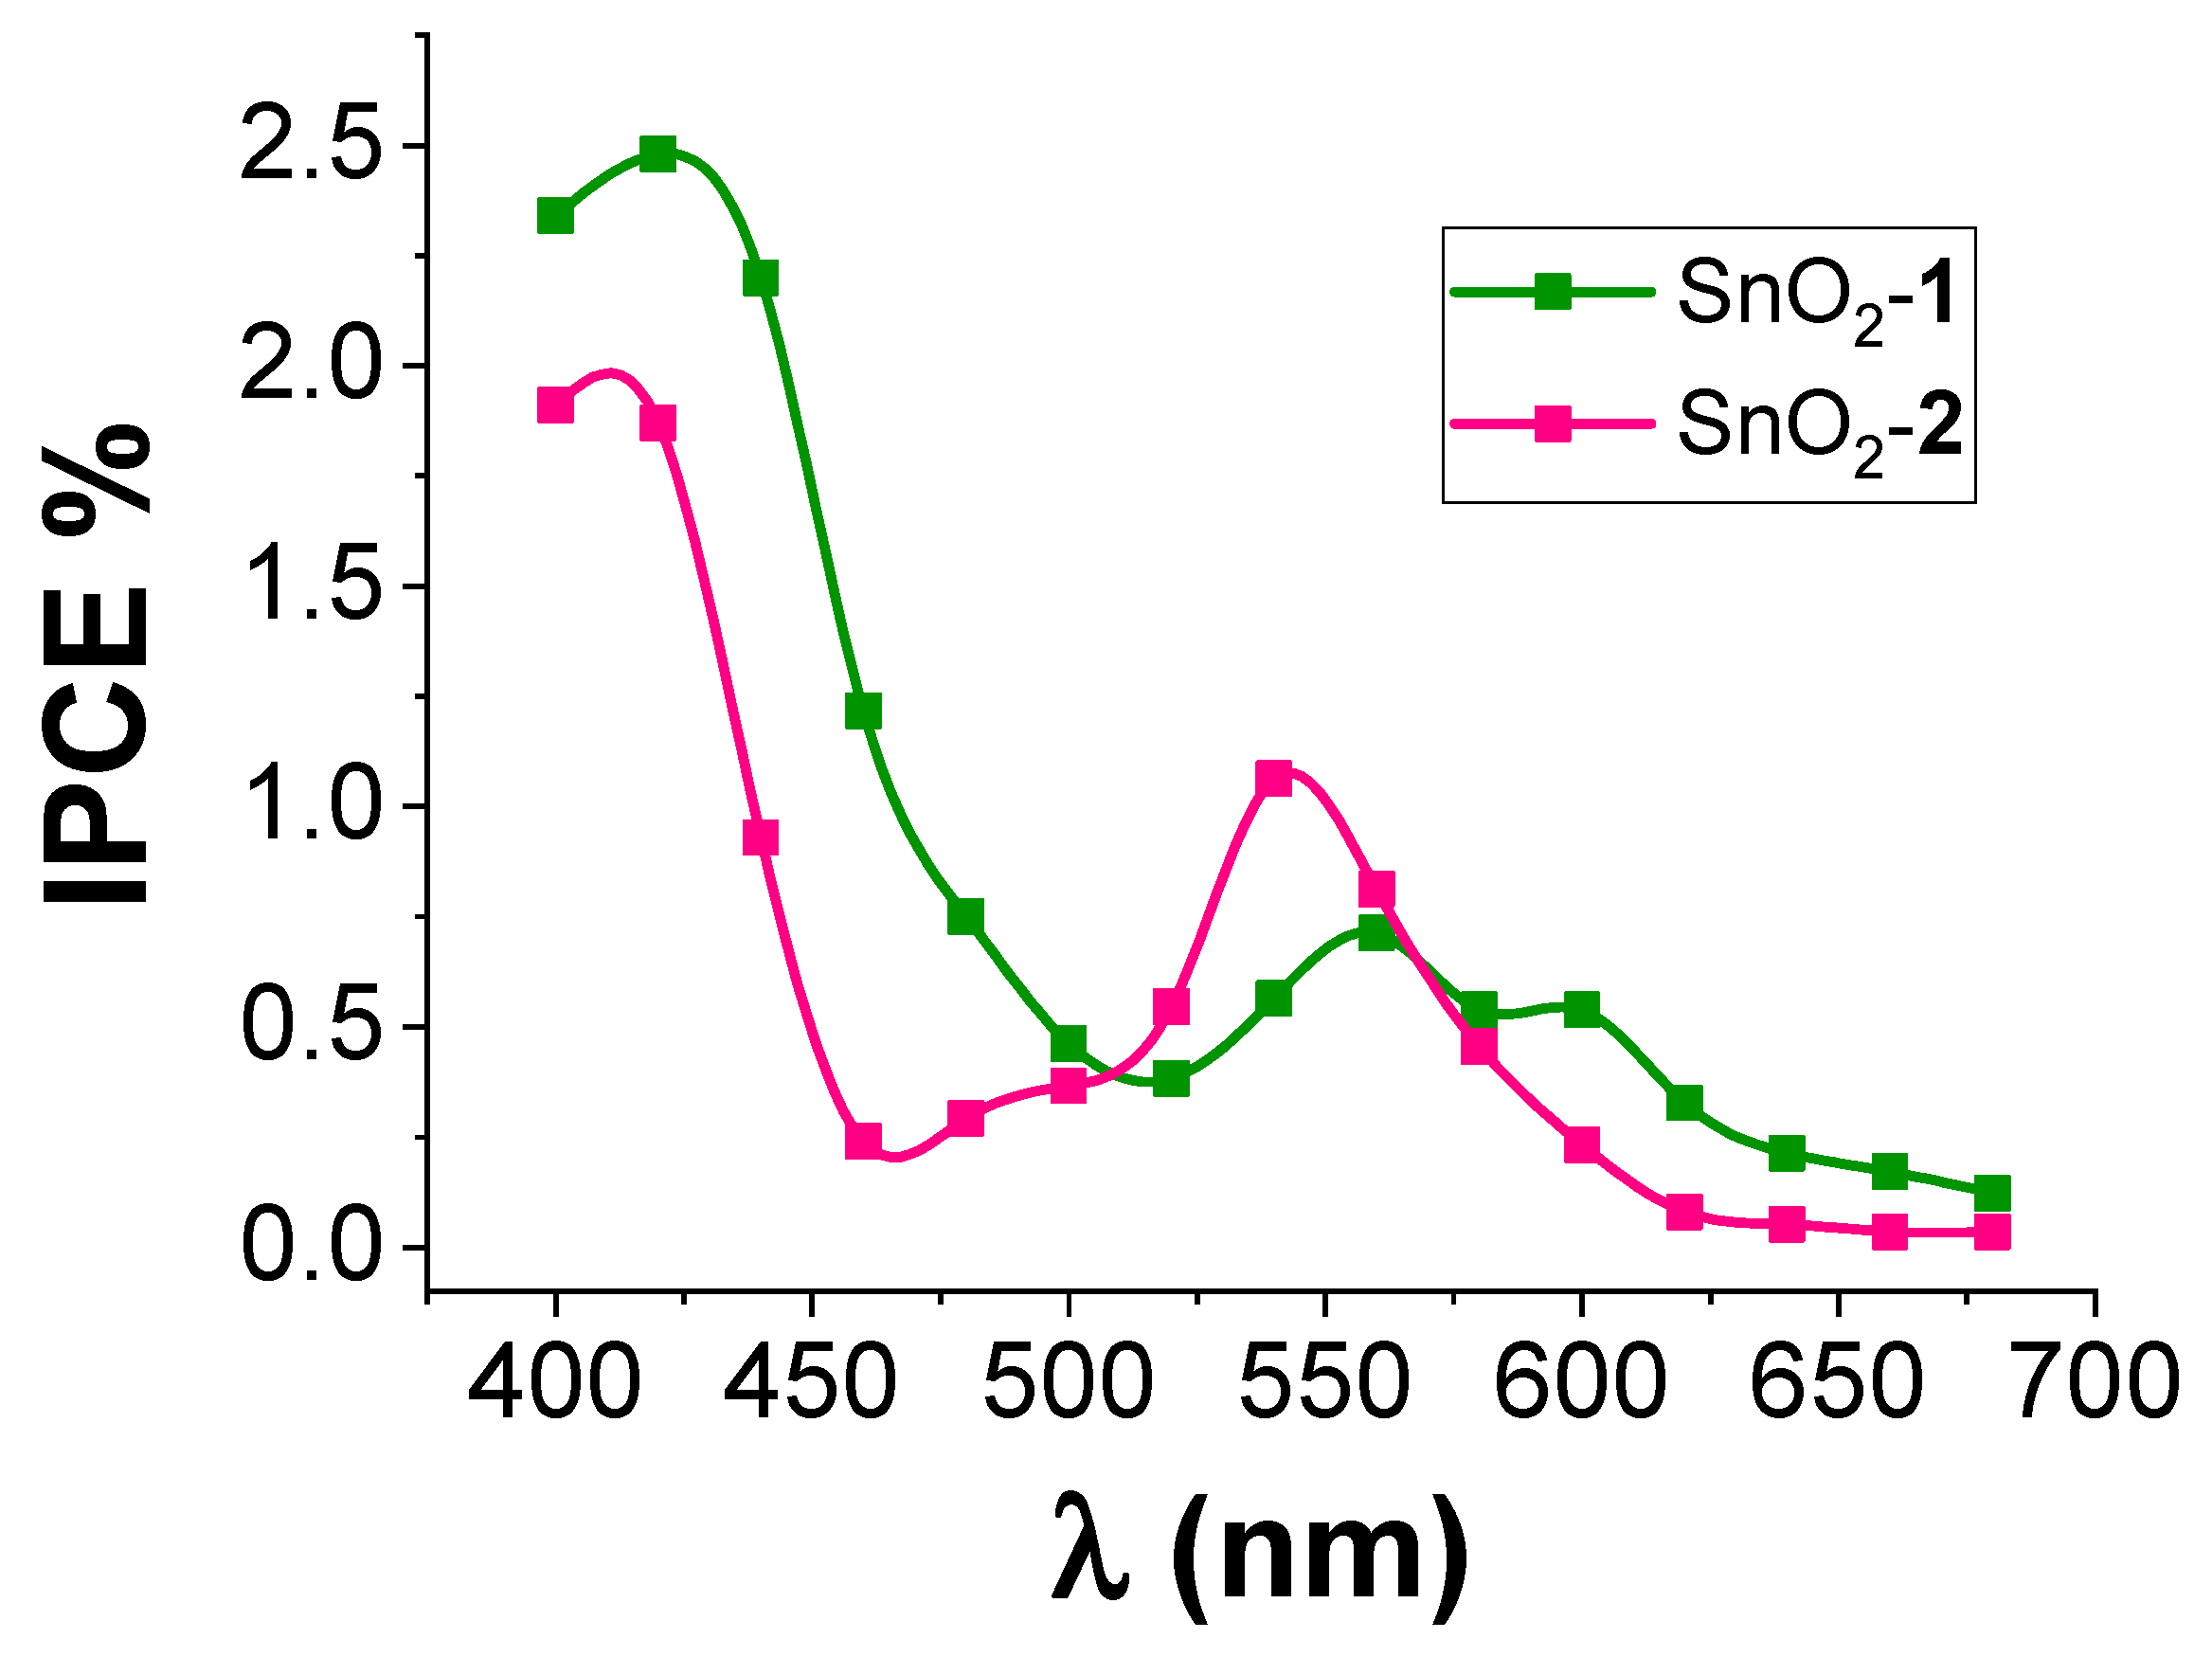
3.4. Spectroscopic and Photoelectrochemical Characterization of the Sensitized Photoanodes
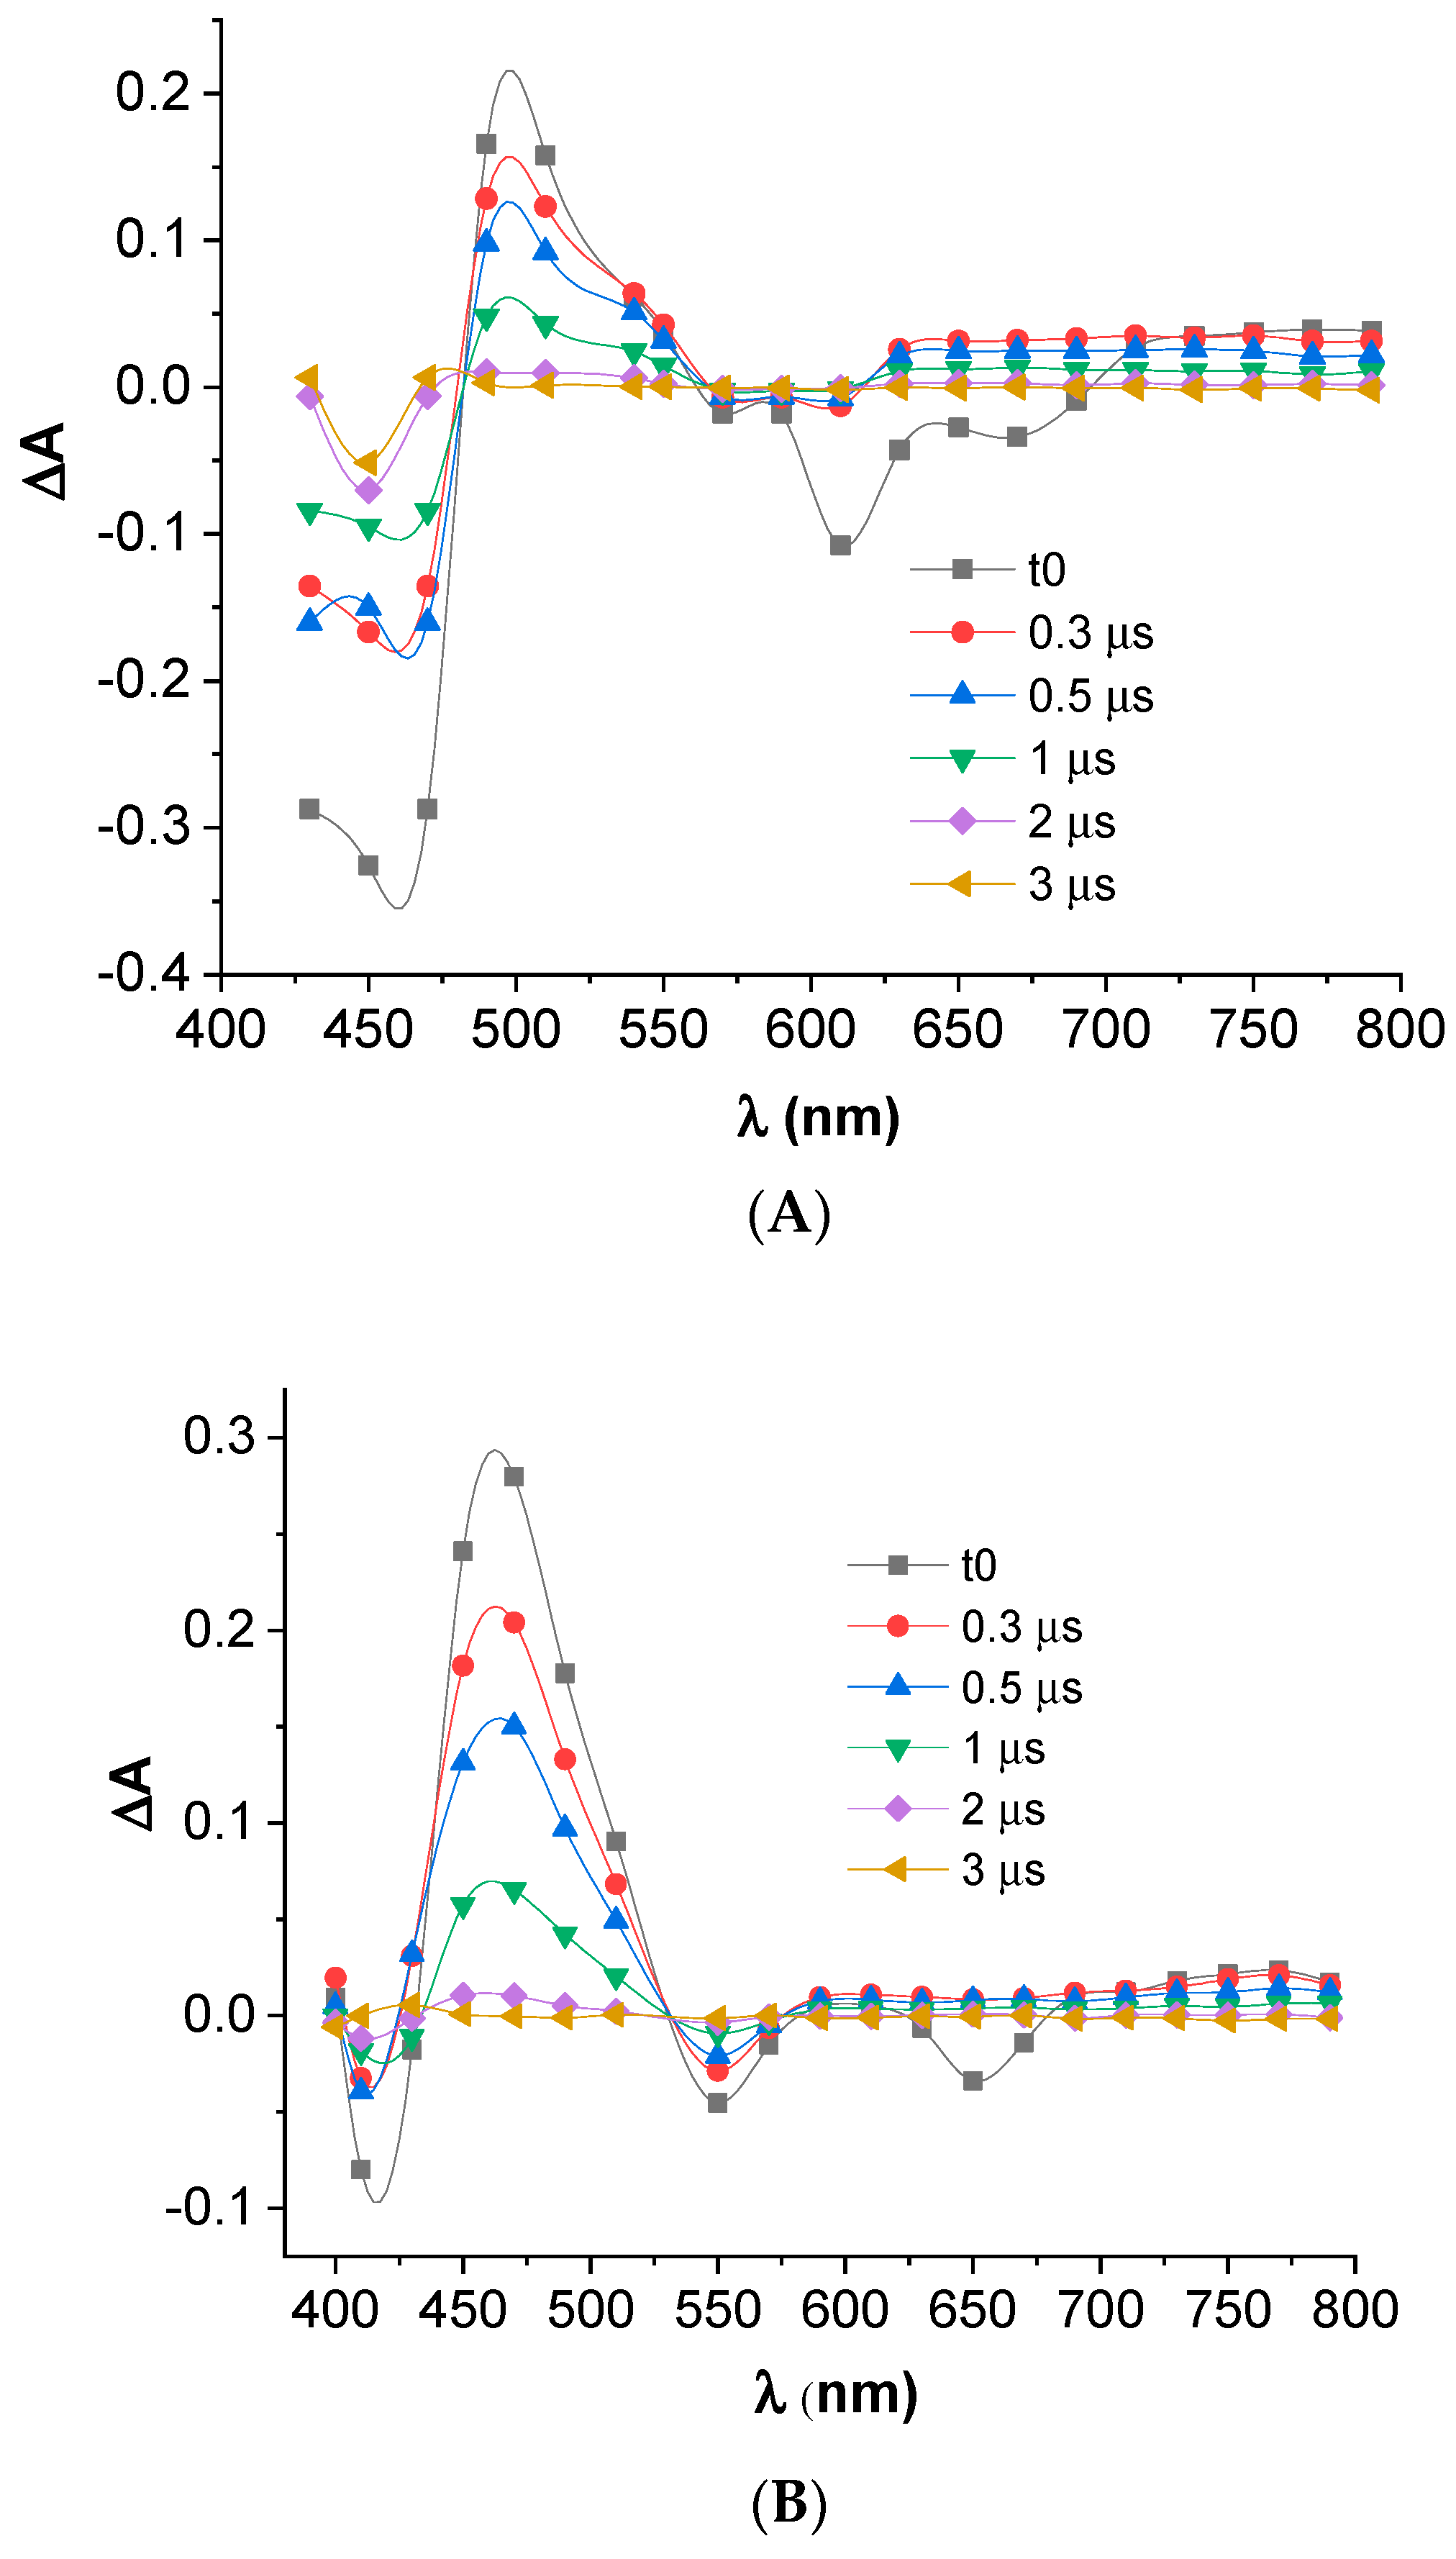
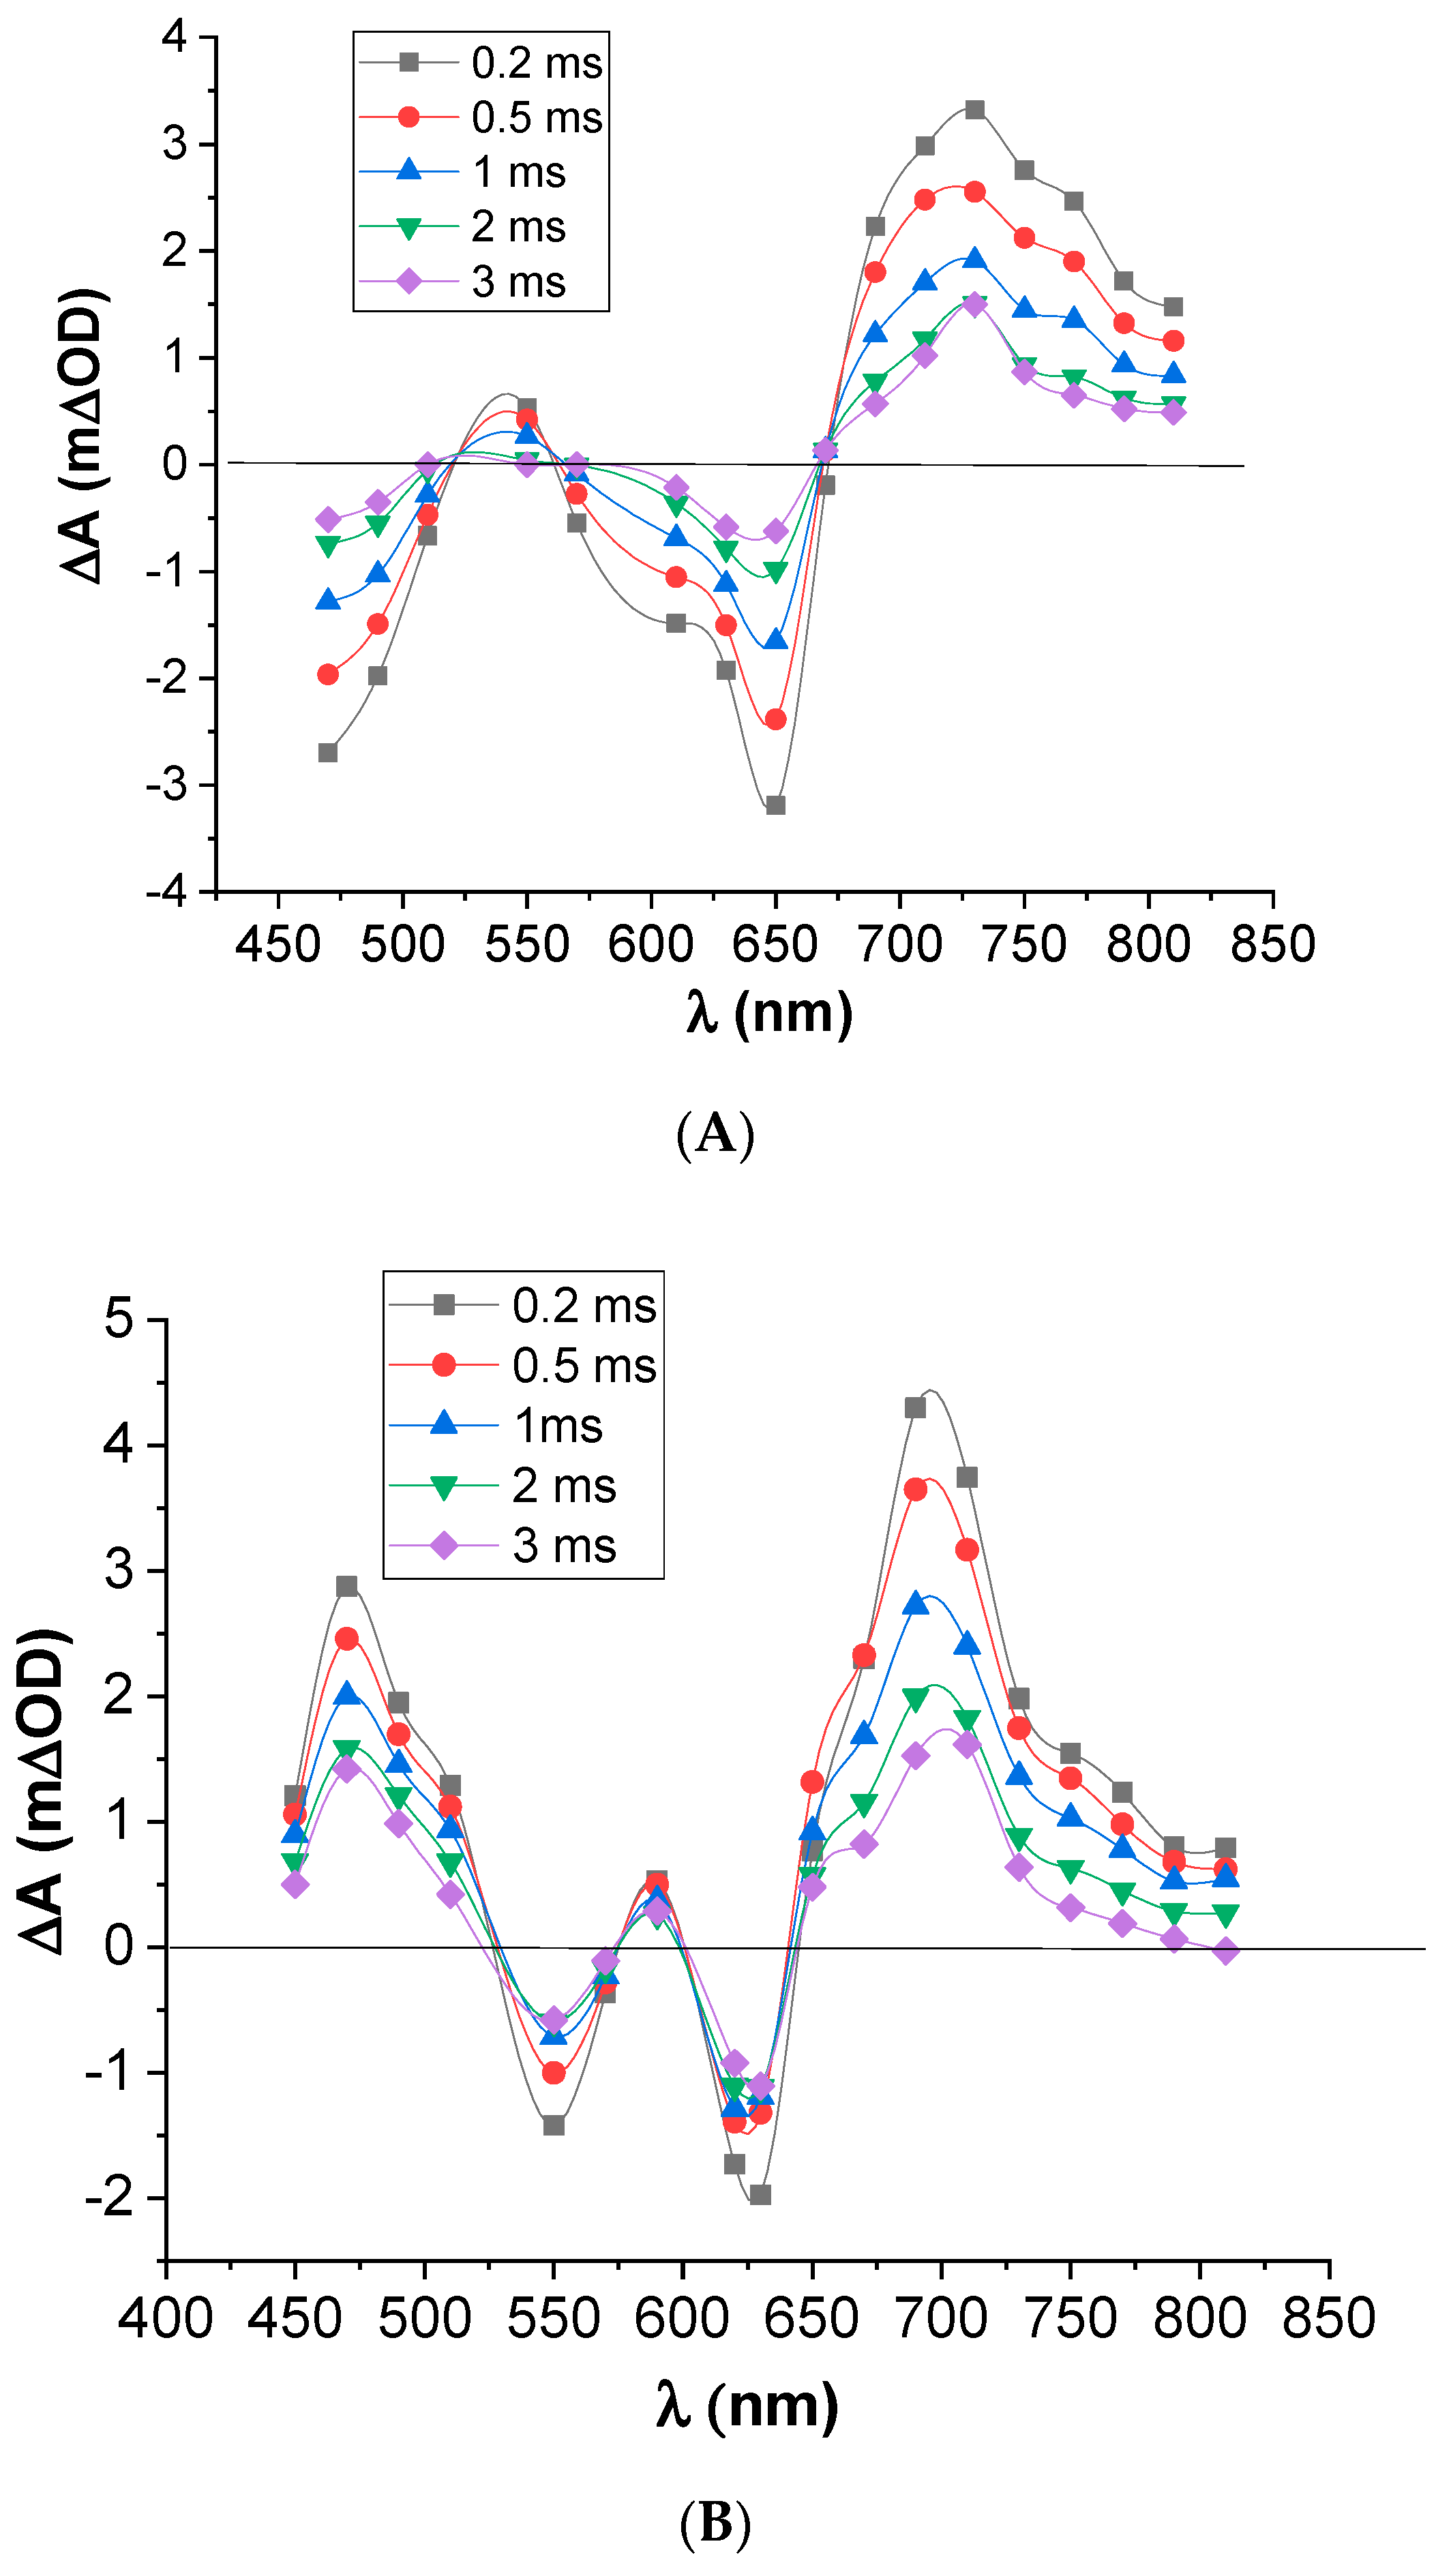
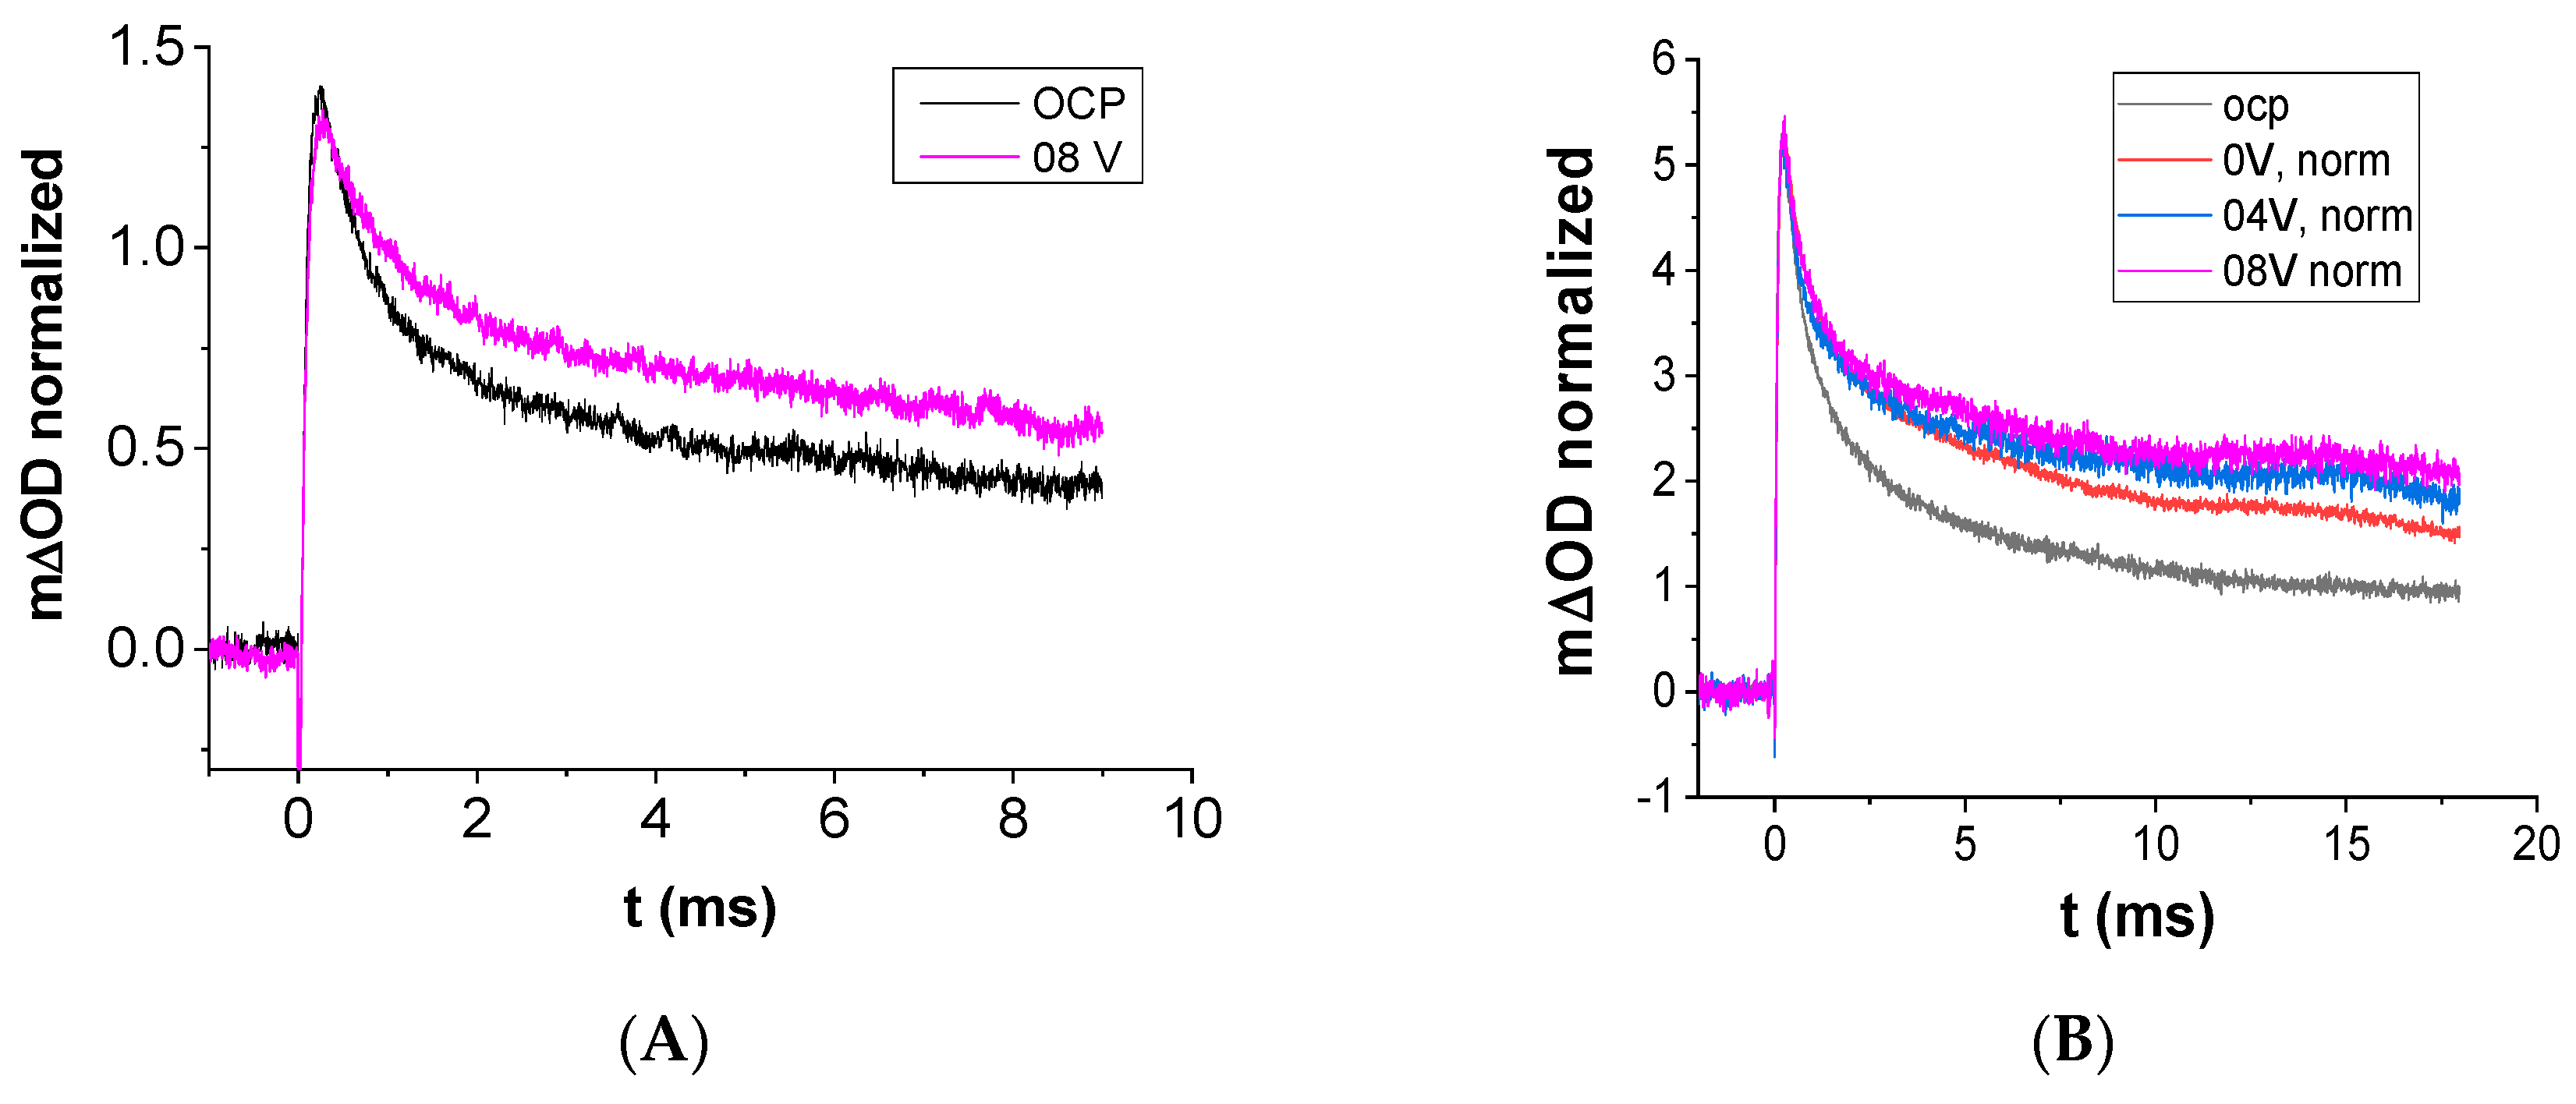
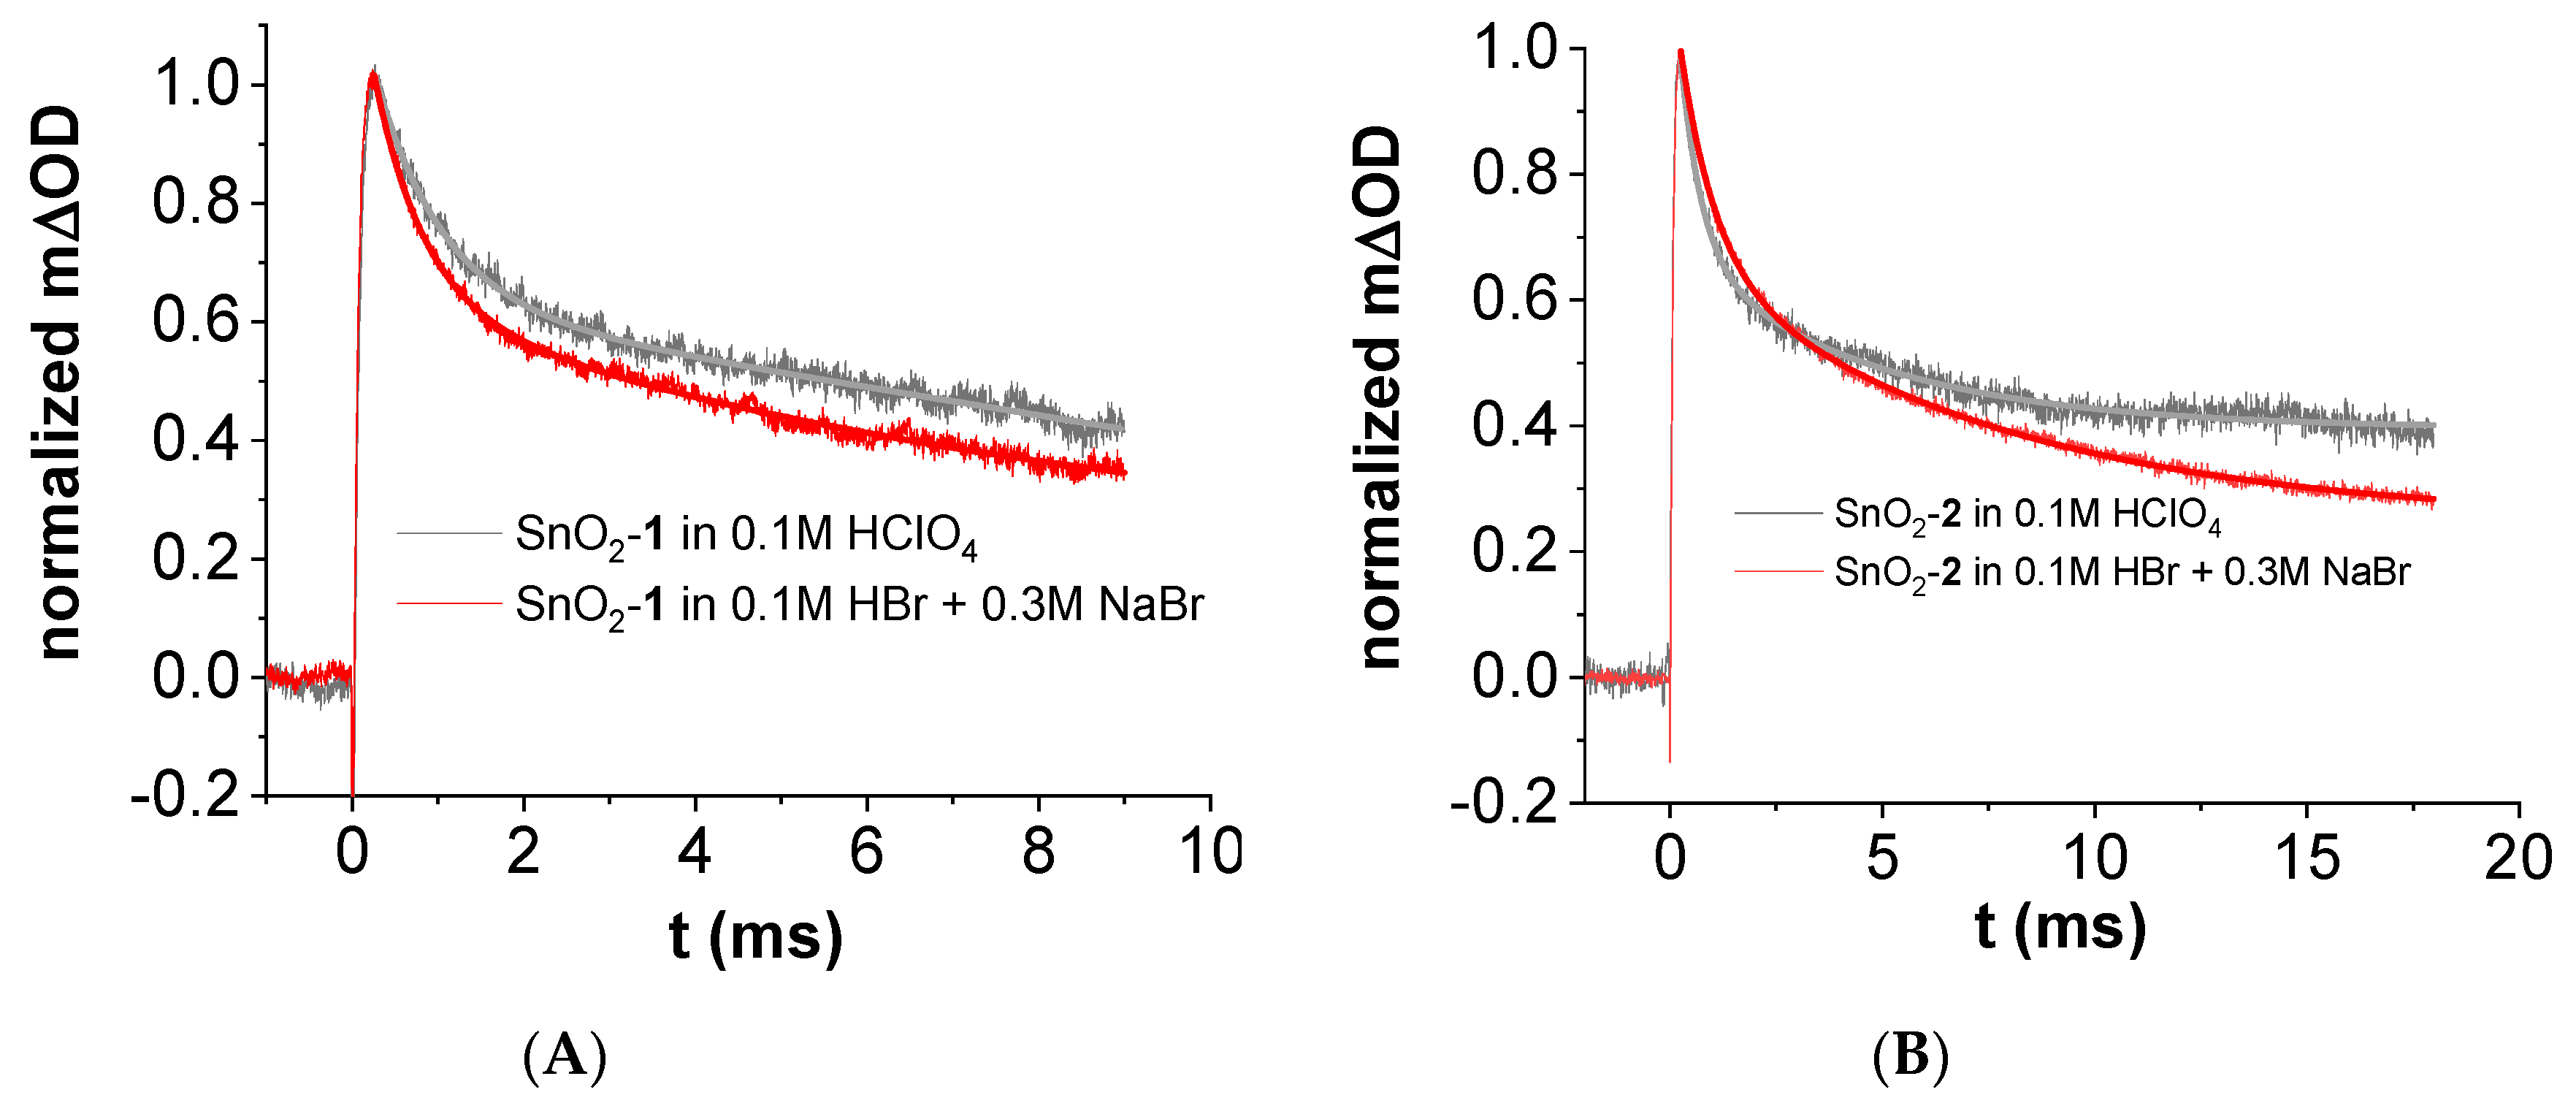
3.5. Transient Absorption Spectroscopy
4. Conclusions
Supplementary Materials
Author Contributions
Acknowledgments
Conflicts of Interest
References
- Eisenberg, R.; Nocera, D. Overview of the Forum on Solar and Renewable Energy. Inorg. Chem. 2005, 44, 6799. [Google Scholar] [CrossRef] [PubMed]
- Lewis, N.S.; Nocera, D.G. Powering the Planet: Chemical Challenges in Solar Energy Utilization. Proc. Natl. Acad. Sci. USA 2006, 103, 15729–15735. [Google Scholar] [CrossRef] [PubMed]
- Lewis, N.S. Research Opportunities to Advance Solar Energy Utilization. Science 2016, 103, 1920. [Google Scholar] [CrossRef] [PubMed]
- Tachibana, Y.; Vayssieres, L.; Durrant, J.R. Artificial Photosynthesis for Solar Water-Splitting. Nat. Photonics 2012, 6, 511–518. [Google Scholar] [CrossRef]
- Ardo, S.; Sang, H.P.; Warren, E.L.; Lewis, N.S. Unassisted solar-driven photoelectrosynthetic HI splitting using membrane-embedded Si microwire arrays. Energy Environ. Sci. 2015, 8, 1484. [Google Scholar] [CrossRef]
- Levy-Clement, C.; Heller, A.; Bonner, W.; Parkinson, B. Spontaneous Photoelectrolysis of HBr and HI. J. Electrochem. Soc. 1982, 129, 1701–1705. [Google Scholar] [CrossRef]
- Khaselev, O.; Turner, J.A. Photoelectrolysis of HBr and HI Using a Monolithic Combined Photoelectrochemical/Photovoltaic Device. Electrochem. Solid-State Lett. 1999, 2, 310–312. [Google Scholar] [CrossRef]
- Brady, M.D.; Sampaio, R.N.; Wang, D.; Meyer, T.J.; Meyer, G.J. Dye-Sensitized Hydrobromic Acid Splitting for Hydrogen Solar Fuel Production. J. Am. Chem. Soc. 2017, 139, 15612–15615. [Google Scholar] [CrossRef] [PubMed]
- Berardi, S.; Cristino, V.; Canton, M.; Boaretto, R.; Argazzi, R.; Benazzi, E.; Ganzer, L.; Borrego Varillas, R.; Cerullo, G.; Syrgiannis, Z.; et al. Perylene Diimide Aggregates on Sb-Doped SnO2: Charge Transfer Dynamics Relevant to Solar Fuel Generation. J. Phys. Chem. C 2017, 121, 17737–17745. [Google Scholar] [CrossRef]
- Cho, K.T.; Tucker, M.C.; Ding, M.; Ridgway, P.; Battaglia, V.S.; Srinivasan, V.; Weber, A.Z. Cyclic Performance Analysis of Hydrogen/Bromine Flow Batteries for Grid-Scale Energy Storage. ChemPlusChem 2015, 80, 402–411. [Google Scholar] [CrossRef]
- Brady, M.D.; Troian-Gautier, L.; Sampaio, R.N.; Motley, T.C.; Meyer, G.J. Optimization of Photocatalyst Excited—And Ground-State Reduction Potentials for Dye-Sensitized HBr Splitting. ACS Appl. Mater. Interfaces 2018, 10, 31312–31323. [Google Scholar] [CrossRef] [PubMed]
- Mussini, P.R.; Orbelli Biroli, A.; Tessore, F.; Pizzotti, M.; Biaggi, C.; Di Carlo, G.; Lobello, M.G.; De Angelis, F. Modulating the electronic properties of asymmetric push–pull and symmetric Zn(II)-diarylporphyrinates with para substituted phenylethynyl moieties in 5,15 meso positions: A combined electrochemical and spectroscopic investigation. Electrochim. Acta 2012, 85, 509–523. [Google Scholar] [CrossRef]
- Hodge, J.A.; Hill, M.G.; Gray, H.B. Electrochemistry of Nonplanar Zinc(II) Tetrakis(Pentafluorophenyl)porphyrins. Inorg. Chem. 1995, 34, 809–812. [Google Scholar] [CrossRef]
- Yang, S.I.; Seth, J.; Strachan, J.P.; Gentemann, S.; Kim, D.; Holten, D.; Lindsey, J.S.; Bocian, D.F. Excited State Electronic Properties of Halogenated Tetraarylporphyrins. Tuning the Building Blocks for Porphyrin-Based Photonic Devices. J. Porphyr. Phthalocyanines 1999, 3, 117. [Google Scholar] [CrossRef]
- Yella, A.; Lee, H.-W.; Tsao, H.N.; Yi, C.; Chandiran, A.K.; Nazeeruddin, M.K.; Diau, E.W.-G.; Yeh, C.-Y.; Zakeeruddin, S.M.; Grätzel, M. Porphyrin-sensitized solar cells with cobalt (II/III)–based redox electrolyte exceed 12 percent efficiency. Science 2011, 334, 629–634. [Google Scholar] [CrossRef] [PubMed]
- Xie, Y.; Tang, Y.; Wu, W.; Wang, Y.; Liu, J.; Li, X.; Tian, H.; Zhu, W.-H. Porphyrin Cosensitization for a Photovoltaic Efficiency of 11.5%: A Record for Non-Ruthenium Solar Cells Based on Iodine Electrolyte. J. Am. Chem. Soc. 2015, 137, 14055–14058. [Google Scholar] [CrossRef] [PubMed]
- Moore, G.F.; Blakemore, J.D.; Milot, R.L.; Hull, J.F.; Song, H.; Cai, L.; Schmuttenmaer, C.A.; Crabtree, R.H.; Brudvig, G.W. A visible light water-splitting cell with a photoanode formed by codeposition of a high-potential porphyrin and an iridium water-oxidation catalyst. Energy Environ. Sci. 2011, 4, 2389–2392. [Google Scholar] [CrossRef]
- Materna, K.L.; Jiang, J.; Regan, K.P.; Schmuttenmaer, C.A.; Crabtree, R.H.; Brudvig, G.W. Optimization of Photoanodes for Photocatalytic Water Oxidation by Combining a Heterogenized Iridium Water-Oxidation Catalyst with a High-Potential Porphyrin Photosensitizer. ChemSusChem 2017, 10, 4526. [Google Scholar] [CrossRef]
- Ronconi, F.; Syrgiannis, Z.; Bonasera, A.; Prato, M.; Argazzi, R.; Caramori, S.; Cristino, V.; Bignozzi, C.A. Modification of Nanocrystalline WO3 with a Dicationic Perylene Bisimide: Applications to Molecular Level Solar Water Splitting. J. Am. Chem. Soc. 2015, 137, 4630–4633. [Google Scholar] [CrossRef]
- Gritzner, G. Polarographic half-wave potentials of cations in nonaqueous solvents. Pure Appl. Chem. 1990, 62, 1839–1858. [Google Scholar] [CrossRef] [Green Version]
- Gritzner, G.K.; Kůta, J. Recommendations on reporting electrode potentials in nonaqueous solvents: Iupac commission on electrochemistry. Electrochim. Acta 1984, 29, 869–873. [Google Scholar] [CrossRef]
- Ronconi, F.; Santoni, M.-P.; Nastasi, F.; Bruno, G.; Argazzi, R.; Berardi, S.; Caramori, S.; Bignozzi, C.A.; Campagna, S. Charge injection into nanostructured TiO2 electrodes from the photogenerated reduced form of a new Ru(II) polypyridine compound: The “anti-biomimetic” mechanism at work. Dalton Trans. 2016, 45, 14109. [Google Scholar] [CrossRef] [PubMed]
- Frisch, M.J.; Trucks, G.W.; Schlegel, H.B.; Scuseria, G.E.; Robb, M.A.; Cheeseman, J.R.; Scalmani, G.; Barone, V.; Mennucci, B.; Petersson, G.A.; et al. Gaussian 09, Revision A.02; Gaussian, Inc.: Wallingford, CT, USA, 2009. [Google Scholar]
- Prampolini, G.; Ingrosso, F.; Segalina, A.; Caramori, S.; Foggi, P.; Pastore, M. Dynamical and Environmental Effects on the Optical Properties of an Heteroleptic Ru(II)–Polypyridine Complex: A Multilevel Approach Combining Accurate Ground and Excited State QM-Derived Force Fields, MD and TD-DFT. J. Chem. Theory Comput. 2019, 15, 529–545. [Google Scholar] [CrossRef] [PubMed]
- Tian, L.; Feiwu, C. Multiwfn: A multifunctional wavefunction analyzer. J. Comput. Chem. 2012, 33, 580–592. [Google Scholar] [CrossRef]
- Lindsey, J.S.; Schreiman, I.C.; Hsu, H.C.; Kearney, P.C.; Marguerettaz, A. Rothemund and Adler-Longo Reactions Revisisted: Synthesis of Tetraphenylporphyrins under Equilibrium Conditions. J. Org. Chem. 1987, 52, 827–836. [Google Scholar] [CrossRef]
- Di Carlo, G.; Orbelli Biroli, A.; Pizzotti, M.; Tessore, F.; Trifiletti, V.; Ruffo, R.; Abbotto, A.; Amat, A.; De Angelis, F.; Mussini, P.R. Tetraaryl ZnII Porphyrinates Substituted at β-Pyrrolic Positions as Sensitizers in Dye-Sensitized Solar Cells: A Comparison with Meso-Disubstituted Push-Pull ZnII Porphyrinates. Chem. Eur. J. 2013, 19, 10723. [Google Scholar] [CrossRef] [PubMed]
- Golf, H.R.A.; Reissig, H.U.; Wiehe, A. Regioselective Nucleophilic Aromatic Substitution Reaction of Meso-Pentafluorophenyl-Substituted Porphyrinoids with Alcohols. Eur. J. Org. Chem. 2015, 7, 1548. [Google Scholar] [CrossRef]
- Kolb, H.C.; Finn, M.G.; Sharpless, K.B. ChemInform Abstract: Click Chemistry: Diverse Chemical Function from a Few Good Reactions. ChemInform 2001, 40, 2004–2021. [Google Scholar] [CrossRef]
- Covezzi, A.; Orbelli Biroli, A.; Tessore, F.; Forni, A.; Marinotto, D.; Biagini, P.; Di Carlo, G.; Pizzotti, M. 4D-π-1A type β-substituted ZnII-porphyrins: Ideal green sensitizers for building-integrated photovoltaics. Chem. Commun. 2016, 52, 12642–12645. [Google Scholar] [CrossRef]
- Di Carlo, G.; Orbelli Biroli, A.; Pizzotti, M.; Tessore, F. Efficient sunlight harvesting by A4 β-pyrrolic substituted ZnII-porphyrins: A mini-review. Front. Chem. 2019, 7, 177. [Google Scholar] [CrossRef]
- Gouterman, M.; Wagnière, G.H.; Snyder, L.C. Spectra of porphyrins: Part II. Four orbital model. J. Mol. Spectrosc. 1963, 11, 108–127. [Google Scholar] [CrossRef]
- Archer, M.D. Nanostructured and Photoelectrochemical Systems for Solar Photon Conversion; Archer, D.M., Nozik, A.J., Eds.; Imperial College Press: London, UK, 2008; Volume 3. [Google Scholar]
- Bergeron, B.V.; Marton, A.; Oskam, G.; Meyer, G.J. Dye-Sensitized SnO2 Electrodes with Iodide and Pseudohalide Redox Mediators. J. Phys. Chem. B 2005, 109, 937–943. [Google Scholar] [CrossRef] [PubMed]
- Alibabaei, L.; Sherman, B.D.; Norris, M.R.; Brennaman, M.K.; Meyer, T.J. Visible photoelectrochemical water splitting into H2 and O2 in a dye-sensitized photoelectrosynthesis cell. Proc. Natl. Acad. Sci. USA 2015, 112, 5899–5902. [Google Scholar] [CrossRef] [PubMed]
- Sheridan, M.V.; Wang, Y.; Wang, D.; Troian-Gautier, T.; Dares, C.J.; Sherman, B.D.; Meyer, T.J. Light-Driven Water Splitting Mediated by Photogenerated Bromine. Angew. Chem. Int. Ed. 2018, 57, 3449. [Google Scholar] [CrossRef] [PubMed]
- Di Carlo, G.; Caramori, S.; Trifiletti, V.; Giannuzzi, R.; De Marco, L.; Pizzotti, M.; Orbelli Biroli, A.; Tessore, F.; Argazzi, R.; Bignozzi, C.A. Influence of Porphyrinic Structure on Electron Transfer Processes at the Electrolyte/Dye/TiO2 Interface in PSSCs: A Comparison between meso Push–Pull and β-Pyrrolic Architectures. ACS Appl. Mater. Interfaces 2014, 6, 15841–15852. [Google Scholar] [CrossRef] [PubMed]
- Di Carlo, G.; Caramori, S.; Casarin, L.; Orbelli Biroli, A.; Tessore, F.; Argazzi, R.; Oriana, A.; Cerullo, G.; Bignozzi, C.A.; Pizzotti, M. Charge Transfer Dynamics in β- and Meso-Substituted Dithienylethylene Porphyrins. J. Phys. Chem. C 2017, 121, 18385–18400. [Google Scholar] [CrossRef]
- Kim, D.; Holten, D.; Gouterman, M. Evidence from picosecond transient absorption and kinetic studies of charge-transfer states in copper(II) porphyrins. J. Am. Chem. Soc. 1984, 106, 2793–2798. [Google Scholar] [CrossRef]


| Dye | λB/nm (log ε) | λQ/nm (log ε) | λex/nm | λem/nm | Φ/% a | τ/ns a | E0−0/eV | ||
|---|---|---|---|---|---|---|---|---|---|
| 1 | 430 (5.19) | 555 (4.26) | 595 (4.25) | 431 | 604 | 654 | 5.6 | 1.40 | 2.07 |
| 2 | 415 (5.22) | 546 (4.13) | 580 (3.48) | 419 | 586 | 640 | 2.4 | 1.30 | 2.13 |
| Dye | Ep,Ia/V (Fc+|Fc) | E0′Ia/V (Fc+|Fc) | Ep,Ic/V (Fc+|Fc) | E0′Ic/V (Fc+|Fc) | HOMO/eV | LUMO/eV | ΔE0′/V (Eg,EC/eV) |
|---|---|---|---|---|---|---|---|
| 1 | 0.80 | 0.86 | −1.29 | −1.32 | −5.63 | −3.48 | 2.15 |
| 2 | 0.75 | 0.77 | −1.43 | −1.46 | −5.58 | −3.34 | 2.24 |
© 2019 by the authors. Licensee MDPI, Basel, Switzerland. This article is an open access article distributed under the terms and conditions of the Creative Commons Attribution (CC BY) license (http://creativecommons.org/licenses/by/4.0/).
Share and Cite
Berardi, S.; Caramori, S.; Benazzi, E.; Zabini, N.; Niorettini, A.; Orbelli Biroli, A.; Pizzotti, M.; Tessore, F.; Di Carlo, G. Electronic Properties of Electron-Deficient Zn(II) Porphyrins for HBr Splitting. Appl. Sci. 2019, 9, 2739. https://0-doi-org.brum.beds.ac.uk/10.3390/app9132739
Berardi S, Caramori S, Benazzi E, Zabini N, Niorettini A, Orbelli Biroli A, Pizzotti M, Tessore F, Di Carlo G. Electronic Properties of Electron-Deficient Zn(II) Porphyrins for HBr Splitting. Applied Sciences. 2019; 9(13):2739. https://0-doi-org.brum.beds.ac.uk/10.3390/app9132739
Chicago/Turabian StyleBerardi, Serena, Stefano Caramori, Elisabetta Benazzi, Nico Zabini, Alessandro Niorettini, Alessio Orbelli Biroli, Maddalena Pizzotti, Francesca Tessore, and Gabriele Di Carlo. 2019. "Electronic Properties of Electron-Deficient Zn(II) Porphyrins for HBr Splitting" Applied Sciences 9, no. 13: 2739. https://0-doi-org.brum.beds.ac.uk/10.3390/app9132739