Exploring Manufacturing Process and Degradation Products of Gilt and Painted Leather


 , , ,
, , , 
Abstract
:
1. Introduction
2. Materials and Methods
2.1. Samples
2.2. Macro X-ray Fluorescence (MA-XRF)
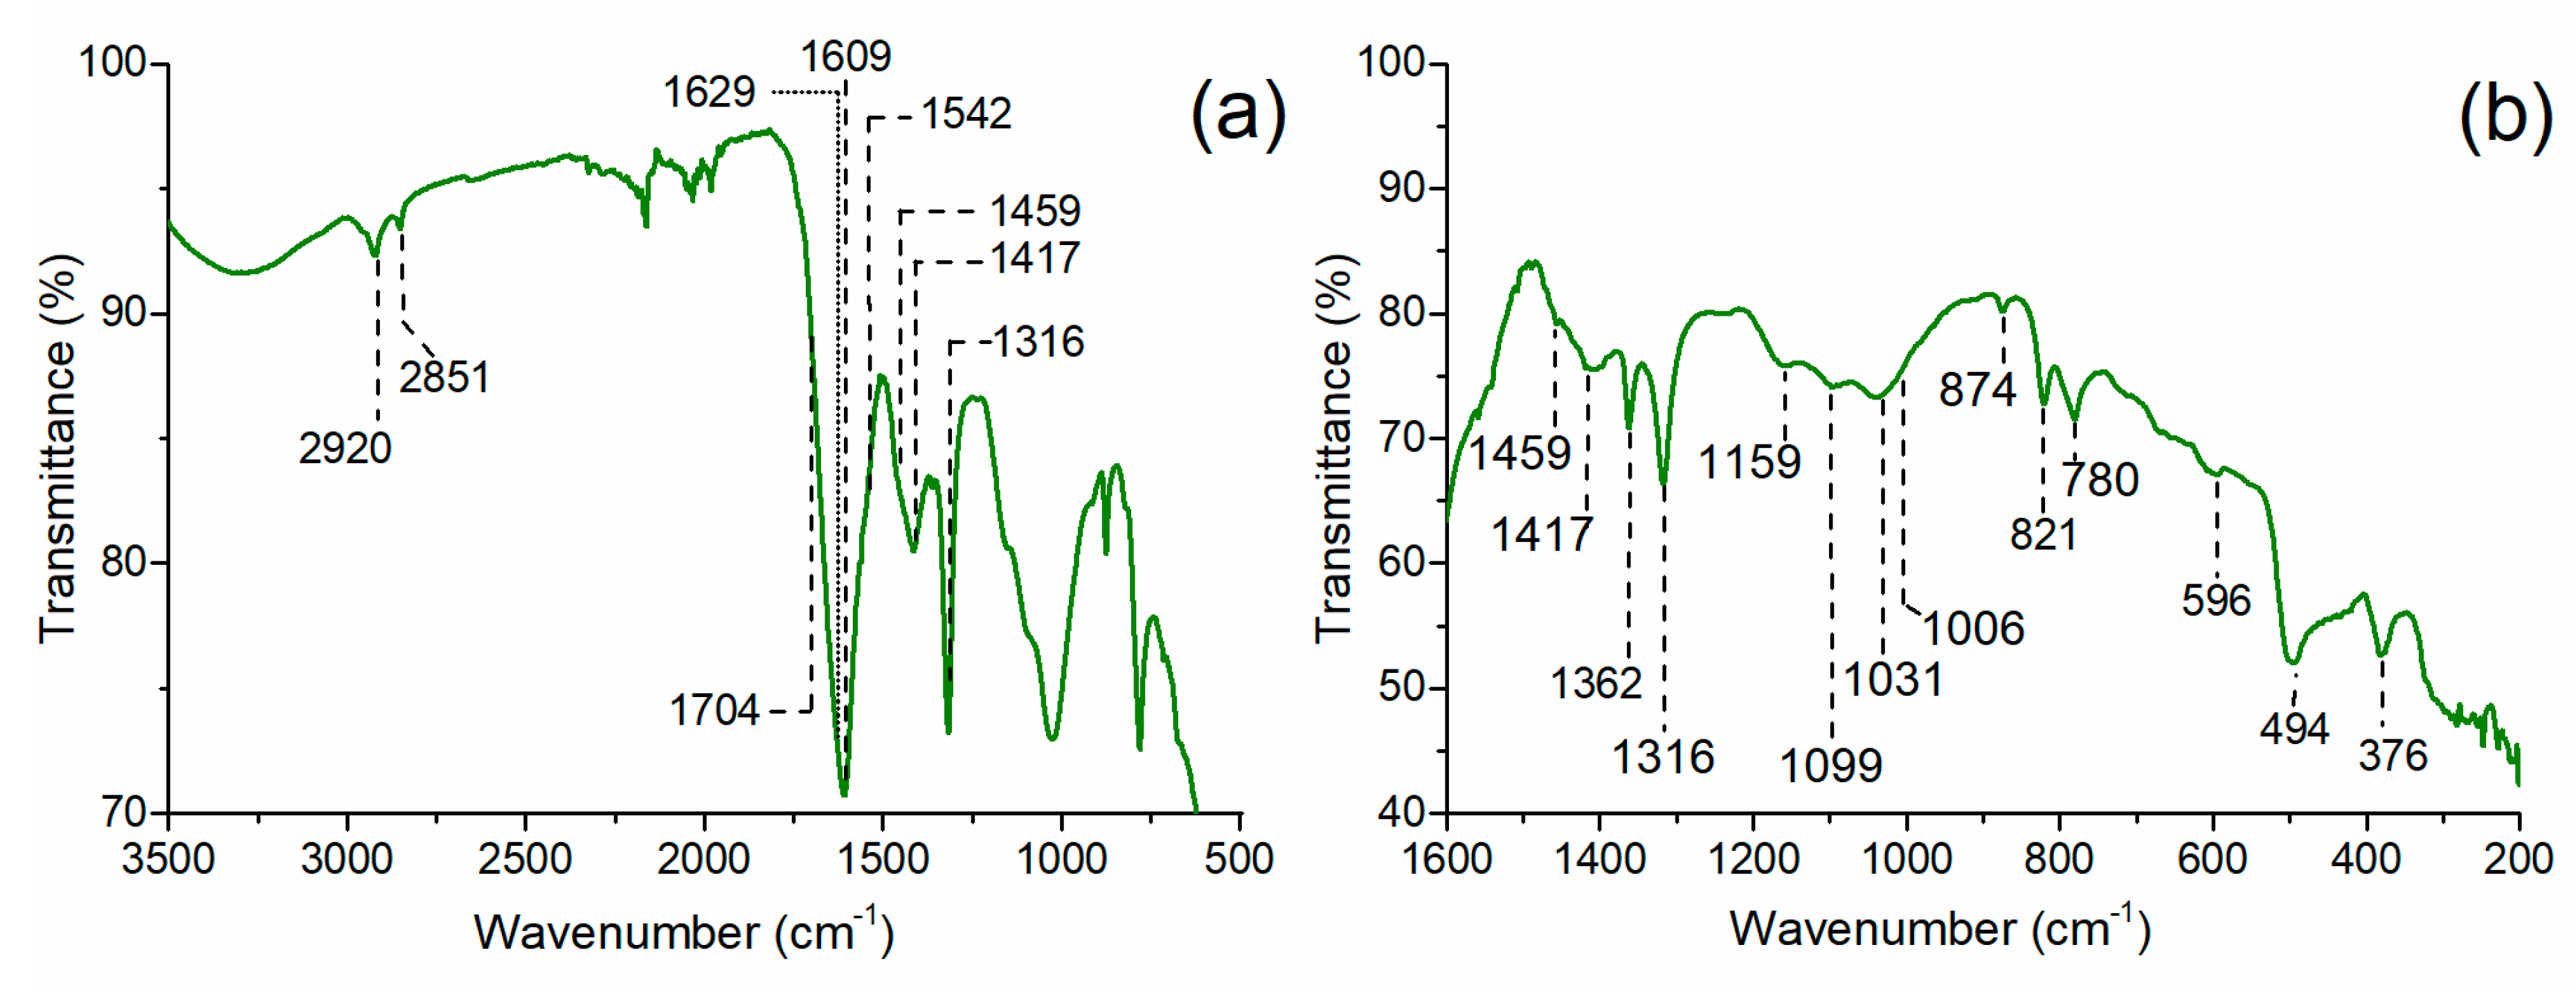
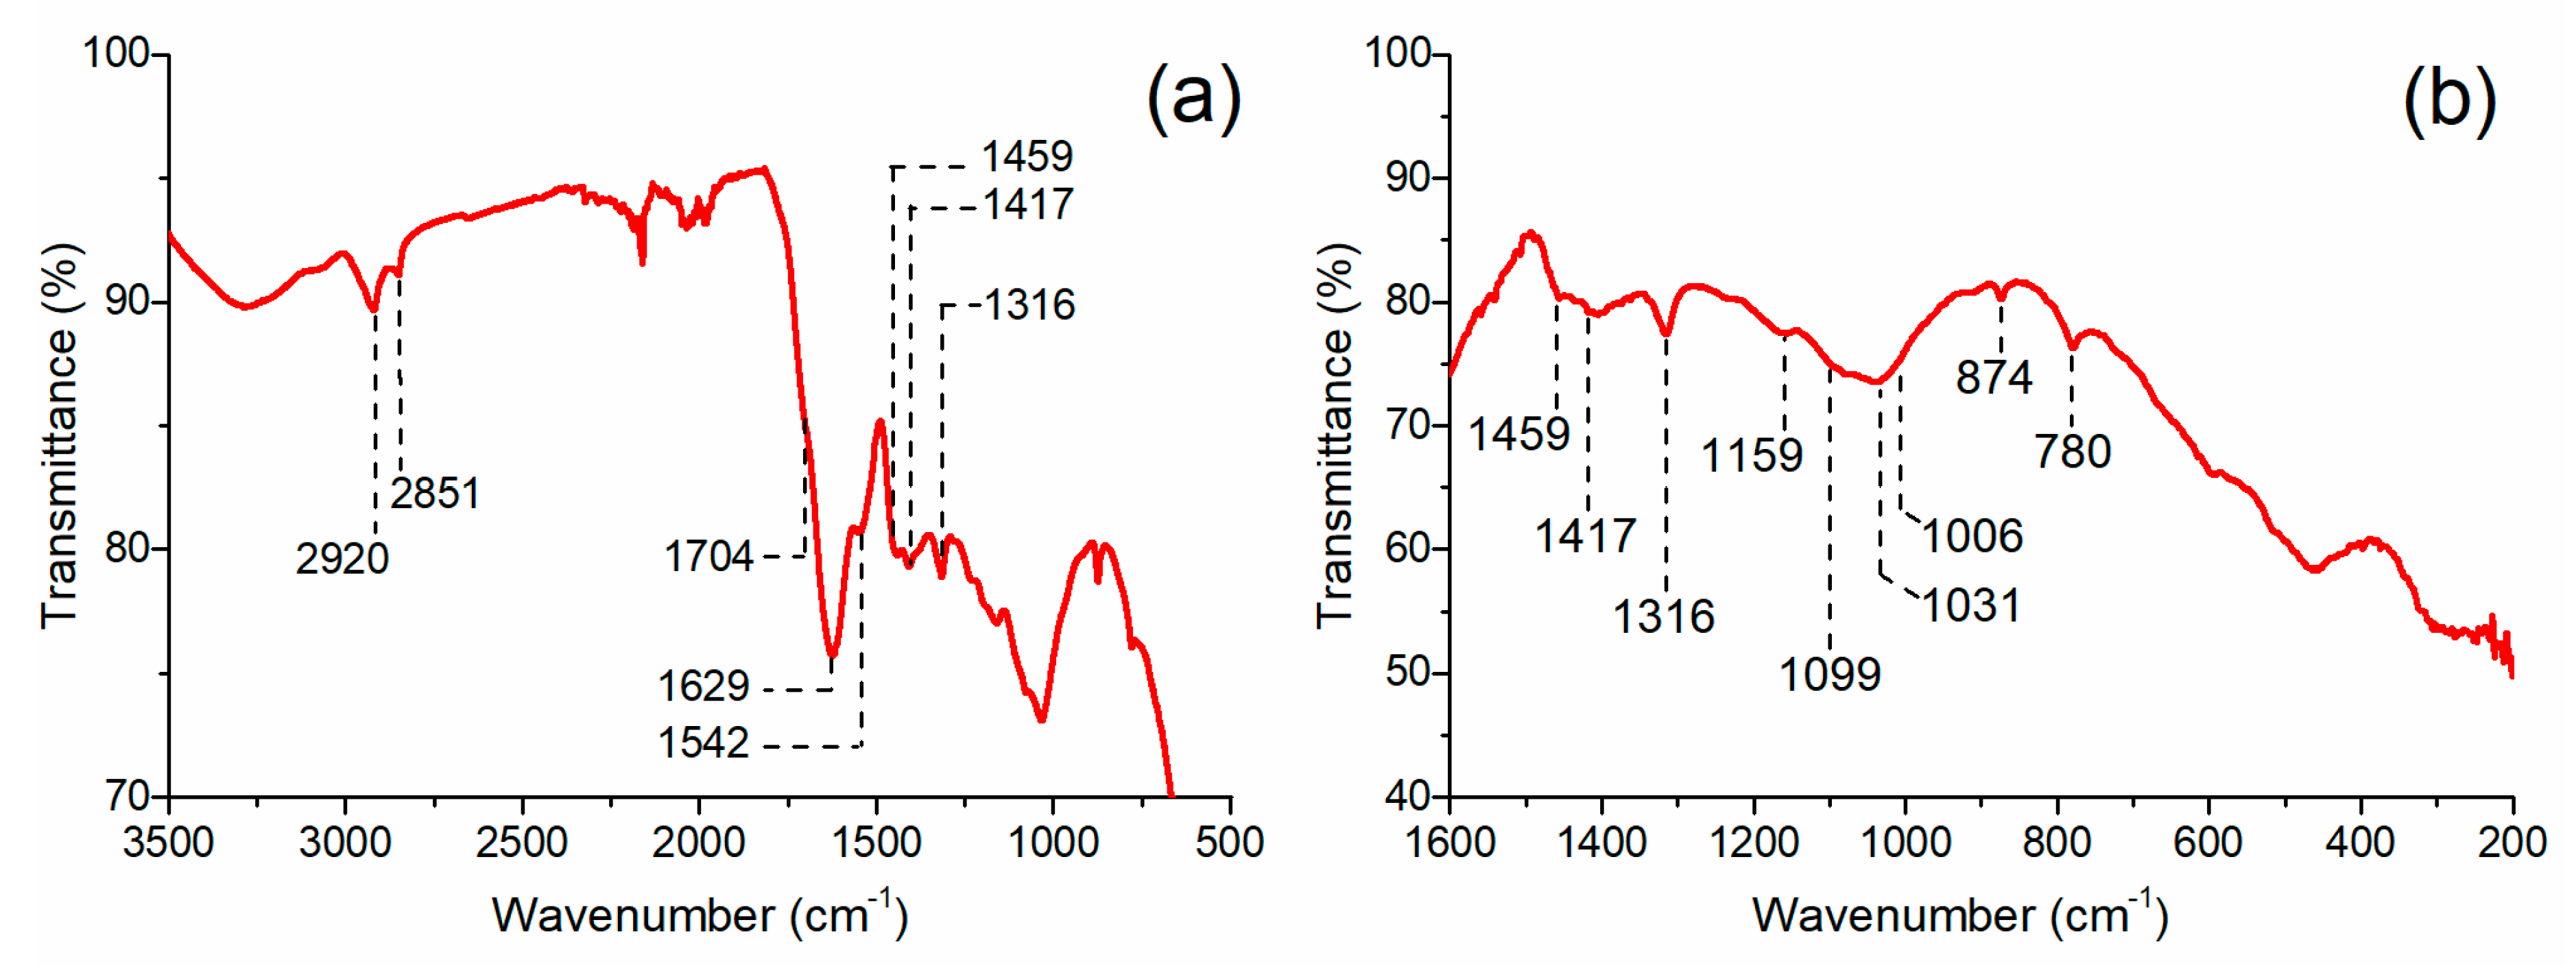
2.3. Attenuated Total Reflectance—Fourier Transform Infrared Spectroscopy (ATR-FTIR)
2.4. Time of Flight Secondary Ion Mass Spectrometry (ToF-SIMS)
3. Results and Discussion
3.1. Leather Support and Silver Leaf
3.2. Gold Varnish
3.3. Blue Areas
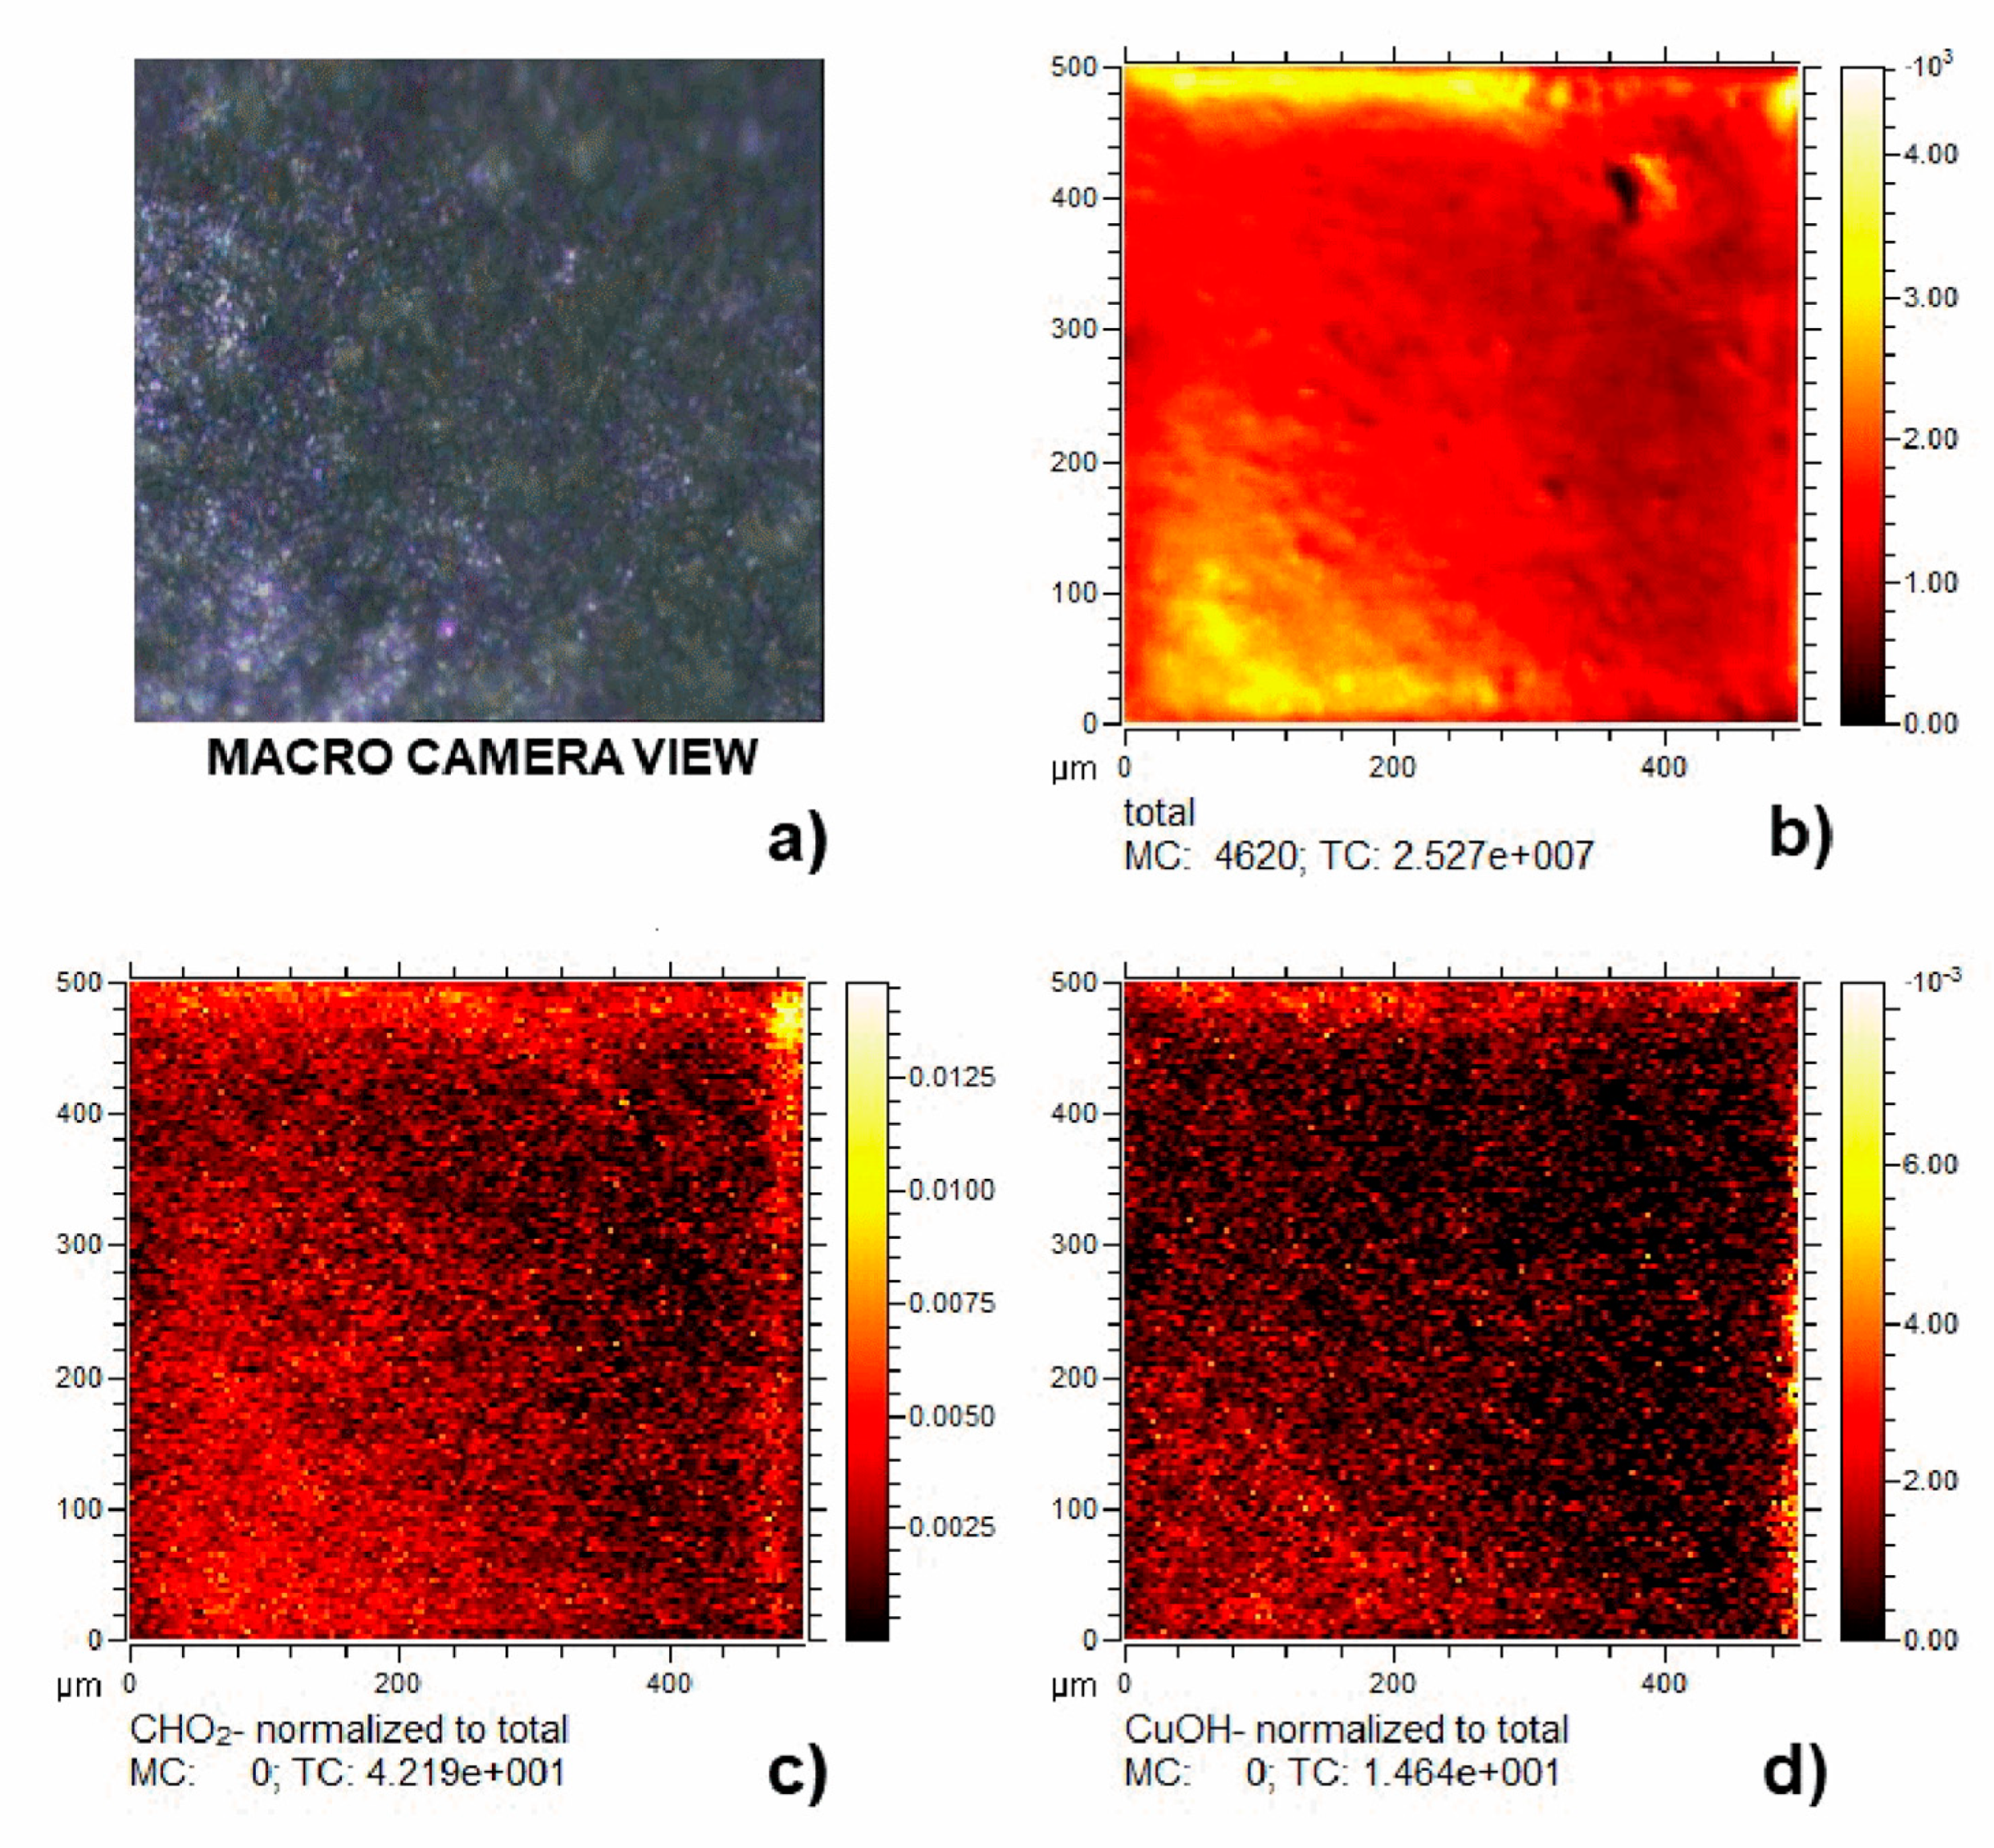
3.4. Green Areas
3.5. Red Areas
4. Conclusions
Supplementary Materials
Author Contributions
Funding
Acknowledgments
Conflicts of Interest
References
- De Boer, M.P.; Groves, R.; Koldeweij, E. Gilt Leather Artefacts: White Paper on Material Characterization and Improved Conservation Strategies within NICAS; Delft University of Technology: Delft, The Netherlands, 2016. [Google Scholar]
- Calnan, C. The conservation of Spanish gilt leather—An introduction. Stud. Conserv. 2016, 37, 23–26. [Google Scholar] [CrossRef]
- De Boer, M.P.; Groves, R.; Koldeweij, E. Gilt leather conservation—A critical review to promote improved conservation strategies. In Proceedings of the 18th ICOM-CC Triennial Conference, Copenhagen, Denmark, 4–8 September 2017. [Google Scholar]
- Mannina, L.; Lombardo, A. Diagnostic analyses for the study of materials, technique and state of preservation of a gilt and painted leather of the XVIII Century. Procedia Chem. 2013, 8, 202–211. [Google Scholar] [CrossRef]
- Petrucci, F. Vita e arte negli arredi dei palazzi barocchi tra tradizione e modernità. In Dentro Il Palazzo; Rodolfo, A., Volpi, C., Eds.; Edizioni Musei Vaticani: Città del Vaticano, Vatican, 2014; Volume 1, pp. 249–282. [Google Scholar]
- Ingo, G.M.; Balbi, S.; de Caro, T.; Fragalà, I.; Angelini, E.; Bultrini, G. Combined use of SEM-EDS, OM and XRD for the characterization of corrosion products grown on silver roman coins. Appl. Phys. A Mater. Sci. Process. 2006, 8, 493–497. [Google Scholar] [CrossRef]
- Ioele, M.; Jervis, A.V.; Paris, M.; Rissotto, L.; Sodo, A.; Giovagnoli, A.; Poli, T. Presence of Indigo in the Paint Layers of Gilt and Painted Leather Artefacts. In Proceedings of the ICOM Committee for Conservation, Lisbon, Portugal, 19–23 September 2011; pp. 1–9. [Google Scholar]
- Tortora, L.; Notaristefani, F.; Ioele, M. ToF-SIMS investigation of gilt and painted leather: Identification of indigo, oil binder and gold varnish. Surf. Interface Anal. 2014, 46, 807–811. [Google Scholar] [CrossRef]
- Sodhi, R.N.S. Time-of-flight secondary ion mass spectrometry (TOF-SIMS): Versatility in chemical and imaging surface analysis. Analyst 2004, 129, 483–487. [Google Scholar] [CrossRef] [PubMed]
- Ingo, G.M.; Riccucci, C.; Pascucci, M.; Messina, E.; Giuliani, C.; Biocca, P.; Tortora, L.; Fierro, G.; di Carlo, G. Combined use of FE-SEM+EDS, ToF-SIMS, XPS, XRD and OM for the study of ancient gilded artefacts. Appl. Surf. Sci. 2018, 446, 168–176. [Google Scholar] [CrossRef]
- Richardin, P.; Mazel, V.; Walter, P.; Laprévote, O.; Brunelle, A. Identification of different copper green pigments in renaissance paintings by Cluster-TOF-SIMS imaging analysis. J. Am. Soc. Mass Spectrom. 2011, 22, 1729–1736. [Google Scholar] [CrossRef] [PubMed]
- Sanyova, J.; Cersoy, S.; Richardin, P.; Lapr, O.; Walter, P.; Brunelle, A. Unexpected materials in a rembrandt painting characterized by high spatial resolution Cluster-TOF-SIMS imaging. Anal. Chem. 2011, 83, 753–760. [Google Scholar] [CrossRef]
- Noun, M.; van Elslande, E.; Touboul, D.; Glanville, H.; Bucklow, S.; Brunelle, A. High mass and spatial resolution mass spectrometry imaging of Nicolas Poussin painting cross section by cluster TOF-SIMS. J. Mass Spectrom. 2016, 51, 1196–1210. [Google Scholar] [CrossRef]
- Vanbellingen, Q.P.; Elie, N.; Eller, M.J.; Della-negra, S.; Touboul, D.; Brunelle, A. Time-of-flight secondary ion mass spectrometry imaging of biological samples with delayed extraction for high mass and high spatial resolutions. Rapid Commun. Mass Spectrom. 2015, 29, 1187–1195. [Google Scholar] [CrossRef]
- Atrei, A.; Benetti, F.; Gliozzo, E.; Perra, G.; Marchettini, N. Chemical characterization of protein based binders in painting samples by means of ToF-SIMS: Tests on ancient and model samples. Int. J. Mass Spectrom. 2014, 369, 9–15. [Google Scholar] [CrossRef]
- Ingo, G.M.; Guida, G.; Angelini, E.; di Carlo, G.; Mezzi, A.; Padeletti, G. Ancient mercury-based plating methods: Combined use of surface analytical techniques for the study of manufacturing process and degradation phenomena. Acc. Chem. Res. 2013, 46, 2365–2375. [Google Scholar] [CrossRef] [PubMed]
- Ridolfi, S.; Tabasso, M.L.; Chaverdi, A.A.; Callieri, P. The finishing technique of the stone monuments of Persepolis: Further studies and new findings through the use of non-destructive analytical techniques. Archaeometry 2019, 61, 272–281. [Google Scholar] [CrossRef]
- Available online: https://www.thermofisher.com/order/catalog/product/912A0760 (accessed on 16 July 2019).
- Levey, B.M. Alum in ancient mesopotamian technology. Univ. Chic. Press J. 1958, 49, 166–169. [Google Scholar] [CrossRef]
- Hamman, J.H. Composition and applications of aloe vera leaf gel. Molecules 2008, 13, 1599–1616. [Google Scholar] [CrossRef] [PubMed]
- Derrick, M. Fourier transform infrared spectral analysis of natural resins used in furniture finishes. J. Am. Inst. Conserv. 1989, 28, 43–56. [Google Scholar] [CrossRef]
- Beltran, V.; Salvadó, N.; Butí, S.; Pradell, T. Ageing of resin from Pinus species assessed by infrared spectroscopy. Anal. Bioanal. Chem. 2016, 408, 4073–4082. [Google Scholar] [CrossRef] [PubMed] [Green Version]
- Keune, K.; Boon, J.J. Analytical imaging studies of cross-sections of paintings affected by lead soap aggregate formation. Stud. Conserv. 2014, 52, 161–176. [Google Scholar] [CrossRef]
- Shearer, G.L. An Evaluation of Fourier Transform Infrared Spectroscopy for the Characterization of Organic Compunds in Art and Archaeology. Ph.D. Thesis, University College London, London, UK, 1989. [Google Scholar]
- Lin-Vien, D.; Colthup, N.B.; Fateley, W.G.; Grasselli, J.G. The Handbook of Infrared and Raman Characteristic Frequencies of Organic Molecules; Academic Press: Boston, MA, USA, 1991. [Google Scholar] [CrossRef]
- Rahmaninia, M.; Javid, E.; Varshoei, A. Process variables and the performance of cationic rosin as an internal sizing agent in recycled corrugated container pulp. BioResources 2016, 11, 5333–5342. [Google Scholar] [CrossRef]
- Rao, Z.; Dong, K.; Yang, X.; Lin, J.; Cui, X.; Zhou, R.; Deng, Q. Natural amber, copal resin and colophony investigated by UV-VIS, infrared and Raman spectrum. Sci. China Phys. Mech. Astron. 2013, 56, 1598–1602. [Google Scholar] [CrossRef]
- Noble, P. Chemical changes in old master paintings II: Darkening due to increased transparency as a result of metal soap formation. In Proceedings of the ICOM Committee for Conservation, The Hague, The Netherlands, 12–16 September 2005; Volume 1. [Google Scholar]
- Cotte, M.; Checroun, E.; de Nolf, W.; Taniguchi, Y.; de Viguerie, L.; Burghammer, M.; Walter, P.; Rivard, C.; Salomé, M.; Janssens, K.; et al. Lead soaps in paintings: Friends or foes? Stud. Conserv. 2017, 62, 2–23. [Google Scholar] [CrossRef]
- Centeno, S.A.; Mahon, D. The chemistry of aging in oil paintings: Metal soaps and visual changes. Metrop. Mus. Art Bull. New Ser. 2019, 67, 12–19. Available online: https://0-www-jstor-org.brum.beds.ac.uk/stable/40588562 (accessed on 24 June 2019).
- Sodo, A.; Biocca, P.; Municchia, A.C.; Fiorin, E.; Antonietta, M. Raman and time of flight secondary ion mass spectrometry investigation answers specific conservation questions on Bosch painting Saint Wilgefortis Triptych. J. Raman Spectrosc. 2019, 50, 150–160. [Google Scholar] [CrossRef]
- Biocca, P.; Santopadre, P.; Sidoti, G.; Sotgiu, G.; Notaristefani, F.; Tortora, L. ToF-SIMS study of gilding technique in the fresco Vela della Castità by Giotto’s school. Surf. Interface Anal. 2016, 48, 404–408. [Google Scholar] [CrossRef]
- Miller, F.A.; Wilkins, C.H. Infrared spectra and characteristic frequencies of inorganic ions their use in qualitative analysis. Anal. Chem. 1952, 24, 1253–1294. [Google Scholar] [CrossRef]
- Brusentsova, T.N.; Peale, R.E.; Maukonen, D.; Harlow, G.E.; Boesenberg, J.S.; Ebel, D. Far infrared spectroscopy of carbonate minerals. Am. Mineral. 2010, 95, 1515–1522. [Google Scholar] [CrossRef]
- Kendix, E.L. Transmission and Reflection (ATR) Far-Infrared Spectroscopy Applied in the Analysis of Cultural Heritage Materials. Ph.D. Thesis, Alma Mater Studiorum—Università di Bologna, Bologna, Italy, 2009. [Google Scholar]
- Mathey, Y.; Greig, D.R.; Shriver, D.F.; Mathey, Y.; Greig, D.R. Variable-temperature Raman and infrared spectra of the copper acetate dimer Cu2(O2CCH3)4(H2O)2 and its derivatives. Inorg. Chem. 1982, 21, 3409–3413. [Google Scholar] [CrossRef]
- Ito, K.; Bernstein, H.J. The vibrational spectra of the formate, acetate, and oxalate ions. Can. J. Chem. 1956, 34, 170–178. [Google Scholar] [CrossRef]
- D’Antonio, M.C.; Palacios, D.; Coggiola, L.; Baran, E.J. Vibrational and electronic spectra of synthetic moolooite. Spectrochim. Acta Part A 2007, 68, 424–426. [Google Scholar] [CrossRef]
- Colombini, M.P.; Modugno, F.; Fuoco, R.; Tognazzi, A. A GC-MS study on the deterioration of lipidic paint binders. Microchem. J. 2002, 73, 175–185. [Google Scholar] [CrossRef]
- Zoppi, A.; Lofrumento, C. Metal oxalates in paints: A Raman investigation on the relative reactivities of different pigments to oxalic acid solutions. Anal. Bioanal. Chem. 2010, 397, 841–849. [Google Scholar] [CrossRef] [PubMed]
- Bordignon, F.; Postorino, P.; Dore, P.; Tabasso, M.L. The formation of metal oxalates in the painted layers of a medieval polychrome on stone, as revealed by micro-Raman spectroscopy. Stud. Conserv. 2019, 53, 158–169. [Google Scholar] [CrossRef]
- Angelini, E.; Ingo, G.M.; Grassini, S.; Corbellini, S.; de Caro, T.; Riccucci, C.; Plescia, P.; Agostini, S.; Bianco, A. Potentialities of XRF and EIS portable instruments for the characterisation of ancient artefacts. Appl. Phys. A Mater. Sci. Process. 2006, 83, 643–649. [Google Scholar] [CrossRef]


© 2019 by the authors. Licensee MDPI, Basel, Switzerland. This article is an open access article distributed under the terms and conditions of the Creative Commons Attribution (CC BY) license (http://creativecommons.org/licenses/by/4.0/).
Share and Cite
Iorio, M.; Graziani, V.; Lins, S.; Ridolfi, S.; Branchini, P.; Fabbri, A.; Ingo, G.; Di Carlo, G.; Tortora, L. Exploring Manufacturing Process and Degradation Products of Gilt and Painted Leather. Appl. Sci. 2019, 9, 3016. https://0-doi-org.brum.beds.ac.uk/10.3390/app9153016
Iorio M, Graziani V, Lins S, Ridolfi S, Branchini P, Fabbri A, Ingo G, Di Carlo G, Tortora L. Exploring Manufacturing Process and Degradation Products of Gilt and Painted Leather. Applied Sciences. 2019; 9(15):3016. https://0-doi-org.brum.beds.ac.uk/10.3390/app9153016
Chicago/Turabian StyleIorio, Morena, Valerio Graziani, Sergio Lins, Stefano Ridolfi, Paolo Branchini, Andrea Fabbri, Gabriel Ingo, Gabriella Di Carlo, and Luca Tortora. 2019. "Exploring Manufacturing Process and Degradation Products of Gilt and Painted Leather" Applied Sciences 9, no. 15: 3016. https://0-doi-org.brum.beds.ac.uk/10.3390/app9153016