1. Introduction
Progressive improvement of the compressive properties of concrete have led to the development of more and more slender concrete structures worldwide, resulting in a progressive reduction of component weight. In consequence, cyclic loads due to variable loading (transient loads and wind, among others) have to be closely studied as tolerance margins are reduced. In some cases, fatigue loads are crucial and the design of the structural element, as in the case of concrete wind turbine towers, depends on fatigue load levels.
Fatigue in concrete can be defined as a process of mechanical degradation leading to failure. Due to cyclic loads, crack initiation and propagation within the specimen occur, until final failure. However, during the application of the variable loads, a modification of the mechanical parameters of the concrete occurs, progressively varying the structural responses of an element.
The classic way to address the problem of fatigue in concrete is to determine the number of cycles (N) that a concrete element can support under given loading conditions. “N” is also called “fatigue life.” A concrete element under cyclic loads collapses after a sufficient number of cycles, even if the maximum applied stress is less than its compressive strength.
The value of N depends on both the maximum and the minimum stress applied. The most common way to represent this relationship is through S–N curves. Fatigue strength (S) is defined as the fraction of the static strength that can be supported repeatedly over a number of cycles. In general, there is a huge scatter in the results of apparently identical specimens.
Traditionally, fatigue analysis has focused on the study of fatigue life, i.e., the number of cycles that the specimen can withstand before collapse [
1,
2,
3,
4,
5,
6,
7,
8,
9,
10], and almost no attention has been paid to how the mechanical parameters vary with the number of cycles [
11,
12,
13,
14].
Nevertheless, those variations represent an interesting approach to fatigue analysis, as most structures are subjected to a combination of cyclic loads, resulting in mechanical degradation, and extreme static loading. A proper design should guarantee the safety of the structure, taking into account the possible reduction of the mechanical capacity of the structure due to cyclic loads.
The addition of fibers inside the concrete mass provides a better behavior of concrete under fatigue loads. Fibers bridge the cracks, resulting in a significant increase of the fatigue life. Much research has been carried out in this field [
15,
16,
17,
18,
19,
20,
21], and in all cases, the results have shown a relevant improvement of the fatigue response of the concrete elements.
It is commonly accepted that a fatigue test consists of applying a cyclic load until failure, with the condition that the maximum load is always below the strength of the concrete element. However, cyclic loads applied to concrete elements will result in a progressive deterioration of the microstructure, with the initiation and propagation of microcracks. This fuzzy damage, distributed over the whole specimen, is expected to result in a progressive variation of the macroscopic response, i.e., the mechanical parameters of the concrete. At the point in time when the specimen collapses during the fatigue test, it may be understood that the residual strength of the concrete specimen is exactly the maximum load that is applied. In consequence, a progressive reduction of the strength of the concrete occurs during the cyclic test.
It must be taken into account that real concrete structures are not subjected only to cyclic loading until failure. In fact, they are usually subjected to cyclic loading, and occasionally to extreme loading episodes. Cyclic loading does not usually causes a concrete structure to collapse, but it causes a variation in its mechanical parameters, altering its behavior under extreme loading episodes.
Concrete towers for wind turbines are a good example of this fact, since they are subjected to a “permanent” cyclic loading and eventual extreme loading events. Considering this fact, Urban et al. [
22] studied the variation in the compressive modulus of elasticity of concrete towers for wind turbines caused by cyclic loading, and its consequence in terms of variation in the structural response to static and dynamic loading.
This phenomenon could also affect post-tensioned concrete beams. Variations in compressive strength, compressive modulus of elasticity, and maximum compressive strain due to cyclic loading alter the structural response, especially under static loading (instantaneous elastic deflection, deferred deflection, etc.). The dynamic response of the structural element is also modified (natural frequency, maximum vertical acceleration, impact factor, etc.).
Damage caused by cyclic loads could leave a trace in the interior of the concrete specimen, such as a crack pattern, and could therefore be studied using computed tomography (CT) technology.
The CT scan is a non-destructive technique to visualize the microstructure of materials based on X-ray properties. This technology is able to define the density of each specimen voxel (volumetric pixel) by assigning a shade of gray according to voxel density. Light shades of grey correspond to high densities, whereas dark shades of grey correspond to low densities. In recent years, many authors have conducted research on concrete microstructures with this technique, and many have, in particular, focused on the fiber orientation and fiber distribution inside concrete matrices [
15,
21,
22]. Some other research works have focused on the spatial distributions of concrete voids and their effects on macroscopic properties [
23,
24,
25,
26,
27,
28]. A complete, state-of-the-art work on the use of computed tomography to explore the microstructure of materials in civil and mechanical engineering is presented in Vicente et al. [
29,
30].
This paper focused on study of the variation of the mechanical parameters of three concrete mixtures with a number of cycles: plain, steel-fiber-reinforced, and polypropylene-fiber-reinforced high-performance concrete (HPC, SFHPC, and PFHPC, respectively). In this case, the mechanical parameters under study were compressive strength (), compressive modulus of elasticity (), and maximum compressive strain (). The specimens were first subjected to cyclic compression loads over five complete cycles: 0; 2000; 20,000; 200,000; and 2,000,000. The specimens were then subjected to a static compression test up to failure, and the abovementioned mechanical parameters were tested in each specimen.
This paper shows an experimental procedure by which to evaluate the variation of the main mechanical parameters due to cyclic loads, and also the results obtained in the three different mixtures with the number of cycles.
Finally, having completed the compressive test, the specimens were scanned and the internal failure mechanisms were studied, using the information provided by the CT scan to gain insight into the resistance mechanisms of the fibers and their influence on the macroscopic response of the concrete specimen.
The structure of this paper is as follows: The experimental program is presented in
Section 2, the experimental results are described and discussed in
Section 3, the resistance mechanisms are described in
Section 4, and, finally, the conclusions are presented in
Section 5.
2. Experimental Program
2.1. Materials
A total of three high-strength concrete mixtures were cast. They all shared the same concrete matrix, and the difference was that one of them had no fibers, while the other two had either steel or polypropylene fibers. The mixtures were identified as plain high-performance concrete (HPC), steel-fiber-reinforced high-performance concrete (SFHPC), and polypropylene-fiber-reinforced high-performance concrete (PPFHPC).
A total of 40 test specimens of each mixture were cast in the form of cylinders with a diameter of 100 mm and a height of 200 mm.
Table 1 shows the mixtures that were used.
The SFHPC contained a volume of 78.5 kg/m3 of Dramix 3D 45/50BL hooked-ended steel fibers (BEKAERT, Kortrijk, Belgium), each of 50 mm in length, with a diameter of 1.05 mm, giving an aspect ratio of 45, a fiber tensile strength of 1115 MPa, and a Young’s modulus of 200 GPa. In the case of PPFHPC, an amount of 9.1 kg/m3 of monofilament polypropylene fibers Masterfiber 249 (BASF, Ludwigshafen am Rhein, Germany) was used. These fibers were 48 mm in length with a diameter of 0.85 mm, resulting in an aspect ratio of 56.5. The tensile strength was 400 MPa and the Young’s modulus was 4.7 GPa. Both fibers were quite similar in terms of their geometry and the number of fibers inside the concrete mixture. The main difference was the structural behavior and overall stiffness.
MasterRoc MS 685 (BASF, Ludwigshafen am Rhein, Germany) nanosilica and a Glenium 52 (BASF, Ludwigshafen am Rhein, Germany) superplasticizer were considered. Siliceous aggregate was used for both fine aggregate and coarse aggregate, with a nominal maximum aggregate size of 4 mm for fine aggregate and 12 mm for coarse aggregate.
Mixing was done in a rotary mixer and the fibers were gradually sprinkled into the drum by hand. The specimens were cured for 180 days in a curing room at a constant relative humidity of 100% and an ambient temperature of 20 °C. The specimens were then removed from the curing room and held under laboratory conditions until testing. All the specimens were at least 300 days old when the test campaign began. Thus, the possible strength increase during the fatigue test was minimized.
2.2. Testing Campaign
As explained before, a total of 40 cylinders of each mixture were cast and divided into two series of 20 cylinders each. The two series were labeled as L-Series and H-Series, as explained later.
Additionally, three cylinders, 150 mm in diameter and 300 mm in height, were cast to define the concrete quality. These cylinders were kept in the curing room with the rest of the specimens until day 28, when they were tested under static compression. The tests were performed according to the European Standards [
31,
32].
The average compressive strength,
, was 75.95 MPa and the characteristic compressive strength,
, was 73.0 MPa. According to Eurocode 2 [
33], the strength class was therefore C70/85.
The abovementioned 40 cylinders, 100 mm in diameter and 200 mm in height, were tested at an age of 180 days, as follows. Four specimens of each series, i.e., eight cylinders, were tested under static compression until failure just before starting the cyclic testing campaign, in order to define the real loads to be applied during the cyclic tests to the rest of the specimens.
Table 2 and
Table 3 show the average values of the main mechanical parameters of the concrete for each series. The value in brackets represents the standard deviation.
The compressive modulus of elasticity was obtained following the method described in standard EN 12390-13 [
31]. The static compression test was then performed, as per standard EN 12390-3 [
32], and the compressive strength and maximum compressive strain values were extracted.
The rest of the cylinders, that is, 16 specimens of each series, were tested under cyclic load up to a pre-defined number of cycles. The main parameters of the cyclic tests were:
Stress level. In this case, two stress levels were considered, one per series. The compression load for the first series of cylinders ranged from 35% to 50% of the characteristic compressive strength, defined through the static tests described above. This first stress level was labeled “high level series” or “H-Series.” For the second series, compression loading ranged from 25% to 40% of the characteristic compressive strength, defined again through the static tests described above. This second stress level was labeled “low level series” or “L-Series.”
Number of cycles. Four specimens of each series were subjected to cyclic loads of up to 2000 cycles. Another set of four specimens from each series was subjected to cyclic loads of up to 20,000 cycles. A third set of four specimens from each series was tested up to 200,000 cycles, and the last set of four specimens, up to 2,000,000 cycles.
Test frequency. In all cases, the test frequency was 6 Hz.
According to Model Code 2010 [
34], the expected fatigue life for the H-Series was 1.5 × 10
3 cycles, while the expected fatigue life for the L-Series was 1.9 × 10
8 cycles. These values were obtained considering the characteristic compressive strength at 28 days, i.e., 70 MPa, which was the reference value for concrete design. On the contrary, considering the characteristic compressive strength at the age when the cyclic testing was carried out, the expected fatigue life for the H-Series was 1.8 × 10
8 cycles, while the expected fatigue life for the L-Series was 1.2 × 10
11 cycles. From 28 days to the date when the cyclic testing began, concrete compression had increased around 30%, but the theoretical fatigue life had increased around 100,000 times for the case of the H-Series and around 1000 times for the case of the L-Series.
None of the specimens broke during the cyclic testing. Once the cylinders reached the pre-defined number of cycles, they were tested under static loading, first to obtain the compressive modulus of elasticity, and then the compressive strength and the maximum compressive strain.
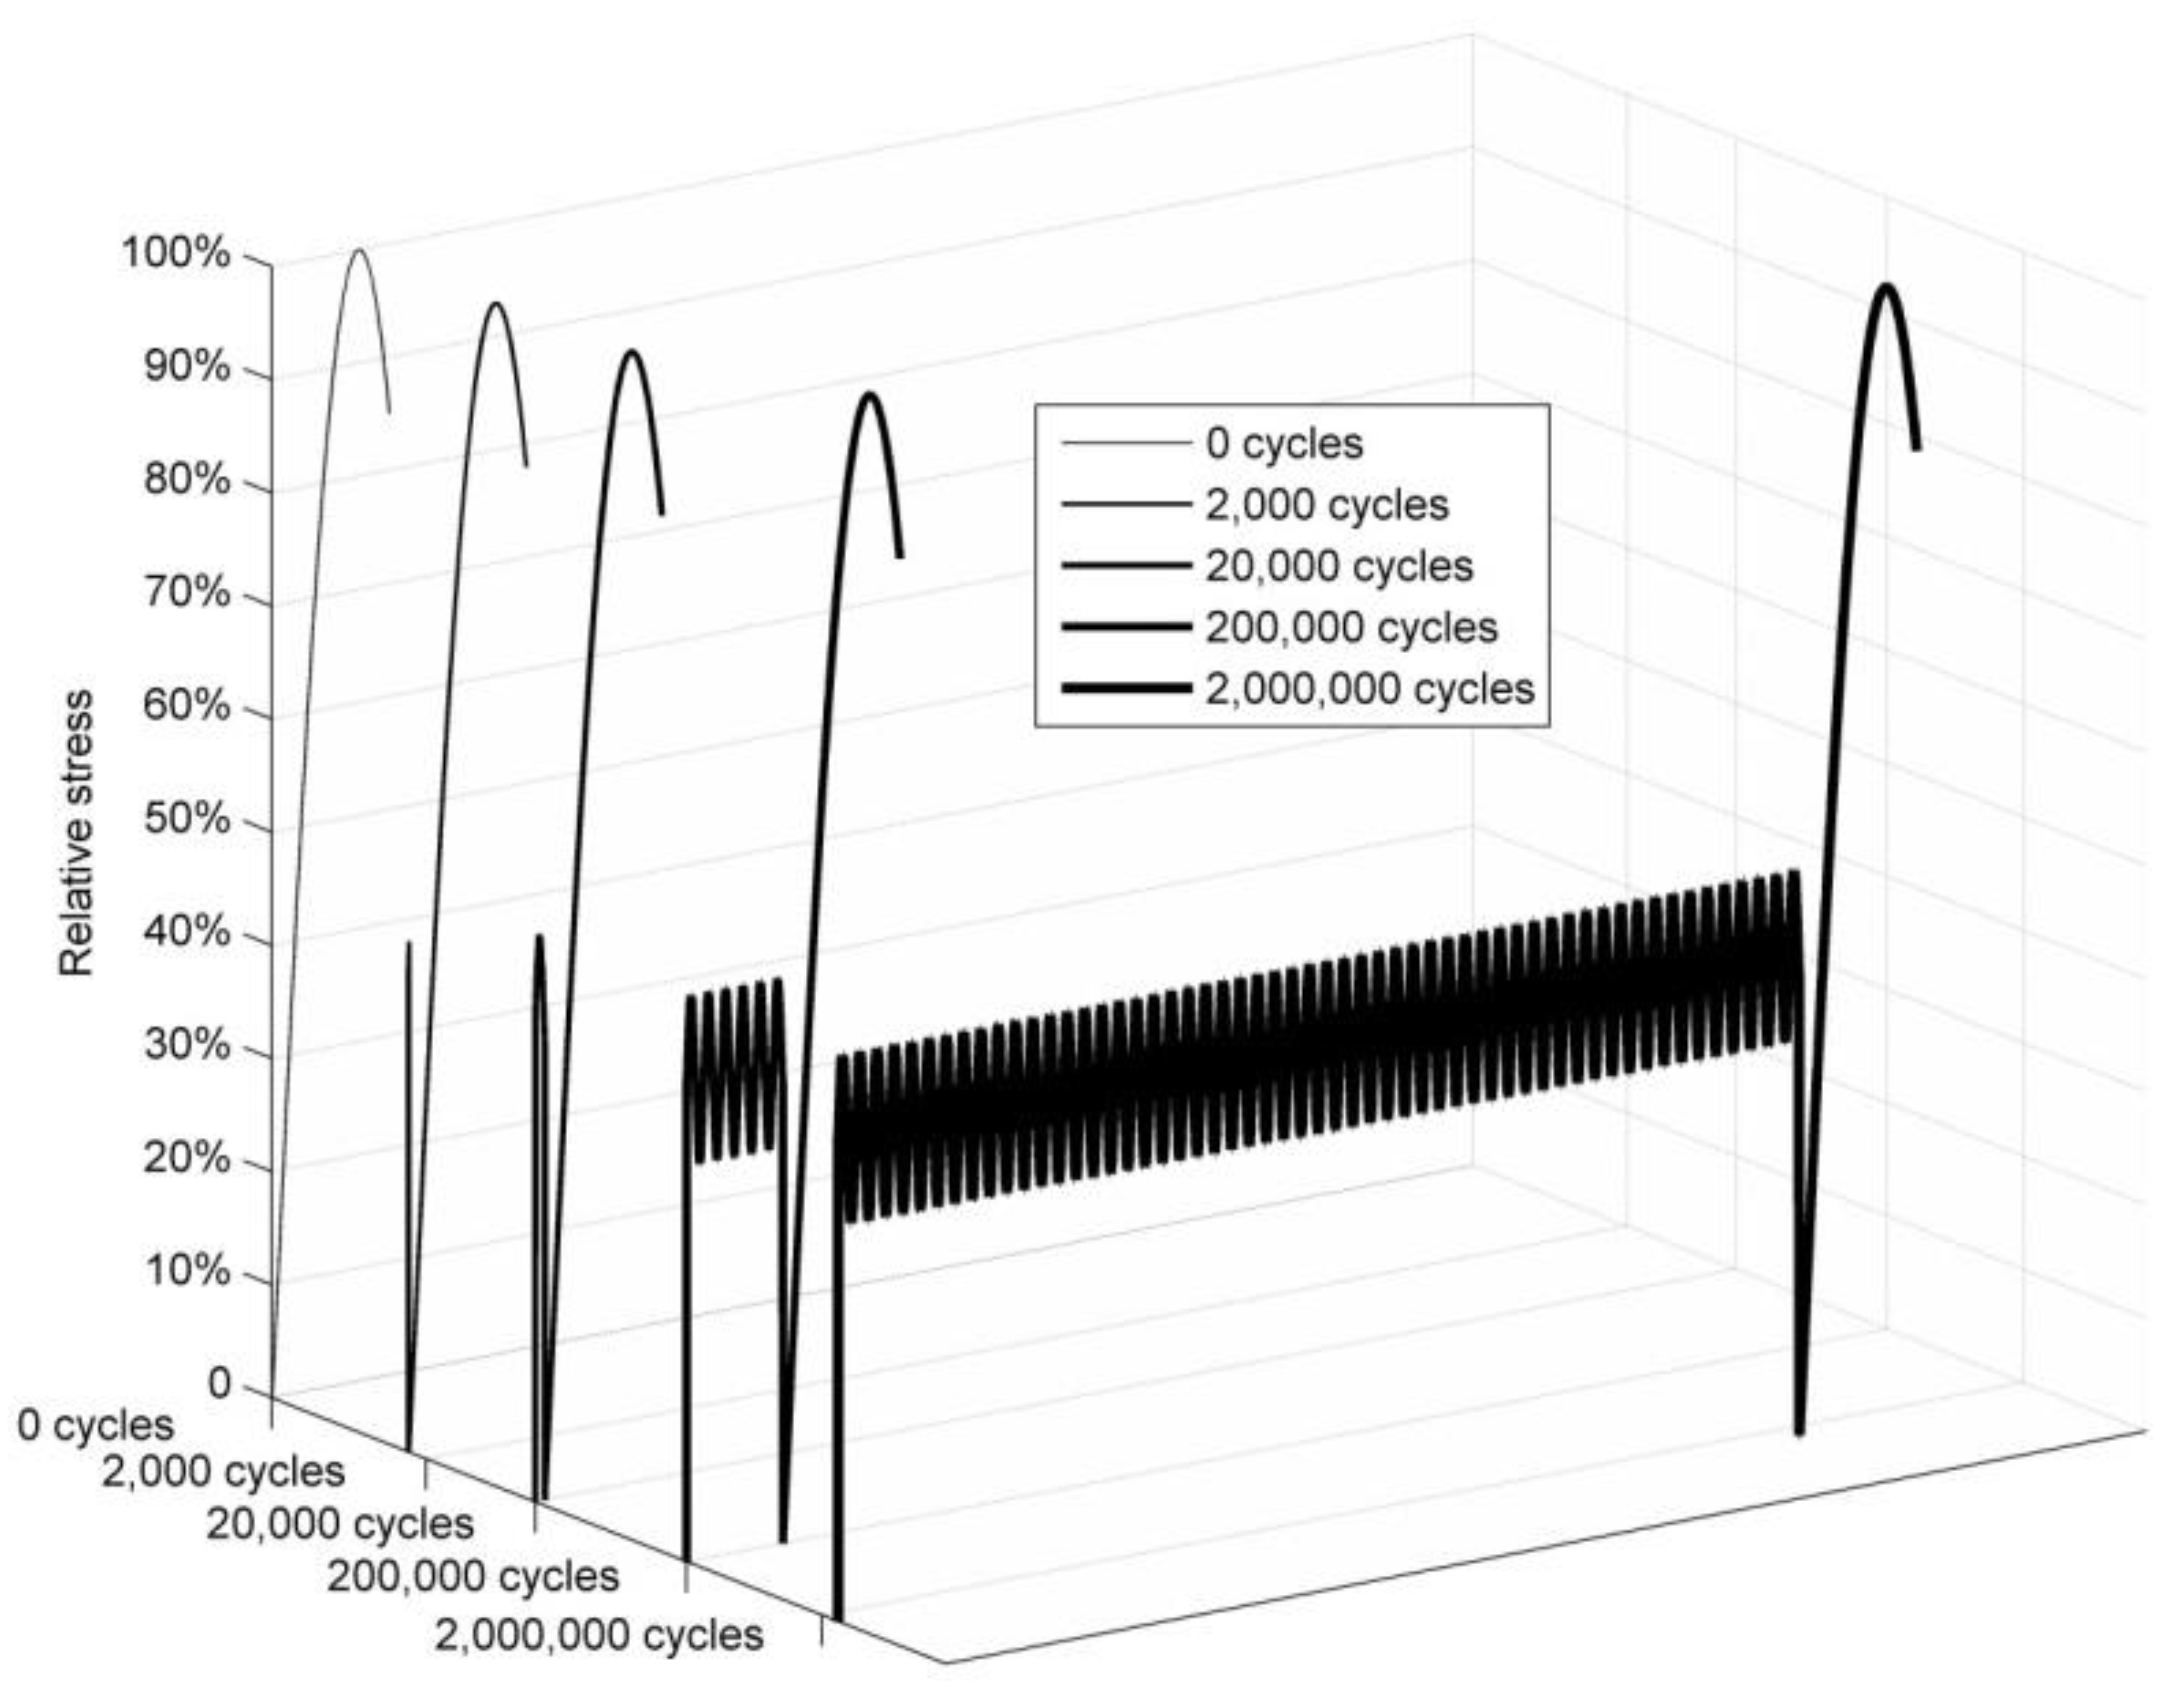
Figure 1 shows a scheme of the test procedure. The longitudinal axis represents the time.
All the specimens were wrapped in polyvinyl chloride (PVC) cling film before the static post-cyclic tests, to prevent defragmentation once failure occurred. Moreover, an end-of-test condition was programmed into the test machine: the test ended when the vertical load dropped by more than 20% of the maximum load. In this case, the end-of-test conditions, in combination with the PVC cling film, meant that all of the specimen fragments were easily locatable.
2.3. CT Scanning
Having completed the mechanical tests, all the specimens were scanned in order to visualize the microstructure of the concrete. CT scan technology generated an image for close up examination of the fiber locations and orientations in each specimen and the internal microcracks, so that the resistance mechanisms, i.e., the mechanisms used by the specimen to withstand the compressive load, could be observed.
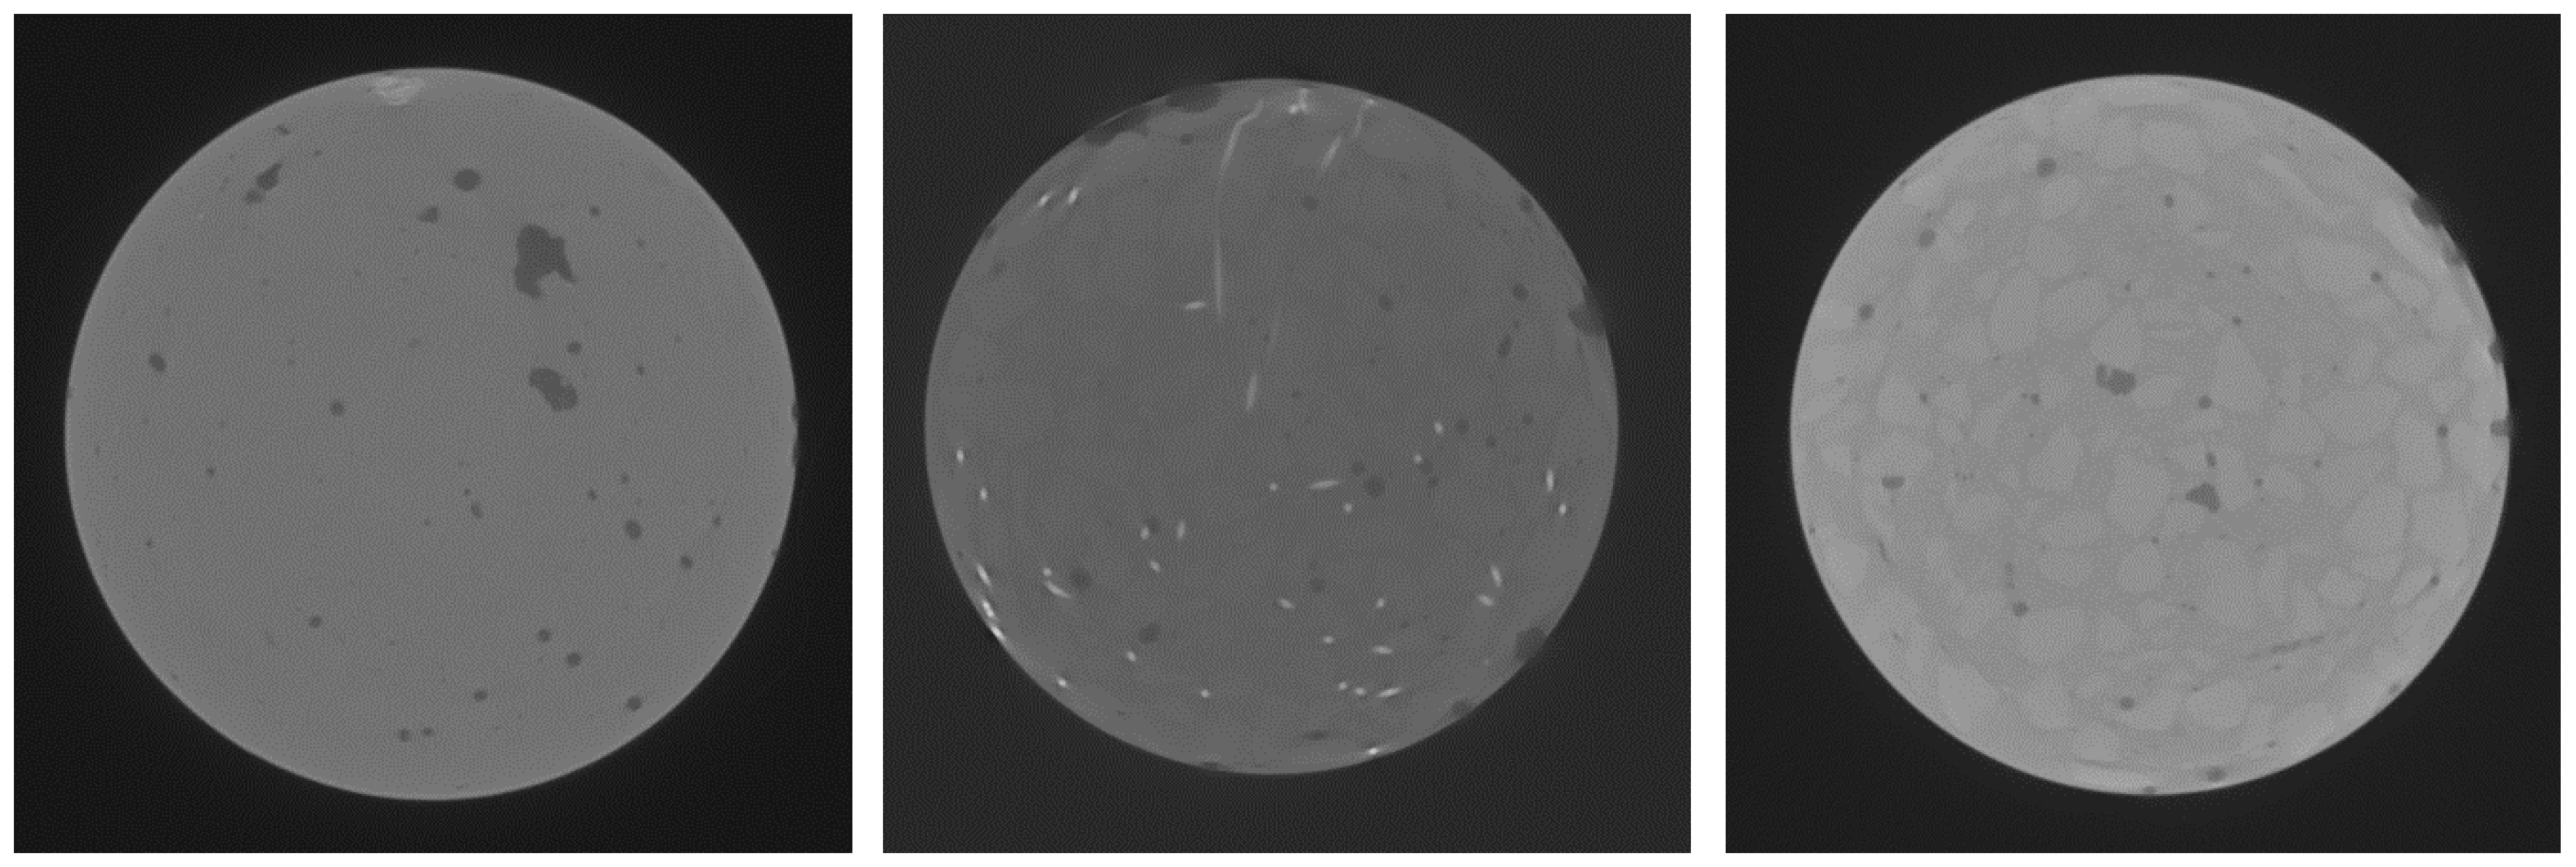
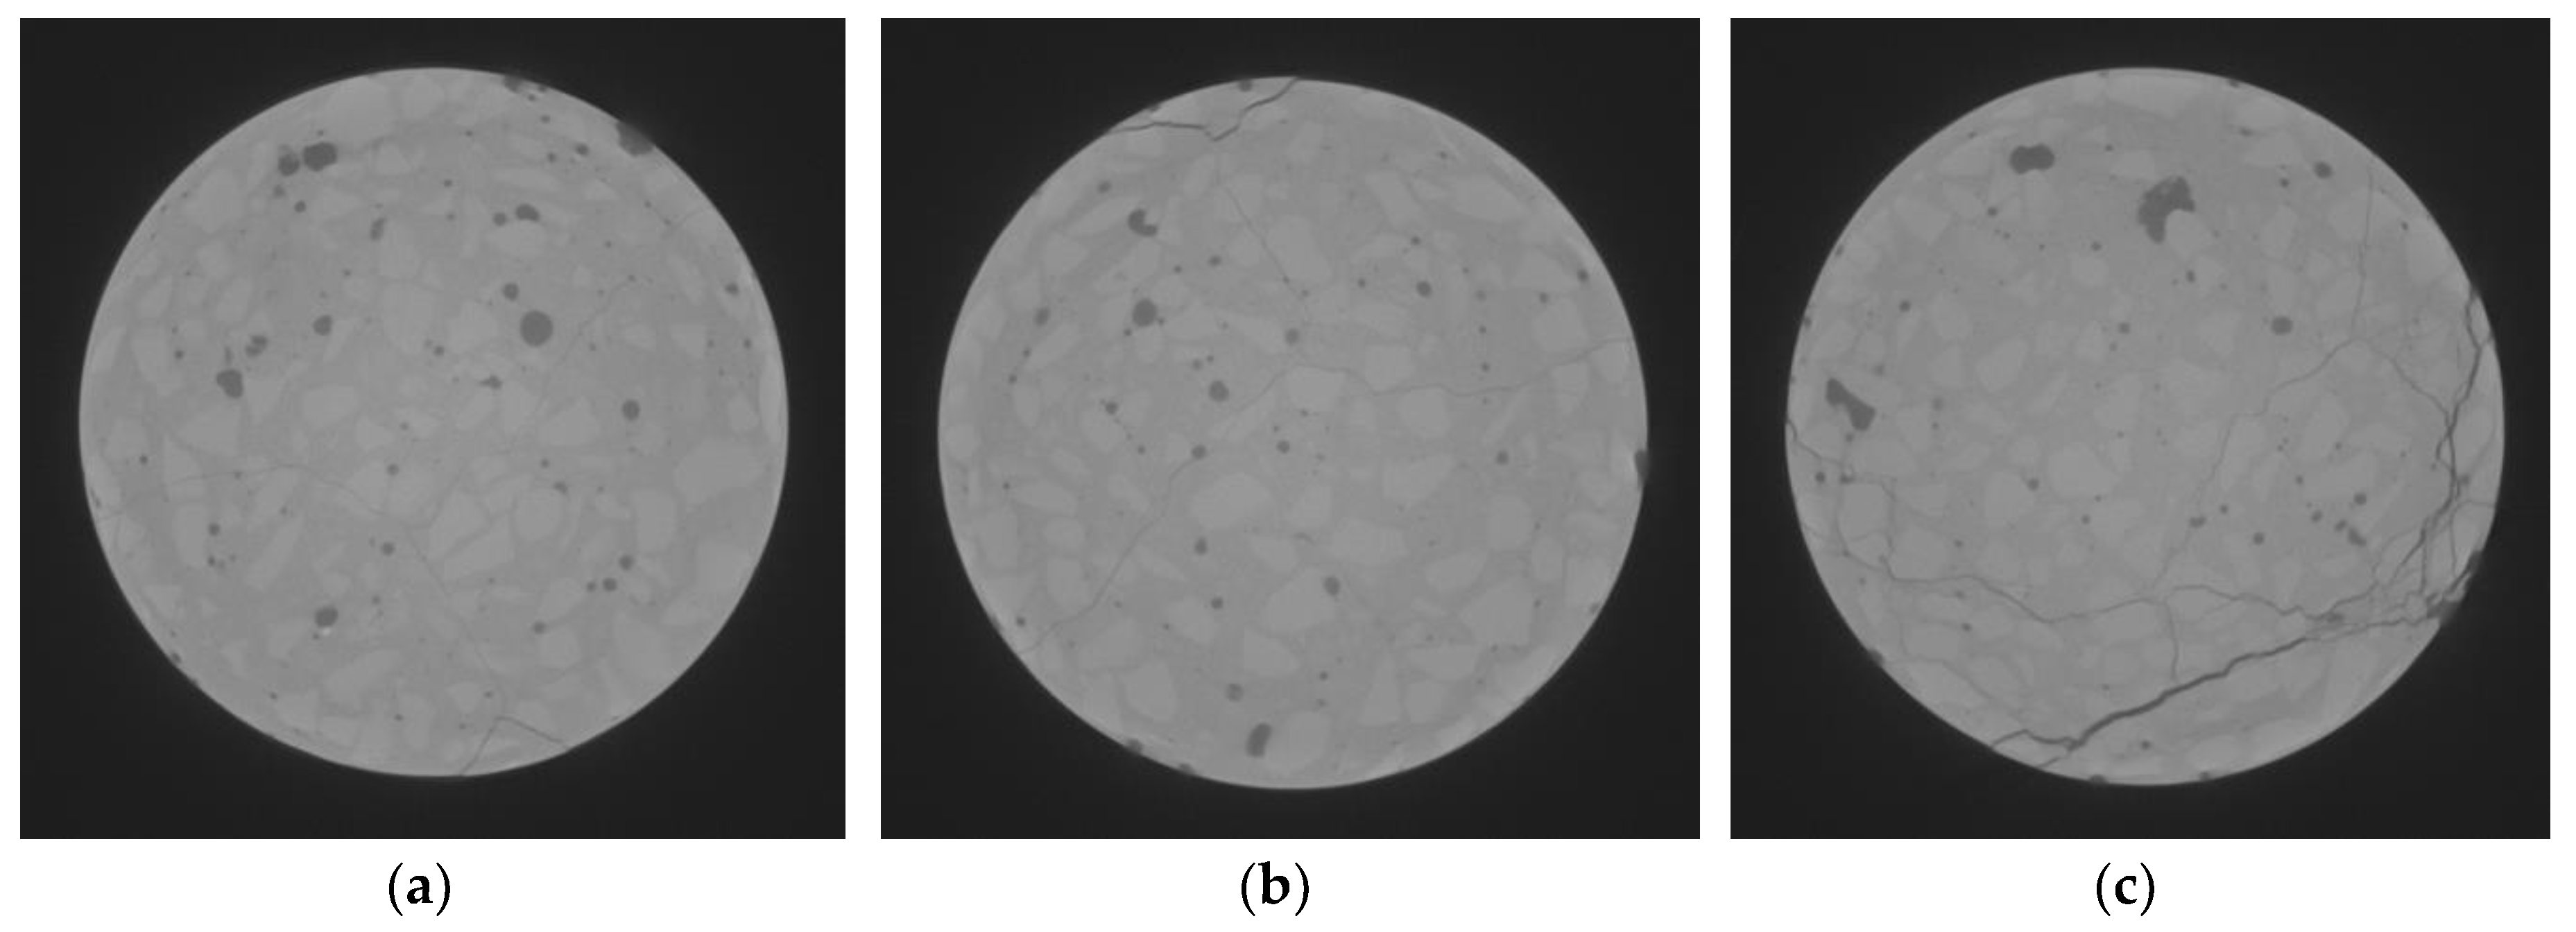
In this research, the cubic specimens were CT scanned using a GE Phoenix v|tome|x device (General Electric, Boston, MA, USA) equipped with a 300 kV/500 W tube. The intensity-controlled X-ray source emits a cone ray that is received by an array of detectors, which measures the loss of X-ray intensity, depending on the density of the matter along its path. Using a post-processing software package, a total of 1334 2D slices with pixel sizes of 2048 × 2048 (
Figure 2) were obtained throughout the height of the specimen from the CT scan data. In this case, the horizontal resolution was approximately 75 × 75 μm
2 and the vertical distance between the slices was around 75 μm. A total of 2667 images were obtained from each cylinder. After that, a 3D image of the whole specimen was generated using all the above mentioned 2D images. The post-processing software assigns a grey value to each voxel, from 0 (which belongs to the least dense voxel, i.e., voids and cracks) to 255 (which belongs to the densest voxel, i.e., steel). The scanning process results in a file that includes the X, Y, and Z Cartesian coordinates of the voxel center of gravity and an integer number, from 0 to 255, with regards to its density. The total number of voxels in a specimen was around 4.8 × 10
9.
3. Experimental Results
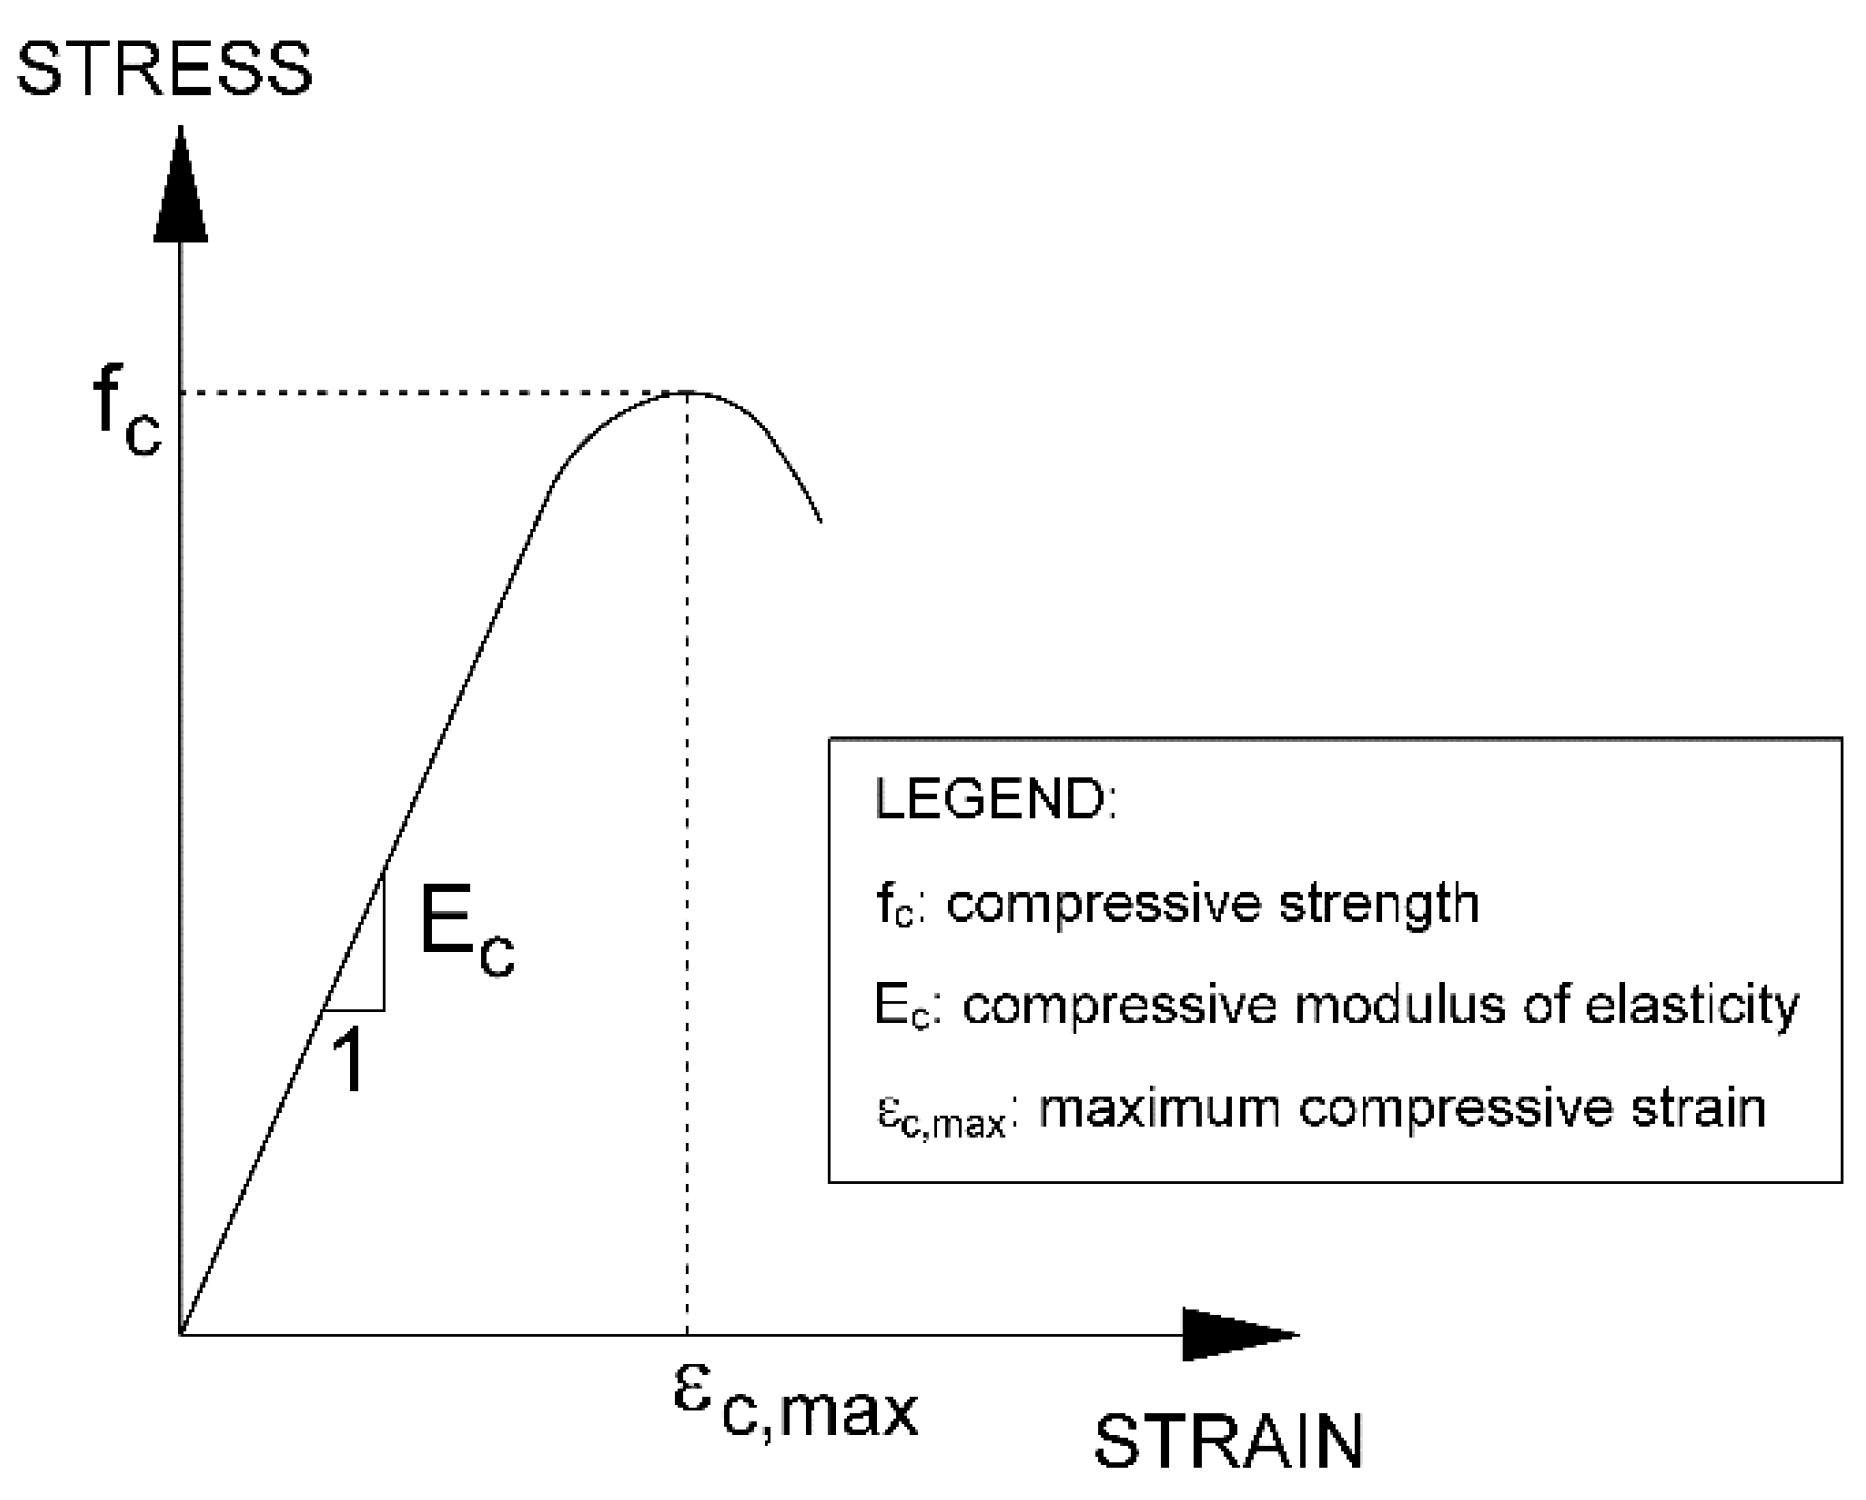
The three main mechanical parameters obtained from the static post-cyclic tests were the compressive strength (
), the compressive modulus of elasticity (
), and the maximum compressive strain (
) (
Figure 3).
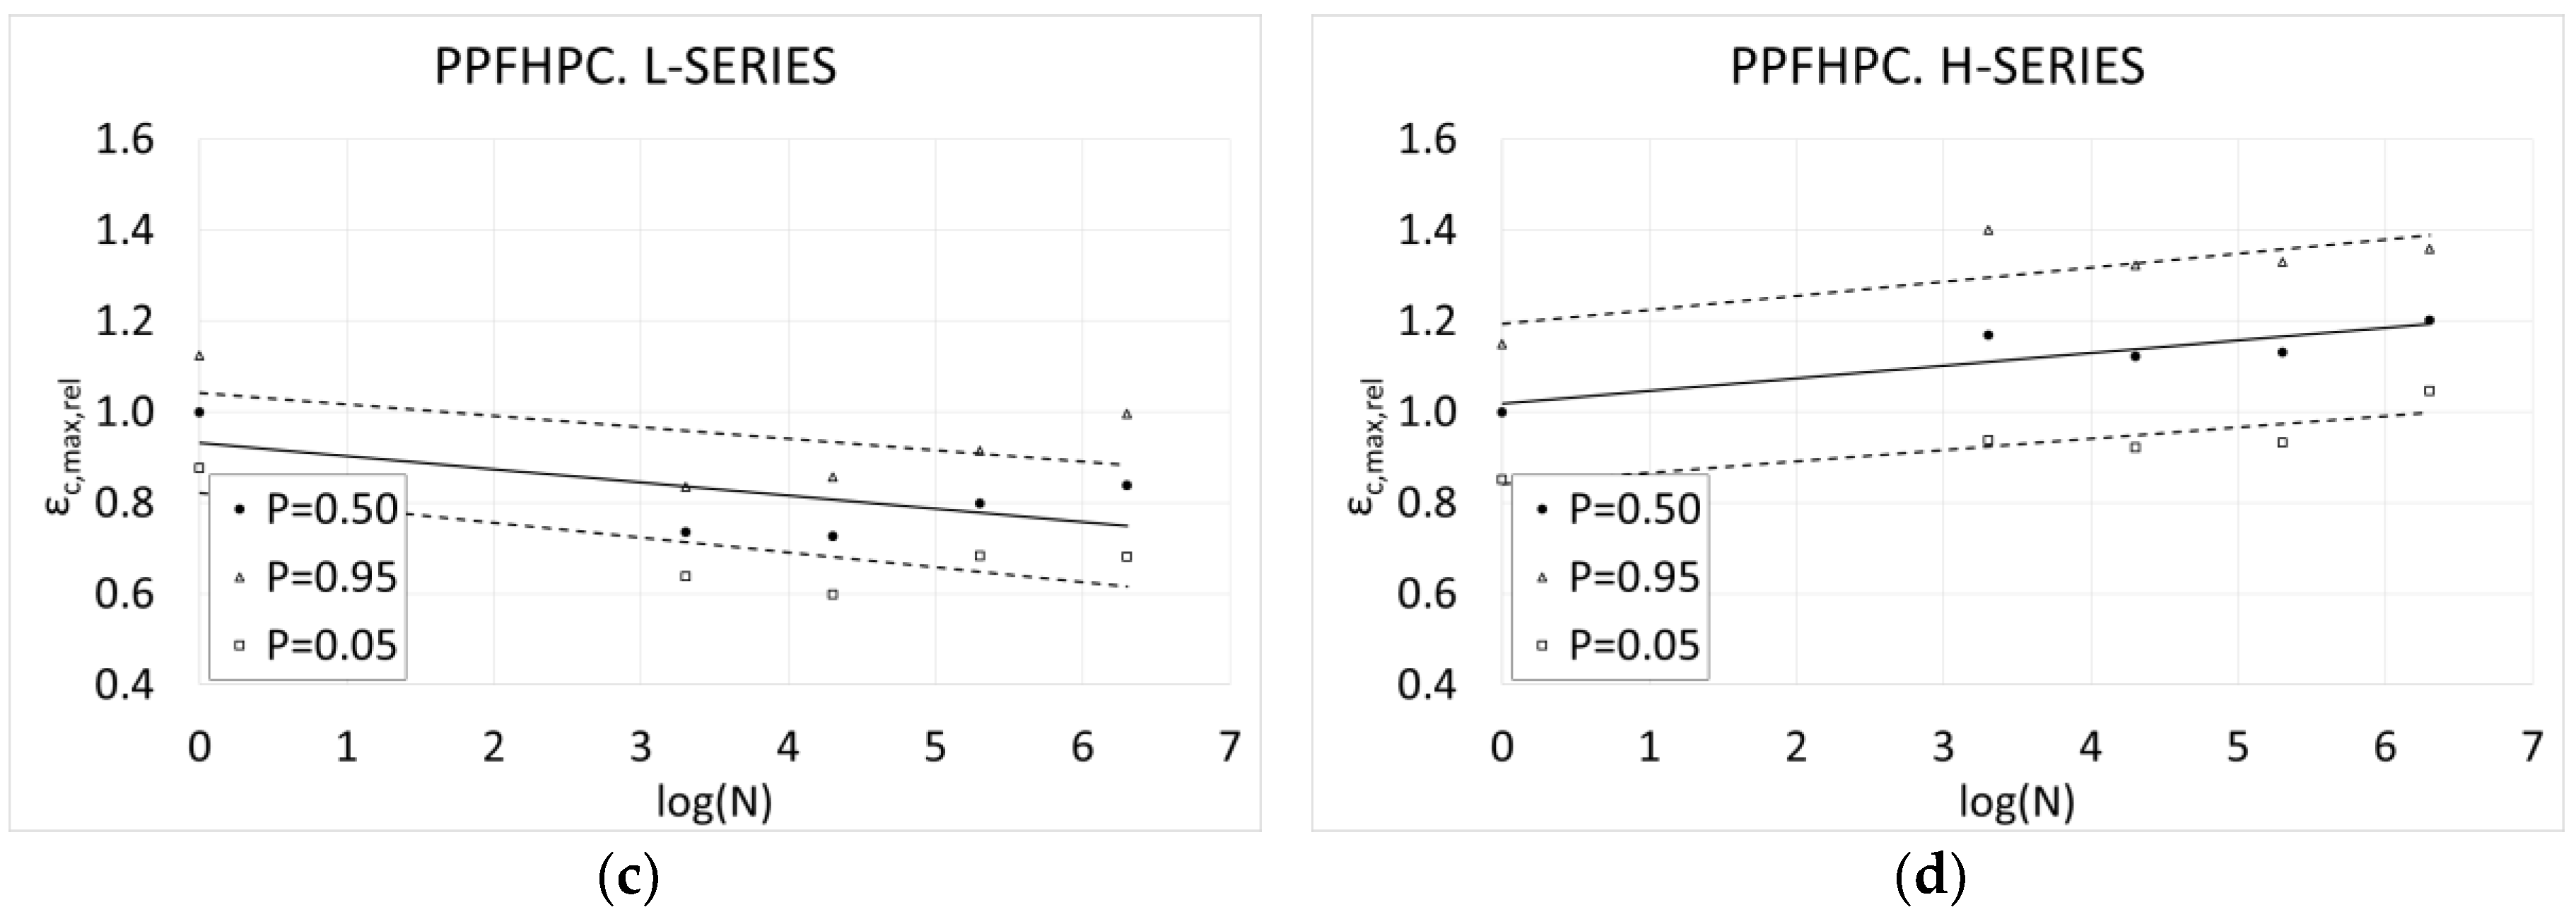
It was assumed that the data distribution pattern of the same set of four cylinders (sharing the same stress level, the same concrete mixture, and the same number of cycles) would follow a normal distribution.
Using those hypotheses, the following three main values were obtained: the average value, showing a probability of not being exceeded by 50% (p = 0.50); the minimum value, showing a probability of not being exceeded by 5% (p = 0.05); and the maximum value, showing a probability of not being exceeded of 95% (p = 0.95).
The relative value was defined as the quotient between the value and the average value at 0 cycles, for better visualization of their evolution with the number of cycles. Moreover, three tendency lines were fitted (using the least square method), for the average, maximum, and minimum relative values, respectively.
These data measurements, compressive strength, compressive modulus of elasticity, and maximum compressive strain are discussed below.
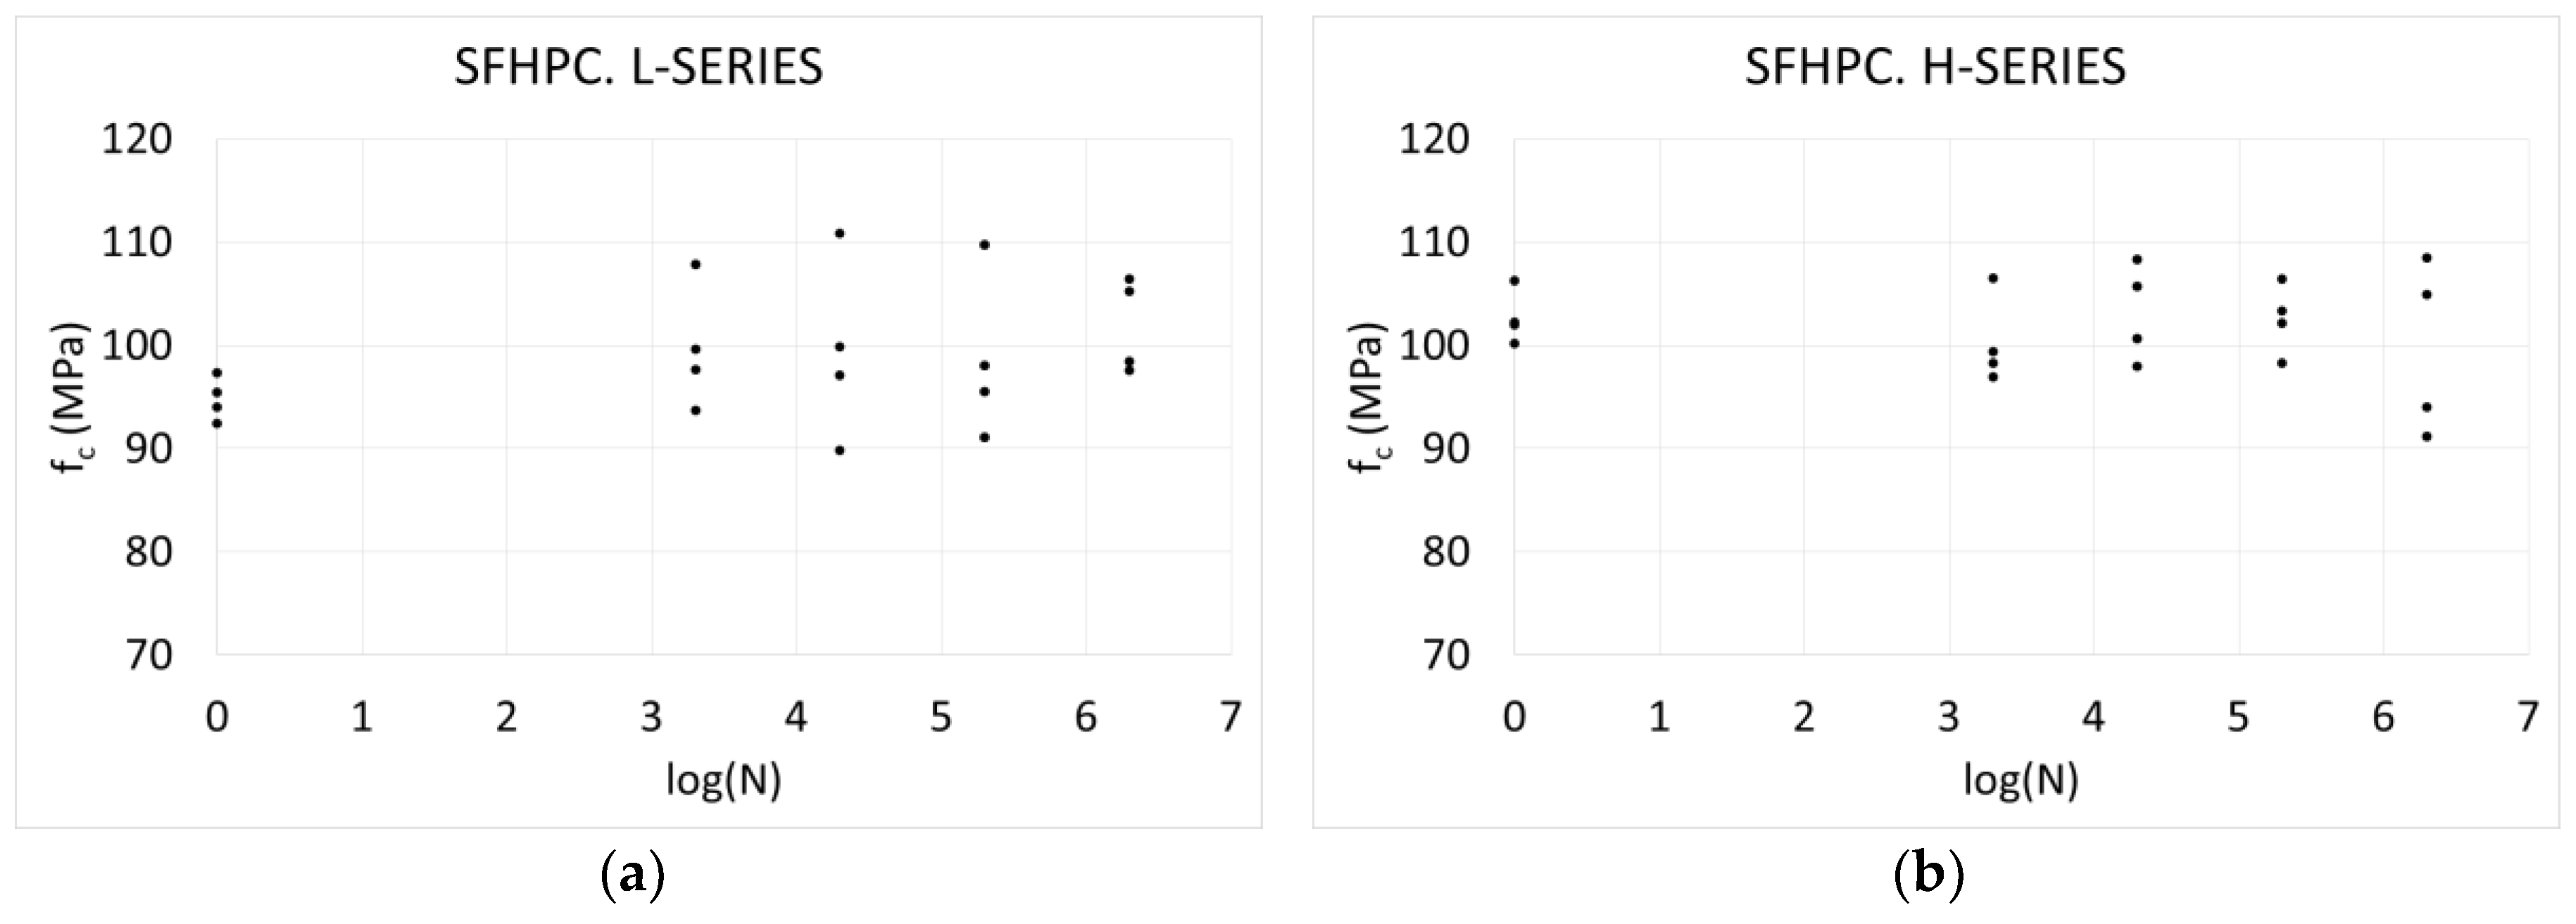
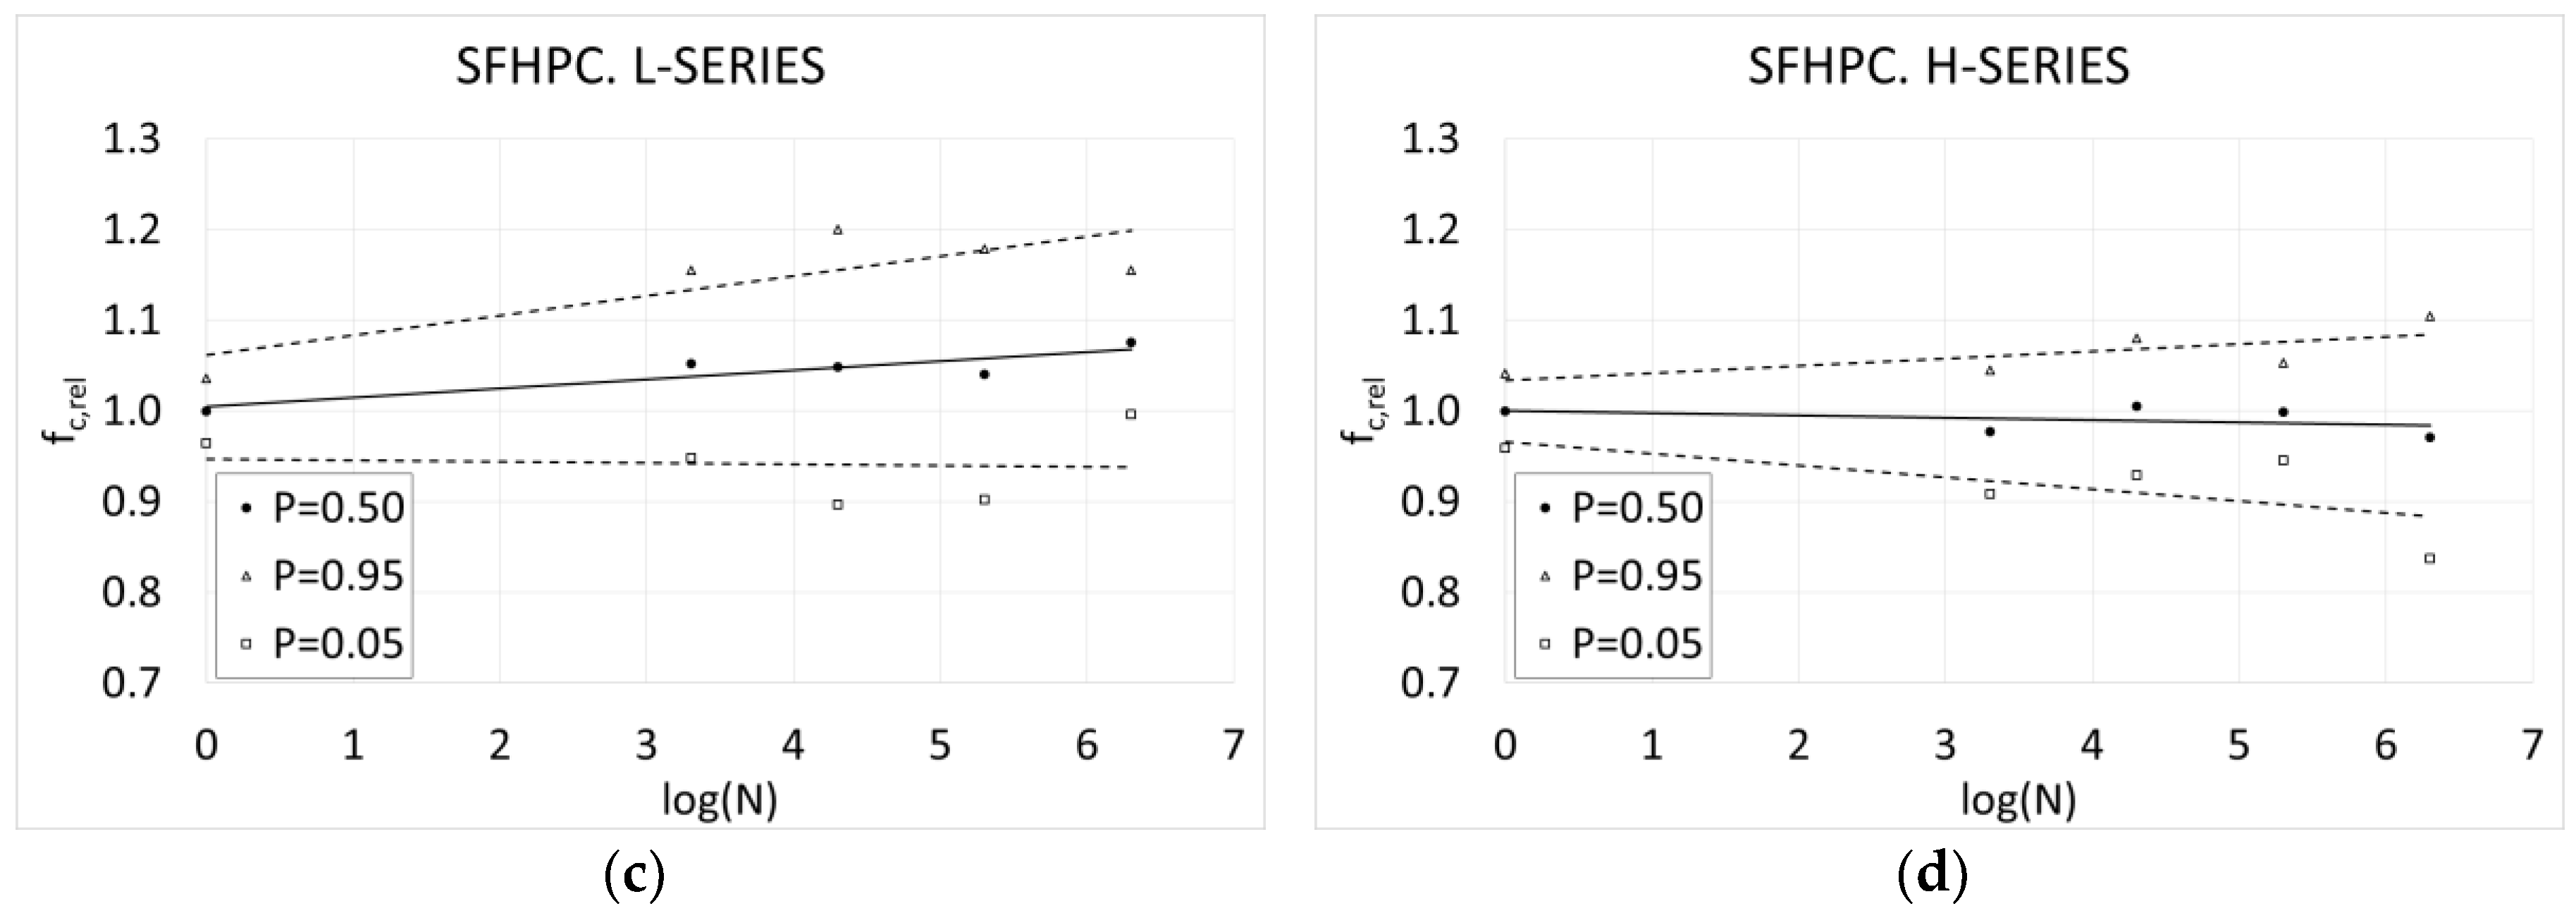
3.1. Compressive Strength
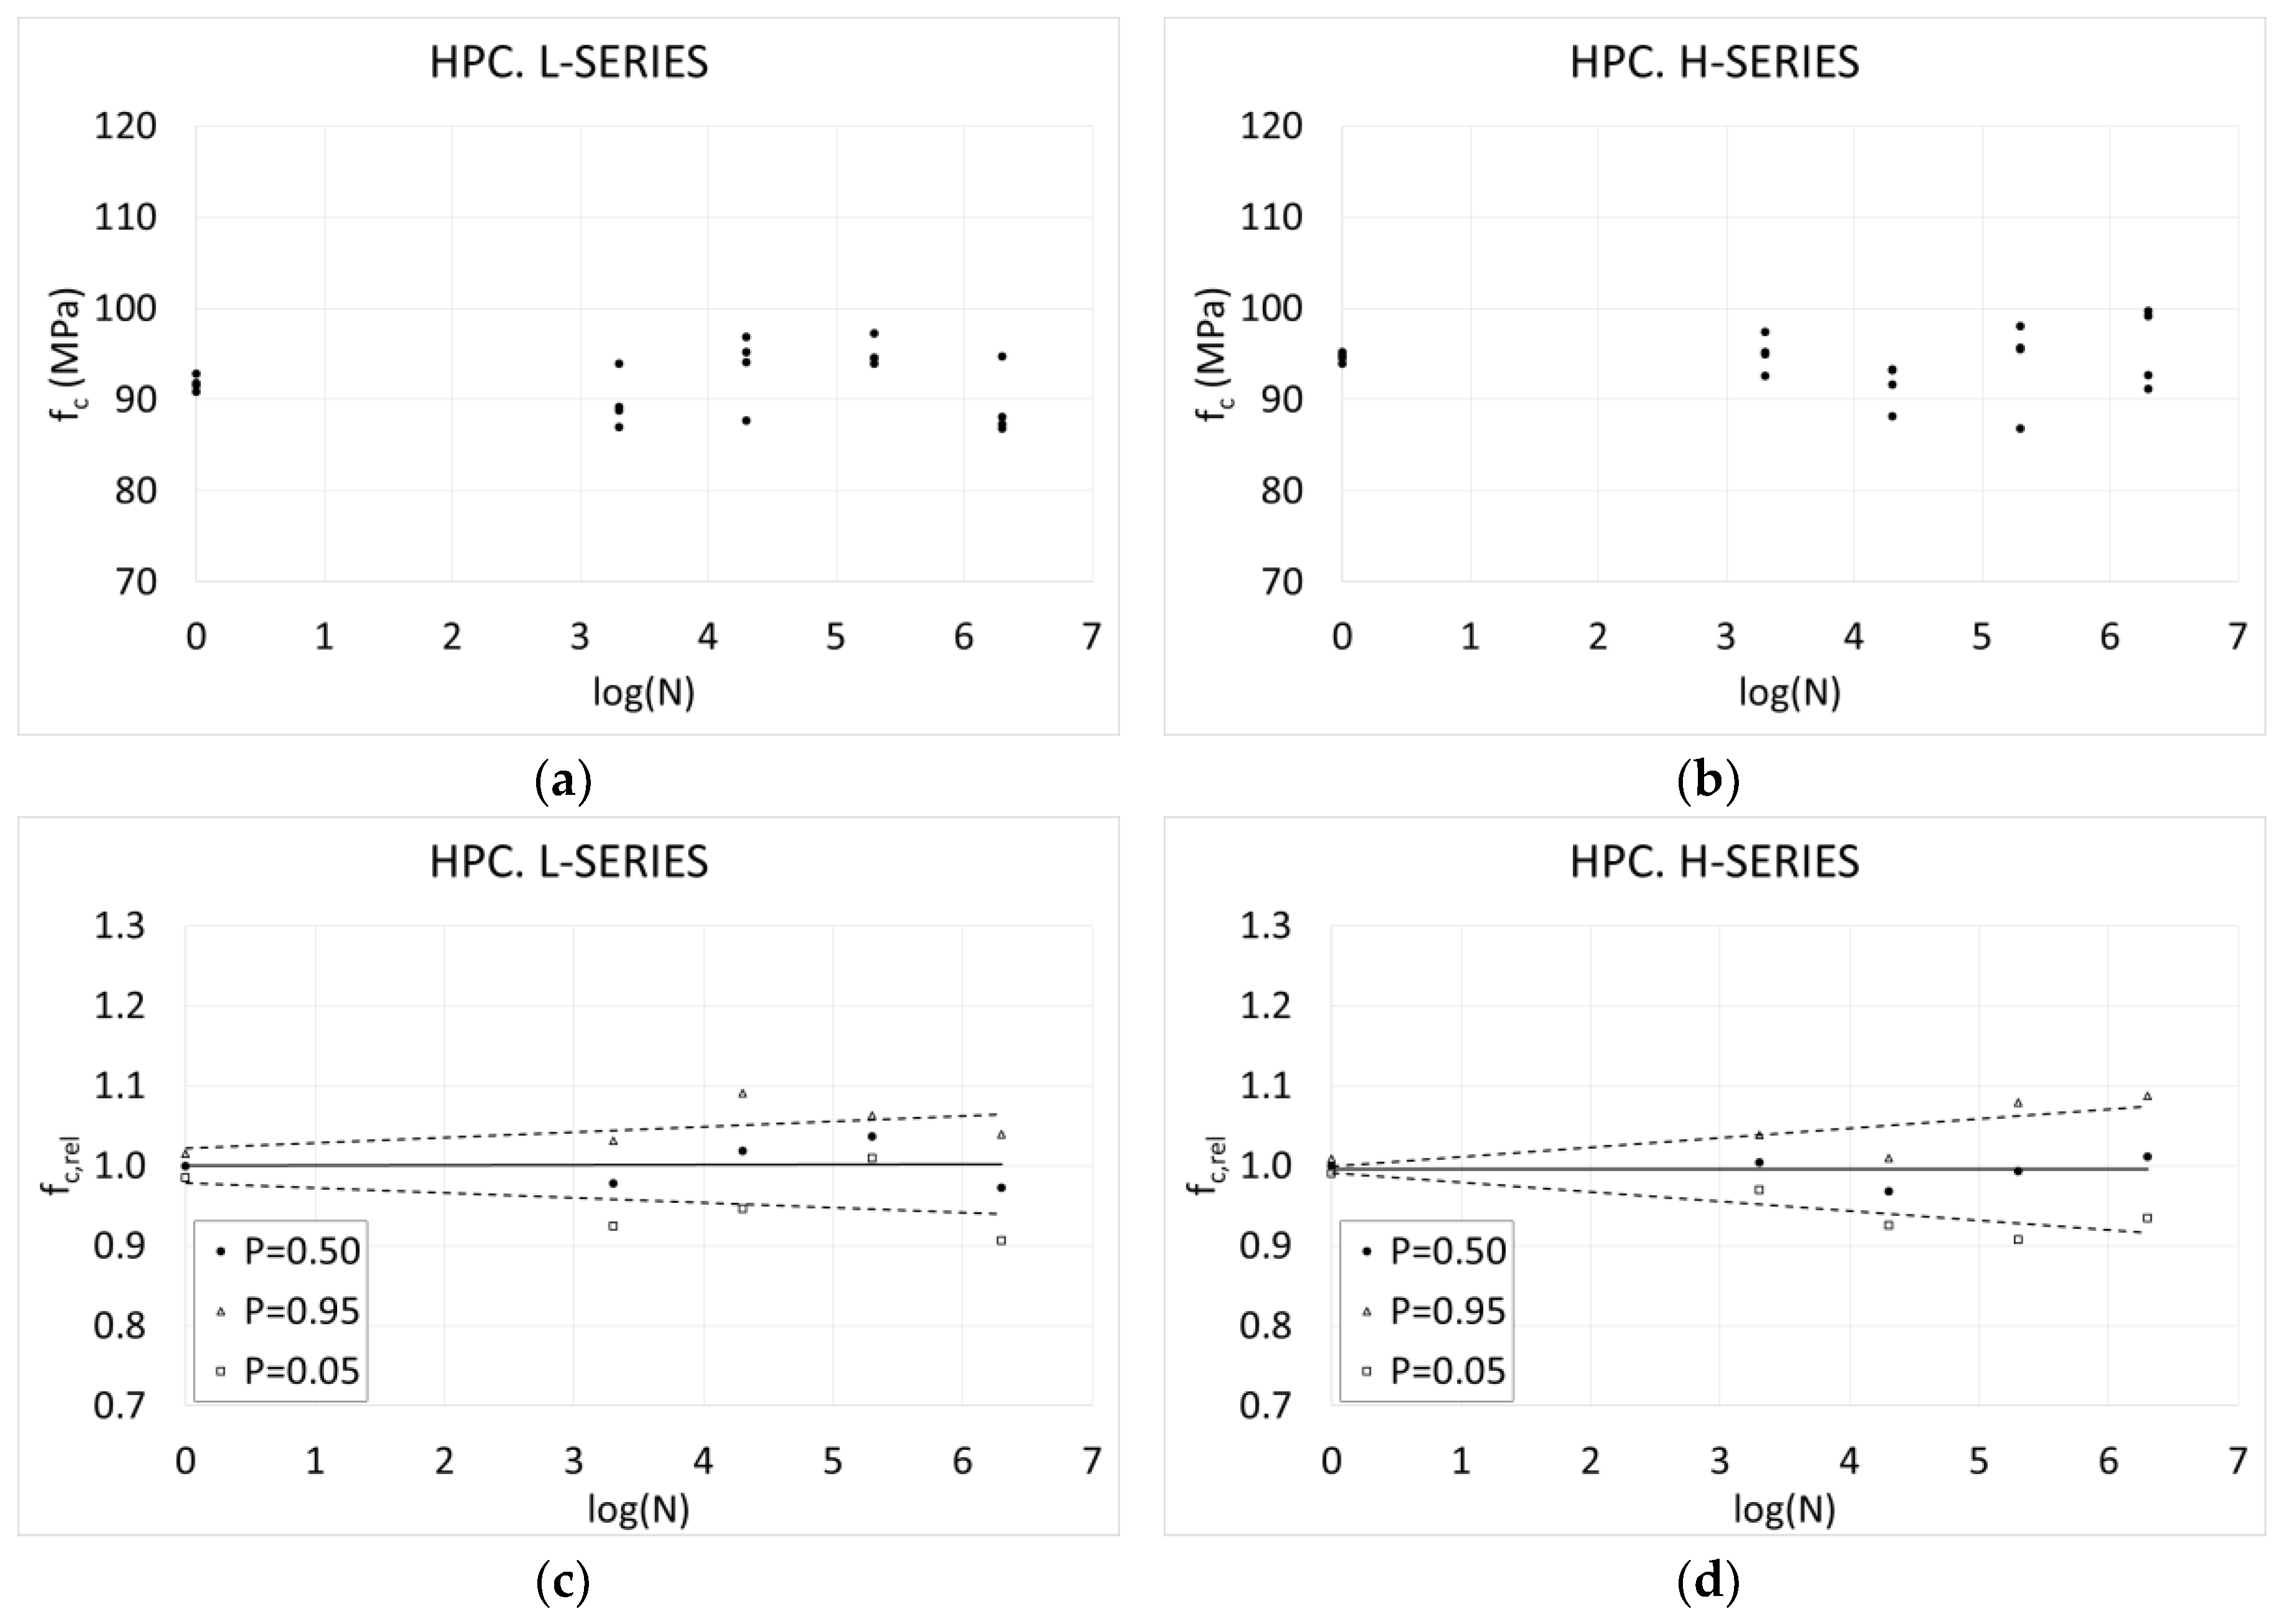
Figure 4,
Figure 5 and
Figure 6 show the range of compressive strengths by number of cycles for the three mixtures and for both series.
Figure 4,
Figure 5 and
Figure 6 show some interesting results. First, it should be highlighted that although the expected fatigue life was 1.9 × 10
8 cycles for the L-Series and 1.5 × 10
3 cycles for the H-Series, no collapse occurred during the cyclic tests. It was especially noticeable for the H-Series, where the number of cycles was, in all cases, greater than the expected fatigue life. When the expected fatigue life corresponding to the real concrete quality at the beginning of the cyclic tests is considered, the results are more consistent.
The results also showed no significant variation in the average compressive strength of the concrete by the number of cycles. In all cases, the variation was less than 7%. This behavior was observed for all the mixtures and for both series. It means that, in this case, any damage caused by cyclic loading was very small, and no appreciable mechanical consequences were observed.
On the contrary, a relevant increase of the scatter of the results was observed. Specimens not previously subjected to cyclic loads showed very low scatter, while the rest of the specimens, in general, showed a higher scatter. In general, the scatter increased more than two-fold, and this variation is quite similar in all cases.
This phenomenon can be explained as follows. Concrete specimens have internal stress caused by the curing process, shrinkage, etc. Cyclic loads release the internal stresses, resulting in microcracking. This phenomenon has been observed in previous research [
35,
36,
37]. Depending on the real internal stress field, the releasing process is more or less intense and more or less microcracking occurs, resulting in different macroscopic responses.
In some cases, this internal stress relaxation is not harmful and a greater compressive strength is observed.
This scatter was higher in the case of the mixtures including fiber, which reveals that the fibers introduced additional restrictions to the concrete mixture during the curing process, resulting in more internal stress. Cyclic loads released this stress, and the macroscopic result was a higher scatter.
The mixture including steel fibers showed, in general, higher compressive strength, which denotes that steel fibers help to increase the mechanical capacity of concrete. In contrast, the mixtures without fibers and with polypropylene fibers showed similar results.
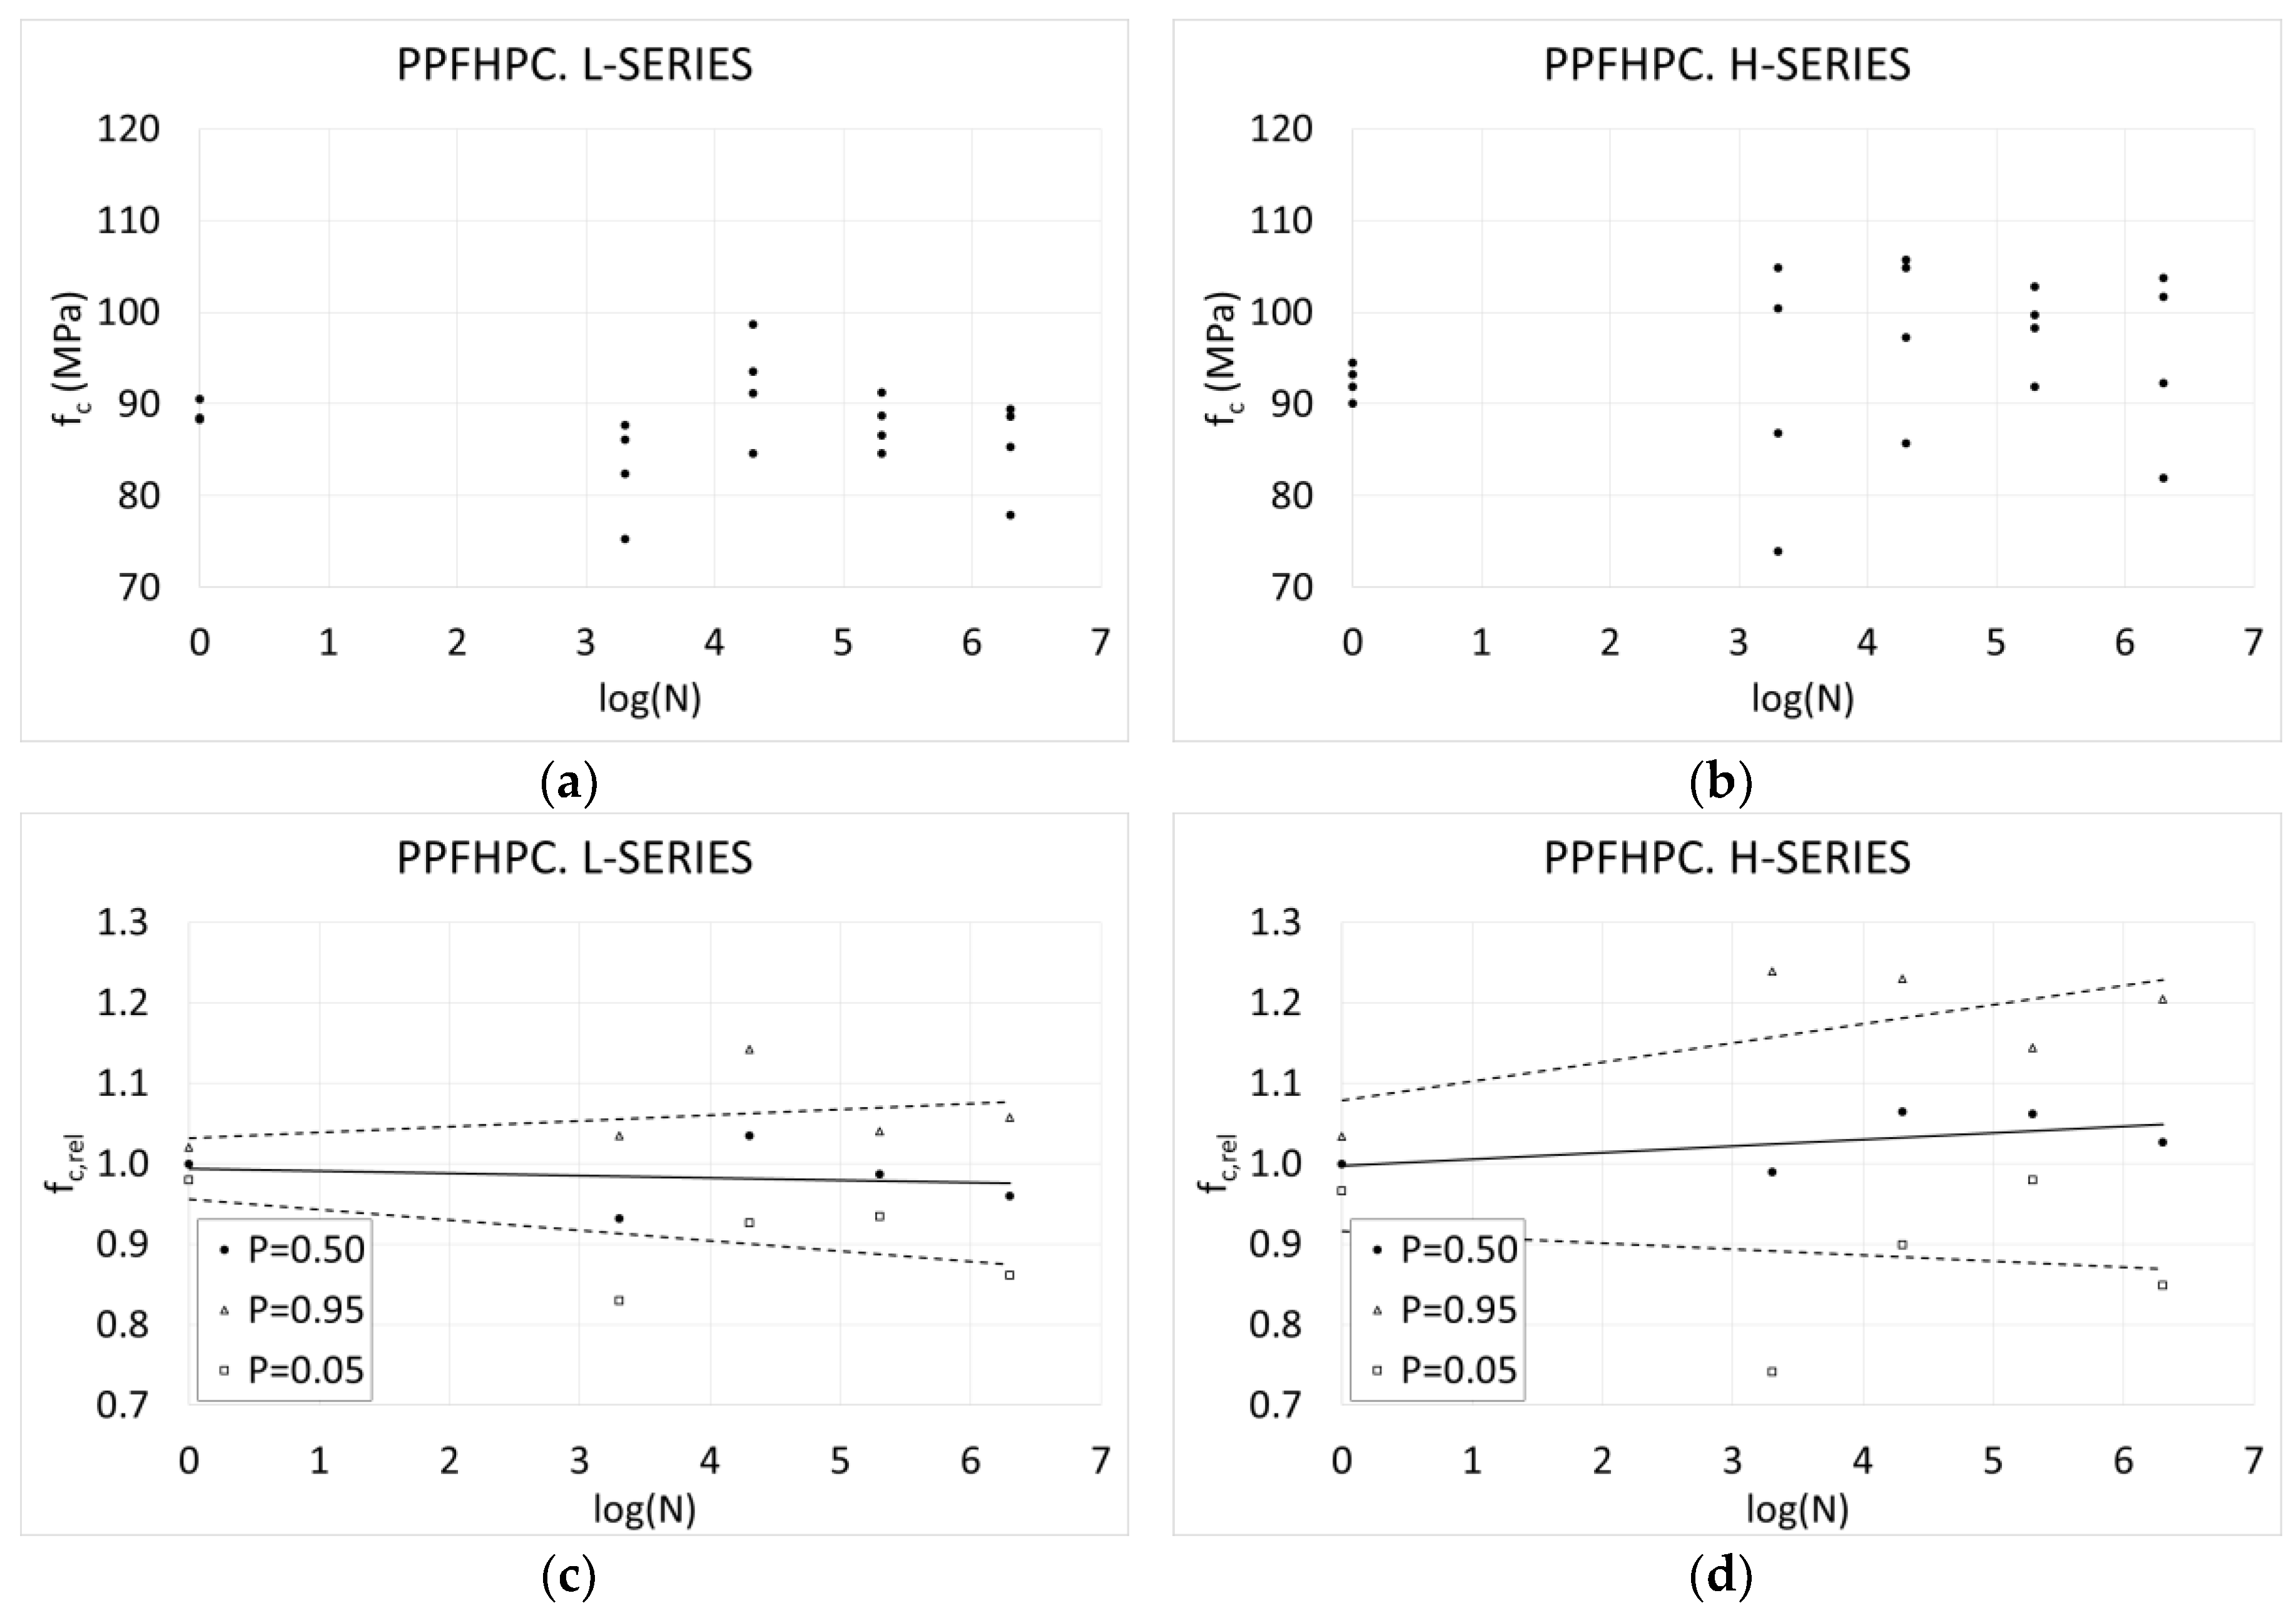
3.2. Compressive Modulus of Elasticity
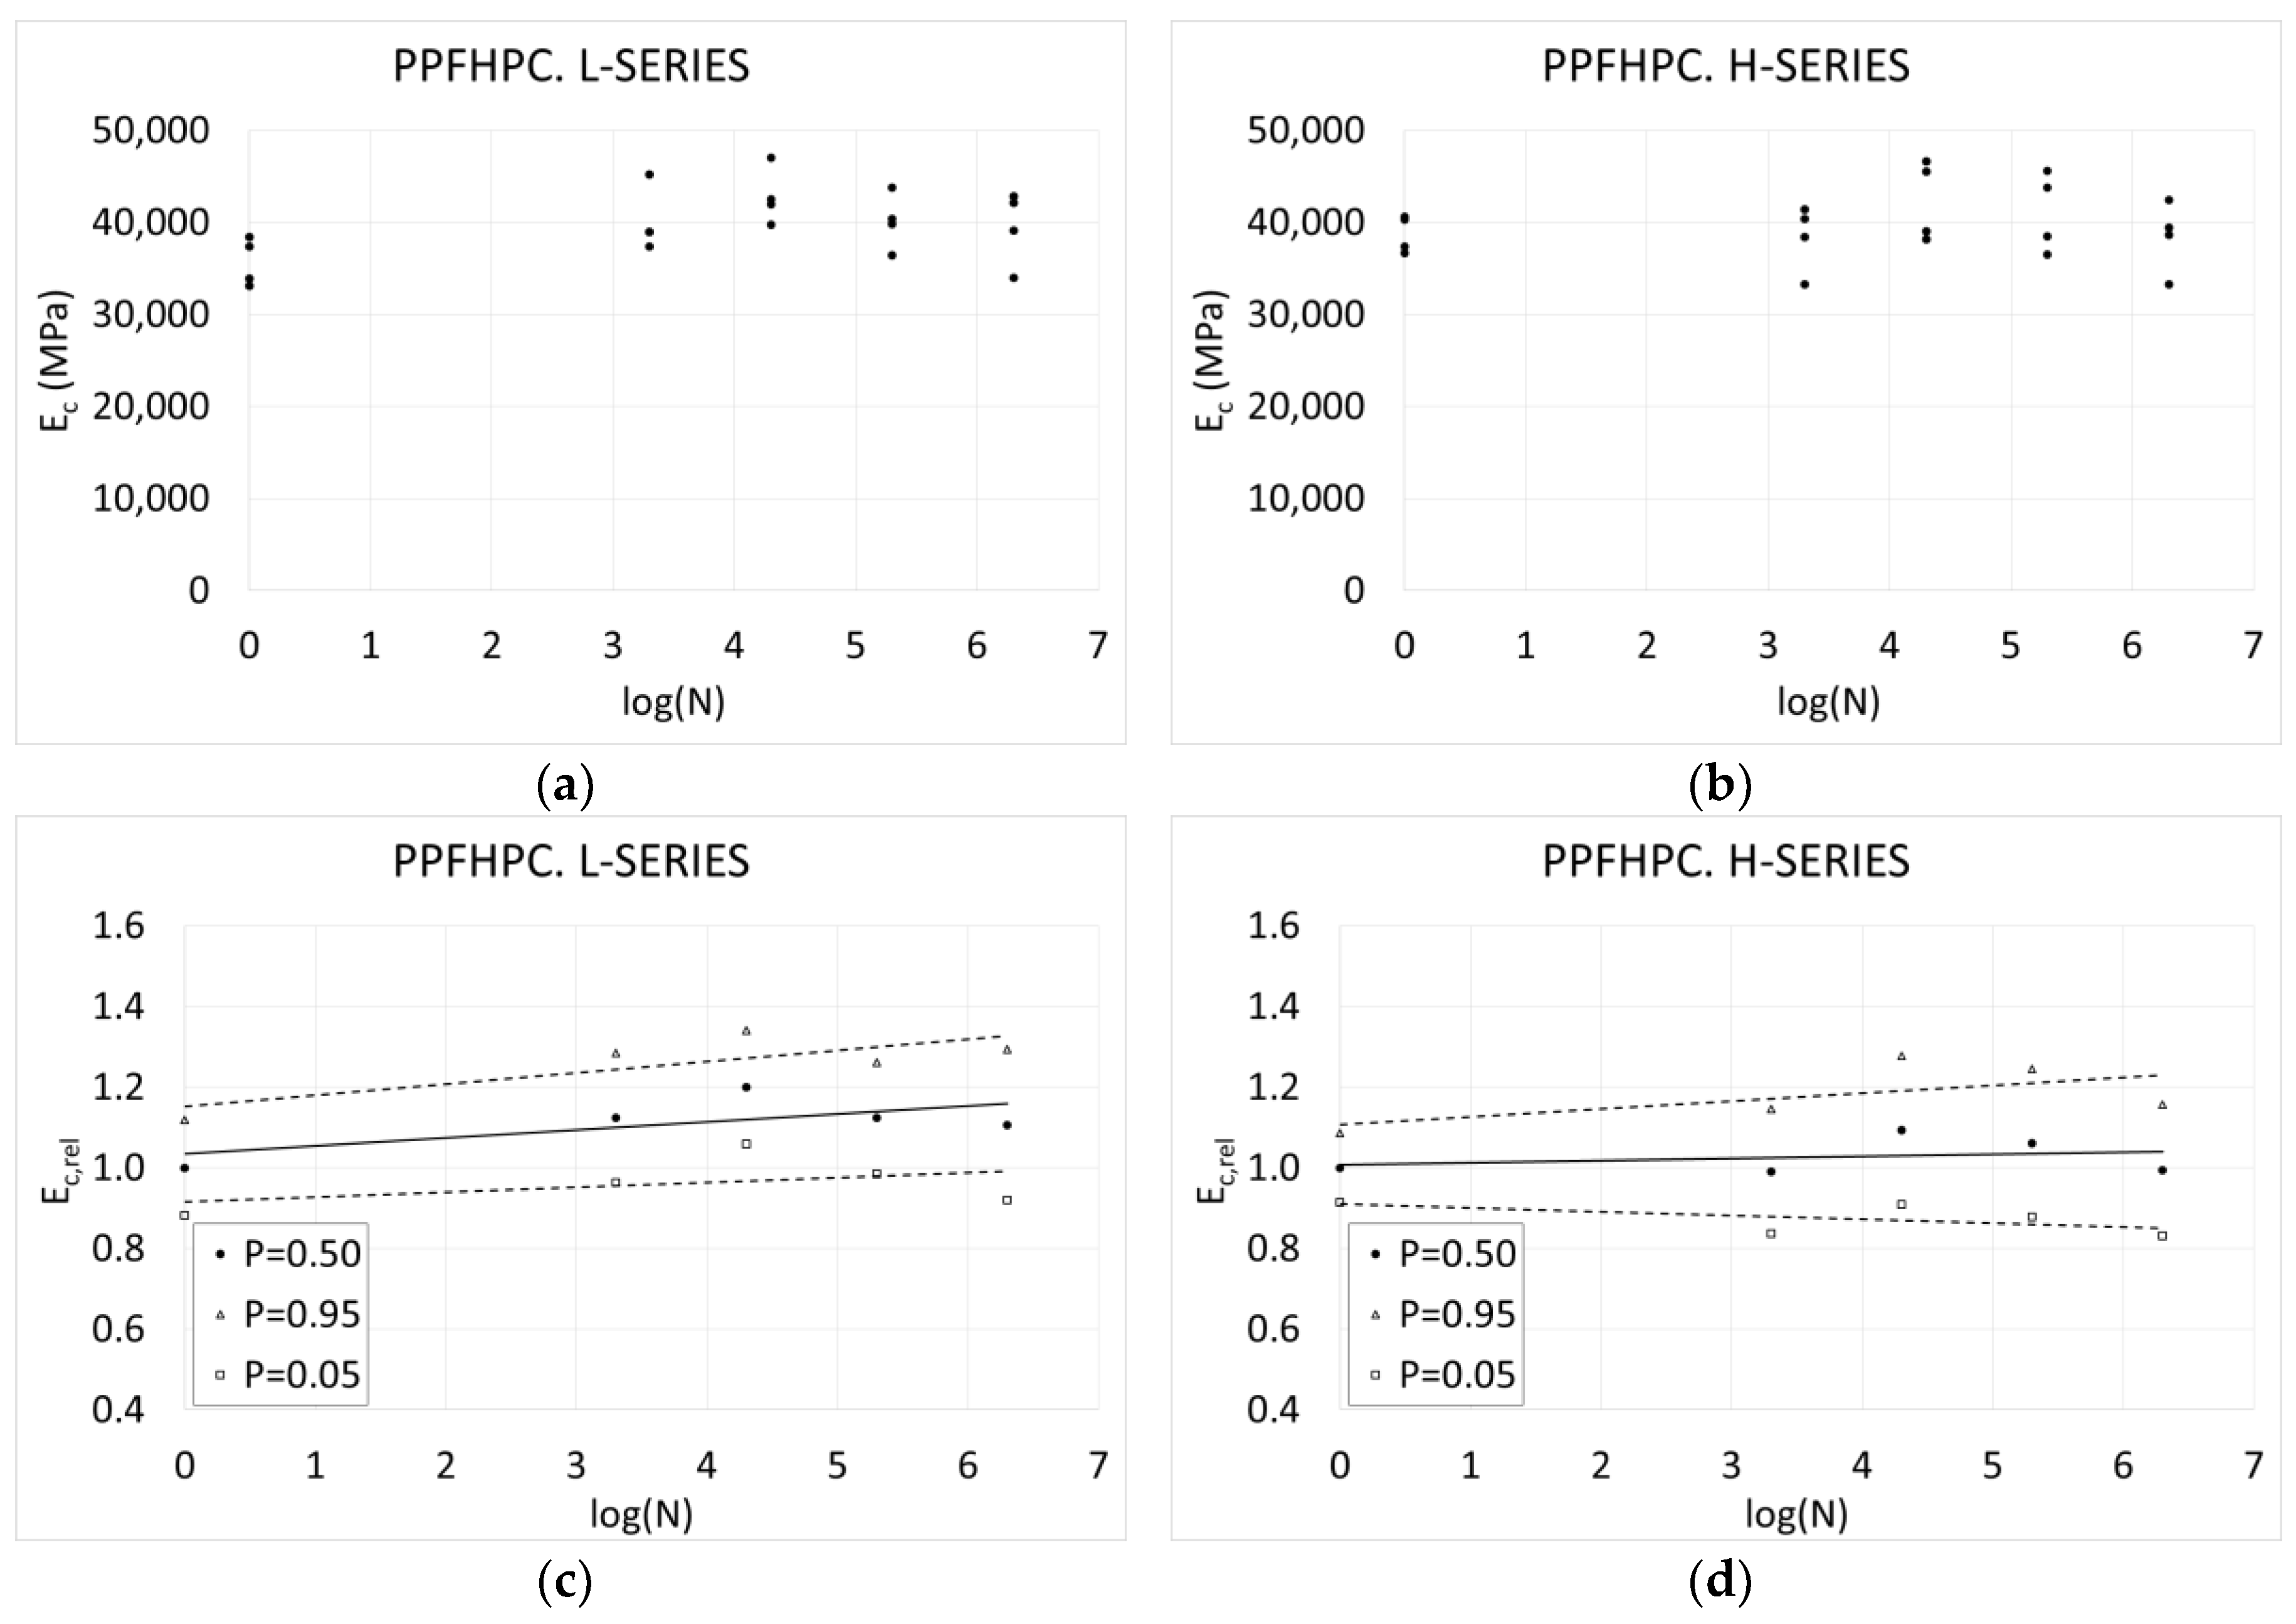
Figure 7,
Figure 8 and
Figure 9 show the results of the variation of the compressive modulus of elasticity with the number of cycles, for the three mixtures and for both series.
In contrast to the results depicted in
Figure 4,
Figure 5 and
Figure 6,
Figure 7,
Figure 8 and
Figure 9 show that there was no significant variation in the average compressive modulus of elasticity of concrete with the number of cycles. The L-Series showed a slight increase of the compressive modulus of elasticity, up to 15–20%. On the other hand, the H-Series showed a flat behavior, with a variation below 5%.
As with compressive strength, the compressive modulus of elasticity was not adversely affected by cyclic loading, and no relevant mechanical consequences were observed.
In a deeper analysis, it may be observed that the variation of the compressive modulus of elasticity did not follow a monotonic tendency. First, an initial slight increase of the compressive modulus of elasticity up to a maximum value was observed, which was located between 20,000 and 200,000 cycles, depending on the mixture and on the series. It then started to decrease.
In this case, an increase of the scatter of the results was observed, although it is not very relevant.
As happened with compressive strength, the internal stress released by the cyclic loads during the first cycles resulted in microcracking. In this case, this stress relaxation resulted in an increase of the compressive modulus of elasticity. Under low and moderate stress levels, which are the ones used to measure the compressive modulus of elasticity, the results show that the presence of fibers had no influence, since no different tendency was observed between the mixtures with and without fibers.
The scatter was also similar in all cases, which denotes that fibers had no relevant influence on the compressive modulus of elasticity, i.e., the evolution of the microcracking and its impact on the compressive modulus of elasticity depends on concrete matrix only. The scatter depends on concrete matrix only, resulting in a similar variation in all cases, regardless of the presence or absence of fibers, and the type of fibers.
Moreover, all the mixtures and both series showed very similar values for the compressive modulus of elasticity (in the surrounding of 40,000 MPa), implying that this parameter was not sensitive to the presence of fibers.
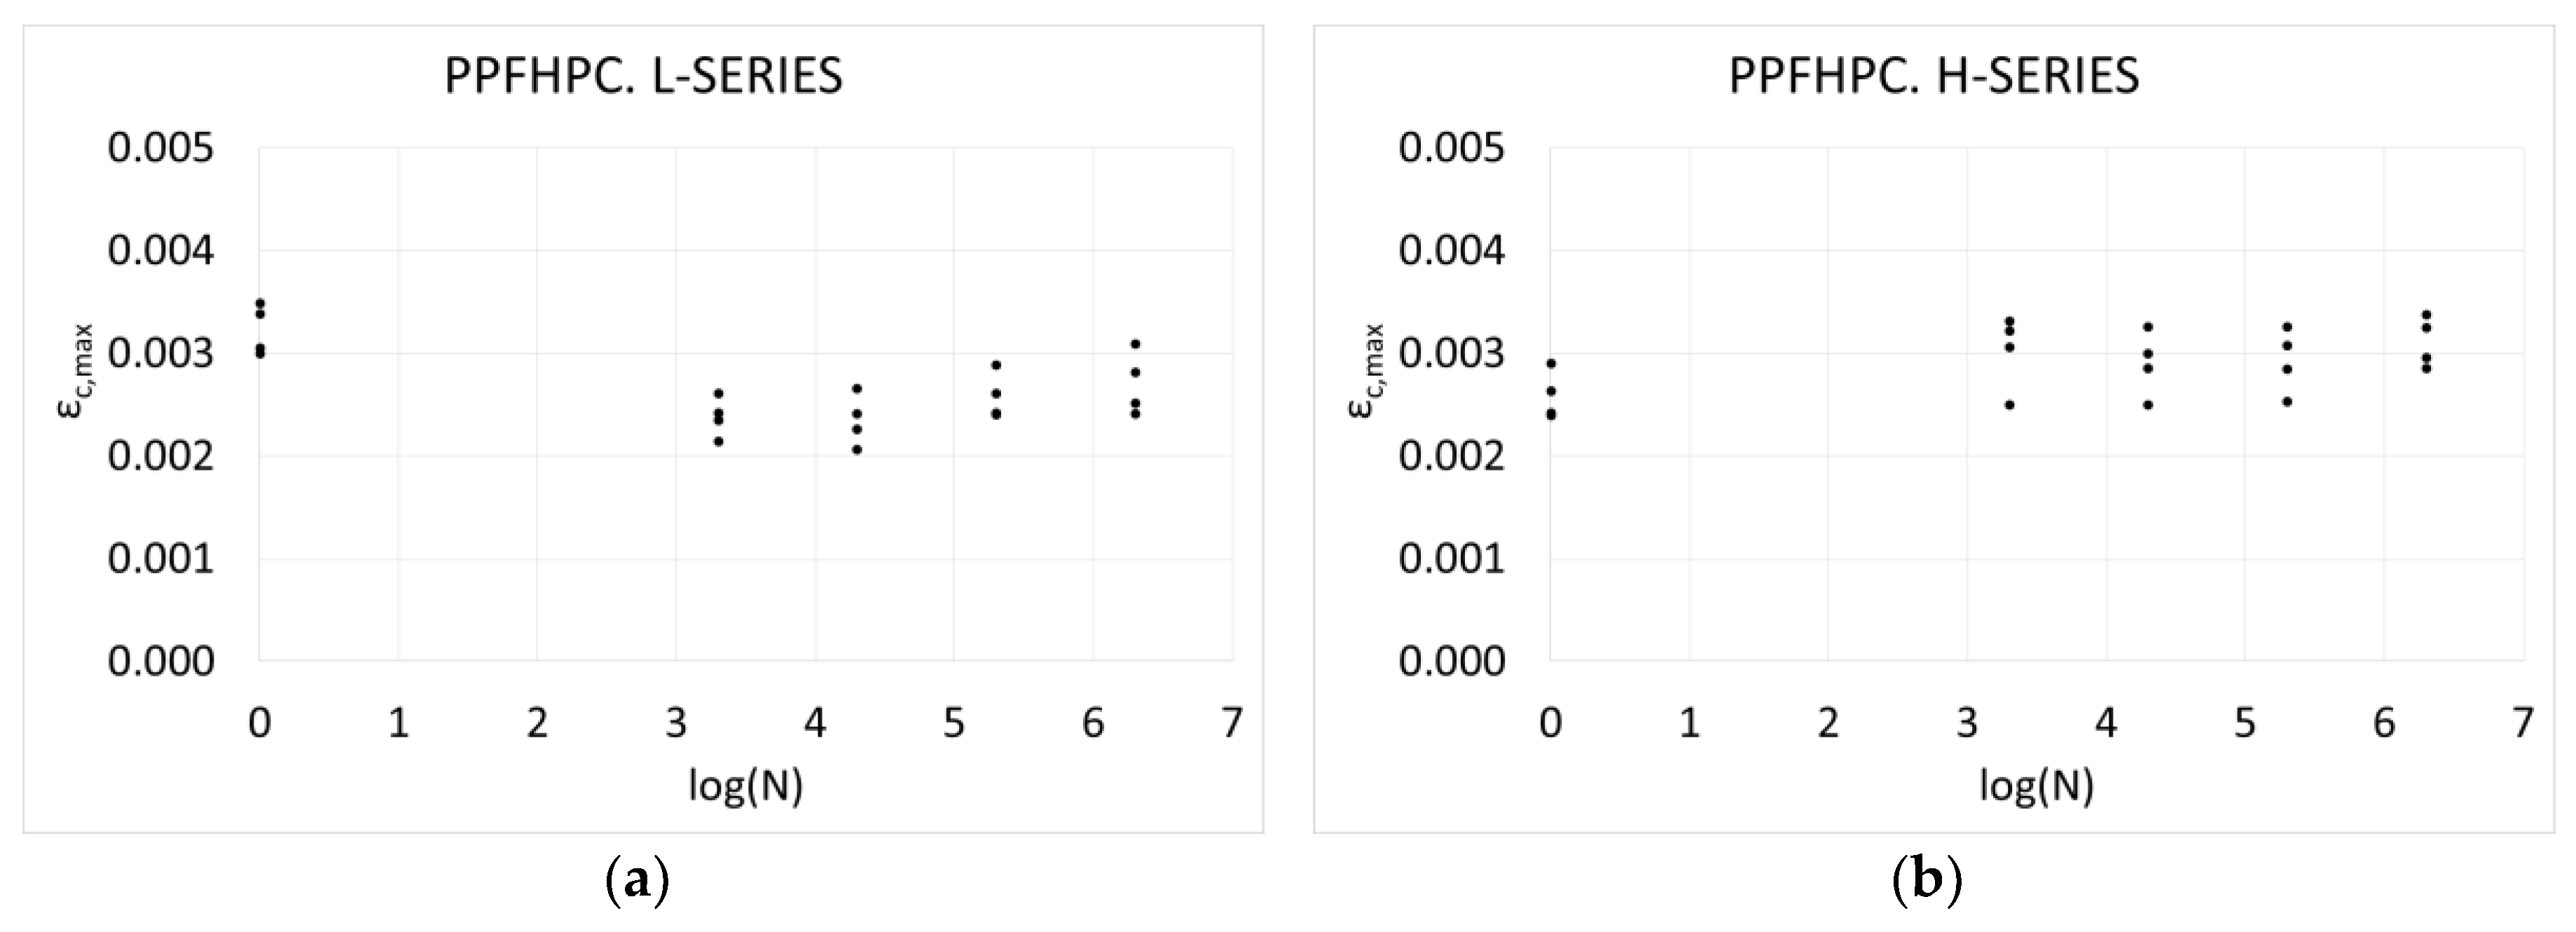
3.3. Maximum Compressive Strain
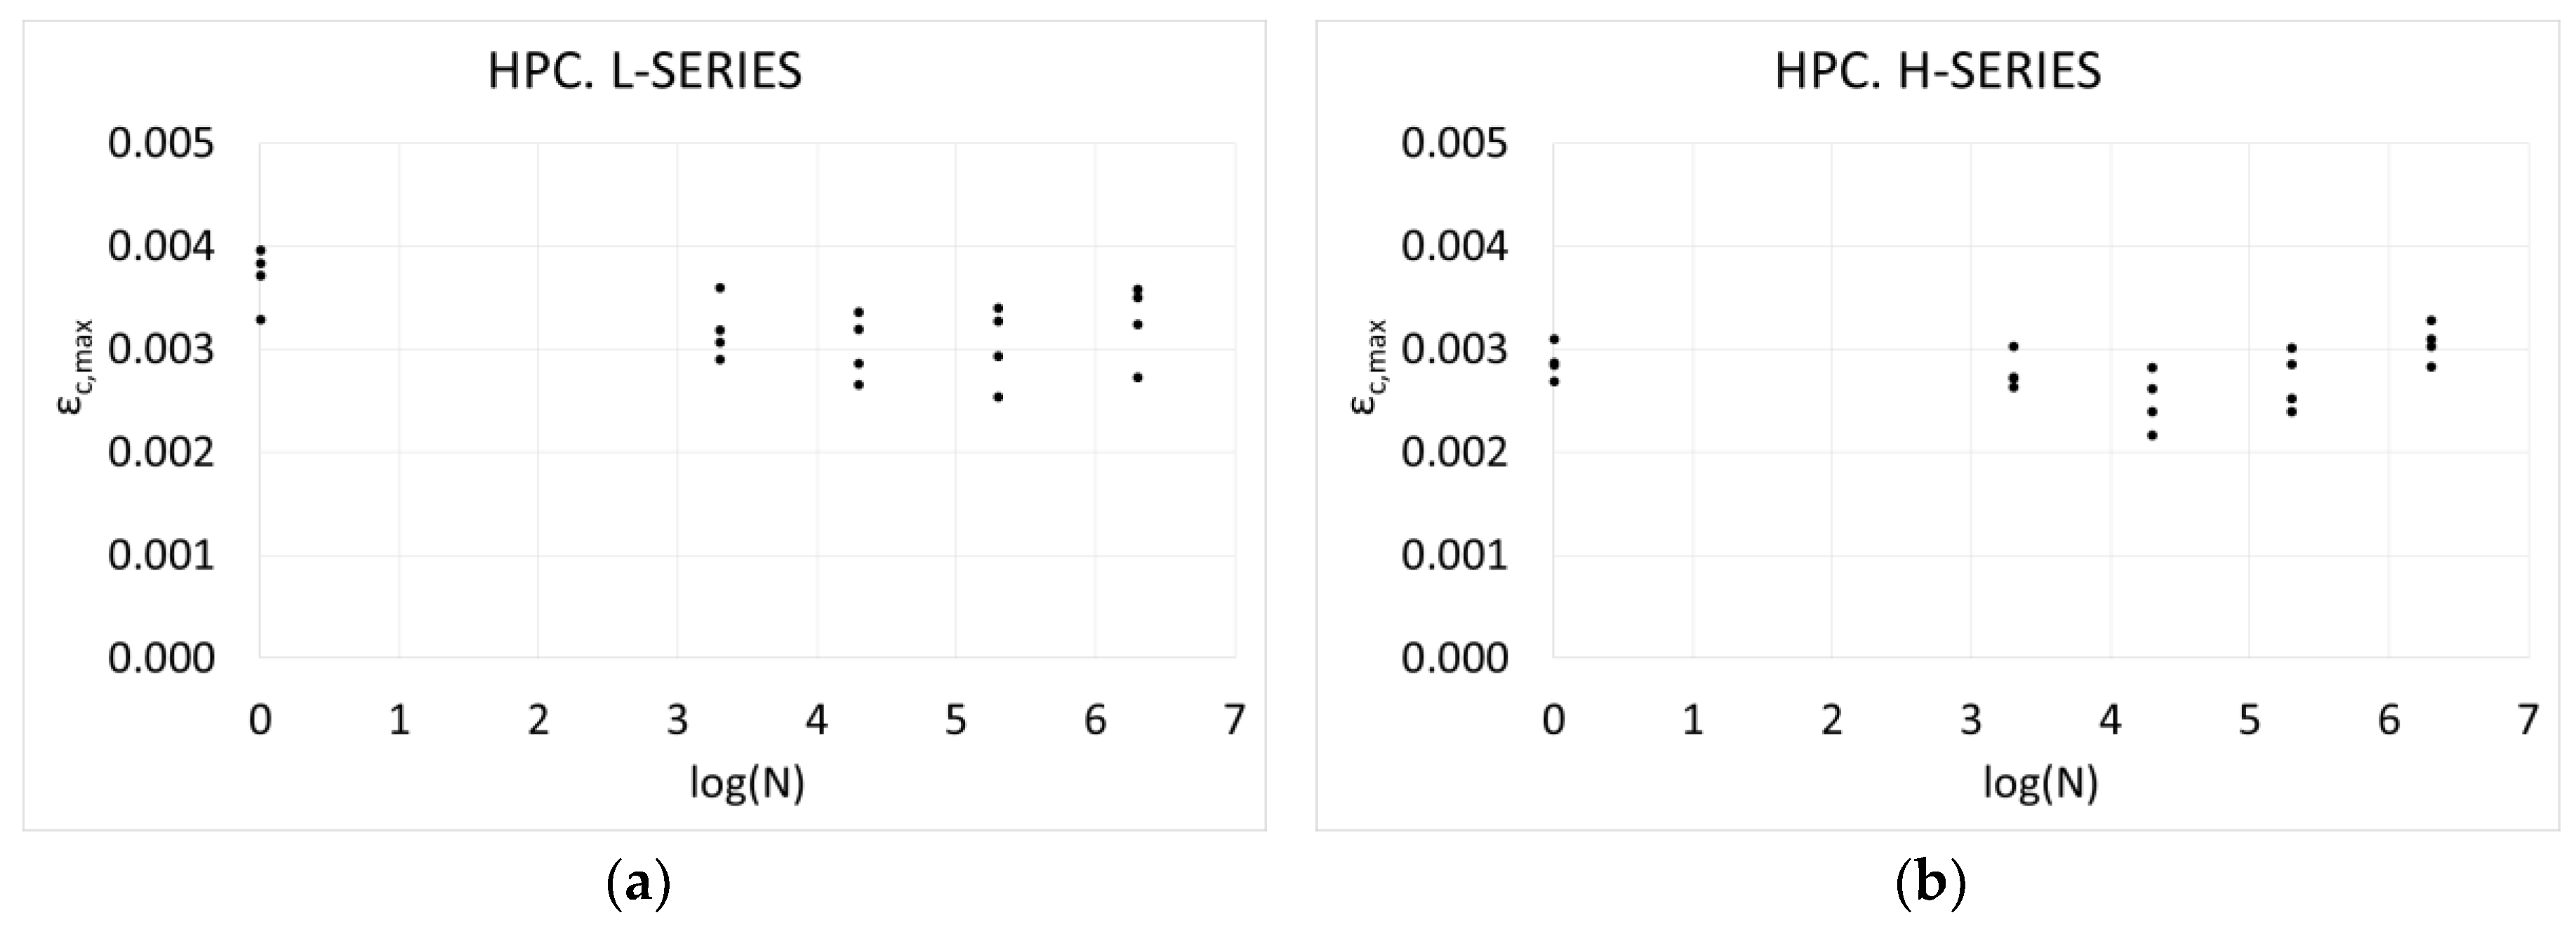
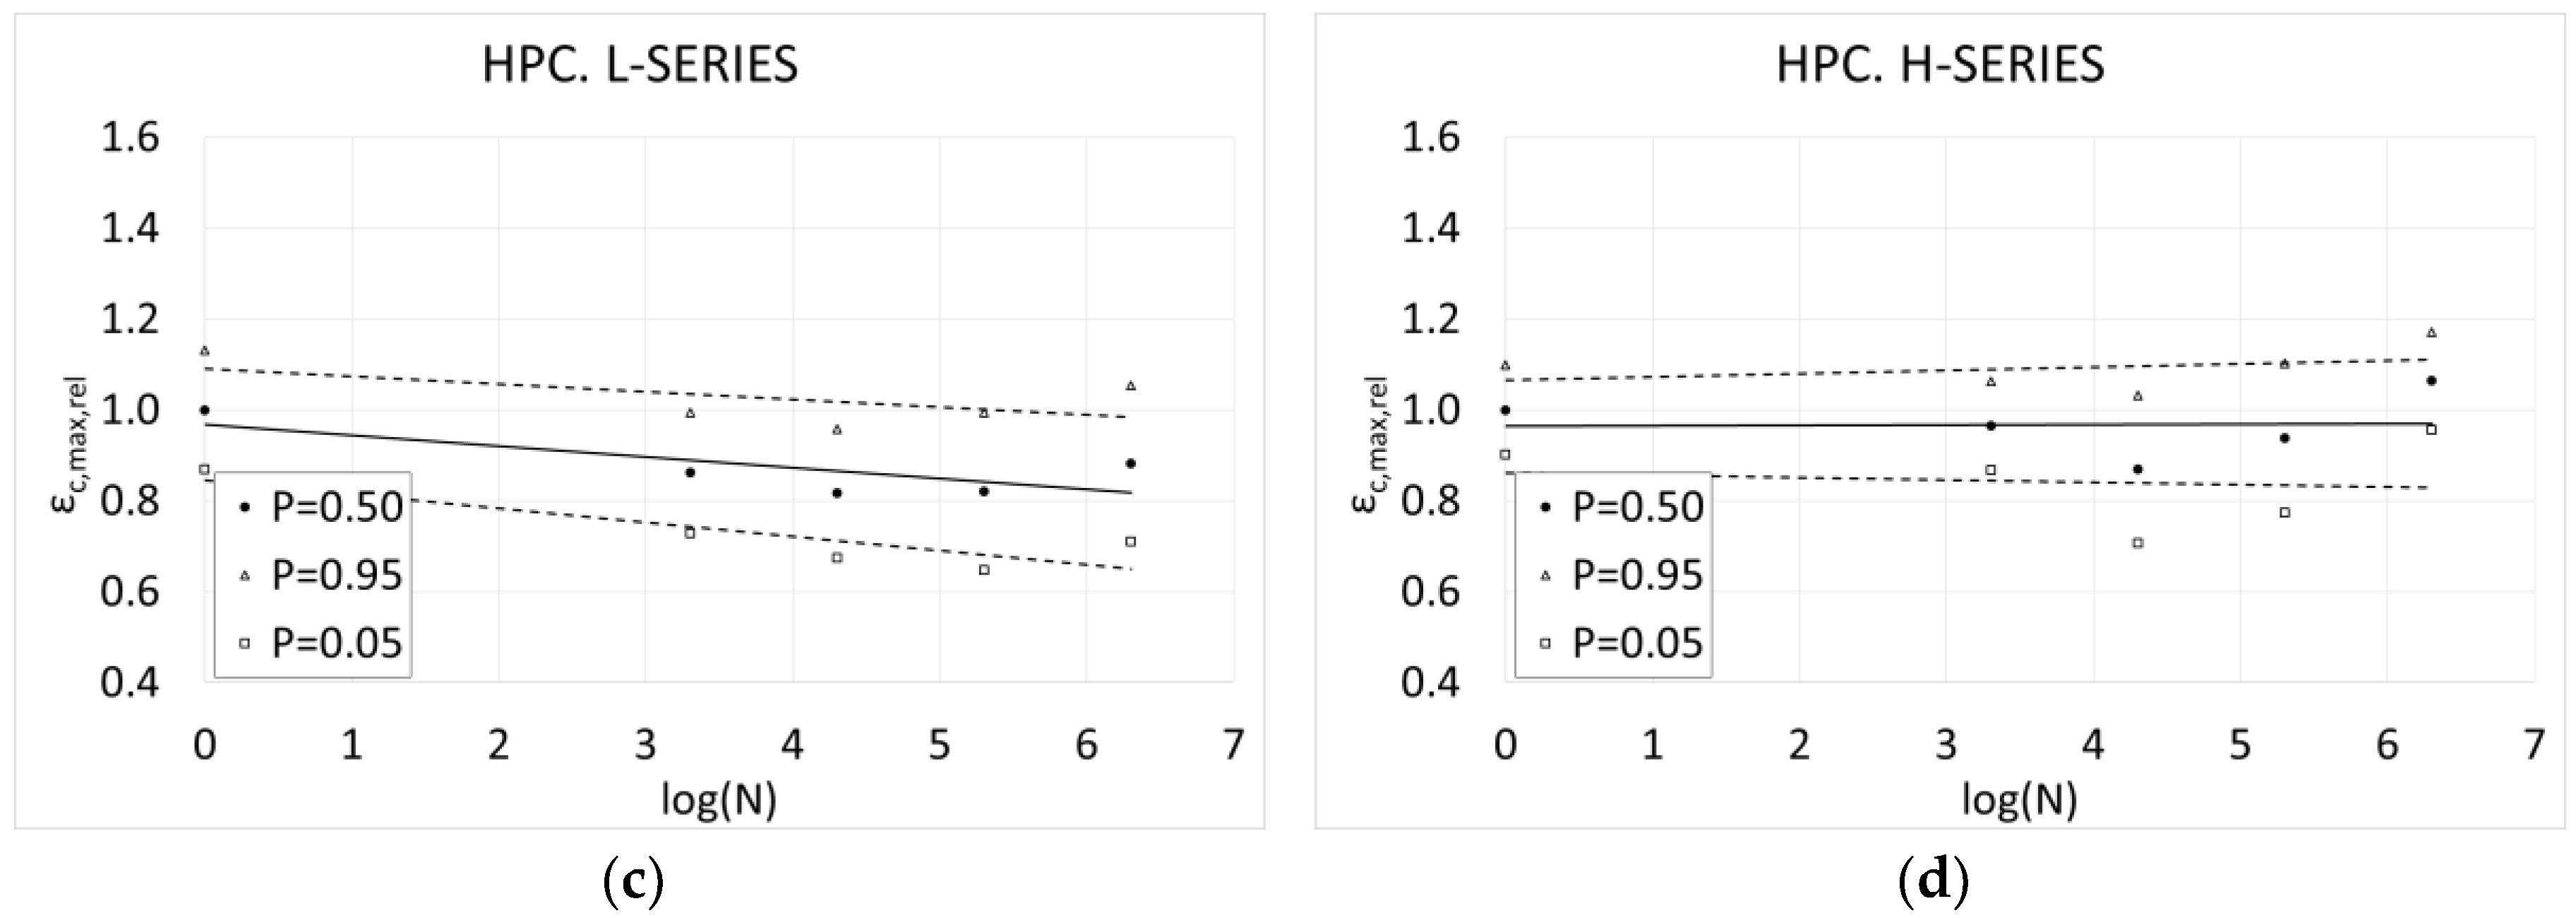
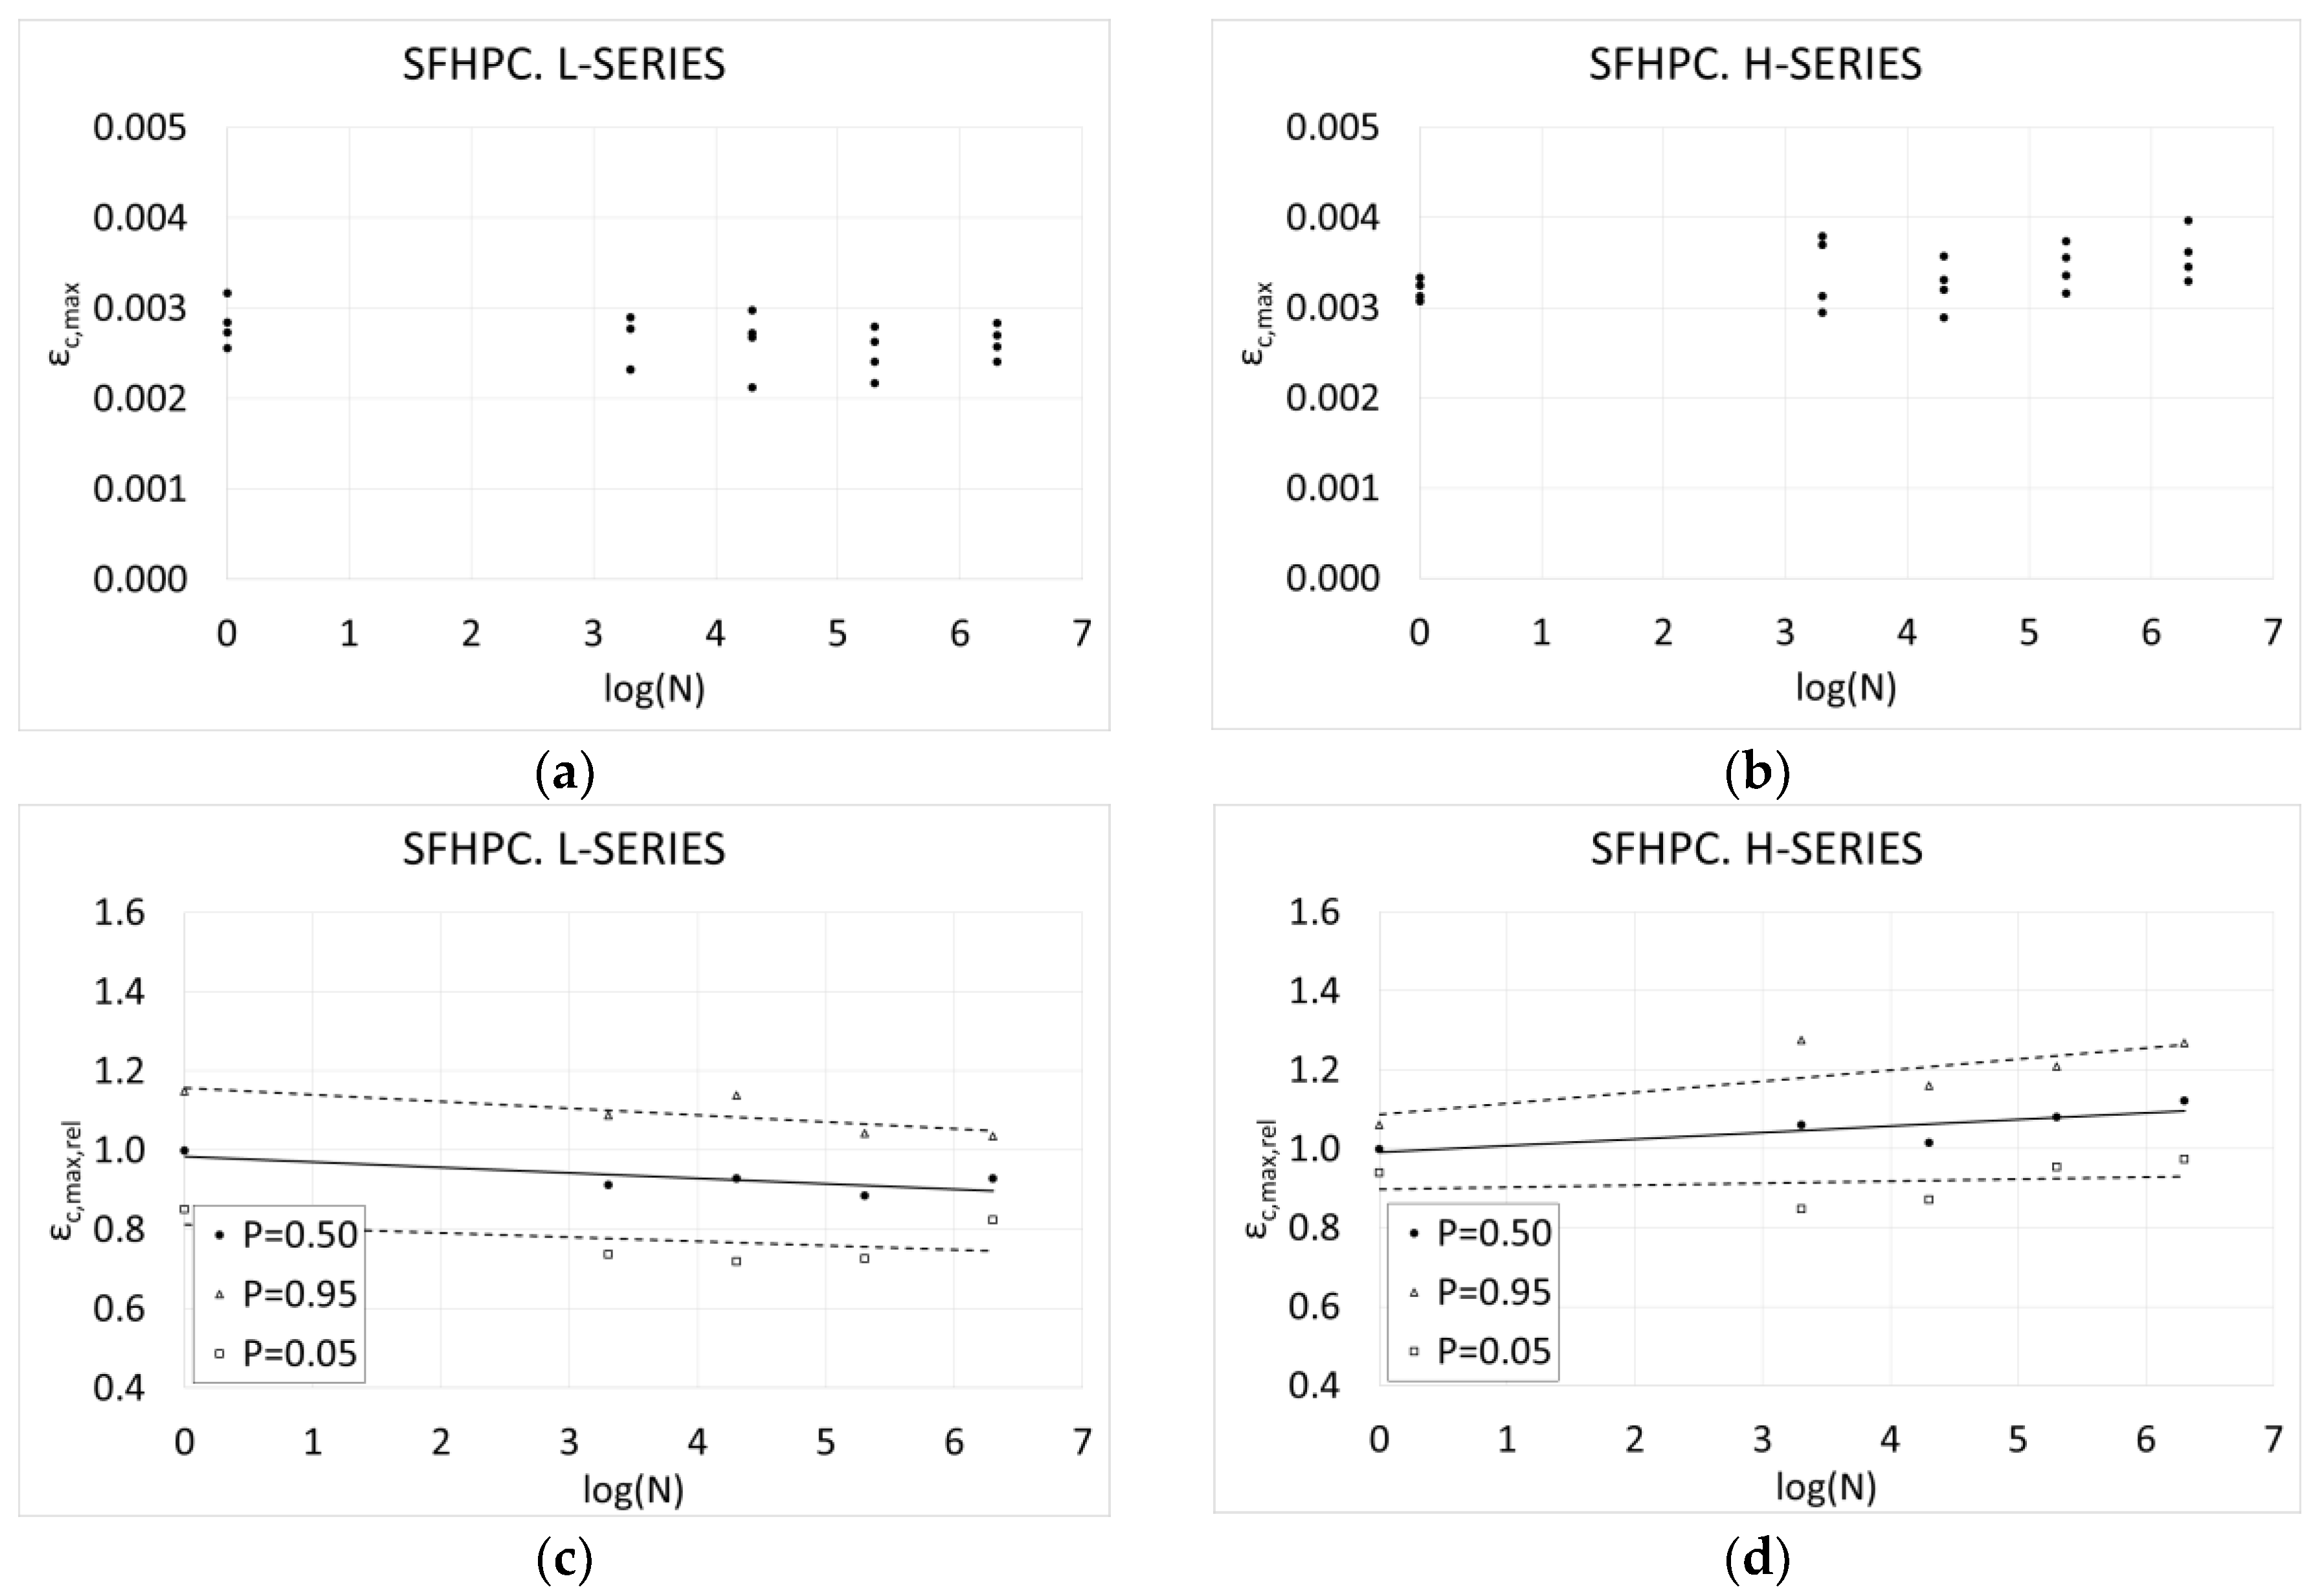
Figure 10,
Figure 11 and
Figure 12 show the results of the variation of the maximum compressive strain with the number of cycles, for the three mixtures and for the two series.
Figure 10,
Figure 11 and
Figure 12 show some interesting results, complementary to those extracted from
Figure 4,
Figure 5,
Figure 6,
Figure 7,
Figure 8 and
Figure 9. First, the results show that, on one side, there was a slight decrease of the average maximum compressive strain of concrete by number of cycles in the case of the L-Series, with a maximum variation of around 18%. On the other side, there was a slight increase of this parameter in the case of the H-Series, with a maximum variation of around 20%. However, this variation was not very relevant. As with compressive strength and the compressive modulus of elasticity, any damage caused by the cyclic loading was very slight, with no observable mechanical distress.
In a deeper analysis, it may be observed that there was an initial slight decrease of the maximum compressive strain up to a minimum value, located between 20,000 and 200,000 cycles depending on the mixture and on the series, after which it started to increase. This expected tendency was quite the opposite to the compressive modulus of elasticity.
The mixtures, in general, showed a very linear behavior up to their compressive strength. After this point, the plain concrete sample shattered and the fiber-reinforced concrete underwent dramatic softening. In this situation, and assuming that the compressive strength remained almost constant, the higher the compressive modulus of elasticity, the weaker the maximum compressive strain (see
Figure 3).
In this case, increased, although not very relevant, scatter was observed.
As occurred with the previous parameters, the relaxation of the internal stress was caused by microcracking due to the cyclic loading. In this case, this stress relaxation resulted in a decrease of the maximum compressive strain.
The scatter was similar in all mixtures, meaning that the fibers had no relevant influence on the maximum compressive strain values. On the contrary, a few added differences between the maximum compressive strains were observed; the average values of that parameter varied between 0.0025 and 0.0035, showing no clear observable tendency.
4. Resistance Mechanisms
The results described above revealed that the fibers had an influence on the fatigue behavior of the specimens, which seemed to be related to the microstructure of the mixture. In this section, the resistance mechanisms of the specimens, i.e., the mechanisms used by the specimen to withstand the compressive load, were studied.
Using CT scan technology, it was possible to observe the microstructure and the failure mechanisms within the concrete, in order to extract relevant information for a better understanding of the macroscopic response of the specimens. As explained before, the grey scale of the slides obtained through the scanning process ranged from 0 (which belongs to the least dense voxel, i.e., voids and cracks) to 255 (which belongs to the densest voxel, i.e., steel).
The static test was carried out under displacement control. During testing, the failure criterion was fixed at a 5% reduction of the load, in order to prevent shattering of the cylinders. In addition, the specimens were wrapped in plastic film, to prevent defragmentation. Consequently, only small cracks were observed in the broken cylinders.
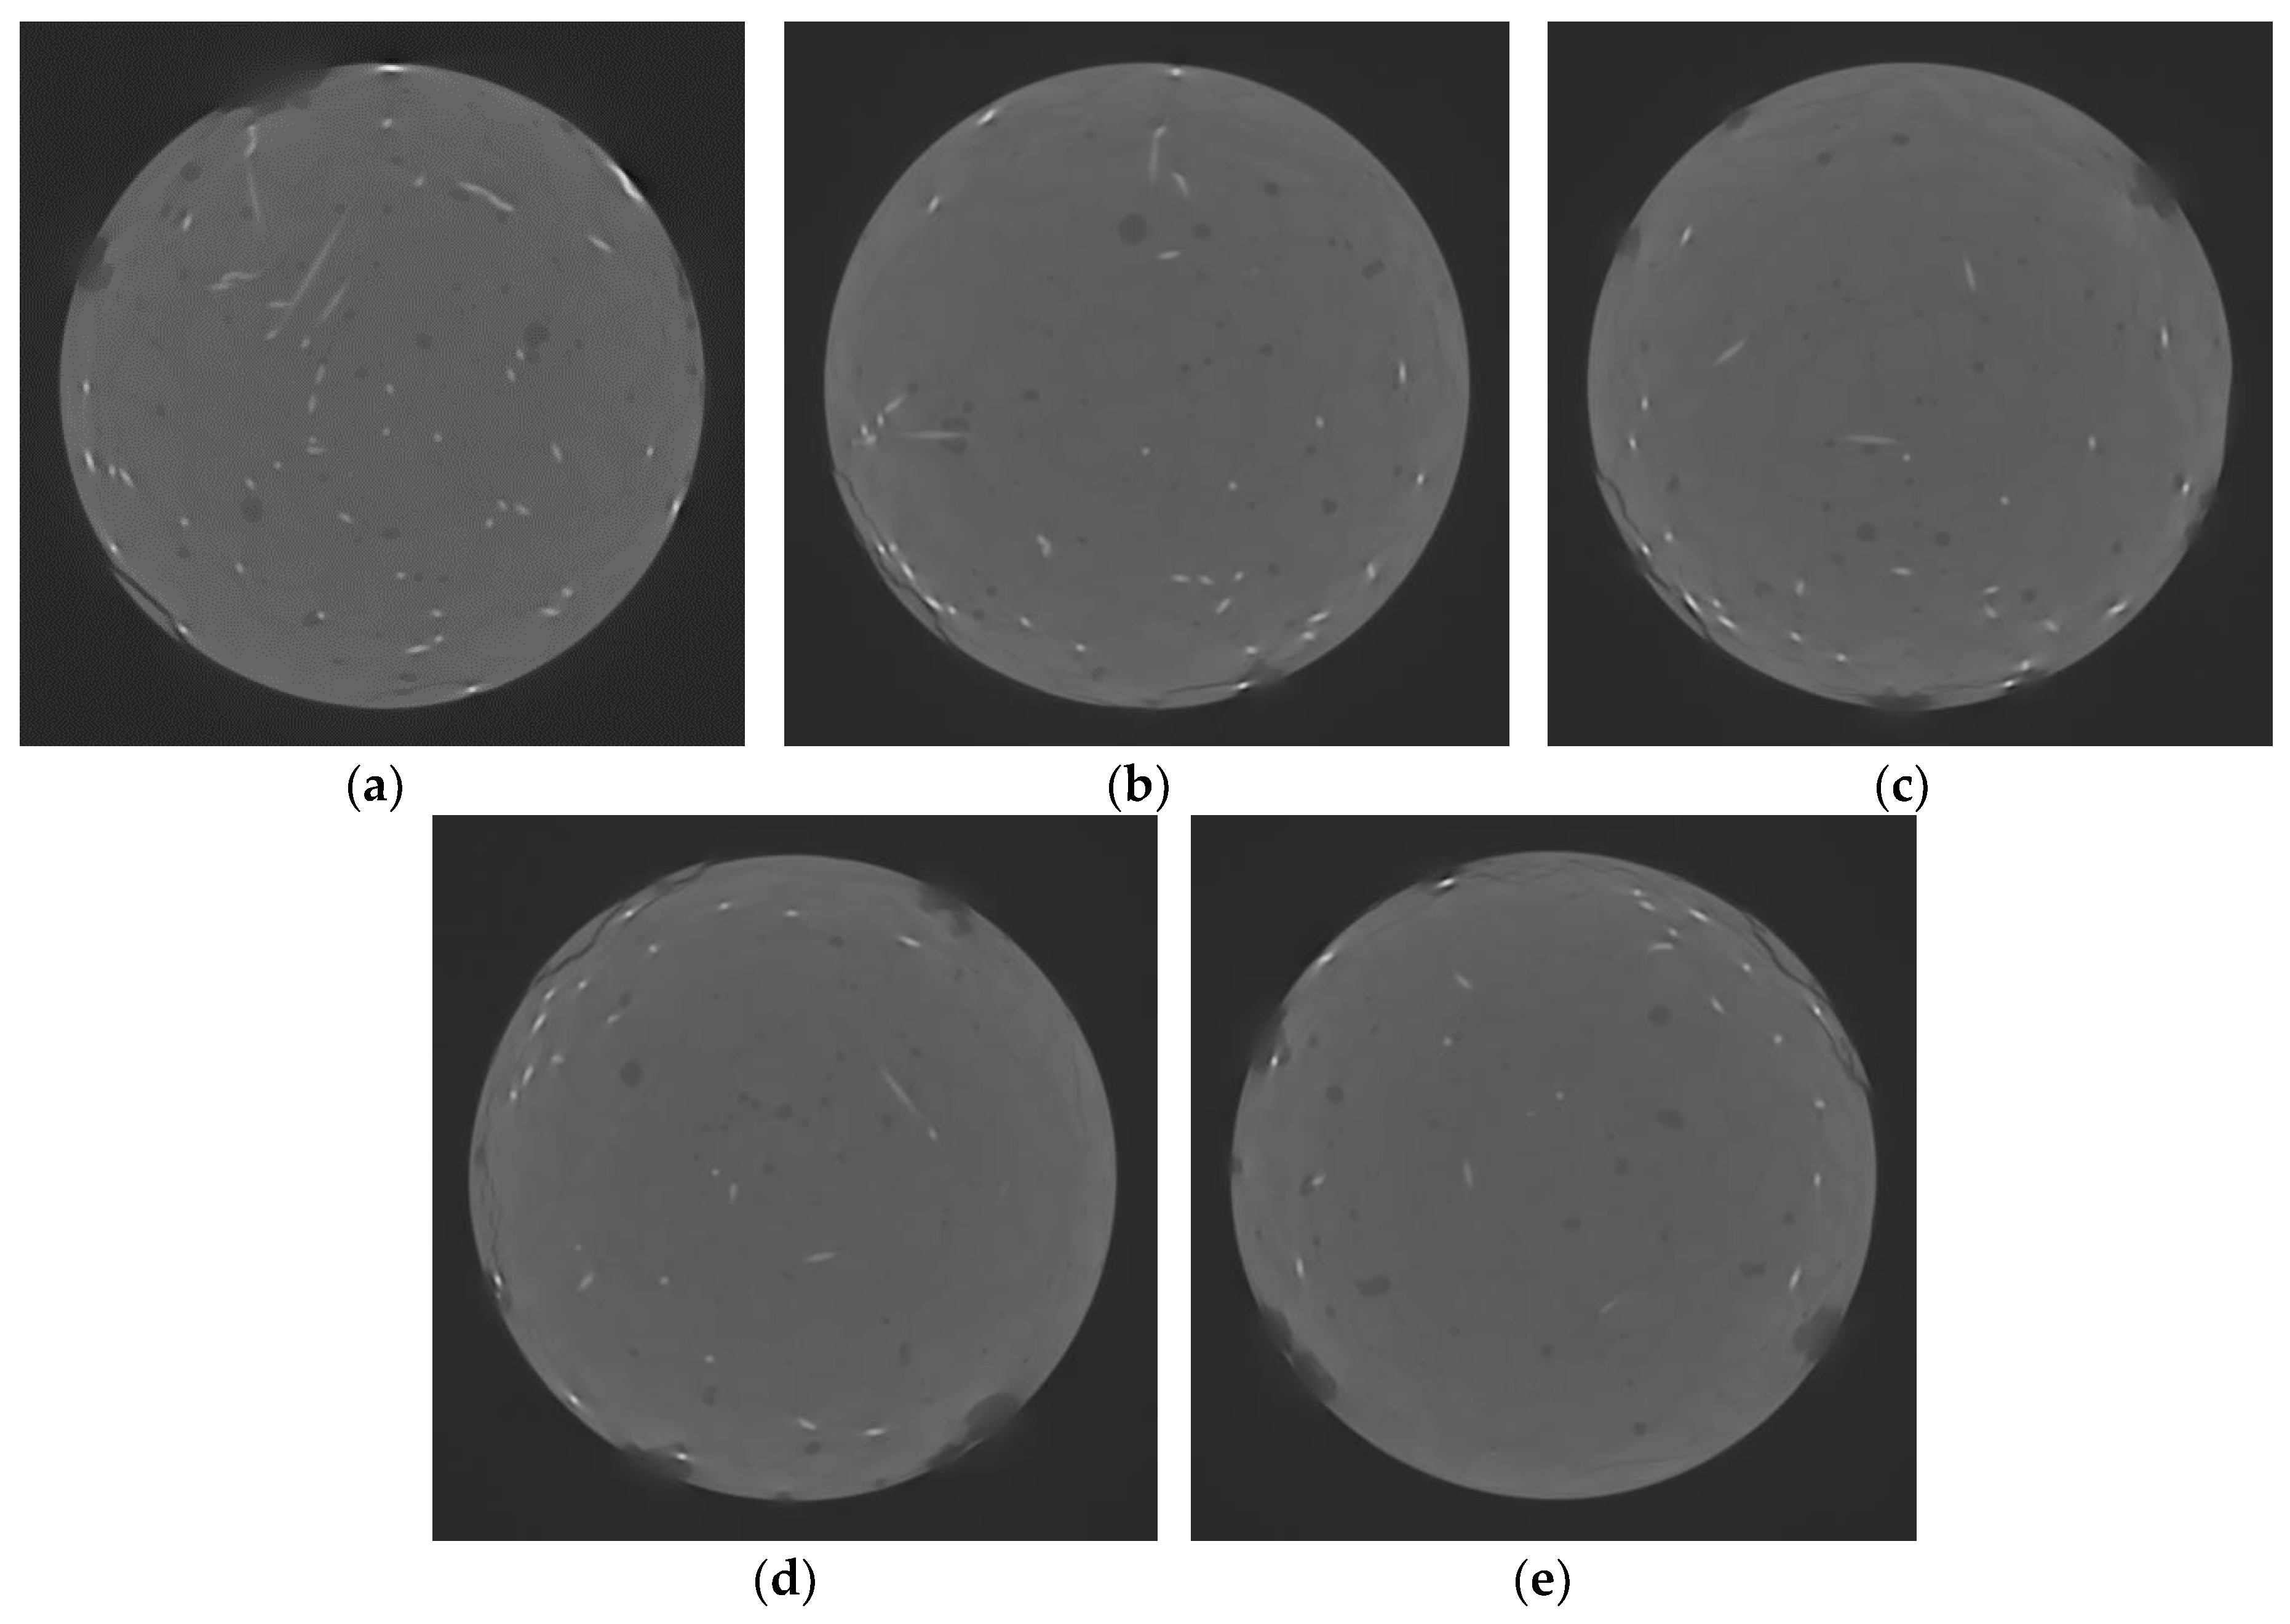
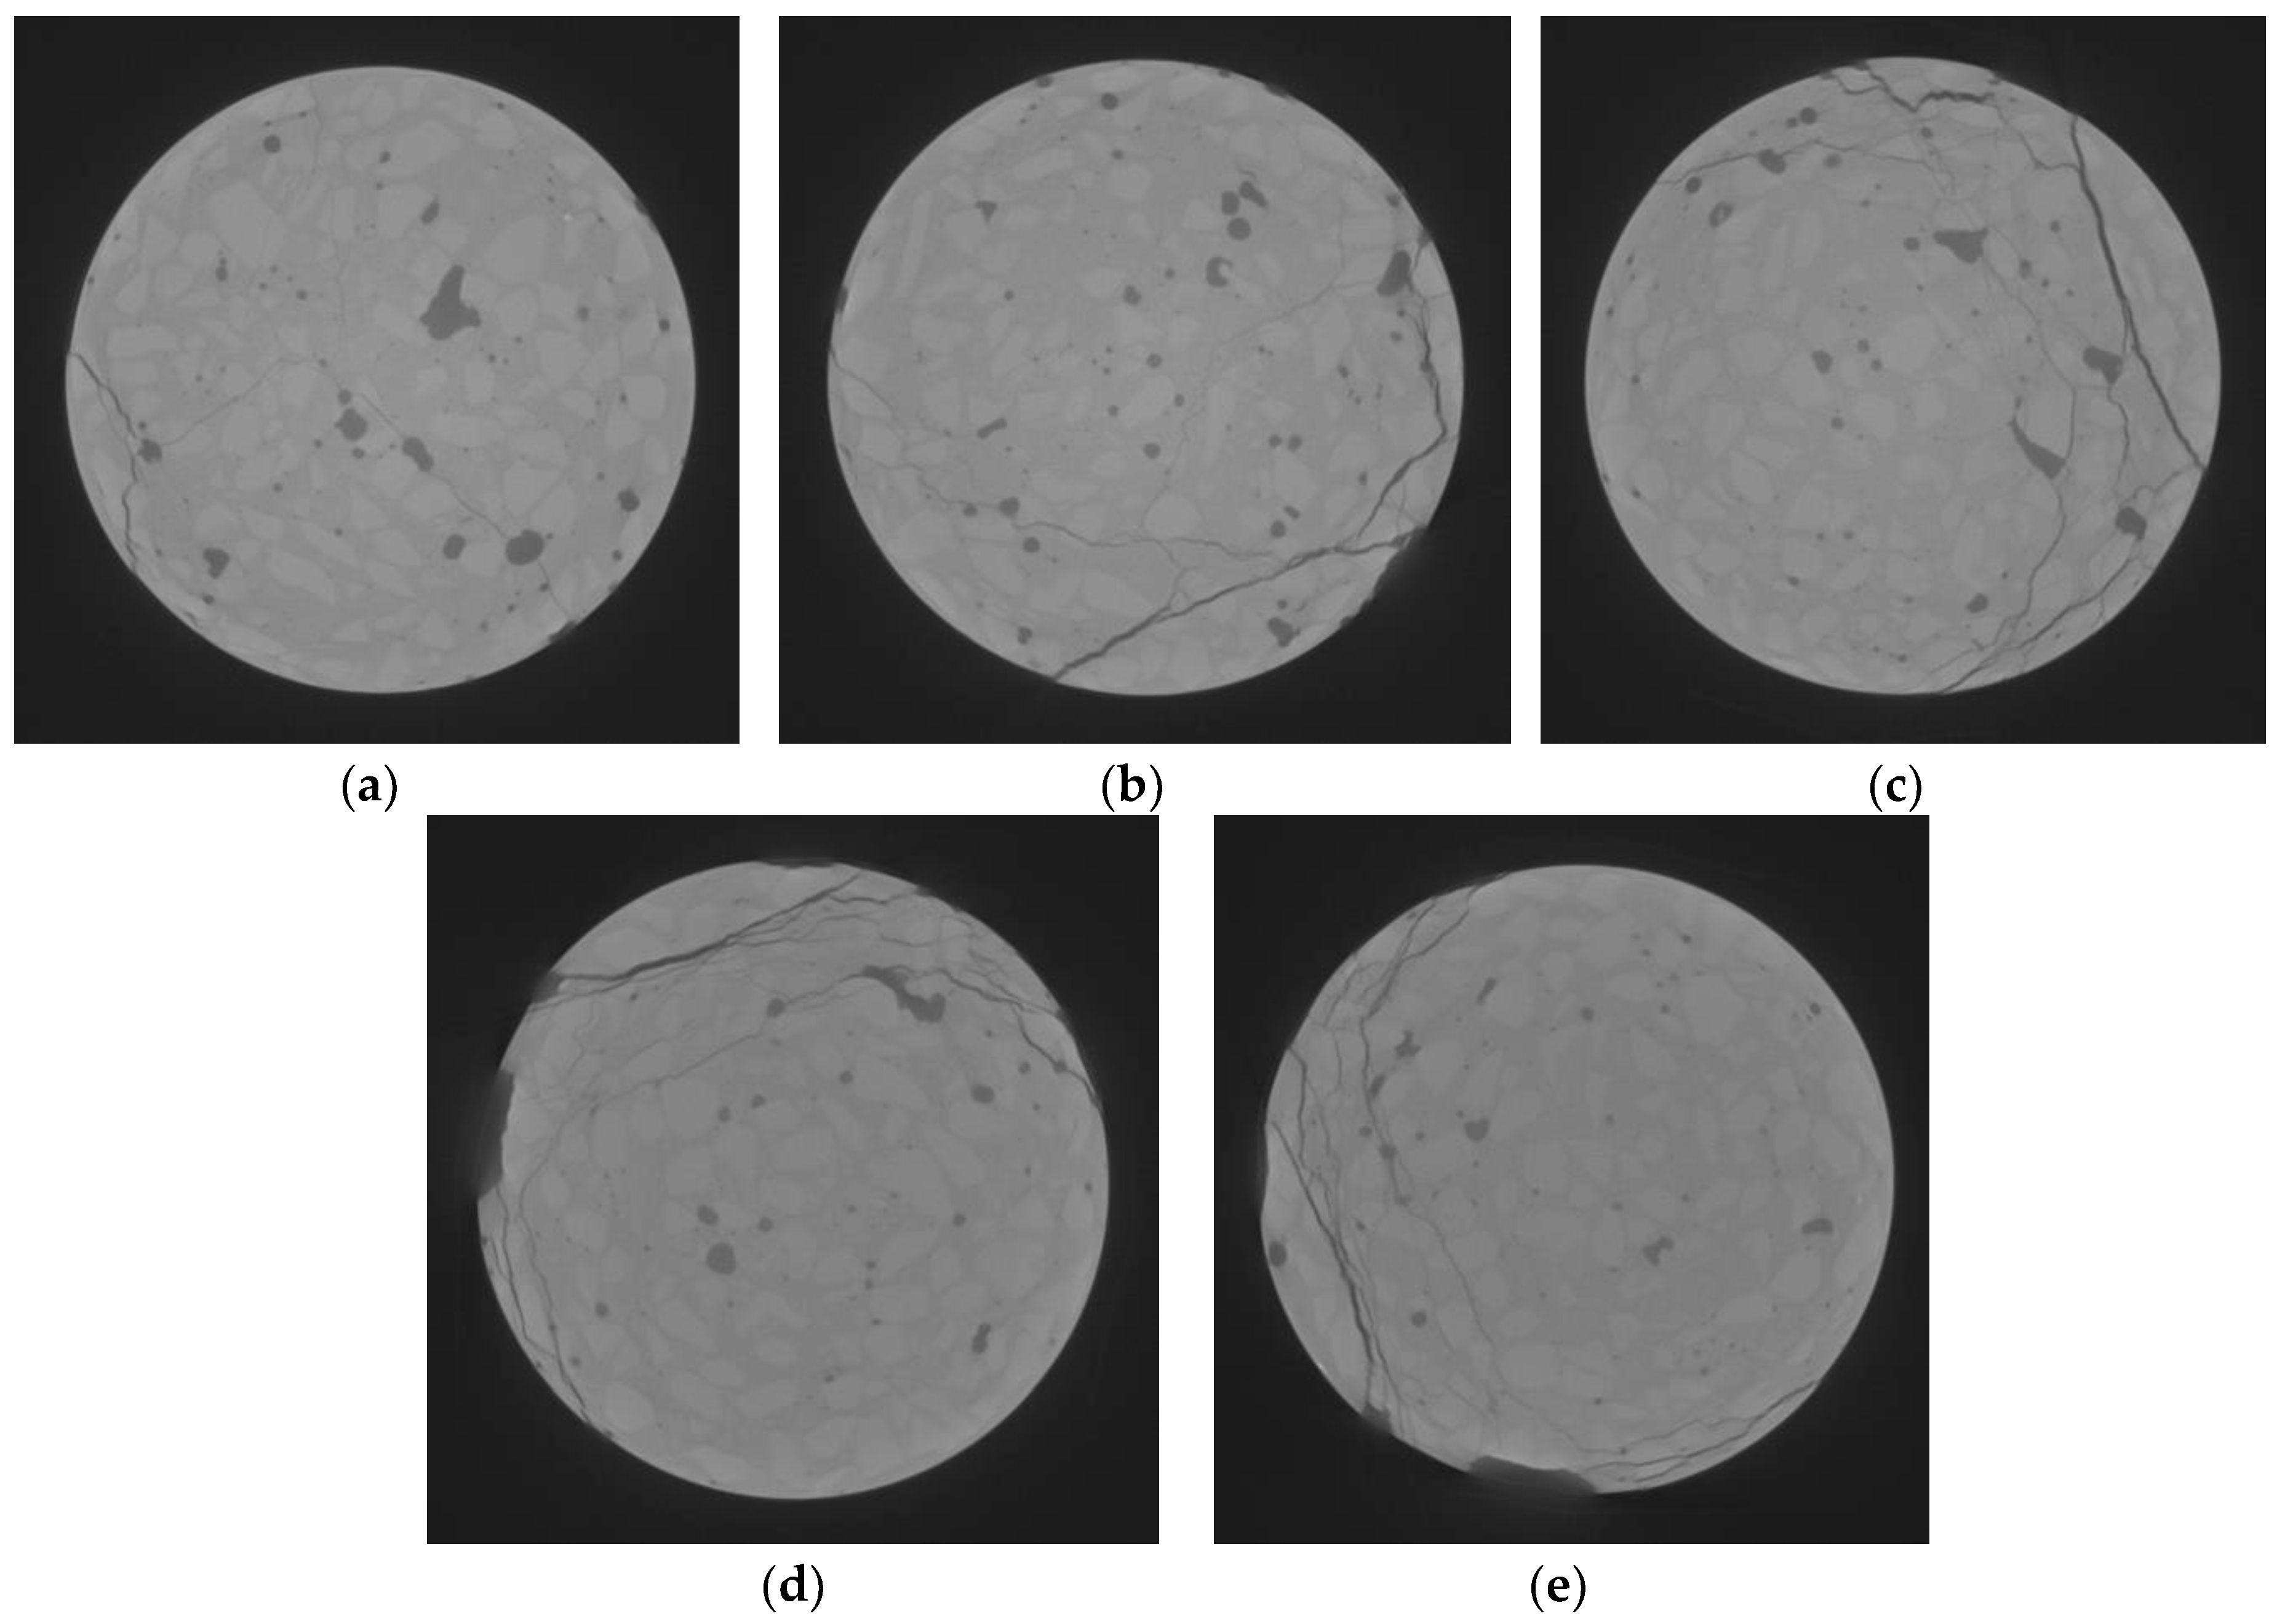
The cracks in the HPF were mainly close to the lateral border of the cylinder. They tended to be long but few in number, and they passed through the aggregates. Only a few cracks were found in the internal cores of the specimen. This phenomenon was observed in all the specimens, regardless of the number of cycles previously applied (i.e., the damage level) and the stress level during the cyclic tests (
Figure 13 and
Figure 14).
Figure 13 and
Figure 14 reveal that, in general, the cyclic tests resulted in low damage levels. The crack surfaces tended to be parallel to the compressive load, showing no significant influence on the behavior of the concrete under static loads.
This finding agrees with the macroscopic behavior of the specimens. The three main mechanical parameters analyzed in this paper showed a slight or null variation with the number of cycles, and no relevant internal damage was observed in the specimens.
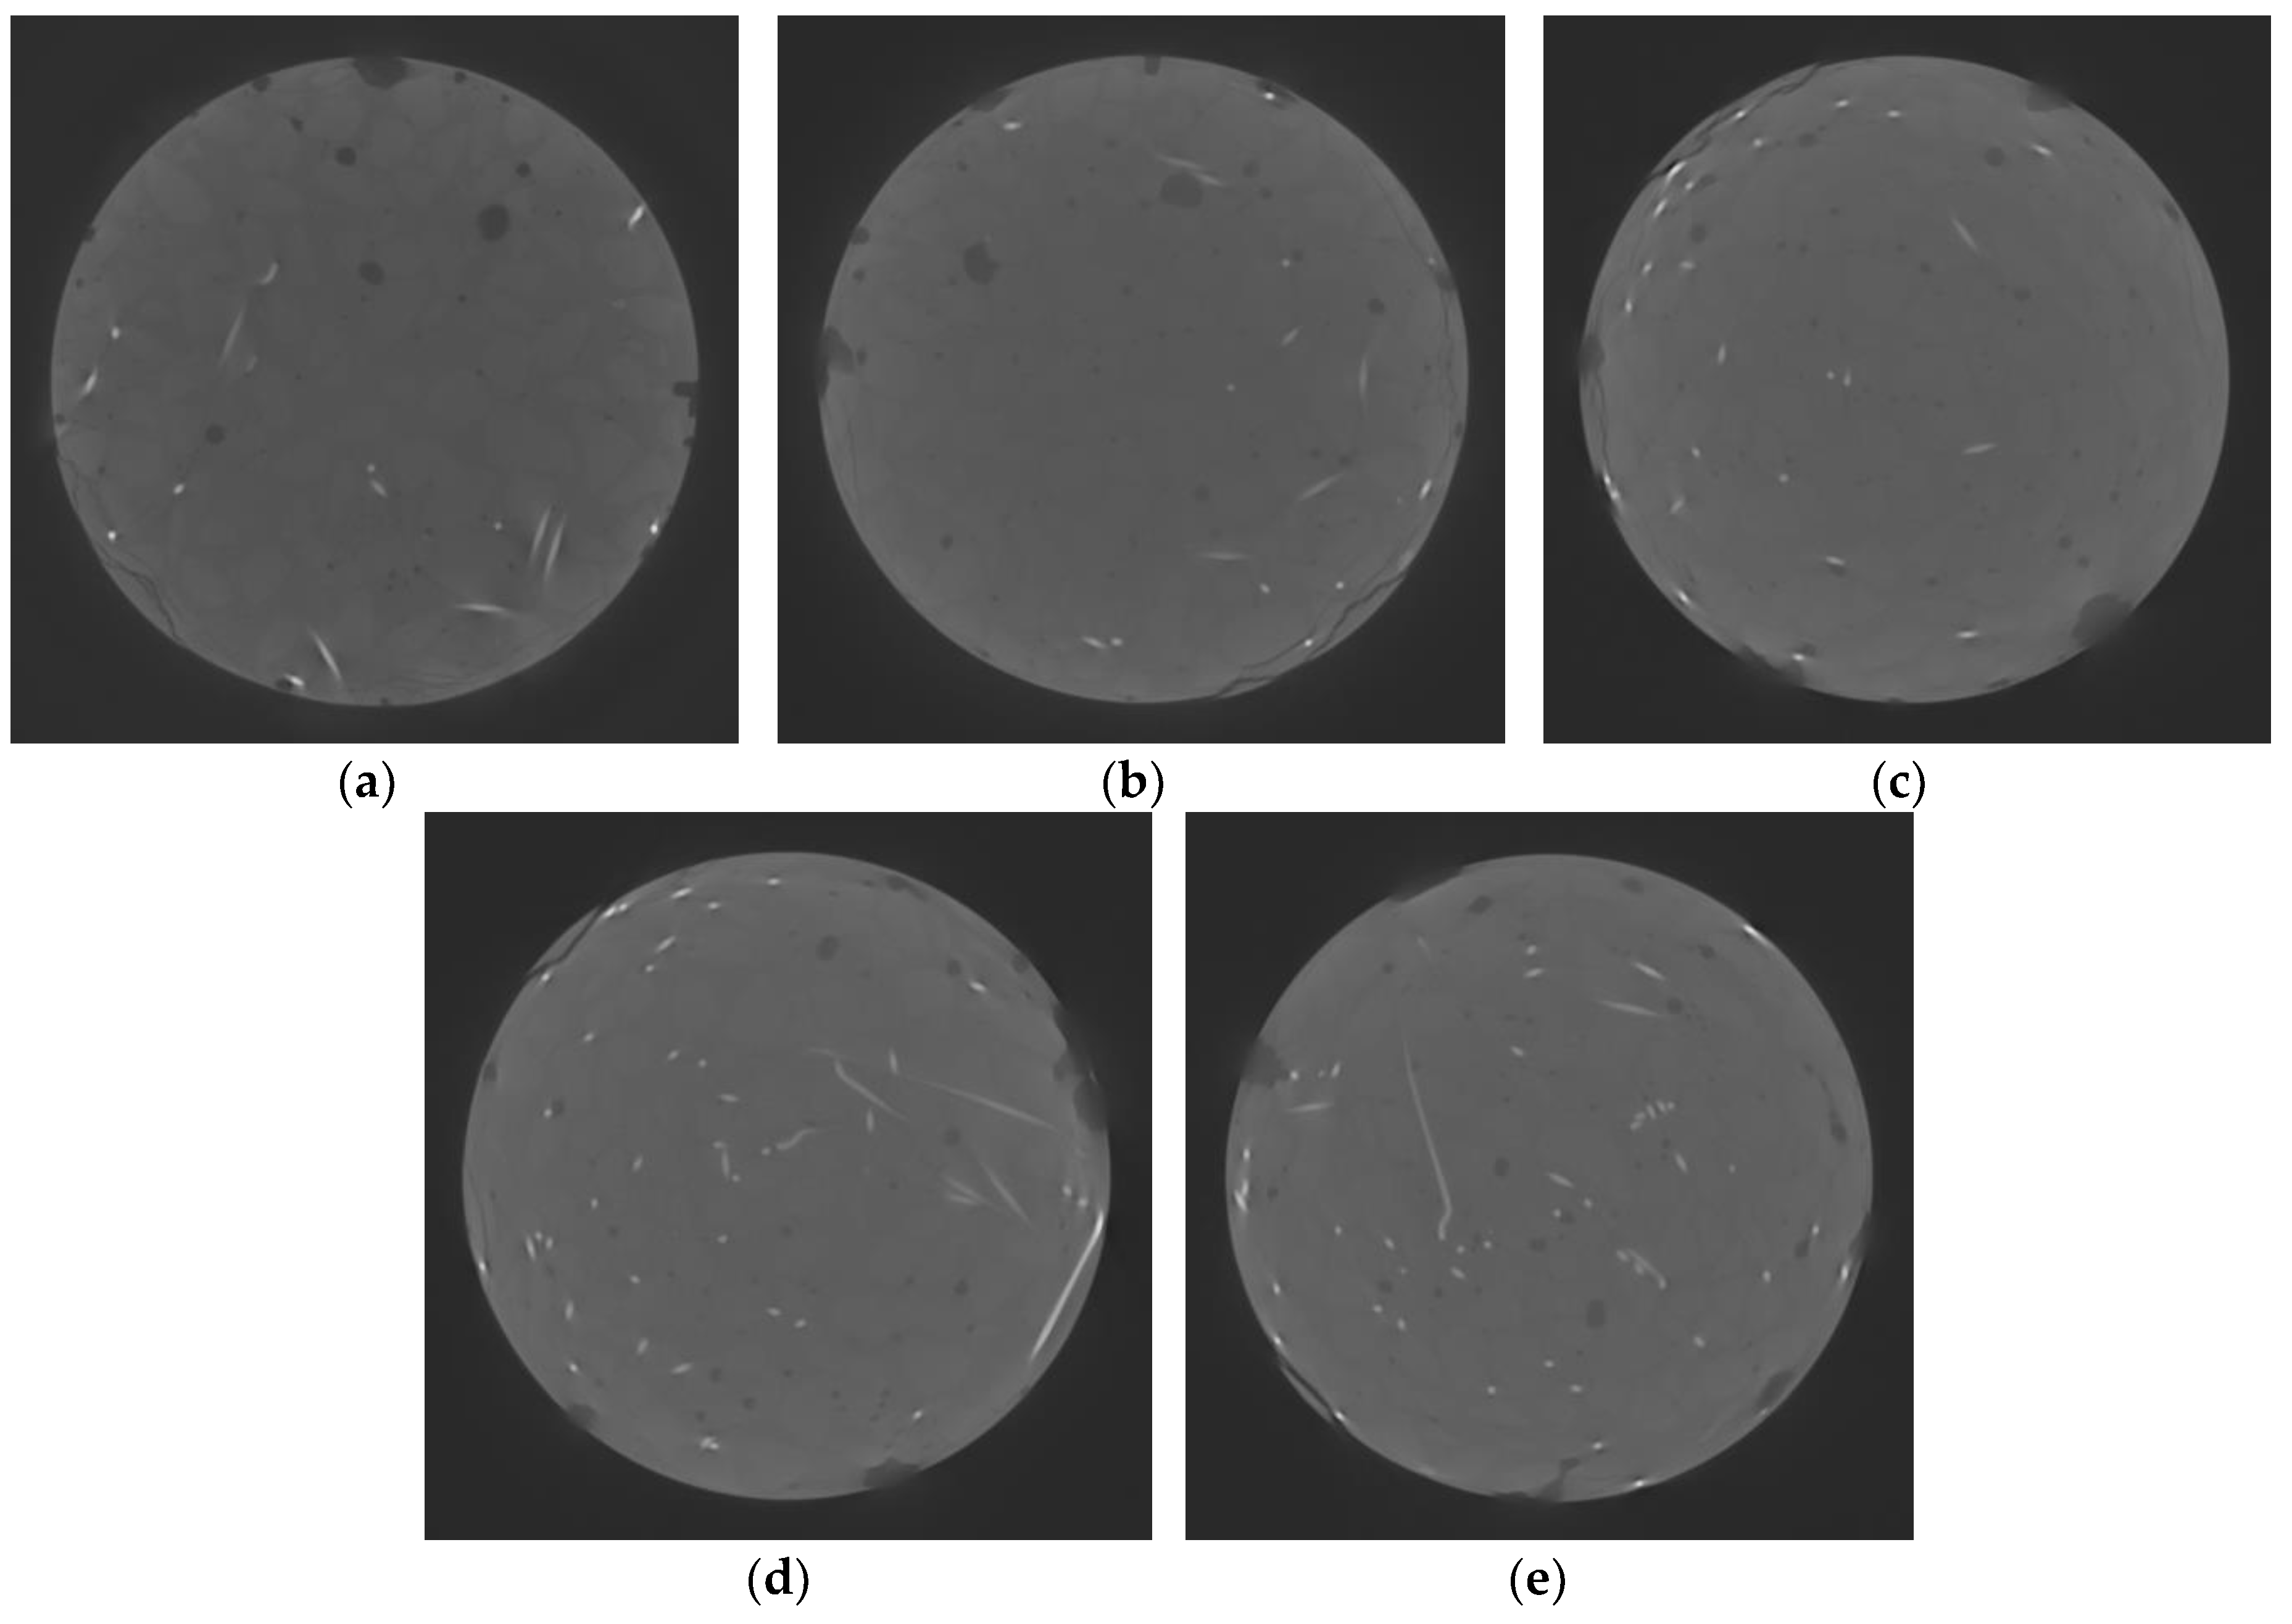
In the case of the SFHPF, the cracks showed the same pattern as in the previous case. Similarly to the previous cases, the cracks, which tended to be long but few, were mainly close to the lateral borders of the cylinder. In this case, no fibers were detected in the internal core of the specimen. Again, no differences in the crack patterns of the specimens related to the number of cycles or the stress level during the cyclic tests were observed (
Figure 15 and
Figure 16).
In this case, as steel fibers are very stiff, the damage due to cyclic loading was mainly concentrated in the lateral border region, where the fibers could not bridge the cracks, rather than within the interior. Again, the crack surfaces tended to be parallel to the compressive load and had no influence on the behavior of the concrete under static loads.
Again, an agreement between the analysis of the CT scan images and the macroscopic behavior of the specimens can be observed. On one hand, the three main mechanical parameters analyzed showed a slight or null variation with the number of cycles, and, on the other hand, no relevant internal damage was observed in the specimens.
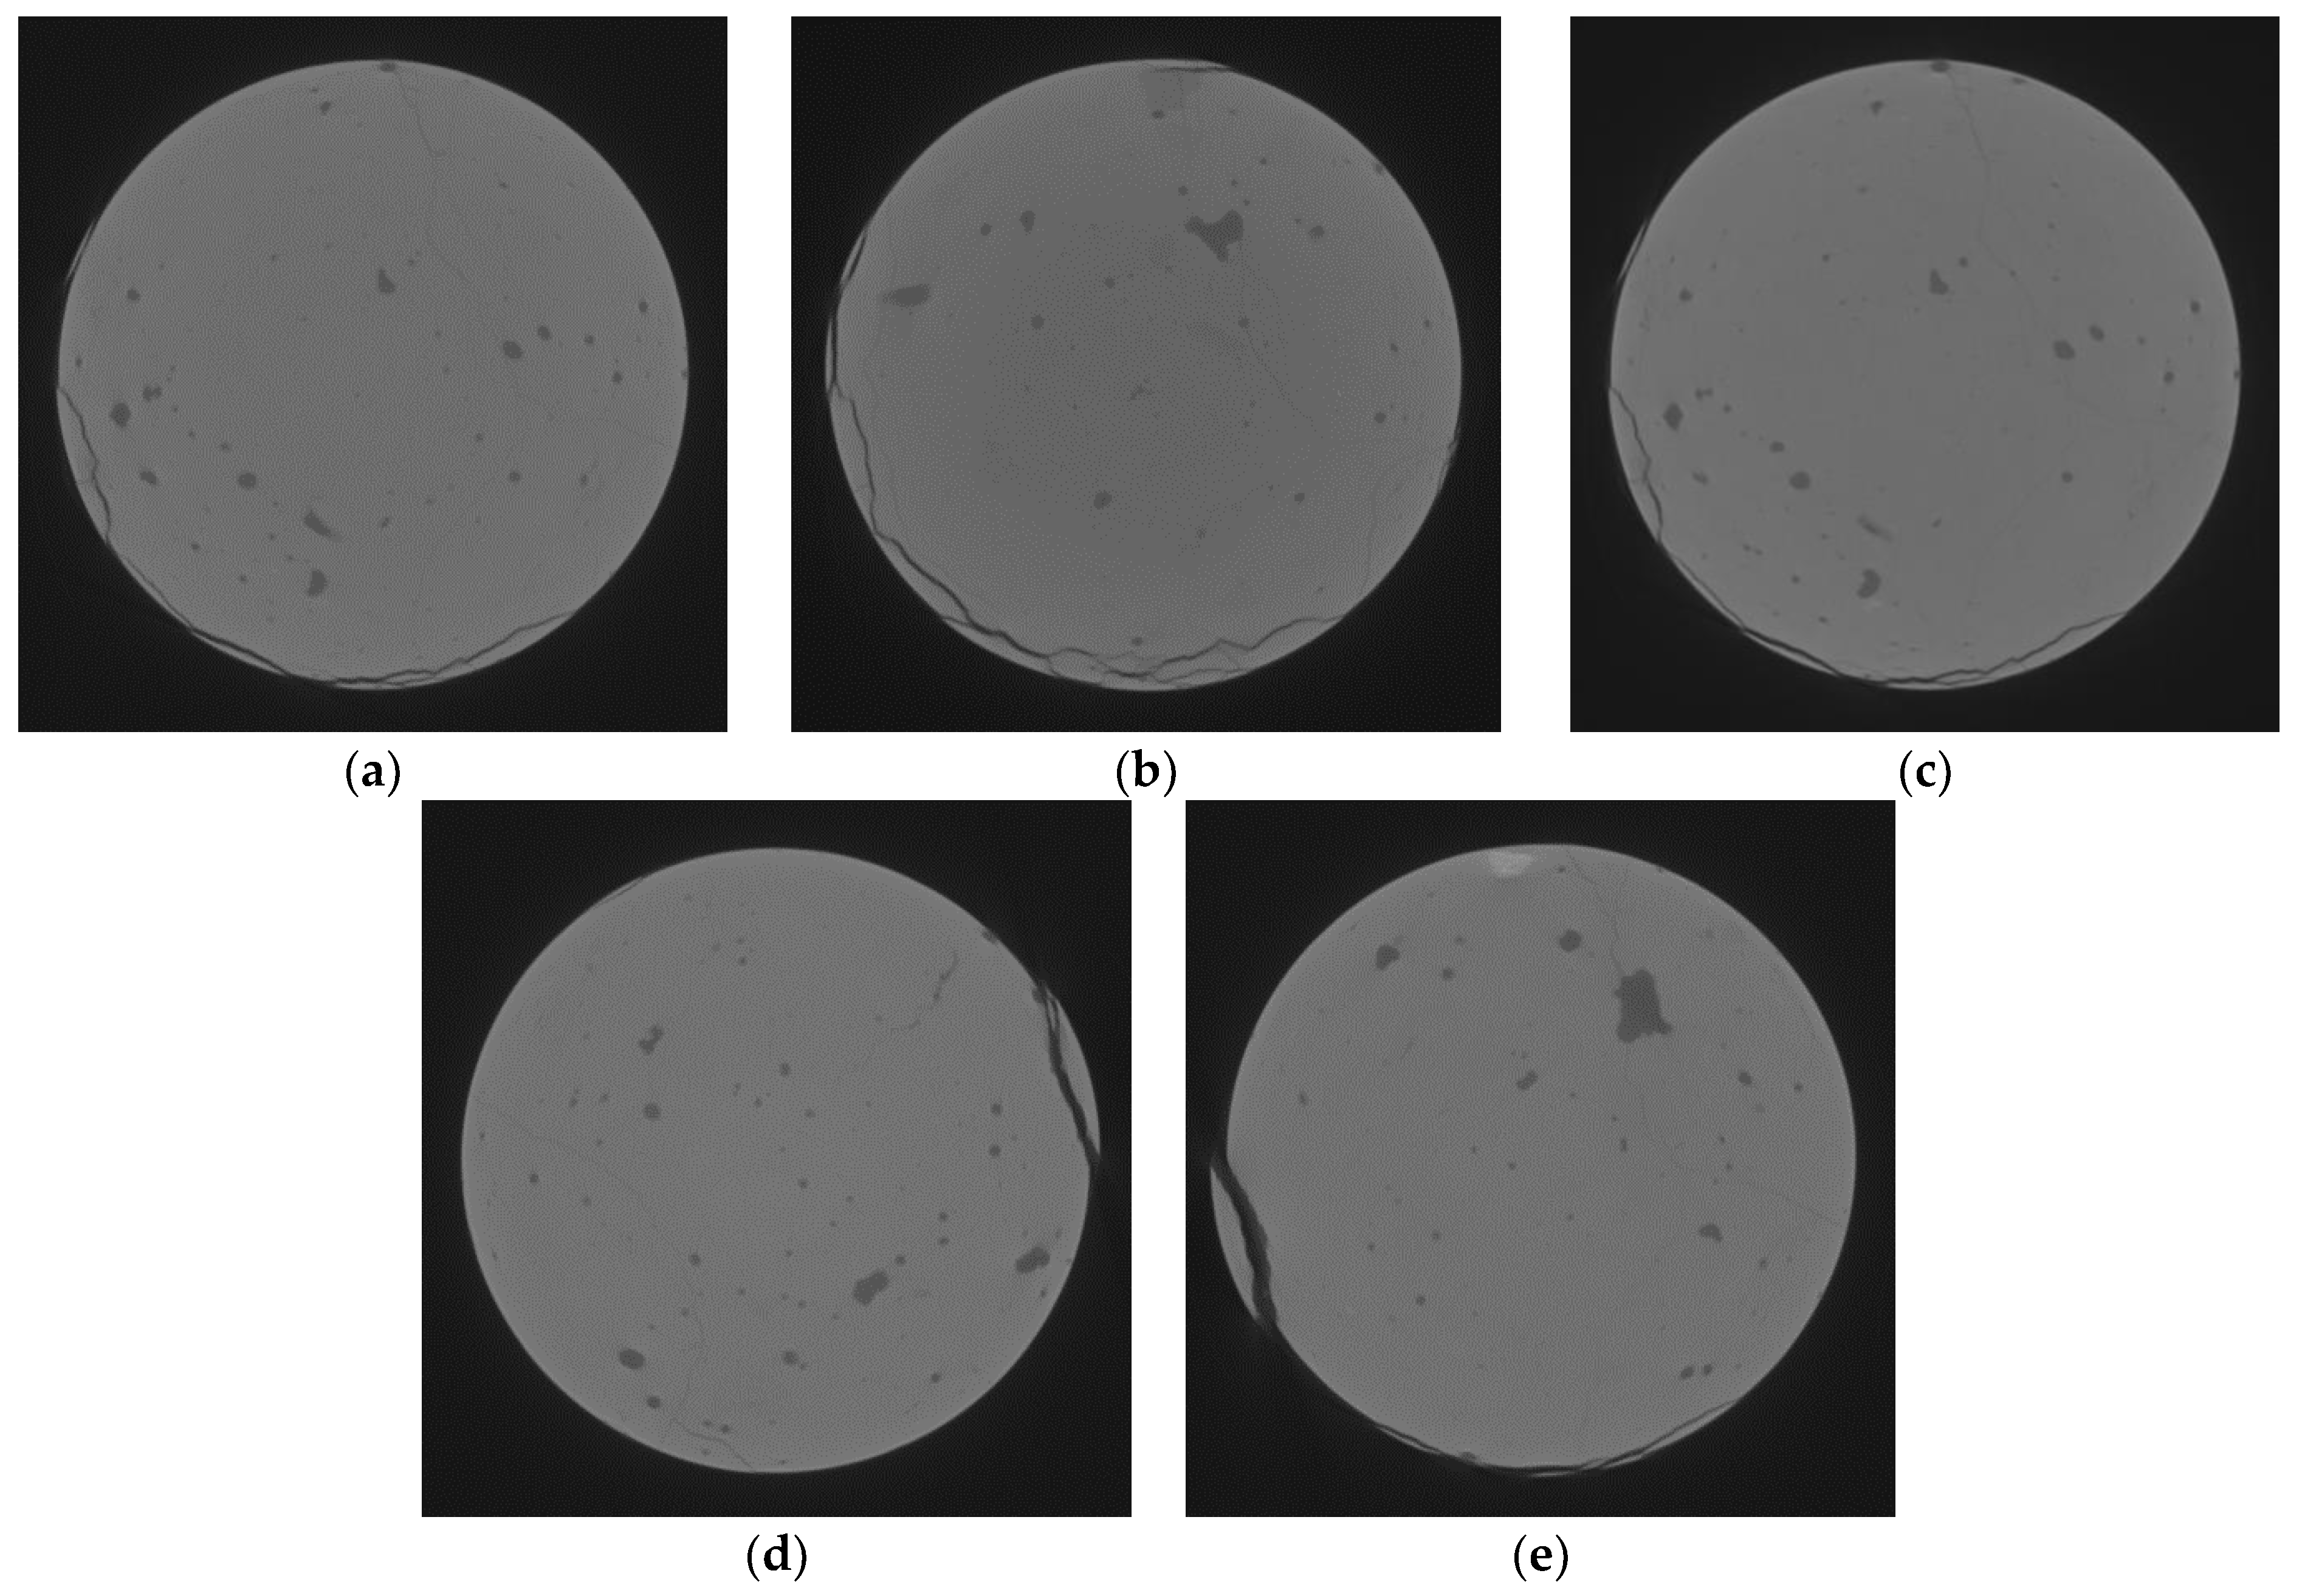
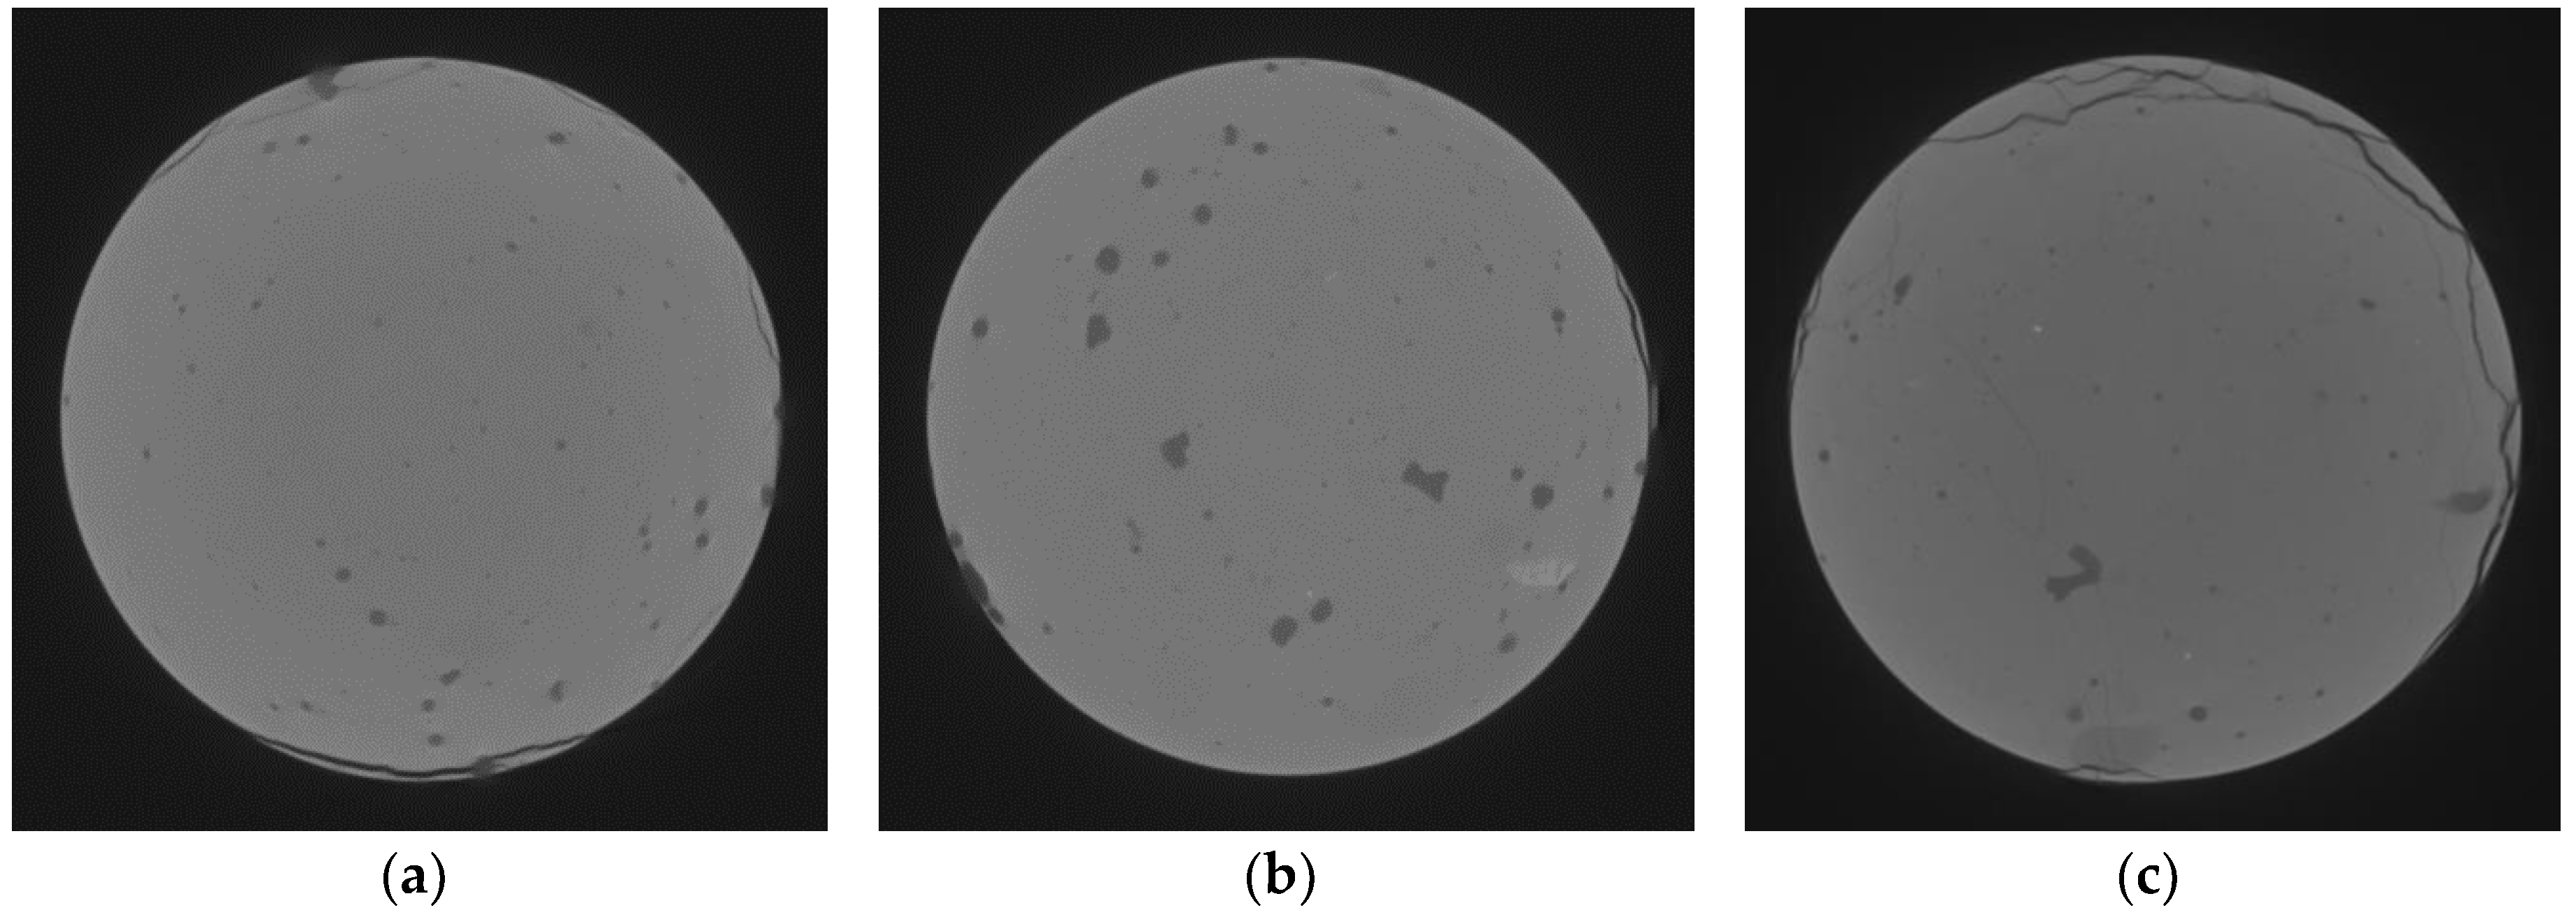
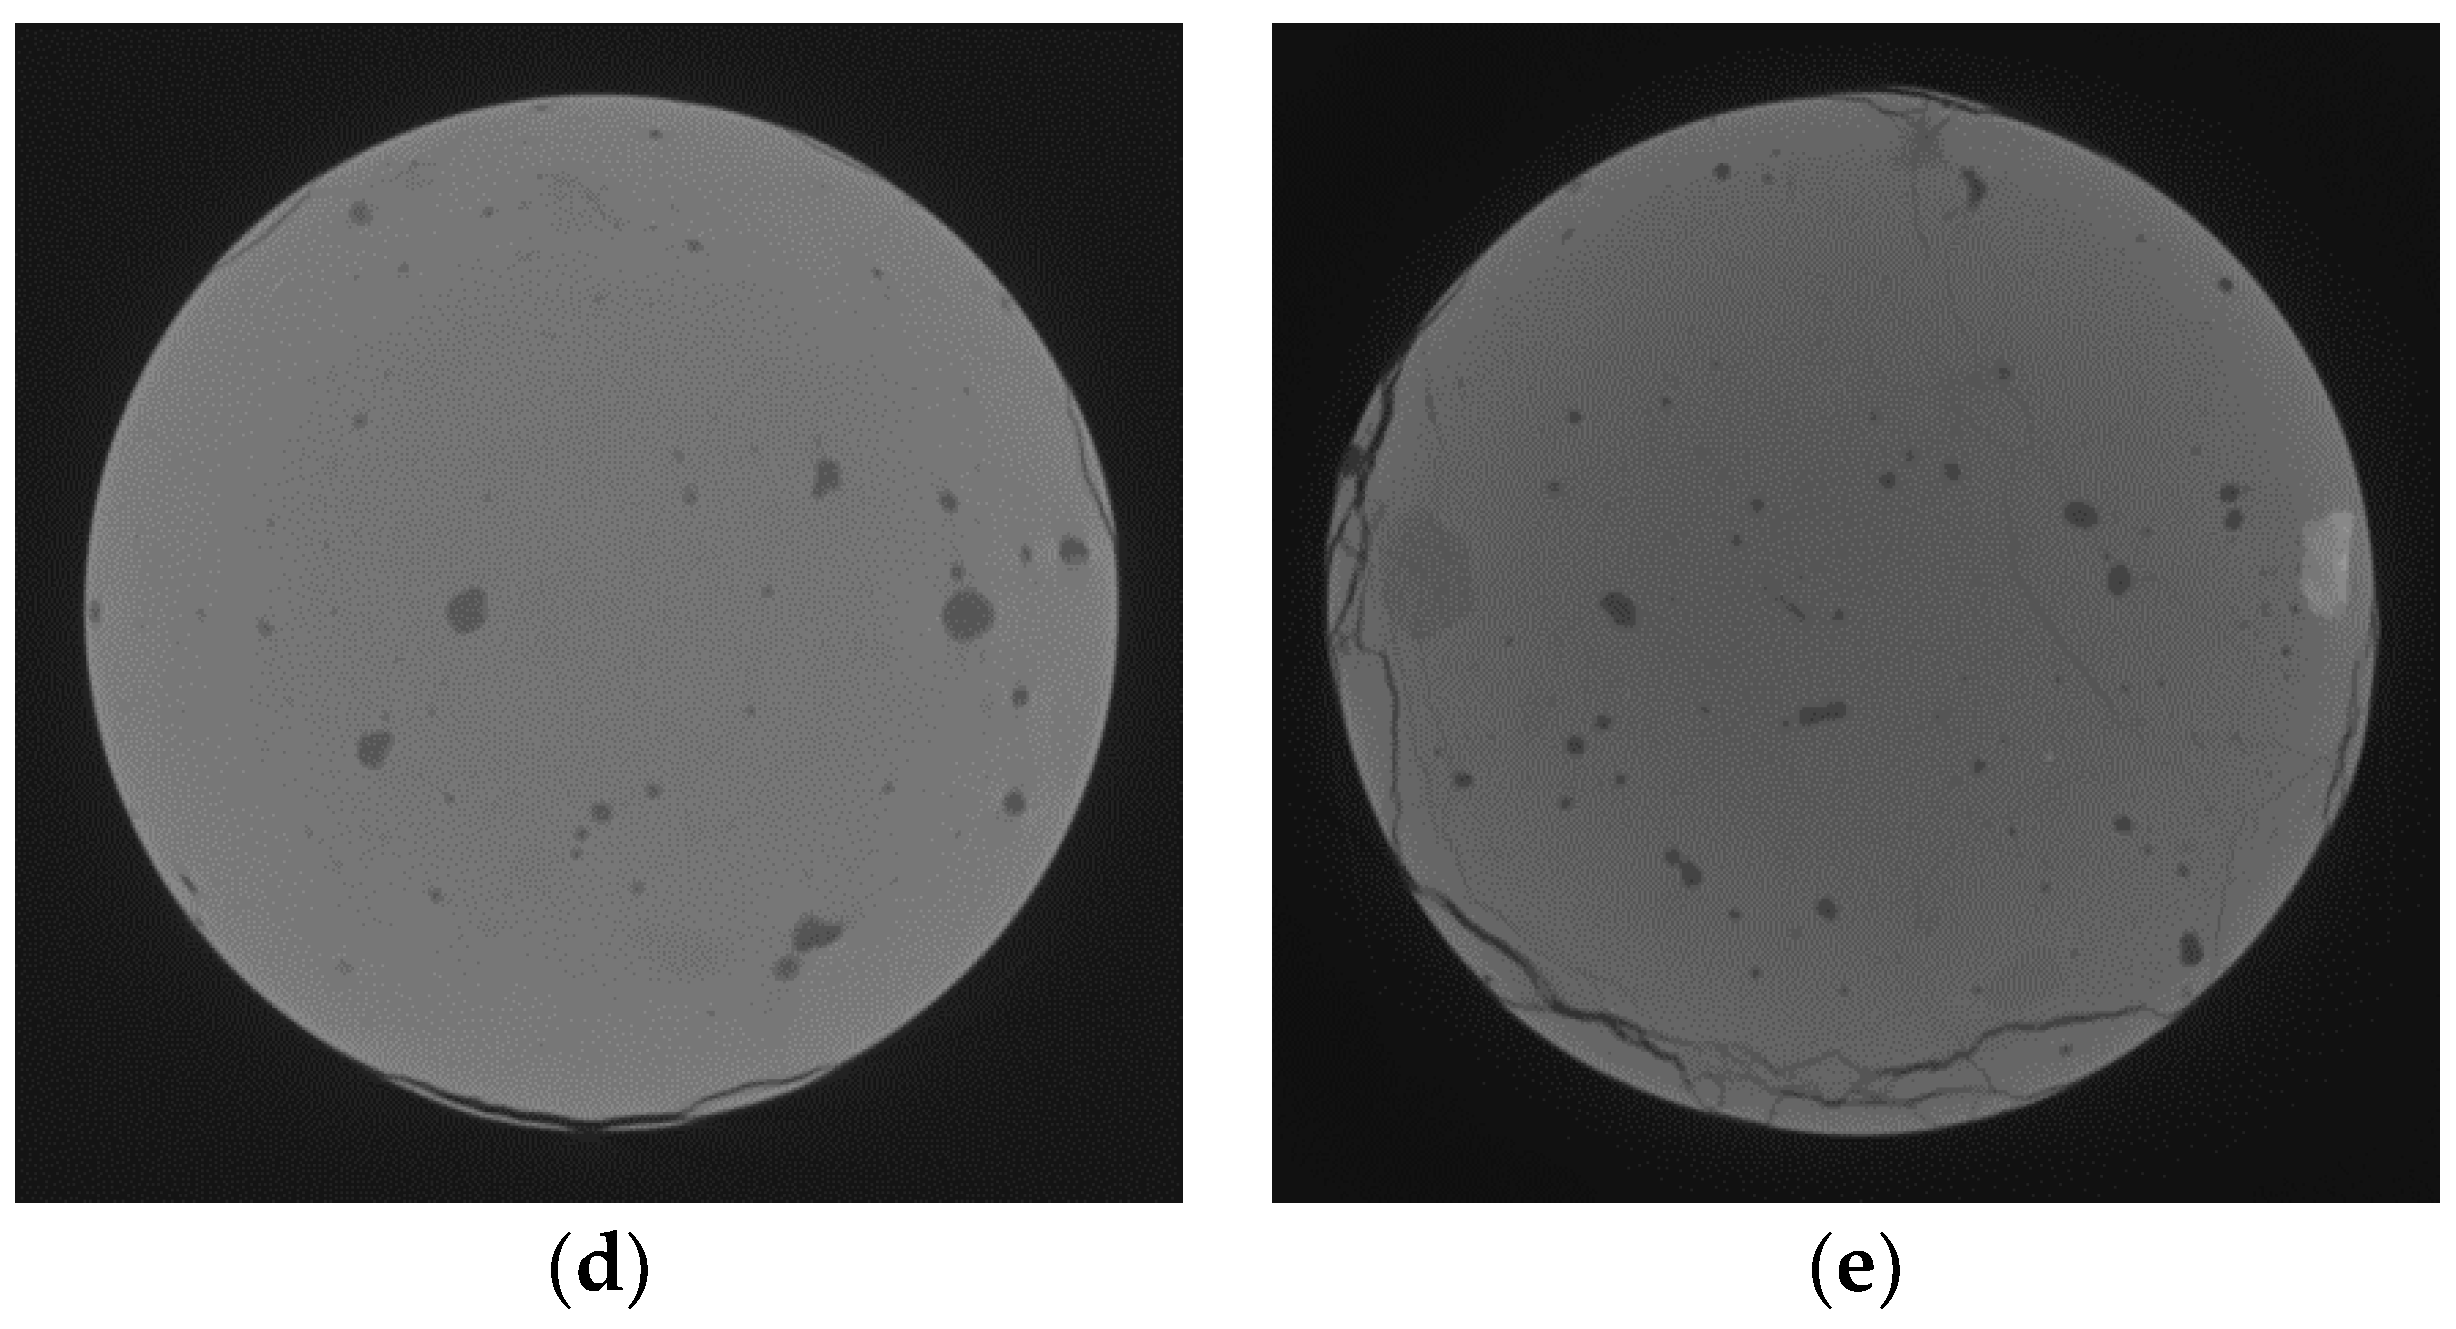
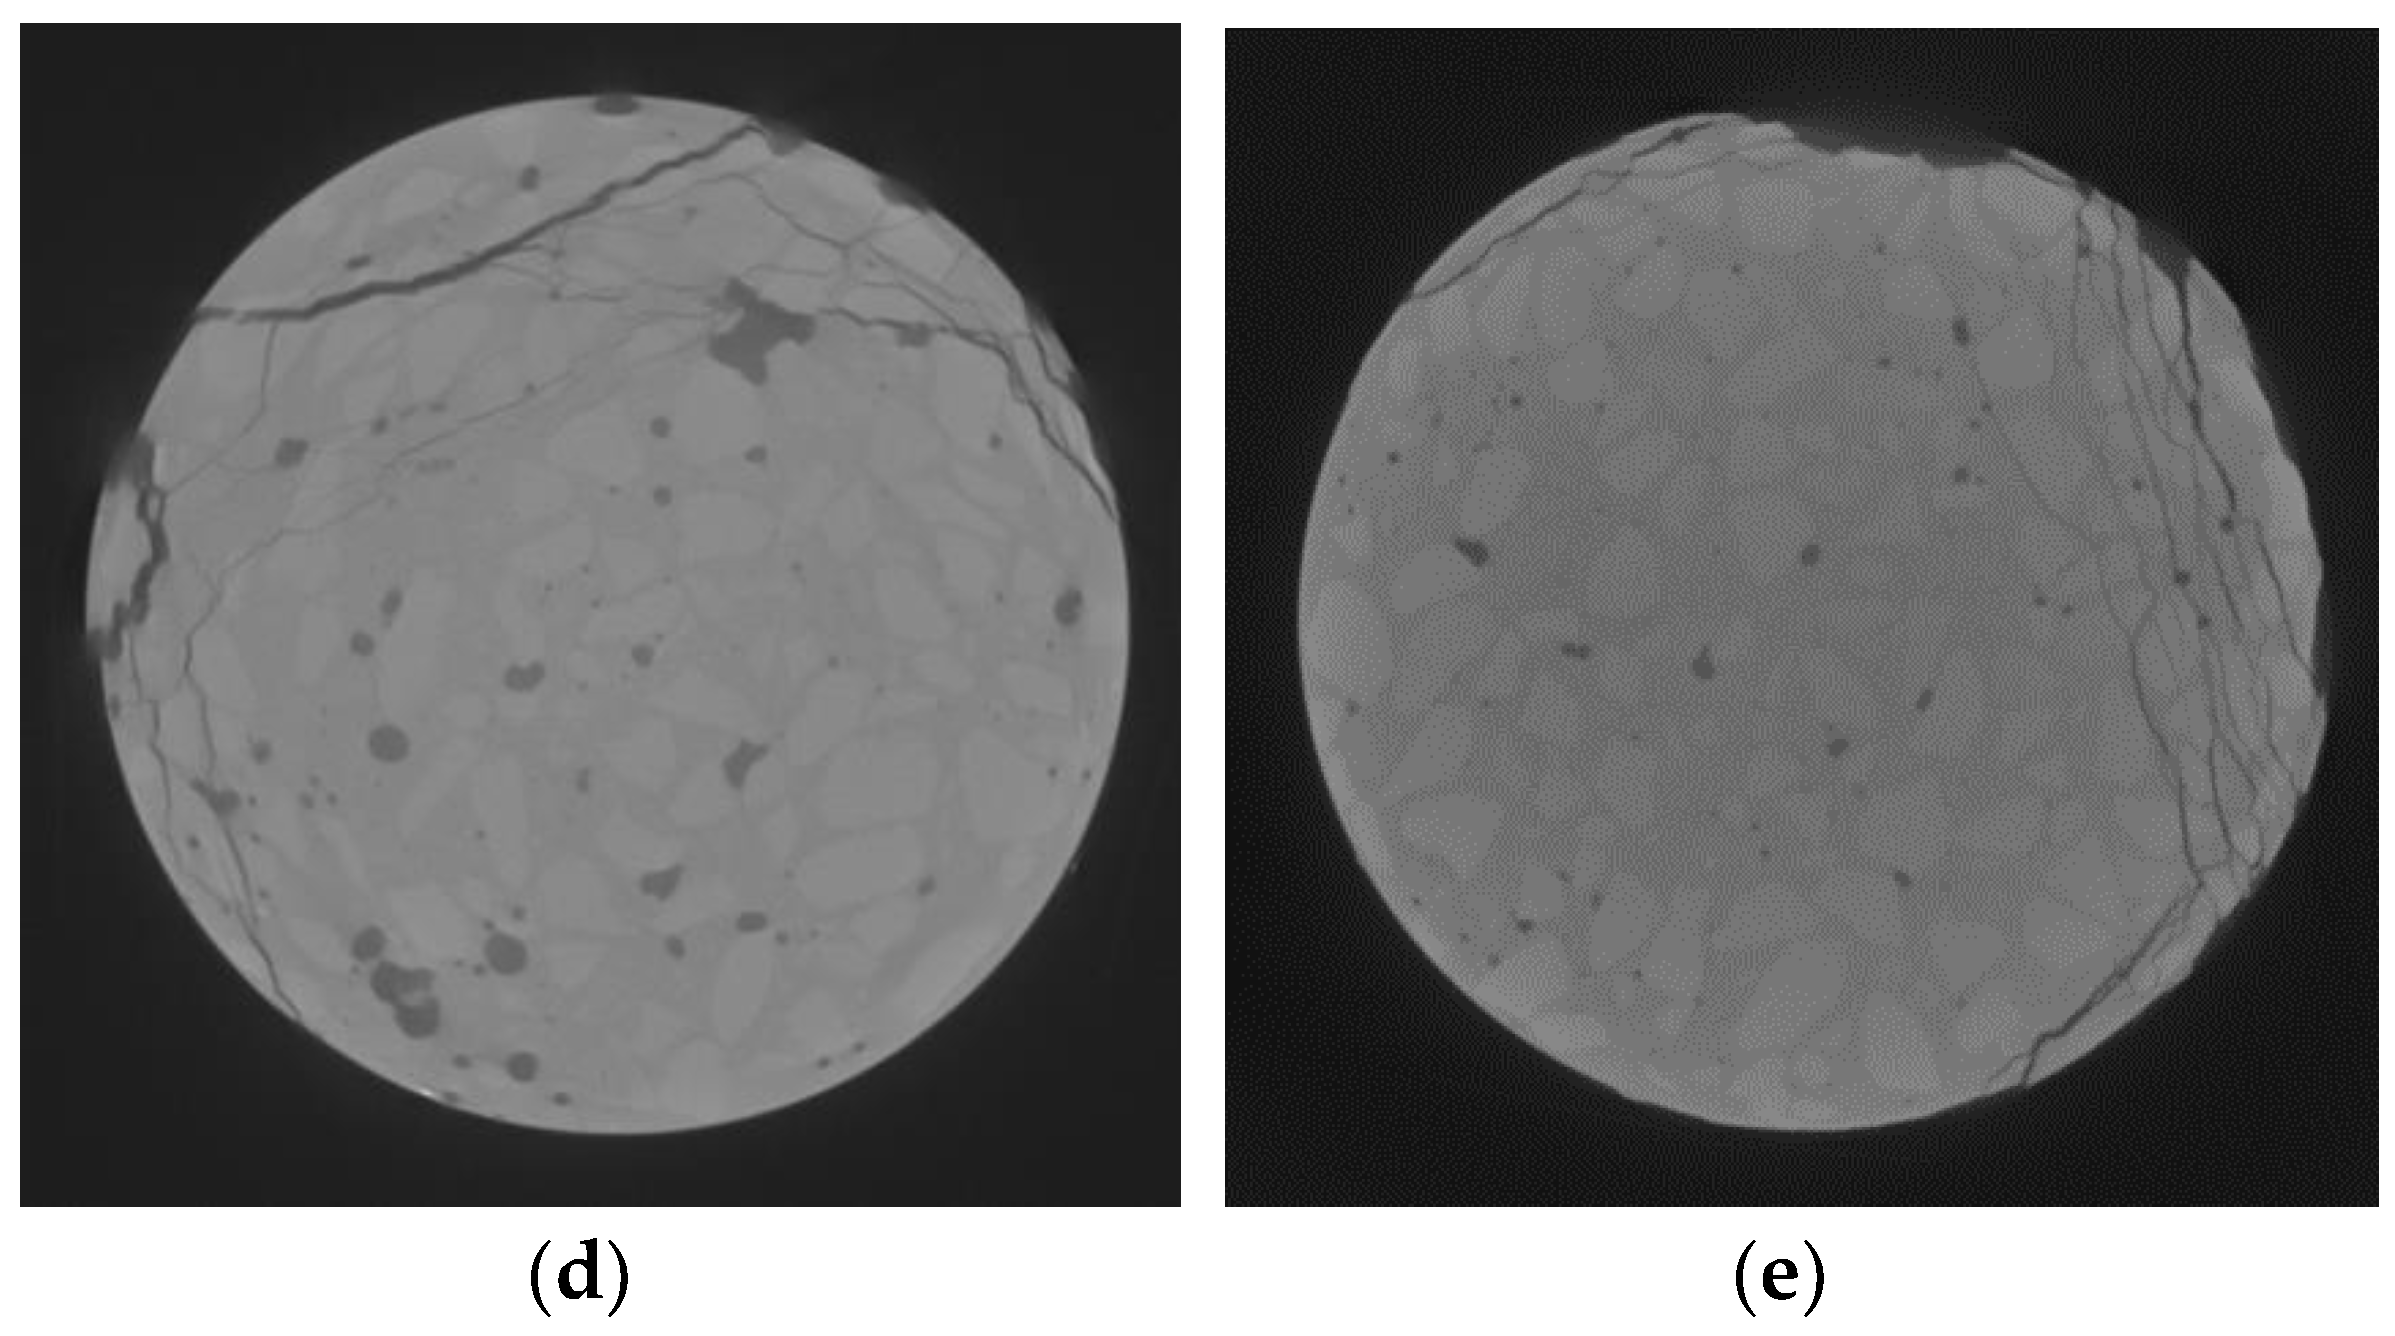
In the case of PPFHPC, the cracks showed a similar pattern to the two previous cases, although the cracks were not only concentrated close to the lateral border, but some of them penetrated towards the internal core of the specimens. Again, the cracks tended to be lengthy, and more numerous cracks could be observed. There were no significant differences between the specimens, and neither the number of cycles nor the stress level appeared to have influenced the crack pattern (
Figure 17 and
Figure 18).
In this case, the polypropylene fibers had a very low stiffness, and the cyclic loads resulted in internal damage. Consequently, some cracks were observed within the specimens. As in the previous cases, the crack surfaces were mainly vertical, i.e., parallel to the compressive loads, and they had no influence on macroscopic behavior under compressive loads.
It can be concluded that in all mixtures, cracks were mostly placed at the surface. This fact seems to have been due to the concrete matrix. The scale effect on concrete specimens is well known, and many examples of this phenomenon can be observed in concrete elements [
38,
39,
40]. In this case, the scale effect conducted to a lower amount of coarse aggregates and fibers at the lateral border [
41]. This would be the reason why the cracks mainly appeared at the surface.
As in the previous cases, the three main mechanical parameters did not show relevant variation with the number of cycles, which agrees with the internal damage observed.
For the three mechanical parameters studied in this paper, the results revealed that the scatter is a parameter clearly dependent on the number of cycles. This fact can be observed in all cases, i.e., in all the mixtures and in both series.
5. Conclusions
In this paper, the range of values of three mechanical parameters of concrete, following the application of five series of cyclic compressive loading, was studied. Three concrete mixtures—plain, steel-fiber-reinforced, and polypropylene-fiber-reinforced high-performance concrete (HPC, SFHPC, and PPFHPC)—were studied. The specimens were subjected to either high stress or low stress levels, and to five different series of cycles: 0, 2000; 20,000; 200,000, and 2,000,000 cycles. All the specimens survived the cyclic test. They were then subjected to a static compression test up to failure, and the compression strength, the compressive modulus of elasticity, and the maximum compressive strain were all measured.
According to Model Code 2010 [
34], the specimens were subjected to relevant fatigue damage, especially in the case of high stress level series.
In addition, before starting the cyclic tests and after the static tests, all the specimens were scanned, in order to visualize the internal damage caused by the cyclic loads. A high-resolution CT scan device was used to do so.
The mechanical results showed no relevant damage caused by the cyclic loading. Moreover, the mechanical parameters of the concrete mixtures showed no significant reduction, and even a slight improvement in some cases.
Regarding the compressive strength, the average value of this mechanical parameter did not significantly vary with the number of cycles, and, in some cases, a slight increase was observed. In addition, the scatter showed a relevant increase with the damage levels, equitable with the number of cycles.
The compressive modulus of elasticity showed a similar behavior. The L-Series showed a slight increase of the compressive modulus of elasticity, while the H-Series showed a flat behavior. Again, the scatter of the compressive modulus of elasticity significantly increased with the number of cycles.
Regarding the maximum compressive strain, the average value showed no clear tendency. In case of the L-Series, an overall decrease with the number of cycles was observed, while in the case of the H-Series, an overall increase with the number of cycles occurred. Again, the scatter showed a progressive increase with the number of cycles.
It can be noticed that for the three mechanical parameters studied in this paper, the results revealed that the scatter is a parameter clearly dependent on the number of cycles. This fact was observed in all cases, i.e., in all the mixtures and in both series.
Moreover, the variation of the mechanical parameters with the damage hardly appeared to be related to the stress level and to the concrete mixture.
The CT scan images revealed no observable internal damage (i.e., internal microcracking) due to cyclic loading, only an observably small number of long cracks. They mainly propagated close to the lateral area of the cylinders and appeared to have been caused by the static testing and not caused by the previous cyclic test, because no differences were observed between the specimens with and without cyclic damage (i.e., the ones subjected to 0 cycles).
Internal cracks were only observed for the PPFHPC specimens, which can be explained by the lower stiffness of the polypropylene fibers.
It was concluded that, contrary to the predictions of the Model Code [
34], the cyclic loads tested in this research caused little or no internal damage (i.e., internal micro-cracking), and no degradation of the microstructure was observed. Both the L-Series and H-Series were less aggressive to the concrete specimens, and even at 2,000,000 cycles no relevant internal damage was observed and the variation of the mechanical properties of the concrete with the number of cycles was small. It can be highlighted that, in the case of the H-Series, the Model Code [
34] predicted an expected fatigue life of 1.5 × 10
3 cycles, which means that all the numbers of cycles tested, i.e., 2000, 20,000, 200,000, and 2,000,000 cycles, were beyond their fatigue life. The truth is that none of the specimens collapsed during the cyclic test and their residual mechanical properties did not vary significantly with respect to the ones showed by the specimens not previously subjected to cyclic loads.


